the Creative Commons Attribution 4.0 License.
the Creative Commons Attribution 4.0 License.
 | 26 Sep 2024
Identifying airborne snow metamorphism with stable water isotopes
Benjamin Walter
Franziska Aemisegger
Luca Bianchi
Michael Lehning
Wind-blown snow is a frequent phenomenon in high-elevation and polar regions which impacts the surface energy and mass balance of these areas. Loose surface snow gets eroded and transported by wind, which influences the snow particles' physical properties (size, shape, optical properties) that determine the characteristics of the emerging wind-impacted snowpack layer. During airborne snow transport, the governing processes happen on the micro-scale while the particles are transported over long distances. The unfolding processes and the evolution of the particles' physical properties are thus difficult to observe in situ. Here, we used cold-laboratory ring wind tunnel experiments as an interim solution to study the governing processes during airborne snow transport with stable water isotopes as tracers for these micro-scale processes. Repeated analysis of airborne-sampled snow by micro-computed tomography (µCT) documented a growing and rounding of snow particles with transport time, with a concurrent decrease in specific surface area. Stable water isotope analysis of airborne snow and water vapour allowed us to attribute this evolution to the process of airborne snow metamorphism. The changes observed in the snow isotopic composition showed a clear isotopic signature of metamorphic deposition, which requires particle–air temperature gradients. These results question the validity of the thermal-equilibrium assumption between particles and air inside the saltation layer of wind-blown snow events, where the conditions are similar to the ones found in the wind tunnel. Our results thus refine the understanding of the governing processes in the saltation layer and suggest that the snow's isotopic composition can inform on local wind-blown snow events as the original snow isotope signal gets overprinted by airborne snow metamorphism. Within transport times of 3 h, we observed changes in the isotope signal of airborne snow of up to +1.47 ‰ in δ18O, ±5.7 ‰ in δD, and −6.1 ‰ in d-excess. Thus, airborne snow metamorphism has the potential to influence the climate signal stored in snow and ice core stable water isotope records.
- Article
(5319 KB) - Full-text XML
-
Supplement
(1148 KB) - BibTeX
- EndNote


The phenomena of blowing and drifting snow are frequently observed in snow-covered territory such as polar and alpine regions (Wagner et al., 2022; Walter et al., 2020; Yang et al., 2023). Previously accumulated snow is mobilised and redistributed by wind, which affects both the surface energy and mass balance of the region and feeds back on snow accumulation patterns (Agosta et al., 2019; Lenaerts et al., 2012; Groot Zwaaftink et al., 2011). In the context of intense climate change in the cold climate zones around the globe, it is thus critical to understand the underlying physical processes of wind-blown snow events to accurately model and predict future snow accumulation changes in these regions and their feedback on the climate system.
Wind-driven aeolian transport of snow can be classified into drifting snow close to the ground (∼ 2 m) and blowing snow further aloft. The dominant snow particle transport modes are creep and saltation during drifting-snow events and suspension during blowing-snow events (Bagnold, 1971; Melo et al., 2022). Both transport regimes can coexist, which motivates the terminology of a saltation and suspension layer in aeolian snow clouds (Nemoto and Nishimura, 2004).
The apparent effect of wind-blown snow is the redistribution of snow mass, which, depending on the surrounding topography and wind regime, can form snow surface structures such as ripples, dunes (Amory et al., 2016; Filhol and Sturm, 2015; Sommer et al., 2018a), and cornices (Yu et al., 2023). On glaciers and ice sheets, snow redistribution also directly affects the surface mass balance when snow is blown off the ice margins, although this contribution is small (Palm et al., 2017). More importantly, wind-blown snow contributes negatively to the surface mass balance by enhancing sublimation of snow (Gerber et al., 2023; Palm et al., 2017; Sigmund et al., 2021). Concurrently, enhanced sublimation during wind-blown snow events leads to enhanced energy loss through a near-surface latent heat flux, which affects the near-surface energy balance and can, in turn, negatively feedback or self-inhibit the sublimation process by lowering the air temperature and increasing the relative humidity of the surrounding air (Amory and Kittel, 2019). Apart from these direct impact pathways on the surface energy balance during actual aeolian snow transport, wind-blown snow also indirectly affects the surface energy balance after the airborne snow has settled on the ground. This post-event influence is due to the modification of the particle size and shape of airborne snow particles during wind-blown snow events. We will use the term physical properties of particles (PPPs) in analogy to the physical properties in ice core studies when referring to snow particle shape, size, and morphology. After settling, the PPPs define energy-balance-relevant characteristics of the resulting snowpack such as albedo (Domine et al., 2006), emissivity (Hori et al., 2013), density, and specific surface area (SSA) (Proksch et al., 2015; Schleef et al., 2014b). Previous studies (Sommer et al., 2017; Walter et al., 2024) have shown that wind-driven aeolian transport of snow significantly affects the microstructure of the ultimately deposited surface snow; i.e. density increases and SSA decreases are intensified under the influence of wind. A resulting wind-blown snow layer is typically characterised by small, broken, or abraded; closely packed; and well-sintered particles (Fierz et al., 2009).
Mechanisms that can control the modification of the PPPs and thus the resulting snowpack characteristics can be grouped into mechanical processes such as particle fragmentation, abrasion (Clifton et al., 2006; Comola et al., 2017; Gromke et al., 2014), and aggregation (Lo and Passarelli, 1982) or into thermodynamic (hereafter metamorphic) processes such as sublimation at snow particle surfaces (Schmidt, 1982; Thorpe and Mason, 1966) and vapour deposition (re-sublimation) on the suspended snow particle (Sharma et al., 2018; Sigmund et al., 2024; Yamaguchi et al., 2019). In this context, Walter et al. (2024) first introduced the term “airborne snow metamorphism”, which summarises the multiple cycles of sublimation and vapour deposition on the suspended snow particle resulting in modifications of the snow particle size and shape during aeolian particle transport in analogy to metamorphism inside a stationary snowpack (Pinzer et al., 2012; Schleef et al., 2014b). The term snow metamorphism describes the recrystallisation of snow grains in a snowpack that is driven by vapour pressure gradients (Colbeck, 1982). Snow metamorphism typically results in a decrease in SSA (growing of snow grains) and can be associated with density changes in a snowpack (Jafari et al., 2020; Kaempfer and Schneebeli, 2007). Based on the temperature regime of the snowpack, a distinction can be made between isothermal and temperature gradient metamorphism. The dominant physical processes creating the vapour pressure gradients are distinct: under isothermal conditions, the micro-scale curvature effects (Kelvin equation) drive metamorphism (Colbeck, 1980), which are outweighed by macro-scale temperature gradient effects (Clausius–Clapeyron equation) in snowpacks with a temperature gradient (Marbouty, 1980). Temperature gradient metamorphism typically results in higher recrystallisation rates and thus faster SSA decay in snowpacks (Taillandier et al., 2007).
Thus, airborne snow metamorphism was proposed as a driving factor for PPP changes during aeolian transport of snow, yet the relative importance of the different processes involved and their combined effect on the snow microstructure are still unknown due to missing observations. Snowpack or climate models that include wind-blown snow modules thus rely on field-based empirical parameterisations when incorporating wind-blown snow effects on snowpack characteristics because the physical process understanding is limited (Walter et al., 2024).
In situ observations of changes in the PPP during wind-blown snow events are difficult due to the micro-scale nature of these processes and the short timescales on which they evolve while the particles cover large distances on their airborne trajectories. Thus, in situ observations are limited to point measurements within the snow cloud (Nishimura et al., 2014; Nishimura and Nemoto, 2005) or pre- and post-event monitoring of the snowpack characteristics (Walter et al., 2024). Field measurements are the foundation for wind-blown snow parameterisations that are currently implemented in snowpack and climate models (Lehning et al., 2002; Liston et al., 2007; Vionnet et al., 2012). As an approach to circumvent the difficulties of multiple unconstrained environmental variables during in situ field observations, controlled laboratory experiments using straight wind tunnels (Nishimura et al., 2014; Wever et al., 2009) or ring-shaped wind tunnels with infinite fetch (Sommer et al., 2018b; Walter et al., 2024) have been used successfully to systematically validate model parameterisations. Additionally, shadowgraphy imaging based on high-speed camera recordings (Gromke et al., 2014) has been applied in wind tunnel experiments to investigate the vertical distribution of snow particle size and number. However, this method does not allow access to information on the evolution of PPPs and thus on the differentiation between mechanical (fragmentation, aggregation, and abrasion) and metamorphic (sublimation and vapour deposition) drivers. Consequently, means to constrain the underlying governing equations of the PPP evolution during airborne snow metamorphism are still missing due to the nature of the processes unfolding on the difficult-to-observe micro-scale.
As direct observations of the individual airborne snow particles are currently impossible, indirect methods such as the monitoring of proxy variables are key to being able to disclose metamorphic processes happening on the micro-scale in macro-scale variables. For snow processes, such a proxy can be the abundance of stable water isotopologues (hereafter simplified to “water isotopes”), namely H216O, H218O, and 2H1H16O, in a sample. Due to their predictable partitioning, i.e. fractionation into the vapour, liquid, and ice phases during phase changes (i.e. water vapour deposition and sublimation or freeze and melt), stable water isotopes are powerful tracers (Ala-aho et al., 2021; Beria et al., 2018; Galewsky et al., 2016) which allow us to identify and quantify the impact of metamorphic processes on the PPPs (Ebner et al., 2017; Harris Stuart et al., 2023). Ideally, stable water isotope measurements comprise all involved phases (in dry-snow regions this, means solid and gas phases) to fully constrain the isotopic fractionation during phase change processes. Stable water isotopes are measured as the abundance ratio R of the rare (i.e. 1H218O and 2H1H16O) to the most abundant (1H216O) isotopes and are commonly reported as δ values referenced against an international standard (equal to the isotope ratio of the mean ocean water) and are given in per mil (‰) (Craig, 1961b; Mook, 2000):
Isotopic fractionation is temperature (T) dependent and empirically well established for equilibrium fractionation processes between vapour and ice (Majoube, 1970; Merlivat and Nief, 1967). For non-equilibrium processes, i.e. processes including a humidity gradient (RH ≠1), the net fractionation between two phases deviates from the pure equilibrium fractionation factor αeq by a non-equilibrium (sometimes also termed kinetic) fractionation factor αk that is due to different molecular diffusivities for the different water isotopes (Merlivat, 1978). The effective fractionation factor of a phase change is thus defined as follows:
where RHs is the relative humidity normalised to surface saturation and defines the humidity gradient. Usually, αnet>1, which shows that the resulting ice phase is enriched in the rare water isotope compared to the relatively depleted vapour phase; hence, . However, deposition under supersaturation conditions (RHs>1) can lead to strong non-equilibrium fractionation, such that (Jouzel and Merlivat, 1984). Equations (1) and (2) can be written analogously for 1H2H16O, with the notation δD being used onwards. From both isotopes, the second-order variable d-excess can be derived as (Craig, 1961a). The slope of 8 originates from the 8-fold stronger fractionation of 2H1H16O compared to H218O under equilibrium conditions. Per definition, this variable will not change under pure equilibrium conditions, and changes in d-excess thus indicate non-equilibrium fractionation processes. Note that, due to the non-linearity of the δ scale, under very depleted conditions, this assumption does not hold (Dütsch et al., 2017). An additional concept to understand and predict isotope behaviour is the analysis of the out-of-equilibrium state, i.e. the disequilibrium in isotopic composition between two phases of water, similarly to the analyses by Aemisegger et al. (2015) or Wahl et al. (2022). For this, the temperature-dependent equilibrium state between two phases is compared against the actual isotopic composition of the respective phase. The difference between the equilibrium and the actual isotopic composition is called disequilibrium, and it describes whether a water entity is more enriched or depleted compared to the equilibrium state. This analysis can inform us about the expected evolution during the mixing of water entities of the original and newly produced phases and can help to reconcile isotope signal behaviour in transient conditions.
This paper aims to characterise airborne snow metamorphism and its effect on the temporal evolution of PPPs during wind-blown snow events for the first time through the lens of stable water isotopes. To this end, we set up cold-laboratory experiments using a ring wind tunnel to simulate wind-blown snow events under controlled conditions and for long transport durations (Sect. 2). We monitored the co-evolution of PPPs and the isotopic composition of both aeolian snow and water vapour inside the ring wind tunnel. From these observations, we deduce the underlying physical processes that are responsible for changes in PPPs and relate them to the ambient atmospheric conditions (Sect. 3). We discuss the significance of our findings for resulting snowpack characteristics and for the modelling and calculation of the energy and mass balance of wind-blown snow events, and we reflect on the implications of our findings for the climate signal imprinted in the snow isotopic composition (Sect. 4).
All experiments were conducted at the cold-laboratory facilities of the WSL Institute for Snow and Avalanche Research SLF in Davos, Switzerland. The experiments were performed in two periods, one from 9 to 13 January 2023 and the other from 11 to 31 May 2023. In the following, an overview of the 19 experiments and the sampling protocol is given, and the experimental setup is described.
2.1 Cold-laboratory wind tunnel experiments
The experiments aimed to simulate wind-blown snow transport in the ring wind tunnel for long transport times while monitoring changes in snow properties and environmental variables to identify the corresponding governing mechanisms. For this, 600 g of fresh snow with known initial PPPs and isotopic composition were introduced to the wind tunnel at an initial wind speed of ∼ 8.5 m s−1, and airborne snow was then repeatedly sampled out of the airstream until no more snow was in suspension.
To keep the experiments' initial conditions as repeatable and reproducible as possible, we used artificially produced snow from SLF's snowmaker (Schleef et al., 2014a), which produces nature-identical snow from tap water. The snowmaker was situated in the same cold-laboratory, but the snowmaker and the wind tunnel were not operated simultaneously to limit heat and moisture sources during the experiment hours. The snow was produced at an air temperature of −20 °C and a water bath temperature of +30 °C, yielding dendritic and hollow column crystals with very low density (45–80 kg m−3) and high SSA (50–70 mm−1) (Walter et al., 2024). The produced snow was stored at −20 °C for a maximum of 4 d before it was used for the experiments. Care was taken to equilibrate the snow temperature to the target wind tunnel air temperature (Table 1) for 30–60 min before the start of each experiment. The snow was well mixed, its temperature was measured, and three replicate samples of 10 g were taken before the introduction of the snow to the wind tunnel to estimate the initial isotopic composition. The mean of these three samples serves as the initial-condition snow isotope value for each experiment. The three initial-snow samples agreed to within a range of standard deviations (SDs) of 0.01 ‰–0.66 ‰ for δ18O, 0.0 ‰–2.8 ‰ for δD, and 0.1 ‰–2.5 ‰ for d-excess, with a mean SD of 0.12 ‰ for δ18O, 0.7 ‰ for δD, and 0.6 ‰ for d-excess within the set of 19 experiments.
At the start of the experiments, the wind tunnel was closed before the snow was prepared for introduction. After the conditions inside the wind tunnel had reached an equilibrium, the wind generation was initiated quickly, reaching wind speeds >8 m s−1, which is well beyond the threshold wind speed for snow movement and ensures that snow is transported in suspension (He and Ohara, 2017; Yu et al., 2023). Shortly after reaching the maximum wind speed, the snow was added to the wind tunnel in small batches through a port in the ceiling within a short time window of 2–5 min. After the snow introduction to the wind tunnel, a part of the snow was not kept in suspension due to the geometry of the flow field in the wind tunnel (Sommer et al., 2017). Some snow accumulated in the curved section underneath the propeller location. In addition to this early and permanent deposition of snow, a saltation layer with a height of approximately 5–10 cm (Walter et al., 2024; Yu et al., 2023) formed in the wind tunnel, where snow was continuously deposited and re-eroded. Importantly, some part of the snow was permanently in suspension up to heights of 10–40 cm. Throughout the whole experiment and until all airborne snow particles had disappeared (due to sublimation or accumulation), the environmental conditions (temperature (T), wind speed (WS), relative humidity (RH)) and the vapour isotopic composition (δv) inside the wind tunnel were monitored using the sensors presented in the next section. Additionally, a small amount of snow (3–10 g) was sampled from the air several times during a single experiment using a Whirl-Pak® that was tied to a hand net frame. This sampling tool was inserted into the wind tunnel through a hole in the wind tunnel ceiling and was moved up and down in the air stream, covering the whole height of the wind tunnel until enough snow had been captured in the Whirl-Pak® for later water isotope analysis in the laboratory. During six experiments, part of the so-collected snow was transferred to specific sample holders for the analysis of particle shape, size, and distribution using micro-computed tomography (µCT). Thereafter, the Whirl-Pak® was closed and stored at −20 °C until further preparation for shipment to the isotope laboratory facility. Once no snow was left in the air column, the experiment was declared to be finished, and the propeller was turned off. Two samples of the accumulated snow were taken right after the wind tunnel was opened: one from the surface layer and one from inside the accumulated snow. Before the start of a new experiment, the sealed wind tunnel was opened to the laboratory air to allow sublimation of vapour depositions on the walls and ceiling, and all the leftover snow was cleaned out.
The temperature regime at which the experiments were conducted was regulated by adjusting the room temperature of the laboratory. During the experiment runs, the air temperature inside the wind tunnel was observed to increase, whereas the room temperature of the cold-laboratory was kept stable (±1 °C) by the laboratory climate control system. The source of this observed warming of the air within the wind tunnel during the experiment can be primarily attributed to the heat generation of the motor and propeller setup. A control run with a sealed but empty wind tunnel was performed to characterise the experiment setup behaviour without added snow. The measurements of this control run are presented in Fig. S1 of the Supplement (SM). It was identified that the precise position of the wind tunnel inside the laboratory with regard to the internal air-conditioning system played a major role in limiting the heating of the air inside the wind tunnel during the experiment. The heating was minimised when the wind tunnel was placed directly opposite the air conditioning system, which allowed for the most effective air circulation in the cold laboratory.
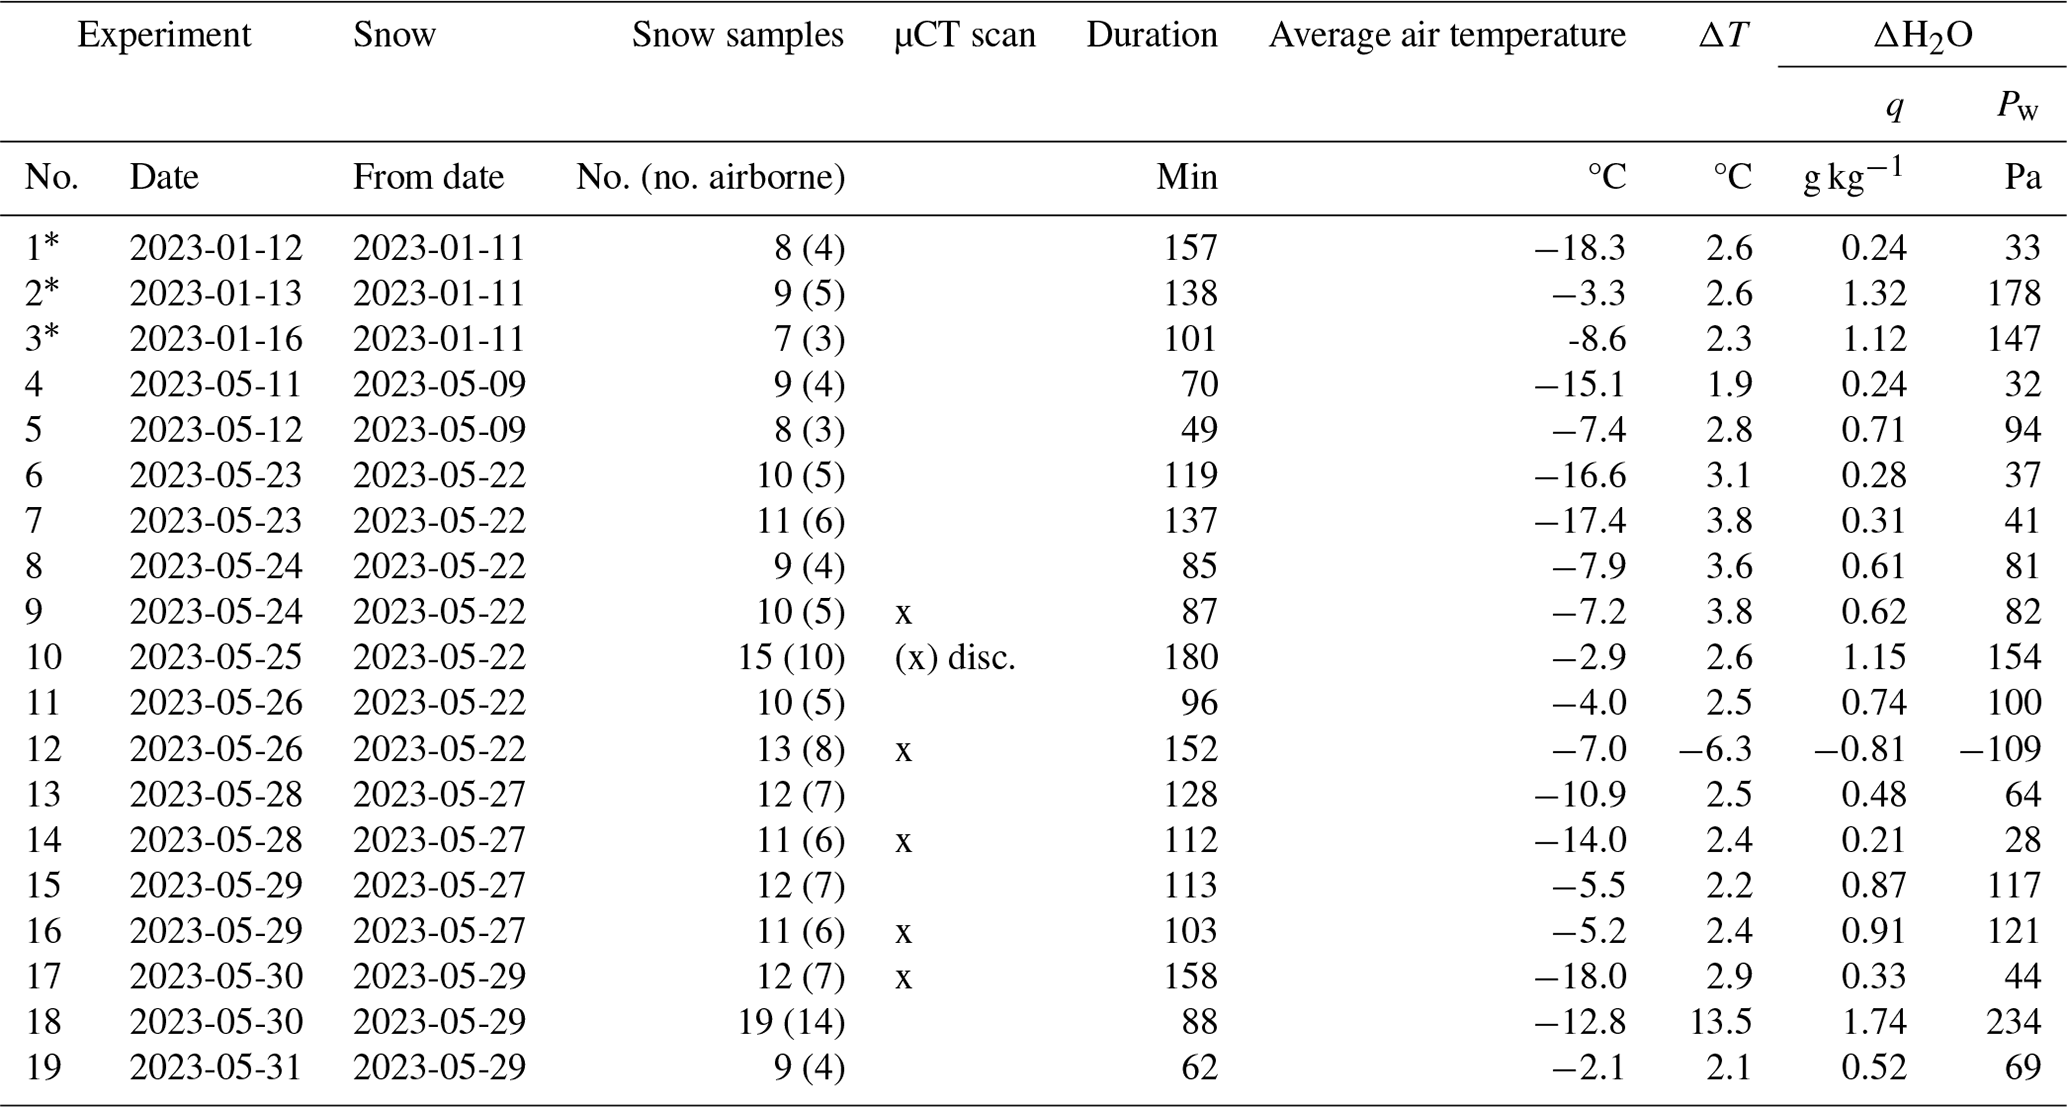
In total, 19 experiments were conducted at different temperature regimes, spanning a temperature range of −20 to −3 °C at the start of the experiments. In two special cases, the laboratory temperature was increased or decreased during the experiment duration, leading to pronounced warming (experiment no. 18, °C) or cooling (experiment no. 12, ΔT: −6 °C) in the wind tunnel. Details on the specific characteristics of each experiment are summarised in Table 1.
Table 1The characteristics of the 19 ring wind tunnel experiments. During the three experiments in January (∗), no water vapour isotopes were measured, and the humidity increase (ΔH2O) is estimated based on the RH sensors (Pw refers to water vapour pressure, and q refers to specific humidity). ΔT lists the change in air temperature inside the wind tunnel during the respective experiment (disc. indicates discarded).
2.2 Instrumentation
2.2.1 Ring wind tunnel and setup
We used an existing ring wind tunnel (Fig. 1; Yu et al., 2023; Sommer et al., 2018b) that was placed in a cold laboratory of the SLF. An outer and inner ring made of wood and plexiglass are placed on wooden planks a few centimetres above the laboratory floor, forming a tunnel with a rectangular cross-section and dimensions of 0.5 m height and ∼ 0.2 m width. The resulting oval ring has outer dimensions of 2.20 m length and 1.20 m width, and the removable lids can be attached to the wooden frame with metal locks. The wind tunnel has an air volume of ∼ 0.5 m3 and was sealed against snow loss with the help of insulation material. However, the tunnel is not fully air-tight, and minor exchange with the laboratory air is inevitable. Wind is generated by an electrically motored two-blade propeller that accelerates the air at a height of approximately 40 cm in the wind tunnel. The wind tunnel is equipped with basic meteorological instrumentation in the observation section of the tunnel, where the lid and walls are made from plexiglass (Fig. 1). This is where WS is recorded by a MiniAir60 (Schildknecht) wind sensor at 37 cm height. HygroClips (HC2-S) (Rotronics) measuring RH and T are installed at three heights (15, 30, 42.5 cm), and an additional Pt100 (K. Mösch AG) T sensor is installed at 3 cm. The T and RH sensors were calibrated in dedicated calibration runs. During these runs, they were placed close together and referenced against their mean readings in a range of −21.5 to −5 °C and 46 % to 91 % to be comparable. For water vapour sampling, we installed a heated copper tube (OD ”, ID 0.19”) that entered the wind tunnel through a hole in the lid at the same observation section. The copper tube was bent such that its opening was oriented with the wind direction, looking downwind at a height of 47 cm in the wind tunnel. The tube then was fed through a connection hole in the laboratory wall and connected to a KNF membrane vacuum pump that was installed in the temperate surroundings outside the cold laboratory. The tube was heated to about 5 °C above the cold-laboratory temperature and insulated with Armaflex insulation material to prevent condensation inside the tube. The flow rate inside the copper tube was set to 200 mL min−1 and controlled by a Sensirion mass flow controller of type SFC5500-10SML. The wind tunnel has four round holes with a 10 cm diameter in each curve; these are closed with metal lids but allow access to the inside of the wind tunnel. Samples of airborne snow were taken through one of these holes.
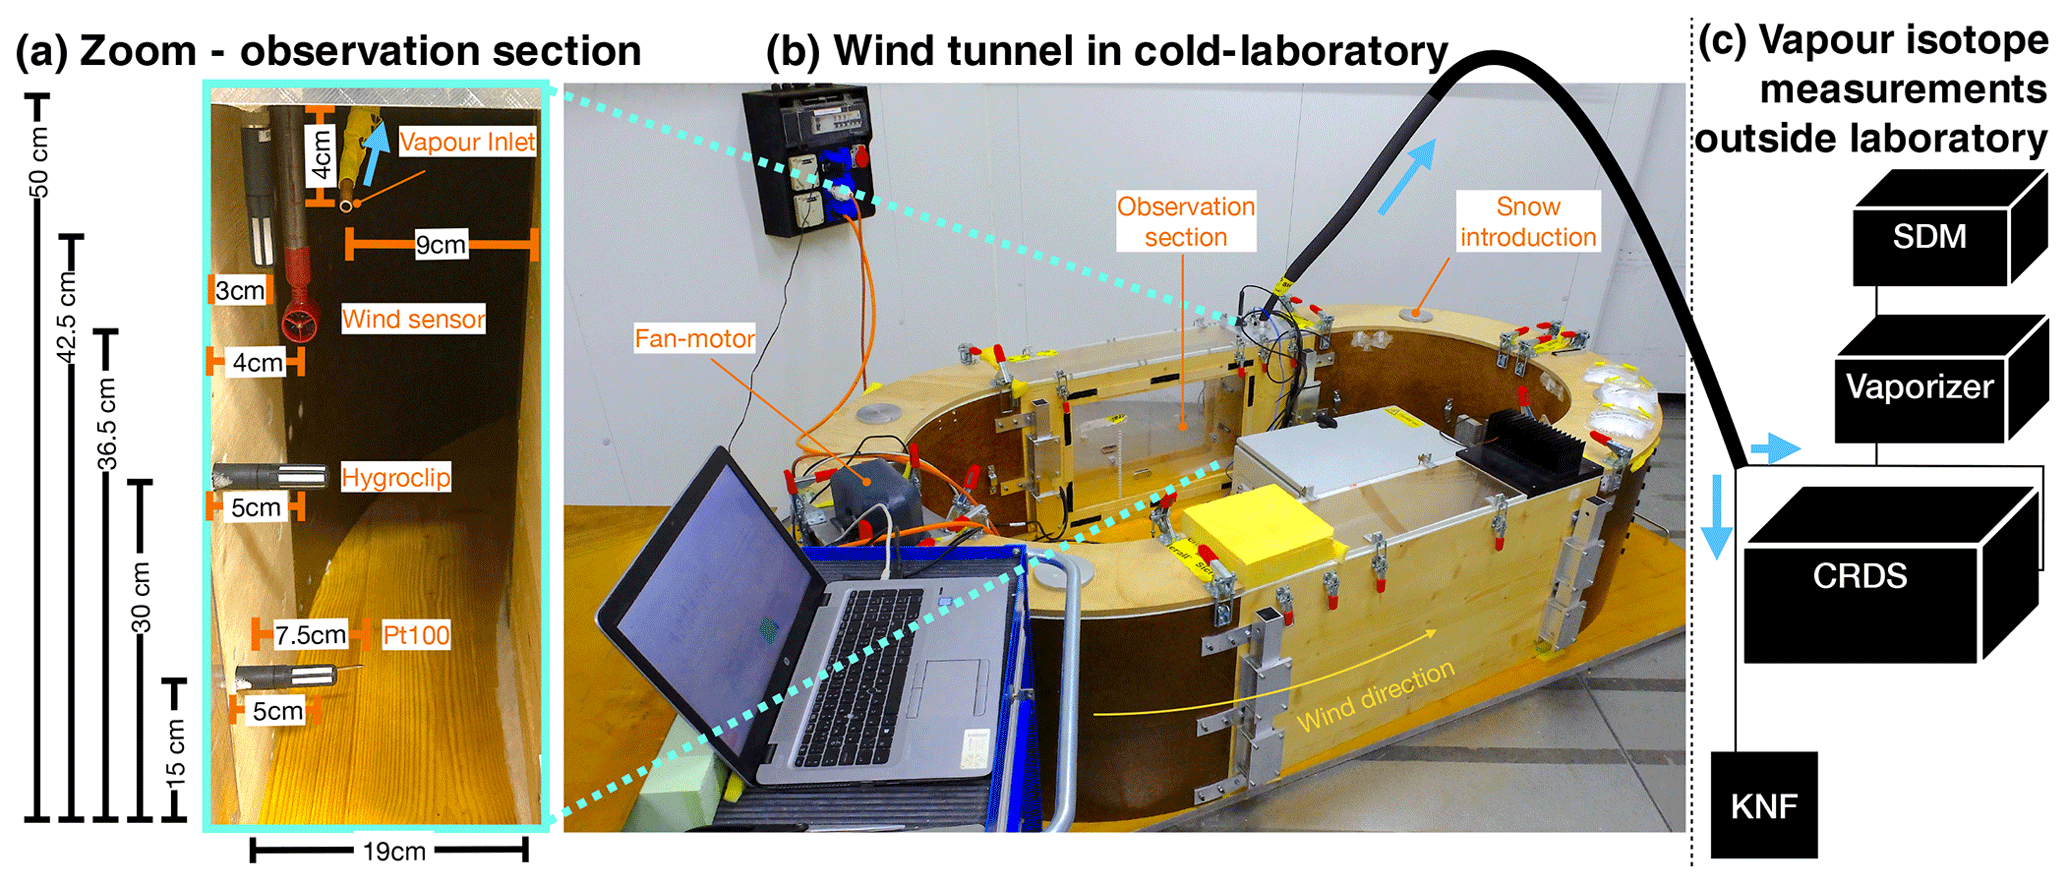
Figure 1Wind tunnel setup. In (b), the ring wind tunnel is shown as it was installed in the cold laboratory. A close-up of the observation section is shown in (a), displaying the positions of the sensors that measured the environmental conditions inside the wind tunnel during the experiments. The vapour measurement setup including the cavity ring-down laser spectrometer (CRDS) was installed outside the cold laboratory and is shown schematically in (c). The KNF pump pumped air at a low flow rate of 200 mL min−1 out of the wind tunnel (blue arrows) to the CRDS for continuous real-time analysis of the water vapour and its isotopic composition. During CRDS calibrations, the standard delivery module (SDM) and vaporiser generated a vapour stream of constant humidity and isotopic composition to be measured by the CRDS.
2.2.2 Stable water isotope measurements
During the experiments, we measured the water vapour inside the wind tunnel continuously and sampled drifting and blowing snow periodically for stable water isotope analysis of both water phases.
Isotopic composition of the water vapour
For analysing the isotopic composition of the water vapour, a cavity ring-down laser spectrometer (CRDS) of type Picarro L2130-i was connected to the copper tube outside the laboratory at stable room temperature (∼ 18 °C) and drew in air at the instrument's flow rate of 30 mL min−1 through the connected vaporiser. The total length of the copper tube between the inlet in the wind tunnel and the entry to the vaporiser was 4.6 m for the first five experiments and 6.1 m after repositioning the wind tunnel in the laboratory. The time delay between a signal occurring in the wind tunnel before it was recorded by the CRDS was experimentally determined to be 38 and 50 s, respectively. As we expect no abrupt jumps in the vapour isotopic composition from the processes in the wind tunnel but rather smooth transitions, this lag time is acceptable. The meteorological and water vapour readings were synchronised while accounting for this time lag during data post-processing.
The recorded vapour measurements were calibrated following standard procedures.
The humidity readings of the CRDS were calibrated with a LI-610 Dew Point Generator in the temperature range between 0 and 20 °C, with an emphasis on the range between 0 and 2.5 °C. In total, 14 calibration pulses of constant (maximum SD ±16 ppmv) humidity between 20–30 min were generated with the LI-610 and were calibrated against the respective saturation vapour pressure following Murphy and Koop (2005). As independent calibration validation, all CRDS humidity measurements were compared to the humidity measurements of the highest HygroClip when both sensors were measuring at the same time. Both measurement techniques yielded specific humidity (g kg−1) readings that agree reasonably well, with a slope of 0.98, an offset of 0.04 g kg−1, and an R2 of 0.99 at p<0.001.
The water vapour isotope measurements were first corrected for the humidity dependency of the CRDS instrument (Aemisegger et al., 2012) and afterwards were calibrated against the VSMOW-SLAP scale. The instrument-specific humidity dependency curve was established using a standard delivery module (SDM) of Picarro by injecting vapour of known isotopic composition at different humidity levels into the CRDS through the vaporiser of model V1102-i in the week prior to the experiments. Since the range of the expected isotopic composition of water vapour was narrow, only one humidity dependency curve was established for a standard water with isotope values close to the expected values (PCD: δ18O = −20.87 ‰, δD = −169.5 ‰). This water standard was measured in a humidity range between 500–18000 ppmv, with 16 821 ± 44 ppmv as the reference normalisation humidity level calculated from 10 plateaus. The data points for the humidity dependency calibration curves were calculated from 15–25 min of continuous CRDS data at constant (max ±190 ppmv, mean SD of 91 ppmv) humidity levels, and the calibration curves for both isotopes were established as orthogonal least-square fit of form to a total of 115 data points (SM Fig. S2) following Weng et al. (2020).
For the normalisation to the VSMOW-SLAP scale, two standard waters (MP: δ18O = −11.12 ‰, δD = −79.8 ‰; GRIP: δ18O = −34.14 ‰, δD = −265.0 ‰) bracketing the expected vapour isotopic composition were vaporised and injected into the CRDS by the SDM once a day, first at a high humidity level of 26 000 ppmv for 15 min to reduce memory effects and afterwards at a constant (max SD of 190 ppmv, mean SD of 99 ppmv) humidity level of 16 770 ± 354 ppmv (mean and SD of all 36 accepted calibration pulses). Continuous measurements of 16–25 min were averaged to obtain the calibration point for each day and each standard water. Since no instrument drift was observed during the laboratory campaign, all water vapour measurements were calibrated with the same calibration data set. This is consistent with other campaigns during which negligibly small drifts of the CRDS instrument were observed (Bailey et al., 2023). The calibration data set was generated by calculating a linear least-square fit to all 36 accepted calibration pulses, of which 21 were of standard water MP and 15 of standard water GRIP, obtained from calibration runs on 13 d. The water standards for the SDM had to be refilled once during the campaign, which resulted in small changes in the standard waters' isotopic compositions that were accounted for during the normalisation. All used sets of standard water were analysed for their isotopic composition at the hydrology laboratory of the University of Freiburg. We estimate the uncertainty of the standard water from replicate samples taken a minimum of 5 d apart from the SDM, which had an absolute offset of ≤0.03 ‰ for δ18O and ≤0.3 ‰ for δD. The humidity-corrected and calibrated 1 s vapour measurements were resampled to 3 min averages. The uncertainty associated with the precision of the vapour isotope data is estimated as the standard error of the mean of the 3 min averages.
The snow samples were melted in the air-tight closed Whirl-Pak®, filtered with a 0.2 µm filter (VWR, nylon membrane, 25 mm), and 1.5 mL of the sample was transferred to 2 mL glass vials and sealed. The samples were sent to and analysed at the stable water isotope laboratory of the Paul Scherrer Institute in Villigen, Switzerland, following established laboratory procedures with an uncertainty of the individual snow sample isotopic composition of <0.1 ‰ for δ18O and <0.5 ‰ for δD (Avak et al., 2019), which yields an uncertainty of 0.9 ‰ on d-excess.
2.2.3 Micro-CT scanning
Micro-computed tomography (µCT) 3D microstructure measurements of the airborne snow samples were performed to obtain information on the evolution of the SSA and the particle size distributions of the snow during the experiments. A small portion (≈ 1 cm2) of the periodically sampled snow was filled in a cylindrical µCT sample holder with a diameter of 15 mm. The measurements were performed using a Scanco® CT-40 scanner (e.g. Heggli et al., 2011; Pinzer and Schneebeli, 2009). A small sample holder was chosen to obtain a high 3D microstructure resolution (voxel size of 8 µm) and thus derive accurate measurements of the SSA and particle size distributions. For the binary segmentation, the energy-based segmentation procedure presented by Hagenmuller et al. (2013) was used. A marching-cubes approach (Hagenmuller et al., 2016) was used for calculating the SSA from the segmented µCT images. A metric for the particle size distribution can be derived from the µCT images by filling the 3D ice matrix with inscribed spheres of different diameters d (Hildebrand and Rüegsegger, 1997).
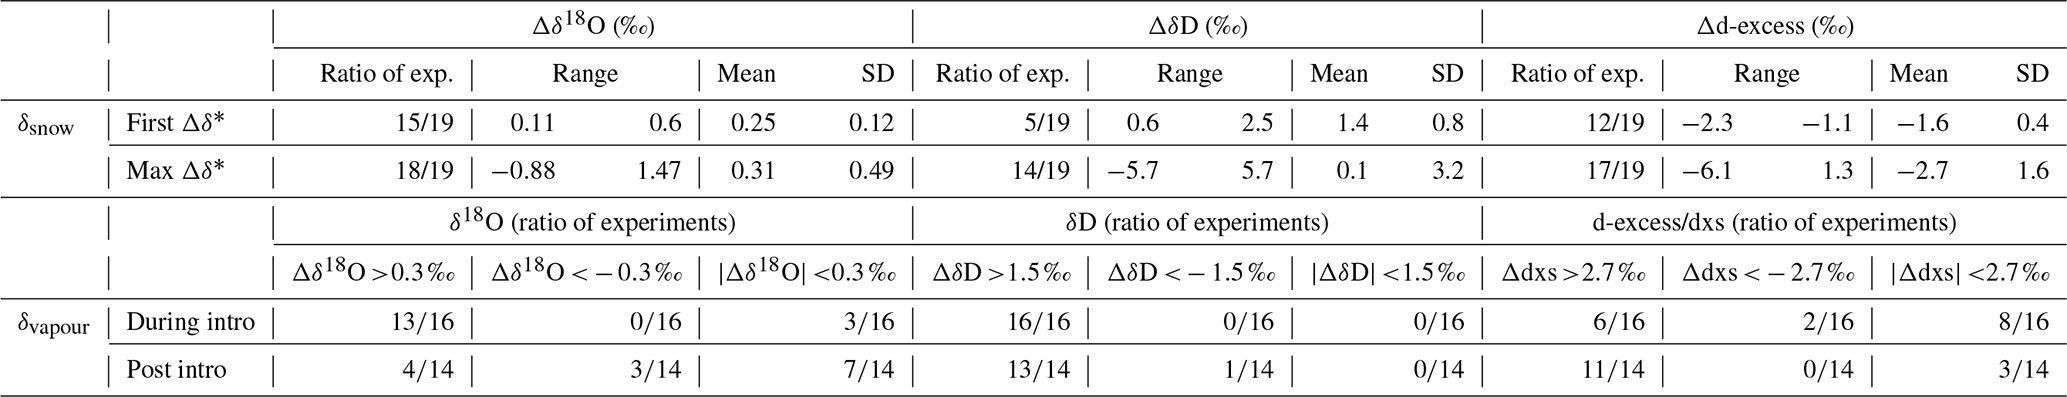
Table 2Statistics of the observed changes (Δ) in the isotopic composition of snow (δsnow) and water vapour (δvapour) during the wind tunnel experiments. Only significant changes are used for the calculations of range, mean, and ±1 standard deviation (SD). For Δδsnow, changes in the first airborne and the maximum observed isotope changes are given (1st ; max , where j refers to the airborne sample with largest deviation from initial snow). For Δδvapour, the number of experiments with high and low isotope signal changes during and following snow introduction are listed and described further in Sect. 3.2.2.
In the following, we present the evolution of the PPPs during the wind-blown snow experiments (Sect. 3.1), followed by the results of the evolution of the snow and vapour isotope signals after calibration and post-processing (Sect. 3.2).
3.1 The evolution of the snow's physical properties during aeolian transport
During 6 of the 16 experiments conducted in May 2023, the airborne snow samples were analysed for their PPPs through measurements of specific surface area (SSA) and sphere size distribution analysis using a µCT scanner. The results of experiment no. 10 had to be discarded as the snow was stored at −2 °C for too long before the samples were measured, which led to distorted µCT results. In the five remaining experiments, the SSA of the last snow sample was reduced to 35 %–70 % of the initial SSA after being transported in the wind tunnel for 1.25–2.5 h. The observed SSA decrease follows an exponential decay as a function of transport time (Eq. 3, Fig. 2a) in agreement with previous SSA decay observations during metamorphism (Cabanes et al., 2003):
with t being the transport duration, α being the decay rate, and c being a parameter for the non-zero asymptote. Neither α nor c show a simple dependency on the temperature regime of the experiment.
The sphere sizes detected in the initial and airborne snow samples can be described with a two-parameter gamma distribution, similarly to the expected particle size distributions in wind-blown snow (Budd, 1966; Clifton et al., 2006; Schmidt, 1982). The evolution of the sphere size distribution in all experiments followed a general coarsening pattern. As shown in Fig. 2b, the initial-snow samples (fresh snowmaker snow) show a distinct peak at ∼ 30–40 µm sphere size, with the largest detected sphere sizes reaching 100–150 µm. With time, both the distribution peaks and maximum values gradually shift towards larger sphere sizes. The smallest sphere sizes detected in the fresh snow (∼ 10 µm) had disappeared in the first airborne samples. However, small sphere samples (∼ 20 µm) are universally detected in all samples taken; i.e. there is only a marginal shift in minimum sphere sizes detected with transport time. Hence, airborne transport leads to a broadening of the distributions. After >80 min of airborne transport, the biggest particles have sphere sizes of >175 µm, reaching 200 µm or larger for the last airborne samples taken in each experiment. By the end of each experiment, the most abundant sphere sizes had shifted to 60–75 µm. Interestingly, the samples taken from the accumulated snow show a difference in the distribution of samples taken from the inner part vs. from the surface layer. The sample from the surface layer (“acc_out”, Fig. 2) shows a similar sphere size distribution compared to the airborne samples towards the end of the experiment, whereas the snow from within the accumulation layer (“acc_in”, Fig. 2) typically shows a distribution more closely resembling the early airborne snow samples. This supports our assumption that snow that is deposited early during the experiment remains in the accumulated snow layer and that snow that is sampled from the airstream can be regarded as “active snow”; i.e. it was transported either in saltation or suspension throughout the entire experiment duration. Note that density measurements of snow collected from an airstream are meaningless and are thus not shown.
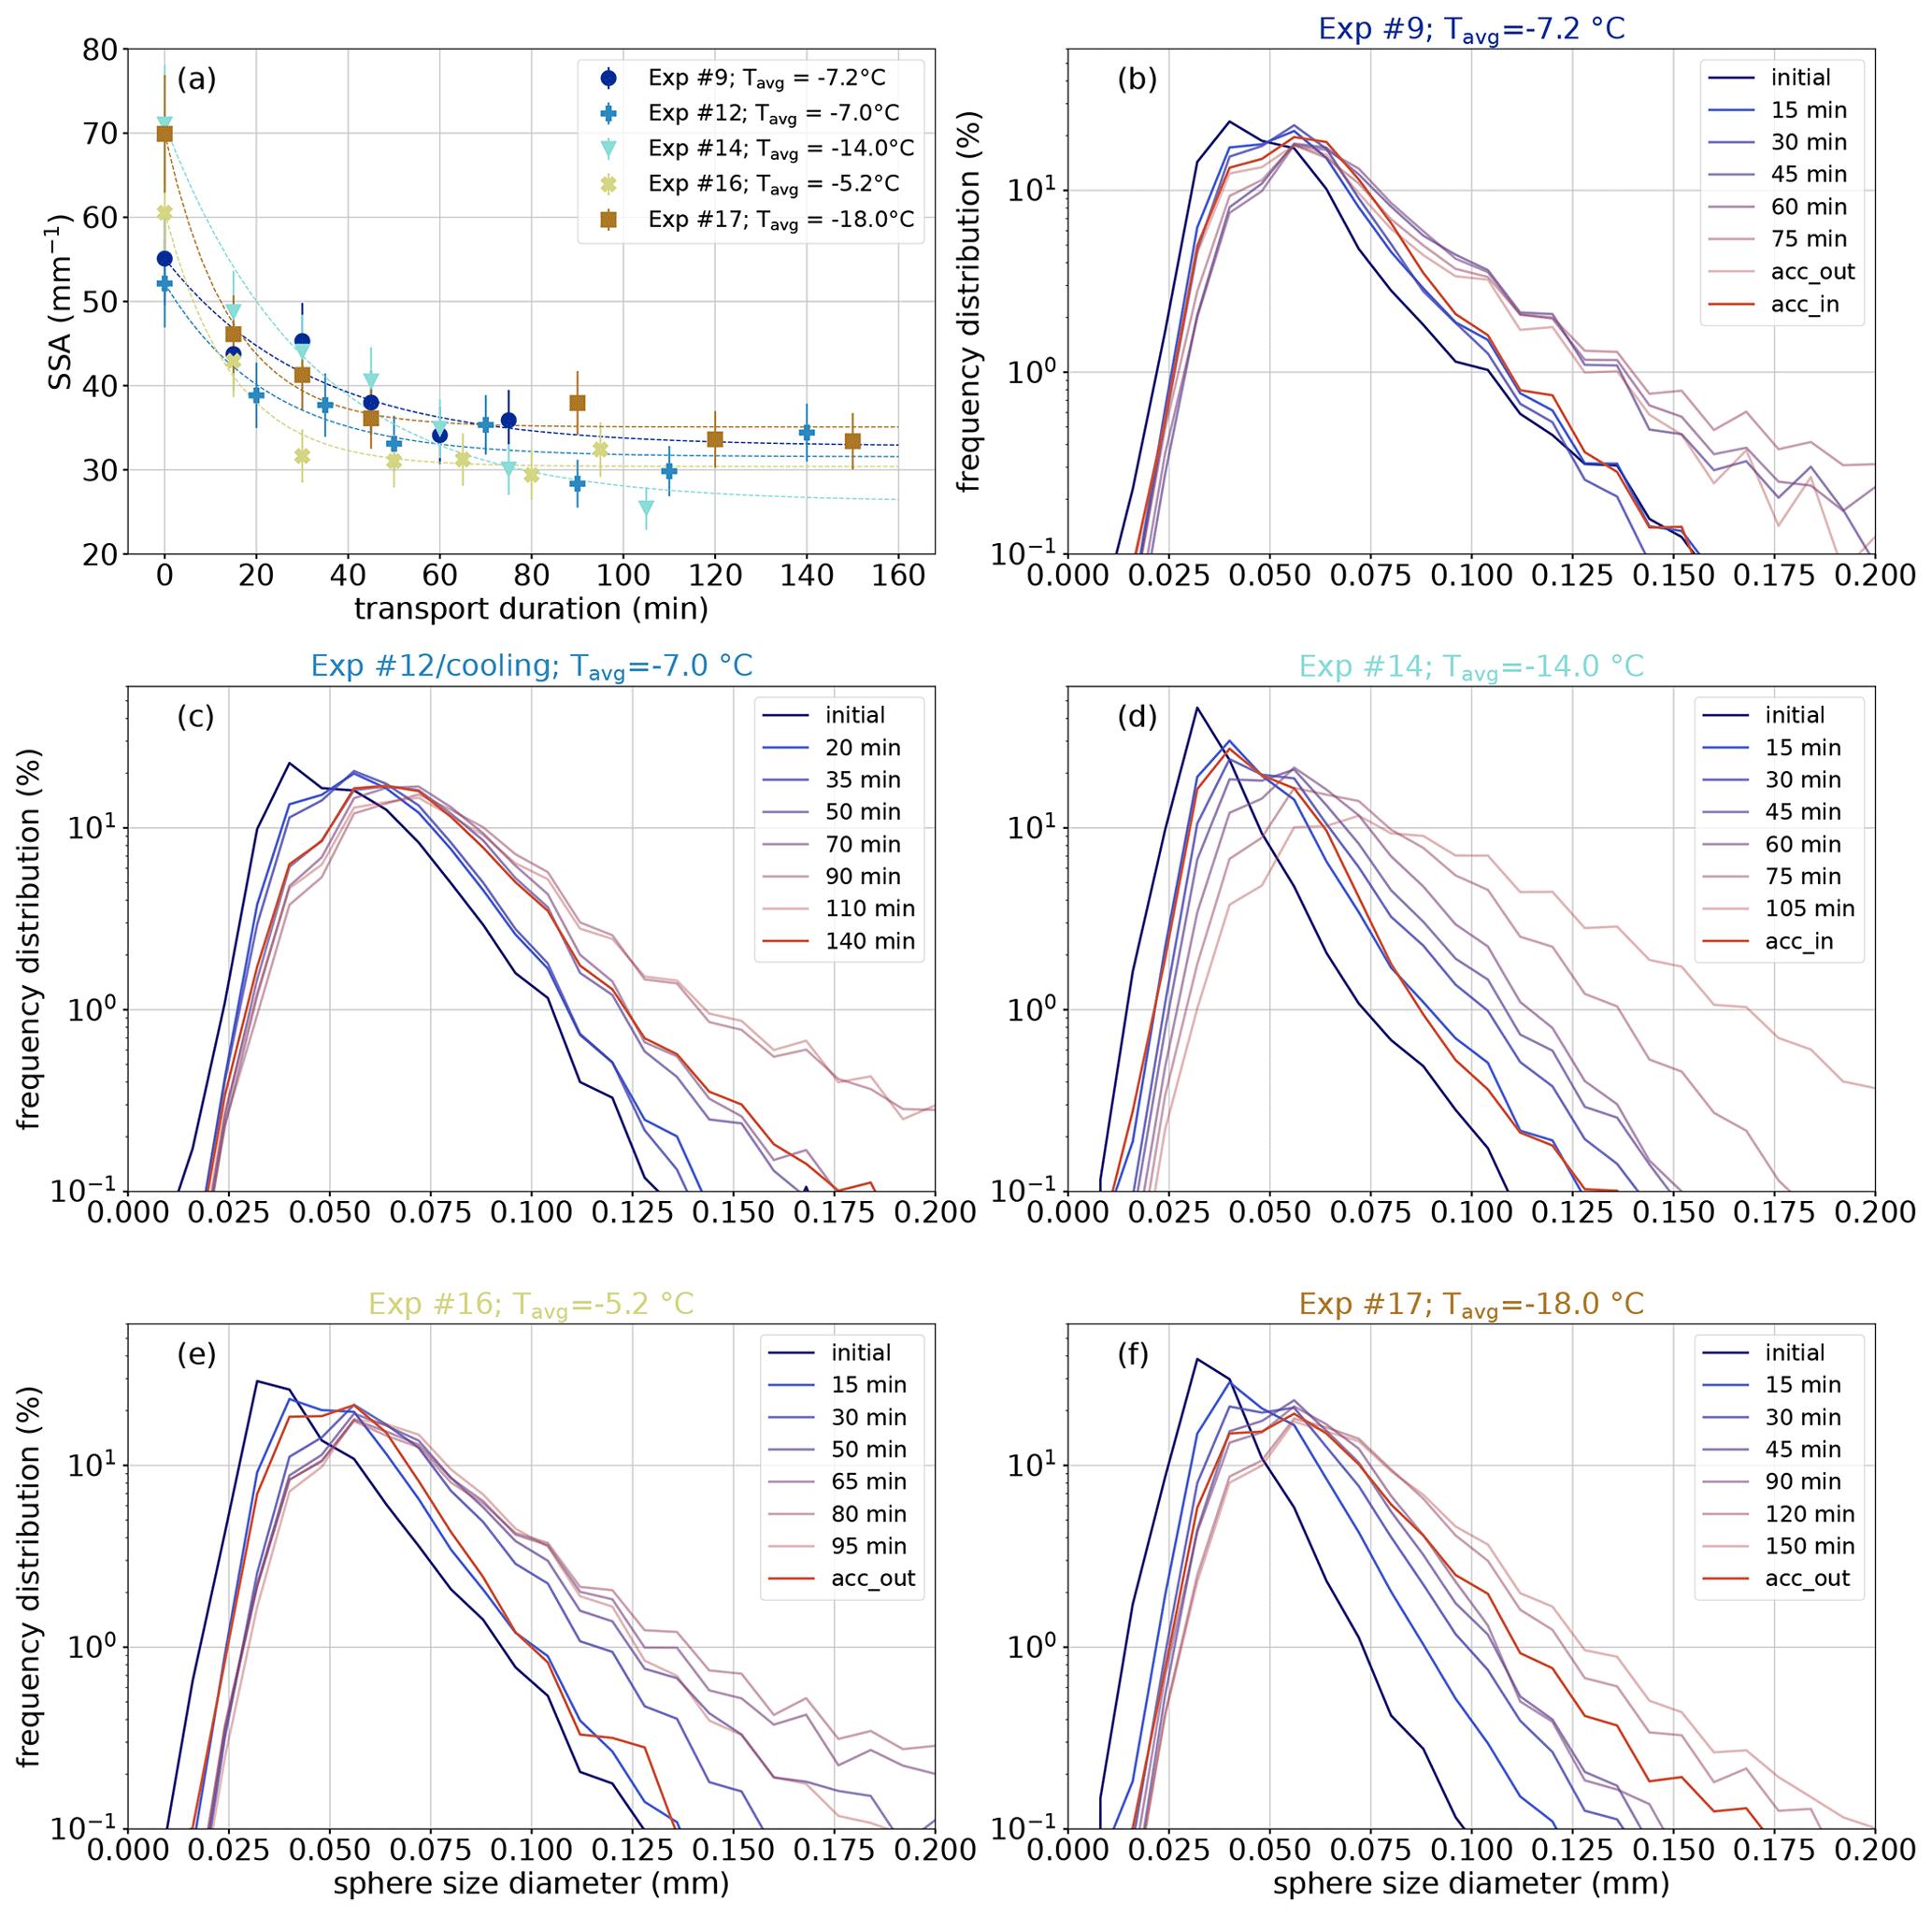
Figure 2The results of the µCT scans of five experiments. Panel (a) displays the decrease in SSA values with transport time in all five experiments at different temperature regimes. Dashed lines are exponential fits of Eq. (3) to the data points. Panels (b)–(f) each show the corresponding sphere size distributions for one experiment that serves as a measure for representative snow particle size. Each distribution is calculated from one snow sample, and the colour corresponds to the time after snow introduction. Note that “acc” samples were scraped off the snow accumulation in the wind tunnel. Samples labelled “acc-out” were taken from the surface layer, and “acc_in” samples were taken from the innermost part of the accumulated snow.
3.2 The isotopic signature of wind-blown snow experiments
To identify the underlying process responsible for the changes in the physical properties during aeolian transport, the evolution in the water isotope signal of the snow was obtained from discrete snow sampling at regular time intervals after the snow introduction to the wind tunnel, and the vapour isotopic composition in the wind tunnel was measured continuously.
3.2.1 Changes in the snow isotopic composition
The snow isotopic composition changed with time during aeolian transport. Figure 3 shows the change in isotopic composition between the initial snow (mean of three samples) and the first airborne sample in panels (a), (b), and (c) and the maximum observed change between initial and airborne snow in panels (d), (e), and (f) for δ18O, δD, and d-excess, respectively. The statistics of the observed significant changes in snow isotopic composition are given in Table 2.
Just after the snow introduction, the majority of the experiments show a significant enrichment in the snow δ18O value () and a decrease in the d-excess value (). For δD, only experiments show a significant enrichment. In all other experiments, the observed changes in the first airborne snow sample are within the uncertainty limits of the calculated difference and thus are not significant. The snow isotopic composition evolved further during aeolian transport.
The general pattern of maximum observed changes between initial and airborne samples that are significant is a δ18O enrichment () and a d-excess decrease (). Three experiments show a reverse behaviour of significant δ18O depletion, and one experiment shows a d-excess increase. For δD, the maximum isotope change recorded is almost evenly distributed between enrichment () and depletion () cases, and five recorded changes fall within the range of measurement uncertainty. Both the cooling (no. 12, ΔT: −6.3 °C) and the warming (no. 18, ΔT: +13.5 °C) experiment follow the general pattern of δ18O enrichment and d-excess decrease in the first airborne snow sample, which intensifies during the experiments. For δD, both experiments show a significant enrichment only after the first snow-sampling time. During the warming experiment, 14 airborne snow samples were taken, which allows a robust trend analysis for this experiment. Including the initial mean isotopic composition and accounting for the uncertainties, the trends for snow isotopic evolution have positive slopes (m) for δ18O (m=0.006 ‰ min−1, p=0.000) and δD (m=0.011 ‰ min−1, p=0.091) and a negative slope for d-excess ( ‰ min−1, p=0.002).
No general, simple dependency between observed isotopic changes and average temperature, net sublimation, transport duration, or initial isotopic composition can be identified. Note that the net increase in humidity correlates positively with the average experiment temperature, as expected by the Clausius–Clapeyron relationship (Fig. 3).
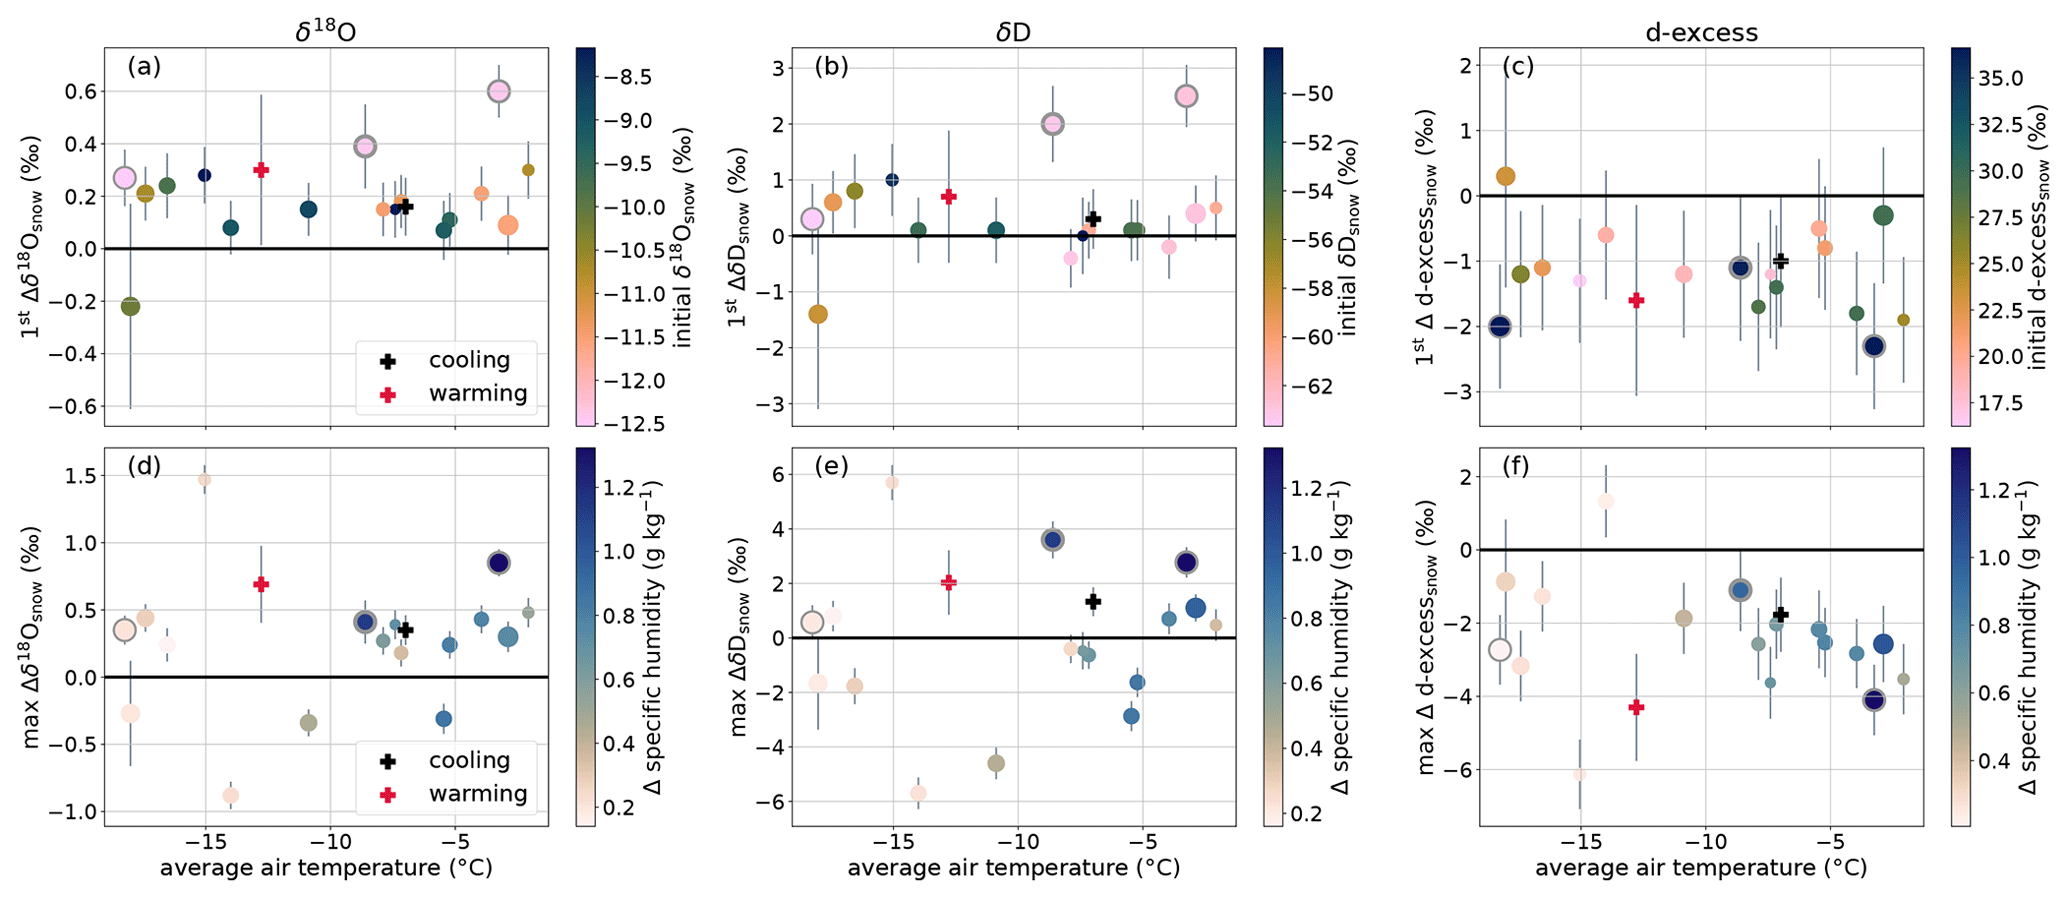
Figure 3Overview of recorded changes in snow isotopic composition during the 19 different experiments. The upper row shows the change in snow isotopic composition () between the average initial snow and the first airborne snow sample (1st ). The lower row shows the maximum observed change between average initial and airborne snow (max , where j is the airborne sample with the largest deviation from initial snow). Changes in δ18O are displayed in (a) and (d), changes in δD are shown in (b) and (e), and changes in d-excess are shown in (c) and (f), plotted against the average temperature during the experiments. The colour code in (a), (b), and (c) shows the average initial-snow isotopic composition. The colour code in (d), (e), and (f) shows the change in specific humidity inside the wind tunnel due to the sublimation of snow until the sampling of the corresponding snow sample. The warming (red cross) and cooling (black cross) experiments are excluded from the colour coding because of their extreme values, which are given in Table 1. Circular grey data points are the experiments conducted in January, in which the specific humidity increase was calculated from the HygroClip sensors in the absence of the CRDS measurements. The marker size indicates the total transport duration in the range of 49 to 180 min, with bigger markers representing longer transport times. Error bars account for the total error calculated from the standard error of the initial mean and the measurement uncertainty of the individual airborne snow sample.
The snow samples taken from the accumulated snow (not shown) show a clear difference between the samples from the inner part and from the surface layer of the accumulated snow. All 16 snow samples from the May period taken from the inner part of the snow accumulation have an isotopic composition closer to that of the initial snow compared to the samples from the surface layer of the accumulated snow. In experiments, the inner accumulation samples had the same (±uncertainty) isotopic composition for all three isotope variables as the initial snow.
3.2.2 The co-evolution of atmospheric and snow variables
Atmospheric variables
The changes we observe in the PPPs and the isotopic composition of the airborne snow are a result of the interplay between the snow particles and the atmospheric conditions in the wind tunnel. For each experiment, the atmospheric conditions were closely monitored. In the following, we summarise the evolution pattern of all experiments and show the data of experiment no. 9 as a representative example in Fig. 4.
At the start of the experiments, when the conditions inside the wind tunnel were stable, the wind generation was initiated (Fig. 4d), and shortly after, the snow was added to the wind tunnel (Fig. 4, purple shading). Immediately after the snow introduction started, the RHice increased sharply and reached saturation with respect to ice within minutes (Fig. 4a). With the start of the wind generator system, the air temperature inside the wind tunnel started to increase as heat was generated by the propeller motor (Fig. 4c, red line). This wind tunnel heating was modulated by the laboratory's cooling system in a way that the cooling phases of the laboratory climate system also slowed down the temperature increase inside the wind tunnel (Fig. 4c, yellow line). The total temperature change for each experiment is given in Table 1. Concurrently with the temperature, the specific humidity inside the wind tunnel evolves as the air reaches (or gets close to) saturation conditions; hence, the saturation vapour pressure defines the humidity level (Fig. 4b). This general evolution of the meteorological variables with the temperature evolution dominating the (saturation) humidity level inside the wind tunnel was observed for all experiments except the warming experiment, in which the air only briefly reaches saturation after ∼ 1 h due to continuous strong heating of the wind tunnel air stream.
The snow-sampling events every 15–30 min can be identified as short-lived dips of 1–2 min in the wind speed (Fig. 4d). In this experiment, the first airborne snow sample (1st ) shows a 0.18 ‰ enrichment in δ18O (Fig. 4f) and a −1.4 ‰ decrease in d-excess (Fig. 4j) whereas the δD value (Fig. 4h) does not change significantly (+0.1 ‰). The maximum observed change (max for this experiment is a 0.18 ‰ enrichment in δ18O, a −0.6 ‰ depletion in δD and a −2.0 ‰ decrease in d-excess. The vapour isotopic composition in this experiment showed enrichment in δ18O (0.81 ‰), δD (10.4 ‰) and an increase in d-excess (3.9 ‰) during the snow introduction. After the snow introduction had ended and until the end of the experiment the δ18O signal showed a reverse evolution (−0.27 ‰) while both δD (2.9 ‰) and d-excess (5.0 ‰) continued to increase.
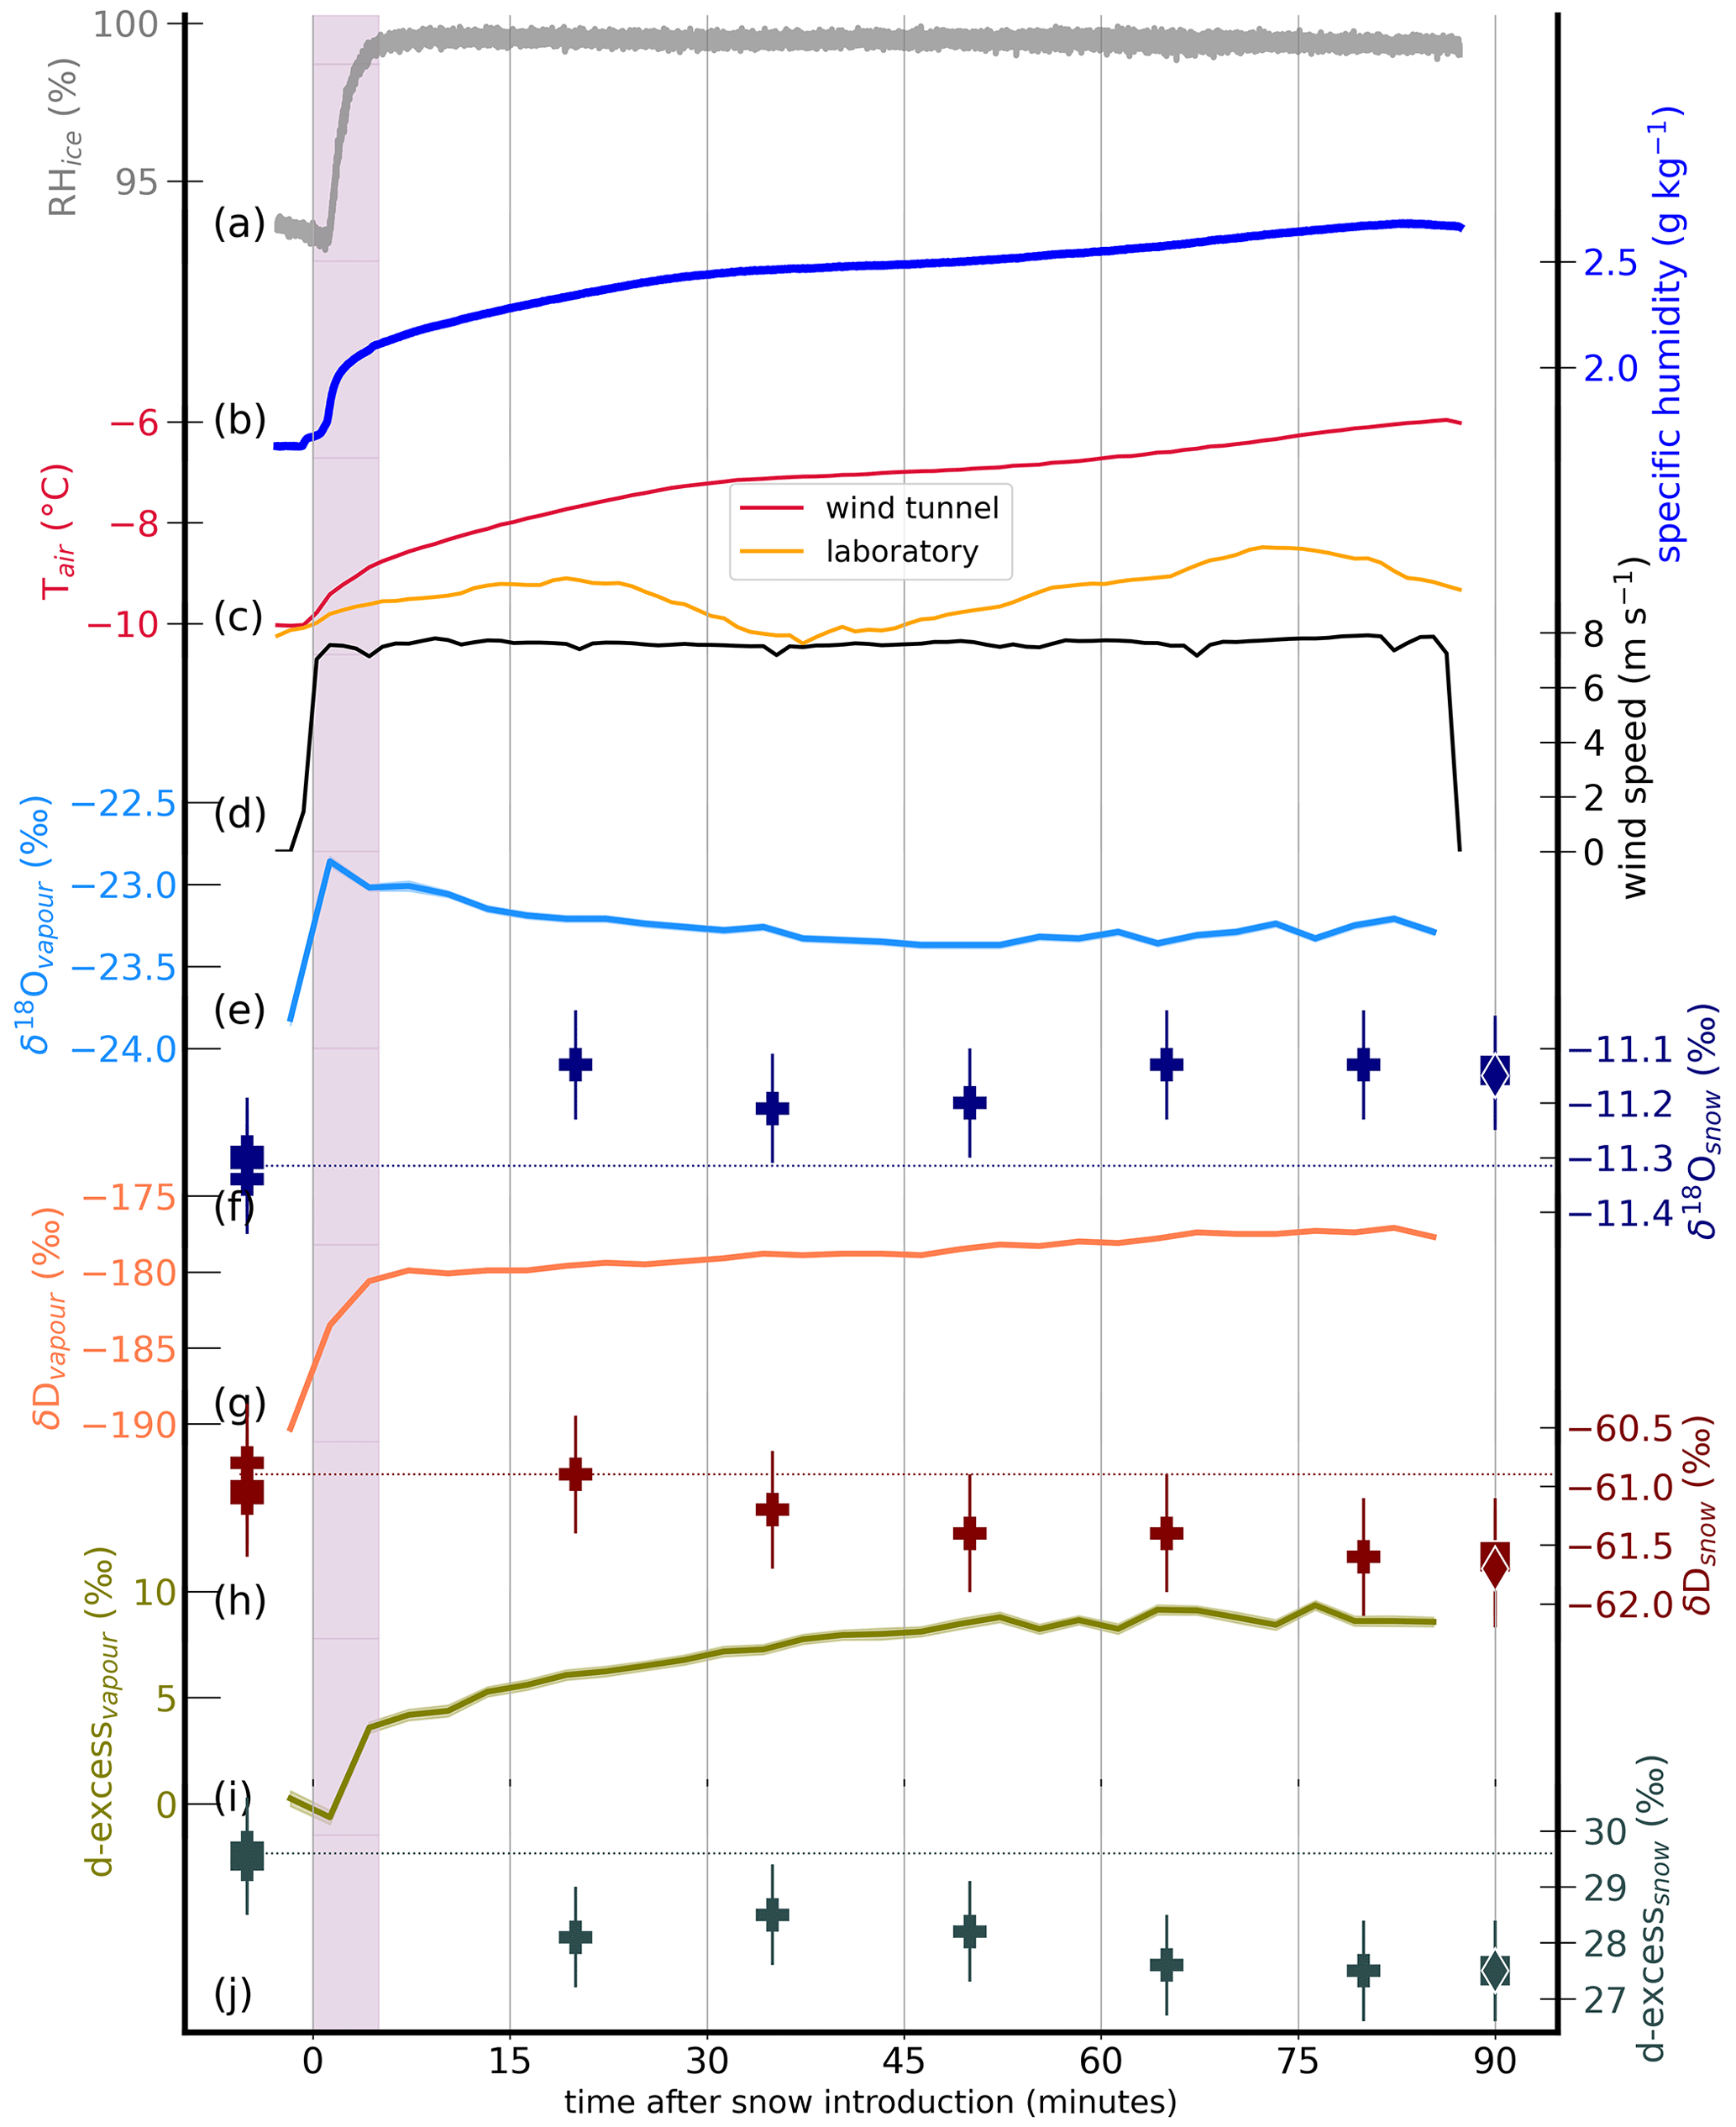
Figure 4The time evolution of all monitored variables in the exemplary experiment no. 9. The meteorological variables inside the wind tunnel are shown in the following panels: (a) relative humidity with respect to ice, (b) CRDS specific humidity readings, (c) wind tunnel and laboratory temperature, and (d) wind speed. The period of snow introduction is shaded in purple. After the snow introduction, the wind tunnel was closed and only opened for brief periods of 1–2 min during airborne snow sampling, which are visible as dips in the wind measurements. The evolution of the 3 min averaged water vapour isotopic composition is shown with shading for the standard error of the mean uncertainty for δ18O in (e), δD in (g), and d-excess in (i). The isotopic composition of the snow samples is given in (f) for δ18O, in (h) for δD, and in (j) for d-excess, with the measurement uncertainty as error bars. The snow samples taken from the accumulated snow are shown as square (surface layer/acc_out) and diamond (inside of accumulation/acc_in) markers. The horizontal lines indicate the initial isotopic composition (mean of three samples).
Vapour isotopic composition
The co-evolution of the isotopic composition of the vapour is exemplarily shown in Fig. 4e, g, and i for experiment no. 9 and is summarised for all experiments in Fig. 5 and Table 2, where the observations are divided into changes during and post snow introduction.
During the snow introduction (Fig. 5 a, b, c), most of the 16 experiments in May 2023 showed a strong enrichment in the vapour phase of δ18O () and δD () and an increase () in d-excess. Two experiments showed a decrease in d-excess. The remaining experiments showed no prominent change during snow introduction in vapour δ18O () or d-excess ().
Post snow introduction (Fig. 5d, e, f), the evolution in the 14 constant temperature experiments can be categorised into the following:
- i.
continued increase in δ18O (), δD (), and d-excess ();
- ii.
reversed evolution, i.e. strong depletion in δ18O () and δD ();
- iii.
low variability in δ18O () and d-excess ().
In the warming experiment, δ18O, δD, and d-excess all showed a pronounced increase after the snow introduction had ended until the end of the experiment. Finally, the cooling experiment showed a variable isotopic evolution with a sequence of pronounced phases of depletion and enrichment and another depletion phase in both δ18O and δD, resulting in net depletion, whereas the d-excess stayed relatively constant (|Δd-excess|<2.7 ‰) during the entire experiment.
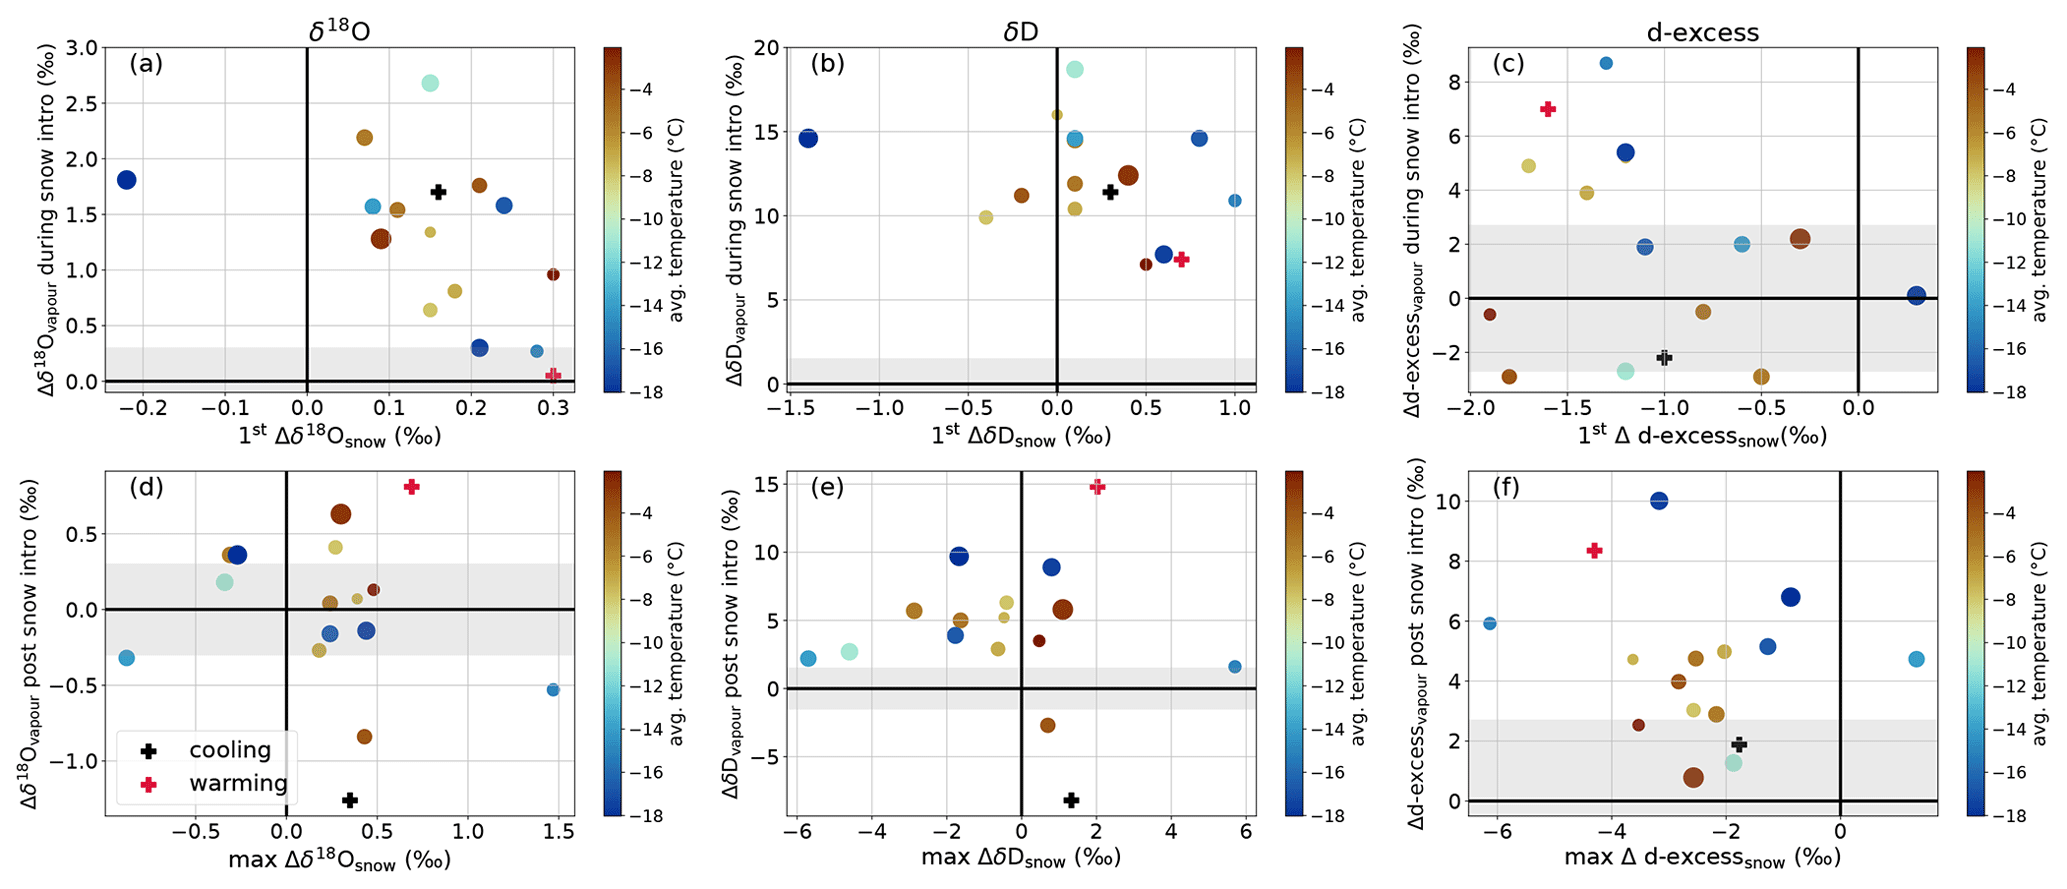
Figure 5The co-evolution of changes in vapour and snow isotopes in all experiments with vapour isotope observations. The change in the snow isotopes (x axes) is plotted against the changes in the vapour isotopes (y axes). The changes in vapour isotopes are calculated from the 3 min averaged data. The upper row (a, b, c) shows changes in vapour isotopes during the snow introduction plotted against the observed change in the snow isotopes of the first airborne sample (see Fig. 3). The lower row (d, e, f) shows the subsequent change in vapour isotopes following snow introduction until the end of the experiment plotted against the maximum observed change in the snow isotopic composition. Shaded areas represent low variability in vapour isotopic composition (|Δδ18O|<0.3 ‰, |ΔδD|<1.5 ‰, |Δd-excess|<2.7 ‰). Note that the colour code represents the average air temperature during the experiments and allows the comparison between the upper and lower rows and the results shown in Fig. 3. The cooling (black cross) and warming (red cross) experiments are exempt.
4.1 Airborne snow metamorphism
4.1.1 SSA
All experiments with µCT measurements show a rapidly decreasing SSA with transport time that can be described by the typical exponential decay function (Cabanes et al., 2003). This phenomenon is well known inside the snowpack where the SSA decreases over time in isothermal conditions and under temperature gradient conditions due to snow metamorphism (Harris Stuart et al., 2023; Schleef et al., 2014b), but it seems to happen at an increased rate of 1–2 orders of magnitude during airborne transport. The decrease in SSA describes a change in the particle morphology, and the rapidness with which the SSA decreases suggests a rounding and growing of particles through abrasion or metamorphic mechanisms since large spheres have the lowest SSA values (Legagneux et al., 2002). These results are in line with the changes observed in the sphere size distribution analysis that are discussed below. Note here that simple mechanic fragmentation of snow particles alone does conceptually lead to an increase in sample SSA and thus cannot explain the decrease in SSA. The initial SSA values of the experiments vary slightly, which is due to the storage time between snow production and the experiment start (Table 1). Although the snow was stored at −20 °C to slow down snow metamorphism prior to the experiment start, the older the snow was when introduced into the wind tunnel, the lower the initial SSA was. We find no direct dependency of SSA decay rate on temperature, which is in line with wind tunnel experiments studying the metamorphism rate of accumulated snow under wind influence for temperatures <−5 °C (Walter et al., 2024) but is different from snowpack metamorphism under no-wind conditions (Harris Stuart et al., 2023; Schleef et al., 2014b). The driving processes for snow metamorphism are vapour pressure gradients, which are largely governed by the (absolute) temperature regime in a stationary snowpack (Kaempfer and Schneebeli, 2007; Taillandier et al., 2007). In airborne snow metamorphism, however, other processes such as turbulent mixing of air and vapour, particle–air temperature gradients (see Sect. 4.2), and variability in saturation conditions might dominate the vapour pressure variability and therefore mask the simple absolute temperature dependency that is expected in stationary snowpack metamorphism.
4.1.2 Particle size and shape
The evolution of the fitted sphere size distribution with transport time shows a general broadening and increase in skewness, with a shift of the dominant sphere size to larger diameters. As the algorithm finds the maximum sphere size it can fit at any given location inside the ice matrix of the sample (Hildebrand and Rüegsegger, 1997), this can be interpreted as larger particles emerging and a rounding of the individual particles with transport time. These observations are somewhat surprising since aeolian transport of snow is associated with fragmentation and abrasion of particles and thus a decrease in particle sizes as snow crystals break apart due to mechanical stresses (Comola et al., 2017; Sato et al., 2008). Notably, the evolution of sphere size distribution resembles the evolution observed during isothermal metamorphism (Flin et al., 2004; Legagneux and Domine, 2005). We note here that care must be taken when interpreting fitted sphere sizes as particle sizes (Löwe et al., 2011), and we mention the difficulty in the assessment of particle “size” in snow in general (Fierz et al., 2009). In fact, our observations of growing sphere sizes do not contradict the initial snow particle fragmentation mechanism through impact as pure fragmentation does not significantly influence fitted sphere size distributions within a snow sample. On the other hand, abrasion producing very fine snow dust could increase the occurrence of very small fitted sphere sizes. However, we see a disappearance of the smallest fitted sphere sizes and an appearance of and increase in bigger sphere sizes of >100 µm. One mechanical mechanism that could explain the shift to larger sphere sizes could be the collision and subsequent aggregation of snow particles, as known from ice cloud observations (Pruppacher and Klett, 1997). In ice clouds, this process of coalescing snow particles is an important ingredient in the growth of ice crystals and the formation of snow aggregates (Lo and Passarelli, 1982; Mitchell, 1988).
Another plausible mechanism for the growing of particles is airborne snow metamorphism with continuous sublimation from and vapour deposition on the suspended particles (Walter et al., 2024). The (close-to-) saturation conditions inside the wind tunnel a few minutes subsequent to the snow introduction are favourable conditions for this chain of thermodynamic processes. The growing and rounding of the particles may thus be explained by airborne metamorphic growth, with vapour being preferentially sublimated from convex sub-grain boundaries and entire small grains and preferentially deposited in concavities or on larger grains with lower curvature (Kelvin effect) in analogy to isothermal metamorphism in a snowpack (Colbeck, 1998, 2001; Wakai et al., 2005). Vapour deposition on suspended snow particles has been previously modelled in large-eddy simulations (LESs) of wind-blown snow (Sharma et al., 2018; Sigmund et al., 2024) but could not be validated against observations so far. As was shown by Sharma et al. (2018), these deposition-enabling conditions can exist even under slightly under-saturated surrounding conditions (usually generally favouring sublimation) if the particle temperature is lower than the surrounding air temperature. Traditionally, a temperature equilibrium between the particle and surrounding air is assumed following the well-established and frequently used sublimation rate estimation by Thorpe and Mason (1966). This assumption does not allow for the deposition of vapour on the suspended particle. However, as the temperature in the wind tunnel was not constant, it is possible that the particle temperature was lagging the air temperature, preventing the establishment of a temperature equilibrium between the air and the snow particle. The accumulated snow on the ground and the walls of the wind tunnel could further act as a cooling source in the wind tunnel system that could especially cool saltation particles. Sharma et al. (2018) found a direct dependency between particle diameter and temperature equilibration lag time. This would suggest that, while small particle fragments (from e.g. abrasion) might equilibrate faster and consequently sublimate entirely, bigger and colder particles might attract vapour deposition and thus trigger a positive feedback. Indeed, we find that the smallest sphere sizes detected initially disappear with time, which can be interpreted as the full sublimation of the smallest particle fragments. These explanations combined can resolve the apparently conflicting observations of growing particles due to vapour deposition while we see a net humidity increase from snow sublimation throughout the experiments.
4.2 The isotopic signature of airborne snow metamorphism
We have observed changes in the isotopic composition of vapour and, notably, also in the snow during the experiments. The changes in the snow isotopic composition support the theory of airborne snow metamorphism as a driver for PPP changes since involved phase changes lead to changes in the isotope signals. Mechanical mechanisms such as abrasion, clustering, and aggregation of particles, however, would not lead to changes in the bulk isotopic composition of the snow sample. Investigating the amplitude and sign of the changes in the snow isotopic signal allows further deduction about the processes at play.
4.2.1 Sublimation-controlled metamorphism immediately after snow introduction and during warming experiment
The near-universal signal of enrichment in snow δ18O and δD while d-excess decreases in the first airborne snow sample suggests sublimation-dominated metamorphic mechanisms affecting the snow and its PPPs during and immediately after snow introduction. This is in line with the steep humidity and RH increase to (close-to-) saturation conditions in this period. Similarly, the continuous positive trend in snow δ18O and δD and the negative trend in d-excess during the persistent sub-saturated conditions in the warming experiment suggests isotopic fractionation during net sublimation conditions. The existence of fractionation during sublimation has been controversially discussed as the slow process of self-diffusion in ice and usually does not allow mixing on timescales fast enough to incorporate the sublimation signal into the remaining solid matrix (Friedman et al., 1991; Hu et al., 2022). Thus, it was assumed that sublimation happens according to a layer-by-layer removal of the water molecules, which would not alter the isotopic composition of the remaining ice. Following this reasoning, current isotope-enabled climate models do not account for fractionation during snow sublimation (Cauquoin and Werner, 2021; Dütsch et al., 2023; Moore et al., 2016; Pfahl et al., 2012). However, ever-growing evidence documents an enrichment in δ18O and δD in snow isotopic composition during and after sublimation of surface snow (Hughes et al., 2021; Sokratov and Golubev, 2009; Stichler et al., 2001) analogously to the results of Δδ18O and ΔδD in the first airborne snow samples and the trend analysis in the warming experiment. The concurrent decrease in snow d-excess is also in agreement with previous laboratory studies that likewise found a decrease in d-excess under sublimation conditions (Hughes et al., 2021). It is an indicator of the existence of non-equilibrium, diffusive processes, which aligns with the strong sublimation signal in the humidity observations. Thus, the wind tunnel results presented in this study further add to previous studies with δ18O and δD enrichment and d-excess decrease during sublimation-favourable conditions.
These sublimation-dominated conditions in the wind tunnel at the beginning of the experiments can explain the PPP changes observed in the first airborne samples. The shift in the smallest sphere sizes is largest between the initial snow and the first airborne snow samples. Highly dendritic parts of the airborne particles either first get abraded and fragmented or sublimate directly from the airborne dendritic particles, which explains the disappearance of the smallest fitted sphere sizes and the decrease in SSA. Once (close-to-) saturation conditions are reached, the conditions shift towards deposition-controlled metamorphism.
4.2.2 Deposition-controlled metamorphism during aeolian transport
We hypothesise that the further decrease in SSA and the gradual shift towards bigger sphere sizes is due to vapour deposition on the airborne particles that consequently grow with aeolian transport time. This hypothesis is supported by the observed maximum changes in snow isotopic composition that can be explained by assuming vapour deposition on suspended particles. Following this assumption, the vapour that gets deposited on the suspended particles controls the sign and magnitude of the change observed in the airborne snow samples. Indeed, the changes can be explained by analysing the isotopic composition of the solid that is formed (deposited) from vapour inside the wind tunnel and the initial snow that is introduced. Figure 6b shows this analysis for δD assuming equilibrium fractionation. The solid disequilibrium analysis (Sect. 1) shows that, generally, experiments in which the combination of water vapour and temperature inside the wind tunnel produces an equilibrium deposit that is enriched compared to the initial snow (positive disequilibrium) show a positive change in δD. If, however, the formed equilibrium deposit is depleted compared to the initial snow (negative disequilibrium), the change in δD is negative. A linear fit to this data is significant (p=0.004), with R2=0.46. It is worth mentioning that a temperature uncertainty of +1 K can produce a fit with a zero origin. In Fig. 6a, the same analysis is shown for δ18O. As δ18O is more sensitive to non-equilibrium conditions than δD (Majoube, 1970; Merlivat and Nief, 1967), it is not surprising that the disequilibrium analysis of formed equilibrium deposits cannot explain the observations. Instead, the changes in δ18O can be explained by allowing for a colder particle temperature compared to the surrounding air. As discussed earlier, this condition of a particle–air temperature gradient that leads to supersaturation with respect to the particle surface is a requirement for the growth of particles through vapour deposition on such short timescales, and the changes in δ18O support this theory. Isotopic fractionation under supersaturation conditions can produce solid deposits with very depleted δ18O values compared to pure equilibrium fractionation (Jouzel and Merlivat, 1984). The resulting δ18O value of the deposit is dependent on the supersaturation condition (set by the particle–air temperature difference) that strongly influences the non-equilibrium fractionation of δ18O. The changes in snow δ18O during the wind tunnel experiments are thus dependent on the combination of initial snow and vapour isotopic composition and the particle–air temperature difference that defines the supersaturation. Everything except the particle–air temperature difference is measured in the wind tunnel experiments, which allows us to estimate the temperature difference needed to observe negative changes in snow δ18O values. Following Jouzel and Merlivat (1984), we calculate the minimum supersaturation conditions necessary for negative changes in snow δ18O. From this, we deduce the associated temperature difference between air and particles using the saturation vapour pressure functions of Goff and Gratch (1946) (see colour code in Fig. 6a). As can be seen, the four experiments in which a negative change in snow δ18O was observed during the experiments are indeed cases in which reasonable temperature differences of 0.5–1.0 K are enough to result in the negative δ18O changes that were observed. Generally, the calculated required temperature difference shows a strong correlation with the maximum observed changes in snow δ18O, with R2=0.47 and p=0.004 (not shown).
In summary, the observed changes in snow isotopic composition support the theory of growing particles due to vapour deposition and the existence of the prerequisite of particles that are colder than the surrounding air.
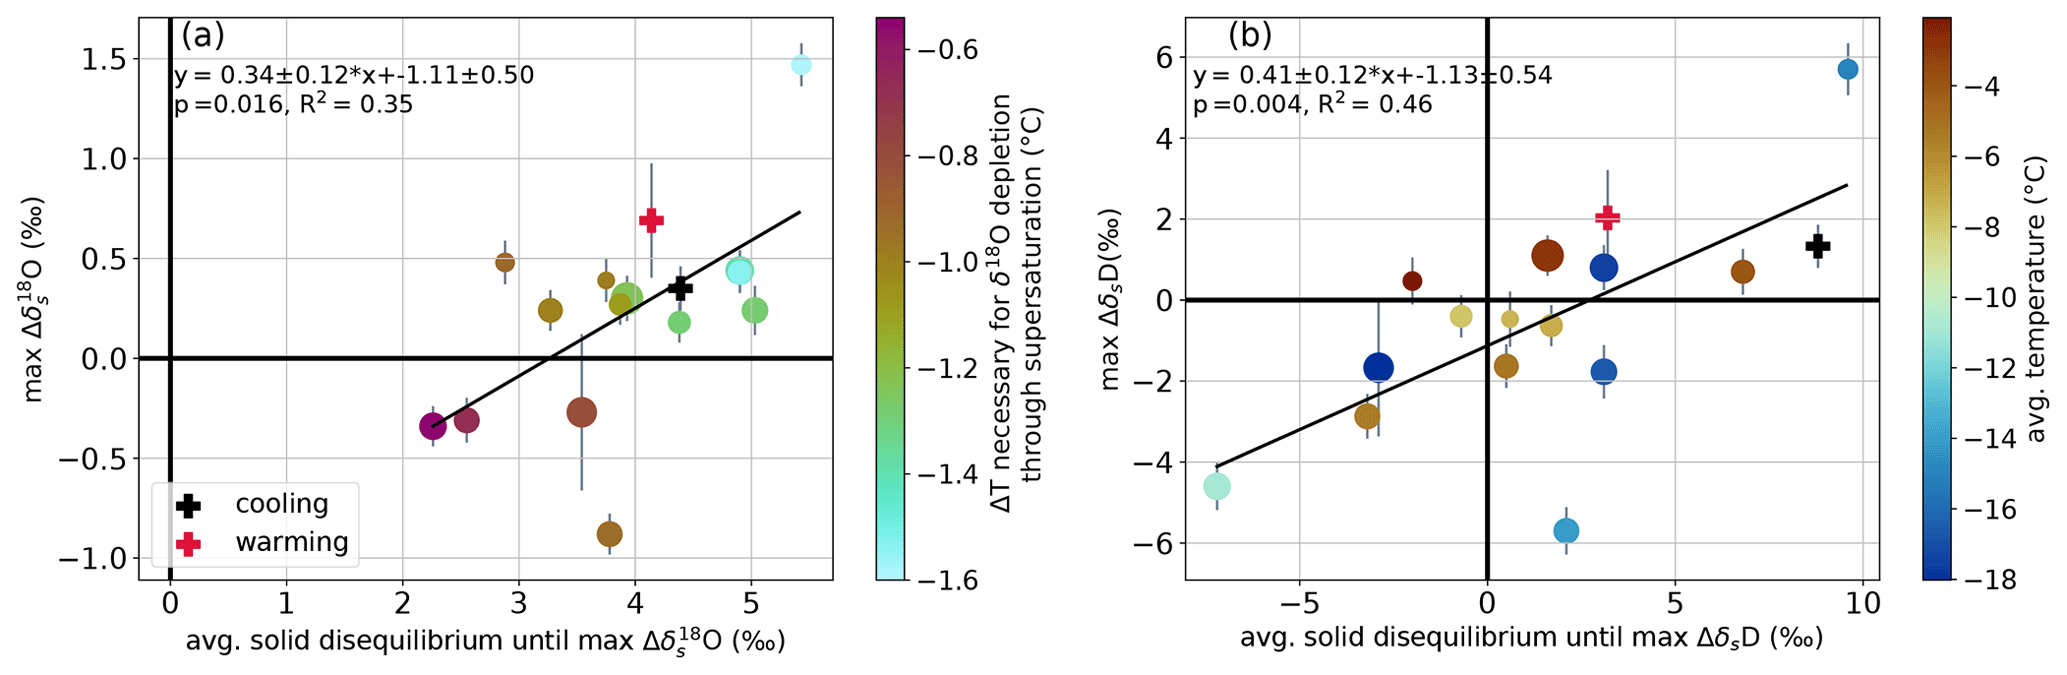
Figure 6Changes in snow isotope signal explained. The y axes show the maximum isotopic change observed between the airborne snow sample and the initial-snow sample for δ18O in (a) and for δD in (b) (same as Fig. 3d and e). The x axes show the average solid disequilibrium in the period after the snow had been added until the maximum change in snow isotopic composition was observed. The colour code in (b) shows the average temperature of the experiments. In (a), the colour code shows the minimum particle–air temperature difference required to produce supersaturation conditions that lead to a negative δ18O change in the snow. Linear least-square fits to the data and the corresponding fitting statistics are given.
4.2.3 Fractionation during sublimation?
As outlined above, this study finds isotopic enrichment in the first airborne snow samples under net sublimation conditions, supporting previous snow-focused studies that present evidence for fractionating sublimation (Hughes et al., 2021; Sokratov and Golubev, 2009; Stichler et al., 2001). A recent study by Wahl et al. (2021) further substantiated the existence of isotopic fractionation during net sublimation from a snow surface by measuring the isotopic composition of the near-surface sublimation flux, which was shown to be significantly depleted compared to the surface snow isotopic composition. Besides the change in the snow isotope signal, the wind tunnel data provide additional supporting evidence through the vapour isotope signal. That is, the changes observed in the vapour isotopic composition during snow introduction are better described by assuming a mixing between already present and newly produced water vapour originating from fractionating sublimation rather than from non-fractionating sublimation. Specifically, the initial disequilibrium prior to snow introduction (i.e. vapour produced by fractionating sublimation) is a better predictor for the changes in vapour isotopic composition during the snow introduction (R2(δ18O) = 0.76, R2(δD) = 0.68) than the mere difference in vapour and snow isotopic composition (i.e. vapour produced by non-fractionating sublimation) (R2(δ18O) = 0.47, R2(δD) = 0.28). For corresponding plots, see SM Fig. S3. However, we want to point out that our observations of an isotopic-deposition signal during general net sublimation (specific humidity increase) suggests an alternative explanation for the observed fractionation during net sublimation. Snow metamorphism happens on the micro-scale, driven by net vapour–pressure gradients where “metamorphic sublimation” and “metamorphic deposition” can co-exist within the snowpack while being spatially separated on the micro-scale, e.g. within one snow crystal. This process happens continuously in the snowpack (Colbeck, 1982) and, evidently, also during airborne transport, with periods of varying dominance of one process over the other. This concept of airborne snow metamorphism is schematically visualised in Fig. 7. Thus, observations of isotopic fractionation during net sublimation do not require that metamorphic sublimation is indeed fractionating if simultaneous metamorphic deposition is. The isotopic enrichment in the solid matrix could thus stem from enriched deposits rather than a surface becoming enriched by sublimation. As in our experiment, this would require that the deposit has a lower d-excess than the snow particle on which it gets deposited, leading to a d-excess decrease rather than the theoretical d-excess increase during vapour deposition (Casado et al., 2016). Ultimately, both d-excess increases and decreases in a snowpack can be associated with metamorphic deposition depending on the disequilibrium between snow and vapour. The macro-scale humidity gradient, e.g. the gradient between the snow surface and the near-surface atmosphere, defines the direction of the net humidity flux, but isotopic fractionation is defined through the micro-scale metamorphic processes. These considerations are needed to find a physically sound explanation for the evidently fractionating net sublimation. Clearly, for realistic isotope-enabled climate model simulations, an implementation of a bulk fractionation factor for net surface sublimation is needed.
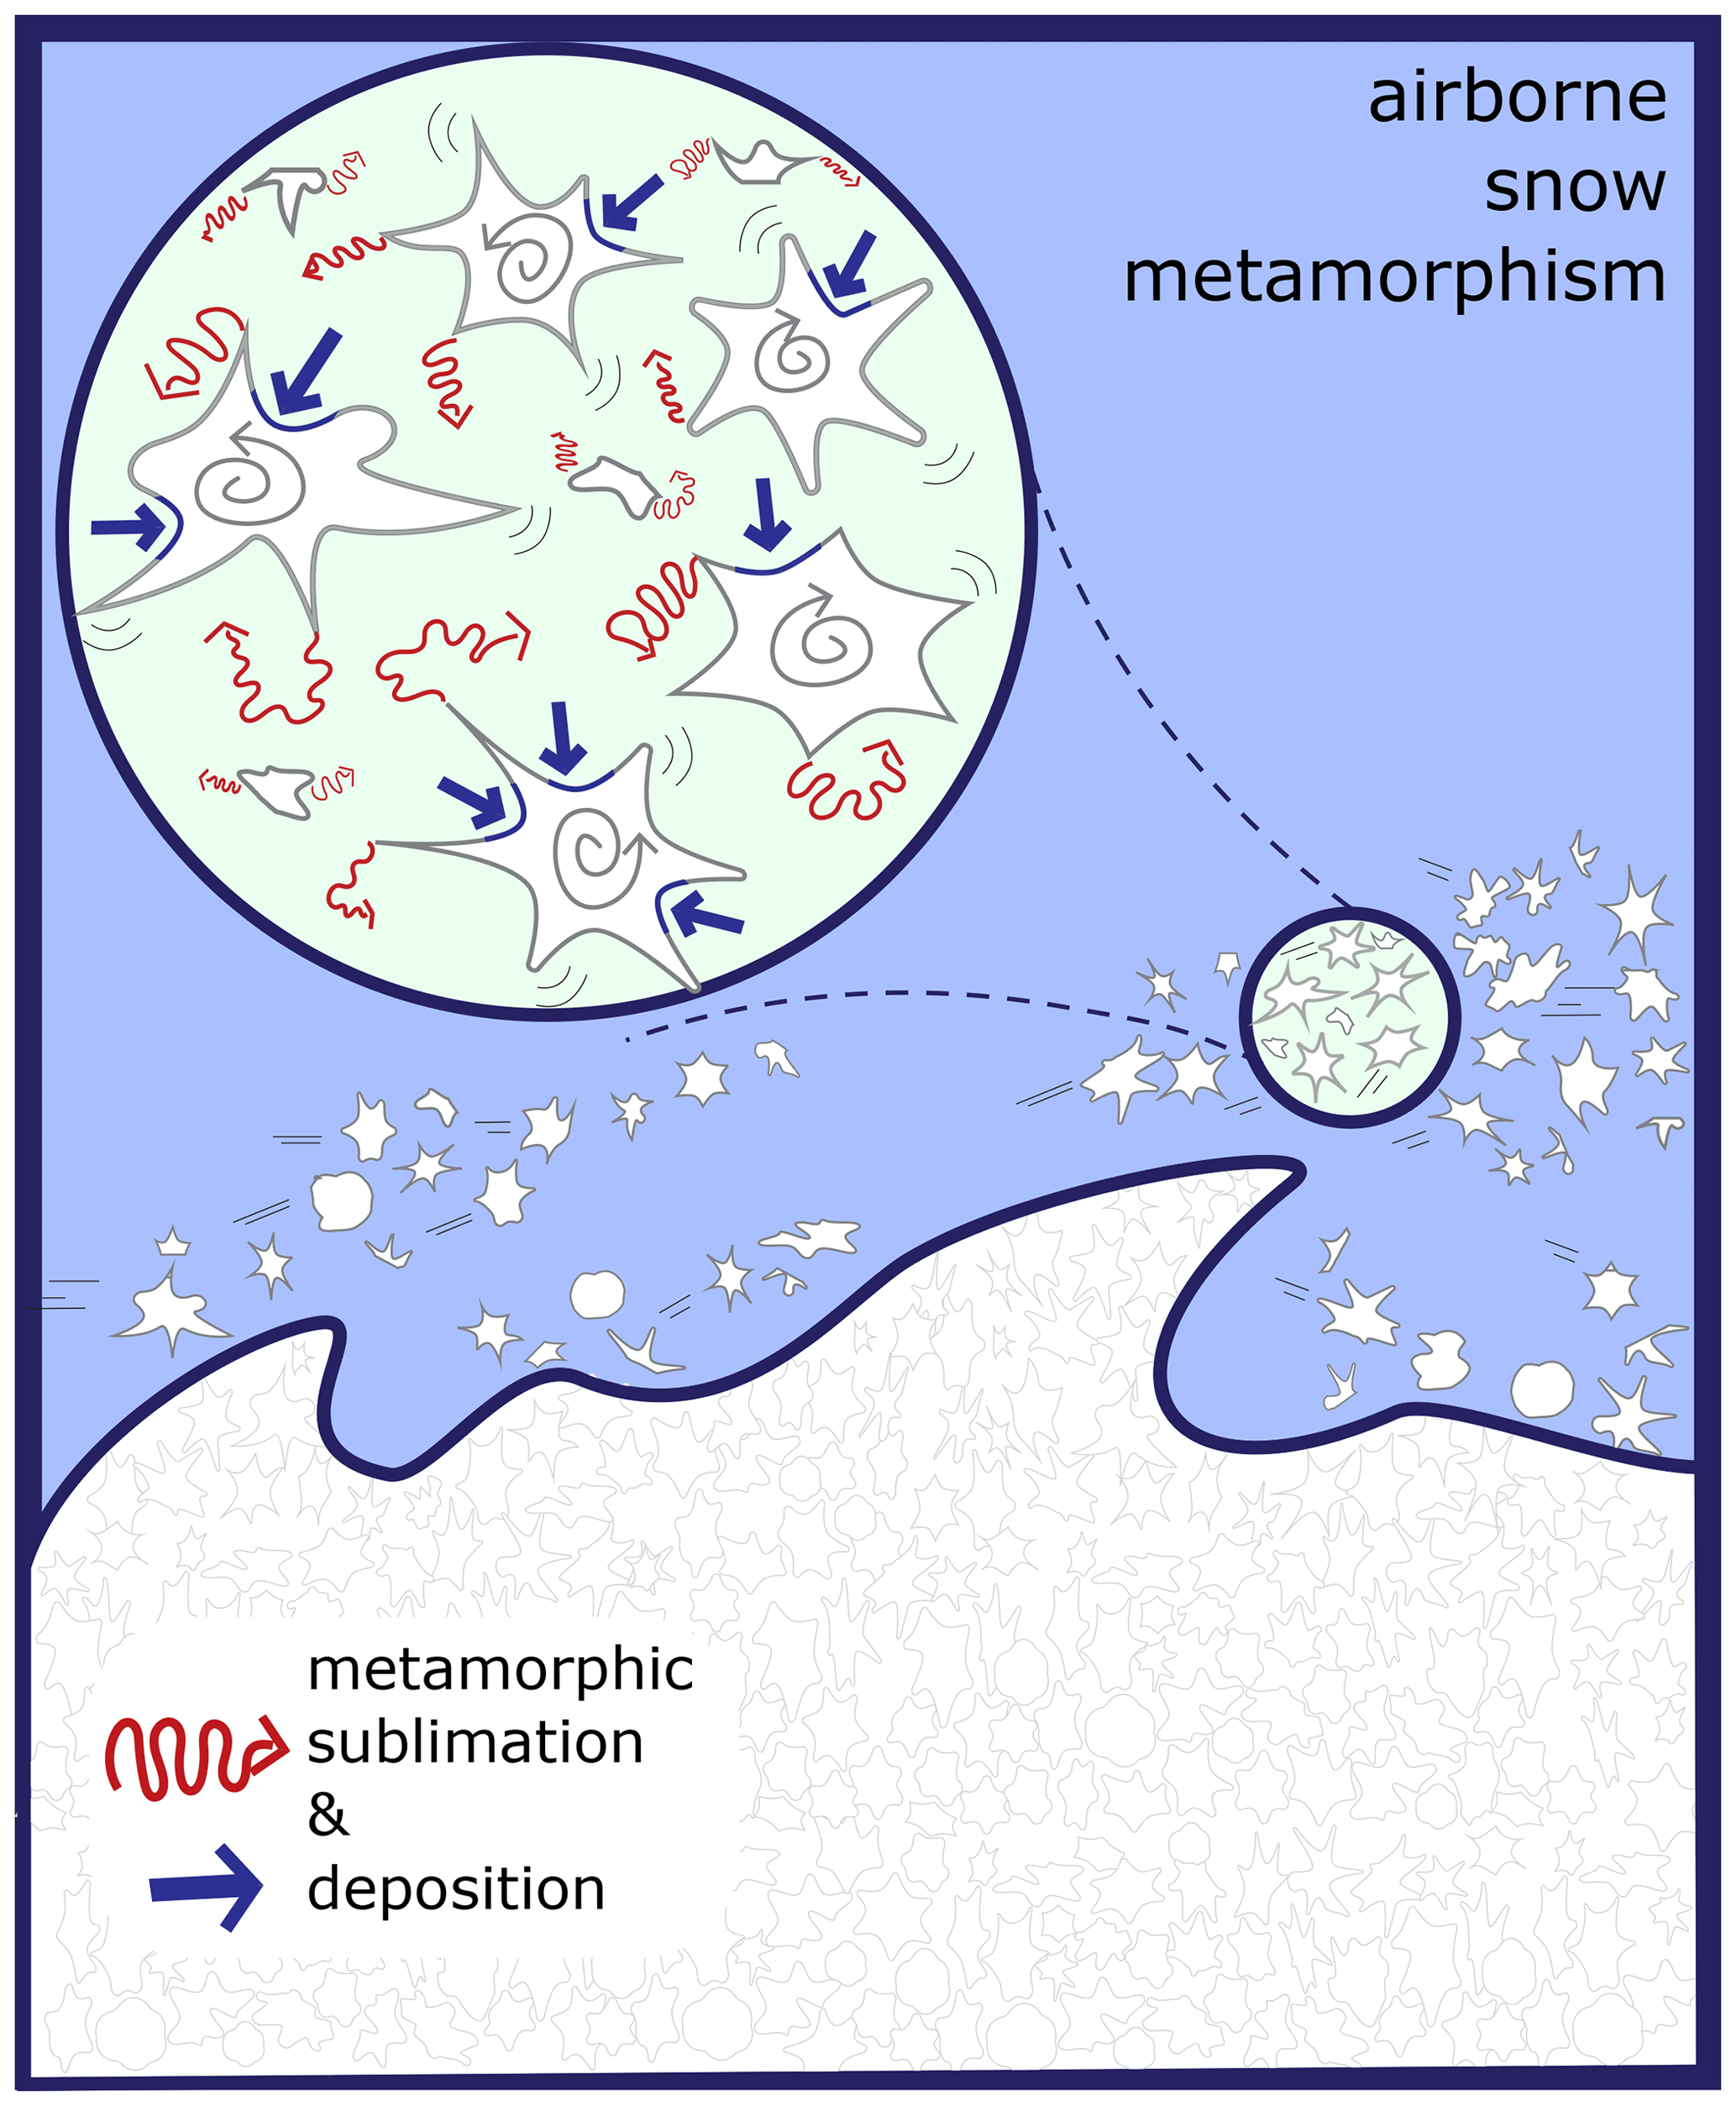
Figure 7Conceptual scheme of airborne snow metamorphism. The scheme shows that micro-scale processes of metamorphic sublimation and metamorphic deposition happen continuously and simultaneously even under net sublimation conditions. We hypothesise that metamorphic vapour deposition on the largest airborne particles due to temperature differences between the surrounding air and particle surface, together with preferential sublimation of convex sub-grain boundaries and preferential deposition in concavities, causes a decrease in SSA and particle growth.
4.3 Field application and experimental limitations
Airborne snow metamorphism as observed in the ring wind tunnel experiments is expected to be dominant in the saltation layer of wind-blown snow. The (close-to-) saturation conditions inside the ring wind tunnel better resemble saltation layer conditions than suspension layer conditions on average, but Sigmund et al. (2021) have shown that downward moisture fluxes can also occur in suspension clouds. Saturated saltation layers (<1 m height) have been frequently observed in coastal Antarctic areas, whereas saturation in blowing-snow clouds of heights >5 m requires very high wind speeds and high particle concentrations (Amory and Kittel, 2019). A deepening of the saturated layer is favoured in stable atmospheric boundary layers with strong near-surface temperature gradients (Mann et al., 2000). Thus, we expect airborne snow metamorphism to reach larger heights during stable boundary layers, which are frequently observed during polar-night conditions. Additionally, the particle–air temperature gradient needed to facilitate vapour deposition and particle growth is predominantly found in the saltation layer, whereas the thermal-equilibrium assumption seems to adequately describe the conditions in the suspension layer (Sharma et al., 2018). Indeed, the particle–air temperature difference simulated in LES close to the cold snow surface is of comparable magnitude (∼ 0.5 K; Sigmund et al., 2024) to the results obtained from the δ18O isotope analyses. The sustained deposition conditions in our experiments might also be favoured by the continued warming of the wind tunnel air, with the particle temperatures lagging. The motor heating is an experimental limitation that hinders the direct analogy to real-world conditions where the energy balance inside a blowing-snow cloud is largely defined by the sublimation process itself, with sublimation leading to a cooling which essentially self-inhibits ongoing sublimation (Amory and Kittel, 2019; Sigmund et al., 2021).
An additional experimental limitation is the interaction of airborne particles with the physical boundaries of the wind tunnel, i.e. the walls and floor, which results in additional collision impacts compared to in nature or in straight wind tunnels. Furthermore, the flow field inside the wind tunnel does not fully develop into a logarithmic boundary layer flow, and centrifugal forces act on the particles in the curved section (Sommer et al., 2017). However, as Walter et al. (2024) outline for the same wind tunnel, the individual particle transport characteristics of the impact angle and velocities, both on the wind tunnel walls and at the snow surface, are comparable to particle transport characteristics in the saltation layer of a fully developed boundary flow. In summary, the sheer setup of the wind tunnel construct prevents an unequivocal comparison to real-world conditions. Yet, the experiments have provided a means to discover a physical process that is not discernible from fixed-location in situ measurements of wind-blown snow without knowledge of the provenance and prior evolution of the observed airborne particles. We point out that the absolute values of available field observations of particle shape and size distributions do not conflict with the findings of this study but might have implicitly entailed airborne snow metamorphism markings. The largest particles that are observed in the experiments contain sphere sizes of 200–300 µm. These sphere sizes are well within in situ observed particle size distributions (Nishimura et al., 2014; Nishimura and Nemoto, 2005) and are significantly smaller than fresh snow particles (Comola et al., 2017; Sato et al., 2008), therefore not contradicting snowflake fragmentation. Interestingly, the most abundant sphere sizes in the last airborne snow samples have diameters of 60–70 µm, which would be considered to be small particle sizes in wind-blown particle size distributions. However, care must be taken when comparing particle size estimates from snow particle counter (Nemoto and Nishumura, 2001) and sphere-fitting routines (Hildebrand and Rüegsegger, 1997). Which metric is superior depends on the application and the question that is being asked. Highly dendritic fresh snowflakes can be large in terms of the particle size but can have very high SSA values, which is better represented through the small sphere size metric.
4.4 Implications of airborne snow metamorphism
4.4.1 Influence on snow surface and snowpack characteristics
The wind tunnel experiments have shown that airborne particles can grow thermodynamically under certain conditions. This process is not accounted for in wind-blown snow models (Melo et al., 2022), nor is it accounted for in calculations of mass removal by snow sublimation during blowing-snow events (Palm et al., 2017). Unfortunately, we have no means to estimate the mass of redeposited vapour in our experiments. Estimates of the impact on mass balance and sublimation flux calculations are beyond the scope of this study. Yet, the changes in airborne PPPs can be set in the context of known changes in snowpack characteristics under wind influence.
Wind has been shown to increase the density of snow (Lehning et al., 2002; Liston et al., 2007; Walter et al., 2024). Crucial for this is the presence of wind-transported snow (Sommer et al., 2017). The surface snow density increase is associated with grain settling and packing, which are more efficient for smaller and rounder particles (Parteli et al., 2014; The Firn Symposium team et al., 2024). The combination of mechanical abrasion and fragmentation (Comola et al., 2017), together with metamorphic rounding, could thus increase the densification rate under wind influence. Likewise, SSA has been shown to decrease under wind influence (Legagneux et al., 2002; Walter et al., 2024). We suggest that this observed wind–SSA relationship is largely due to airborne snow metamorphism. These modifications of SSA affect the radiative characteristics of the resulting snowpack, with SSA decay leading to a reduction in snow albedo (Flanner and Zender, 2006). Consequentially, airborne snow metamorphism could reduce the albedo of the ultimately accumulated snow.
4.4.2 The isotopic signature of wind-blown snow
Snowpack metamorphism has been shown to influence the isotopic composition of snow in polar areas depending on the temperature gradient in the snowpack (Casado et al., 2021; Harris Stuart et al., 2023). Laboratory experiments have further shed light on the interplay between snow and vapour isotopic composition during snow metamorphism (Ebner et al., 2017). The experiments revealed that the isotopic signature of the wind-blown snow event in the wind tunnel was dependent on the combination of initial vapour and snow isotopic composition and the resulting disequilibrium. As we produced snow from tap water, this disequilibrium was, at times, asymmetric between the two isotope species and was more pronounced than generally assumed in nature. As the disequilibrium determines the isotopic evolution, it is not possible to unambiguously predict the expected changes in the snow isotope signal under wind influence without considering the water vapour isotope variability imposed by synoptic-scale atmospheric transport (Aemisegger et al., 2022; Bagheri Dastgerdi et al., 2021). However, the results suggest that a strong d-excess decrease can be linked to airborne metamorphism. This should be kept in mind when observations of snow d-excess values are used as hydrological tracers. Further field studies in windy and dry locations, such as the katabatic wind zones on the Antarctic Ice Sheet, could support this idea.
Another interesting implication of the wind tunnel findings is the interpretation of the snow isotopic composition as a climate signal. Stable water isotope records obtained from ice cores in the polar areas are valuable climate proxy records that allow the reconstruction of paleo-climate and ice sheet dynamics in these remote areas (Jouzel et al., 2007; Stenni et al., 2017; Vinther et al., 2009). The foundation for these paleo-climate interpretations of isotope records is the observation of a linear relationship between annual mean temperatures and the corresponding average precipitation isotopic composition (Dansgaard, 1964). However, in low-accumulation, dry regions of the ice sheets, from which the oldest ice cores are obtained, evidence accumulates for the influence of post-depositional processes over the snow isotopic composition and thus over the climate signal that is stored in the snow (Dietrich et al., 2024; Ollivier et al., 2024; Town et al., 2024; Wahl et al., 2022; Zuhr et al., 2023). This study shows that wind transport is one more post-depositional process that has the potential to add a local climate signal to the snow isotopic composition. The magnitude of observed snow isotopic change in the experiments due to airborne snow metamorphism is within the range of observed daily snow surface isotope variability on clear-sky and calm days (Wahl et al., 2022; Zuhr et al., 2024), yet this evolves within 1–2 h. Thus, modelling studies will be needed to estimate the impact of the combined post-depositional processes on the original precipitation isotopic composition that is also proclaimed to carry information about the moisture source conditions (Aemisegger et al., 2022; Uemura et al., 2012). Our results suggest that locations with frequent strong winds might show strong potential for an overprinting of the original d-excess source region signal and could support the interpretation of studies with measured low d-excess values (Hu et al., 2022).
We used ring wind tunnel experiments to study the governing micro-scale processes of aeolian snow transport that are difficult to observe in the field. Micro-CT measurements of airborne snow samples documented a growing and rounding of suspended particles and a consequential decrease in SSA with transport time. Stable water isotope analysis of airborne snow and water vapour suggests airborne snow metamorphism rather than mechanical mechanisms as a driver for the observed particle evolution. Snow sublimation dominated the metamorphic process during sub-saturation conditions, while vapour deposition dominated in (close-to-) saturated conditions comparable to saltation layer conditions during wind-blown snow events. Supporting previous modelling studies, the wind tunnel results further indicated a particle–air temperature difference, particularly for larger particles that favour the deposition of vapour and thus particle growth, while smaller particles get sublimated entirely. This process of airborne snow metamorphism is difficult to observe in situ with point measurements of wind-blown snow, where the origin and preceding history of the airborne particles are unknown. Thus, it is a hitherto unobserved process, yet our conclusions do not contradict available in situ measurements of airborne particle distributions during blowing-snow events. Instead, our findings refine the process understanding of wind-blown snow, with possible implications for mass and energy balance and moisture budget calculations during blowing- and drifting-snow events.
In this study, the isotopic fingerprint of airborne snow metamorphism was used to pinpoint its existence. The change in the snow isotope signal that we attribute to airborne snow metamorphism was dependent on the vapour–snow disequilibrium and ranged from −0.88 ‰ to +1.47 ‰ in δ18O, −5.7 ‰ to +5.7 ‰ in δD, and −6.1 ‰ to +1.3 ‰ in d-excess. As this isotopic signature of airborne snow metamorphism partly overprints the original snow isotopic signal, it offers the potential to act as tracer for aeolian snow transport. Furthermore, it questions the conservation of moisture source region signals in the snow isotopic composition in windy areas with frequent wind-blown snow events. Future field-based studies will be valuable to support our laboratory-based observations of a link between airborne snow transport, particle physical properties, and stable water isotopes.
The data collected during the wind tunnel experiments and presented in this paper are available at https://doi.org/10.16904/envidat.494 (Wahl et al., 2024).
The supplement related to this article is available online at: https://doi.org/10.5194/tc-18-4493-2024-supplement.
Funding for this work was acquired by ML. ML and FA provided resources. SW conceptualised and designed the experiments with inputs from FA, ML, and BW. The data were curated by SW and BW with help from LB. Data calibration was performed by SW. The data were analysed by SW with feedback from FA, BW, and ML. SW performed the visualisations and writing of the original draft, and all the authors edited the paper.
The contact author has declared that none of the authors has any competing interests.
Publisher's note: Copernicus Publications remains neutral with regard to jurisdictional claims made in the text, published maps, institutional affiliations, or any other geographical representation in this paper. While Copernicus Publications makes every effort to include appropriate place names, the final responsibility lies with the authors.
Sonja Wahl acknowledges funding from the NFR grant SnowDOGS (no. 335140). We thank the ETH atmospheric dynamics group (Heini Wernli) for providing liquid water standards, a pump, and nylon filters. We thank Katrin Meusburger from WSL for providing the SDM and Julia Schmale from EPFL for lending us the MFC. We greatly appreciated the speed and flexibility of the sample analyses performed by the isotope laboratory at both the University of Freiburg, Germany, and the Paul Scherrer Institute, Switzerland. We also thank all the users of the SLF cold-laboratory facilities for sharing the cold-laboratory space, and we especially thank Matthias Jaggi and Benjamin Eggert for the reliable and prompt support and help with the wind tunnel experiments. We thank Armin Sigmund for the helpful discussions on particle–air interactions. We are grateful for three anonymous reviewers and the editor Lei Geng who provided valuable feedback during the review process.
This research has been supported by the Schweizerischer Nationalfonds zur Förderung der Wissenschaftlichen Forschung (grant no. 179130).
This paper was edited by Lei Geng and reviewed by three anonymous referees.
Aemisegger, F., Sturm, P., Graf, P., Sodemann, H., Pfahl, S., Knohl, A., and Wernli, H.: Measuring variations of δ18O and δ2H in atmospheric water vapour using two commercial laser-based spectrometers: an instrument characterisation study, Atmos. Meas. Tech., 5, 1491–1511, https://doi.org/10.5194/amt-5-1491-2012, 2012.
Aemisegger, F., Spiegel, J. K., Pfahl, S., Sodemann, H., Eugster, W., and Wernli, H.: Isotope meteorology of cold front passages: A case study combining observations and modeling, Geophys. Res. Lett., 42, 5652–5660, https://doi.org/10.1002/2015GL063988, 2015.
Aemisegger, F., Trachsel, J., Sadowski, Y., Eichler, A., Lehning, M., Avak, S., and Schneebeli, M.: Fingerprints of Frontal Passages and Post-Depositional Effects in the Stable Water Isotope Signal of Seasonal Alpine Snow, J. Geophys. Res.-Atmos., 127, e2022JD037469, https://doi.org/10.1029/2022JD037469, 2022.
Agosta, C., Amory, C., Kittel, C., Orsi, A., Favier, V., Gallée, H., van den Broeke, M. R., Lenaerts, J. T. M., van Wessem, J. M., van de Berg, W. J., and Fettweis, X.: Estimation of the Antarctic surface mass balance using the regional climate model MAR (1979–2015) and identification of dominant processes, The Cryosphere, 13, 281–296, https://doi.org/10.5194/tc-13-281-2019, 2019.
Ala-aho, P., Welker, J. M., Bailey, H., Højlund Pedersen, S., Kopec, B., Klein, E., Mellat, M., Mustonen, K.-R., Noor, K., and Marttila, H.: Arctic Snow Isotope Hydrology: A Comparative Snow-Water Vapor Study, Atmosphere, 12, 150, https://doi.org/10.3390/atmos12020150, 2021.
Amory, C. and Kittel, C.: Brief communication: Rare ambient saturation during drifting snow occurrences at a coastal location of East Antarctica, The Cryosphere, 13, 3405–3412, https://doi.org/10.5194/tc-13-3405-2019, 2019.
Amory, C., Naaim-Bouvet, F., Gallée, H., and Vignon, E.: Brief communication: Two well-marked cases of aerodynamic adjustment of sastrugi, The Cryosphere, 10, 743–750, https://doi.org/10.5194/tc-10-743-2016, 2016.
Avak, S. E., Trachsel, J. C., Edebeli, J., Brütsch, S., Bartels-Rausch, T., Schneebeli, M., Schwikowski, M., and Eichler, A.: Melt-Induced Fractionation of Major Ions and Trace Elements in an Alpine Snowpack, J. Geophys. Res.-Earth, 124, 1647–1657, https://doi.org/10.1029/2019JF005026, 2019.
Bagheri Dastgerdi, S., Behrens, M., Bonne, J.-L., Hörhold, M., Lohmann, G., Schlosser, E., and Werner, M.: Continuous monitoring of surface water vapour isotopic compositions at Neumayer Station III, East Antarctica, The Cryosphere, 15, 4745–4767, https://doi.org/10.5194/tc-15-4745-2021, 2021.
Bagnold, R. A.: The Physics of Blown Sand and Desert Dunes, Springer Netherlands, Dordrecht, https://doi.org/10.1007/978-94-009-5682-7, 1971.
Bailey, A., Aemisegger, F., Villiger, L., Los, S. A., Reverdin, G., Quiñones Meléndez, E., Acquistapace, C., Baranowski, D. B., Böck, T., Bony, S., Bordsdorff, T., Coffman, D., de Szoeke, S. P., Diekmann, C. J., Dütsch, M., Ertl, B., Galewsky, J., Henze, D., Makuch, P., Noone, D., Quinn, P. K., Rösch, M., Schneider, A., Schneider, M., Speich, S., Stevens, B., and Thompson, E. J.: Isotopic measurements in water vapor, precipitation, and seawater during EUREC4A, Earth Syst. Sci. Data, 15, 465–495, https://doi.org/10.5194/essd-15-465-2023, 2023.
Beria, H., Larsen, J. R., Ceperley, N. C., Michelon, A., Vennemann, T., and Schaefli, B.: Understanding snow hydrological processes through the lens of stable water isotopes, WIREs Water, 5, e1311, https://doi.org/10.1002/wat2.1311, 2018.
Budd, W. F.: The drifting of nonuniform snow particles, National Academies Press, https://doi.org/10.17226/21297, 1966.
Cabanes, A., Legagneux, L., and Dominé, F.: Rate of Evolution of the Specific Surface Area of Surface Snow Layers, Environ. Sci. Technol., 37, 661–666, https://doi.org/10.1021/es025880r, 2003.
Casado, M., Cauquoin, A., Landais, A., Israel, D., Orsi, A., Pangui, E., Landsberg, J., Kerstel, E., Prie, F., and Doussin, J. F.: Experimental determination and theoretical framework of kinetic fractionation at the water vapour-ice interface at low temperature, Geochim. Cosmochim. Ac., 174, 54–69, https://doi.org/10.1016/j.gca.2015.11.009, 2016.
Casado, M., Landais, A., Picard, G., Arnaud, L., Dreossi, G., Stenni, B., and Prié, F.: Water Isotopic Signature of Surface Snow Metamorphism in Antarctica, Geophys. Res. Lett., 48, e2021GL093382, https://doi.org/10.1029/2021gl093382, 2021.
Cauquoin, A. and Werner, M.: High-Resolution Nudged Isotope Modeling With ECHAM6-Wiso: Impacts of Updated Model Physics and ERA5 Reanalysis Data, J. Adv. Model. Earth Sy., 13, e2021MS002532, https://doi.org/10.1029/2021MS002532, 2021.
Clifton, A., Rüedi, J.-D., and Lehning, M.: Snow saltation threshold measurements in a drifting-snow wind tunnel, J. Glaciol., 52, 585–596, https://doi.org/10.3189/172756506781828430, 2006.
Colbeck, S. C.: Thermodynamics of snow metamorphism due to variations in curvature, J. Glaciol., 26, 291–301, https://doi.org/10.3189/S0022143000010832, 1980.
Colbeck, S. C.: An overview of seasonal snow metamorphism, Reviews of Geophysics, 20, 45–61, https://doi.org/10.1029/RG020i001p00045, 1982.
Colbeck, S. C.: Sintering in a dry snow cover, J. Appl. Phys., 84, 4585–4589, https://doi.org/10.1063/1.368684, 1998.
Colbeck, S. C.: Sintering of unequal grains, J. Appl. Phys., 89, 4612–4618, https://doi.org/10.1063/1.1356427, 2001.
Comola, F., Kok, J. F., Gaume, J., Paterna, E., and Lehning, M.: Fragmentation of wind-blown snow crystals, Geophys. Res. Lett., 44, 4195–4203, https://doi.org/10.1002/2017GL073039, 2017.
Craig, H.: Isotopic Variations in Meteoric Waters, Science, 133, 1702–1703, https://doi.org/10.1126/science.133.3465.1702, 1961a.
Craig, H.: Standard for Reporting Concentrations of Deuterium and Oxygen-18 in Natural Waters, Science, 133, 1833–1834, https://doi.org/10.1126/science.133.3467.1833, 1961b.
Dansgaard, W.: Stable isotopes in precipitation, Tellus, 16, 436–468, https://doi.org/10.3402/tellusa.v16i4.8993, 1964.
Dietrich, L. J., Steen-Larsen, H. C., Wahl, S., Faber, A.-K., and Fettweis, X.: On the importance of the humidity flux for the surface mass balance in the accumulation zone of the Greenland Ice Sheet, The Cryosphere, 18, 289–305, https://doi.org/10.5194/tc-18-289-2024, 2024.
Domine, F., Salvatori, R., Legagneux, L., Salzano, R., Fily, M., and Casacchia, R.: Correlation between the specific surface area and the short wave infrared (SWIR) reflectance of snow, Cold Reg. Sci. Technol., 46, 60–68, https://doi.org/10.1016/j.coldregions.2006.06.002, 2006.
Dütsch, M., Pfahl, S., and Sodemann, H.: The Impact of Nonequilibrium and Equilibrium Fractionation on Two Different Deuterium Excess Definitions, J. Geophys. Res.-Atmos., 122, 12732–12746, https://doi.org/10.1002/2017JD027085, 2017.
Dütsch, M., Steig, E. J., Blossey, P. N., and Pauling, A. G.: Response of Water Isotopes in Precipitation to a Collapse of the West Antarctic Ice Sheet in High-Resolution Simulations with the Weather Research and Forecasting Model, J. Climate, 36, 5417–5430, https://doi.org/10.1175/JCLI-D-22-0647.1, 2023.
Ebner, P. P., Steen-Larsen, H. C., Stenni, B., Schneebeli, M., and Steinfeld, A.: Experimental observation of transient δ18O interaction between snow and advective airflow under various temperature gradient conditions, The Cryosphere, 11, 1733–1743, https://doi.org/10.5194/tc-11-1733-2017, 2017.
Fierz, C., Armstrong, R. L., Durand, Y., Etchevers, P., Greene, E., McClung, D. M., Nishimura, K., Satyawali, P. K., and Sokratov, S. A.: The International Classification for Seasonal Snow on the Ground, in: IHP-VII Technical Documents in Hydrology N° 83, UNESCO-IHP, Paris, https://unesdoc.unesco.org/ark:/48223/pf0000186462 (last access: 19 September 2024), 2009.
Filhol, S. and Sturm, M.: Snow bedforms: A review, new data, and a formation model, J. Geophys. Res.-Earth, 120, 1645–1669, https://doi.org/10.1002/2015JF003529, 2015.
Flanner, M. G. and Zender, C. S.: Linking snowpack microphysics and albedo evolution, J. Geophys. Res., 111, 2005JD006834, https://doi.org/10.1029/2005JD006834, 2006.
Flin, F., Brzoska, J.-B., Lesaffre, B., Coléou, C., and Pieritz, R. A.: Three-dimensional geometric measurements of snow microstructural evolution under isothermal conditions, Ann. Glaciol., 38, 39–44, https://doi.org/10.3189/172756404781814942, 2004.
Friedman, I., Benson, C., and Gleason, J.: Isotopic changes during snow metaporphism, in: Stable Isotope Geochemistry: A Tribute to Samuel Epstein, vol. 3, edited by: Tayoir, H. P., O'Neill, J. R., and Kaplan, I. R., Geochemical Society, 211–221, https://www.geochemsoc.org/files/8114/1269/7654/SP-3_211-222_Friedman.pdf (last access: 19 September 2024), 1991.
Galewsky, J., Steen-Larsen, H. C., Field, R. D., Worden, J., Risi, C., and Schneider, M.: Stable isotopes in atmospheric water vapor and applications to the hydrologic cycle, Rev. Geophys., 54, 809–865, https://doi.org/10.1002/2015RG000512, 2016.
Gerber, F., Sharma, V., and Lehning, M.: CRYOWRF–Model Evaluation and the Effect of Blowing Snow on the Antarctic Surface Mass Balance, J. Geophys. Res.-Atmos., 128, e2022JD037744, https://doi.org/10.1029/2022JD037744, 2023.
Goff, J. A. and Gratch, S.: Low-pressure properties of water from −160 to 212 °F, in Transactions of the American Society of Heating and Ventilating Engineers, pp. 95–122, presented at the 52nd annual meeting of the American Society of Heating and Ventilating Engineers, New York, 1946.
Gromke, C., Horender, S., Walter, B., and Lehning, M.: Snow particle characteristics in the saltation layer, J. Glaciol., 60, 431–439, https://doi.org/10.3189/2014JoG13J079, 2014.
Groot Zwaaftink, C. D., Löwe, H., Mott, R., Bavay, M., and Lehning, M.: Drifting snow sublimation: A high-resolution 3-D model with temperature and moisture feedbacks, J. Geophys. Res., 116, D16107, https://doi.org/10.1029/2011JD015754, 2011.
Hagenmuller, P., Chambon, G., Lesaffre, B., Flin, F., and Naaim, M.: Energy-based binary segmentation of snow microtomographic images, J. Glaciol., 59, 859–873, https://doi.org/10.3189/2013JoG13J035, 2013.
Hagenmuller, P., Matzl, M., Chambon, G., and Schneebeli, M.: Sensitivity of snow density and specific surface area measured by microtomography to different image processing algorithms, The Cryosphere, 10, 1039–1054, https://doi.org/10.5194/tc-10-1039-2016, 2016.
Harris Stuart, R., Faber, A.-K., Wahl, S., Hörhold, M., Kipfstuhl, S., Vasskog, K., Behrens, M., Zuhr, A. M., and Steen-Larsen, H. C.: Exploring the role of snow metamorphism on the isotopic composition of the surface snow at EastGRIP, The Cryosphere, 17, 1185–1204, https://doi.org/10.5194/tc-17-1185-2023, 2023.
He, S. and Ohara, N.: A New Formula for Estimating the Threshold Wind Speed for Snow Movement, J. Adv. Model. Earth Sy., 9, 2514–2525, https://doi.org/10.1002/2017MS000982, 2017.
Heggli, M., Köchle, B., Matzl, M., Pinzer, B. R., Riche, F., Steiner, S., Steinfeld, D., and Schneebeli, M.: Measuring snow in 3-D using X-ray tomography: assessment of visualization techniques, Ann. Glaciol., 52, 231–236, https://doi.org/10.3189/172756411797252202, 2011.
Hildebrand, T. and Rüegsegger, P.: A new method for the model-independent assessment of thickness in three-dimensional images, Journal of Microscopy, 185, 67–75, https://doi.org/10.1046/j.1365-2818.1997.1340694.x, 1997.
Hori, M., Aoki, T., Tanikawa, T., Hachikubo, A., Sugiura, K., Kuchiki, K., and Niwano, M.: Modeling angular-dependent spectral emissivity of snow and ice in the thermal infrared atmospheric window, Appl. Optics, 52, 7243–7255, https://doi.org/10.1364/AO.52.007243, 2013.
Hu, J., Yan, Y., Yeung, L. Y., and Dee, S. G.: Sublimation origin of negative deuterium excess observed in snow and ice samples from McMurdo Dry Valleys and Allan Hills Blue Ice Areas, East Antarctica, J. Geophys. Res.-Atmos., 127, e2021JD035950, https://doi.org/10.1029/2021jd035950, 2022.
Hughes, A. G., Wahl, S., Jones, T. R., Zuhr, A., Hörhold, M., White, J. W. C., and Steen-Larsen, H. C.: The role of sublimation as a driver of climate signals in the water isotope content of surface snow: laboratory and field experimental results, The Cryosphere, 15, 4949–4974, https://doi.org/10.5194/tc-15-4949-2021, 2021.
Jafari, M., Gouttevin, I., Couttet, M., Wever, N., Michel, A., Sharma, V., Rossmann, L., Maass, N., Nicolaus, M., and Lehning, M.: The Impact of Diffusive Water Vapor Transport on Snow Profiles in Deep and Shallow Snow Covers and on Sea Ice, Front. Earth Sci., 8, 249, https://doi.org/10.3389/feart.2020.00249, 2020.
Jouzel, J. and Merlivat, L.: Deuterium and oxygen 18 in precipitation: Modeling of the isotopic effects during snow formation, J. Geophys. Res., 89, 11749–11757, https://doi.org/10.1029/JD089iD07p11749, 1984.
Jouzel, J., Masson-Delmotte, V., Cattani, O., Dreyfus, G., Falourd, S., Hoffmann, G., Minster, B., Nouet, J., Barnola, J. M., Chappellaz, J., Fischer, H., Gallet, J. C., Johnsen, S., Leuenberger, M., Loulergue, L., Luethi, D., Oerter, H., Parrenin, F., Raisbeck, G., Raynaud, D., Schilt, A., Schwander, J., Selmo, E., Souchez, R., Spahni, R., Stauffer, B., Steffensen, J. P., Stenni, B., Stocker, T. F., Tison, J. L., Werner, M., and Wolff, E. W.: Orbital and Millennial Antarctic Climate Variability over the Past 800,000 Years, Science, 317, 793–796, https://doi.org/10.1126/science.1141038, 2007.
Kaempfer, T. U. and Schneebeli, M.: Observation of isothermal metamorphism of new snow and interpretation as a sintering process, J. Geophys. Res., 112, 2007JD009047, https://doi.org/10.1029/2007JD009047, 2007.
Legagneux, L. and Domine, F.: A mean field model of the decrease of the specific surface area of dry snow during isothermal metamorphism, J. Geophys. Res., 110, 2004JF000181, https://doi.org/10.1029/2004JF000181, 2005.
Legagneux, L., Cabanes, A., and Dominé, F.: Measurement of the specific surface area of 176 snow samples using methane adsorption at 77 K, J. Geophys. Res., 107, 4335, https://doi.org/10.1029/2001JD001016, 2002.
Lehning, M., Bartelt, P., Brown, B., Fierz, C., and Satyawali, P.: A physical SNOWPACK model for the Swiss avalanche warning Part II. Snow microstructure, Cold Reg. Sci. Technol., 35, 147–167, 2002.
Lenaerts, J. T. M., Van Den Broeke, M. R., Déry, S. J., Van Meijgaard, E., Van De Berg, W. J., Palm, S. P., and Sanz Rodrigo, J.: Modeling drifting snow in Antarctica with a regional climate model: 1. Methods and model evaluation, J. Geophys. Res., 117, 2011JD016145, https://doi.org/10.1029/2011JD016145, 2012.
Liston, G. E., Haehnel, R. B., Sturm, M., Hiemstra, C. A., Berezovskaya, S., and Tabler, R. D.: Simulating complex snow distributions in windy environments using SnowTran-3D, J. Glaciol., 53, 241–256, https://doi.org/10.3189/172756507782202865, 2007.
Lo, K. K. and Passarelli, R. E.: The Growth of Snow in Winter Storms:. An Airborne Observational Study, J. Atmos. Sci., 39, 697–706, https://doi.org/10.1175/1520-0469(1982)039<0697:TGOSIW>2.0.CO;2, 1982.
Löwe, H., Spiegel, J. K., and Schneebeli, M.: Interfacial and structural relaxations of snow under isothermal conditions, J. Glaciol., 57, 499–510, https://doi.org/10.3189/002214311796905569, 2011.
Majoube, M.: Fractionation Factor of 18O between Water Vapour and Ice, Nature, 226, 1242, https://doi.org/10.1038/2261242a0, 1970.
Mann, G. W., Anderson, P. S., and Mobbs, S. D.: Profile measurements of blowing snow at Halley, Antarctica, J. Geophys. Res., 105, 24491–24508, https://doi.org/10.1029/2000JD900247, 2000.
Marbouty, D.: An Experimental Study of Temperature-Gradient Metamorphism, J. Glaciol., 26, 303–312, https://doi.org/10.3189/S0022143000010844, 1980.
Melo, D. B., Sharma, V., Comola, F., Sigmund, A., and Lehning, M.: Modeling Snow Saltation: The Effect of Grain Size and Interparticle Cohesion, J. Geophys. Res.-Atmos., 127, e2021JD035260, https://doi.org/10.1029/2021JD035260, 2022.
Merlivat, L.: Molecular diffusivities of H216O, HD16O, and H218O in gases, J. Chem. Phys., 69, 2864–2871, https://doi.org/10.1063/1.436884, 1978.
Merlivat, L. and Nief, G.: Fractionnement isotopique lors des changements d'etat solide-vapeur et liquide-vapeur de l'eau a des temperatures inferieures a 0 °C, Tellus, 122, https://doi.org/10.3402/tellusa.v19i1.9756 1967.
Mitchell, D. L.: Evolution of Snow-Size Spectra in Cyclonic Storms. Part I: Snow Growth by Vapor Deposition and Aggregation, J. Atmos. Sci., 45, 3431–3451, https://doi.org/10.1175/1520-0469(1988)045<3431:EOSSSI>2.0.CO;2, 1988.
Mook, W. G.: Environmental isotopes in the hydrological cycle: principles and applications, International atomic energy agency and united Nations educational, scientific and cultural organization, Paris/Vienna, https://unesdoc.unesco.org/ark:/48223/pf0000121907?posInSet=6&queryId=b3250656-149a-4d44-86f4-78e62dc3cfe9 (last access: 19 September 2024), 2000.
Moore, M., Blossey, P. N., Muhlbauer, A., and Kuang, Z.: Microphysical controls on the isotopic composition of wintertime orographic precipitation, J. Geophys. Res.-Atmos., 121, 7235–7253, https://doi.org/10.1002/2015JD023763, 2016.
Murphy, D. M. and Koop, T.: Review of the vapour pressures of ice and supercooled water for atmospheric applications, Q. J. Roy. Meteor. Soc., 131, 1539–1565, https://doi.org/10.1256/qj.04.94, 2005.
Nemoto, M. and Nishumura, K.: Direct Measurement Of Shear Stress During Snow Saltation, Bound.-Lay. Meteorol., 100, 149–170, https://doi.org/10.1023/A:1019267015986, 2001.
Nemoto, M. and Nishimura, K.: Numerical simulation of snow saltation and suspension in a turbulent boundary layer, J. Geophys. Res., 109, 2004JD004657, https://doi.org/10.1029/2004JD004657, 2004.
Nishimura, K. and Nemoto, M.: Blowing snow at Mizuho station, Antarctica, Phil. Trans. R. Soc. A., 363, 1647–1662, https://doi.org/10.1098/rsta.2005.1599, 2005.
Nishimura, K., Yokoyama, C., Ito, Y., Nemoto, M., Naaim-Bouvet, F., Bellot, H., and Fujita, K.: Snow particle speeds in drifting snow: Snow particle speeds in drifting snow, J. Geophys. Res.-Atmos., 119, 9901–9913, https://doi.org/10.1002/2014JD021686, 2014.
Ollivier, I., Steen-Larsen, H. C., Stenni, B., Arnaud, L., Casado, M., Cauquoin, A., Dreossi, G., Genthon, C., Minster, B., Picard, G., Werner, M., and Landais, A.: Surface processes and drivers of the snow water stable isotopic composition at Dome C, East Antarctica – a multi-datasets and modelling analysis, EGUsphere [preprint], https://doi.org/10.5194/egusphere-2024-685, 2024.
Palm, S. P., Kayetha, V., Yang, Y., and Pauly, R.: Blowing snow sublimation and transport over Antarctica from 11 years of CALIPSO observations, The Cryosphere, 11, 2555–2569, https://doi.org/10.5194/tc-11-2555-2017, 2017.
Parteli, E. J. R., Schmidt, J., Blümel, C., Wirth, K.-E., Peukert, W., and Pöschel, T.: Attractive particle interaction forces and packing density of fine glass powders, Sci. Rep., 4, 6227, https://doi.org/10.1038/srep06227, 2014.
Pfahl, S., Wernli, H., and Yoshimura, K.: The isotopic composition of precipitation from a winter storm – a case study with the limited-area model COSMOiso, Atmos. Chem. Phys., 12, 1629–1648, https://doi.org/10.5194/acp-12-1629-2012, 2012.
Pinzer, B. and Schneebeli, M.: Breeding snow: an instrumented sample holder for simultaneous tomographic and thermal studies, Meas. Sci. Technol., 20, 095705, https://doi.org/10.1088/0957-0233/20/9/095705, 2009.
Pinzer, B. R., Schneebeli, M., and Kaempfer, T. U.: Vapor flux and recrystallization during dry snow metamorphism under a steady temperature gradient as observed by time-lapse micro-tomography, The Cryosphere, 6, 1141–1155, https://doi.org/10.5194/tc-6-1141-2012, 2012.
Proksch, M., Löwe, H., and Schneebeli, M.: Density, specific surface area, and correlation length of snow measured by high-resolution penetrometry, J. Geophys. Res.-Earth, 120, 346–362, https://doi.org/10.1002/2014JF003266, 2015.
Pruppacher, H. R. and Klett, J. D.: Microphysics of Clouds and Precipitation, 18, Atmospheric and Oceanographic Sciences Library, Springer Netherlands, Dordrecht, https://doi.org/10.1007/978-0-306-48100-0., 1997.
Sato, T., Kosugi, K., Mochizuki, S., and Nemoto, M.: Wind speed dependences of fracture and accumulation of snowflakes on snow surface, Cold Reg. Sci. Technol., 51, 229–239, https://doi.org/10.1016/j.coldregions.2007.05.004, 2008.
Schleef, S., Jaggi, M., Löwe, H., and Schneebeli, M.: An improved machine to produce nature-identical snow in the laboratory, J. Glaciol., 60, 94–102, https://doi.org/10.3189/2014JoG13J118, 2014a.
Schleef, S., Löwe, H., and Schneebeli, M.: Influence of stress, temperature and crystal morphology on isothermal densification and specific surface area decrease of new snow, The Cryosphere, 8, 1825–1838, https://doi.org/10.5194/tc-8-1825-2014, 2014b.
Schmidt, R. A.: Vertical profiles of wind speed, snow concentration, and humidity in blowing snow, Bound.-Lay. Meteorol., 23, 223–246, https://doi.org/10.1007/BF00123299, 1982.
Sharma, V., Comola, F., and Lehning, M.: On the suitability of the Thorpe–Mason model for calculating sublimation of saltating snow, The Cryosphere, 12, 3499–3509, https://doi.org/10.5194/tc-12-3499-2018, 2018.
Sigmund, A., Dujardin, J., Comola, F., Sharma, V., Huwald, H., Melo, D. B., Hirasawa, N., Nishimura, K., and Lehning, M.: Evidence of Strong Flux Underestimation by Bulk Parametrizations During Drifting and Blowing Snow, Bound.-Lay. Meteorol., 182, 119–146, https://doi.org/10.1007/s10546-021-00653-x, 2021.
Sigmund, A., Melo, D. B., Dujardin, J., Nishimura, K., and Lehning, M.: Parameterizing Snow Sublimation in Conditions of Drifting and Blowing Snow, ESS Open Archive [preprint], https://doi.org/10.22541/essoar.172304053.32270258/v1, 2024.
Sokratov, S. A. and Golubev, V. N.: Snow isotopic content change by sublimation, J. Glaciol., 55, 823–828, https://doi.org/10.3189/002214309790152456, 2009.
Sommer, C. G., Lehning, M., and Fierz, C.: Wind tunnel experiments: saltation is necessary for wind-packing, J. Glaciol., 63, 950–958, https://doi.org/10.1017/jog.2017.53, 2017.
Sommer, C. G., Wever, N., Fierz, C., and Lehning, M.: Investigation of a wind-packing event in Queen Maud Land, Antarctica, The Cryosphere, 12, 2923–2939, https://doi.org/10.5194/tc-12-2923-2018, 2018a.
Sommer, C. G., Lehning, M., and Fierz, C.: Wind Tunnel Experiments: Influence of Erosion and Deposition on Wind-Packing of New Snow, Front. Earth Sci., 6, 4, https://doi.org/10.3389/feart.2018.00004, 2018b.
Stenni, B., Curran, M. A. J., Abram, N. J., Orsi, A., Goursaud, S., Masson-Delmotte, V., Neukom, R., Goosse, H., Divine, D., van Ommen, T., Steig, E. J., Dixon, D. A., Thomas, E. R., Bertler, N. A. N., Isaksson, E., Ekaykin, A., Werner, M., and Frezzotti, M.: Antarctic climate variability on regional and continental scales over the last 2000 years, Clim. Past, 13, 1609–1634, https://doi.org/10.5194/cp-13-1609-2017, 2017.
Stichler, W., Schotterer, U., Fröhlich, K., Ginot, P., Kull, C., Gäggeler, H., and Pouyaud, B.: Influence of sublimation on stable isotope records recovered from high-altitude glaciers in the tropical Andes, J. Geophys. Res.-Atmos., 106, 22613–22620, https://doi.org/10.1029/2001JD900179, 2001.
Taillandier, A. S., Domine, F., Simpson, W. R., Sturm, M., and Douglas, T. A.: Rate of decrease of the specific surface area of dry snow: Isothermal and temperature gradient conditions, J. Geophys. Res.-Earth, 112, F03003, https://doi.org/10.1029/2006JF000514, 2007.
The Firn Symposium team, Amory, C., Buizert, C., Buzzard, S., Case, E., Clerx, N., Culberg, R., Datta, R. T., Dey, R., Drews, R., Dunmire, D., Eayrs, C., Hansen, N., Humbert, A., Kaitheri, A., Keegan, K., Kuipers Munneke, P., Lenaerts, J. T. M., Lhermitte, S., Mair, D., McDowell, I., Mejia, J., Meyer, C. R., Morris, E., Moser, D., Oraschewski, F. M., Pearce, E., De Roda Husman, S., Schlegel, N.-J., Schultz, T., Simonsen, S. B., Stevens, C. M., Thomas, E. R., Thompson-Munson, M., Wever, N., and Wouters, B.: Firn on ice sheets, Nat. Rev. Earth Environ., 5, 79–99, https://doi.org/10.1038/s43017-023-00507-9, 2024.
Thorpe, A. D. and Mason, B. J.: The evaporation of ice spheres and ice crystals, Br. J. Appl. Phys., 17, 541–548, https://doi.org/10.1088/0508-3443/17/4/316, 1966.
Town, M. S., Steen-Larsen, H. C., Wahl, S., Faber, A.-K., Behrens, M., Jones, T. R., and Sveinbjornsdottir, A.: Post-depositional modification on seasonal-to-interannual timescales alters the deuterium-excess signals in summer snow layers in Greenland, The Cryosphere, 18, 3653–3683, https://doi.org/10.5194/tc-18-3653-2024, 2024.
Uemura, R., Masson-Delmotte, V., Jouzel, J., Landais, A., Motoyama, H., and Stenni, B.: Ranges of moisture-source temperature estimated from Antarctic ice cores stable isotope records over glacial–interglacial cycles, Clim. Past, 8, 1109–1125, https://doi.org/10.5194/cp-8-1109-2012, 2012.
Vinther, B. M., Buchardt, S. L., Clausen, H. B., Dahl-Jensen, D., Johnsen, S. J., Fisher, D. A., Koerner, R. M., Raynaud, D., Lipenkov, V., Andersen, K. K., Blunier, T., Rasmussen, S. O., Steffensen, J. P., and Svensson, A. M.: Holocene thinning of the Greenland ice sheet, Nature, 461, 385–388, https://doi.org/10.1038/nature08355, 2009.
Vionnet, V., Brun, E., Morin, S., Boone, A., Faroux, S., Le Moigne, P., Martin, E., and Willemet, J.-M.: The detailed snowpack scheme Crocus and its implementation in SURFEX v7.2, Geosci. Model Dev., 5, 773–791, https://doi.org/10.5194/gmd-5-773-2012, 2012.
Wagner, D. N., Shupe, M. D., Cox, C., Persson, O. G., Uttal, T., Frey, M. M., Kirchgaessner, A., Schneebeli, M., Jaggi, M., Macfarlane, A. R., Itkin, P., Arndt, S., Hendricks, S., Krampe, D., Nicolaus, M., Ricker, R., Regnery, J., Kolabutin, N., Shimanshuck, E., Oggier, M., Raphael, I., Stroeve, J., and Lehning, M.: Snowfall and snow accumulation during the MOSAiC winter and spring seasons, The Cryosphere, 16, 2373–2402, https://doi.org/10.5194/tc-16-2373-2022, 2022.
Wahl, S., Steen-Larsen, H. C., Reuder, J., and Hörhold, M.: Quantifying the Stable Water Isotopologue Exchange Between the Snow Surface and Lower Atmosphere by Direct Flux Measurements, J. Geophys. Res.-Atmos., 126, e2020JD034400, https://doi.org/10.1029/2020JD034400, 2021.
Wahl, S., Steen-Larsen, H. C., Hughes, A. G., Dietrich, L. J., Zuhr, A., Behrens, M., Faber, A. -K., and Hörhold, M.: Atmosphere-Snow Exchange Explains Surface Snow Isotope Variability, Geophys. Res. Lett., 49, e2022GL099529, https://doi.org/10.1029/2022GL099529, 2022.
Wahl, S., Walter, B., Bianch, L., Aemisegger, F., and Lehning, M.: Ring wind tunnel experiments – airborne snow metamorphism and stable water isotopes, EnviDat [data set], https://doi.org/10.16904/envidat.494, 2024.
Wakai, F., Yoshida, M., Shinoda, Y., and Akatsu, T.: Coarsening and grain growth in sintering of two particles of different sizes, Acta Mater., 53, 1361–1371, https://doi.org/10.1016/j.actamat.2004.11.029, 2005.
Walter, B., Huwald, H., Gehring, J., Bühler, Y., and Lehning, M.: Radar measurements of blowing snow off a mountain ridge, The Cryosphere, 14, 1779–1794, https://doi.org/10.5194/tc-14-1779-2020, 2020.
Walter, B., Weigel, H., Wahl, S., and Löwe, H.: Wind tunnel experiments to quantify the effect of aeolian snow transport on the surface snow microstructure, The Cryosphere, 18, 3633–3652, https://doi.org/10.5194/tc-18-3633-2024, 2024.
Weng, Y., Touzeau, A., and Sodemann, H.: Correcting the impact of the isotope composition on the mixing ratio dependency of water vapour isotope measurements with cavity ring-down spectrometers, Atmos. Meas. Tech., 13, 3167–3190, https://doi.org/10.5194/amt-13-3167-2020, 2020.
Wever, N., Lehning, M., Clifton, A., Rüedi, J.-D., Nishimura, K., Nemoto, M., Yamaguchi, S., and Sato, A.: Verification of moisture budgets during drifting snow conditions in a cold wind tunnel, Water Resour. Res., 45, W07423, https://doi.org/10.1029/2008WR007522, 2009.
Yamaguchi, S., Ishizaka, M., Motoyoshi, H., Nakai, S., Vionnet, V., Aoki, T., Yamashita, K., Hashimoto, A., and Hachikubo, A.: Measurement of specific surface area of fresh solid precipitation particles in heavy snowfall regions of Japan, The Cryosphere, 13, 2713–2732, https://doi.org/10.5194/tc-13-2713-2019, 2019.
Yang, Y., Kiv, D., Bhatta, S., Ganeshan, M., Lu, X., and Palm, S.: Diagnosis of Antarctic Blowing Snow Properties Using MERRA-2 Reanalysis with a Machine Learning Model, J. Appl. Meteorol. Clim., 62, 1055–1068, https://doi.org/10.1175/JAMC-D-23-0004.1, 2023.
Yu, H., Li, G., Walter, B., Lehning, M., Zhang, J., and Huang, N.: Wind conditions for snow cornice formation in a wind tunnel, The Cryosphere, 17, 639–651, https://doi.org/10.5194/tc-17-639-2023, 2023.
Zuhr, A. M., Wahl, S., Steen-Larsen, H. C., Hörhold, M., Meyer, H., and Laepple, T.: A Snapshot on the Buildup of the Stable Water Isotopic Signal in the Upper Snowpack at EastGRIP on the Greenland Ice Sheet, J. Geophys. Res.-Earth, 128, e2022JF006767, https://doi.org/10.1029/2022JF006767, 2023.
Zuhr, A. M., Wahl, S., Steen-Larsen, H. C., Hörhold, M., Meyer, H., Gkinis, V., and Laepple, T.: Spatial and temporal stable water isotope data from the upper snowpack at the EastGRIP camp site, NE Greenland, sampled in summer 2018, Earth Syst. Sci. Data, 16, 1861–1874, https://doi.org/10.5194/essd-16-1861-2024, 2024.