the Creative Commons Attribution 4.0 License.
the Creative Commons Attribution 4.0 License.
 | 28 Aug 2024
Retrieval of snow and soil properties for forward radiative transfer modeling of airborne Ku-band SAR to estimate snow water equivalent: the Trail Valley Creek 2018/19 snow experiment
Benoit Montpetit
Joshua King
Julien Meloche
Chris Derksen
Paul Siqueira
J. Max Adam
Peter Toose
Mike Brady
Anna Wendleder
Vincent Vionnet
Nicolas R. Leroux
Accurate snow information at high spatial and temporal resolution is needed to support climate services, water resource management, and environmental prediction services. However, snow remains the only element of the water cycle without a dedicated Earth observation mission. The snow scientific community has shown that Ku-band radar measurements provide quality snow information with its sensitivity to snow water equivalent and the wet/dry state of snow. With recent developments of tools like the snow micropenetrometer (SMP) to retrieve snow microstructure data in the field and radiative transfer models like the Snow Microwave Radiative Transfer (SMRT) model, it becomes possible to properly characterize the snow and how it translates into radar backscatter measurements. An experiment at Trail Valley Creek (TVC), Northwest Territories, Canada, was conducted during the winter of 2018/19 in order to characterize the impacts of varying snow geophysical properties on Ku-band radar backscatter at a 100 m scale. Airborne Ku-band data were acquired using the University of Massachusetts radar instrument. This study shows that it is possible to calibrate SMP data to retrieve statistical information on snow geophysical properties and properly characterize a representative snowpack at the experiment scale. The tundra snowpack measured during the campaign can be characterize by two layers corresponding to a rounded snow grain layer and a depth hoar layer. Using RADARSAT-2 and TerraSAR-X data, soil background roughness properties were retrieved (), and it was shown that a single value could be used for the entire domain. Microwave snow grain size polydispersity values of 0.74 and 1.11 for rounded and depth hoar snow grains, respectively, were retrieved. Using the geometrical optics surface backscatter model, the retrieved effective soil permittivity increased from C-band (εsoil=2.47) to X-band (εsoil=2.61) and to Ku-band (εsoil=2.77) for the TVC domain. Using the SMRT and the retrieved soil and snow parameterizations, an RMSE of 2.6 dB was obtained between the measured and simulated Ku-band backscatter values when using a global set of parameters for all measured sites. When using a distributed set of soil and snow parameters, the RMSE drops to 0.9 dB. This study thus shows that it is possible to link Ku-band radar backscatter measurements to snow conditions on the ground using a priori knowledge of the snow conditions to retrieve snow water equivalent (SWE) at the 100 m scale.
- Article
(4243 KB) - Full-text XML
- BibTeX
- EndNote


Snow is an important freshwater resource and remains the only element in the water cycle without a dedicated spaceborne mission (Derksen et al., 2019). While surface snow depth observation networks support the generation and validation at coarse resolution (>25 km), snow water equivalent (SWE) products from passive microwave remote sensing (e.g. Luojus et al., 2021) and higher-spatial-resolution (< 500 m) sources of spatially continuous snow information are needed to meet the needs of climate services, water resource management, and environmental prediction (Garnaud et al., 2019, 2021; Kim et al., 2021; Cho et al., 2023).
Tower and airborne measurements (Lemmetyinen et al., 2018; Zhu et al., 2021) supported by theoretical modeling (e.g. Xu et al., 2012; Tsang et al., 2007) show that Ku-band radar measurements (13.5 and 17.25 GHz) provide a viable pathway for a future satellite mission capable of monitoring snow water storage because of (1) sensitivity to SWE through the volume scattering properties of dry snow and (2) the ability to discriminate wet from dry snow cover (Tsang et al., 2022). While Ku-band radar measurements are available from altimetry and precipitation missions (CryoSAT-2 and Sentinel-3, CloudSat), there are no current SAR missions at this frequency available for science applications. Despite limited availability of measurements, significant progress has been made over the past decade in the understanding of Ku-band radar response to SWE, snow microstructure, and snow wet/dry state in support of past and current mission concepts (e.g. Tsang et al., 2022; Derksen et al., 2019; Rott et al., 2010).
The advancement of a Ku-band radar-based SWE retrieval is highly dependent on decomposing the strong seasonal influences of snow microstructure from background permittivity (Picard et al., 2022; Meloche et al., 2021). Unconstrained, known variations in these properties can modify Ku-band backscatter in ways comparable to SWE in terrestrial environments, making retrievals impossible. In this paper, extensive measurements of snow microstructure and soil properties collected in a tundra environment are used to constrain known uncertainties and evaluate the capability of a forward electromagnetic model (Snow Microwave Radiative Transfer (SMRT) model; Picard et al., 2018) to reproduce observed backscatter from a new set of Ku-band (13.5 GHz) airborne measurements. We present a multi-frequency approach, in which we decouple the background soil contribution using C-band satellite data from the snow volume scattering contribution at the Ku-band. By illustrating the successful forward simulation of measured Ku-band backscatter using an open source electromagnetic model, we successfully demonstrate a crucial component of the cost function SWE retrieval concepts described in the literature (Rott et al., 2012).
While Ku-band radar measurements have clear potential for measuring SWE, experimental airborne and tower measurements are limited. Tower-based measurements at 10.2, 13.3, and 16.7 GHz were collected over four winter seasons in Sodankylä, Finland (2009/10 through 2012/13), complemented with multi-frequency passive microwave measurements of an overlapping footprint. The synergistic radiometer measurements were effective in providing first-guess information on effective snow grain size, which was used within the SWE retrieval approach developed and evaluated by Lemmetyinen et al. (2018). These tower measurements have also been used to support other algorithm development experiments (Merkouriadi et al., 2021; Zhu et al., 2021; Durand et al., 2024; Pan et al., 2024), with the daily temporal resolution proving to be particularly insightful. However, a major limitation was the lack of spatial sampling, so efforts in the community shifted to the acquisition of airborne Ku-band radar data.
The European Space Agency (ESA) SnowSAR instrument was developed to support science development activities for the proposed Cold Regions Hydrology High-Resolution Observatory (CoReH2O) satellite mission (Rott et al., 2010). SnowSAR is a side-looking, dual-polarized (VV/VH), X- and Ku-band synthetic aperture radar (SAR), operable from various aircraft. Between 2010 and 2013, the instrument was deployed at several sites in northern Finland, the Austrian Alps, and northern Canada. These data, along with comprehensive snow measurements during the data acquisition periods, are freely available as described in Lemmetyinen et al. (2022). While temporally limited, these measurements provide the first spatially distributed Ku-band backscatter data, which provided a new perspective on radar signatures in snow-covered environments, including the important influence of snow microstructure (King et al., 2018). Collective analysis of the SnowSAR datasets from the CoReH20 era showed the potential for machine learning (ML) techniques to be effectively trained to retrieve SWE across the range of snow-climate classes flown by SnowSAR (Santi et al., 2021). The SnowSAR was also flown over Grand Mesa, Colorado, as part of the NASA Snow Experiment (SnowEx) in 2017 (Singh et al., 2023). These studies (e.g. Tsang et al., 2022; Lemmetyinen et al., 2022; King et al., 2018) have shown that the Ku-band frequency range is most sensitive to SWE, and a priori knowledge of snow microstructure is necessary to accurately estimate SWE. This is why a Canadian, dual-frequency Ku-band (13.5 and 17.25 GHz), dual-polarization (VV/VH) SAR mission is currently in development by the Canadian Space Agency and Environment and Climate Change Canada (Terrestrial Snow Mass Mission, TSMM). This Canadian-led mission aims at providing weekly coverage over the Northern Hemisphere at a nominal resolution of 500 m.
A dual-frequency (13.285 and 35.9 GHz) radar was developed at the University of Massachusetts (UMass) as a demonstration and precursor to NASA's Surface Water and Ocean Topography (SWOT) mission. Subsequently, the lower-frequency Ku-band component of the system at 13.285 GHz was repurposed in 2018 and developed into an airborne system that could be easily ported between common aircraft platforms. In this study, we utilized measurements from this UMass instrument, deployed during the 2018/19 winter over the Trail Valley Creek study area in the Northwest Territories, Canada, to advance science readiness activities of TSMM (Siqueira et al., 2021).
This paper focuses on the forward radiative transfer modeling component of a future SWE retrieval algorithm similar to what is proposed by Rott et al. (2012) and Pan et al. (2024). The data collected during the Trail Valley Creek (TVC) experiment are used to validate the SMRT model as the forward model used for such an SWE algorithm and will provide insight into the model parameterization needed to link snow properties to the Ku-band signal, i.e. (1) isolating the background soil contribution to the backscattered signal and (2) tuning the snow microstructure to properly link the snow volume scattering to SWE.
To evaluate Ku-band radar sensitivity to snow properties, airborne measurements with the UMass Ku-band radar instrument were acquired over the TVC watershed near Inuvik, Northwest Territories, Canada, in November, January, and March during the 2018/19 winter season (Siqueira et al., 2021). Snow measurements and distributed hydrological modeling research activities have been conducted at TVC since 1995 (e.g. Shi et al., 2015; Wilcox et al., 2022), including a portion of the airborne SnowSAR snow radar campaign conducted during the 2012/13 winter season (King et al., 2018). Amongst these studies, a detailed vegetation map was completed by Grünberg and Boike (2019). The Siksik sub-basin studied for the TVC experiment is predominantly composed of tussock tundra (39.1 %), followed by dwarf shrub (30.6 %) and lichen (26.6 %) covers and sparse riparian shrub elements (3.7 %). Isolated black spruce stands located within the TVC research watershed were not evaluated in this study. The snowpack at TVC is a typical Canadian Arctic snowpack with a maximum snow depth of around 50 cm and two dominant snow layers, i.e. a wind slab with mostly rounded snow grains at the surface and a less cohesive depth hoar grain layer at the bottom (Rutter et al., 2019; Derksen et al., 2009).
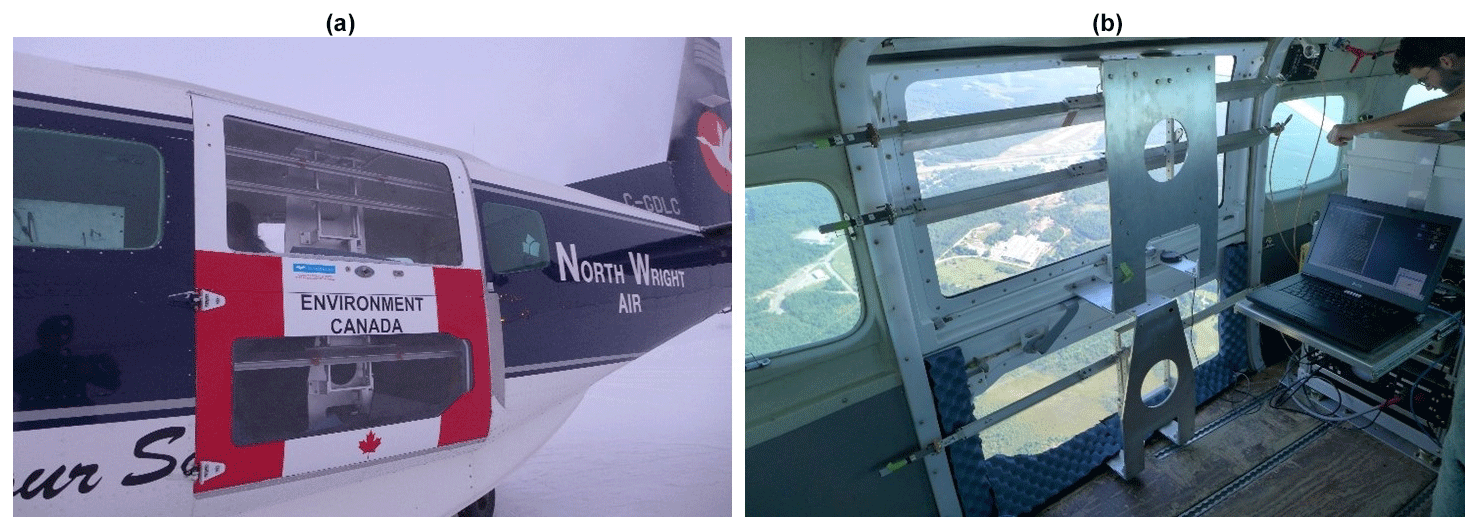
Figure 1UMass Ku-band radar mounted in a modified Cessna 208 baggage door (a). A single transmit antenna is mounted in the lower half and two receiver antennas in the upper half (b). Electronics for the system are mounted as a single rack easily transported between a variety of aircraft platforms.
2.1 Airborne SAR measurements
For the TVC experiment, a vertically polarized waveguide antenna for signal transmission was installed in the lower half of a modified Cessna 208 baggage door (Fig. 1). Two additional waveguides were mounted in the upper half of the door for simultaneous dual-channel reception, enabling both single-polarization VV SAR and single-pass InSAR capabilities. At a nominal flight altitude of 1000 m, the system images a 2 km swath with a 2 m ground range resolution and across an incidence angle range of ∼20–70°.
Flight lines with the UMass system were optimized to maximize repeat coverage of the smaller Siksik sub-basin and surrounding regions (∼24 km2) within the greater TVC watershed (58 km2; Fig. 2). Concentrating the flight lines over this smaller area of interest was done to maximize overlap with coincident ground snow surveys and locally installed meteorological and soil stations (Fig. 2). Furthermore, the design of the radar acquisitions involving generous swath overlaps and inter-campaign repeat passes was implemented to allow for filtering of motion uncertainties where needed, as well as to increase inter-swath calibration opportunities (see King et al., 2018).
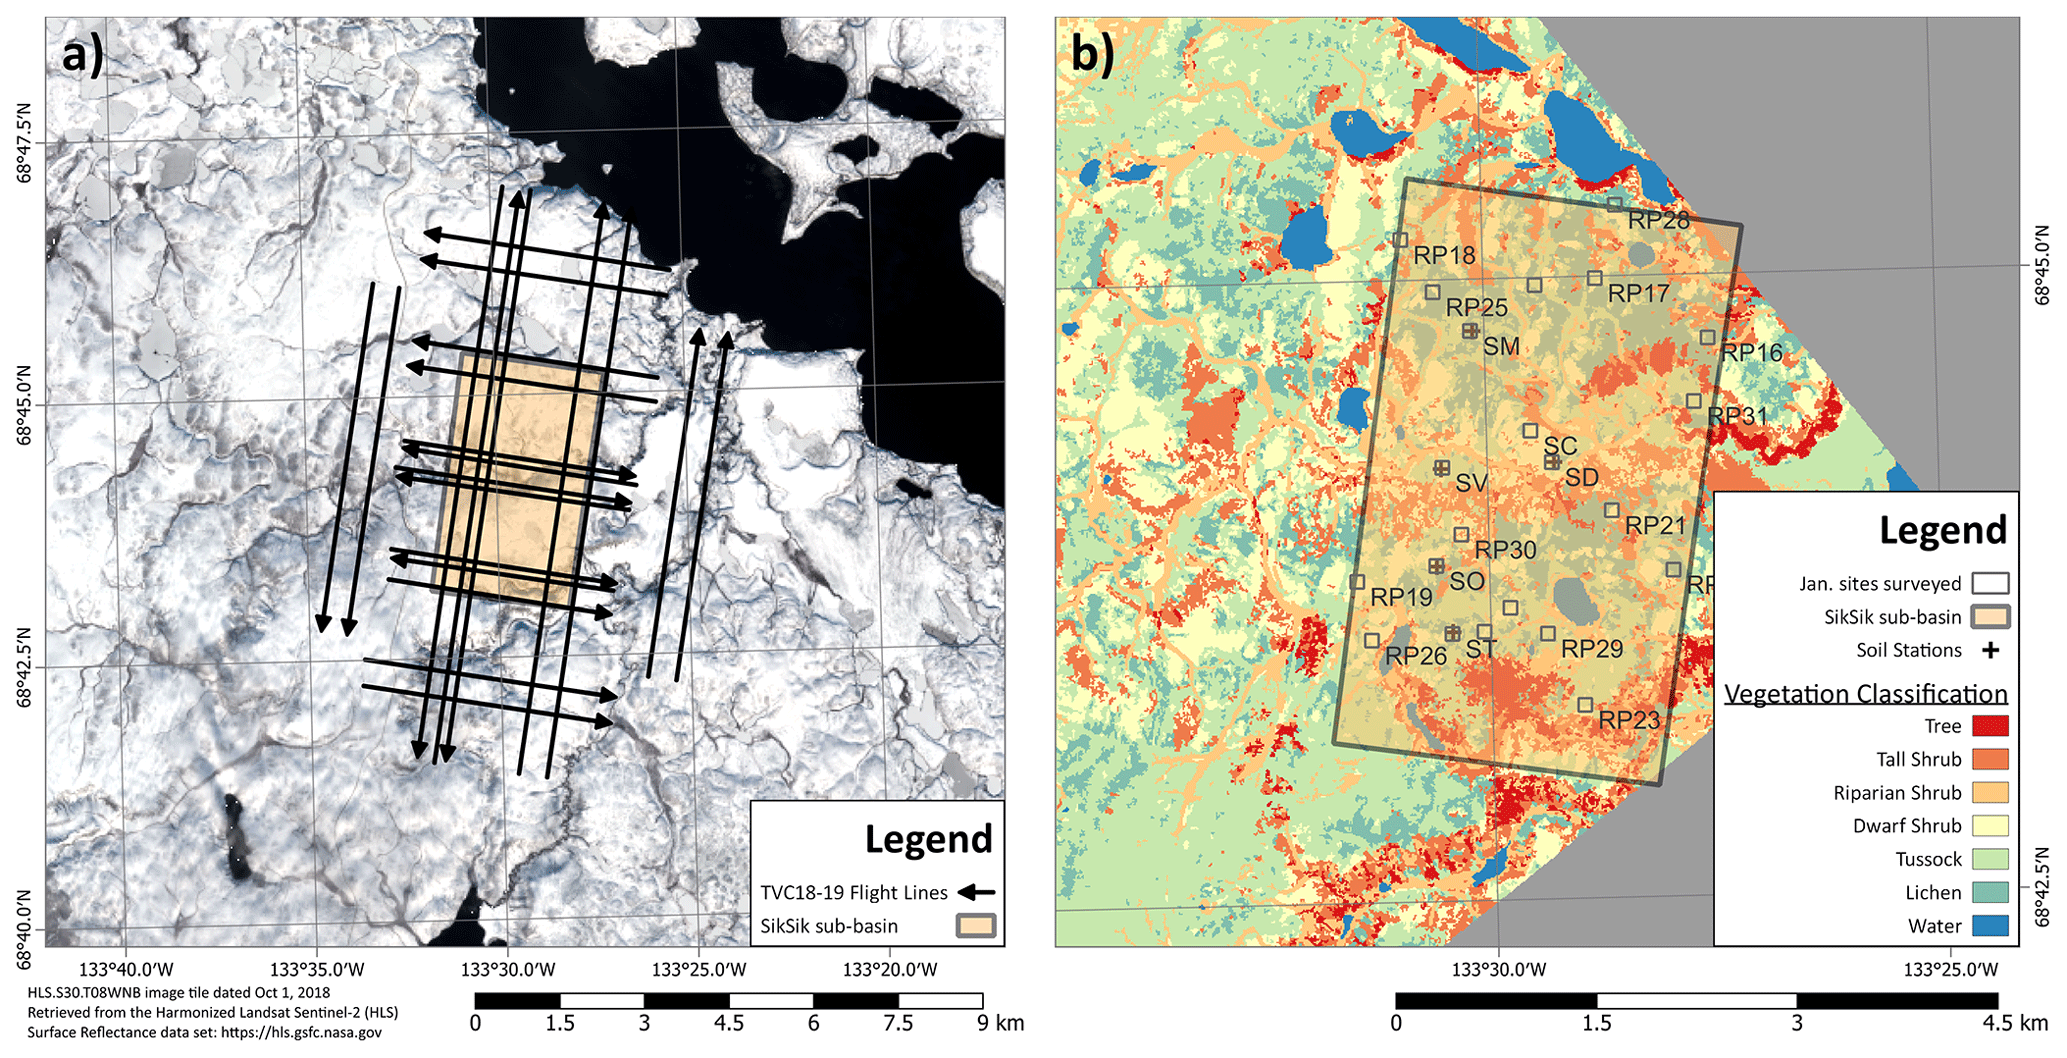
Figure 2Flight lines completed during each of the TVC snow deployments (a). The 2016 vegetation classification map (Grünberg and Boike, 2019) with the location of the surveyed sites and soil stations (b). The weather station is located at the SM site. The size of the surveyed site box corresponds to the 100 m footprint of the radar data.
Balancing budget, time, and overlap requirements, 16 flight lines were planned, and all areas within the selected domain were measured in four distinct look directions and from multiple incident angles due to the 75 % overlap established between sequential passes. Where time allowed, flight lines were repeated within each deployment to generate further samples. Multiple revisits during a flight mission generated a diversity of radar viewing geometries.
This study will focus on optimizing the forward modeling of the SAR data acquired during the January campaign to focus on dry winter snow conditions. The November campaign Ku-band data require additional calibration due to unstable flight lines. This is attributed to difficult weather conditions for flying and the need for manual in-flight corrections from the pilot to control the roll, pitch, and yaw of the plane. The January flights had much more stable flight lines, yielding better-calibrated SAR data. The March campaign had above-freezing temperatures, which made it difficult to retrieve snow properties in the field. Some liquid water content in the top portion of the snowpack was also present, which prevents good forward modeling of the snowpack since the radar signal does not penetrate the wet snow layers.
2.2 Satellite SAR measurements
For this campaign, C-band satellite SAR data from RADARSAT-2 (RSAT-2) were acquired as well as X-band TerraSAR-X (TSX) data. A total of 87 Fine Quad Wide (FQW) RSAT-2 and 40 TSX StripMap images were acquired over the Siksik basin from September 2018 to June 2019. Table 1 gives the details of the different acquisition modes, polarizations, and incidence angles for both RSAT-2 and TSX.
Table 1List of beam modes, respective polarizations, and incidence angles for the RSAT-2 and TSX acquisitions.
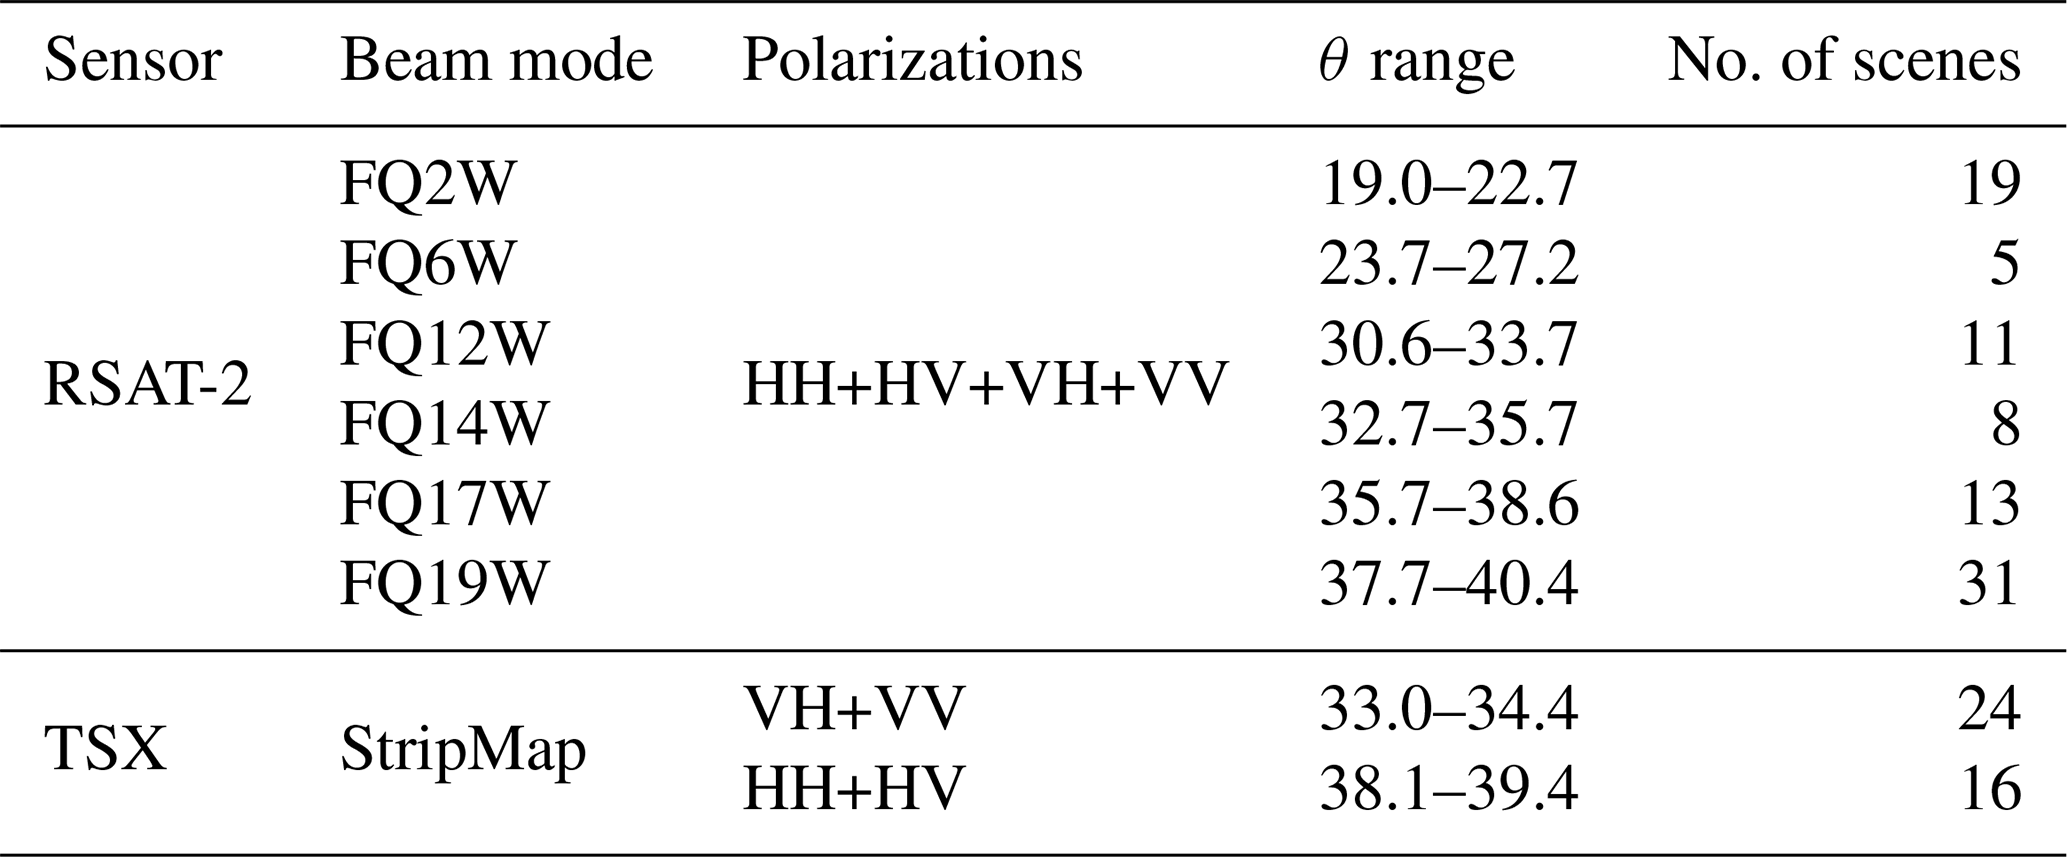
With little sensitivity of the C- and X-band signal intensities to snow volume scattering at co-polarizations (co-pol) (Duguay and Bernier, 2012), these satellite datasets were used to estimate the background contribution of the total backscattered signal in the forward modeling scheme (Sect. 3.2). To focus on the UMass Ku-band data forward modeling optimization, which is single-polarization VV, only the VV channel of the satellite imagery was used in this study. The available satellite data are provided in Table 1 as information in case future work requires additional polarizations. To increase the number of points in the optimization process, the satellite imagery acquired 2 weeks before and after the intensive ground campaigns was considered only if the intensity variability (standard deviation) from one image to another for all surveyed sites was below 2 dB.
2.3 Ground-based snow and soil measurements
Within the Siksik sub-basin, six static sites were established to represent the contrasting land cover and associated snow conditions also present across the greater TVC domain (Fig. 2): a snow drift site (SD), a site near the meteorological station (SM), a site near an old trench site (SO; Rutter et al., 2019), an open tundra site (ST), and a site within a valley (SV). Repeat snow measurements were completed during each deployment to characterize temporal variability in snow properties. Care was taken to not complete measurements in identical locations on successive deployments; however, the general location of the sites remained the same. At these sites, four HydroProbe soil sensors were installed horizontally in a soil pit in each of the cardinal directions approximately 5 m outwards from a central datalogger. Two sensors were buried at 5 cm, and two were buried 10 cm below the surface within the top layer of organic material. The soil sensor networks collected hourly measurements of temperature, moisture, and complex permittivity during the experiment. From these measurements it was possible to determine the freeze–thaw state of the soil and provide modeling inputs to estimate the background scattering through the winter season.
At the center of each snow survey site, a snowpit was excavated as a reference measurement. From the pit face, stratigraphy and layer heights were interpreted via visual inspection following standard methods (Fierz et al., 2009). Snow samples extracted from each layer were visually identified by grain origin type using a 2 mm comparator card and a 40× magnification field microscope. Density profiles were collected from the pit face as continuous profiles with a Taylor–LaChapelle style cutter (100 cm3; 3 cm height). Extracted samples of a known volume were immediately weighed with a shielded digital scale (±0.01 g accuracy) to obtain density estimates. The consistent presence of vegetation voids and weak basal layers at the base of the pack made the collection of continuous profiles challenging. As a result, measurements of basal hoar or ground-interfacing layers are likely to be underrepresented, a common issue in tundra studies (Domine et al., 2016). Profiles of snow specific area (SSA) were collected as an objective metric of microstructure with the A2 Photonics IceCube. The IceCube is a commercial implementation of infrared reflectometry sensors commonly used in snow studies (Domine et al., 2007; Gallet et al., 2009). Measurements of the reflected 1310 nm laser were calibrated using a set of six Spectralon diffuse reflectance targets before and after each profile. With a 3 cm extractor, samples were taken as continuous vertical profiles where cohesive samples could be extracted. For samples in depth hoar or vegetation voids, the filling and packing of the sampler were often required to ensure the laser would not fully penetrate the sample. Reported in square meters per kilogram (m2 kg−1), measurement uncertainty of SSA is expected to be ±10 %. See Fig. A1 of Tsang et al. (2022) for a typical representation of vertical snowpit measurements.
At each snowpit site, a minimum of two snow micropenetrometer (SMP; Proksch et al., 2015) profiles were collected near the central snowpit to calibrate against layered density and SSA from the typical snowpit measurements. SMP calibration measurements were taken within 10 cm of the snowpit face, adjacent to the profiles of density and SSA measurements. The calibration of the density and SSA models extends the work of King et al. (2020) and Calonne et al. (2020), as modified from the foundational work of Proksch et al. (2015) and Pielmeier and Schneebeli (2003). Following the pre-processing steps outlined in King et al. (2020), profiles penetrating less than 90 % of the measured snow thickness were removed. Individual profiles were also evaluated to flag and remove signal artefacts including values below 0.001 N or changes in force of greater than 100 % over distances of less than 2.5 mm (Proksch et al., 2015; Marshall and Johnson, 2009). Applying a one-dimensional shot-noise process conceptualized in Löwe and van Herwijnen (2012), profiles of mean force () and length scale (L) of the penetration window were computed for all SMP profiles using a moving window of 5 mm with 50 % overlap. The continuous profiles were then aggregated into 5 cm layers, small enough to represent average layers (Sandells et al., 2022). Results of the SMP calibration are shown in Sect. 4.2. To capture vertical variability in snow properties within a 100 m footprint around the snowpit, a north–south and an east–west SMP transect was measured with a 10 m distance between each profile (∼18 profiles per site; Fig. 3). These profiles were then converted to snow density and SSA using the calibration obtained from the pit profiles.
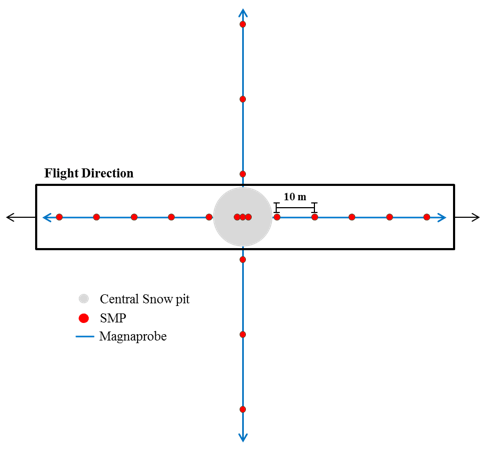
To get a better representation of snow depth distributions within the 100 m footprint around the snowpits, magnaprobe (Sturm and Holmgren, 2018) measurements along the SMP transects were recorded every 1–2 m (∼290 measurements per site; Fig. 3).
In addition to surveying the same six static sites during each campaign visit, snow measurements were also made at a series of roving survey sites (i.e. roving pits, RPs) in November (15), January (16), and March (25). Those sites were selected using a stratified random sampling approach which considered land cover and topography. These extra sites were sampled in order to capture the variability in snow properties within the Siksik basin and how it impacts radar backscatter. They were also used to determine how representative the background soil properties measured were at the static sites of the entire domain by retrieving a distribution of soil permittivity and roughness parameters from the forward modeling optimization process (Sect. 3.2). The same sampling strategy was used for the static and roving sites for snow properties. Only the soil surface temperature was measured at the roving sites at the time of sampling.
This section provides the processing steps of the UMass radar data as well as the satellite imagery. The forward radiative transfer modeling optimization approach is also detailed.
3.1 Processing of SAR measurements
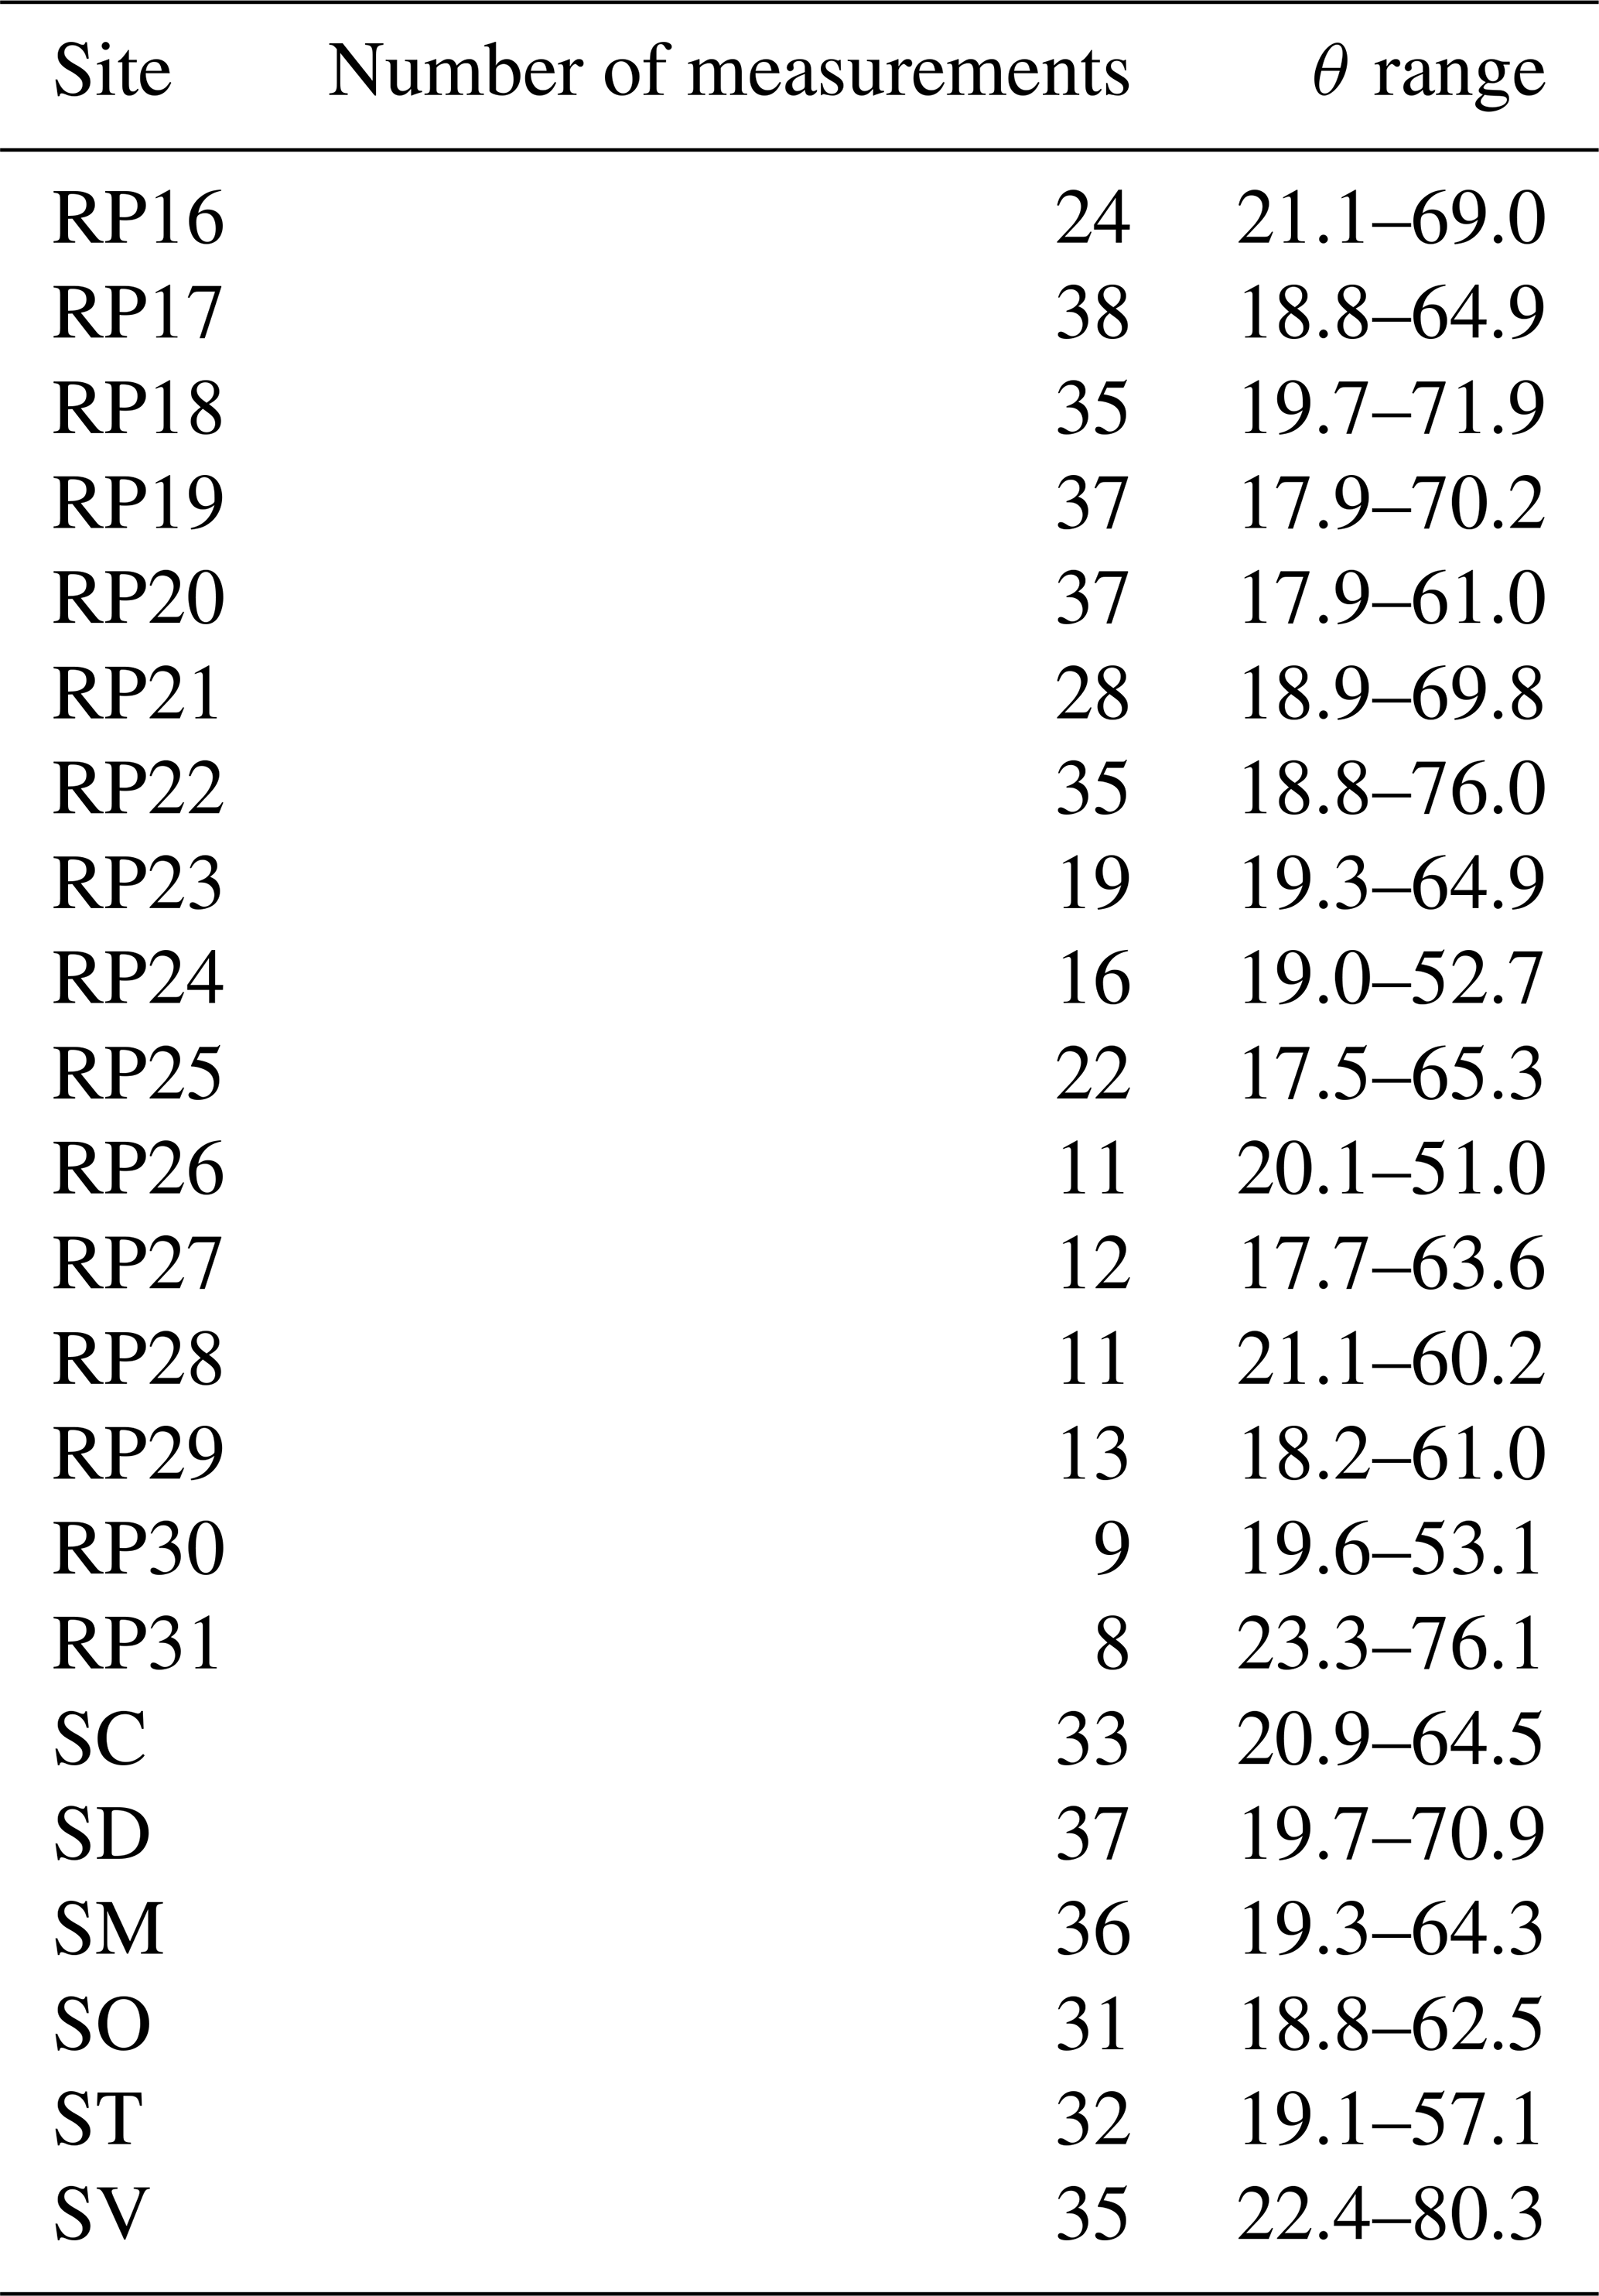
UMass radar measurements (2 m × 2 m) were aggregated by considering pixels within a 50 m radius of central snowpits (n=2500 pixels). The evaluated pixels were filtered to remove 3σ outliers and averaged to obtain a single value for analysis. This pre-processing was applied to minimize or negate the complex influence of pixel-scale variabilities (hummocks and vegetation) and radar speckle. Overlapping passes of the flight grid produced an average of 25 independent radar measurements per snowpit site (Table 2; 8 measurements in the worst case and 38 measurements for the best case). The overlapping flight lines provided a diverse viewing geometry. On average, a 45.5° range of incidence was available at each site from approximately 19.5 to 65.0°. The ability to view the same site from multiple incident-angle and look-direction configurations is a unique ability of airborne SAR, which in this study enabled forward modeling and retrieval testing across a broad range of geometries.
Table 2Number of measurements per site for the TVC January 2019 campaign with the respective incidence angle range.
The satellite imagery was processed using the ESA SNAP software, and processing steps include image calibration to σ0, orthorectification (range Doppler terrain correction) using the ArcticDEM (Porter et al., 2023) at 2 m spatial resolution, and extraction of the local incidence angle and its corresponding corrected backscatter values. An area of 100 m × 100 m with the snowpit geo-coordinates as the centroids was extracted from the imagery. Approximately 1100 and 400 pixels were averaged for TSX (∼3 m pixel spacing) and RSAT-2 (∼5 m pixel spacing), respectively. No filtering was necessary given the wavelength of the two sensors and the fact that averaging over that large number of pixels removes speckle noise.
3.2 Forward modeling
In this study, the Snow Microwave Radiative Transfer (SMRT; Picard et al., 2018) model was used to simulate the backscattered signal (σ0) at C-, X-, and Ku-bands at VV polarization. To properly simulate σ0, some parameters need to be properly estimated, mainly (1) the background roughness and permittivity (Meloche et al., 2021; Montpetit et al., 2018) and (2) the snow microwave grain size (Picard et al., 2022) related to microstructure and volume scattering.
For every optimization process at every site of the January 2019 campaign, the most representative SMP profile was selected to provide input of snow properties to the SMRT model for the multi-layered snowpack analysis. The SMP profile selection was based on using the SMP profile with the snow depth that best corresponded to the median snow depth of all magnaprobe measurements for a given site. For discussion purposes, further testing using a two-layer snowpack was performed, where the median values of the rounded and depth hoar grain type layers, using all the SMP profiles, were used to determine their snow geophysical properties (e.g. thickness, temperature, SSA, density).
For the background surface scattering modeling, the geometric optics (GO) model (Tsang and Kong, 2001), implemented in the SMRT model, was used since the surface roughness parameters at the 100 m scale and the wavelengths of the sensors largely surpass the validity range of other models such as the Advanced Integral Equation Model (AIEM) (Meloche et al., 2021). With little sensitivity to snow volume scattering of the signal intensity at C- and X-bands, the satellite data of RSAT-2 and TSX were used to retrieve the effective soil permittivity (εsoil) for each band and effective soil roughness, i.e. mean square slope (mss), which is the parameter used in the GO surface scattering model.
Given the recent progress in understanding the microwave scattering properties of snow grains (Picard et al., 2022) and the two-layer nature of the Arctic snowpack (Rutter et al., 2019), it was decided to optimize the snow volume scattering using the polydispersity (K) parameter for two grain types, i.e. (1) rounded and (2) depth hoar grains. Those two grain types are the dominant grain in the two layer types reported by Derksen et al. (2012, 2009) for Canadian Arctic snowpacks. This means that the data at the Ku-band are used to retrieve three parameters: (1) εsoil[Ku], (2) rounded-grain polydispersity (KR), and (3) depth hoar polydispersity (KH).
With the amount of data available for all bands (Tables 1 and 2) and the diversity of SAR viewing geometry available, a simple least-squares method, using the trust region reflective algorithm (Conn et al., 2009), was used to retrieve all parameters. This algorithm has the advantage of allowing boundary constraints which prevent the optimization process from converging on unrealistic values. The different effective parameters were thus constrained by values found in the literature.
In this section, the seasonal evolution of snow properties as documented by the field measurements will be presented to provide context, even though only data from the January 2019 campaign will be used for the rest of the analysis and discussion. The results of the SMP calibration with the snowpit measurements for both snow density and SSA will be shown. Retrieved background effective properties will be given as well as the error estimation for forward modeling at C- and X-bands. Finally, the forward modeling results at the Ku-band will be presented.
4.1 Spatio-temporal variability in snow properties
Figure 4 shows the seasonal evolution of snow depth, from magnaprobe measurements, depth hoar fraction, and classified SMP profiles (Table 5) throughout the campaign. A median snow depth of 32 cm in the early season (November) was observed. Measurements show a median accumulation of up to 46 cm in the mid-season (January) and a median of 42 cm in the late season (March) with a more normal distribution across the entire domain. Figure 4 also shows that the fraction of the snowpack that consists of depth hoar is mainly concentrated around 0.4 during November and then stabilizes around 0.5 for the rest of the winter. There are fewer snow profiles that show no depth hoar from the classification as the winter season progresses.
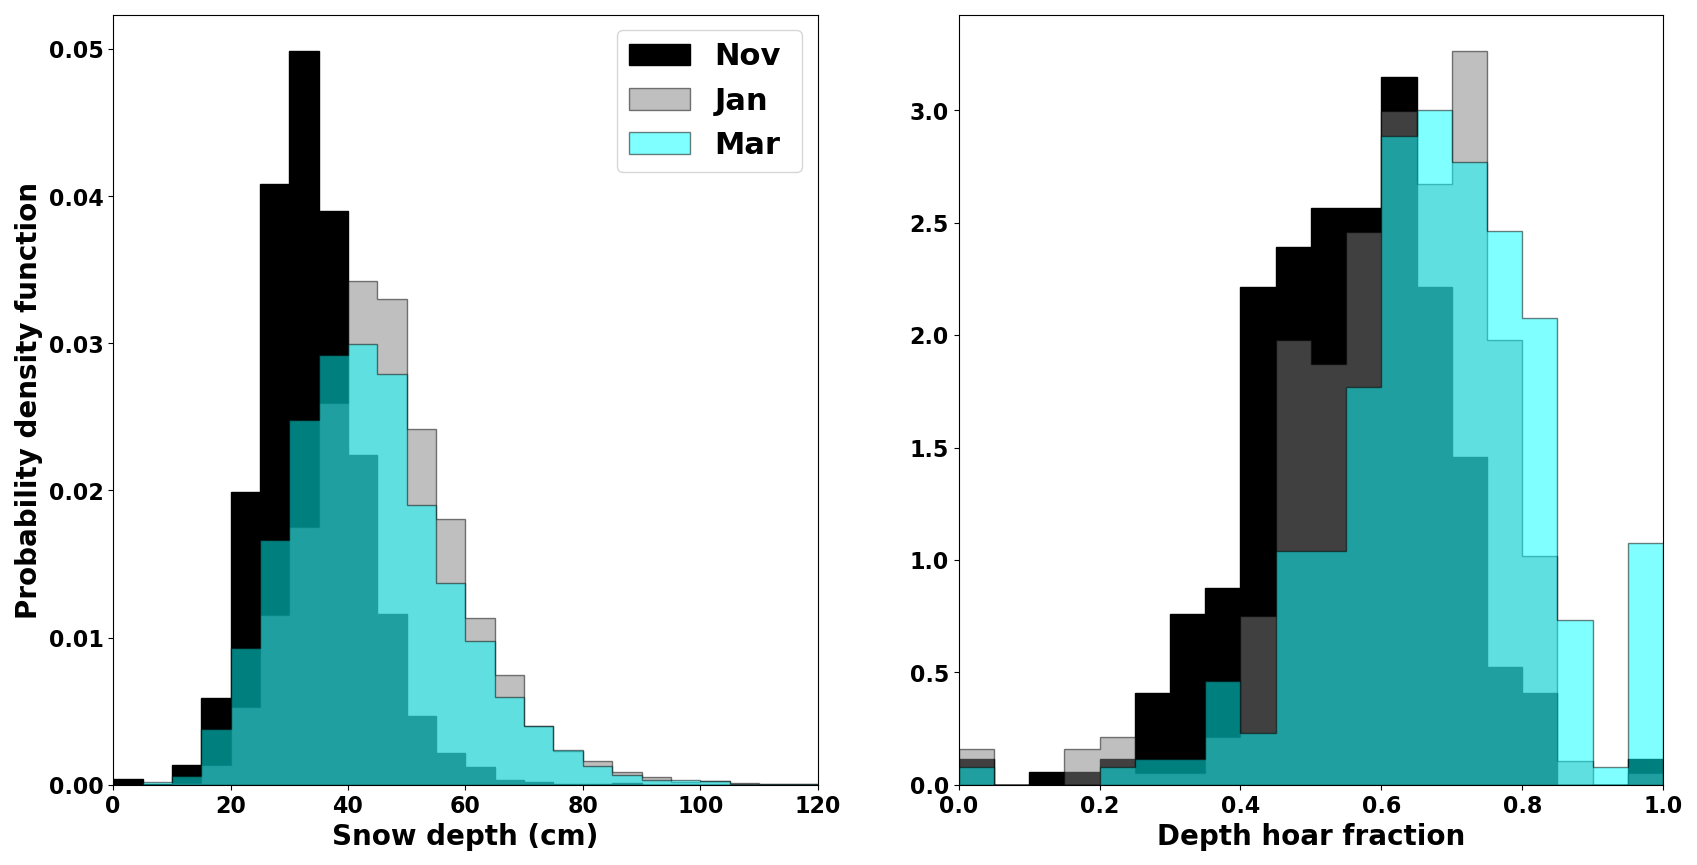
Figure 4Evolution of snow depth distributions and depth hoar fraction throughout the field campaign.
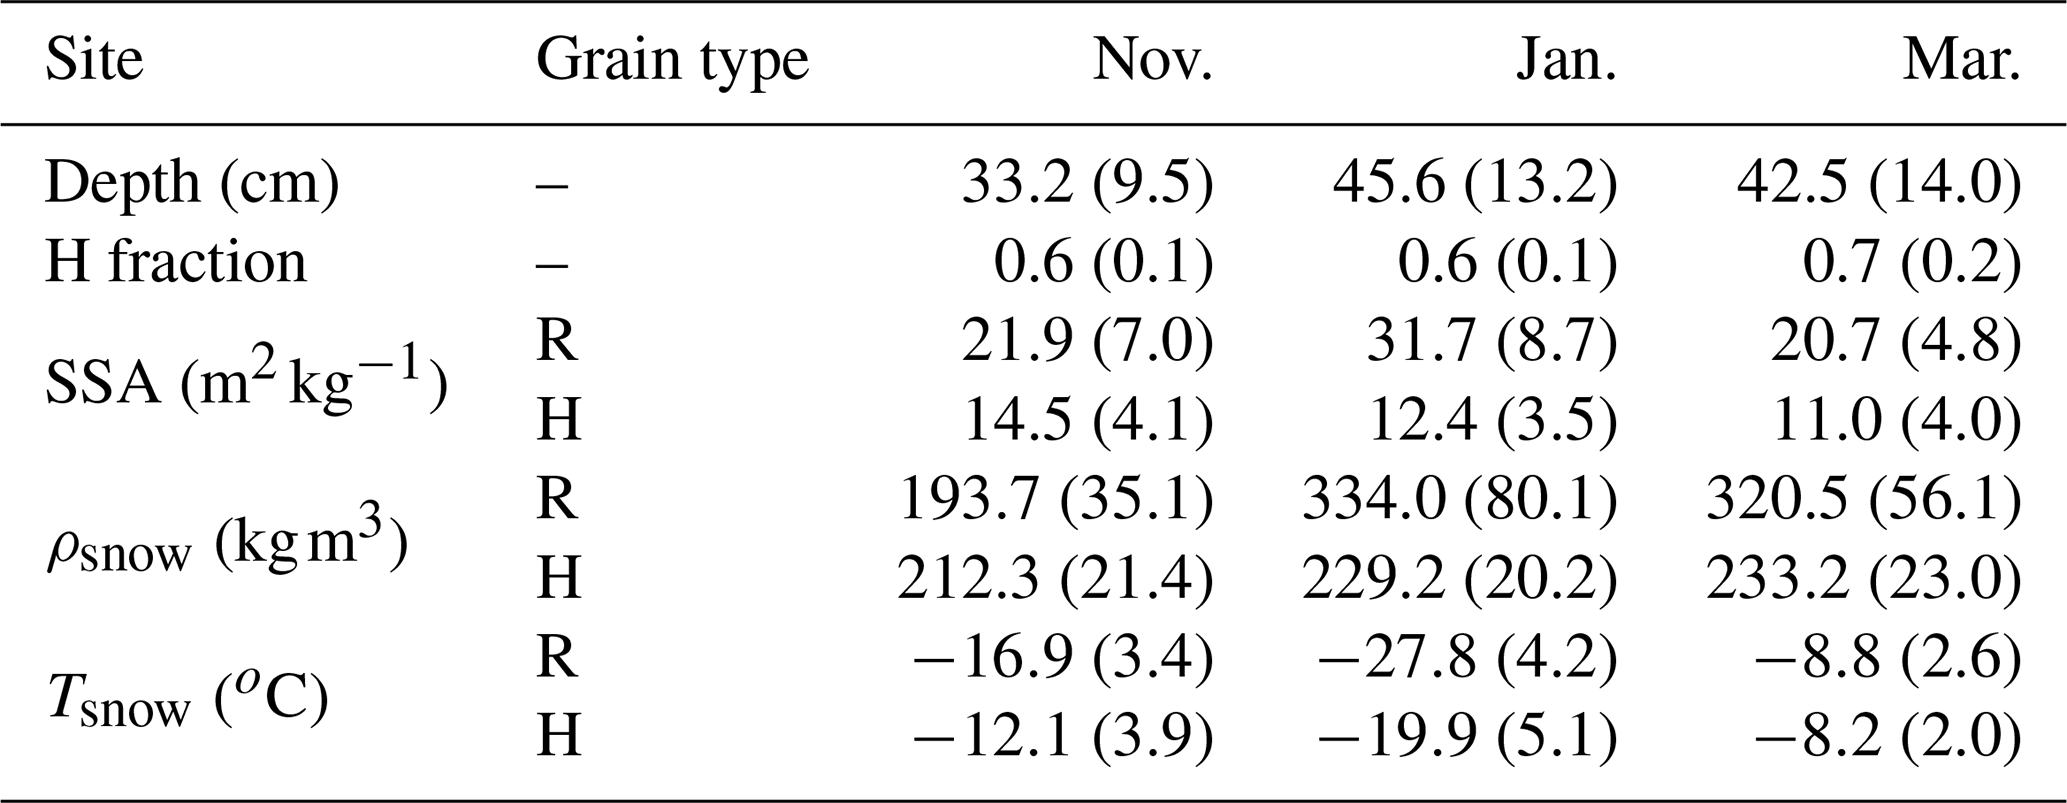
Figure 5 shows the evolution of SSA, density, and temperature for the two dominant snow layers throughout the field campaign. Table 3 gives the median and standard deviations of the different snow properties measured for the entire campaign shown in Figs. 4 and 5. Figure 5 and Table 3 show that the grain size tends to get larger as the season progresses (i.e. lower SSA values). The only exception is during the January campaign when the rounded grain layer tends to have an increase in SSA followed by a decrease during the March campaign. As for density, an overall densification of the snowpack for both snow layers was observed, and a slight decrease in density can be seen from January to March. The snow temperatures reflect the air temperature trends for each site visit, where colder temperatures and warmer air temperatures were measured during the January and March campaigns, respectively, compared to the November campaign.
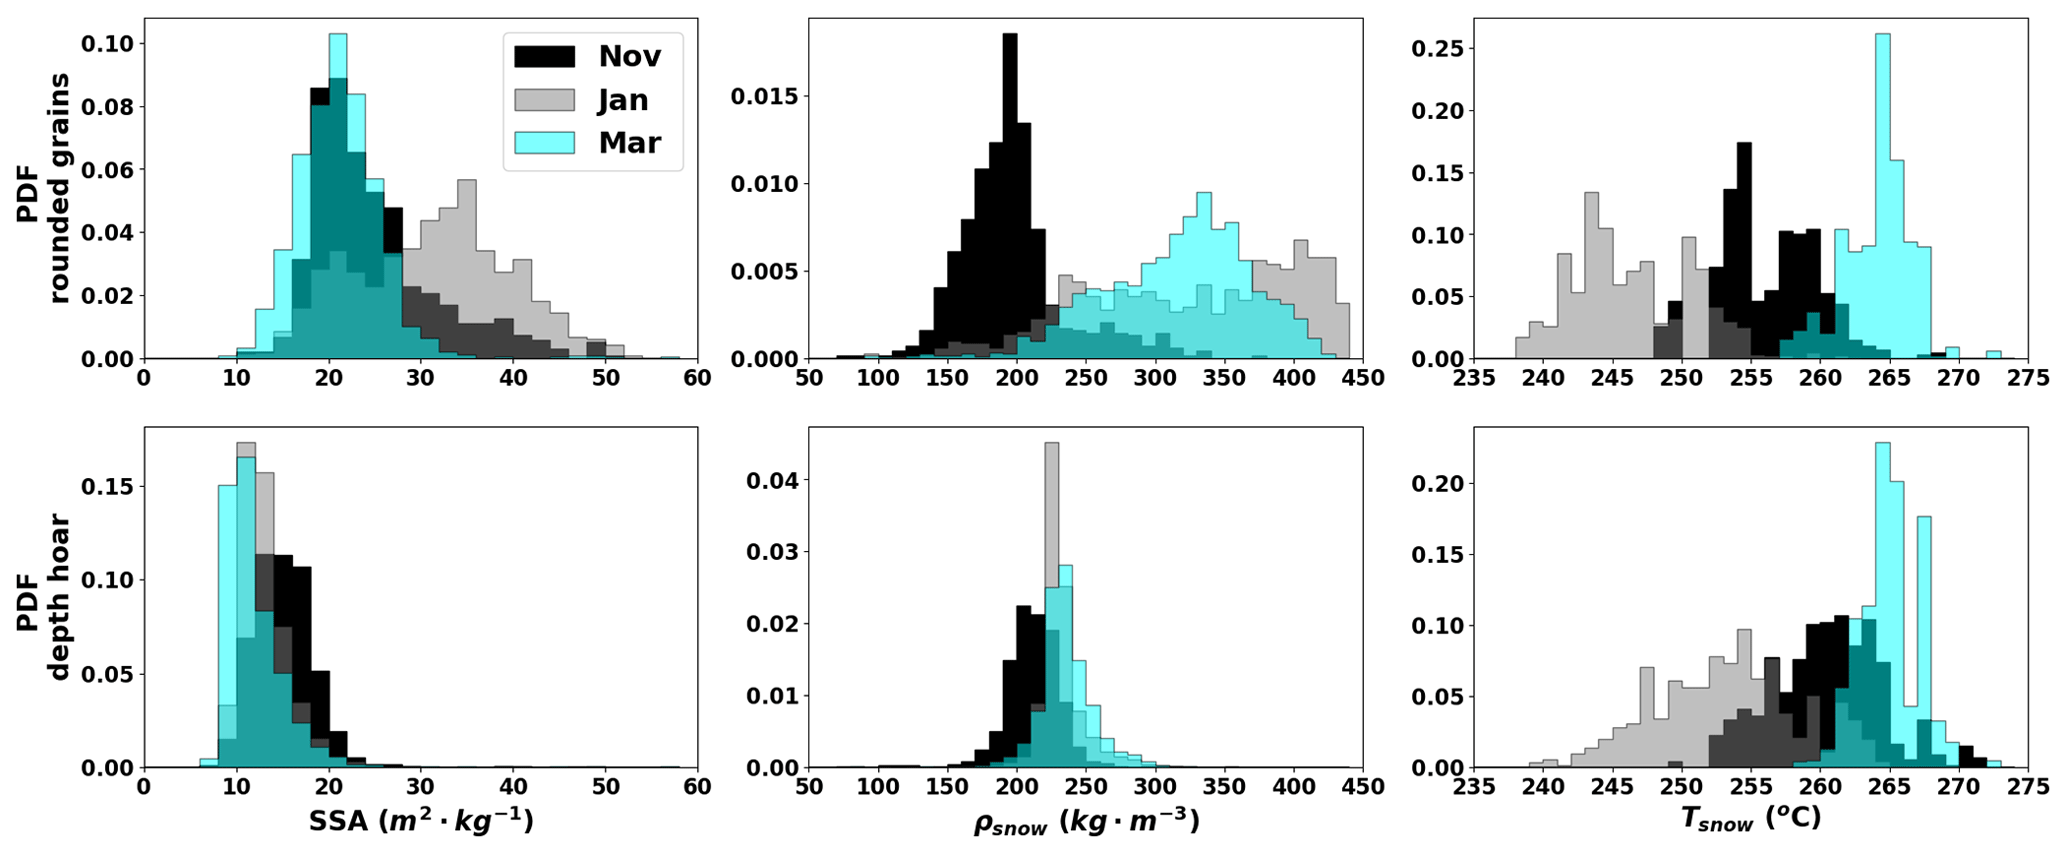
Figure 5Evolution of snow geophysical properties (SSA, density, and temperature) throughout the winter season for the two dominant snow grain type layers: rounded (R) and depth hoar grains (H).
Table 3Median and standard deviations of measured snowpack properties during the TVC 2018/19 winter season for the two dominant snow grain type layers: rounded (R) and depth hoar grains (H).
4.2 Characterization of snow properties
Figures 6 and 7 show the results of the density and SSA estimates from the calibrated SMP measurements. Table 4 gives the equations used to calibrate the SMP profiles to ρsnow and SSA.
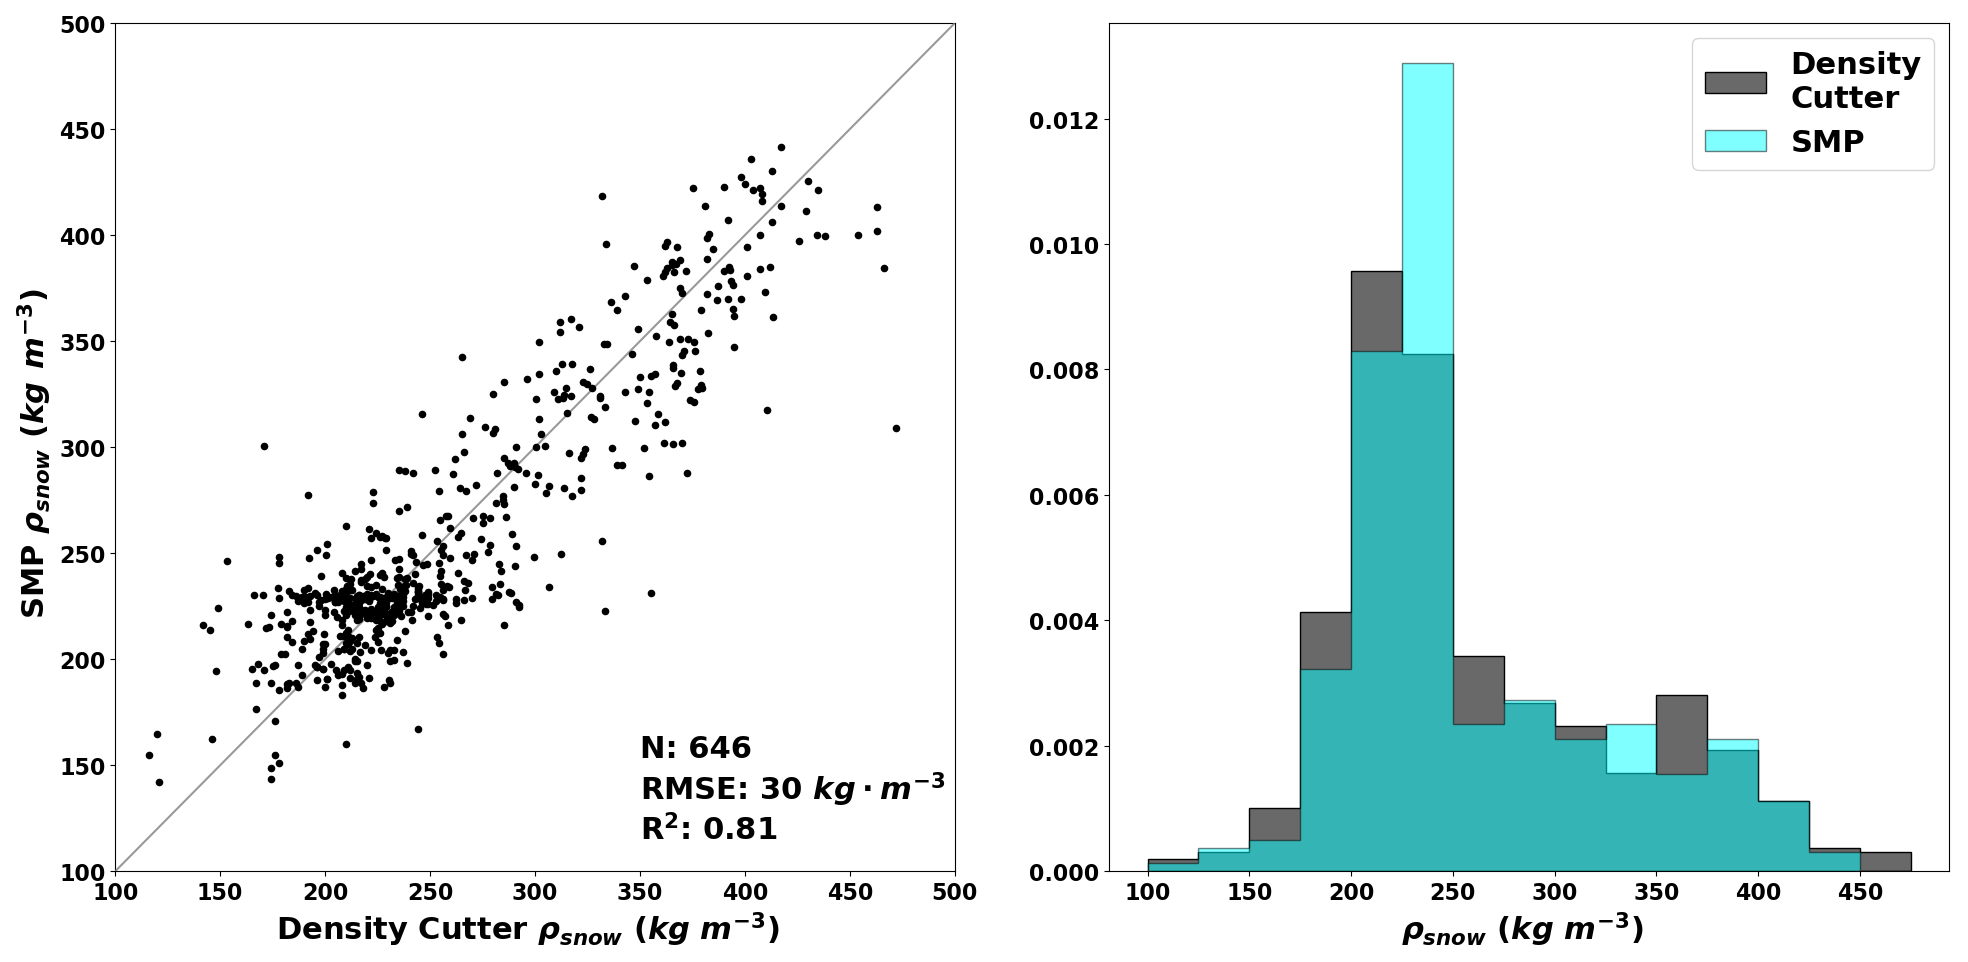
Following the methodology of King et al. (2020), good agreement is achieved between the SMP and density cutter measurements. With 646 comparison points, we get an RMSE =31 kg m−3 (12 % error) and an R2=0.81, which is comparable to results obtained by King et al. (2020) for snow on sea ice and to the results of Dutch et al. (2022), who used a subset of these same field measurements while studying the impact of snow properties on heat transfer within the snowpack. Figure 6 also shows that the density measurement distributions for both the SMP and density cutter overlap well, which further validates the measurement agreement.
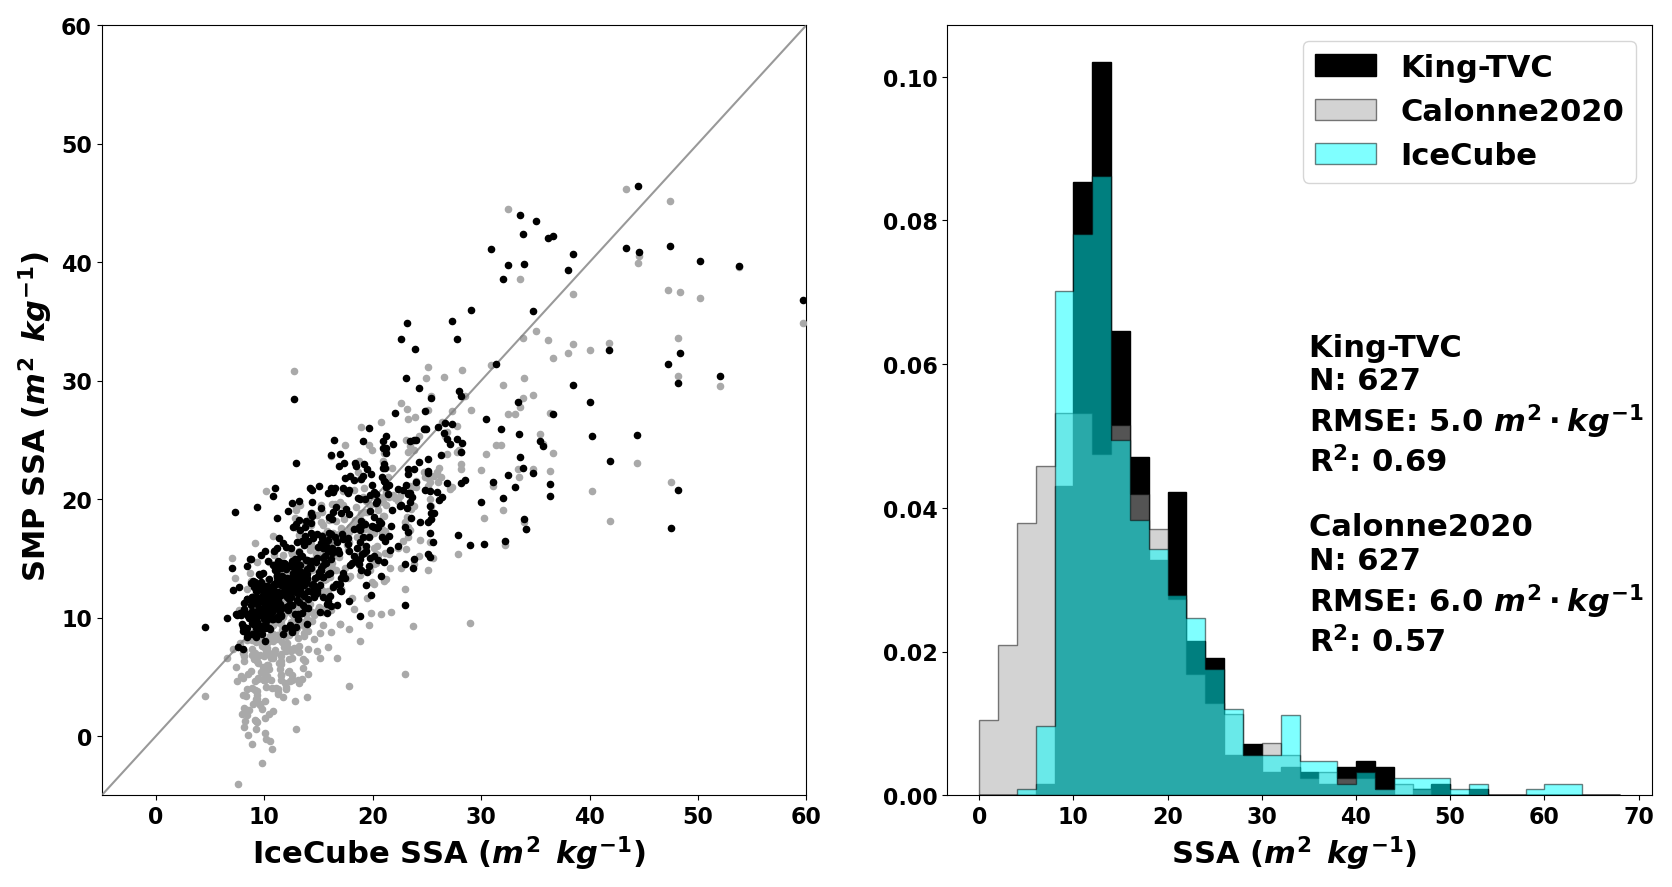
Figure 7 shows that the calibration coefficients of Calonne et al. (2020) (labeled Calonne2020) do not generate SSA values comparable to IceCube measurements for low SSA values (< 15 m2 kg−1). Given this result, new coefficients were generated for this study (labeled King-TVC). With 627 comparison points, we get an RMSE =5.2 m2 kg−1 (29 % error) and R2=0.68 with this new calibration compared to RMSE =6.0 m2 kg−1 (35 % error) and R2=0.57 with the Calonne et al. (2020) calibration. The systematic underestimation of low SSA values from the SMP measurements is also removed with the new calibration.
Calonne et al. (2020)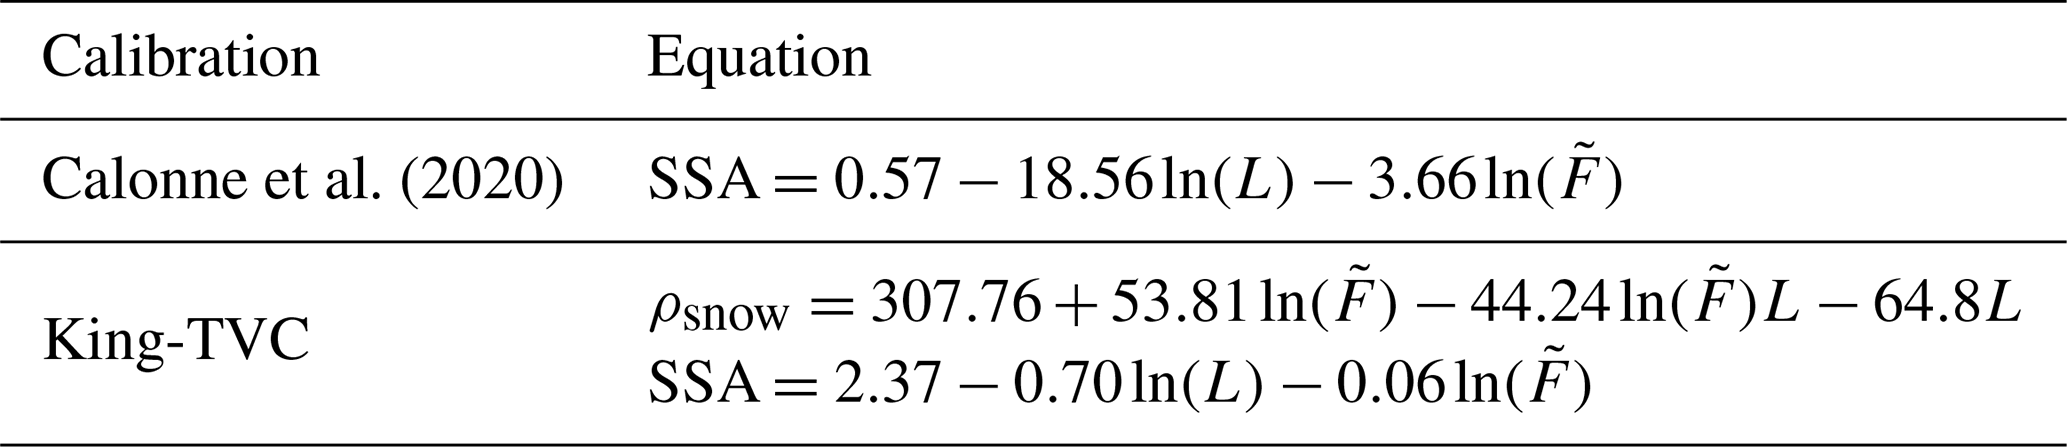
Figure 8 illustrates an example of the distribution of magnaprobe snow depths, the corresponding snow depth for the different SMP measurements, and the selected profile which is closest to the median value of the magnaprobe distribution for a given site.
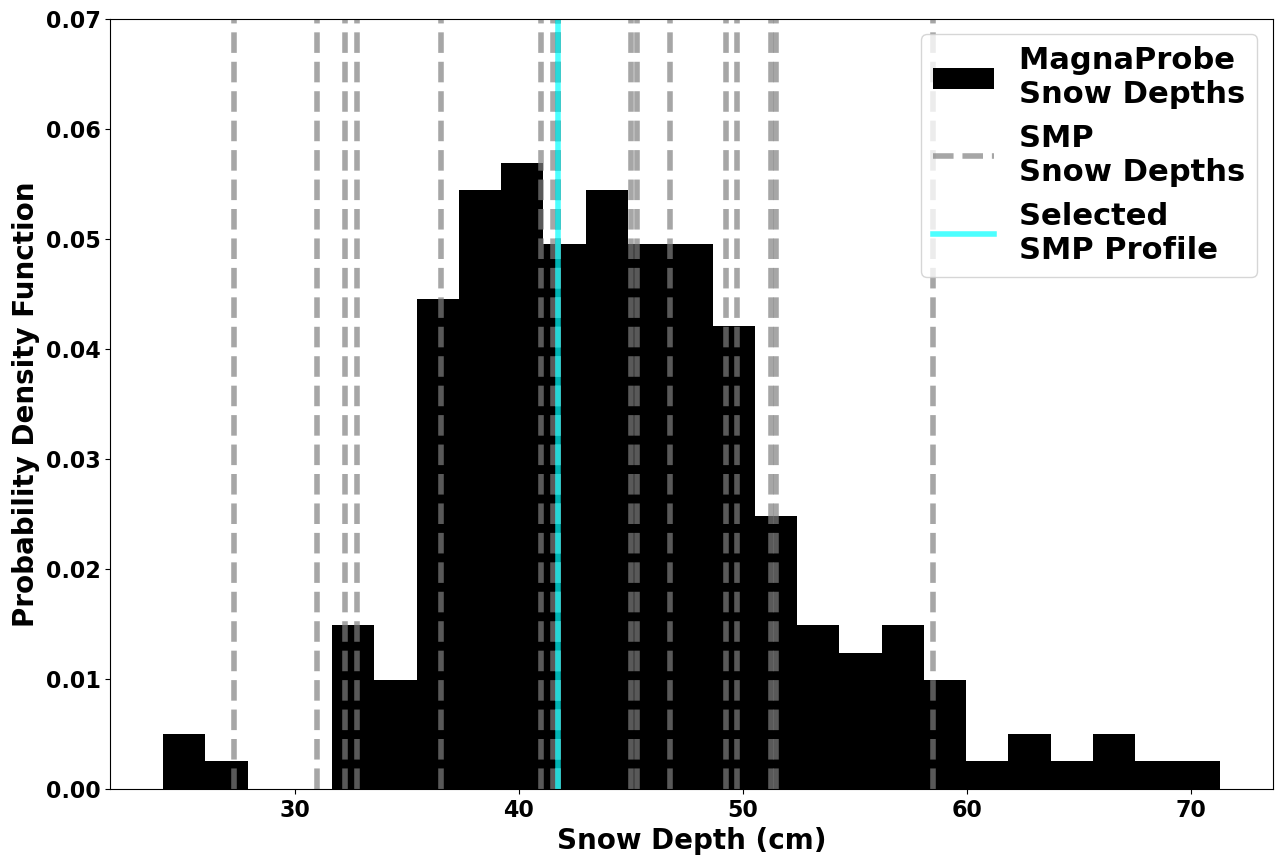
Figure 8Example of the SMP profile selection as a representative snowpack for the SM site (Table 2).
In order to retrieve the polydispersity parameters to optimize the snow volume scattering at the Ku-band, the different snow layers had to be classified into rounded grains versus depth hoar layers. To achieve this, the same support vector machine (SVM) classifier methodology used in King et al. (2020) was used for rounded and depth hoar snow grain classes. To generate the SVM classifier, the SMP profiles acquired behind the central snowpit wall were used as inputs. Layers of mixed/faceted grains were frequently identified by the surveyors. These layers were labeled as rounded grains due to the similarity of the ρsnow and SSA distributions (Fig. 9).
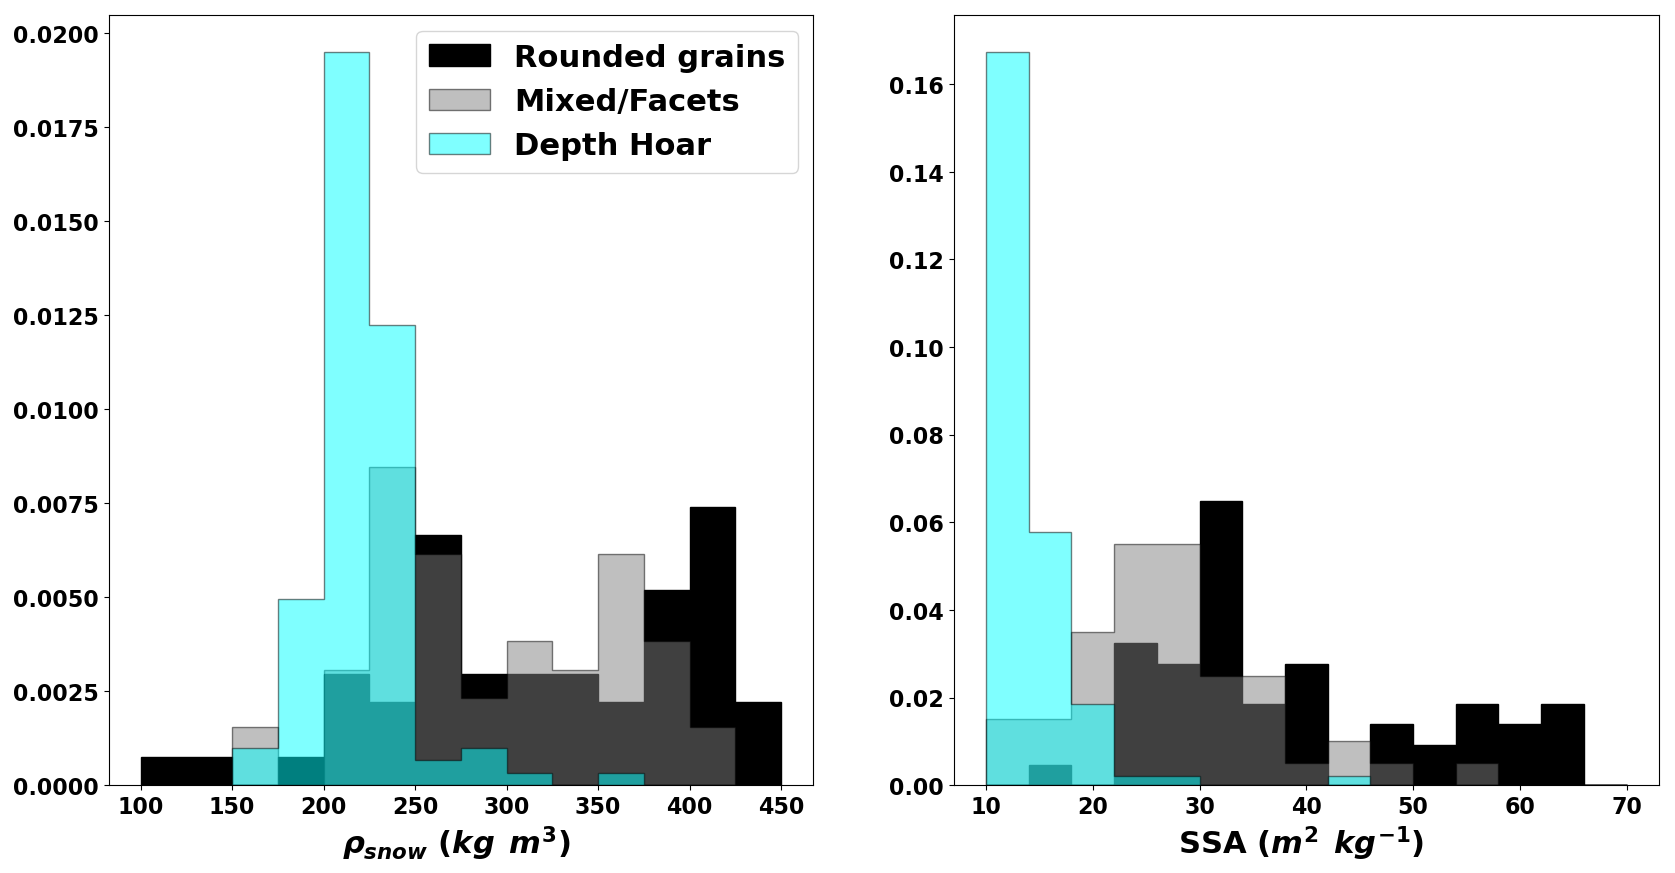
Figure 9Distribution of snow density and SSA for the three dominant grain type layers for the January campaign.
Table 5 shows the confusion matrix of the classification results. An overall accuracy of 88.4 % (±2.5 %) was obtained over 10 different randomly shuffled iterations with an % split for training and testing, respectively.
Table 5Confusion matrix of the grain type classification for the January snowpits.
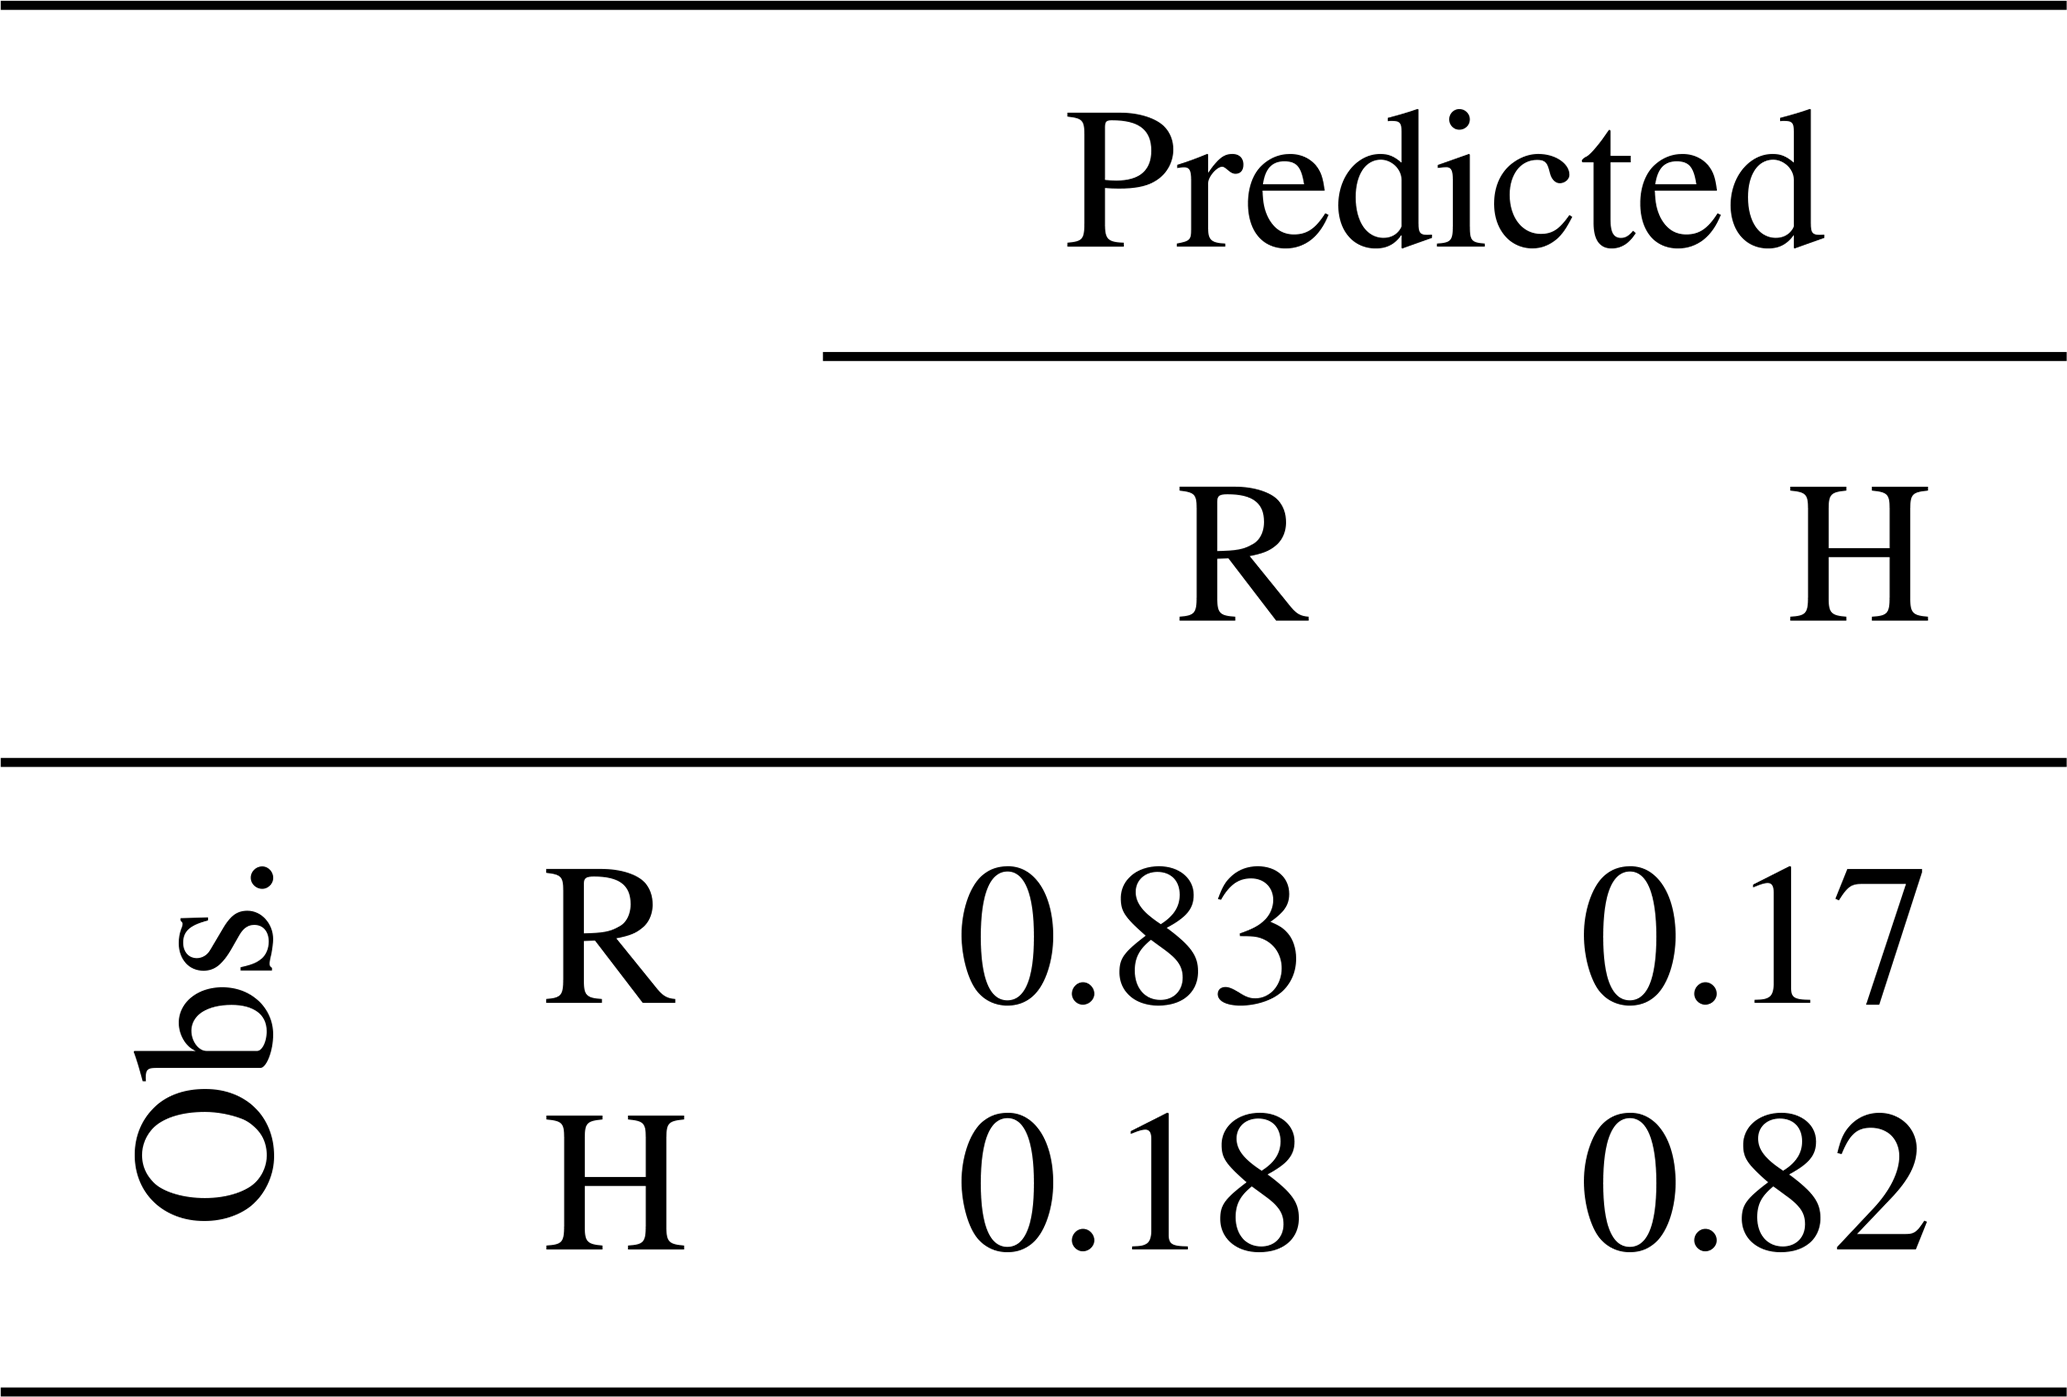
With this classifier, 67 % of the layers that were classified as mixed/faceted layers by the surveyors were classified as rounded grains and the other 33 % as depth hoar.
4.3 Forward modeling of C- and X-band backscatter
This section presents the forward modeling optimization of the background soil properties at C- and X-bands, using the January campaign data alone to focus solely on dry winter conditions. Initial values of permittivity for the optimization process were extrapolated from the retrieved values of Montpetit et al. (2018). The boundaries which the optimization process could not go beyond were determined by published values (Meloche et al., 2021; Pulliainen and Grandell, 1999). The initial mean square slope, i.e. soil roughness (msssoil) value, was set by the median value obtained from airborne lidar measurements collected in August 2018 before the field campaign (Lange et al., 2021). The range was determined by the standard deviation of these measurements. Since the lidar point clouds were noisy with inconsistent point density for all the sites of the January campaign, these measurements were not used directly to simulate the backscatter at the different frequencies. For all parameters, none of them had converged towards the upper or lower boundaries for any sites, meaning there was always a minimum within the constrained values. Table 6 shows the results of the background optimization for all January sites (including static and roving sites) and the static sites individually to show the variability in the different land coverages of the Siksik basin. Out of the six static sites, only one site (SC02; Table 2) was neglected for the parameter retrieval due to the fact that a permanently installed radar corner reflector was mounted nearby within the 100 m footprint surrounding the static snow measurement site. This corner reflector artificially increased the backscatter at C- and X-bands for this site and was thus not considered for the retrieval.
Table 6Retrieved soil parameters using C- and X-band data for the static sites individually and all the sites including the static sites (all) of the January campaign.
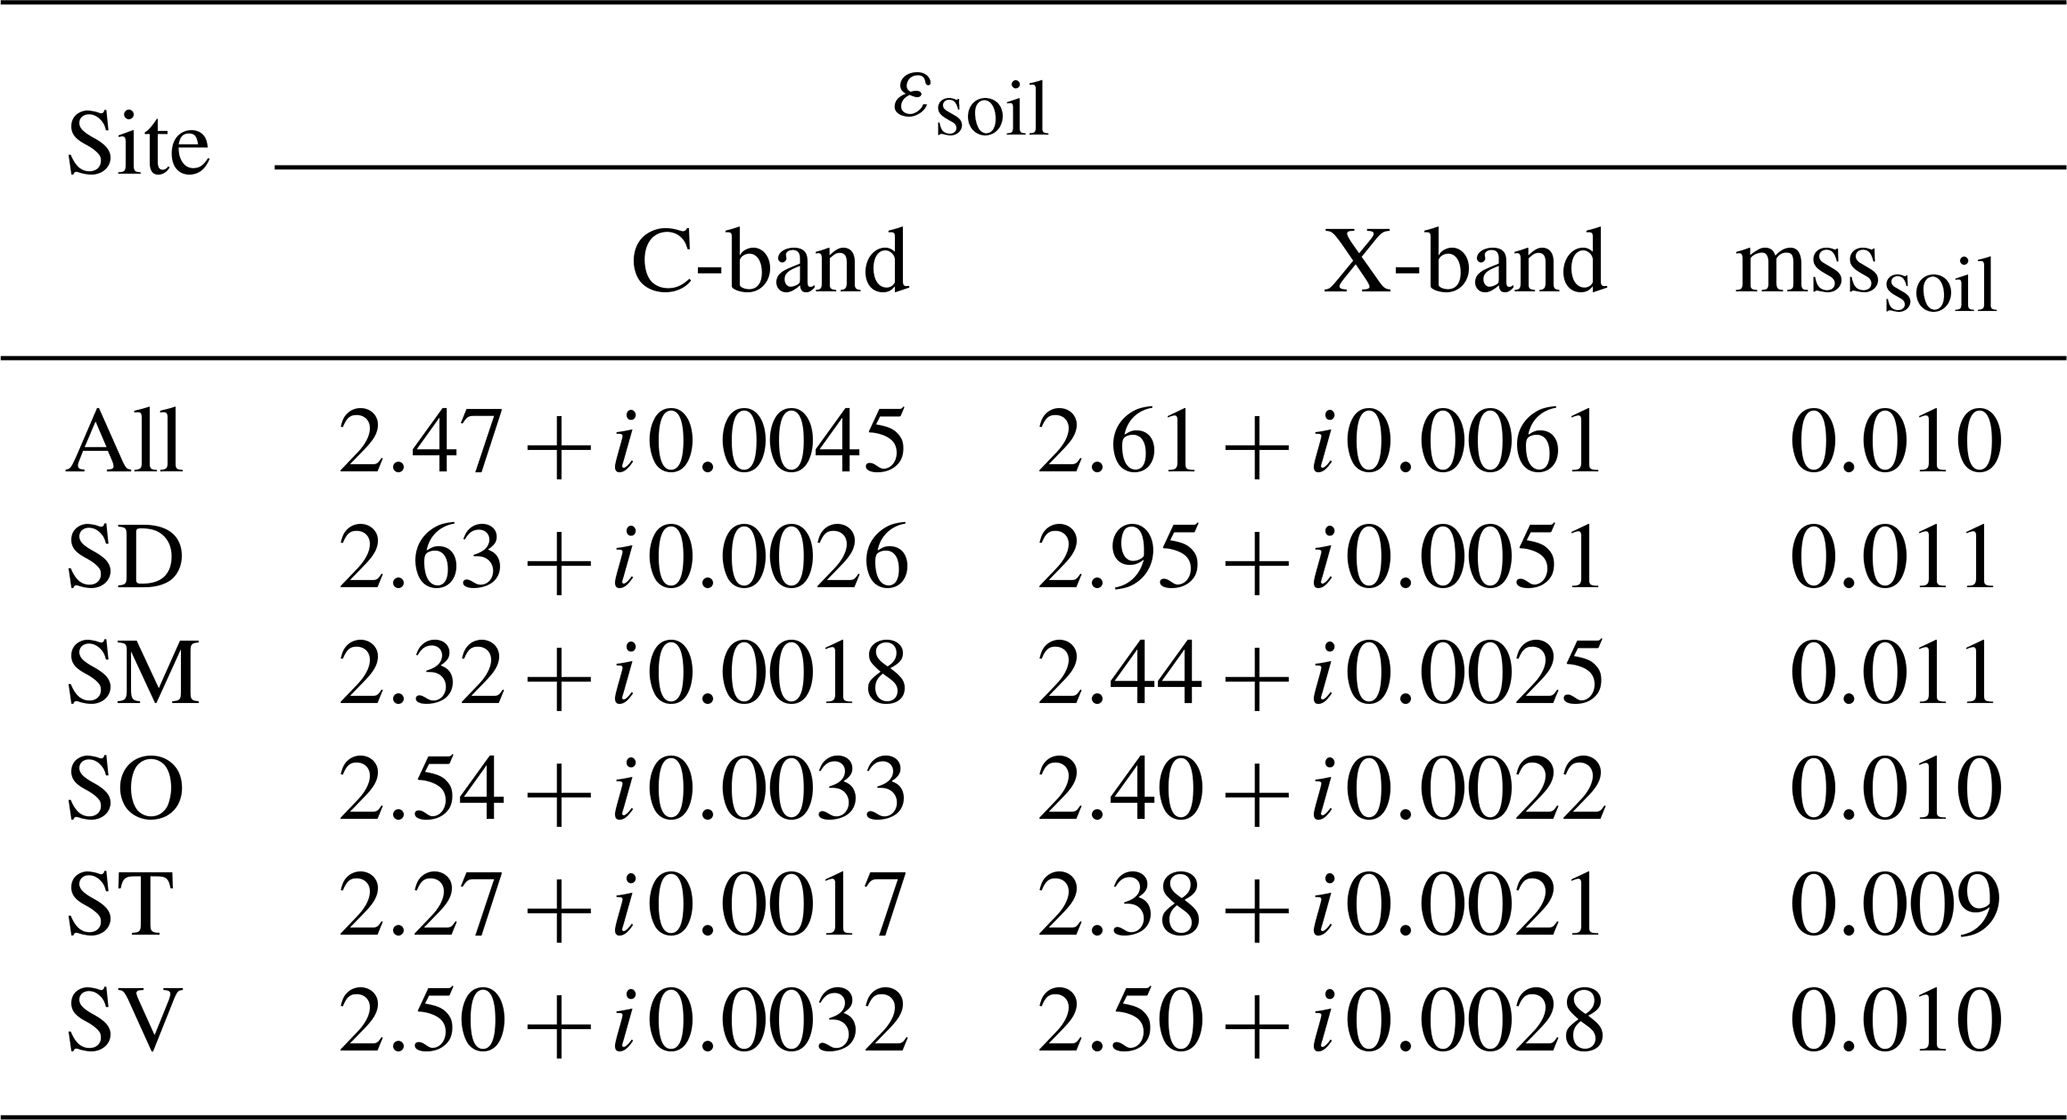
Figure 10 shows the distributions of all the retrieved real εsoil values for all January sites. Both frequencies have very similar distributions with slightly different median values (Table 6). Overall, we get and for C- and X-bands, respectively. Uncertainties were calculated using the standard deviation of the retrieved parameters for all January sites. As shown in Fig. 10, both frequencies have similar uncertainties. The global mean square slope roughness parameter was . Given that the msssoil value is centered at 0.010 with very little variability, this validates the use of a single value for all sites.
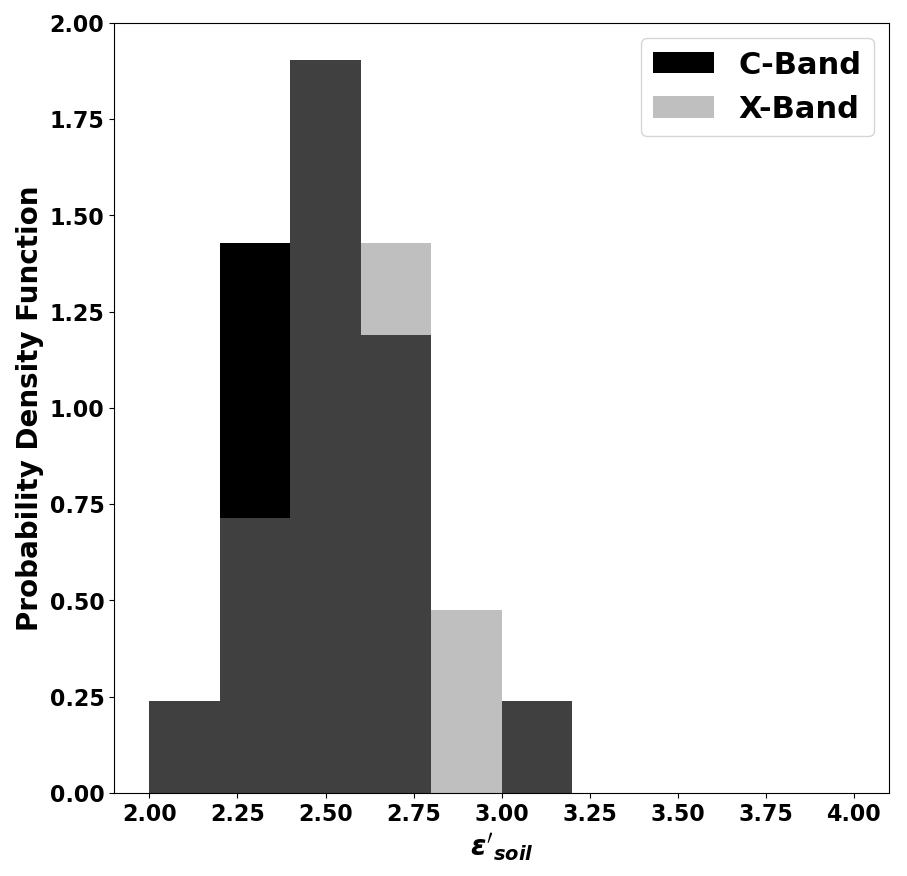
Figure 10Distributions of the retrieved real εsoil for C- and X-band data for all the sites measured during the January campaign.
Figure 11 displays the results between the measured and simulated backscatter values for all snow survey sites of the January campaign for both bands. Figure 11a shows the results when simulating the backscatter with a single set of parameters for the entire domain and Fig. 11b for simulated backscatter using retrieved values for each site individually (distributed values of Fig. 10).
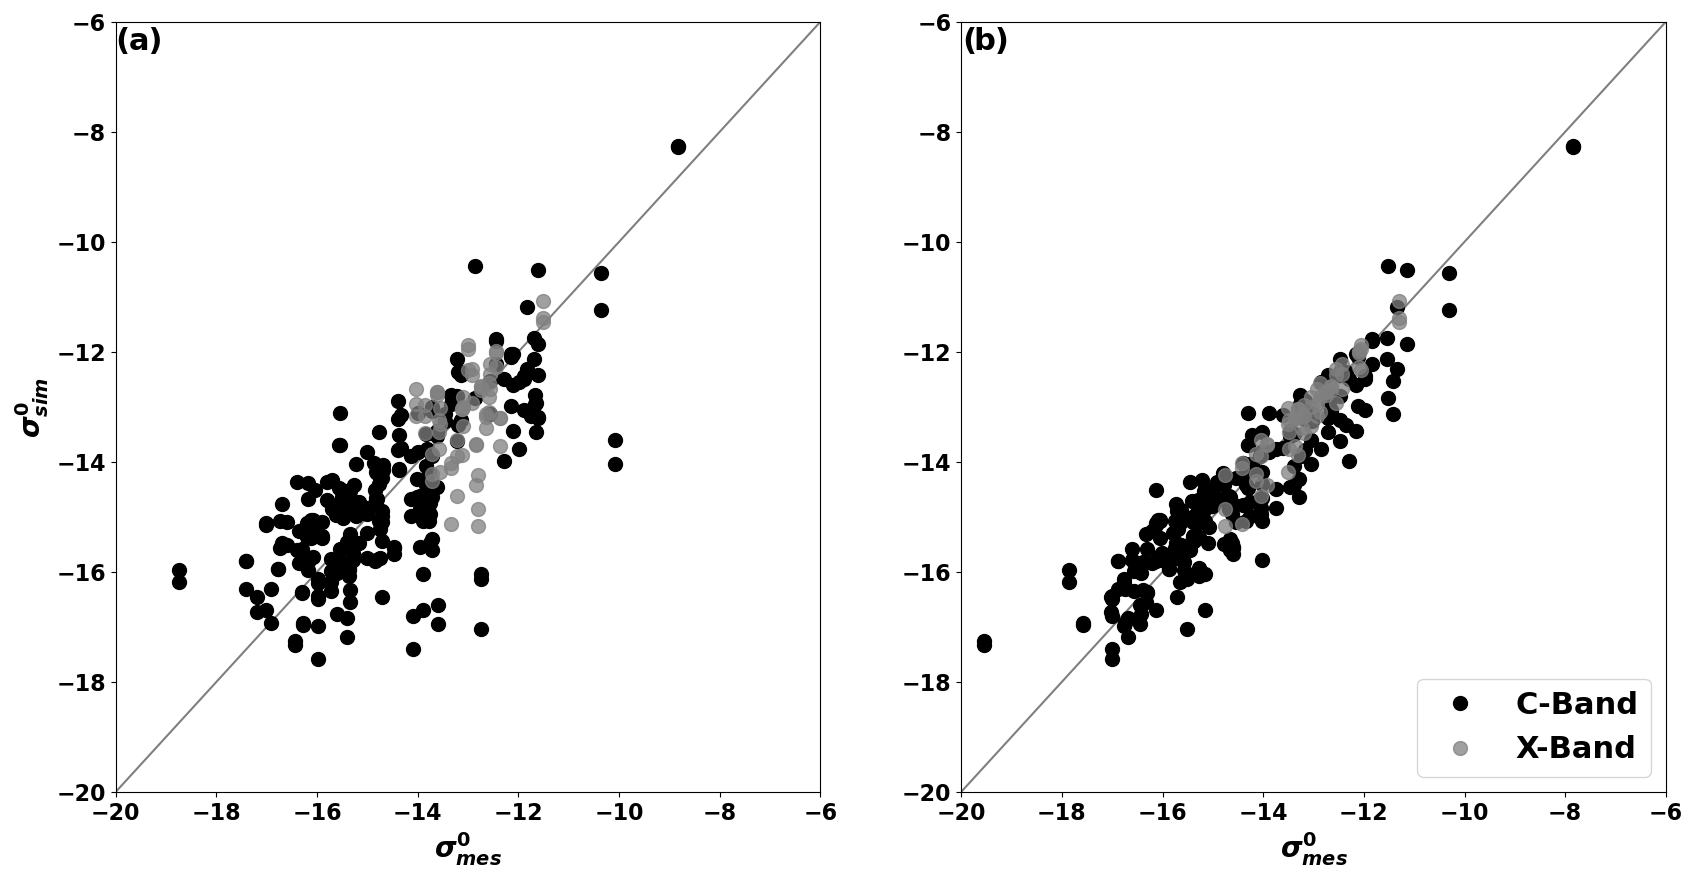
Overall, there is a larger spread in Fig. 11a, which translates into larger errors (RMSE =1.1 dB and bias =0.1 dB and RMSE =0.7 dB and bias =0.0 dB for Fig. 11a and b, respectively).
4.4 Forward modeling of Ku-band backscatter
Since Ku-band data are sensitive to snow volume scattering, polydispersity parameters for the two dominant grain types had to be considered in this optimization process. As shown in Sect. 4.3, the permittivity parameter in the GO soil surface scattering model is frequency-dependent. Since the msssoil is considered independent of frequency, a single parameter was used for all sites (“All” in Table 6). This optimization process thus had four parameters to optimize in total. For the initial permittivity value, the parameter was set by extrapolating from the two previous values retrieved in Sect. 4.3. The same boundaries were set as the optimization at C- and X-bands. The scaling factor ϕ=1.09 obtained by King et al. (2018) for TVC depth-hoar-dominated snowpacks was used as the initial optimization polydispersity value. A slightly wider range of values than those published by Picard et al. (2022) was used to constrain the range of plausible values, i.e. 0.5 to 1 for rounded grains and 1 to 2 for depth hoar compared to 0.6 to 0.9 for rounded grains and 1.2 to 1.9 for Canadian Arctic depth hoar.
Table 7 illustrates the median and standard deviation values of the retrieved parameters over the January sites. Figure 12 shows the distributions of the retrieved parameters.
Table 7Retrieved soil and snow parameters using Ku-band data for January.
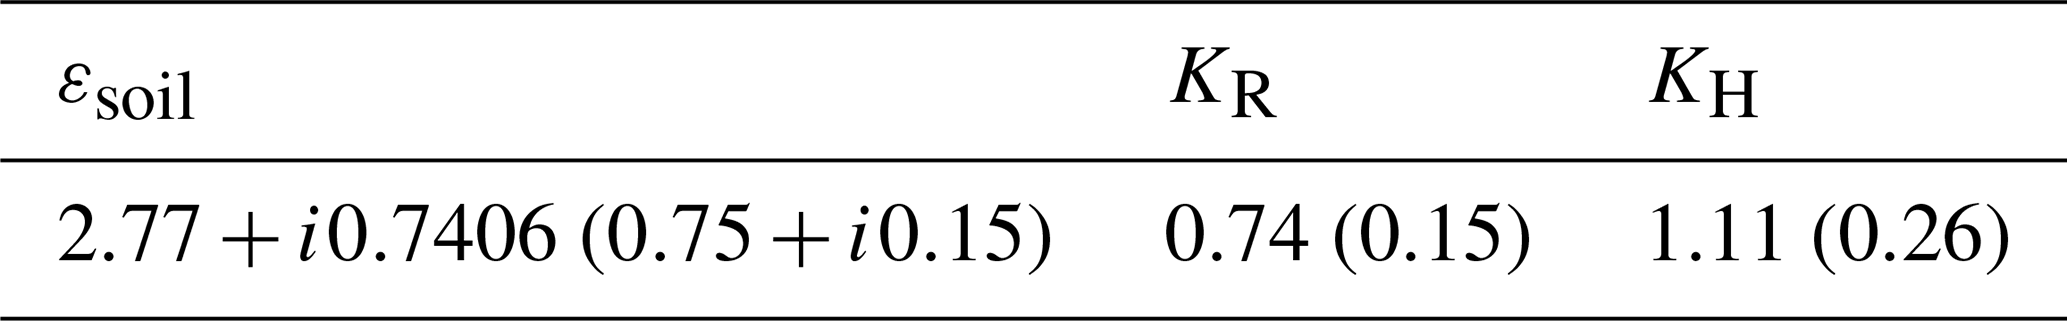
Compared to Fig. 10, there is a much larger spread in distribution of the real part of the εsoil at the Ku-band, and it seems to have two clusters: one centered at 2.41 and the other at 3.82.
For the polydispersity values (K), the values retrieved for the rounded grains (KR) show a distribution centered around 0.74. The values for the depth hoar grains (KH) show a different spread, but most values are centered around 1.11.
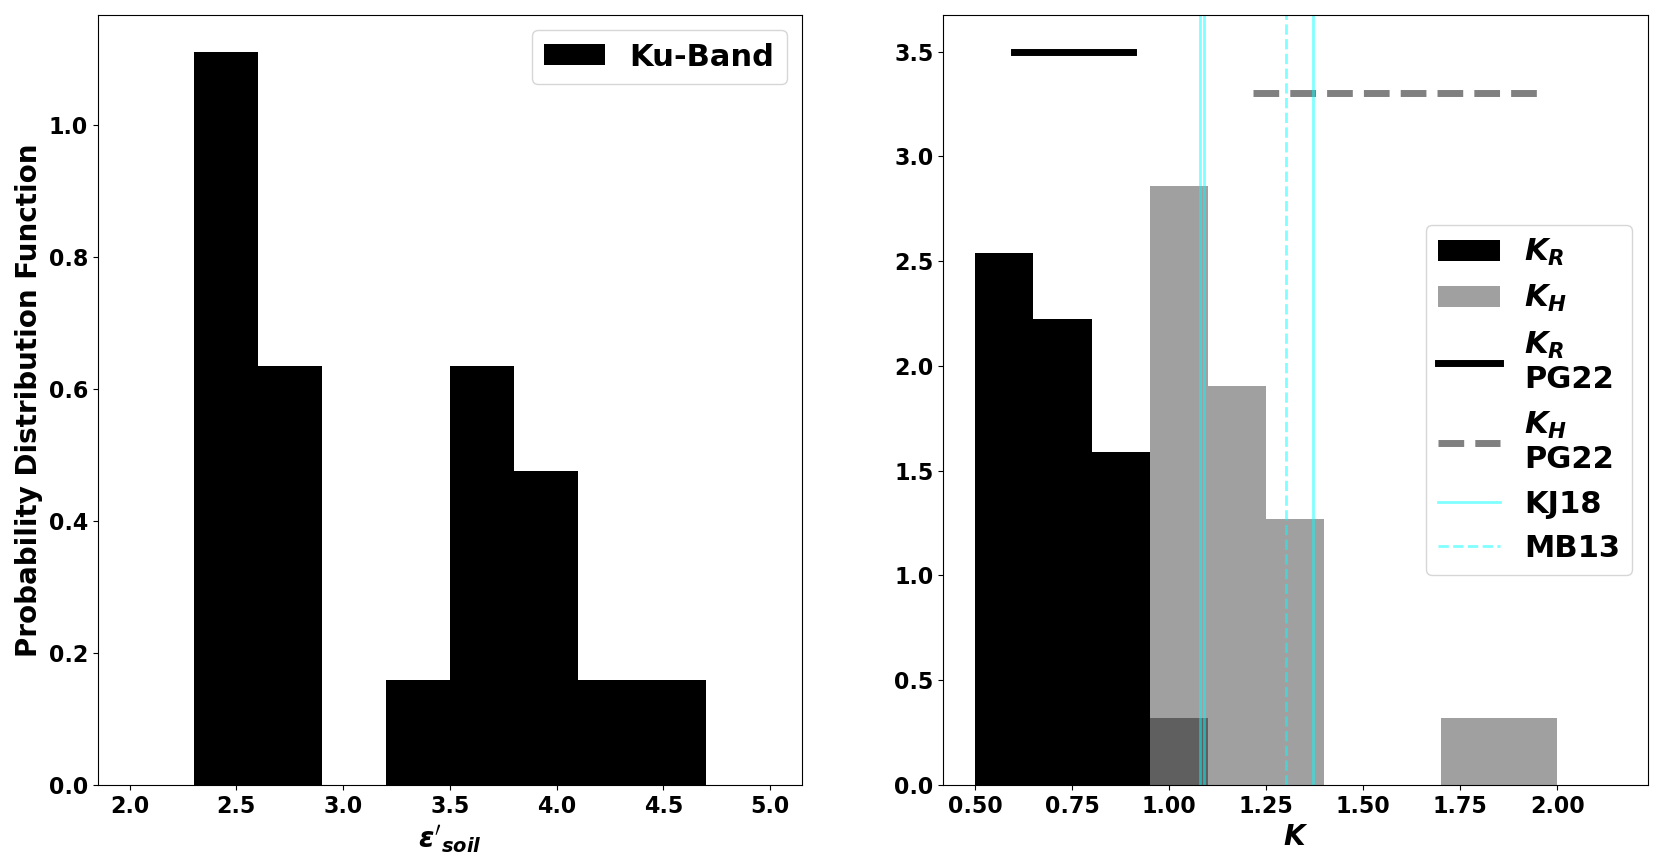
Figure 12Distribution of retrieved parameters at the Ku-band (Table 7). The range of retrieved K values from Picard et al. (2022) for both grain types (PG22) and the different values retrieved by King et al. (2018) and Montpetit et al. (2013) (KJ18 and MB13, respectively) are also displayed.
Figure 13a shows the results when simulating the backscatter with a single set of parameters for all the domain and Fig. 13b for simulated backscatter using retrieved values for each site individually (distributed values of Fig. 12).
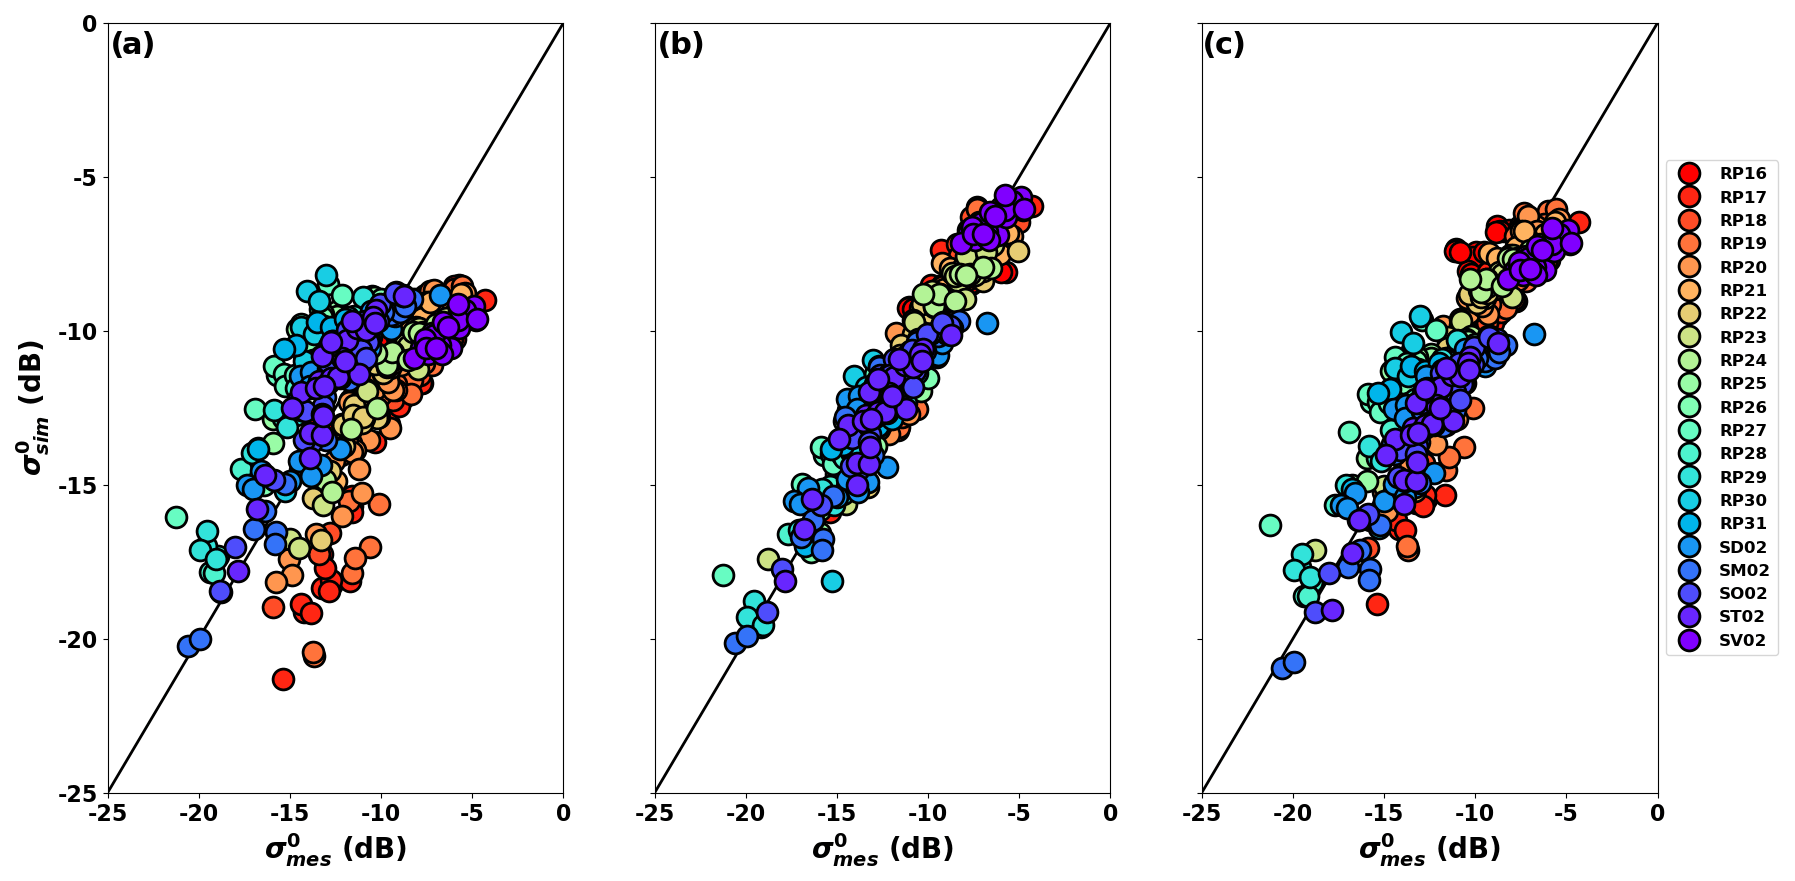
Figure 13Comparison between simulated and measured σ0 at the Ku-band for (a) using a single set of parameters for all sites (Table 7), (b) retrieved parameters for each site individually (distributed values shown in Fig. 12), and (c) the same parameterization as (a) except the median values of of the two clusters of Fig. 12 were used. Colour code corresponds to each surveyed site in January.
Similarly to Fig. 11 there is less spread and better agreement between the simulated and measured σ0 when considering distributed parameterizations instead of a single set of parameters for the entire domain. The mean bias and RMSE are 0.9 and 2.6 dB for Fig. 13a and −0.1 and 0.9 dB for Fig. 13b, respectively. Figure 13c shows the same figure as Fig. 13a but with median values of the two different clusters. These results show less spread and better accuracy (bias =0.0 dB and RMSE =1.3 dB) than a single set of permittivity values for all sites.
5.1 Characterization of snow properties for radar
SMP measurements have become increasingly useful to better characterize spatial variability in the snowpack properties in the field (King et al., 2020; Hagenmuller and Pilloix, 2016; Teich et al., 2019; Tsang et al., 2022). As reported by King et al. (2020), no single method works for every SMP instrument in every study area even though there are different published calibration parameters and methods (Proksch et al., 2015; King et al., 2020; Pielmeier and Schneebeli, 2003). This means that SMP calibration against density and SSA measurements is required for each instrument and field campaign. In this study we show that the approach of King et al. (2020) can retrieve snow density and SSA from SMP profiles rapidly and efficiently given the proper snowpit sampling strategy (Sect. 2.3). For SSA, low values when using the previous work of Calonne et al. (2020) were improved by 6 % overall and 17 % for low SSA values by generating new calibration coefficients for the SMP data.
Snow layers of the SMP profiles were classified into the two dominant snow type categories for the Canadian Arctic (Derksen et al., 2009; Picard et al., 2022) to simplify the generation of statistically representative snowpacks. It should be noted that a fresh snow layer was not considered in this study since it was not present during the January campaign. Having 33 % of the mixed/faceted layers reported by surveyors for the January campaign be classified as depth hoar can be explained by its overlapping SSA and ρsnow distributions (Fig. 9) with the two main grain types. Faceted grains found during the 2018/19 winter season at TVC consist of faceted rounded particles as reported in Picard et al. (2022) for Antarctica and alpine snowpacks, which is why those layers were originally labeled as rounded grains for the classification. The similar distributions between the mixed/faceted grains and the rounded grains also support this assumption. Some solid faceted particles were identified in the mixed/faceted layers surveyed, which might explain the lower SSA distribution compared to rounded grains (Fig. 9). This could also explain why 33 % of the faceted crystals are linked to depth hoar.
The overall evolution of snow depth and depth hoar fraction (Fig. 5) observed throughout the winter season is similar to what was previously reported in studies for TVC (King et al., 2018; Dutch et al., 2022). The SSA and ρsnow distributions during the March campaign might be underestimated. This is due to the difficult surveying conditions due to air temperatures above 0 °C on some survey dates. Warm air temperatures make it difficult to retrieve proper samples for IceCube and density measurements, especially for depth hoar layers as snow sticks to the instruments. Some liquid water content was also present in some snow samples which impacts density and SSA measurements. All these uncertainties result in less accurate calibration of the SMP data. Unfortunately, with the liquid water content potentially present in the snowpack during some radar flights, it will be challenging to validate these snow geophysical properties against Ku-band radar data.
5.2 Forward modeling of C- and X-band backscatter
The fact that with two frequencies the msssoil values all converge towards a single value, i.e. msssoil=0.010, with little variability (18 %) indicates that this value can be used at the satellite and airborne scale for radiative transfer modeling. This value is also identical to the msssoil=0.01 reported by Zhu (2021). Even though the lidar data were not used directly for the backscatter simulations, the retrieved value is in good agreement with the measured median value of 0.011 obtained over the January sites after filtering the extreme values due to noise and anthropogenic sources.
As shown by Tsang and Kong (2001), the GO model is not frequency-dependent, but results indicate that this is due to the permittivity value used in the model. The low variability (7 %) observed in the retrieved permittivity values for both C- and X-bands and the small errors between the simulated and measured backscatter indicate that the intensity signal at these frequencies is not impacted by snow volume scattering for Arctic tundra snowpacks found at TVC. Also, the small variability in permittivities indicate that the ground signal is fairly stable, which suggests the signal penetrates into the soil surface and is less impacted by the variable surface vegetation composition.
5.3 Forward modeling of Ku-band backscatter
Figure 12 shows a large spread of background soil permittivities, which indicates that the Ku-band signal is much more sensitive to the composition of the soil surface than the other two lower frequencies analyzed in this study. In fact, there are two distinct permittivity clusters. The land cover types at the survey sites associated with the lower-value cluster are mostly dominated by lichen and tussocks, whereas the land cover types at the sites with the higher values are mostly dominated by lichen and dwarf shrubs. The results here are in agreement with permittivity values reported by Savin and Mironov (2020), where higher permittivity values were found for sites dominated by shrubs compared to sites dominated by tussocks. Since the retrieved effective permittivities encompass both soil and vegetation, it is possible that the higher permittivity values compensate for higher scattering from the shrubs.
With only three data points, it is difficult to extrapolate the effective permittivity values to higher frequencies using the GO model. Zhu (2021) reported that permittivities should saturate in the Ku- to K-band frequency range using the same background model. This implies that little variability should be observed for permittivities at higher frequencies than at the Ku-band in this study.
The polydispersity (K) values retrieved for both dominant grain types are in agreement with the values reported by Picard et al. (2022). The KR values are normally distributed around 0.74 and range between 0.5 and 1, as established by Mätzler (2002). The values for KH do not really follow a specific distribution and show a wider spread, indicating larger uncertainty on the depth hoar polydispersity. Though no significant relationship was found, the higher values of KH tend to be associated with a higher depth hoar fraction (>0.45). The median value retrieved of 1.11 is also in agreement with grain size correction factors (ϕ), which can now be explained by the polydispersity (Picard et al., 2022), reported by King et al. (2018) and Montpetit et al. (2013) for Canadian Arctic tundra sites. Those studies applied a single correction factor to all layers, and it is known that the microwave snow volume scattering is dominated by the depth hoar layer, which tends to boost the overall polydispersity close to KH in this case. While not investigated in depth in this study, using a single polydispersity value for both grain types resulted in K=1.5, which further supports the dominance of the volume scattering component by the depth hoar layer.
The larger spread and lack of agreement between simulated and measured backscatter values in Fig. 13a can be explained by the model not taking into account the two different clusters of soil permittivity observed in Fig. 12. When using the median values from the two different clusters, there is improved agreement and reduced bias, as confirmed in Fig. 13c. In fact, changing the polydispersity values within the retrieved range did not have a significant impact on the overall error (<0.5 dB improvement of RMSE). This indicates that the lower spectrum of the Ku-band is still sensitive to the background surface scattering even in the presence of snow volume scattering (which was negligible at C- and X-bands). With the saturation effect of the modeled background properties within the Ku-band range, the volume scattering will only become more dominant compared to the background surface scattering. These results show that a distributed, statistical approach for all the retrieved parameters is more suited to forward modeling of the Ku-band signal (Pan et al., 2024) even though this approach is less preferable for satellite observation SWE retrievals (Durand et al., 2024). To improve efficiency in forward modeling computation time, the snowpacks of January were reduced to two layers, i.e. rounded grains and depth hoar layers, where the median value of all the measured data, including magnaprobe, SMP, and snowpits, was considered to generate the geophysical properties of both layers. No significant change was observed in the RMSE (∼7 % difference) between the simulated and observed backscatter values. This further supports the two-layer classification approach used in this study and confirms that two layers are sufficient to represent a Canadian tundra snowpack (Derksen et al., 2012; King et al., 2018).
This study describes in detail the spatio-temporal evolution of snow geophysical properties during the Trail Valley Creek experiment conducted during the winter of 2018/19. It was shown that the snow micropenetrometer is an efficient instrument to quickly and quantitatively determine spatial variability in the vertical snow structure within a given footprint, representative of a single grid cell measurement at satellite scale. It was also demonstrated that the Canadian Arctic tundra snowpack is represented well by a two-layer snowpack consisting of a wind-compacted rounded grain layer and a depth hoar layer.
Using satellite data from RADARSAT-2 and TerraSAR-X, the background soil contribution to measured backscatter was characterized. An RMSE of 0.7 dB was achieved between the simulated and measured backscatter at C- and X-bands using the retrieved background properties. Using the geometrical optics surface backscatter model, we proved that the real part of the effective permittivity tends to increase with frequency.
Following the constraint of the soil background properties, the contribution of snow volume scattering at the Ku-band was also optimized. Using the two-layer classification approach for all the different layers measured by the SMP, we showed that the snow volume scattering was dominated by the depth hoar layer, where KH needed to be increased (∼1.11) and where the KR of the rounded grain layer needed to be reduced (∼ 0.74). An overall RMSE between the simulated and measured backscatter at the Ku-band of 0.9 dB was achieved when using the distributed retrieved values of soil permittivity and snow polydispersity. This confirms that a statistical approach is better suited to reproduce the measured radar backscatter from ground geophysical properties (Pan et al., 2024) than using a single set of values to represent a larger domain such as TVC.
This validates the use of the SMRT model and its different subroutines, i.e. geometrical optics for soil surface backscatter, improved born approximation (IBA) with an exponential autocorrelation function for snow scattering, and the discrete ordinate radiative transfer (DORT) solver, to forward simulate the airborne UMass radar measurements. These results confirm the development direction of the snow water equivalent retrieval algorithm for the future Canadian Terrestrial Snow Mass Mission (TSMM), which will use SMRT simulations.
The fact that the background properties saturate in the Ku-band spectrum further validates the proposed use of the dual-frequency Ku-band (13.5 and 17.25 GHz) TSMM concept. The lower Ku frequency is more sensitive to the background soil properties than the higher Ku frequency, and the fact that the background properties should be similar for both frequencies will allow the ability to isolate the background surface scattering component from the snow volume scattering component of the signal received by a dual-frequency sensor.
Having the two frequencies will also allow for the better estimation of depth hoar fraction using the retrieved polydispersity values from this study. Having a first guess of the snow vertical profiles from a land surface model like the Soil Vegetation Snow Version 2 (SVS-2; Garnaud et al., 2019; Vionnet et al., 2022), using Crocus as the snow model component (Vionnet et al., 2012), should further constrain the plausible snow physical properties within a known distributed range of values, which will allow the measured Ku-band radar backscatter to be related to the bulk SWE values using the SMRT scheme presented in this study.
In order to improve computational efficiency, future work needs to be conducted in order to reduce the number of snow layers of the land surface models to a number of layers relevant to radar radiative transfer modeling, i.e. a “microwave-relevant” snowpack. We have shown that for the snowpack measured at TVC, reducing the number of layers to the two main snow grain types, i.e. depth hoar and rounded grains, is appropriate for skillful forward modeling of the radar signal.
All codes are available at https://github.com/ECCCBen/TVCExp18-19 (last access: 24 July 2024) and https://doi.org/10.5281/zenodo.12750470 (Montpetit and Brady, 2024). Links to the different datasets used will also be provided in the GitHub repository.
The TerraSAR-X data are available through the DLR (© DLR 2019). RADARSAT-2 data and products are from © MacDonald, Dettwiler and Associates Ltd. (2018) – all rights reserved. RADARSAT is an official trademark of the Canadian Space Agency. Though original imagery cannot be accessed publicly due to license agreement, the post-processed data necessary to reproduce this study are publicly available at https://doi.org/10.5281/zenodo.12750470 (Montpetit and Brady, 2024).
BM, JK, and CD wrote the manuscript with contributions from all co-authors. JK designed the experiment. PS, JMA, and his team at UMass developed the airborne radar and processed the data. BM, JK, and JM performed the analysis. BM, JK, CD, and PT collected the field measurements. MB helped write portions of code used and reviewed the codes before publication. AW ordered and provided the TSX data. VV and NRL reviewed the manuscript and provided analysis guidance in the context of the TSMM mission.
At least one of the (co-)authors is a member of the editorial board of The Cryosphere. The peer-review process was guided by an independent editor, and the authors also have no other competing interests to declare.
Publisher's note: Copernicus Publications remains neutral with regard to jurisdictional claims made in the text, published maps, institutional affiliations, or any other geographical representation in this paper. While Copernicus Publications makes every effort to include appropriate place names, the final responsibility lies with the authors.
This work was started and field campaign orchestrated by the late Joshua King. The study was completed by the other co-authors. The authors would like to thank the two anonymous reviewers for their great constructive feedback, which improved this paper. The authors would like to thank the excellent logistical support provided by the Trail Valley Creek station crew, in particular Branden Walker and Philip Marsh. This work would not have been possible without the contribution of many partners including Barum Majumber (WLU), Alexandre Roy (UQTR), Alex Mavrovic (UQTR), Daniel Kramer (UdS), Simon Levasseur (UdS), Max Adam (UMass), Casey Wolieffer (UMass), Nick Rutter (Northumbria U.), Richard Essery (Northumbria U.), Jim Hudgson (Lake Central Aircraft Services), Yves Crevier (CSA), and Simon Yueh (NASA).
This research has been supported by Environment and Climate Change Canada, the Canadian Space Agency, and NASA's THP and ESTO-IIP programs (grant nos. 80NDDC20K1592 and 80NSSC22K0279).
This paper was edited by Carrie Vuyovich and reviewed by two anonymous referees.
Calonne, N., Richter, B., Löwe, H., Cetti, C., ter Schure, J., Van Herwijnen, A., Fierz, C., Jaggi, M., and Schneebeli, M.: The RHOSSA campaign: multi-resolution monitoring of the seasonal evolution of the structure and mechanical stability of an alpine snowpack, The Cryosphere, 14, 1829–1848, https://doi.org/10.5194/tc-14-1829-2020, 2020. a, b, c, d, e
Cho, E., Vuyovich, C. M., Kumar, S. V., Wrzesien, M. L., and Kim, R. S.: Evaluating the utility of active microwave observations as a snow mission concept using observing system simulation experiments, The Cryosphere, 17, 3915–3931, https://doi.org/10.5194/tc-17-3915-2023, 2023. a
Conn, A. R., Scheinberg, K., and Vicente, L. N.: Introduction to Derivative-Free Optimization, SIAM, Chap. 11, 173–205, 2009. a
Derksen, C., Sturm, M., Liston, G., Holmgren, J., Huntington, H., Silis, A., and Solie, D.: Northwest Territories and Nunavut Snow Characteristics from a Subarctic Traverse: Implications for Passive Microwave Remote Sensing, J. Hydrometeorol., 10, 448–463, https://doi.org/10.1175/2008JHM1074.1, 2009. a, b, c
Derksen, C., Smith, S., Sharp, M., Brown, L., Howell, S., Copland, L., Mueller, D., Gauthier, Y., Fletcher, C., Tivy, A., Bernier, M., Bourgeois, J., Brown, R., Burn, C., Duguay, C., Kushner, P., Langlois, A., Lewkowicz, A., Royer, A., and Walker, A.: Variability and Change in the Canadian Cryosphere, Clim. Change, 115, 59–88, https://doi.org/10.1007/s10584-012-0470-0, 2012. a, b
Derksen, C., Lemmetyinen, J., King, J., Belair, S., Garnaud, C., Lapointe, M., Crevier, Y., Burbidge, G., and Siqueira, P.: A Dual-Frequency Ku-Band Radar Mission Concept for Seasonal Snow, in: International Geoscience and Remote Sensing Symposium (IGARSS), 5742–5744, ISBN 978-1-5386-9154-0, https://doi.org/10.1109/IGARSS.2019.8898030, 2019. a, b
Domine, F., Taillandier, A.-S., and Simpson, W.: A Parameterization of the Specific Surface Area of Seasonal Snow for Field Use and for Models of Snowpack Evolution, J. Geophys. Res.-Earth Surf., 112, F02031, https://doi.org/10.1029/2006JF000512, 2007. a
Domine, F., Barrere, M., and Morin, S.: The growth of shrubs on high Arctic tundra at Bylot Island: impact on snow physical properties and permafrost thermal regime, Biogeosciences, 13, 6471–6486, https://doi.org/10.5194/bg-13-6471-2016, 2016. a
Duguay, Y. and Bernier, M.: The Use of RADARSAT-2 and TerraSAR-X Data for the Evaluation of Snow Characteristics in Subarctic Regions, in: 2012 IEEE International Geoscience and Remote Sensing Symposium, 3556–3559, ISSN 2153-7003, https://doi.org/10.1109/IGARSS.2012.6350650, 2012. a
Durand, M., Johnson, J. T., Dechow, J., Tsang, L., Borah, F., and Kim, E. J.: Retrieval of snow water equivalent from dual-frequency radar measurements: using time series to overcome the need for accurate a priori information, The Cryosphere, 18, 139–152, https://doi.org/10.5194/tc-18-139-2024, 2024. a, b
Dutch, V. R., Rutter, N., Wake, L., Sandells, M., Derksen, C., Walker, B., Hould Gosselin, G., Sonnentag, O., Essery, R., Kelly, R., Marsh, P., King, J., and Boike, J.: Impact of measured and simulated tundra snowpack properties on heat transfer, The Cryosphere, 16, 4201–4222, https://doi.org/10.5194/tc-16-4201-2022, 2022. a, b
Fierz, C., Armstrong, R., Durand, Y., Etchevers, P., Greene, E., Mcclung, D., Nishimura, K., Satyawali, P., and Sokratov, S.: The International Classification for Seasonal Snow on the Ground (UNESCO, IHP (International Hydrological Programme)–VII, Technical Documents in Hydrology, No 83; IACS (International Association of Cryospheric Sciences) Contribution No 1), 2009. a
Gallet, J.-C., Domine, F., Zender, C. S., and Picard, G.: Measurement of the specific surface area of snow using infrared reflectance in an integrating sphere at 1310 and 1550 nm, The Cryosphere, 3, 167–182, https://doi.org/10.5194/tc-3-167-2009, 2009. a
Garnaud, C., Bélair, S., Carrera, M., Derksen, C., Bilodeau, B., Abrahamowicz, M., Gauthier, N., and Vionnet, V.: Quantifying Snow Mass Mission Concept Trade-Offs Using an Observing System Simulation Experiment, J. Hydrometeorol., 20, 155–173, https://doi.org/10.1175/JHM-D-17-0241.1, 2019. a, b
Garnaud, C., Vionnet, V., Gaborit, É., Fortin, V., Bilodeau, B., Carrera, M., and Durnford, D.: Improving Snow Analyses for Hydrological Forecasting at Eccc Using Satellite-Derived Data, Remote Sens., 13, 5022, https://doi.org/10.3390/rs13245022, 2021. a
Grünberg, I. and Boike, J.: Vegetation Map of Trail Valley Creek, Northwest Territories, Canada, PANGAEA [data set], https://doi.org/10.1594/PANGAEA.904270, 2019. a, b
Hagenmuller, P. and Pilloix, T.: A New Method for Comparing and Matching Snow Profiles, Application for Profiles Measured by Penetrometers, Front. Earth Sci., 4, 52, https://doi.org/10.3389/feart.2016.00052, 2016. a
Kim, R. S., Kumar, S., Vuyovich, C., Houser, P., Lundquist, J., Mudryk, L., Durand, M., Barros, A., Kim, E. J., Forman, B. A., Gutmann, E. D., Wrzesien, M. L., Garnaud, C., Sandells, M., Marshall, H.-P., Cristea, N., Pflug, J. M., Johnston, J., Cao, Y., Mocko, D., and Wang, S.: Snow Ensemble Uncertainty Project (SEUP): quantification of snow water equivalent uncertainty across North America via ensemble land surface modeling, The Cryosphere, 15, 771–791, https://doi.org/10.5194/tc-15-771-2021, 2021. a
King, J., Derksen, C., Toose, P., Langlois, A., Larsen, C., Lemmetyinen, J., Marsh, P., Montpetit, B., Roy, A., Rutter, N., and Sturm, M.: The Influence of Snow Microstructure on Dual-Frequency Radar Measurements in a Tundra Environment, Remote Sens. Environ., 215, 242–254, https://doi.org/10.1016/j.rse.2018.05.028, 2018. a, b, c, d, e, f, g, h, i
King, J., Howell, S., Brady, M., Toose, P., Derksen, C., Haas, C., and Beckers, J.: Local-scale variability of snow density on Arctic sea ice, The Cryosphere, 14, 4323–4339, https://doi.org/10.5194/tc-14-4323-2020, 2020. a, b, c, d, e, f, g, h, i
Lange, S., Grünberg, I., Anders, K., Hartmann, J., Helm, V., and Boike, J.: Airborne Laser Scanning (ALS) Point Clouds of Trail Valley Creek, NWT, Canada (2018), PANGAEA [data set], https://doi.org/10.1594/PANGAEA.934387, 2021. a
Lemmetyinen, J., Derksen, C., Rott, H., Macelloni, G., King, J., Schneebeli, M., Wiesmann, A., Leppänen, L., Kontu, A., and Pulliainen, J.: Retrieval of Effective Correlation Length and Snow Water Equivalent from Radar and Passive Microwave Measurements, Remote Sens., 10, 170, https://doi.org/10.3390/rs10020170, 2018. a, b
Lemmetyinen, J., Cohen, J., Kontu, A., Vehviläinen, J., Hannula, H.-R., Merkouriadi, I., Scheiblauer, S., Rott, H., Nagler, T., Ripper, E., Elder, K., Marshall, H.-P., Fromm, R., Adams, M., Derksen, C., King, J., Meta, A., Coccia, A., Rutter, N., Sandells, M., Macelloni, G., Santi, E., Leduc-Leballeur, M., Essery, R., Menard, C., and Kern, M.: Airborne SnowSAR data at X and Ku bands over boreal forest, alpine and tundra snow cover, Earth Syst. Sci. Data, 14, 3915–3945, https://doi.org/10.5194/essd-14-3915-2022, 2022. a, b
Löwe, H. and van Herwijnen, A.: A Poisson Shot Noise Model for Micro-Penetration of Snow, Cold Reg. Sci. Technol., 70, 62–70, https://doi.org/10.1016/j.coldregions.2011.09.001, 2012. a
Luojus, K., Pulliainen, J., Takala, M., Lemmetyinen, J., Mortimer, C., Derksen, C., Mudryk, L., Moisander, M., Hiltunen, M., Smolander, T., Ikonen, J., Cohen, J., Salminen, M., Norberg, J., Veijola, K., and Venäläinen, P.: GlobSnow v3.0 Northern Hemisphere Snow Water Equivalent Dataset, Sci. Data, 8, https://doi.org/10.1038/s41597-021-00939-2, 2021. a
Marshall, H.-P. and Johnson, J.: Accurate Inversion of High-Resolution Snow Penetrometer Signals for Microstructural and Micromechanical Properties, J. Geophys. Res.-Earth Surf., 114, 163, https://doi.org/10.1029/2009JF001269, 2009. a
Mätzler, C.: Relation between Grain-Size and Correlation Length of Snow, J. Glaciol., 48, 461–466, https://doi.org/10.3189/172756502781831287, 2002. a
Meloche, J., Royer, A., Langlois, A., Rutter, N., and Sasseville, V.: Improvement of Microwave Emissivity Parameterization of Frozen Arctic Soils Using Roughness Measurements Derived from Photogrammetry, Int. J. Digit. Earth, 14, 1380–1396, https://doi.org/10.1080/17538947.2020.1836049, 2021. a, b, c, d
Merkouriadi, I., Lemmetyinen, J., Liston, G., and Pulliainen, J.: Solving Challenges of Assimilating Microwave Remote Sensing Signatures With a Physical Model to Estimate Snow Water Equivalent, Water Resour. Res., 57, e2021WR030119, https://doi.org/10.1029/2021WR030119, 2021. a
Montpetit, B. and Brady, M.: ECCCBen/TVCExp18-19: TVC Experiment 2018/19 (0.0.0), Zenodo [code and data set], https://doi.org/10.5281/zenodo.12750470, 2024. a, b
Montpetit, B., Royer, A., Roy, A., Langlois, A., and Derksen, C.: Snow Microwave Emission Modeling of Ice Lenses within a Snowpack Using the Microwave Emission Model for Layered Snowpacks, IEEE T. Geosci. Remote, 51, 4705–4717, https://doi.org/10.1109/TGRS.2013.2250509, 2013. a, b
Montpetit, B., Royer, A., Roy, A., and Langlois, A.: In-Situ Passive Microwave Emission Model Parameterization of Sub-Arctic Frozen Organic Soils, Remote Sens. Environ., 205, 112–118, https://doi.org/10.1016/j.rse.2017.10.033, 2018. a, b
Pan, J., Durand, M., Lemmetyinen, J., Liu, D., and Shi, J.: Snow water equivalent retrieved from X- and dual Ku-band scatterometer measurements at Sodankylä using the Markov Chain Monte Carlo method, The Cryosphere, 18, 1561–1578, https://doi.org/10.5194/tc-18-1561-2024, 2024. a, b, c, d
Picard, G., Sandells, M., and Löwe, H.: SMRT: an active–passive microwave radiative transfer model for snow with multiple microstructure and scattering formulations (v1.0), Geosci. Model Dev., 11, 2763–2788, https://doi.org/10.5194/gmd-11-2763-2018, 2018. a, b
Picard, G., Löwe, H., Domine, F., Arnaud, L., Larue, F., Favier, V., Le Meur, E., Lefebvre, E., Savarino, J., and Royer, A.: The Microwave Snow Grain Size: A New Concept to Predict Satellite Observations Over Snow-Covered Regions, AGU Adv., 3, e2021AV000630, https://doi.org/10.1029/2021AV000630, 2022. a, b, c, d, e, f, g, h, i
Pielmeier, C. and Schneebeli, M.: Stratigraphy and Changes in Hardness of Snow Measured by Hand, Ramsonde and Snow Micro Penetrometer: A Comparison with Planar Sections, Cold Reg. Sci. Technol., 37, 393–405, https://doi.org/10.1016/S0165-232X(03)00079-X, 2003. a, b
Porter, C., Howat, I., Noh, M.-J., Husby, E., Khuvis, S., Danish, E., Tomko, K., Gardiner, J., Negrete, A., Yadav, B., Klassen, J., Kelleher, C., Cloutier, M., Bakker, J., Enos, J., Arnold, G., Bauer, G., and Morin, P.: ArcticDEM - Mosaics, Version 4.1, Harvard Dataverse [data set], https://doi.org/10.7910/DVN/3VDC4W, 2023. a
Proksch, M., Löwe, H., and Schneebeli, M.: Density, Specific Surface Area, and Correlation Length of Snow Measured by High-Resolution Penetrometry, J. Geophys. Res.-Earth Surf., 120, 346–362, https://doi.org/10.1002/2014JF003266, 2015. a, b, c, d
Pulliainen, J. and Grandell: HUT Snow Emission Model and Its Applicability to Snow Water Equivalent Retrieval, IEEE T. Geosci. Remote, 37, 1378–1390, https://doi.org/10.1109/36.763302, 1999. a
Rott, H., Yueh, S., Cline, D., Duguay, C., Essery, R., Haas, C., Heliere, F., Kern, M., MacElloni, G., Malnes, E., Nagler, T., Pulliainen, J., Rebhan, H., and Thompson, A.: Cold Regions Hydrology High-Resolution Observatory for Snow and Cold Land Processes, Proc. IEEE, 98, 752–765, https://doi.org/10.1109/JPROC.2009.2038947, 2010. a, b
Rott, H., Nagler, T., Voglmeier, K., Kern, M., MacElloni, G., Gai, M., Cortesi, U., Scheiber, R., Hajnsek, I., Pulliainen, J., and Flach, D.: Algorithm for Retrieval of Snow Mass from Ku- and X-band Radar Backscatter Measurements, in: International Geoscience and Remote Sensing Symposium (IGARSS), 135–138, https://doi.org/10.1109/IGARSS.2012.6350911, 2012. a, b
Rutter, N., Sandells, M. J., Derksen, C., King, J., Toose, P., Wake, L., Watts, T., Essery, R., Roy, A., Royer, A., Marsh, P., Larsen, C., and Sturm, M.: Effect of snow microstructure variability on Ku-band radar snow water equivalent retrievals, The Cryosphere, 13, 3045–3059, https://doi.org/10.5194/tc-13-3045-2019, 2019. a, b, c
Sandells, M., Löwe, H., Picard, G., Dumont, M., Essery, R., Floury, N., Kontu, A., Lemmetyinen, J., Maslanka, W., Morin, S., Wiesmann, A., and Mätzler, C.: X-Ray Tomography-Based Microstructure Representation in the Snow Microwave Radiative Transfer Model, IEEE T. Geosci. Remote, 60, 1–15, https://doi.org/10.1109/TGRS.2021.3086412, 2022. a
Santi, E., Paloscia, S., Pettinato, S., Notarnicola, C., Cuozzo, G., de Gregorio, L., Cigna, F., and Tapete, D.: Snow Water Equivalent Retrieval from COSMO-SkyMed Observations Through Machine Learning Algorithms and Model Simulations, in: International Geoscience and Remote Sensing Symposium (IGARSS), 5473–5476, https://doi.org/10.1109/IGARSS47720.2021.9553985, 2021. a
Savin, I. and Mironov, V.: Dielectric Spectra of Thawed and Frozen Wet Organic Arctic Soils, Zenodo [data set], https://doi.org/10.5281/zenodo.3819912, 2020. a
Shi, X., Marsh, P., and Yang, D.: Warming Spring Air Temperatures, but Delayed Spring Streamflow in an Arctic Headwater Basin, Environ. Res. Lett., 10, 064003, https://doi.org/10.1088/1748-9326/10/6/064003, 2015. a
Singh, S., Durand, M., Kim, E., Pan, J., Kang, D., and Barros, A.: A Physical-Statistical Retrieval Framework to Estimate SWE from X and Ku-Band SAR Observations, in: International Geoscience and Remote Sensing Symposium (IGARSS), vol. 2023-July, 17–20, ISBN 9798350320107, https://doi.org/10.1109/IGARSS52108.2023.10281838, 2023. a
Siqueira, P., Adam, M., Kraatz, S., Lagoy, D., Tarres, M. C., Tsang, L., Zhu, J., Derksen, C., and King, J.: A Ku-Band Airborne InSAR for Snow Characterization at Trail Valley Creek, in: 2021 IEEE International Geoscience and Remote Sensing Symposium IGARSS, 2146–2149, ISSN 2153-7003, https://doi.org/10.1109/IGARSS47720.2021.9554888, 2021. a, b
Sturm, M. and Holmgren, J.: An Automatic Snow Depth Probe for Field Validation Campaigns, Water Resour. Res., 54, 9695–9701, https://doi.org/10.1029/2018WR023559, 2018. a
Teich, M., Giunta, A. D., Hagenmuller, P., Bebi, P., Schneebeli, M., and Jenkins, M. J.: Effects of Bark Beetle Attacks on Forest Snowpack and Avalanche Formation – Implications for Protection Forest Management, Forest Ecol. Manage., 438, 186–203, https://doi.org/10.1016/j.foreco.2019.01.052, 2019. a
Tsang, L. and Kong, J. A.: Scattering of Electromagnetic Waves: Advanced Topics, Wiley, 432 pp., ISBN 978-0-471-46379-5, https://www.wiley.com/en-us/Scattering+of+Electromagnetic+Waves%3A+Advanced+Topics-p-9780471463795 (last access: 14 December 2023), 2001. a, b
Tsang, L., Pan, J., Liang, D., Li, Z., Cline, D., and Tan, Y.: Modeling Active Microwave Remote Sensing of Snow Using Dense Media Radiative Transfer (DMRT) Theory with Multiple-Scattering Effects, IEEE T. Geosci. Remote, 45, 990–1004, https://doi.org/10.1109/TGRS.2006.888854, 2007. a
Tsang, L., Durand, M., Derksen, C., Barros, A. P., Kang, D.-H., Lievens, H., Marshall, H.-P., Zhu, J., Johnson, J., King, J., Lemmetyinen, J., Sandells, M., Rutter, N., Siqueira, P., Nolin, A., Osmanoglu, B., Vuyovich, C., Kim, E., Taylor, D., Merkouriadi, I., Brucker, L., Navari, M., Dumont, M., Kelly, R., Kim, R. S., Liao, T.-H., Borah, F., and Xu, X.: Review article: Global monitoring of snow water equivalent using high-frequency radar remote sensing, The Cryosphere, 16, 3531–3573, https://doi.org/10.5194/tc-16-3531-2022, 2022. a, b, c, d, e
Vionnet, V., Brun, E., Morin, S., Boone, A., Faroux, S., Le Moigne, P., Martin, E., and Willemet, J.-M.: The detailed snowpack scheme Crocus and its implementation in SURFEX v7.2, Geosci. Model Dev., 5, 773–791, https://doi.org/10.5194/gmd-5-773-2012, 2012. a
Vionnet, V., Verville, M., Fortin, V., Brugman, M., Abrahamowicz, M., Lemay, F., Thériault, J., Lafaysse, M., and Milbrandt, J.: Snow Level From Post-Processing of Atmospheric Model Improves Snowfall Estimate and Snowpack Prediction in Mountains, Water Resour. Res., 58, e2021WR031778, https://doi.org/10.1029/2021WR031778, 2022. a
Wilcox, E. J., Wolfe, B. B., and Marsh, P.: Assessing the influence of lake and watershed attributes on snowmelt bypass at thermokarst lakes, Hydrol. Earth Syst. Sci., 26, 6185–6205, https://doi.org/10.5194/hess-26-6185-2022, 2022. a
Xu, X., Tsang, L., and Yueh, S.: Electromagnetic Models of Co/Cross Polarization of Bicontinuous/DMRT in Radar Remote Sensing of Terrestrial Snow at X- and Ku-band for CoReH2O and SCLP Applications, IEEE J. Sel. Top. Appl. Earth Obs., 5, 1024–1032, https://doi.org/10.1109/JSTARS.2012.2190719, 2012. a
Zhu, J.: Surface and Volume Scattering Model in Microwave Remote Sensing of Snow and Soil Moisture, Thesis, https://doi.org/10.7302/3871, 2021. a, b
Zhu, J., Tan, S., Tsang, L., Kang, D.-H., and Kim, E.: Snow Water Equivalent Retrieval Using Active and Passive Microwave Observations, Water Resour. Res., 57, e2020WR027563, https://doi.org/10.1029/2020WR027563, 2021. a, b