the Creative Commons Attribution 4.0 License.
the Creative Commons Attribution 4.0 License.
A study of sea ice topography in the Weddell and Ross seas using dual-polarimetric TanDEM-X imagery
Irena Hajnsek
The total freeboard, which is the ice layer above water level and includes the snow thickness, is needed to retrieve the ice thickness and ice surface topography. Single-pass interferometric synthetic aperture radar (InSAR) allows for the generation of digital elevation models (DEMs) over the drifting sea ice. However, accurate sea ice DEMs (i.e., the total freeboard) derived from InSAR are impeded due to variation in the penetration of the radar signals into the snow and ice layers. This research introduces a novel methodology for retrieving sea ice DEMs using dual-polarization interferometric SAR images, considering the variation in radar penetration bias across multiple ice types. The accuracy of the method is verified through photogrammetric measurements, demonstrating that the derived DEM has a root-mean-square error of 0.26 m over a 200 km × 19 km area. The method is further applied to broader regions in the Weddell Sea and the Ross Sea, offering new insights into the regional variations of the sea ice topography in the Antarctic. We also characterize the non-Gaussian statistical behavior of the total freeboard using log-normal and exponential-normal distributions. The results suggest that the exponential-normal distribution is superior in the thicker-sea-ice region (average total freeboard > 0.5 m), whereas the two distributions exhibit similar performance in the thinner-ice region (average total freeboard < 0.5 m). These findings offer an in-depth representation of the total freeboard and roughness in the Weddell and Ross seas. The novel methodology introduced here can be conducted on time series data to comprehend the dynamics of the sea ice, including its growth and deformation.
- Article
(10725 KB) - Full-text XML
- BibTeX
- EndNote
The sea ice topography refers to the shape, height, and large-scale roughness of sea ice at the meter scale. It encompasses a variety of ice features, including rafted ice, ridges, rubble fields, and hummocks, all of which contribute to the intricate nature of the sea ice topography (Weeks and Ackley, 1986). The presence of snow cover atop the ice surface further influences the topographic characteristics, adding another layer of complexity to the overall sea ice topography (Massom et al., 2001).
The sea ice surface topography plays a crucial role in understanding sea ice dynamics and interactions within the air–ocean–ice system. It determines the spatial distribution of distinct surface features such as snow dunes (Trujillo et al., 2016; Iacozza and Barber, 1999) and deformed ice (Haas et al., 1999; Petty et al., 2016), which are impacted by the forces from winds and currents. Moreover, the atmospheric drag coefficient over sea ice, which is topography dependent, is an important parameter for understanding interactions at the ice–atmosphere boundary (Garbrecht et al., 2002; Castellani et al., 2014).
The sea ice topography can be described through a digital elevation model (DEM), which refers to the total freeboard (snow + ice) above the local sea surface. The DEM (i.e., total freeboard) can be converted to the thickness if the snow depth is known and the values of the snow, ice, and seawater densities are assumed (Kwok and Kacimi, 2018). Estimating sea ice thickness over time offers valuable insights into the overall stability of sea ice in the changing climate. Furthermore, mapping the sea ice topography is paramount for safe navigation in polar oceans. By providing information on ice deformation and identifying safe routes, accurate sea ice topography maps contribute to ensuring the safety and efficiency of ship navigation in challenging environments (Dammann et al., 2017).
Sea ice DEMs can be obtained using laser altimeters mounted on different platforms, including helicopters (Dierking, 1995), aircraft such as IceBridge (Petty et al., 2016), and satellites like ICESat-1 (Zwally et al., 2008) and ICESat-2 (Kacimi and Kwok, 2020). These laser altimeters provide high spatial resolution (< 1 m) when measuring the total freeboard. However, limited spatial coverage and long revisit times (e.g., 91 d for ICESat-2) restrict their capacity for consistent and comprehensive sea ice monitoring. In recent decades, synthetic aperture radar (SAR) has been of significant importance for Earth observation as it offers a balance between spatial resolution (meters to tens of meters) and swath coverage (tens to hundreds of kilometers). SAR is unaffected by weather conditions or daylight limitations, enabling consistent data acquisition with a revisit time of around 10 days. Notably, the single-pass interferometric SAR (InSAR) sensor, exemplified by TanDEM-X, presents an unprecedented opportunity to generate sea ice DEMs over landfast sea ice (Dierking et al., 2017; Yitayew et al., 2018). For drifting ice, the accuracy of InSAR-derived DEMs can be affected by additional phase shifts induced by ice motion. Dierking et al. (2017) calculated and theoretically discussed the sensitivity of InSAR-derived DEMs concerning the drifting velocity of the ice, the InSAR frequency, and the baseline configuration.
Nevertheless, an InSAR-derived DEM can be affected by the variation in the penetration of microwaves into the snow and ice layers. Dry snow can have penetration depths of up to hundreds of wavelengths (Guneriussen et al., 2001). For X-band SAR, the penetration into younger ice, such as new and first-year ice, is minimal due to the high salinity of the ice surface (Hallikainen and Winebrenner, 1992). On the other hand, for older and desalinated ice, such as multi-year ice, the penetration depth varies from 0–1 m depending on the temperature and salinity (Hallikainen and Winebrenner, 1992; Huang et al., 2021). To account for the mechanism of the scattering from the volumes (snow and ice) and layers (snow–ice–water interfaces), a two-layer-plus-volume (TLPV) model (Huang et al., 2021) has been developed to determine the penetration depth over snow-covered old ice in the Antarctic. This model improves the precision of sea ice topographic mapping by offsetting the InSAR phase center to the top surface.
SAR polarimetry complements interferometry by providing valuable insights into scattering processes and has proven useful for characterizing sea ice properties (Winebrenner et al., 1995; Ressel et al., 2016; Singha et al., 2018). For old and deformed ice, a radar theory has been developed to examine the relationship between scattering mechanisms and the sea ice DEM (Nghiem et al., 2022), resulting in a geophysical model function based on co-polarimetric coherence for retrieving the sea ice DEM (Huang et al., 2022). These findings emphasize the significance of integrating polarimetric and interferometric information for accurate sea ice topography mapping using SAR imagery.
Given the variations in the microwaves' penetration depth into snow and ice, the capacity to derive a sea ice DEM from SAR imagery over a broad spatial scale encompassing diverse ice types is still constrained. In this study, we develop an innovative two-step method to generate a sea ice DEM across multiple ice types using machine learning and polarimetric-interferometry SAR techniques. The initial step involves the development of a random-forest classifier using specific SAR features to categorize sea ice into two groups, small-penetration-condition ice (SPI) and large-penetration-condition ice (LPI), based on the penetration depth of microwaves into the snow and ice. Subsequently, a sea ice DEM is created for each ice type. In the case of SPI, standard InSAR processing is applied to determine the total freeboard. For LPI, a novel inversion algorithm is proposed to estimate the parameters of the developed TLPV model (Huang et al., 2021). This model allows for the correction of the penetration bias in the InSAR signal over LPI, resulting in accurate retrieval of the total freeboard. We validate the proposed method against the photogrammetric DEM from the IceBridge aircraft. A root-mean-square error (RMSE) of 0.26 m between the derived DEM and reference data indicates an improved accuracy of total freeboard retrieval.
We further apply the proposed two-step approach to 162 SAR images covering 12 segments (each covering an area of ∼ 500 km × 20 km) in the Weddell and Ross seas. This allows broad mapping of the sea ice DEM and roughness, offering new insights into the topographic patterns of sea ice at a large spatial scale. Note that the roughness in this study refers to the macroscale roughness, which is defined as the standard deviation of the total freeboard within a 50 m × 50 m window. We analyze the variation in sea ice DEM and roughness in the southwards direction and associate it with the variation in sea ice classes obtained from an operational product from the US National Ice Center. The statistics of the total freeboard over various regions are modeled using the log-normal and exponential-modified normal distributions. The findings enhance our understanding of sea ice formation and dynamics and can be used to interpret geophysical parameters associated with the sea ice topography.
The paper is structured as follows. Section 2 describes the data sets and data-processing procedures. The two-step approach for sea ice DEM retrieval is introduced in Sect. 3. The retrieval results and interpretation of topographic characteristics are given in Sect. 4 and further discussed in Sect. 5. Finally, Sect. 6 summarizes the study.
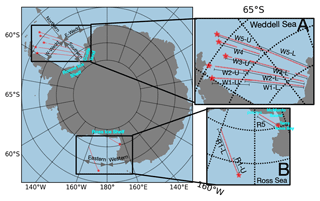
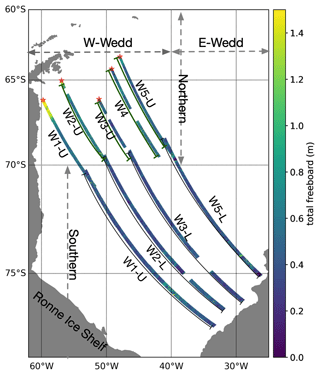
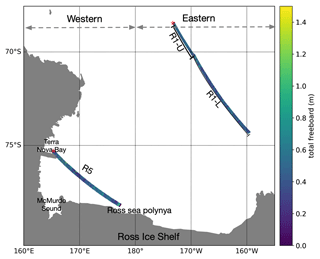
Figure 1Geolocation of the study area. The northernmost position in each segment is marked with a star symbol and serves as a reference point for calculating the relative distance in Sect. 4.2.
2.1 Study area
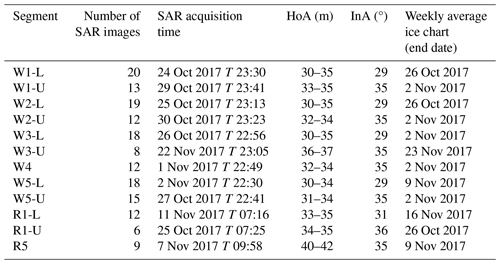
The region of interest includes both the Weddell Sea and the Ross Sea, as shown in Fig. 1. The SAR footprints over the two seas are enlarged in boxes A and B, respectively. The footprints consist of 12 segments, each corresponding to a sequence of SAR images within the same orbit that were acquired with only a few seconds' difference. The segments will be referred to as W1-U, W1-L, W2-U, W2-L, W3-U, W3-L, W4, W5-U, W5-L, R1-U, R1-L, and R5 in the following sections for conciseness.
2.2 SAR imagery
The TanDEM-X is a SAR interferometer that operates as a bistatic single-pass system that is capable of acquiring two images simultaneously (Krieger et al., 2007). The two images are co-registered single-look complex products, which can be processed to derive the sea ice DEM through interferometry.
In the study, we collected 162 SAR images over the 12 segments in StripMap mode in dual-pol (dual-polarimetric) channels (HH and VV). The pixel spacing is around 0.9 m × 2.7 m in slant range and azimuth. The acquisition time and the number of images for each segment are listed in Table 1. The incidence angle (InA) is measured at the center of the scene, and the height of ambiguity (HoA) corresponds to an interferometric phase change of 2π. Note that for R5, the larger HoA leads to higher average uncertainty in the derived InSAR height (hInSAR) compared to other InSAR configurations with a smaller HoA. More details can be found in Sect. A1 in the Appendix.
The multilook processing was conducted using a 4 × 12 window, resulting in ∼ 10 m × 10 m pixel spacing in azimuth and ground range. This resolution (∼ 10 m × 10 m) was subsequently utilized for the sea ice classification and DEM retrieval detailed in Sect. 3. The backscattering intensity σmeasure of the images includes additive thermal noise, which can be described by the noise-equivalent sigma zero (NESZ) and is assumed to be uncorrelated with the signal (Nghiem et al., 1995). Removing the thermal noise allows for a better representation of sea ice features, which is crucial for ice classification. We denoised backscattering intensities for the different polarizations (i.e., HH, VV, Pauli-1 (HH + VV), and Pauli-2 (HH − VV)) by subtracting the NESZ from σmeasure (Huang et al., 2022). More details about the thermal noise removal can be found in Sect. A2 in the Appendix. The denoised backscattering intensities are used in the following sections.
2.3 Optical digital mapping system (DMS) data
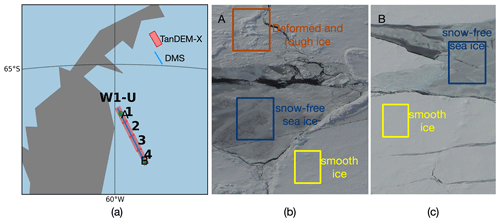
With an objective to investigate the Antarctic sea ice topography, Operation IceBridge (OIB) and the TanDEM-X Antarctic Science Campaign (OTASC) (Nghiem et al., 2018) were successfully carried out along a portion of W1, as shown in Fig. 2a. Equipped with a digital mapping system (DMS), the OIB aircraft captured optical images (Dominguez, 2010) and generated a DEM using photogrammetric techniques at a spatial resolution of approximately 40 cm × 40 cm with a vertical accuracy of 0.2 m (Dotson and Arvesen., 2012). The DMS acquisitions occurred between 17:45 and 18:44 UTC on 29 October 2017. Figure 2b and c showcase DMS optical images taken over specific areas, highlighting a diverse range of sea ice features, including ridges, deformed ice, smooth ice with snow cover, and snow-free ice.
In this study, we geocoded the DMS DEM to match the coordinates and resolution of the multilooked SAR image, the latter of which is approximately 10 m × 10 m in both range and azimuth. Note that the DMS DEM gives height values relative to the WGS-84 ellipsoid. To obtain the total freeboard, we calibrated the DMS DEM to the local sea level through manual selection of the water surface from DMS images (Huang et al., 2021). The calibrated DMS DEM is henceforth referred to as the DMS DEM for brevity.
As the sea ice is constantly moving, co-registration is crucial to compensate for the time lag (∼ 6 h) between the DMS sensor and TanDEM-X. To achieve this, we carefully aligned the two data sets by identifying distinctive sea ice features in both the optical and the SAR images (Huang et al., 2021, 2022). Note that the segments lacking distinctive sea ice features in the optical and SAR images were eliminated to ensure co-registration quality. The co-registered DMS DEM is used as reference data in this study.
2.4 Ice charts
The US National Ice Center's Antarctic sea ice charts (referred to simply as “ice charts” hereafter) offer weekly products detailing the total sea ice concentration, partial concentration, and stage of development (U.S. National Ice Center, 2022). The ice charts covering the date of SAR acquisitions are listed in Table 1.
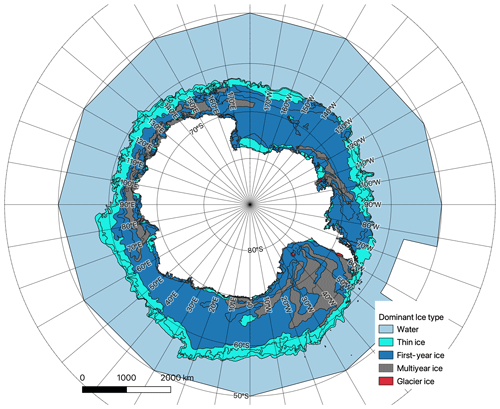
Figure 3The dominant ice type from the US National Ice Center's Antarctica weekly sea ice chart (26 October 2017).
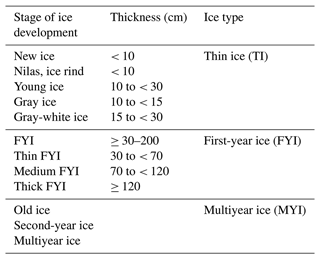
The ice charts are provided in Shapefile format as grids with a spatial resolution of 10 km × 10 km. For each specified latitude and longitude, three ice concentration values are given, each corresponding to a different stage of ice development. Details of these stages and their corresponding thicknesses can be found in the first and second columns of Table 2, respectively. The postprocessing of the ice charts consisted of two steps. First, we categorized the three stages of ice into thin ice (TI), first-year ice (FYI), and multiyear ice (MYI) types according to the third column of Table 2. Next, we extracted the ice concentration values for TI, FYI, and MYI, respectively. An example of an ice chart, which shows the dominant ice type, is provided in Fig. 3. Note that the dominant ice type refers to the ice type with the highest concentration values.
Table 2Stages of development for each ice type category (U.S. National Ice Center, 2022).
2.5 SAR interferometry
A single-pass interferometer acquires two simultaneous observations, denoted as s1 and s2. The complex interferogram γ and the interferometric phase ϕγ can be described as (Cloude, 2010)
The further processing of ϕγ includes flat-earth removal, interferogram filtering, low-coherence area masking, and phase unwrapping (Huang and Hajnsek, 2021). The resulting can be converted to height using
where hInSAR is the height of the InSAR phase center and ha is the HoA related to the InSAR baseline configuration provided in Table 1.
The complex interferometric coherence between the two images can be estimated by (Cloude, 2010)
where the symbol 〈.〉 denotes an ensemble average within a 4 × 12 multilooking window. Pixels with γInSAR < 0.3 were designated as water areas and excluded from further processing. The above interferometric processing was carried out using the GAMMA software.
The hInSAR obtained from Eq. (3) was further calibrated to the average water surface. Instead of identifying water pixels that were masked out due to the low InSAR coherence (less than 0.3), we selected smooth and new ice regions, assuming they were thin enough and their elevations (i.e., radar freeboards) were negligible and approximately equal to the water surface. Smooth and thin ice regions typically exhibit very low backscattering intensities in SAR images (Dierking et al., 2017). Therefore, we selected pixels with backscattering intensities within the range of −19 to −18 dB, slightly above TanDEM-X's noise level (−19 dB), and generated a histogram of hInSAR values for these pixels. We determined the third percentile of the height of these pixels as the water surface elevation. The threshold value, i.e., the third percentile, was chosen by applying the method to four SAR scenarios overlaid with the DMS DEM. By choosing the third percentile as the water surface level, we ensured alignment between the water surface levels derived from InSAR and those from the DMS data, thus validating the threshold value. Note that we estimate a single value representing the water surface for each SAR scene. However, it is important to note that this method may introduce inaccuracies due to the centimeter-level radar freeboard of the selected thin and new ice as well as the fluctuating water surface within each SAR scenario.
2.6 SAR polarimetry
SAR polarimetry reflects the scattering mechanisms and has been proven to be a proxy for characterizing sea ice properties (Wakabayashi et al., 2004; Ressel et al., 2016; Huang and Hajnsek, 2021; Singha et al., 2018; Nghiem et al., 2022).
2.6.1 Co-polarization ratio
The co-polarization (coPol) ratio (RcoPol) measures the backscattering intensity ratio between the dual-pol channels and can be calculated as follows:
where σHH and σVV are the denoised SAR backscattering intensities in the dual-pol channels on a linear scale. RcoPol, extracted from L-band SAR images, is associated with the dielectric constant and has therefore been used as an indicator of ice thickness (Wakabayashi et al., 2004). Further investigation is required to determine if RcoPol from the X band can also serve as a proxy for ice thickness. Additionally, RcoPol has been identified as an important feature for discriminating thicker ice and water and is an effective tool for classifying sea ice in X-band SAR imagery (Ressel et al., 2016).
2.6.2 Pauli-polarization ratio
Similarly, we can obtain the Pauli-polarization ratio (RPauli) from
where σP1 and σP2 are the denoised SAR backscattering intensities in Pauli-1 and Pauli-2 polarizations on a linear scale, respectively. sHH and sVV are single-look complex images in dual-pol channels.
2.6.3 Complex coPol coherence
The complex coPol correlation is calculated as (Lee and Pottier, 2009)
where γcoPol is the coPol coherence magnitude and ϕcoPol is the coPol phase.
γcoPol measures the degree of electromagnetic wave depolarization caused by the surface roughness and the volume scattering. This parameter has been shown to be associated with sea ice DEM (Huang and Hajnsek, 2021) and thickness (Kim et al., 2011).
ϕcoPol is sensitive to the anisotropic structure of the medium and deviates from 0° when the signal delay becomes polarization dependent (Leinss et al., 2014). ϕcoPol has been utilized to retrieve the fresh-snow anisotropy over the ground (Leinss et al., 2016) and to characterize the topography of the snow layer (Huang and Hajnsek, 2021).
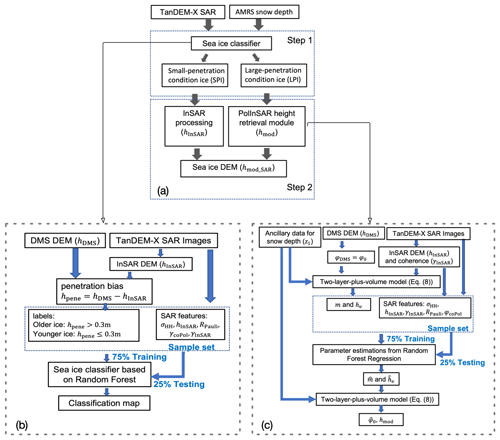
This section introduces an innovative two-step approach for retrieving sea ice DEM across various ice conditions. The initial step is to categorize sea ice into LPI and SPI types based on the radar penetration depths. The second step involves generating the sea ice DEM using different methods for the two ice categories. The two-step approach is presented in Fig. 4a, and the two steps are detailed in Sect. 3.1 and 3.2, respectively. The method is developed and validated using the four SAR images (Fig. 2) that were overlapped with the DMS DEM.
3.1 Sea ice classification
As shown in Fig. 4a, in Step 1, the sea ice is classified into SPI and LPI types using a random-forest (RF) classifier (Breiman, 2001). A detailed description of the training and validation process for the classifier is given in Fig. 4b, where the DMS DEM (hDMS) is utilized as reference data. The penetration depth hpene = hDMS−hInSAR, where hDMS measures the total freeboard, i.e., the elevation from the snow–air surface relative to the water level. The InSAR DEM (hInSAR) measures the radar freeboard, i.e., the elevation of the InSAR phase center relative to the water level, which can be somewhere inside the snow or ice, depending on the snow and ice conditions. hInSAR is generated from the TanDEM-X InSAR pair, following the principles described in Sect. 2.5. In general, microwaves can penetrate much shallower into the younger and more saline sea ice than into the older and less saline sea ice. According to Hallikainen and Winebrenner (1992), the penetration depth into multi-year ice varies between 0.3 and 1 m at the X band, depending on the salinity and temperature. Desalination within ice ridges increases the effective penetration depth compared to level ice (Dierking et al., 2017). Considering these findings, and given the study area's snow cover and the presence of deformed ice formations such as ridges, we chose a penetration depth of 0.3 m as the threshold for distinguishing the two ice types. Hence, pixels with hpene < 0.3 m are labeled as SPI, whereas those with hpene ≥ 0.3 m are LPI.
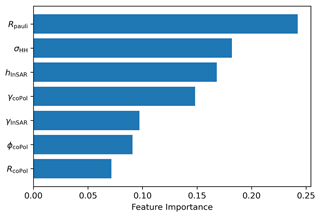
We investigate a range of features for classification, including the denoised backscattering intensity in HH polarization (σHH), polarimetric features such as the coPol ratio (RcoPol), the Pauli-polarization ratio (RPauli), the coPol coherence magnitude (γcoPol), and the coPol phase (ϕcoPol), as well as interferometric features, including the InSAR coherence magnitude (γInSAhR) and the height of the interferometric phase center (hInSAR). To improve computational performance, we rank features based on Gini importance (i.e., the mean decrease in impurity), which measures the average gain of purity achieved by splitting a given variable. The top five features (i.e., RPauli, σHH, hInSAR, γcoPol, and γInSAR) are selected as effective predictors for the RF classifier. The ranking of all the SAR features is given in Fig. A3 in the Appendix. Note that the computed Gini importance is not inherently specific to a particular class or ice type. Instead, it represents the relative importance of features when making overall classification decisions within the context of the entire data set. Therefore, the importance level determined by the Gini importance is not specific to individual ice types but reflects the significance of features for the classifier's overall predictive performance across all classes.
The selected features together with the ice labels (i.e., LPI and SPI) form the sample set. 75 % are used for training the RF classifier, which is implemented in Python using the default hyperparameters. Since the sample numbers for the SPI and LPI classes are well balanced (48 % and 52 %, respectively), it is not necessary to implement a specific balanced training strategy. The validation of ice classification over the testing subset (25 %) is given in Sect. 4.1.
3.2 DEM generation
As shown in Fig. 4a, in Step 2, we separately retrieve the sea ice DEMs for the two categories of ice based on the classification map. For SPI, conventional InSAR processing (Sect. 2.5) is conducted, given the minimal penetration depth attributed to the saline ice. On the other hand, for LPI, which is subject to radar signal penetration, we apply the TLPV model developed in (Huang et al., 2021), which incorporates InSAR processing and corrects for the bias from radar penetration into the snow-covered old ice.
The TLPV model includes surface scattering from the top and bottom interfaces and volume scattering from the snow and ice, as shown in Fig. 5. The model was further simplified by merging the contributions of the snow volume, the ice volume, and the top layer into one Dirac delta (Huang et al., 2021):
where ϕ0 is the topographic phase at the snow–air interface, ϕ1=κz_volz1, ϕ2=κz_volz2, and z1 and z2 are the locations of the layers, respectively. refers to the depth between the top and bottom layers. It is worth noting that the bottom layer may not always be at the ice–water interface. In certain situations, there might be a lower basal saline ice layer, and strong surface scattering arises from the ice–basal layer interface (Nghiem et al., 2022). Brine inclusions with higher salinity occur in this basal saline layer upon transitioning towards the ice–seawater interface (Tison et al., 2008). κz_vol is the vertical wavenumber in the volume, which depends on the InSAR configuration (such as the HoA and the incidence angle) and the dielectric constant of the volume (Dall, 2007; Sharma et al., 2012; Huang et al., 2021). m refers to the layer-to-layer scattering ratio, which is the backscattering power ratio between the top and bottom layers:
where σtop(ω) and σbottom(ω) denote the backscattering power from the top and bottom interfaces, respectively, at a given polarization ω. m potentially reveals the relative importance of scattering from these interfaces, which depends on factors like the interface roughness, dielectric constant, and radar polarization. A larger value of m signifies that surface scattering from the bottom layer predominates, while a smaller m indicates that surface scattering from the top layer is more significant.
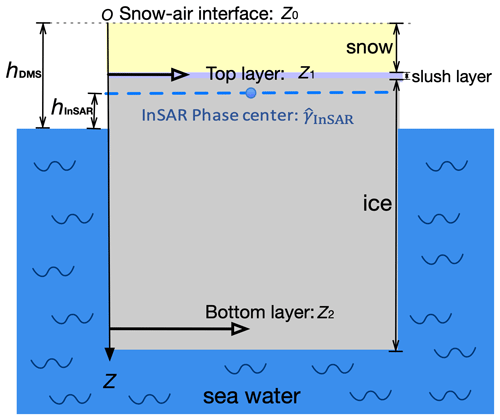
Figure 5Schematic of the proposed TLPV model for sea ice (Huang et al., 2021).
The aim is to estimate ϕ0 and convert it into the height (hmod), which is the total freeboard of LPI. When fixing the origin at the air–snow interface, z1 is equivalent to the snow depth, which can be obtained from the AMSR level-3 data (Meier et al., 2018). However, Eq. (8) still contains two unknown variables, m and hv, preventing the direct estimation of ϕ0. Therefore, we develop a PolInSAR height retrieval module to invert the TLPV model and estimate m and hv, as shown in Fig. 4c. We first establish an empirical relation (RF regression) between SAR features and the true values of m and hv, which can be derived using the DMS DEM as a priori information. Specifically, we simulate the interferometric phase (ϕDMS=ϕ0) from the height (hDMS) using Eq. (3) tailored to the specific InSAR configuration with the ha given in Table 1. With the snow depth z1 and from the AMSR data and InSAR observations, respectively, m and hv values are derived by inverting Eq. (8), and these are used as the true values for training the RF regressor.
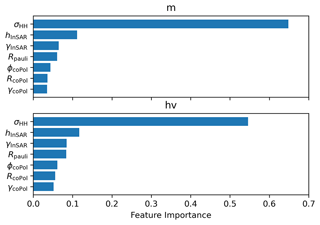
We use the Gini importance to rank the seven features for regression, selecting the top five predictors for estimating and : σHH, hInSAR, γInSAR, RPauli, and ϕcoPol. The ranking of the SAR features is given in Fig. A4 in the Appendix. The selected features, together with the true m and hv, form the sample set. 75 % are used for training the RF regressor. Note that the RF regressor is trained using the same sample set as the sea ice classification.
The well-trained RF regressor is subsequently utilized to estimate and for SAR scenes that do not overlap with DMS measurements. Selected features from SAR images, along with the z1 from ancillary data, serve as inputs to the RF regression model for estimating and . Subsequently, the topographic phase can be derived by solving Eq. (8) and then transformed into the total freeboard hmod using Eq. (3). For SAR scenes overlaid with DMS measurements, the validation of the height retrieval accuracy over the testing subset (25 %) is given in Sect. 4.1.
Following the two-step approach developed in Sect. 3, this section obtains the SAR-derived DEM from 162 dual-pol InSAR pairs that cover the sea ice in the Weddell and Ross seas. We verify the accuracy of the SAR-derived DEM. We further analyze the variation of the total freeboard and roughness along the southwards direction and examine the statistical characteristics of sea ice DEM across various geographic regions.
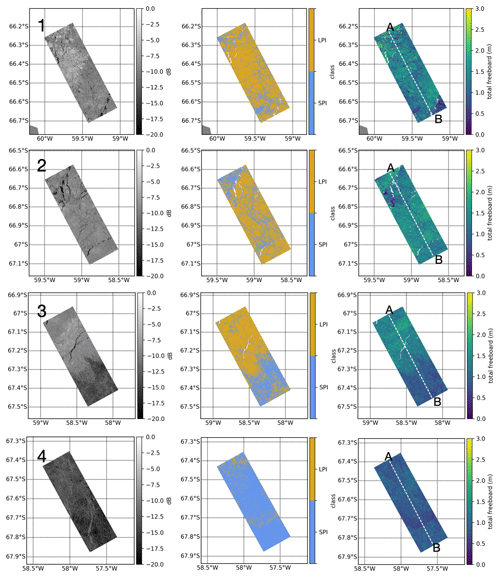
Figure 6First column: SAR backscattering intensity in HH polarization. Second column: sea ice classification. Third column: sea ice DEM (hmod_SAR) over the four scenarios. The rows correspond to scene nos. 1–4 in Fig. 2, respectively. The spatial resolution is 10 m × 10 m. The void pixels in the second and third columns represent water areas excluded from processing because γInSAR < 0.3. The dashed white line indicates the flight track overlapped by the DEM DEM (hDMS).
4.1 Sea ice topography retrieval and validation
The proposed two-step approach for sea ice DEM retrieval is visually and quantitatively validated based on the four scenes that are overlapped with DMS measurements. The SAR backscattering intensities over the four scenes are displayed in the left column in Fig. 6. In the first step, the proposed classification scheme demonstrates good performance on the testing set, with an accuracy of 0.84; the confusion matrix is presented in Fig. 7a. The classifier is then applied to the entire SAR image, including the region not overlapped by the DMS DEM, and the classified maps are shown in the middle column of Fig. 6.
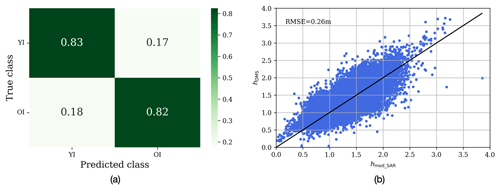
Figure 7(a) Confusion matrix for sea ice classification. (b) Comparison between the reference height and the derived height over LPI and SPI.
In the second step, the sea ice DEM (hmod_SAR) is obtained by merging hmod and hInSAR over LPI and SPI. Note that hmod_SAR represents the total freeboard relative to the water surface retrieved from the pixel at a spacing size of 10 m × 10 m. The retrieved sea ice DEMs are compared with hDMS over the testing set, as shown in Fig. 7b. The RMSE between hmod_SAR and hDMS is 0.26 m. This result is promising, as Dierking et al. (2017) suggested that a satisfactory accuracy for a sea ice DEM is less than 0.3 m. Note that the average RMSE value of LPI without compensating for the penetration bias is ∼ 1.10 m (Huang et al., 2021).
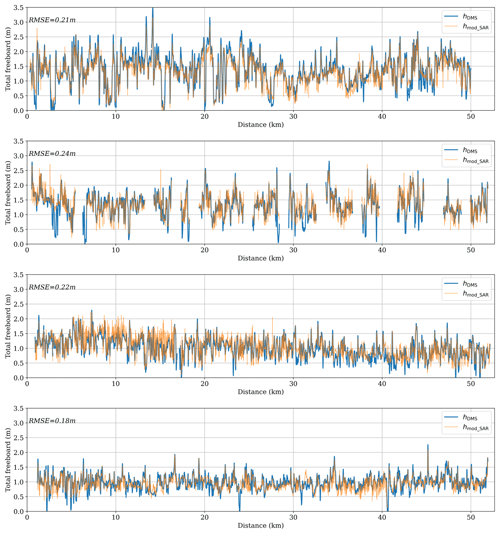
Figure 8Comparison between the total-freeboard profiles (hmod_SAR) from the proposed method and the DMS DEM (hDMS) along the dotted line (from A to B) over scene nos. 1–4 in Fig. 6c. The spatial resolution is 10 m × 10 m. The data gaps are the water areas and segments that were excluded due to the absence of distinctive features, ensuring co-registration quality.
The hmod_SAR over the entire SAR image is displayed in the right column of Fig. 6. For each scene, the dashed white line delineates a 50 km × 100 m strip that overlaps with the DMS DEM. By extracting the values at the center of the strip, the height profiles are obtained. These are presented in Fig. 8, where hmod_SAR shows good agreement with the reference data (hDMS) and captures the topographic variation well. Considering that hDMS already contains an uncertainty of 0.2 m (Dotson and Arvesen., 2012), these results prove the effectiveness of the proposed two-step approach for sea ice DEM retrieval over both SPI and LPI.
4.2 Sea ice topography in the southwards direction
We obtain the sea ice DEM over the total 162 images using the two-step approach. A visualization of the derived sea ice DEM can be found in the Appendix (Figs. A5 and A6). The derived DEM is downsampled to a resolution of 500 m and utilized in the subsequent analyses.
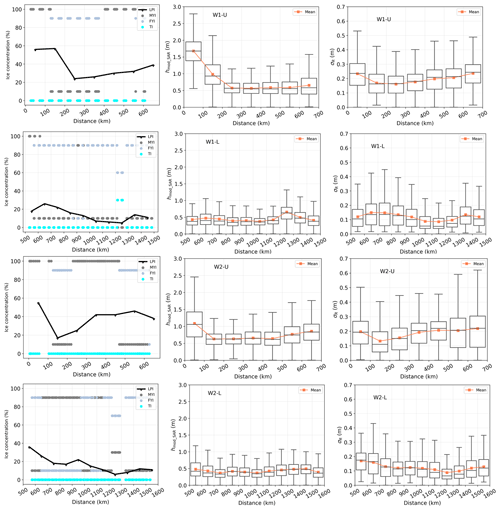
Figure 9Sea ice characteristics in the southwards direction along the W1 and W2 segments. The black line in the first column displays the LPI percentages derived from SAR images, and the dots indicate the ice types obtained from the ice charts. The second and third columns plot the total freeboard (hmod_SAR) and roughness (σR), respectively. Distance is measured from the northernmost SAR image reference point towards the south. The orange line denotes the average values of hmod_SAR and σR. For each box, the upper and lower boundaries represent the first (Q1) and third (Q3) quartiles, while the upper (lower) whisker extends to the last (first) sample outside of Q3 ± 1.5 × (Q3 − Q1).
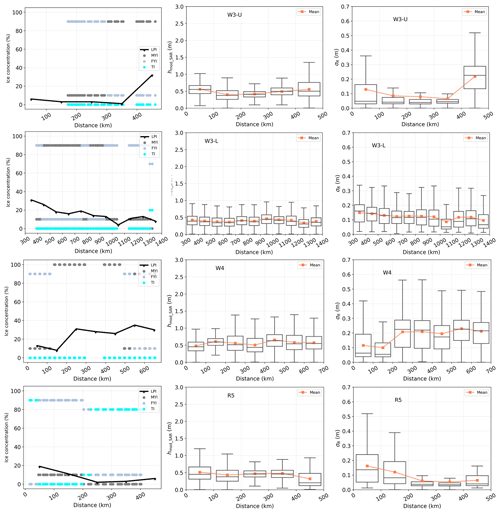
Figure 10Sea ice characteristics in the southwards direction along the W3, W4, and R5 segments. The black line in the first column displays the LPI percentages derived from SAR images, and the dots indicate the ice types obtained from the ice charts. The second and third columns plot the total freeboard (hmod_SAR) and roughness (σR), respectively.
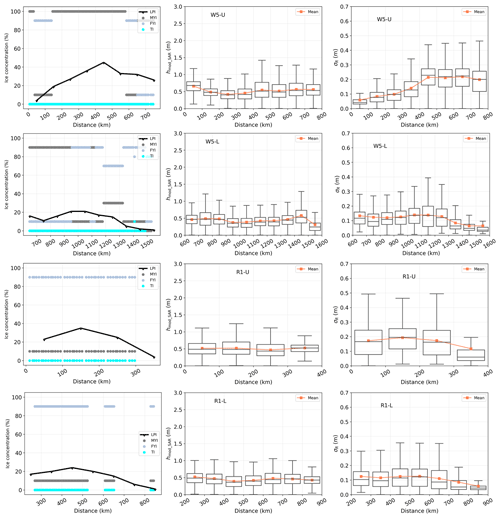
Figure 11Sea ice characteristics in the southwards direction along W5 and R1 segments. The black line in the first column displays the LPI percentages derived from SAR images, and the dots indicate the ice types obtained from the ice charts. The second and third columns plot the total freeboard (hmod_SAR) and roughness (σR), respectively.
The northernmost location in each segment is selected and marked with a star symbol in Fig. 1. Subsequently, we characterize the variation of the sea ice category, total freeboard, and roughness moving southwards using distances relative to the northernmost locations and averaging over every 100 km interval. These topographic variations along the distance are illustrated in Figs. 9–11.
The first column shows the LPI percentages estimated from the proposed two-step approach and compared with the ice charts. The overall trend in estimated LPI percentages correlates well with the dominant ice types and ice concentrations from the ice charts across most segments (W1-U, W1-L, W2-U, W4, W5-U, W5-L, and R5). W1-U and W1-L are explained as two examples. From 0–120 km, W1-U is covered by 100 % MYI, and the LPI percentage reaches its highest value (58 %). From 120–400 km, the dominant ice transitions from MYI to FYI, with the LPI percentage decreasing accordingly. There is a dominance of MYI ice from 400–600 km, with a corresponding increasing LPI percentage. For W1-L, between 500–600 km there is 100 % MYI and the LPI percentage peaks, but the LPI percentage decreases after 650 km as FYI becomes dominant. The lowest LPI percentage is found at around 1200 km, consistent with the occurrence of TI at this distance.
The observation of similar trends can be explained by the general assumption that MYI is thicker and less saline, allowing for deeper radar penetration compared to FYI and TI. However, penetration depth is influenced by various factors as well as ice age, including ice salinity, snow condition, flooding effects, and temperature. This explains the discrepancies for other segments (W2-L, W3-U, W3-L, R1-U, and R1-L). Furthermore, discrepancies can also be attributed to differences in spatial resolution and temporal gaps between ice charts and SAR imagery, considering the dynamic nature of sea ice.
It is essential to clarify that we utilized ice chart data as external information to interpret the classification results and spatial variation of topography. However, we did not use ice charts to quantitatively validate the proposed method. For validation purposes, we conducted pixel-by-pixel comparisons using co-registered DMS data.
The second and third columns in Figs. 9–11 display the distance dependencies of the total freeboard (hmod_SAR) and the roughness (σR), respectively. Sea ice roughness is the standard deviation of the total freeboard within a 50 m × 50 m area. For each 100 km distance interval, we calculate and display the average and median values as well as the first and third quartiles of hmod_SAR and σR using boxplots.
The ice charts are also used to validate and explain the topographic variation of the sea ice. In general, a region with thicker ice (e.g., MYI) is anticipated to display a higher total freeboard or larger roughness compared to an area with thinner ice, such as FYI and TI. This hypothesis is substantiated by the agreement between topographical variations (total freeboard and roughness) and ice types observed in Figs. 9 to 11 across most segments, with the exception of W3-L and W5-L. The sea ice is identified as MYI at distances between 450–750 km in W3-L and 650–950 km in W5-L. However, neither total freeboard nor roughness significantly increases within these specific ranges. Minor discrepancies also persist, for instance, in W1-U and W2-L, where there is no clear reduction in either total freeboard or roughness when FYI is present at around 600 km. These discrepancies may arise due to local cases where rough FYI exhibits greater roughness than smooth, level MYI. FYI may also show higher elevations when covered by very thick snow. In addition, considering that the ice chart data are weekly products, the inconsistencies could be attributed to mis-coregistration caused by sea ice drift during the time lag between the ice charts and the SAR images.
In the northwestern Weddell Sea, we observe that the sea ice near the Antarctic Peninsula (AP) in the W1-U and W2-U segments exhibits the highest average total freeboard (mean > 0.7 m) and roughness (mean = 0.19 m), as shown in the first and third rows in Fig. 9. This observation aligns with a previous study that used OIB Airborne Topographic Mapper (ATM) data from 14 and 22 November 2017 (Wang et al., 2020), which reported that the total freeboard near the eastern AP ranges from 1.5–2.5 m. Moving outwards from the AP, the total freeboard and roughness along W1-U and W2-U sharply decrease within approximately 0–200 km before gradually increasing upon heading southwards. Similar trends are observed in W3-U (first row in Fig. 10) and W5-U (first row in Fig. 11), with a more subtle decrease in the total freeboard within the 0–200 km range compared to W1-U and W2-U, followed by a southwards increase. Conversely, in the initial 0–200 km of W4 (third row in Fig. 10), there is no observed decrease in total freeboard or roughness. Instead, a gradual increase in both parameters is evident as one moves southwards, consistent with the dominance of MYI beyond 100 km from the ice chart data. In the southeastern region, segments W1-L, W2-L, W3-L, and W5-L exhibit similar patterns of topographic variation, with total freeboard and roughness generally decreasing towards the south as Coats Land is approached (see the location in Fig. 1). This trend can be explained by the increasing occurrence of FYI or TI at distances beyond around 1000 km from the ice chart data.
The observed variation in sea ice topography could result from the formation and dynamics of sea ice in the East Weddell (E-Wedd) and West Weddell (W-Wedd) regions, which are defined by specific longitude ranges: E-Wedd encompasses 15° E to 40° W, while W-Wedd extends from 40 to 62° W. Segments of W1-U, W2-U, W3-U, W4, and W5-U are located within W-Wedd, in which the presence of Antarctic MYI has been reported (Lange and Eicken, 1991). Sea ice initially forms in the eastern region and then circulates clockwise within the cyclonic gyre of the southern Weddell Sea. Later, older sea ice drifts outward in a northwestern direction (Kacimi and Kwok, 2020). The sea ice undergoes thickening and deformation as it drifts (Vernet et al., 2019; Kacimi and Kwok, 2020), resulting in an increased total freeboard and greater roughness in the northwestern Weddell Sea.
In the western Ross Sea, the sea ice along the R5 segment (the last row in Fig. 10) exhibits greater total freeboard and roughness near Terra Nova Bay (see Fig. 1 for the location), with these decreasing in a southeastward direction. This observation aligns with the transition of the dominant ice type from FYI to TI in that direction. It is also consistent with recent research (Rack et al., 2021): airborne measurements in November 2017 revealed deformed sea ice exceeding 10 m in thickness within the first 100 km south of Terra Nova Bay, while thinner ice was observed towards the southeastern area near McMurdo Sound (see Fig. 1 for the location). Satellite data also confirmed a region of thinner ice influenced by the Ross Sea polynya, with thicker ice located westward (Kurtz and Markus, 2012). The observed pattern can be attributed to significant deformation in the western Ross Sea, caused by wind-driven shearing, rafting, and ridging within a convergent sea ice regime (Hollands and Dierking, 2016). This deformation leads to potentially thicker sea ice compared to the eastern part (Rack et al., 2021).
For the R1 segment located in the eastern Ross Sea (third and fourth rows in Fig. 11), although the sea ice exhibits a relatively stable total freeboard, which agrees with the consistent predominance of FYI, the roughness decreases towards the southeastern direction. This may be attributed to the influence of the ocean circulation, considering that the R1 segment is situated farther from the land than the other segments. The variation of the roughness along the R1 segment suggests that ice topography provides add-on information that can be useful to integrate into operational ice charting. Furthermore, since the edges of ice floes with open water between the floes can also contribute to the ice roughness, combining ice topography with ice concentration can help characterize the sea ice more comprehensively.
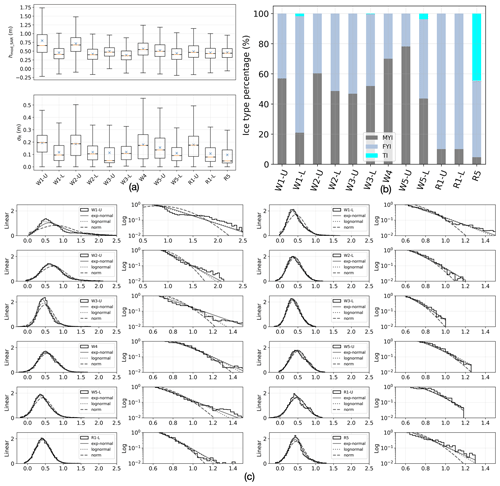
Figure 12(a) Total freeboard (hmod_SAR) and roughness (σR) derived from SAR images across the 12 segments. (b) The percentages of multi-year ice (MYI), first-year ice (FYI), and thin ice (TI) from the ice charts. (c) Probability density functions (PDFs) of derived total freeboard (hmod_SAR) and fits to the PDFs using exponential-normal, log-normal, and normal distributions.
4.3 Regional variation of sea ice topography
Figure 12a displays the topographic variation across different segments. We present the average and median values as well as the first and third quartiles of total freeboard and roughness using boxplots. The mean values are listed in Table 3. Additionally, the percentages of the three ice types within each segment, calculated from the ice charts for reference, are presented in Fig. 12b.
Table 3Average total freeboard and roughness for each segment as well as the Kolmogorov–Smirnov (KS) values for comparisons between the observed total-freeboard and modeled distributions (which were modeled using exponential-normal (exp-normal) and log-normal distributions). The smallest KS value for each segment is shown in bold.
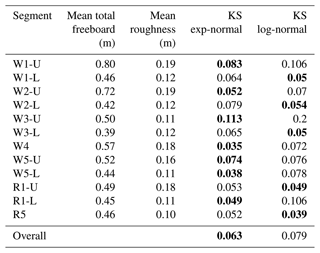
Generally, sea ice in the northwestern Weddell Sea (W1-U, W2-U, W3-U, W4, and W5-U) exhibits a higher average total freeboard (> 0.5 m) compared to that in the southeastern Weddell Sea and the Ross Sea (W1-L, W2-L, W3-L, W5-L, R1-U, R1-L, and R5); see the detailed values in Table 3. W1-U and W2-U exhibit the highest average total freeboards of 0.8 and 0.72 m, respectively, along with the largest average roughness of 0.19 m. This is comparable with the total freeboard retrieved from ICESat-2 (Kacimi and Kwok, 2020), which reported an average total freeboard of 0.6–0.7 m near the eastern AP between 1 April and 16 November 2019. W4 and W5-U show average total freeboards of 0.57 and 0.52 m and average roughness values of 0.18 and 0.16 m, respectively. The above topographic values (i.e., total freeboard and roughness) are consistent with the ice types presented in Fig. 12b, where W1-U, W2-U, W4, and W5-U exhibit a substantial proportion (≥ 57 %) of MYI, known for its greater total freeboard and roughness. W3-U, which consists of 47 % MYI, exhibits a total freeboard of 0.50 m but a relatively low roughness of 0.11 m, suggesting the possibility of a smooth snow–air interface over older and thicker ice.
For the segments in the southeastern Weddell Sea and the Ross Sea (W1-L, W2-L, W3-L, W5-L, R1-L, and R5), the average total freeboard remains below 0.46 m and the roughness is around 0.11 m. The reduced average total freeboard and roughness correspond to ice types with fewer MYI percentages (≤ 52 %) and greater amounts of FYI and TI (> 52 %). R1-U demonstrates an average total freeboard of 0.49 m and a roughness of 0.18 m, with FYI predominating throughout the region. This observation suggests a plausible scenario of a rougher snow–air interface over younger and thinner ice (Tin and Jeffries, 2001; Tian et al., 2020).
4.4 Statistical analyses of the sea ice topography
Studies on sea ice topography in the Arctic have extensively examined the applicability of statistical distributions such as the log-normal distribution (Landy et al., 2020; Duncan and Farrell, 2022) and the exponentially modified normal (exp-normal) distribution (Yi et al., 2022). However, there remains a gap in our understanding of the most suitable distribution models for describing the total freeboard of Antarctic sea ice. We aim to address this gap by evaluating three distribution models – Gaussian, log-normal, and exp-normal – to determine the most appropriate probability density function (PDF) for describing the sea ice total freeboard across segments.
The PDF of a Gaussian distribution with mean μg and standard deviation σg is defined as
Following Gaddum (1945), the PDF of a log-normal distribution with mean and variance is
The PDF of an exp-normal distribution with mean and variance is given by (Foley and Dorsey, 1984)
where erfc(⋅) is the complementary error function, with .
The observed and modeled distributions of total freeboard over each segment are depicted in the left column of Fig. 12c. In all segments, the observed distributions are asymmetrical, with long tails. A closer examination of the tail regions (right column in Fig. 12c) reveals significant deviations from the Gaussian distribution, particularly in segments W1-U and W2-U, which are covered by deformed and thicker sea ice. The observed non-Gaussian nature of the total-freeboard distribution aligns with previous studies (Hughes, 1991; Davis and Wadhams, 1995; Castellani et al., 2014; Landy et al., 2019; Huang et al., 2021). To quantitatively evaluate the fit of each non-Gaussian distribution (i.e., the log-normal and exp-normal distributions) to the observed total freeboard, we employ the Kolmogorov–Smirnov (KS) test (Massey, 1951). This test measures the goodness of fit by calculating the distance between the observed distribution function and the theoretical cumulative distribution function. The values from the KS test are given in Table 3, where a lower value indicates a better fit.
In the northwestern Weddell Sea, where the segments (W1-U, W2-U, W3-U, W4, and W5-U) have an average total freeboard of greater than 0.5 m, the exp-normal distribution demonstrates superior fitting performance, as evidenced by its smaller KS values. This can be attributed to the exp-normal distribution's incorporation of an exponential component, which enables a better fit to data with heavy or long tails compared to the log-normal distribution. Consequently, the exp-normal distribution is better suited for characterizing the statistics of older and thicker sea ice, which often involves strong deformation and exhibits a significant total freeboard.
In the southern Weddell Sea and the Ross Sea, segments average below 0.5 m in total freeboard, with the best distribution to use for fitting varying between the exp-normal and the log-normal distribution. The log-normal distribution exhibits a better fit for W1-L, W2-L, W3-L, R1-U, and R5, while the exp-normal distribution is more appropriate for W5-L and R1-L. This observation suggests that the two distributions perform comparably well in characterizing the total freeboard of younger and thinner sea ice.
Evaluating the overall performance across all segments, the exp-normal distribution outperforms the log-normal distribution, as indicated by a smaller average KS value of 0.063.
5.1 Factors affecting the model performance
In the proposed two-step method (Fig. 4), we obtain the snow depth from AMSR products (Meier et al., 2018), which provide a 5 d running average of snow depth over the sea ice. Due to the limited spatial (12.5 km) and temporal resolution of the snow depth data, we assume a constant value of snow depth across one SAR image. Hence, for each SAR acquisition covering a spatial extent of 50 km × 19 km, we compute the mean snow depth and utilize it as the input parameter z1 in the TLPV model.
In Fig. 8, it appears that the derived total freeboard (hmod_SAR) underestimates some high and low peaks in the reference data (hDMS). One factor that could contribute to the underestimation of the total freeboard is the assumption of a constant average snow depth over one SAR scene. Using a single average value of snow depth may lead to an underestimation of snow depth in high-peak areas such as ridges, consequently resulting in an underestimation of the total freeboard. Our prior study (Huang et al., 2021) demonstrated a mean difference of 0.31 m in the derived total freeboard due to snow depth variations from 0.05 to 0.75 m over scene no.1, highlighting the impact on peak estimation. In the future, it would be interesting to adapt the proposed method to use available co-located high-resolution snow depth measurements across the test sites.
Another factor that could potentially lead to the underestimation of high and low peaks is the residual shift between the SAR and DMS images. Although we carefully co-registered the four SAR scenes with the DMS data, this co-registration cannot be perfect. In the process, we divided the entire overlapped transect into small patches (each corresponding to 100 m × 1000 m). We assumed the same drift location over one patch and no rotation; thus, only one shift vector was used for co-registration over each patch. This could result in small residual shifts when ice floes or features do not drift at the same velocity or there are rotations within the patch. The presence of low- and high-peak ice features with narrow sizes spanning just a few pixels, poses a challenge. Even slight residual shifts as small as 1–2 pixels can lead to a loss or misalignment of peak structures in SAR images. Consequently, inputting these slightly misaligned SAR images into the proposed model may result in an underestimation of the total freeboard.
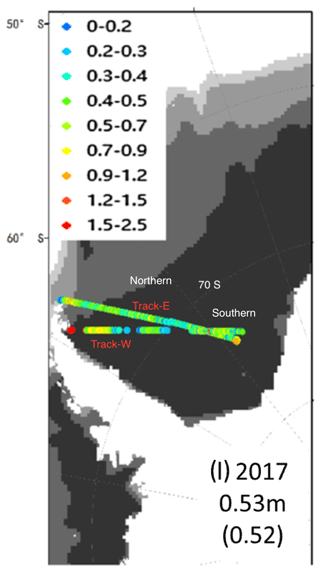
Figure 13The total freeboard calculated from IceBridge laser altimetry (this is a copy of Fig. 6l in Wang et al., 2020). We labeled the two tracks Track-W and Track-E. The region with latitudes < 70° S (> 70° S) is referred to as the northern (southern) track.
5.2 Comparison of the InSAR-derived total freeboard with an existing study
Wang et al. (2020) calculated the mean total freeboard in the Weddell Sea using IceBridge laser altimetry. In this subsection, we conduct a visual comparison between the results in Wang et al. (2020) (Fig. 13) and the four segments (W2-U, W2-L, W3-U, and W3-L) in our study (Figs. 9 and 10). Note that the window is tens of kilometers in size in Wang et al. (2020), significantly exceeding the 500 m × 500 m window size we used.
We denote the region in Fig. 13 with latitudes < 70° S (> 70° S) as the northern (southern) track. The northern and southern Track-W segments are partially overlaid with W2-U and W2-L, respectively. In our study, the total freeboard of W2-U and W2-L in Fig. 9 reaches a mean value of ∼ 1 m and a 75th percentile value of ∼ 1.5 m within the first 100 km, which agrees with the red dot in Track-W in Fig. 13. Then, the total freeboard goes down to a mean value of ∼ 0.7 m and a 75th percentile value of ∼ 0.75 m from 100–200 m. Although there is a data gap in Fig. 13, we can see that the color of the dots changes from red to yellow, which is consistent with the decreasing trend in the total freeboard within 300 km from our results. For W2-L, the mean total freeboard from our results is around 0.5 m, which agrees with the mix of green and yellow dots (0.4–0.9 m) in the southern Track-W in Fig. 13. Note that the OIB ATM data used in (Wang et al., 2020) were acquired on 14 and 22 November 2017, while the SAR images in our study were acquired on 30 and 25 October 2017 for W2-U and W2-L, respectively. Sea ice drifting and potential melting could have induced the slight differences between our results and Wang et al. (2020).
W3-U and W3-L can be compared with northern and southern Track-E, respectively. From Fig. 13, a mix of green and yellow dots in northern Track-E represent a total freeboard of 0.5–1.2 m, which agrees well with our result for W3-U; see the first row in Fig. 10. At around 70° S, the dots transit to a mix of cyan and blue colors representing a total freeboard of 0.2–0.7 m, which is consistent with W3-L in Fig. 10. The slight difference can be attributed to the temporal difference from the SAR images used in our study. Specifically, the image for W3-L was acquired on 26 October 2017, while the Track-E image was acquired on 22 November 2017.
In this study, we proposed a novel two-step approach integrating machine-learning and polarimetric interferometry techniques to retrieve the total freeboard from dual-pol single-pass InSAR images, taking into account the variations in penetration bias across different ice classes. Initially, a random-forest classifier was employed to categorize sea ice (i.e., SPI and LPI) based on the microwaves' penetration. Subsequently, the standard InSAR processing technique was applied to retrieve the total freeboard over SPI regions, where the penetration depth is negligible. For LPI regions, an inversion algorithm for the TLPV model was developed. This algorithm can effectively compensate for the bias in radar penetration into snow and ice, allowing an accurate sea ice DEM (i.e., total freeboard) to be obtained. The uncertainty level is satisfactory for LPI, with an RMSE of 0.26 m. However, this accuracy is insufficient for thinner ice with a height above sea level of only tens of centimeters (or even less). Given that a substantial portion of the Antarctic sea ice consists of first-year ice with a thickness of approximately 1 m (Scott, 2023), achieving accurate DEM retrieval over thinner ice remains a challenge. In the future, applying a potential single-pass InSAR configuration that uses a higher frequency, such as the Ku band, along with a longer cross-track baseline would result in a smaller height of ambiguity (HoA) of less than 5 m (López-Dekker et al., 2011). This setup can enhance InSAR sensitivity and improve the accuracy of total-freeboard measurements.
The proposed approach was applied to a broad area in Antarctica. Overall, sea ice in the northwestern Weddell Sea exhibits a higher average total freeboard (> 0.5 m) than the southeastern region and the Ross Sea, where the average total freeboard is lower (< 0.5 m). In the northwestern Weddell Sea, sea ice experiences substantial deformation near the eastern AP, followed by a pronounced decline in both total freeboard and roughness within a range of 0–200 km. Subsequently, there is a gradual increase in these parameters as one moves southwards. In the southeastern Weddell Sea, the total freeboard and roughness generally decrease towards the south as Coats Land is approached. In the Western Ross Sea, thicker and rougher ice was observed near Terra Nova Bay, while thinner ice was found in the southeastern area near McMurdo Sound. In the eastern Ross Sea, the stable total freeboard aligns with the prevalent presence of FYI, but roughness decreases in the southeastern direction. These findings emphasize that topographic mapping can enhance ice category delineation, allowing an in-depth understanding of sea ice characteristics.
Furthermore, the statistical analyses of the total freeboard confirmed its non-Gaussian distribution. The results further suggested that the exp-normal distribution outperforms the log-normal distribution when they are used to fit the total freeboards of regions with an average total freeboard of greater than 0.5 m, particularly for older and thicker sea ice, whereas both distributions perform comparably for regions with an average total freeboard of lower than 0.5 m.
The spatial distribution of penetration depth (total freeboard minus radar freeboard) could be an interesting topic for future research. In snow-covered sea ice, penetration is significantly influenced by local snow conditions. Hence, a coordinated campaign encompassing TanDEM-X acquisitions, lidar measurements, and in situ snow assessments would hold great promise as a means to analyze the relation between radar freeboard and total freeboard across different snow conditions. Future studies will also involve linking the derived sea ice topographic characteristics associated with oceanographic factors (ocean currents and bathymetry) and climatology parameters (wind and temperature). We aim to further advance our comprehension of sea ice dynamics and evolution in Antarctica.
A1 InSAR height uncertainty across various height-of-ambiguity values
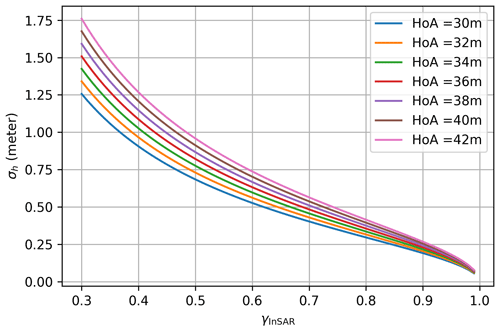
The HoA (ha) is the height of ambiguity determined by the specific InSAR configuration, such as the radar wavelength, orbit height, incidence angle, and baseline. A larger HoA will elevate the uncertainty in the InSAR-derived height. This uncertainty (σh) can be estimated by (Madsen, 1998)
where is the phase noise, which can be expressed as a function of the interferometric coherence (γInSAR) and the independent number of looks (NL) (Rosen et al., 2000):
The variation in the simulated σh for different ha and γInSAR values is illustrated in Fig. A1. At γInSAR = 0.75, σh increases from 0.35 to 0.48 m as ha ranges from 30 to 42 m. Across the studied region, both the mean and median values of γInSAR are around 0.75. Consequently, in the case of R5, the larger ha induces a relatively large average uncertainty in the derived InSAR height (hInSAR) compared to the smaller ha InSAR configuration in our data set.
A2 SAR-thermal-noise removal
The SAR-measured backscattering intensity (σmeasure) containing additive thermal noise can be denoted as
where Sdenoised is the noise-subtracted backscattering amplitude, and N is the additive thermal noise. Considering Sdenoised and N to be uncorrelated, the noise-subtracted backscattering intensity can be obtained from the following simple equation: (Nghiem et al., 1995)
where NESZ is the noise floor (i.e., the noise-equivalent sigma zero (NESZ)), and all terms are on a linear scale.
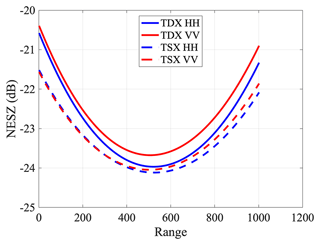
Figure A2NESZ patterns for one TanDEM-X acquisition (scene no. 1 in Fig. 2) used as an example.
The TanDEM-X product contains a set of polynomial coefficients that describe the NESZ pattern for each polarization along the range direction (Eineder et al., 2008) for both the TanDEM-X (TDX) and TerraSAR-X (TSX) images. An example of the calculated NESZ is shown in Fig. A2 on a dB scale. By converting to a linear scale, σdenoised can be calculated by subtracting NESZ from σmeasure. We calculate the NESZ pattern for each SAR acquisition and employ Eq. (A2) to generate denoised backscattering intensities for the different polarizations (i.e., HH, VV, Pauli-1 (HH + VV), and Pauli-2 (HH − VV)) from the TSX image. Note that for Pauli-1 and Pauli-2, we use the average NESZ between the HH and VV channels.
A3 Ranking of SAR features
The Gini importance computed from the random-forest (RF) classifier is given in Fig A3.
The Gini importance computed from the RF regressor for estimating m and hv is given in Fig A4.
A4 Overview of the InSAR-derived total freeboard
The derived total freeboards over the Weddell and Ross seas are given in Figs. A5 and A6, respectively.
TanDEM-X imagery can be acquired from the German Aerospace Center (DLR) by submitting a scientific proposal and then downloading it from the website https://eoweb.dlr.de (DLR, 2024). Additionally, DMS data can be obtained from the National Snow and Ice Data Center at https://nsidc.org/data/icebridge (NSIDC, 2024), while ice chart data from the National Snow and Ice Data Center are available at https://doi.org/10.7265/46cc-3952 (U.S. National Ice Center, 2020).
LH carried out SAR image processing, designed the methodology, analyzed the results, and drafted the manuscript. IH provided valuable input on method development and result analysis, contributing to the enhancement of the manuscript.
The contact author has declared that neither of the authors has any competing interests.
Publisher's note: Copernicus Publications remains neutral with regard to jurisdictional claims made in the text, published maps, institutional affiliations, or any other geographical representation in this paper. While Copernicus Publications makes every effort to include appropriate place names, the final responsibility lies with the authors.
We would like to thank all individuals involved in the OTASC campaign jointly conducted by the DLR and NASA. Special thanks to Thomas Busche for his invaluable assistance in accessing the TanDEM-X data. We also express our appreciation to Vishnu Nandan and the two anonymous reviewers for their comments, which significantly improved the paper. Finally, Lanqing Huang would like to express her gratitude to her boyfriend, Xun Jack Li, for his company, support, and abundant encouragement during her PhD and postdoc years in Zurich.
The authors received partial financial support for this research from a Swiss National Science Foundation Postdoc.Mobility fellowship (grant no. P500PN_217817).
This paper was edited by Vishnu Nandan and reviewed by two anonymous referees.
Breiman, L.: Random forests, Mach. Learn., 45, 5–32, https://doi.org/10.1023/A:1010933404324, 2001. a
Castellani, G., Lüpkes, C., Hendricks, S., and Gerdes, R.: Variability of Arctic sea-ice topography and its impact on the atmospheric surface drag, J. Geophys. Res.-Oceans, 119, 6743–6762, https://doi.org/10.1002/2013JC009712, 2014. a, b
Cloude, S.: Polarisation: applications in remote sensing, Oxford University Press, https://doi.org/10.1093/acprof:oso/9780199569731.001.0001, 2010. a, b
Dall, J.: InSAR elevation bias caused by penetration into uniform volumes, IEEE T. Geosci. Remote, 45, 2319–2324, https://doi.org/10.1109/TGRS.2007.896613, 2007. a
Dammann, D. O., Eicken, H., Mahoney, A. R., Saiet, E., Meyer, F. J., and George, J. C.: Traversing sea ice–linking surface roughness and ice trafficability through SAR polarimetry and interferometry, IEEE J. Sel. Top. Appl., 11, 416–433, https://doi.org/10.1109/JSTARS.2017.2764961, 2017. a
Davis, N. and Wadhams, P.: A statistical analysis of Arctic pressure ridge morphology, J. Geophys. Res.-Oceans, 100, 10915–10925, https://doi.org/10.1029/95JC00007, 1995. a
Dierking, W.: Laser profiling of the ice surface topography during the Winter Weddell Gyre Study 1992, J. Geophys. Res.-Oceans, 100, 4807–4820, https://doi.org/10.1029/94JC01938, 1995. a
Dierking, W., Lang, O., and Busche, T.: Sea ice local surface topography from single-pass satellite InSAR measurements: a feasibility study, The Cryosphere, 11, 1967–1985, https://doi.org/10.5194/tc-11-1967-2017, 2017. a, b, c, d, e
DLR – German Aerospace Center: Earth Observation on the Web (EOWEB), https://eoweb.dlr.de, last access: 1 July 2024. a
Dominguez, R.: IceBridge DMS L1B geolocated and orthorectified Images, Version 1, NASA National Snow and Ice Data Center Distributed Active Archive Center [data set], Boulder, Colorado, USA, https://doi.org/10.5067/OZ6VNOPMPRJ0 (updated 2018), 2010. a
Dotson, R. and Arvesen., J.: IceBridge DMS L3 photogrammetric DEM, version 1, NASA National Snow and Ice Data Center Distributed Active Archive Center [data set], Boulder, Colorado, USA, https://doi.org/10.5067/39YO5T544XCC (updated 2014), 2012. a, b
Duncan, K. and Farrell, S. L.: Determining Variability in Arctic Sea Ice Pressure Ridge Topography With ICESat-2, Geophys. Res. Lett., 49, e2022GL100272, https://doi.org/10.1029/2022GL100272, 2022. a
Eineder, M., Fritz, T., Mittermayer, J., Roth, A., Boerner, E., and Breit, H.: TerraSAR-X ground segment, basic product specification document, Tech. rep., Cluster Applied Remote Sensing (CAF), Oberpfaffenhofen, Germany, https://apps.dtic.mil/sti/tr/pdf/ADA515513.pdf (last access: 3 July 2024), 2008. a
Foley, J. P. and Dorsey, J. G.: A review of the exponentially modified Gaussian (EMG) function: evaluation and subsequent calculation of universal data, J. Chromatogr. Sci., 22, 40–46, https://doi.org/10.1093/chromsci/22.1.40, 1984. a
Gaddum, J. H.: Lognormal distributions, Nature, 156, 463–466, https://doi.org/10.1038/156463a0, 1945. a
Garbrecht, T., Lüpkes, C., Hartmann, J., and Wolff, M.: Atmospheric drag coefficients over sea ice–validation of a parameterisation concept, Tellus A, 54, 205–219, https://doi.org/10.3402/tellusa.v54i2.12129, 2002. a
Guneriussen, T., Hogda, K. A., Johnsen, H., and Lauknes, I.: InSAR for estimation of changes in snow water equivalent of dry snow, IEEE T. Geosci. Remote, 39, 2101–2108, https://doi.org/10.1109/36.957273, 2001. a
Haas, C., Quanhua, L., and Thomas, M.: Retrieval of Antarctic sea-ice pressure ridge frequencies from ERS SAR imagery by means of in situ laser profiling and usage of a neural network, Int. J. Remote Sens., 20, 3111–3123, 1999. a
Hallikainen, M. and Winebrenner, D. P.: The physical basis for sea ice remote sensing, in: Microwave remote sensing of sea ice, edited by: Carsey, F. D., Geophys. Monogr. Ser., 68, 29–46, https://doi.org/10.1029/GM068p0029, 1992. a, b, c
Hollands, T. and Dierking, W.: Dynamics of the Terra Nova Bay Polynya: The potential of multi-sensor satellite observations, Remote Sens. Environ., 187, 30–48, https://doi.org/10.1016/j.rse.2016.10.003, 2016. a
Huang, L. and Hajnsek, I.: Polarimetric Behavior for the Derivation of Sea Ice Topographic Height From TanDEM-X Interferometric SAR Data, IEEE J. Sel. Top. Appl., 14, 1095–1110, https://doi.org/10.1109/JSTARS.2020.3036395, 2021. a, b, c, d
Huang, L., Fischer, G., and Hajnsek, I.: Antarctic snow-covered sea ice topography derivation from TanDEM-X using polarimetric SAR interferometry, The Cryosphere, 15, 5323–5344, https://doi.org/10.5194/tc-15-5323-2021, 2021. a, b, c, d, e, f, g, h, i, j, k, l
Huang, L., Hajnsek, I., and Nghiem, S. V.: Sea ice elevation in the Western Weddell Sea, Antarctica: Observations from field campaign, Earth Space Sci., 9, e2022EA002472, https://doi.org/10.1029/2022EA002472, 2022. a, b, c
Hughes, B.: On the use of lognormal statistics to simulate one-and two-dimensional under-ice draft profiles, J. Geophys. Res.-Oceans, 96, 22101–22111, https://doi.org/10.1029/91JC02336, 1991. a
Iacozza, J. and Barber, D. G.: An examination of the distribution of snow on sea-ice, Atmos. Ocean, 37, 21–51, https://doi.org/10.1080/07055900.1999.9649620, 1999. a
Kacimi, S. and Kwok, R.: The Antarctic sea ice cover from ICESat-2 and CryoSat-2: freeboard, snow depth, and ice thickness, The Cryosphere, 14, 4453–4474, https://doi.org/10.5194/tc-14-4453-2020, 2020. a, b, c, d
Kim, J.-W., Kim, D.-j., and Hwang, B. J.: Characterization of Arctic sea ice thickness using high-resolution spaceborne polarimetric SAR data, IEEE T. Geosci. Remote, 50, 13–22, https://doi.org/10.1109/TGRS.2011.2160070, 2011. a
Krieger, G., Moreira, A., Fiedler, H., Hajnsek, I., Werner, M., Younis, M., and Zink, M.: TanDEM-X: A satellite formation for high-resolution SAR interferometry, IEEE T. Geosci. Remote, 45, 3317–3341, https://doi.org/10.1109/TGRS.2007.900693, 2007. a
Kurtz, N. T. and Markus, T.: Satellite observations of Antarctic sea ice thickness and volume, J. Geophys. Res.-Oceans, 117, C08025, https://doi.org/10.1029/2012JC008141, 2012. a
Kwok, R. and Kacimi, S.: Three years of sea ice freeboard, snow depth, and ice thickness of the Weddell Sea from Operation IceBridge and CryoSat-2, The Cryosphere, 12, 2789–2801, https://doi.org/10.5194/tc-12-2789-2018, 2018. a
Landy, J. C., Tsamados, M., and Scharien, R. K.: A facet-based numerical model for simulating SAR altimeter echoes from heterogeneous sea ice surfaces, IEEE T. Geosci. Remote, 57, 4164–4180, https://doi.org/10.1109/TGRS.2018.2889763, 2019. a
Landy, J. C., Petty, A. A., Tsamados, M., and Stroeve, J. C.: Sea ice roughness overlooked as a key source of uncertainty in CryoSat-2 ice freeboard retrievals, J. Geophys. Res.-Oceans, 125, e2019JC015820, https://doi.org/10.1029/90JC02441, 2020. a
Lange, M. and Eicken, H.: The sea ice thickness distribution in the northwestern Weddell Sea, J. Geophys. Res.-Oceans, 96, 4821–4837, 1991. a
Lee, J.-S. and Pottier, E.: Polarimetric radar imaging: from basics to applications, CRC Press, https://doi.org/10.1201/9781420054989, 2009. a
Leinss, S., Parrella, G., and Hajnsek, I.: Snow height determination by polarimetric phase differences in X-band SAR data, IEEE J. Sel. Top. Appl., 7, 3794–3810, https://doi.org/10.1109/JSTARS.2014.2323199, 2014. a
Leinss, S., Löwe, H., Proksch, M., Lemmetyinen, J., Wiesmann, A., and Hajnsek, I.: Anisotropy of seasonal snow measured by polarimetric phase differences in radar time series, The Cryosphere, 10, 1771–1797, https://doi.org/10.5194/tc-10-1771-2016, 2016. a
López-Dekker, P., Prats, P., De Zan, F., Schulze, D., Krieger, G., and Moreira, A.: TanDEM-X first DEM acquisition: A crossing orbit experiment, IEEE Geosci. Remote S., 8, 943–947, 2011. a
Madsen, S. N.: Imaging radar interferometry, in: Manual of Remote Sensing, 2, Principles and Applications of Imaging Radar, 3rd Edn., John Wiley & Sons, 359–380, ISBN 978-0471294061, 1998. a
Massey Jr., F. J.: The Kolmogorov–Smirnov test for goodness of fit, J. Am. Stat. Assoc., 46, 68–78, https://doi.org/10.1080/01621459.1951.10500769, 1951. a
Massom, R. A., Eicken, H., Hass, C., Jeffries, M. O., Drinkwater, M. R., Sturm, M., Worby, A. P., Wu, X., Lytle, V. I., Ushio, S., Morris, K., Reid, P. A., Warren, S. G., and Allison, I.: Snow on Antarctic sea ice, Rev. Geophys., 39, 413–445, https://doi.org/10.1029/2000RG000085, 2001. a
Meier, W. N., Markus, T., and Comiso, J. C.: AMSR-E/AMSR2 Unified L3 Daily 12.5 km Brightness Temperatures, Sea Ice Concentration, Motion & Snow Depth Polar Grids, Version 1, NASA National Snow and Ice Data Center Distributed Active Archive Center [data set], Boulder, Colorado, USA, https://doi.org/10.5067/RA1MIJOYPK3P, 2018. a, b
Nghiem, S., Kwok, R., Yueh, S., and Drinkwater, M.: Polarimetric signatures of sea ice: 2. Experimental observations, J. Geophys. Res.-Oceans, 100, 13681–13698, https://doi.org/10.1080/08843759508947700, 1995. a, b
Nghiem, S., Busche, T., Kraus, T., Bachmann, M., Kurtz, N., Sonntag, J., Woods, J., Ackley, S., Xie, H., Maksym, T., Kirsteen, T., Rack, W., Langhorne, P., Haas, C., Panowicz, C., Rigor, I., Morin, P., Nguyen, L., and Neumann, G.: Remote Sensing of Antarctic Sea Ice with Coordinated Aircraft and Satellite Data Acquisitions, IGARSS 2018 – 2018 IEEE International Geoscience and Remote Sensing Symposium, Valencia, Spain, IEEE, 8531–8534, https://doi.org/10.1109/IGARSS.2018.8518550, 2018. a
Nghiem, S. V., Huang, L., and Hajnsek, I.: Theory of radar polarimetric interferometry and its application to the retrieval of sea ice elevation in the Western Weddell Sea, Antarctic, Earth Space Sci., 9, e2021EA002191, https://doi.org/10.1029/2021EA002191, 2022. a, b, c
NSIDC – National Snow and Ice Data Center: Distributed Active Archive Center (DAAC) IceBridge Data, NSIDC [data set], https://nsidc.org/data/icebridge, last access: 1 July 2024. a
Petty, A. A., Tsamados, M. C., Kurtz, N. T., Farrell, S. L., Newman, T., Harbeck, J. P., Feltham, D. L., and Richter-Menge, J. A.: Characterizing Arctic sea ice topography using high-resolution IceBridge data, The Cryosphere, 10, 1161–1179, https://doi.org/10.5194/tc-10-1161-2016, 2016. a, b
Rack, W., Price, D., Haas, C., Langhorne, P. J., and Leonard, G. H.: Sea ice thickness in the Western Ross Sea, Geophys. Res. Lett., 48, e2020GL090866, https://doi.org/10.1029/2020GL090866, 2021. a, b
Ressel, R., Singha, S., Lehner, S., Rösel, A., and Spreen, G.: Investigation into different polarimetric features for sea ice classification using X-band synthetic aperture radar, IEEE J. Sel. Top. Appl., 9, 3131–3143, https://doi.org/10.1109/JSTARS.2016.2539501, 2016. a, b, c
Rosen, P. A., Hensley, S., Joughin, I. R., Li, F. K., Madsen, S. N., Rodriguez, E., and Goldstein, R. M.: Synthetic aperture radar interferometry, P. IEEE, 88, 333–382, https://doi.org/10.1109/5.838084, 2000. a
Scott, M.: Understanding climate: Antarctic sea ice extent, NOAA Climate Government, https://www.climate.gov/news-features/understanding-climate/understanding-climate-antarctic-sea-ice-extent (last access: 22 March 2024), 2023. a
Sharma, J. J., Hajnsek, I., Papathanassiou, K. P., and Moreira, A.: Estimation of glacier ice extinction using long-wavelength airborne Pol-InSAR, IEEE T. Geosci. Remote, 51, 3715–3732, https://doi.org/10.1109/TGRS.2012.2220855, 2012. a
Singha, S., Johansson, M., Hughes, N., Hvidegaard, S. M., and Skourup, H.: Arctic Sea Ice Characterization Using Spaceborne Fully Polarimetric L-, C-, and X-band SAR With Validation by Airborne Measurements, IEEE T. Geosci. Remote, 56, 3715–3734, https://doi.org/10.1109/TGRS.2018.2809504, 2018. a, b
Tian, L., Xie, H., Ackley, S. F., Tang, J., Mestas-Nuñez, A. M., and Wang, X.: Sea-ice freeboard and thickness in the Ross Sea from airborne (IceBridge 2013) and satellite (ICESat 2003–2008) observations, Ann. Glaciol., 61, 24–39, https://doi.org/10.1017/aog.2019.49, 2020. a
Tin, T. and Jeffries, M. O.: Sea-ice thickness and roughness in the Ross Sea, Antarctica, Ann. Glaciol., 33, 187–193, https://doi.org/10.3189/172756401781818770, 2001. a
Tison, J.-L., Worby, A., Delille, B., Brabant, F., Papadimitriou, S., Thomas, D., De Jong, J., Lannuzel, D., and Haas, C.: Temporal evolution of decaying summer first-year sea ice in the Western Weddell Sea, Antarctica, Deep-Sea Res. Pt. II, 55, 975–987, 2008. a
Trujillo, E., Leonard, K., Maksym, T., and Lehning, M.: Changes in snow distribution and surface topography following a snowstorm on Antarctic sea ice, J. Geophys. Res.-Earth, 121, 2172–2191, https://doi.org/10.1002/2016JF003893, 2016. a
U.S. National Ice Center: U.S. National Ice Center Arctic and Antarctic Sea Ice Concentration and Climatologies in Gridded Format, Version 1, Boulder, Colorado USA, National Snow and Ice Data Center [data set], https://doi.org/10.7265/46cc-3952, 2020. a
U.S. National Ice Center: U. S. National Ice Center Arctic and Antarctic Sea Ice Charts in SIGRID-3 Format, Version 1, Colorado USA, National Snow and Ice Data Center [data set], https://doi.org/10.7265/4b7s-rn93, 2022. a, b
Vernet, M., Geibert, W., Hoppema, M., Brown, P. J., Haas, C., Hellmer, H., Jokat, W., Jullion, L., Mazloff, M., Bakker, D., Brearley, J. A., Croot, P., Hattermann, T., Hauck, J., Hillenbrand, C.-D., Hoppe, C. J. M., Huhn, O., Koch, B. P., Lechtenfeld, O. J., Meredith, M. P., Naveira, A. C., Garabato, Nöthig, E.-M., Peeken, I., Rutgers van der Loeff, M. M., Schmidtko, S., Schröder, M., Strass, V. H., Torres-Valdés, S., and Verdy, A.: The Weddell Gyre, Southern Ocean: present knowledge and future challenges, Rev. Geophys., 57, 623–708, https://doi.org/10.1029/2018RG000604, 2019. a
Wakabayashi, H., Matsuoka, T., Nakamura, K., and Nishio, F.: Polarimetric Characteristics of sea ice in the sea of Okhotsk observed by airborne L-band SAR, IEEE T. Geosci. Remote, 42, 2412–2425, https://doi.org/10.1109/TGRS.2004.836259, 2004. a, b
Wang, X., Jiang, W., Xie, H., Ackley, S., and Li, H.: Decadal variations of sea ice thickness in the Amundsen-Bellingshausen and Weddell seas retrieved from ICESat and IceBridge laser altimetry, 2003–2017, J. Geophys. Res.-Oceans, 125, e2020JC016077, https://doi.org/10.1029/2020JC016077, 2020. a, b, c, d, e, f, g
Weeks, W. F. and Ackley, S. F.: The growth, structure, and properties of sea ice, in: The Geophysics of Sea Ice, Springer, 9–164, https://doi.org/10.1007/978-1-4899-5352-0_2, 1986. a
Winebrenner, D., Farmer, L., and Joughin, I.: On the response of polarimetric synthetic aperture radar signatures at 24-cm wavelength to sea ice thickness in Arctic leads, Radio Sci., 30, 373–402, https://doi.org/10.1029/94RS02313, 1995. a
Yi, D., Egido, A., Smith, W. H., Connor, L., Buchhaupt, C., and Zhang, D.: Arctic Sea-Ice Surface Elevation Distribution from NASA's Operation IceBridge ATM Data, Remote Sens.-Basel, 14, 3011, https://doi.org/10.3390/rs14133011, 2022. a
Yitayew, T. G., Dierking, W., Divine, D. V., Eltoft, T., Ferro-Famil, L., Rösel, A., and Negrel, J.: Validation of Sea-Ice Topographic Heights Derived From TanDEM-X Interferometric SAR Data With Results From Laser Profiler and Photogrammetry, IEEE T. Geosci. Remote, 56, 6504–6520, https://doi.org/10.1109/TGRS.2018.2839590, 2018. a
Zwally, H. J., Yi, D., Kwok, R., and Zhao, Y.: ICESat measurements of sea ice freeboard and estimates of sea ice thickness in the Weddell Sea, J. Geophys. Res.-Oceans, 113, C02S15, https://doi.org/10.1029/2007JC004284, 2008. a


