the Creative Commons Attribution 4.0 License.
the Creative Commons Attribution 4.0 License.
 | 20 Jun 2024
Quantifying frost-weathering-induced damage in alpine rocks
Maxim Deprez
Laurenz Schröer
Veerle Cnudde
Daniel Draebing
Frost weathering is a key mechanism of rock failure in periglacial environments and landscape evolution. In high-alpine rock walls, freezing regimes are a combination of diurnal and sustained seasonal freeze–thaw regimes, and both influence frost cracking processes. Recent studies have tested the effectiveness of freeze–thaw cycles by measuring weathering proxies for frost damage in low-strength and in grain-supported pore space rocks, but detecting frost damage in low-porosity and crack-dominated alpine rocks is challenging due to small changes in these proxies that are close to the detection limit. Consequently, the assessment of frost weathering efficacy in alpine rocks may be flawed. In order to fully determine the effectiveness of both freezing regimes, freeze–thaw cycles and sustained freezing were simulated on low-porosity, high-strength Dachstein limestone with varying saturation. Frost-induced rock damage was uniquely quantified by combining X-ray computed microtomography (µCT), acoustic emission (AE) monitoring, and frost cracking modelling. To differentiate between potential mechanisms of rock damage, thermal- and ice-induced stresses were simulated and compared to AE activity. Our results underscore the significant impact of initial crack density on frost damage, with µCT scans revealing damage primarily through crack expansion. Discrepancies between AE signals and visible damage indicate the complexity of damage mechanisms. The study highlights frost cracking as the main driver of rock damage during freezing periods. Notably, damage is more severe during repeated freeze–thaw cycles compared to extended periods of freezing, a finding that diverges from field studies. This discrepancy could stem from limited water mobility due to low porosity or from the short duration of our experimental setup.
- Article
(9271 KB) - Full-text XML
-
Supplement
(620 KB) - BibTeX
- EndNote


Frost weathering is a key mechanism for rock breakdown in periglacial environments (Matsuoka and Murton, 2008) and is therefore considered to be the main driver of alpine-landscape evolution (Egholm et al., 2015; Hales and Roering, 2009). The breakdown of rock due to freezing is called frost cracking and can prepare and trigger rockfall (Matsuoka, 2019). Cracking can occur when stresses exceed thresholds (critical cracking) or by repetition of low-magnitude stresses that progressively weaken the rock (sub-critical cracking; Eppes and Keanini, 2017). Frost cracking is associated with two different processes: volumetric expansion and ice segregation (Matsuoka and Murton, 2008).
When water freezes into ice, volumetric expansion of 9 % occurs and can theoretically build up stresses of up to 207 MPa (Matsuoka and Murton, 2008), which would exceed the tensile stress of most existing rock (Perras and Diederichs, 2014). Conditions that favour volumetric expansion are a high degree (91 %) of water saturation (Walder and Hallet, 1986), rapid freezing associated with diurnal freeze–thaw cycles (Matsuoka, 2001; Matsuoka and Murton, 2008), and freezing from all sides (Matsuoka and Murton, 2008). However, conditions facilitating volumetric expansion in real rock walls are rare, as moisture conditions exceeding 91 % rarely occur during phases of rapid freezing (Sass, 2005a).
During freezing processes, ice crystals develop within cracks and pores in rock. A repulsion mechanism ensures that a thin water film (< 9 nm) persists between the ice crystal and the walls of the pore or crack (Gilpin, 1979; Webber et al., 2007; Sibley et al., 2021), facilitating the movement of unfrozen water present within the frozen rock matrix towards the ice crystal, which is driven by a thermodynamic potential gradient (Derjaguin and Churaev, 1986; Kjelstrup et al., 2021; Everett, 1961; Gerber et al., 2022). Due to ice segregation, ice expands within pores and cracks and generates crystallization pressure (Scherer, 1999) that can damage rocks. Ice segregation is most efficient in a temperature range called the “frost cracking window” (Anderson, 1998), which depends on rock strength (Walder and Hallet, 1985; Mayer et al., 2023). Common temperature ranges vary from −6 to −3 °C for low-strength Berea sandstone (Hallet et al., 1991) but can drop to −15 to −5 °C for high-strength rocks (Walder and Hallet, 1985; Mayer et al., 2023). Ice segregation can occur in rocks with low saturation (Mayer et al., 2023) and is theoretically more favourable in environments with slow freezing rates and consistently low temperatures, which are typical of seasonal freezing conditions (Matsuoka and Murton, 2008; Walder and Hallet, 1986).
Frost cracking serves as an indicator of frost damage or the increase in porosity in rocks and rock walls, yet its gradual and sub-critical nature makes direct measurements challenging. Consequently, laboratory studies have adopted indicators such as AE signals (Hallet et al., 1991; Mayer et al., 2023; Maji and Murton, 2021; Duca et al., 2014), frost heave or crack expansion (Murton et al., 2006; Draebing and Krautblatter, 2019), alterations in mechanical properties like P-wave velocity, Young's modulus, uniaxial strength or porosity (Whalley et al., 2004; Matsuoka, 1990; Jia et al., 2015; Eslami et al., 2018; Prick, 1997), and frost cracking simulations (Mayer et al., 2023; Murton et al., 2006) to estimate its impact. At the scale of rock walls, proxies such as AE signals (Girard et al., 2013; Amitrano et al., 2012), fracture density (Hales and Roering, 2009; Draebing and Mayer, 2021; Messenzehl et al., 2018), fracture opening (Draebing, 2021; Draebing et al., 2017b, a), rock wall erosion rates (Draebing et al., 2022; Matsuoka, 2008), and frost cracking simulations (e.g. Draebing et al., 2022; Sanders et al., 2012) have been utilized to infer frost cracking activity. However, all these techniques provide proxies for frost cracking, and as low-porosity alpine rocks are characterized by micro-cracks, changes in frost cracking proxies are very small: often within the uncertainty range of the techniques used and therefore do not provide reliable results. In contrast, X-ray-computed microtomography (µCT) enables the quantification of material damage (Cnudde and Boone, 2013; Withers et al., 2021) and has previously been applied to track frost cracking damage in high-porosity rocks (De Kock et al., 2015; Deprez et al., 2020a; Maji and Murton, 2020; Dewanckele et al., 2013) or assess post-experimental frost damage along artificial cracks in low-porosity rocks (Wang et al., 2020a, b) exposed to frequent freeze–thaw cycles.
To our knowledge, no study has directly quantified the effectiveness of different freeze–thaw cycles or demonstrated whether frost cracking creates new cracks or propagates existing cracks in high-strength, low-porosity rocks. In this study, we exposed low-porosity, high-strength Dachstein limestone to frequent diurnal and seasonal sustained freeze–thaw cycles during laboratory freezing experiments. We monitored acoustic emission events during the experiments, modelled thermal and ice-induced stresses, and applied µCT to pre- and post-stressed rocks to quantify and track crack propagation and to assess the frost cracking efficacy of different freeze–thaw cycles.
2.1 Rock samples and mechanical properties
We collected three large Dachstein limestone boulders in the Dachstein mountain range, Austria. Dachstein limestone (upper Triassic) is a massive rock with a minor occurrence of fractures, which is widespread in the Northern Calcareous Alps (Pfiffner, 2010). From boulder one, we drilled three cylindrical samples 10 cm (in length) × 5 cm (in diameter) and measured rock density, ρr, and open porosity, nr, by immersion weighing (DIN-EN 52102:2013-10, 2013; DIN-EN 1097-6:2022-5, 2022). The determined rock density was 2690 kg m−3, and rock porosity was 0.1 % (Table 1). To quantify shear modulus, G; Poisson's ratio, ν; and Young's modulus, E, dilatational-wave-velocity measurements were performed using a Geotron ultrasonic generator (USG40) and a Geotron preamplifier (VV51) with 20 kHz sensors. Sensor-to-sample coupling was improved by applying 0.2 MPa pressure. Detection and analyses of the signals were processed with a Pico oscilloscope and the Geotron Lighthouse DW software. The determined value of shear modulus was 24.02 ± 0.05 GPa, Poisson's ratio was 0.327 ± 0.003, and Young's modulus was 63.74 ± 0.04 GPa (Table 1). We drilled two cylindrical samples with a size of 5 × 2.5 cm from boulder one to measure tensile strength, σt, following Lepique (2008). The determined tensile strength was 7.9 ± 0.7 MPa. Fracture toughness, KiC, was tested in the Magnel–Vandepitte Laboratory at Ghent University using a three-point bending test setup on boulder two (Carloni et al., 2019; Bazant and Planas, 1998). For Dachstein limestone, the fracture toughness is 1.32 ± 0.1 MPa m. For the freezing experiments, we drilled six cylindrical samples 91.5 mm long and 25.5 mm in diameter from boulder three (Fig. 1b) to keep micro-fractures as homogeneous as possible. We assume that mechanical properties from the three rock boulders are identical as they were collected from the same rock wall.
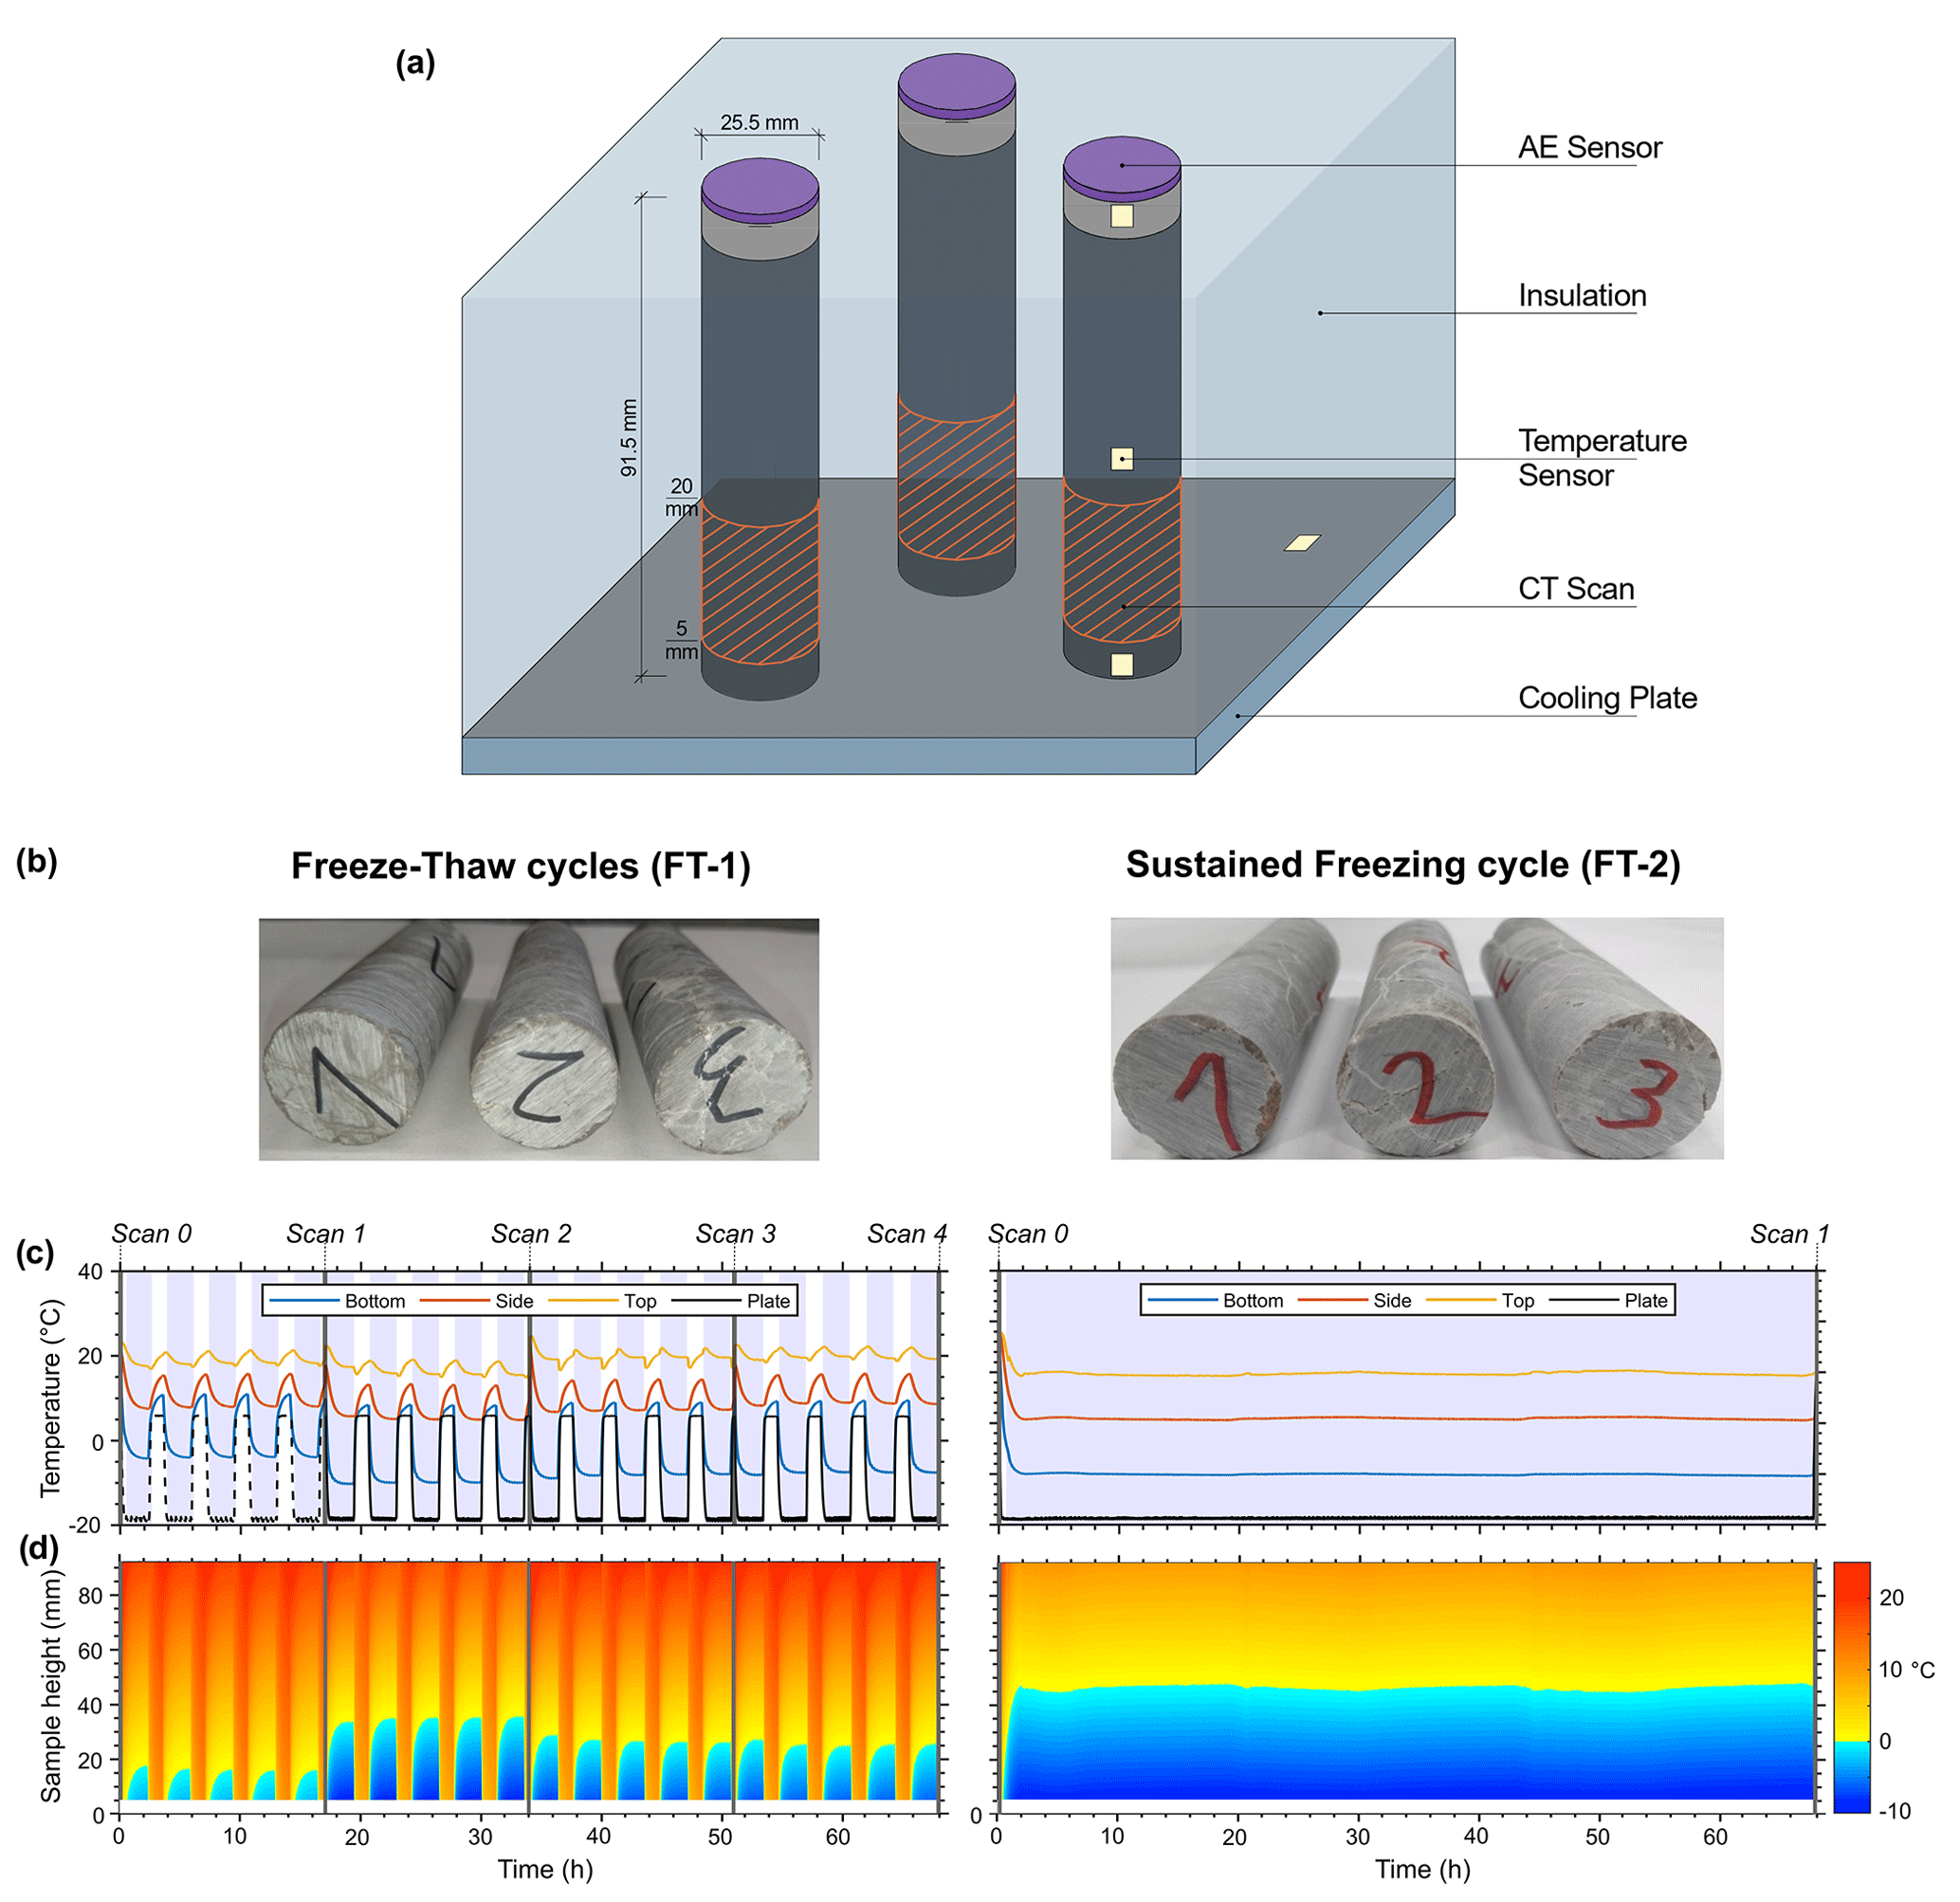
Figure 1The design of the experiment was influenced by the methodologies of Hallet et al. (1991) and Mayer et al. (2023), focusing on distinguishing ice segregation from other weathering mechanisms as a distinct weathering process. (a) Schematic representation of the laboratory freezing setup. We created a linear temperature gradient by cooling three rock samples, each with varying levels of saturation, using a cooling plate positioned at the bottom, while exposing the top of the samples to ambient room temperature conditions. (b) The 91.5 × 25.5 mm cylindrical Dachstein limestone samples used for the freeze–thaw experiments. (c) Temperature cycles were implemented for FT-1 and FT-2, along with the corresponding measurements of rock and cooling plate temperatures. In FT-1, between scan 0 and 1, there was inadequate coupling of the temperature sensor, resulting in excessively high temperature readings. (d) Temperature isoplots of derived temperature distribution within the samples.
2.2 Freezing experiment setup
Three rock samples were placed at the same time into an insulating holder on a cooling plate, which was driven by Peltier elements (TE technology, CP-121HT), a power supply unit (PS-24-13), and a temperature control system (TC-48-20 OEM; Fig. 1a). While the bottom part of each sample was exposed to freezing conditions from the cooling plate, the top part was left open to non-freezing ambient laboratory conditions (∼ 20 °C). With this setup, we simulated a closed system that provided a linear temperature gradient and a water body inside the rock samples reflecting simplified natural rock wall conditions. During the freezing experiments, rock temperature was monitored every minute at the side close to the top, middle, and bottom of one rock sample with three SE060 high-temperature type-K thermocouples (accuracy ±0.5 °C, Pico Technology; Fig. 1b) to avoid damaging the samples by drilling. The surface temperature of the sample has a slight offset compared to the internal temperature at the centre, with lower temperatures in the core of the sample. However, we assume this offset was minor due to the high thermal conductivity of limestone (2.4 W m−1 K−1; Cermák and Rybach, 1982). An additional thermocouple was placed on the cooling plate to record cooling plate temperatures. To test the efficiency of freeze–thaw cycles, we exposed three rock samples at the same time to two different freeze–thaw cycles.
As saturation influences frost weathering, we used rock samples with an initial saturation of approximately 30 %, 70 % and 100 % categorized as low, partial, and high saturation, respectively. The samples were saturated by immersing the lower part into a distilled water bath. To prevent air inclusions, we slowly raised the water table until the samples were completely immersed and a constant mass prevailed (that we refer to as high saturation). Subsequently, samples were dried under atmospheric conditions and weighed until low (30 %) or partial saturation (70 %) was reached. To minimize moisture loss through evaporation, the samples were wrapped in clingfilm. As the porosity of the samples is 0.1 %, the level of saturation is inaccurate and provides only a rough estimation. Furthermore, the saturation can change during the experiments due to moisture loss, or the distribution of rock moisture can alter within the rock samples. We chose a 91.5 mm length for the rock samples to enable moisture migration towards the sample parts close to the cooling plate where freezing occurred. Due to the low number of samples, we cannot quantify saturation effects on frost weathering; however, our setup enables us to incorporate the variability in saturation levels occurring in natural rock walls and to test the consistency of frost damage patterns.
To monitor acoustic emission (AE), which is used as a proxy for cracking (Eppes et al., 2016; Hallet et al., 1991), a Physical Acoustics AE sensor (PK6I) with a frequency between 35 and 65 kHz was mounted with acrylic sealant on the top of each rock sample (Fig. 1a). The detected AE signals were recorded with a Physical Acoustics micro SHM node. Recorded data were subsequently processed and filtered using the Physical Acoustics AEwin software. Due to the low background noise of our setup, we set an initial signal threshold of 30 dBAE, similar to the setup of Mayer et al. (2023), who established a threshold of 35 dBAE due to the presence of stronger background noise. We performed lead break tests as sample cracks (Eppes et al., 2016) before and after each scan to control sensor coupling and evaluate system performance and wavelength form. Poor coupling of an AE sensor could lead to diminished AE amplitudes, meaning signals of low amplitude might not be detected by the system. To avoid erroneous AE signals stemming from the setup, the system underwent testing without any freezing or temperature alterations.
During freezing test 1 (FT-1), we simulated diurnal freeze–thaw conditions and exposed three samples with different saturation levels (Fig. 1b) to 20 freeze–thaw cycles (Fig. 1c). In each cycle, we cooled the samples until the cooling plate reached −20 °C and the rock temperature at the bottom of the samples was approximately −10 °C, followed by 1 h warming until a cooling plate temperature of 5 °C and sample temperatures between 5 and 7 °C were achieved. Small sample temperature deviations could have occurred due to thermistor placement at the side of the sample or due to ice development between the cooling plate and rock samples. Our setup enabled us to develop a thermal gradient within the samples (Fig. 1d) where the lower parts of the rock samples between 0 and 40 mm sample height, including the scanned area between 5 and 19 mm sample height (Fig. 2a), were exposed to freezing conditions, while the upper parts remained unfrozen. The freezing rate we utilized, 12.5 °C h−1 at the cooling plate, might surpass the rates observed in natural rock wall settings, yet it is comparable to those employed in earlier freezing studies (Jia et al., 2015; Matsuoka, 1990). The applied freezing rate could amplify frost cracking and result in an overestimation of frost damage.
In our second experiment, we subjected three rock samples, each with varying levels of saturation (Fig. 1b), to an extended period of freezing (FT-2), maintaining the cooling plate at −20 °C for 68 h. This setup resulted in a temperature gradient within the samples, with the lower 0–40 mm of the samples experiencing freezing temperatures and the upper section remaining above freezing, maintaining a stable thermal gradient for about 66 h (Fig. 1d). The setup aimed at enabling the migration of water from the unfrozen segment to the frozen one, enhancing the potential for frost cracking; however, the samples' low porosity combined with the small size of the unfrozen segments limited the amount of water that was able to migrate, potentially resulting in an underestimation of frost damage compared to what might be observed under natural conditions.
2.3 µCT imaging
In order to identify crack locations and quantify crack growth, X-ray-computed microtomography (µCT) was performed at the Ghent University Centre for Tomography (UGCT) with the CoreTom (TESCAN XRE) µCT scanner. For experiment FT-1, µCT scans were performed before the start and after every five cycles (Fig. 3). For the sustained freezing experiment (FT-2), rock samples were scanned before and after the experiment. As only the bottom part of the sample (0–40 mm) experienced freezing (Fig. 1c–d), the rock sample sections between 0 and 20 mm were scanned (Fig. 2a). The dimensions of the section were determined to optimize the resolution, as the resolution of scanning is influenced by the size of the sample (Cnudde and Boone, 2013). The µCT system settings for our experiment were set to 179 kV for the X-ray source with a power output of 20 W. The scans were performed at binning 2 and a voxel size of 20 µm. A 1 mm thick aluminium plate was used to filter low-energy X-rays and reduce beam hardening. For each sample, 2142 projections were made with an exposure time of 600 ms. The raw µCT data were reconstructed using the software PANTHERA (TESCAN XRE), where beam hardening and ring filters were applied and resulted in a stack of cross-sections saved as 16-bit .tiff images. All subsequent image handling, such as registration, segmentation, and analyses, were performed with Avizo3D Pro (Version 2021.1; ThermoFisher Scientific). In Avizo, a sandbox filter was conducted to bin contrast variations inside the images and match contrast between the single scans. We tuned the parameters until the best visual result was observed. Therefore, sample voids (pore space) and the matrix (sample material) of each image were able to be separated by thresholding over contrast. We followed Deprez et al. (2020a) and defined a distinguishable feature in the scan image as a minimum spatial resolution of 3 times the voxel size (60 µm). Volume fractions and the expansion of pore space in the sample were assessed using photogrammetry in Avizo. For each image, the software detected and quantified distinctions between the void voxel, VV, and the matrix voxel, VM, which we call “crack fraction”, cf (Fig. 2b). Crack fraction is derived by
This approach enabled subsequent comparisons between scans to assess the development of pore space growth in the sample (Fig. 2c and d). The crack fraction parameter was defined by the total amount of segmented pore space (voids) per image in the image stack (cross-section) divided by the total amount of segmented sample material (matrix + voids). Due to the effects of beam hardening, which result in image distortion at sample heights between 0 and 5 mm and between 19 and 20 mm, our analyses were concentrated on the portion of the rock sample ranging from 5 to 19 mm in height. We quantified crack growth (pore space growth) by comparing the crack fraction per layer after each scan (Figs. 2d and 6a–f).
If growth occurs in every crack or void, this implies that the distribution of initial cracks and/or voids could either accelerate or decelerate the growth of cracks. Consequently, crack growth cannot be directly compared across samples due to variations in crack distribution. To address this, we adjusted each scan, cfi, by its initial crack fraction, cf0, allowing for an assessment of crack growth that is independent of the initial crack distribution. The normalized crack fraction, cfnorm, for each scan is calculated as follows:
where i represents the scan number. For the purpose of assessing the progression of quantified frost damage both within a single sample and among different samples, we computed the mean of cfnorm for each scan.
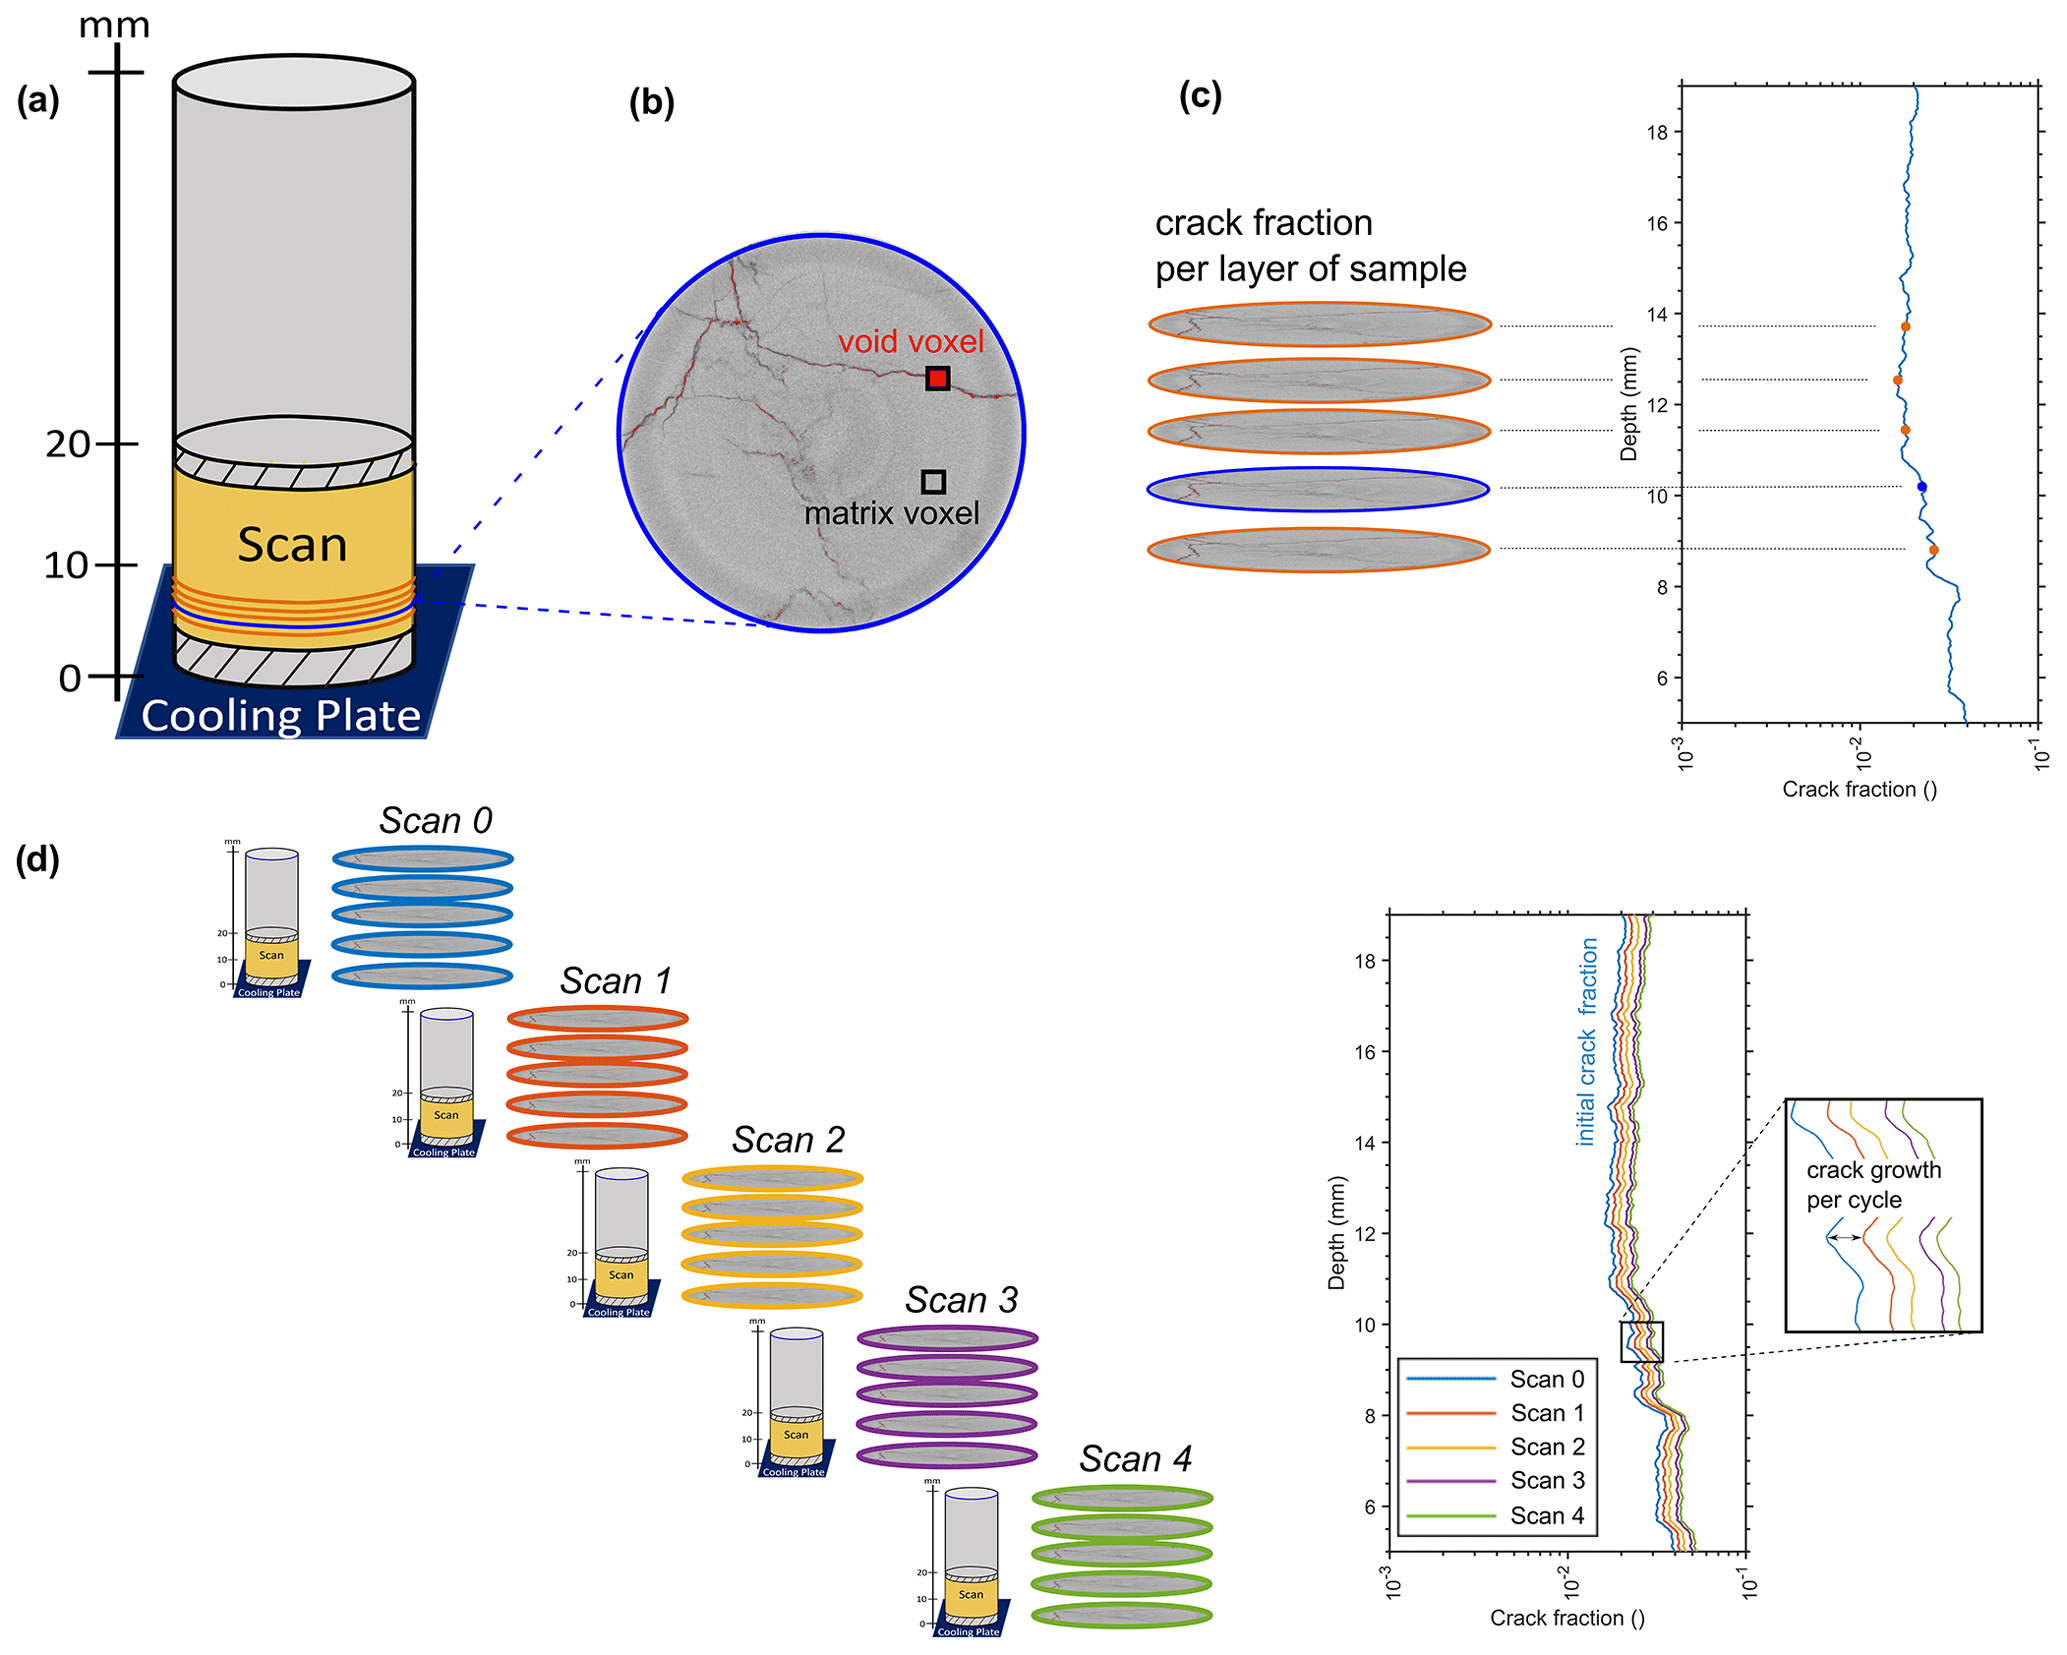
Figure 2Schematic drawing from scan to crack growth. (a) Scanned volume from 0 to 20 mm sample height. Due to beam hardening effects (dashed black area) at the edges, only the area between 5 and 19 mm in sample height was analysed. (b) Example scan of one layer (20 µm thick) with example void or crack voxel and matrix voxel derived by Avizio3D Pro. (c) Crack fraction derived for each layer over the whole scanned height from 5 to 19 mm by photogrammetry. (d) Example of resulting crack growth per cycle with initial crack fraction (blue line).
2.4 Thermal and ice stress modelling
We modelled thermal and ice stresses to determine potential drivers of AE signals and porosity growth. The models require a one-dimensional temperature distribution inside the samples. Temperature distributions were calculated by assuming a linear and homogeneous temperature gradient between all temperature sensors (Fig. 1d and e). Latent heat effects were incorporated in general, as our sensors measured rock temperatures that were affected by latent heat effects. All thermal and ice stress simulations were performed in MATLAB (Version R2021b; MathWorks). Thermal stress occurred in our samples as a result of changing temperatures. We modelled one-dimensional thermal stress, σTL, based on Paul (1991):
with the thermal expansion coefficient, αT; shear modulus, G; and Poisson's ratio, ν (Table 1). TL±5 represents a running temperature mean over 5 min. Our model approach did not incorporate complex crack geometries of the samples; therefore, we could only provide quantitative estimates of thermal stress. Hence, we focused in our analysis on the timing of thermal stresses and did not analyse absolute stress values.
We applied frost cracking modelling to determine when ice stresses occur during the tests. Frost cracking modelling was performed using the model of Walder and Hallet (1985), which combines hydraulic and mechanical rock properties. The model simulated ice pressures in a single 1 mm long mode I crack. Therefore, this model simplified crack geometry and provided quantitative estimates of ice pressure. Due to the abstract model predictions, we only used quantified ice pressure to interpret the timing of AE events and not to relate ice pressure to rock damage. We tested different parameter influences on model prediction in a sensitivity analysis (see Figs. S1 and S2 in Supplement). The basic model requirements to start ice segregation are rock temperatures below the pore freezing point, Tf, and an unfrozen area inside the rock that acts as a water reservoir (Fig. 1d). The transition area between a potential ice lens in the frozen part and the unfrozen area is called “frozen fringe”. The model assumes a fully saturated rock. Ice pressure rises between the lens and the pore or crack wall when water migration is driven through the frozen fringe by a thermodynamic potential gradient. The amount of supplied water is governed by Darcy's law but restrained due to hydraulic conductivity inside the frozen fringe and flow resistance due to the thin film between ice and crack wall.
Following Walder and Hallet (1985), we chose a hydraulic conductivity, khc, of m s−1. Flow resistance between the ice and pore wall depends on grain size, R; liquid layer thickness, hl; and ice-free porosity, nf. Walder and Hallet (1985) set the grain size to 0.75 mm, the liquid layer thickness to 6 nm °C (following Gilpin, 1980) at a temperature of −1 °C), and neglected ice-free porosity. A simplified potential ice lens has the form of a penny-shaped crack with a crack radius, c, and a width, w. With water migrating towards the ice lens, ice pressure rises inside the lens and finally leads to tip cracking (mode I type). The initial crack length (2 times the crack radius) is set between 1 and 40 mm, with the crack orientation parallel to the sample bottom (φp=0°). Based on Walder and Hallet (1985), shear modulus, G, and Poisson's ratio, ν, determine how the penny-shaped crack is deformed elastically into an oblate ellipsoid when ice pressure, pi, is applied and is described for very thin cracks (w≪c) to
where n represents the incremental depth (1 mm), and t denotes the incremental timing (1 min). The crack finally breaks sub-critical inelastically at the tip (mode I type) and propagates at a growth rate, V, when one-third of the critical fracture toughness, KC (), is exceeded. For , crack growth can be expressed following Walder and Hallet (1985) as
with KI as the stress intensity factor, and V=0 when . Sub-critical cracking can be also expressed by the critical ice pressure (13.7 MPa), which is derived from transforming from Walder and Hallet (1985) and incorporating the measured critical fracture toughness of 1.32 ± 0.1 MPa m and an initial crack length of 1 mm. We set the dependent growth-law parameters Vc and γ to 340 m s−1 and 37.1 (Table 1) following Westerly granite (Walder and Hallet, 1985). Our model simplifies the complex process of frost weathering in natural rock. We conducted a sensitivity analysis to assess the impact of various rock parameters and selected the optimal value based on these findings (see Figs. S1–S2 in the Supplement and Sect. 4.4).
Table 1Parameters used for thermal stress and frost cracking modelling of Dachstein limestone samples.
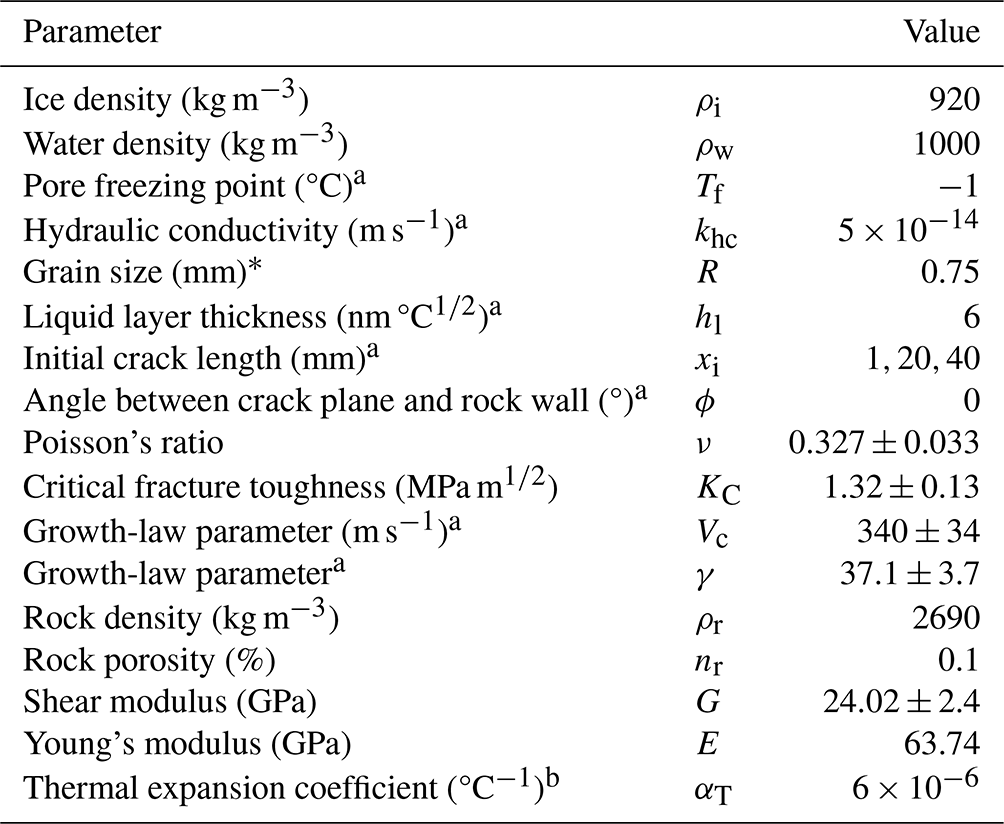
a Walder and Hallet (1985), b Pei et al. (2016).
3.1 Continuous AE, temperature monitoring, and stress modelling
3.1.1 Freeze–thaw cycles (FT-1)
The rock sample bottoms were exposed to a temperature range of −19 to 6 °C on the cooling plate. Initial temperature loggers were poorly attached to the rock, causing discrepancies in bottom surface temperatures during the first five freeze–thaw cycles compared to later cycles, as shown in Fig. 3a, suggesting that the actual temperatures were likely lower than recorded. After five cycles, a temperature sensor was added to the cooling plate. Between freeze–thaw cycles 5 and 20, the rock bottom temperature reached minimum temperatures of −10 to −8 °C and maximum temperatures of 8.5 to 9.5 °C, while the top sensor consistently registered 15 to 24 °C.
More AE hits were recorded during freezing phases compared to non-freezing ones (Fig. 3c). The majority of hits occurred when bottom temperatures were below freezing, with the high-saturation sample registering 235 hits, the partial-saturation sample 326 hits, and the low-saturation sample 123 hits. Positive temperature readings yielded fewer hits: 82 for the high-saturation sample, 89 for the partial-saturation sample, and 57 for the low-saturation sample. Total AE hits observed were 317 for the high-saturation sample, 415 for the partial-saturation sample, and 180 for the low-saturation sample.
Throughout the cycles, a pattern of accumulating AE hits among the samples is evident. Initially, the high-saturation sample accumulated the majority of hits in the first 10 cycles (121 hits). However, there was a notable increase in AE hits for the partial-saturation sample, eventually leading to a higher total than the high-saturation sample between 10 and 20 cycles (173 hits). Given the consistent trend observed in both the high- and low-saturation samples, a likely shift in the coupling between the AE sensor and the sample is suggested. Consequently, it is probable that the total AE hits for the partial-saturation sample were fewer than those for the high-saturation one. Due to two recording interruptions of the AE logger, AE hits for the FT-1 cycle were likely underestimated.
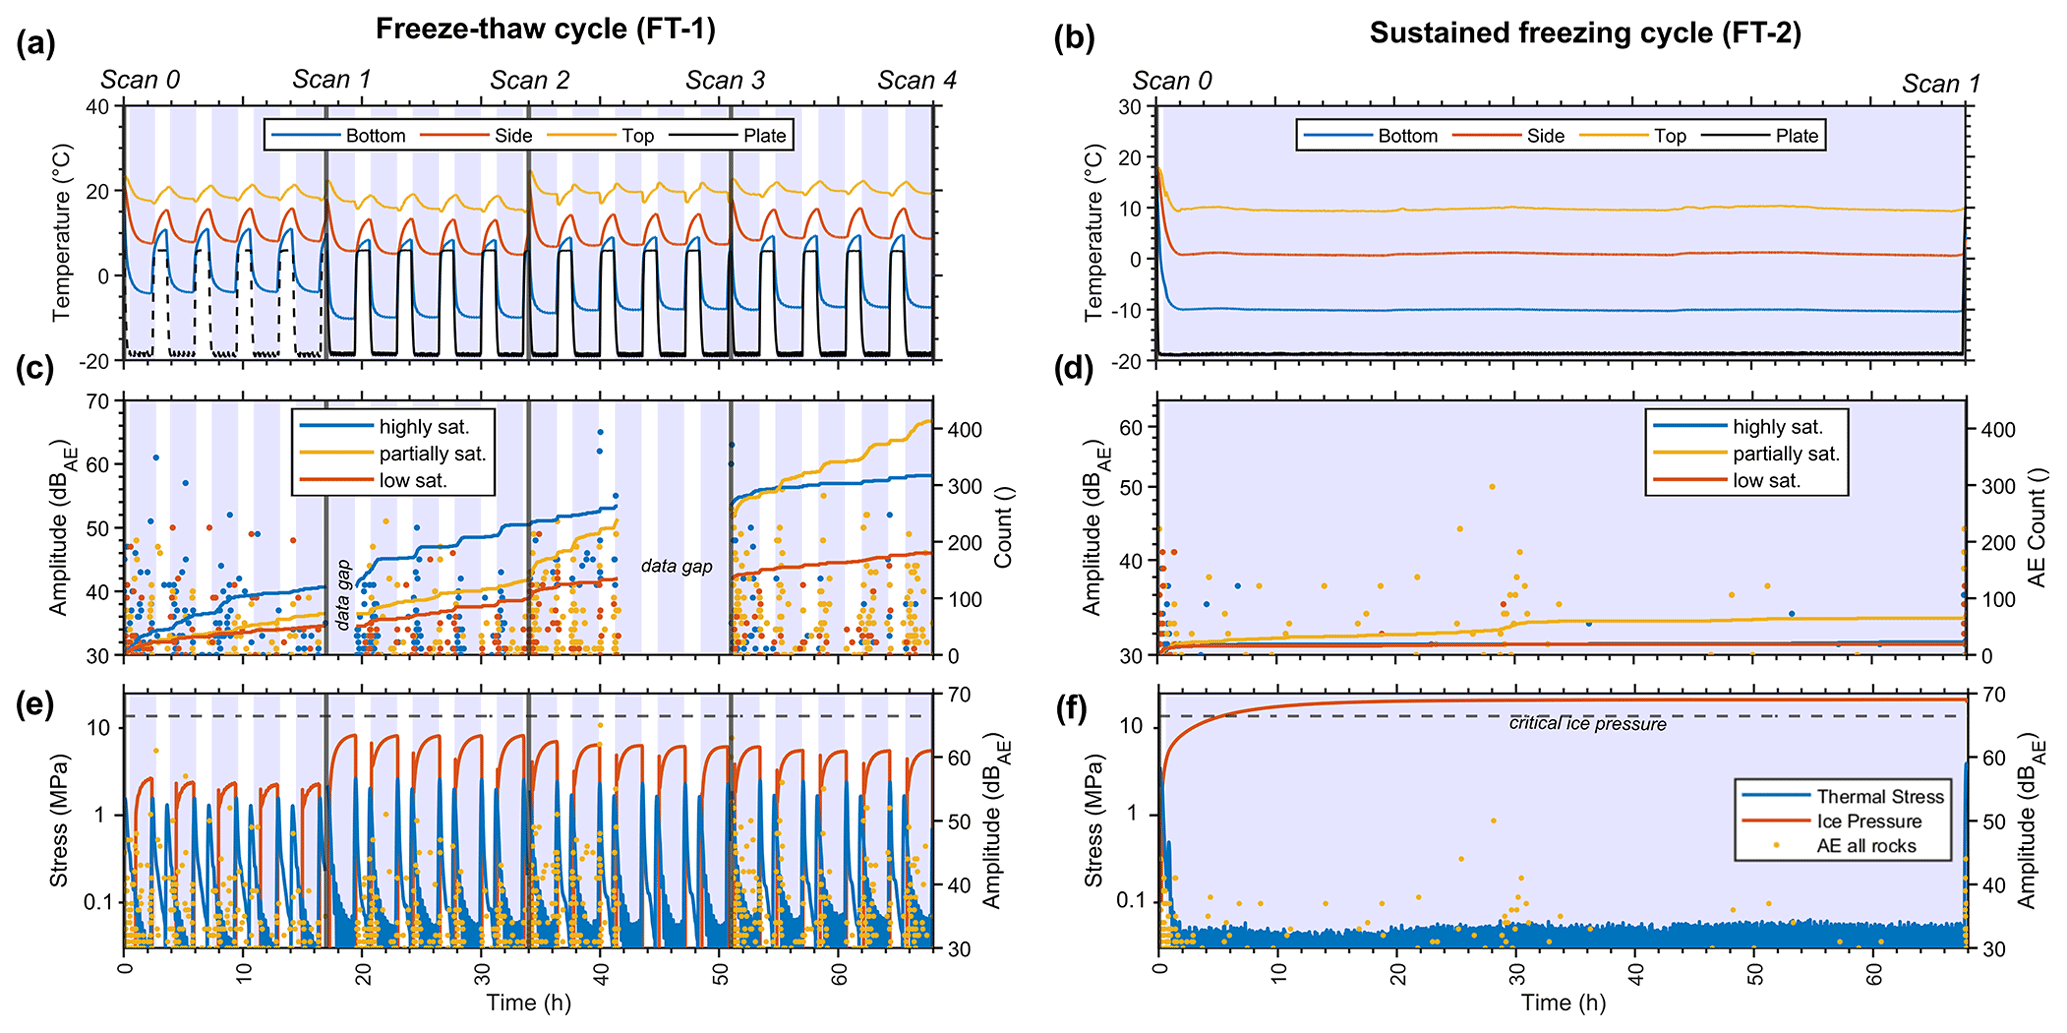
Figure 3FT-1 resulted in significantly more AE hits than FT-2, as indicated by thermal stress models but not reflected in frost cracking models, where FT-2 showed higher predicted ice stresses. More AE hits were recorded during freezing phases compared to non-freezing ones. (a–b) Measured rock and cooling plate temperatures, respectively; (c–d) recorded AE hits (coloured dots) and cumulative AE hits (coloured lines); and (e–f) modelled thermal and ice stresses at the bottom temperature sensor plotted against time for FT-1 and FT-2 with AE hits from all samples. The dashed black line highlights cooling plate temperatures according to the controller, while black lines indicate measured plate temperature (the cooling plate sensor was attached after the first 5 cycles). The temperature offset between scan 0 and 1 during FT-1 in (a) is a result of poor connectivity of the bottom temperature sensor. Blue backgrounds highlight periods when rock bottom samples were exposed to temperatures below 0 °C.
Our model indicated that both thermal- and ice-induced stresses peaked during freezing temperatures (Fig. 3e). However, due to a temperature discrepancy in the initial five freeze–thaw cycles, the modelled thermal and ice stresses were underestimated (Fig. 3e). From the 5th to the 20th cycle, the highest thermal stresses occurred as temperatures transitioned from thawing to freezing, reaching pressures of 2.15 ± 0.25 and 2.95 ± 0.20 MPa, respectively. These stresses were minimal at stable temperatures. Ice stress was present only during freezing, with the model predicting increasing ice stresses up to a maximum of 6.85 ± 1.35 MPa at the end of each freezing phase. This is significantly below the critical ice pressure threshold (13.7 MPa) for sub-critical cracking.
3.1.2 Sustained freezing cycle (FT-2)
In the FT-2 run, the partial-saturation sample registered the highest number of AE hits, with ice stresses being a major factor. The rock samples underwent 68 h of freezing, maintaining a constant bottom temperature of −10 ± 0.5 °C (Fig. 3b). During this period, the middle sensor recorded a slightly positive temperature of 0.9 ± 0.3 °C, and the top sensor stayed at 9.8 ± 0.4 °C. AE logging revealed 28 hits for the high-saturation sample, 77 hits for the partial-saturation sample, and 23 hits for the low-saturation sample (Fig. 3d). The fixed freezing phase caused 11 hits to occur in the high-saturation rock, 53 hits in the partial-saturation rock, and 8 hits at the low-saturation rock. Thermal stress modelling indicated peak stresses of 3.6 MPa during cooling and 3.9 MPa during warming at the cycle's start and end (Fig. 3f), dropping below 0.1 MPa at stable temperatures. Ice stress models showed a continuous increase in ice stress throughout the freezing phase, reaching a maximum of 21 MPa, surpassing the critical ice pressure threshold of 13.7 MPa after 5.4 h.
3.2 Discontinuous µCT monitoring
3.2.1 Freeze–thaw cycles (FT-1)
The µCT scans conducted with a spatial resolution of 60 µm indicated that the majority of the pore volume in our samples consisted of cracks, with changes in volume manifesting as crack expansion (Fig. 4). The expansion of cracks was found to be consistent throughout the height of the sample, indicating that the growth of cracks was uniform from the topmost scanned section (19 mm) to the bottommost (5 mm). However, there was a discernible positive relationship between an initial crack and subsequent crack growth (Fig. 5a–c). Crack fraction in the initial scan (scan 0) before freezing exhibited variations from in the low-saturation rock, to in the partial-saturation rock, and to in the high-saturation rock. The final (scan 4) crack fraction was (an increase of 35 %) for the low-saturation rock, (an increase of 33 %) for the partial-saturation rock, and (an increase of 51 %) for the high-saturation sample.
To mitigate the influence of initial crack distribution on crack growth analysis, we normalized the growth of crack volume for each sample relative to its initial crack fraction (see Eq. 2). This normalization showed that crack growth was consistent throughout the sample's height, although the extent of growth varied with saturation levels (Fig. 5g–i). Scan 4 revealed a final mean normalized crack growth of 1.34 ± 0.8 (equivalent to 34 % more crack volume than the initial value) for the low-saturation sample, 1.29 ± 0.11 (29 % increase) for the partial-saturation sample, and 1.52 ± 0.13 (52 % increase) for the high-saturation sample. The mean normalized increase in crack volume between scans was 0.8 ± 0.03 (8 % increase) for the low-saturation sample, 0.07 ± 0.04 (7 % increase) for the partial-saturation sample, and 0.13 ± 0.05 (13 % increase) for the high-saturation sample.
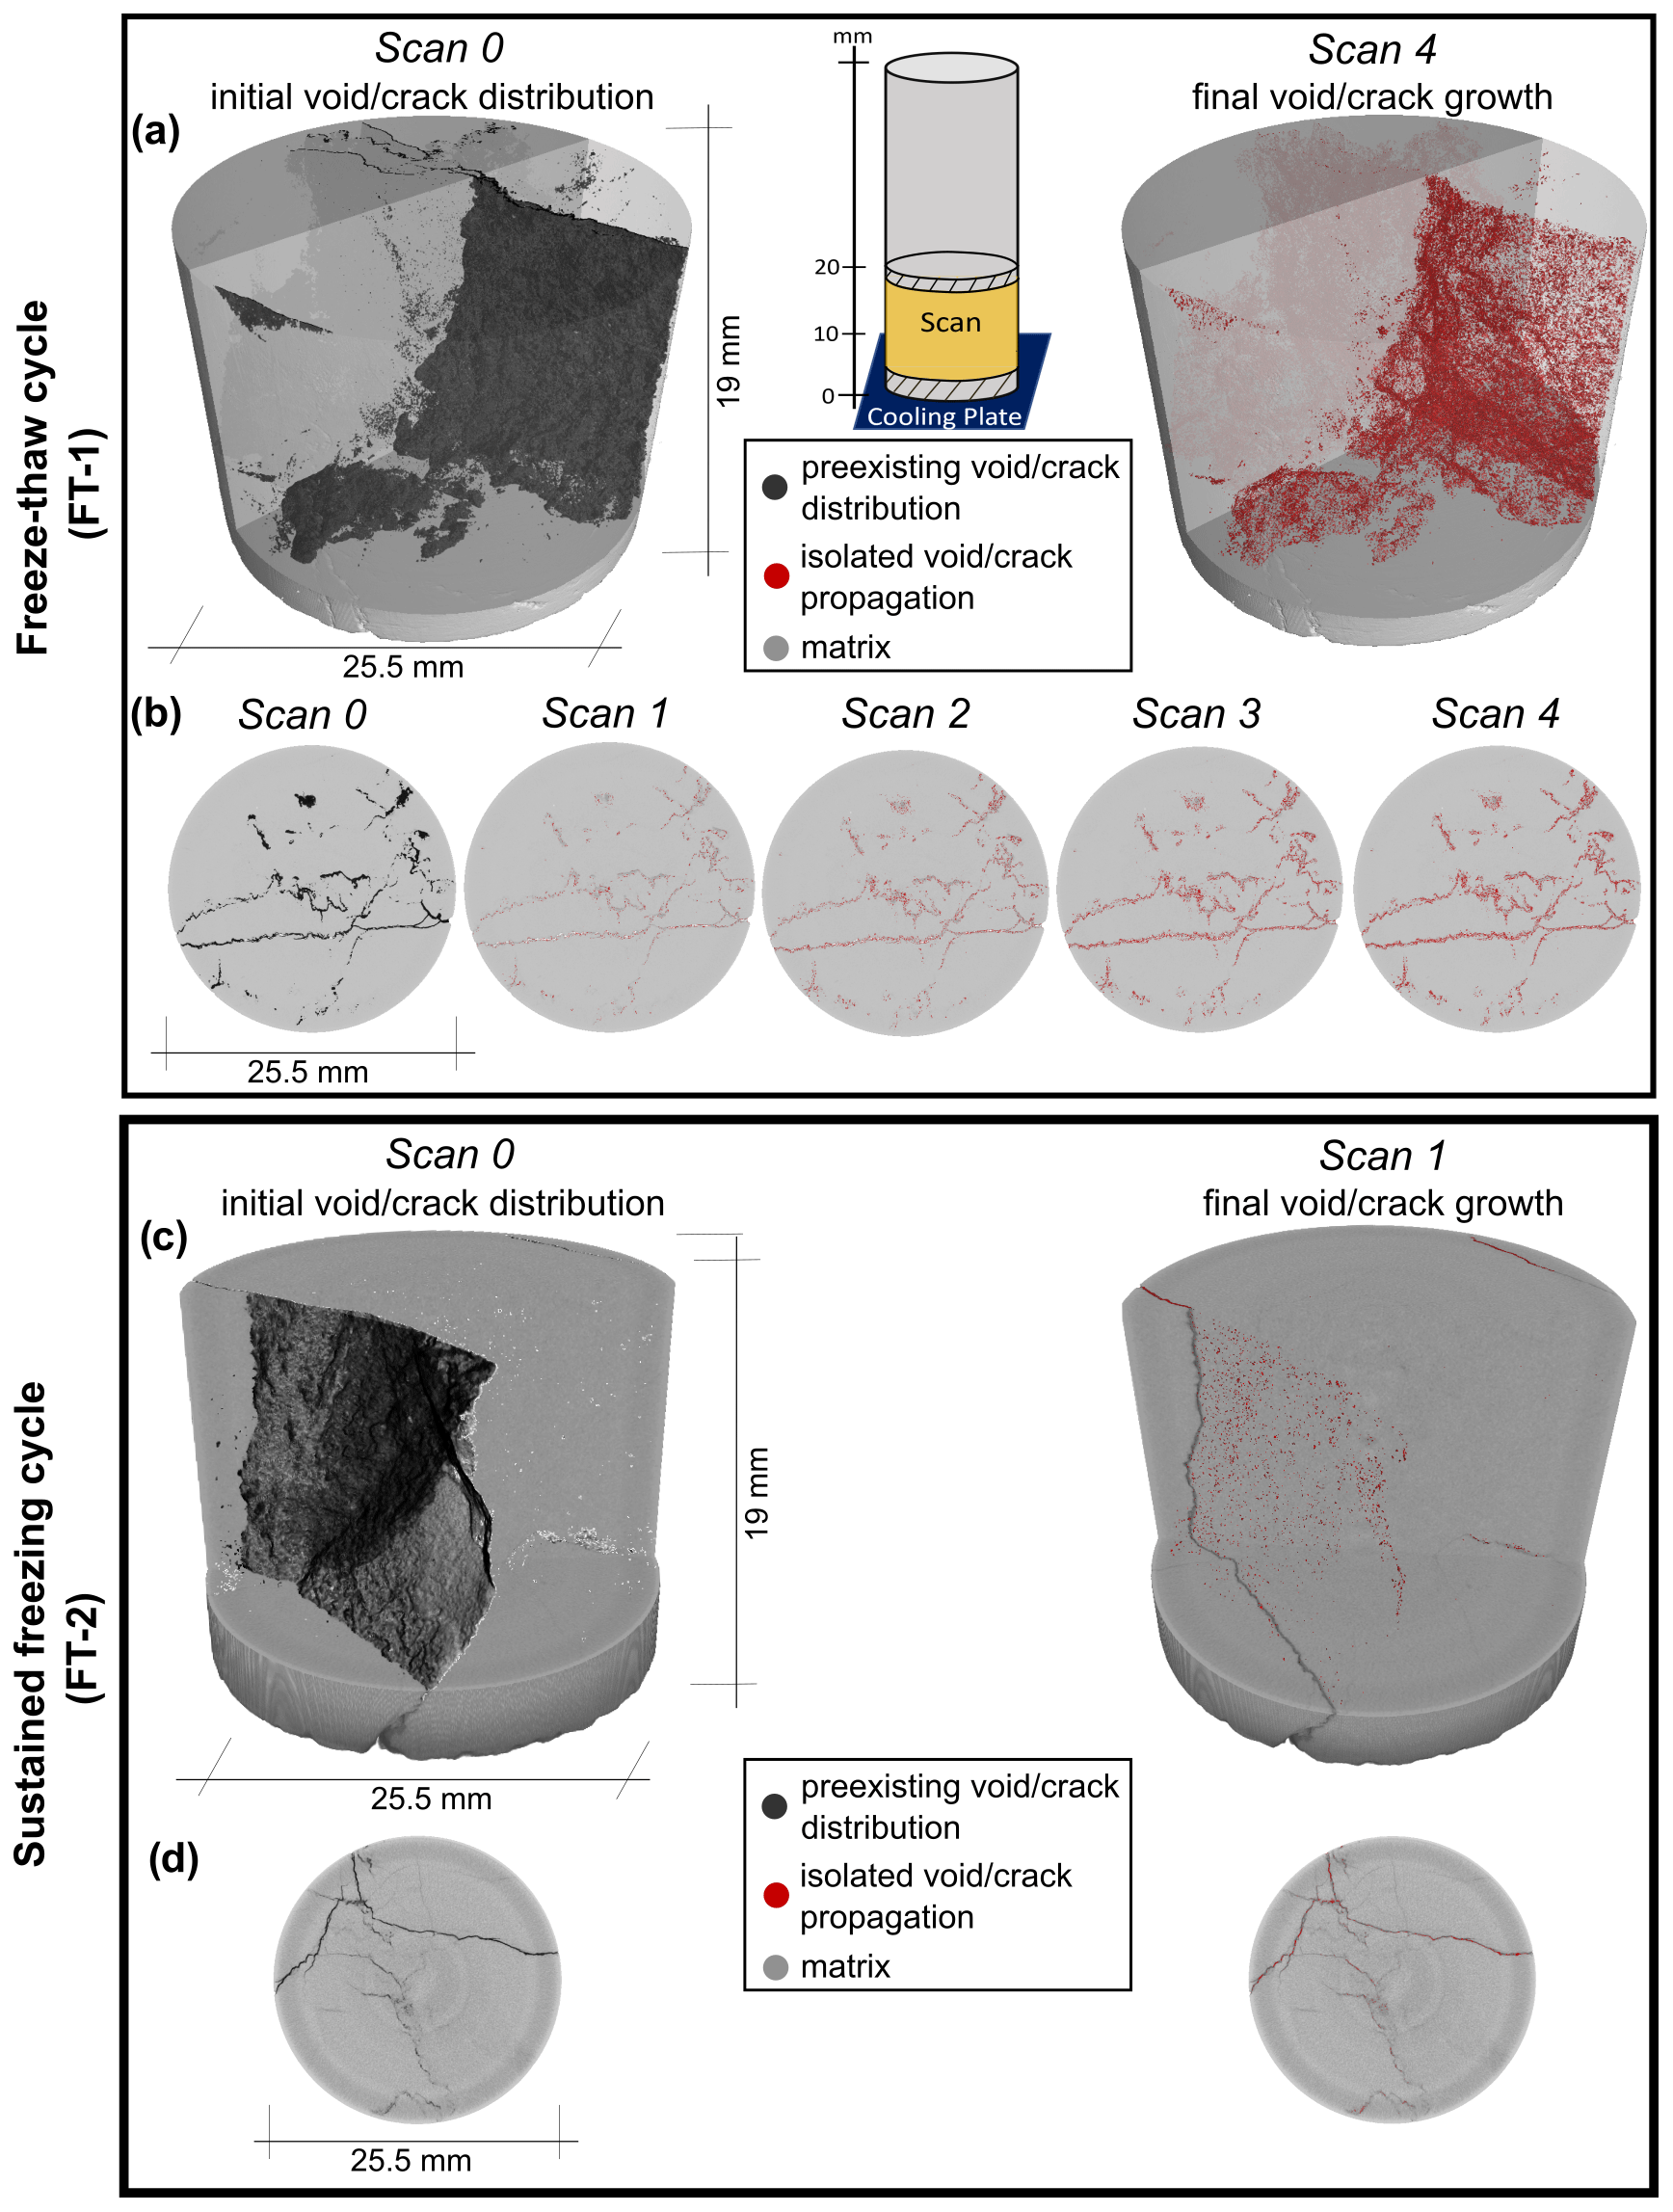
Figure 4µCT visualizations of crack growth for cycles FT-1 and FT-2. (a) Three-dimensional µCT scans before (scan 0) and after (scan 4) the last freeze–thaw cycle of the low-saturation rock sample exposed to FT-1 and (c) the partial-saturation rock sample exposed to FT-2. The initial distribution of cracks and/or voids is depicted in black, whereas red illustrates solely the isolated growth of these cracks. Example of µCT scan slices at an 8 mm height from the bottom for (b) the low-saturation sample exposed to FT-1 and for (d) the partial-saturation sample exposed to FT-2.
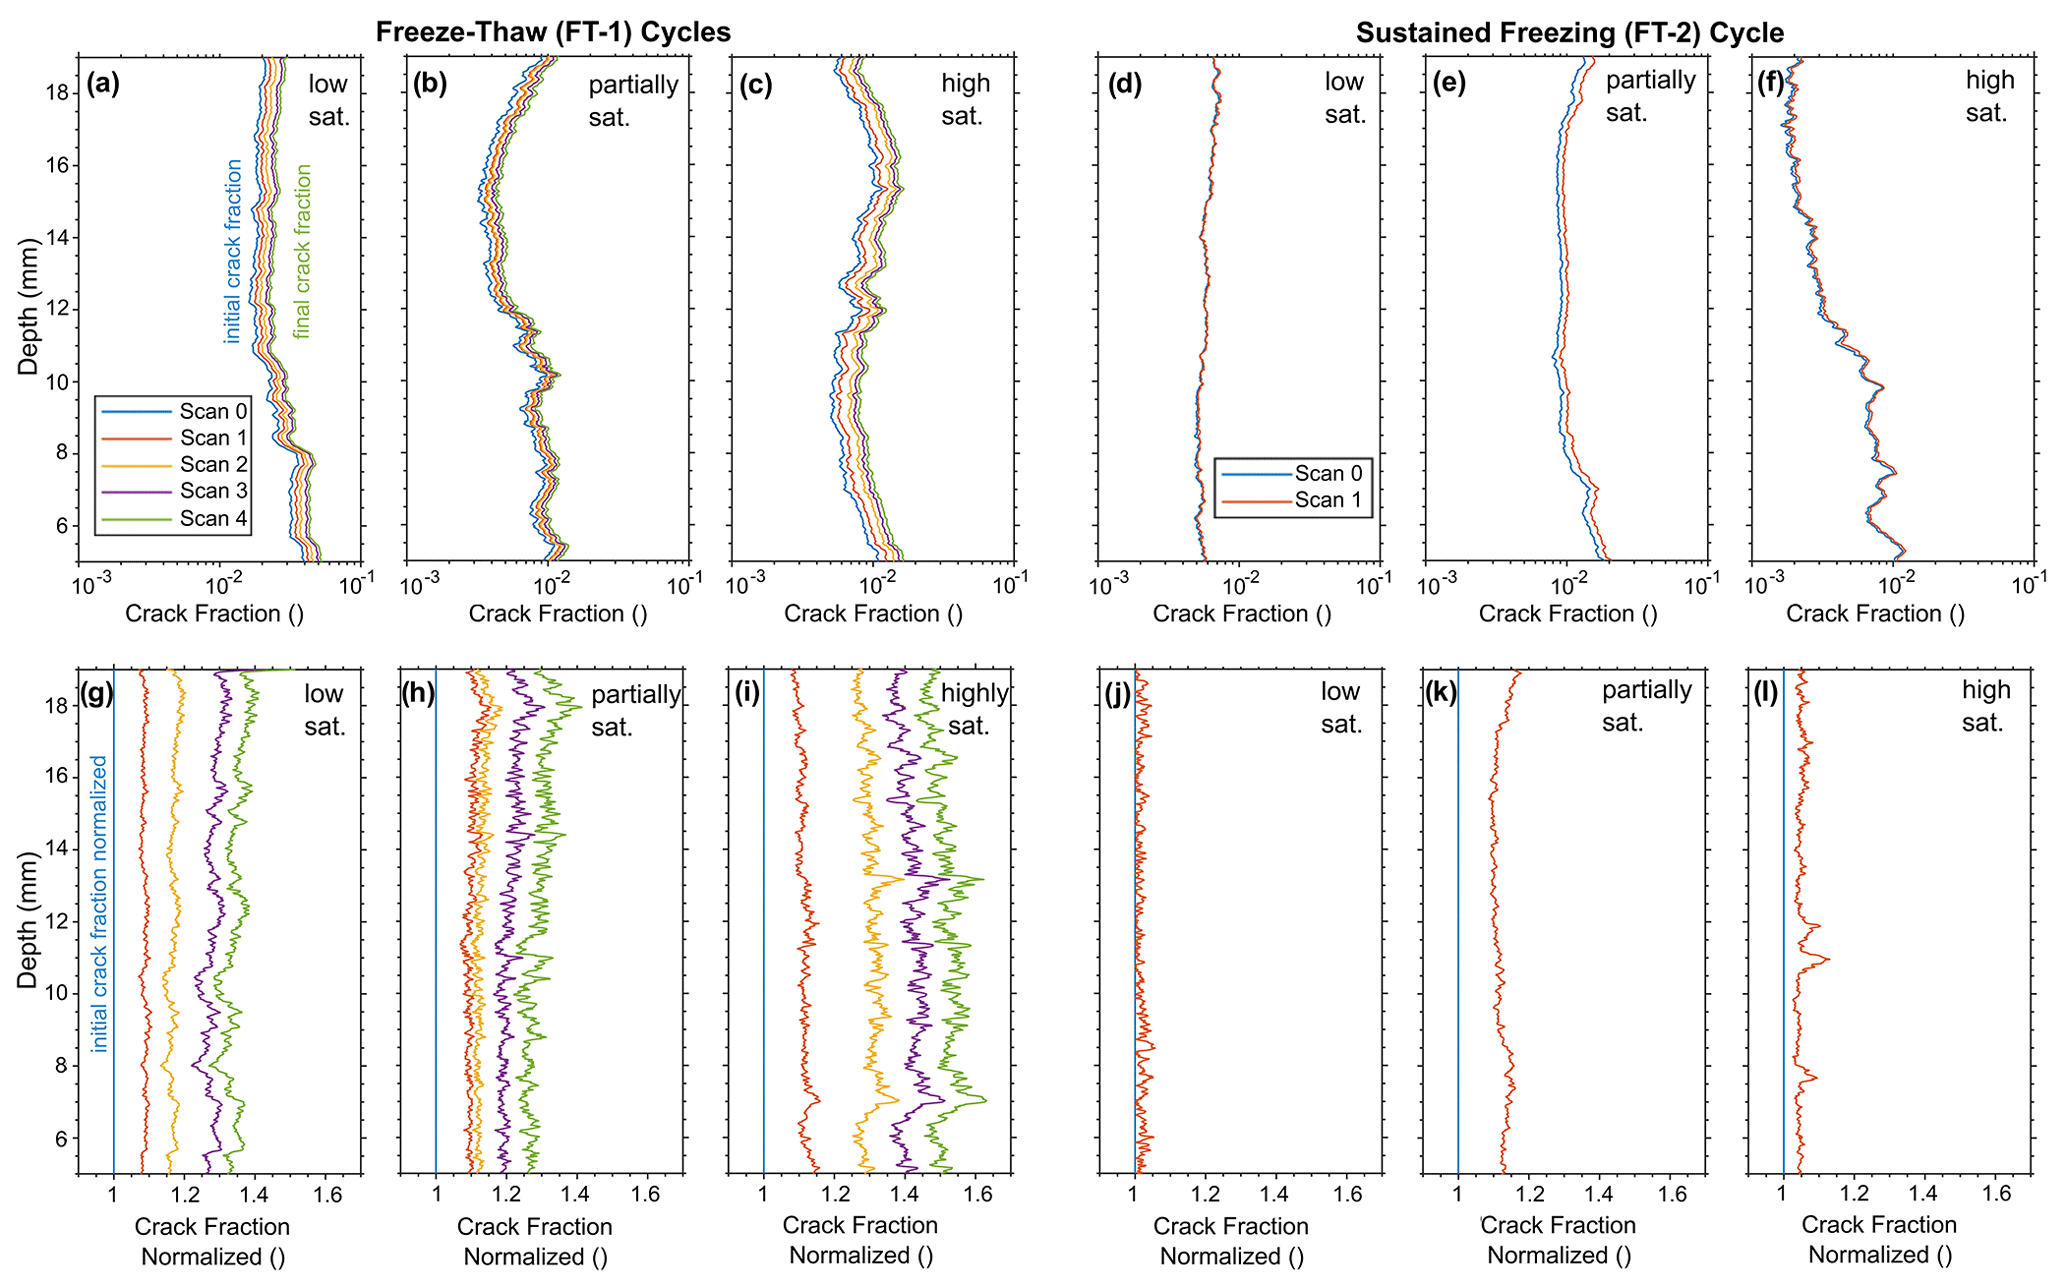
Figure 5µCT effectively showcases the progression of cracks in our samples, illustrating a steady growth in crack volume that is uniform throughout different heights in the sample and directly correlates to the initial crack volume. (a–f) Measured crack fraction (volume of cracks and voids divided by total volume; refer to Fig. 2b) using µCT plotted against rock depth. (g–l) Quantified normalized crack fraction by initial crack volume (blue lines in a–f) plotted against rock depth.
3.2.2 Sustained freezing cycle (FT-2)
During the prolonged freezing experiment, the most significant crack growth was observed in the partial-saturation rock sample followed by the high-saturation one. In contrast, the low-saturation sample exhibited minimal crack growth (Fig. 5d–f). The initial crack fraction at scan 0 ranged from for the low-saturation sample, to for the partial-saturation sample, and to for the high-saturation sample. The final crack fraction was (an increase of 0 %) for the low-saturation sample, (an increase of 17 %) for the partial-saturation rock, and (an increase of 0 %) for the high-saturation sample.
Normalized data indicated the most pronounced crack growth in the partial-saturation sample (Fig. 5j–l). The final scan revealed a mean normalized crack growth of 1.02 ± 0.02 (indicating a 2 % increase in crack volume) for the low-saturation sample, 1.12 ± 0.04 (12 % increase) for the partial-saturation sample, and 1.05 ± 0.03 (5 % increase) for the high-saturation sample.
4.1 Critical discussion of AE monitoring, stress modelling, and the µCT technique
Thermal and ice stresses or a combination of these stresses can cause rock damage. We monitored AE as a proxy for cracking, as in previous stress experiments (Eppes et al., 2016; Hallet et al., 1991), and analysed the timing of AE events in combination with simplified thermal stress and ice stress models to decipher the potential stress source. Our findings indicate a proportional relationship between the number of AE events and the rock damage quantified via µCT (Fig. 6a and d), which was also shown in the findings of Wang et al. (2020a). However, in our study the highest count of AE hits does not always align with the most-visible rock damage (Fig. 6a). Specifically, the partial-saturation sample exhibited over 415 AE hits with a normalized crack growth fraction of 47 %, while the low-saturation sample displayed 180 AE hits alongside a 53 % crack growth. In contrast to our setup, Wang et al. (2020a) utilized a rock sample with artificially created macro-fractures that predominantly drove the generation of AE signals. The discrepancy in our results might be due to variations in volume growth per crack propagation, potentially causing fewer AE releases with greater porosity growth. Additionally, the distinct responses of our natural rock samples to stress, influenced by slightly varying rock parameters, crack distribution, and saturation, could also impact the number of AE hits. A potential alteration in the AE sensor attachment to the rock might also affect signal detection. Although we reattached sensors and conducted lead break tests during the FT-1 cycle, the connection could have changed over time. Given the consistent AE accumulation trend observed in both the high- and low-saturation samples, a likely coupling shift in the partial-saturation sample is suggested (Fig. 3e), which was not reflected in µCT crack growth data (Fig. 5b and h). Despite these variables, the partial-saturation sample showed a higher AE accumulation already before the shift than the low-saturated one, underscoring the fact that AE hits did not completely correlate to crack growth.
Our approach to model thermal stress did not account for the complex geometries of the cracks in the samples. As a result, our analysis concentrated on the timing of thermal stresses rather than their precise magnitudes. In our frost cracking modelling, we presented results for ellipsoidal cracks starting at a length of 1 mm. It is important to note, however, that cracks vary in size and exhibit more intricate geometries, as seen by µCT imaging (Fig. 4). Additionally, slight variations in mechanical and elastic properties may occur since parameters were derived from different boulders of the same lithology or were based on data from Walder and Hallet (1985). Our sensitivity analysis (see Figs. S1 and S2) for frost cracking models revealed that the timing of increasing ice pressure was largely consistent across variations in parameters such as fracture toughness, growth-law parameters, shear modulus, and Poisson's ratio. Nevertheless, the crack length significantly influences the timing and the critical threshold for cracking. A larger crack length results in lower and delayed ice stresses, as well as a reduced critical threshold.
Prior µCT measurements have demonstrated the instrument's capability of quantifying crack growth, as illustrated by Deprez et al. (2020b) in their study on highly porous (30 %–40 %) oolithic limestone building stone and by De Kock et al. (2015) in their examination of highly porous (∼ 35 %) miliolid limestone. These studies revealed the microscopic activities taking place within limestone pores throughout freeze–thaw cycles. The authors linked the pore processes to potential patterns of macroscopic damage. In their experiments, both groups worked with small samples measuring 8–9 mm in diameter, achieving resolutions of 21 µm (Deprez et al., 2020b) and 20.4 µm (De Kock et al., 2015). In contrast, aiming to create a thermal gradient and water movement, we utilized larger samples, which led to a reduced spatial resolution of 60 µm. Our experiments demonstrated our capability of visualizing and quantifying damage in low-porosity rock samples caused by freeze–thaw cycles, while also acknowledging the possibility of minor additional damage not detectable at µCT resolution. Previous laboratory freeze–thaw tests have used a decrease in elastic properties such as P-wave velocity and Young's modulus or increases in porosity (Whalley et al., 2004; Matsuoka, 1990; Draebing and Krautblatter, 2012) as proxies for frost damage. However, detecting frost damage in low-porosity alpine rocks poses challenges due to minimal or undetectable alterations in these elastic properties or porosity levels. Moreover, the use of measured elastic properties or porosities does not provide information on crack geometry and crack growth. We demonstrated that cracks grow along pre-existing cracks and highlighted that µCT is a powerful analytical tool.
4.2 Influence of initial cracks on crack growth
In alpine rocks, freezing causes expansion in the pore spaces along existing cracks, influenced by the initial density of these cracks. Although our samples were extracted from the same boulder and visually appeared to have a uniform distribution of cracks, µCT scanning revealed differences in the internal distribution of cracks across the samples. Our normalized µCT findings show a consistent increase in pore space expansion across the height of the samples, evident across pre-existing cracks through both freeze–thaw cycles. This uniform pattern indicates that the density of cracks plays a role in the extent of crack expansion, with a notable increase in crack growth linked to higher initial densities of cracks or pore volumes, as shown in Fig. 5g–i. This finding is highlighted by the scan images (Fig. 4), which predominantly display the expansion of pore spaces within pre-existing cracks, as captured within the resolution of µCT. Our findings align with theoretical models proposed by Scherer (1999) and Walder and Hallet (1985), which suggest that ice crystallization pressure escalates in pore spaces, potentially leading to the enlargement of pores or cracks. This is further corroborated by microscopic analyses by Gerber et al. (2022), who confirmed that such pressure could indeed facilitate pore or crack expansion. Utilizing µCT with a 35 µm resolution, Wang et al. (2020b) found that pore space expansion in granite occurred exclusively as propagation of artificial created cracks, without evidence of new crack formation. Similarly, Dewanckele et al. (2013) observed no new crack formation within the rock matrix using µCT imaging at a 2.5 µm resolution in high-porosity Lede and Noyant limestones, pinpointing that pore space growth transpires at pre-existing weak zones (such as fossils). We state that most frost damage occurs in pre-existing cracks or voids and leads to crack propagation or widening, with the process intensifying as crack density increases.
4.3 Efficacy of freeze–thaw and sustained freezing cycles
Based on µCT data, freeze–thaw cycles (FT-1) revealed higher rock damage compared to a sustained freezing cycle (FT-2) in low-porosity, crack-dominated alpine rocks. Final crack growth is affected by initial crack density or pore volume distribution and cannot be compared directly; however, normalized crack growth fraction revealed an increase between 29 % and 52 % for FT-1 compared to an increase between 2 % and 12 % for FT-2 (Fig. 6a and d). The increase varied between samples of different saturation levels. While the low number of samples prohibits a quantitative analysis of saturation effects on rock damage, our results are consistent and reveal the higher damage of FT-1 compared to FT-2, independent of saturation levels (Fig. 6a and d).
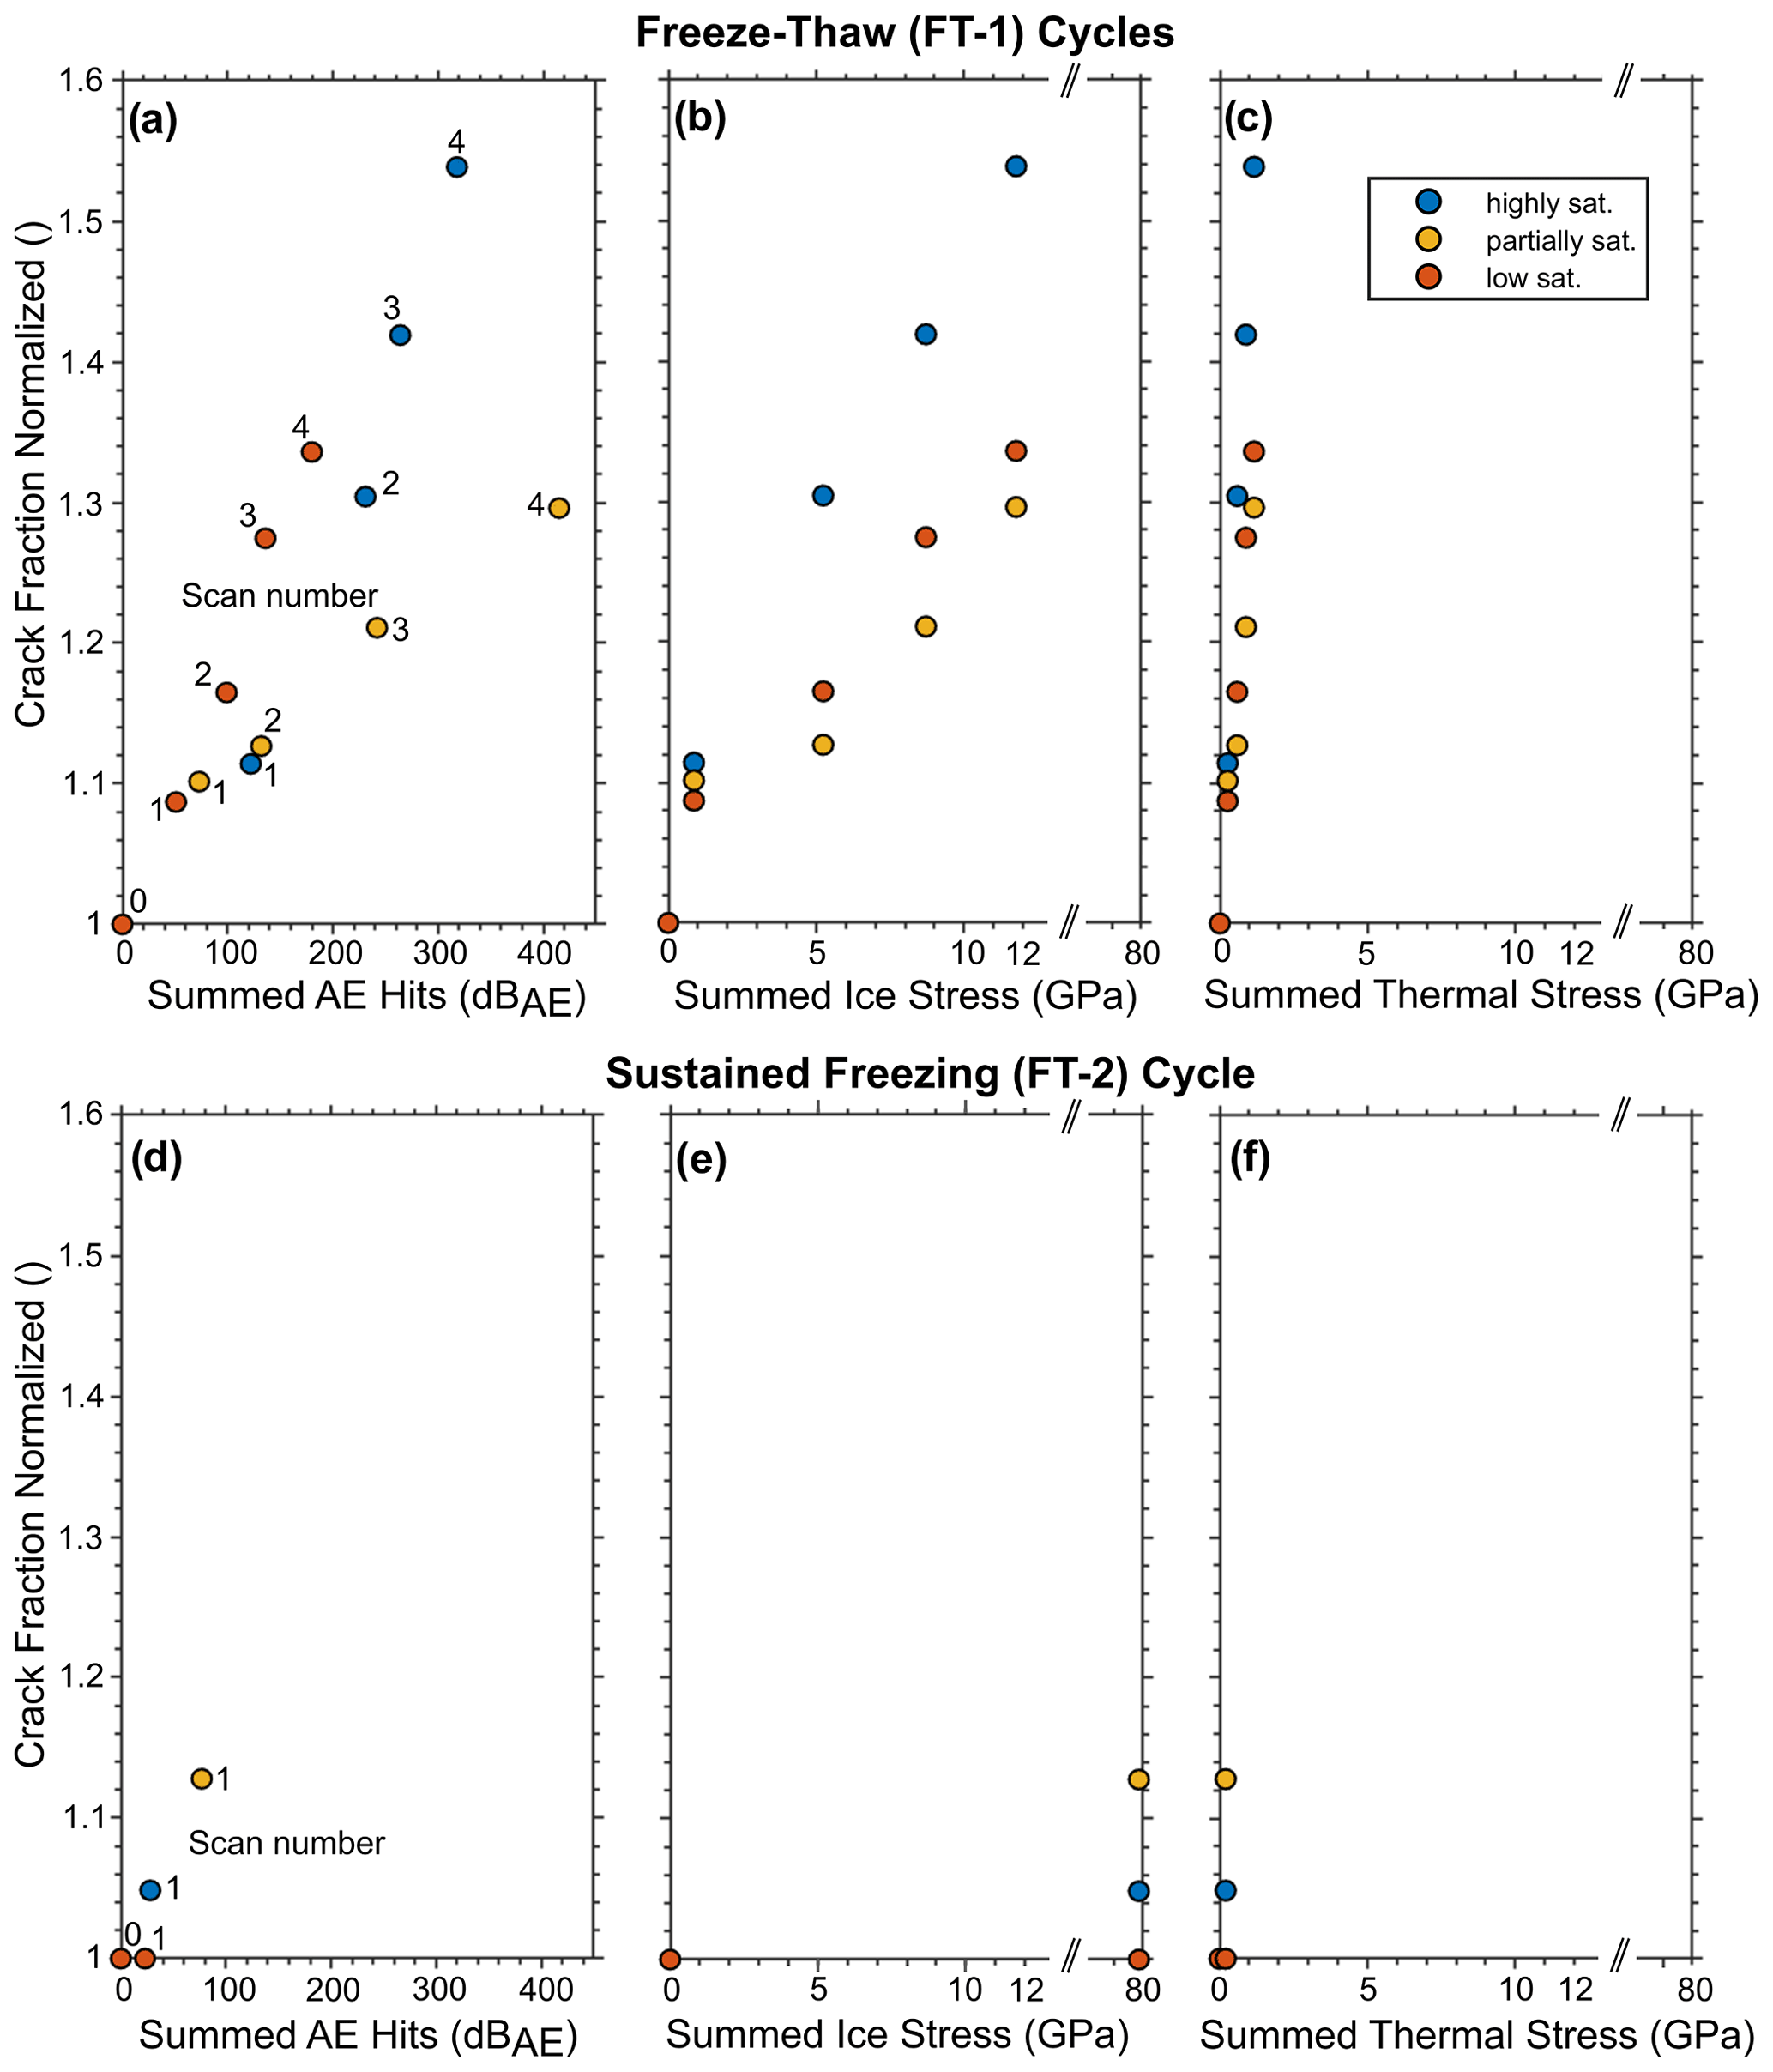
Figure 6Freeze–thaw cycles (FT-1) have a higher frost cracking efficacy compared to sustained freezing-cycles (FT-2) in low-porosity, crack-dominated alpine rocks. Normalized crack fraction in relation to accumulated AE hits, simulated summed ice stress, and thermal stress for (a–c) FT-1 and (d–f) FT-2. Simulated stresses by our frost cracking models are higher for FT-2 in comparison with FT-1, which is not aligned by normalized crack fraction.
The setup of FT-1 enables the development of thermal stresses during cooling and warming of the samples, volumetric expansion alongside the expanding freezing front, and ice segregation during freezing conditions (Fig. 7a). In addition, FT-2 favours the development of ice segregation when temperatures are sustained and rock moisture is able to migrate towards the freezing front (Fig. 7a).
During warming and cooling, thermal stresses with a magnitude slightly higher than 1 MPa occurred. Due to the higher number of temperature cycles in FT-1, higher cumulative thermal stresses occurred in FT-1 than in FT-2 (Fig. 6c and f), which could have contributed to the increased rock damage observed and quantified via µCT (Fig. 5g–l). Nonetheless, when compared to the predicted ice stresses (Fig. 6b and e) or accumulated AE hits during freezing times (Fig. 7), the thermal stresses were significantly lower, pointing to frost cracking as the predominant cause of rock damage.
Simulated stresses in our frost cracking models are higher for FT-2 in comparison with FT-1 (Fig. 6b and e), which is not supported by our µCT findings (Fig. 5g–l). Our frost cracking modelling revealed 8-times-higher ice stresses in the sustained freezing phase than in the freeze–thaw cycle. A fundamental requirement of our frost cracking model is complete saturation, a condition not consistently met throughout the experiment due to evaporation affecting our samples. The high-saturation samples showed that the highest frost damage (+53 % more crack volume than initially) occurred during FT-1, in contrast to our model predictions, whilst in FT-2 significantly less crack growth (+5 % more crack volume than initially) was observed (Fig. 5i and l). This observation could potentially be explained by variations in ice formation. Gerber et al. (2023) suggests that the pressures exerted by ice depend on its structure, which in turn is influenced by the rate of ice formation and its ageing process. Rapid freeze–thaw cycles may result in fine-grained ice and a sharp increase in stresses, whereas prolonged freezing through ageing may result in coarse ice grains exerting less stress. Nevertheless, the transformation and ageing of ice over an extended period of freezing – a characteristic of alpine conditions – could result in an increase in ice stress, thereby enhancing the potential for frost damage. A different explanation could be that ice segregation relies on water migration towards the freezing front, facilitated by the presence of unfrozen water at the top of our samples. Gerber et al. (2023) indicated that various ice structures could affect the water migration needed for ice segregation differently, lowering its impact. Prick (1997) noted water migration in limestone samples similar in size, with porosities ranging from 26 % to 48.2 %. In contrast, our rock samples exhibit much lower porosities of around 0.1 %, offering a substantially smaller water reservoir. This suggests that the water supply in FT-2 may also have been a limiting factor for ice segregation, despite the temperature conditions being conducive to this process (e.g. Walder and Hallet, 1985). As a result, our simulations of ice stress might have overestimated the actual stresses involved. In addition, our frost cracking model simplified the complex crack geometries observed in the samples (Fig. 4). Therefore, the magnitude of simulated ice stresses potentially deviates significantly from the ice stresses that occurred, which resulted in the deviation between modelled ice stresses and measured rock damage, especially in FT-2 (Fig. 6b and e).
During freezing of water to ice, volume expansion occurs that can produce rock damage if saturation levels are above 91 %. The high number of freezing cycles in FT-1 could have resulted in more volume-expansion-induced frost cracking than in FT-2. The high-saturation sample in FT-1 revealed the highest normalized rock damage (53 %) compared to the partial-saturation (29 % increase) and low-saturation (34 % increase) samples (Fig. 5g and h), which could indicate the involvement of volumetric expansion. We only estimated initial saturation, and rock moisture can redistribute during the experiments, resulting in higher moisture levels at the freezing fronts that could exceed the moisture threshold and enable volume-expansion-induced damage. In addition to volume expansion, higher saturation can also increase the efficacy of ice segregation by providing more moisture that is able to migrate. We conclude that within the constraints of our experiments, freeze–thaw cycles cause higher frost damage compared to sustained freezing cycles, with ice segregation serving as the primary contributing factor to frost cracking, while the occurrence of volume-expansion-induced damage is likely within high-saturation samples and cannot be excluded in low- and partial-saturation samples.
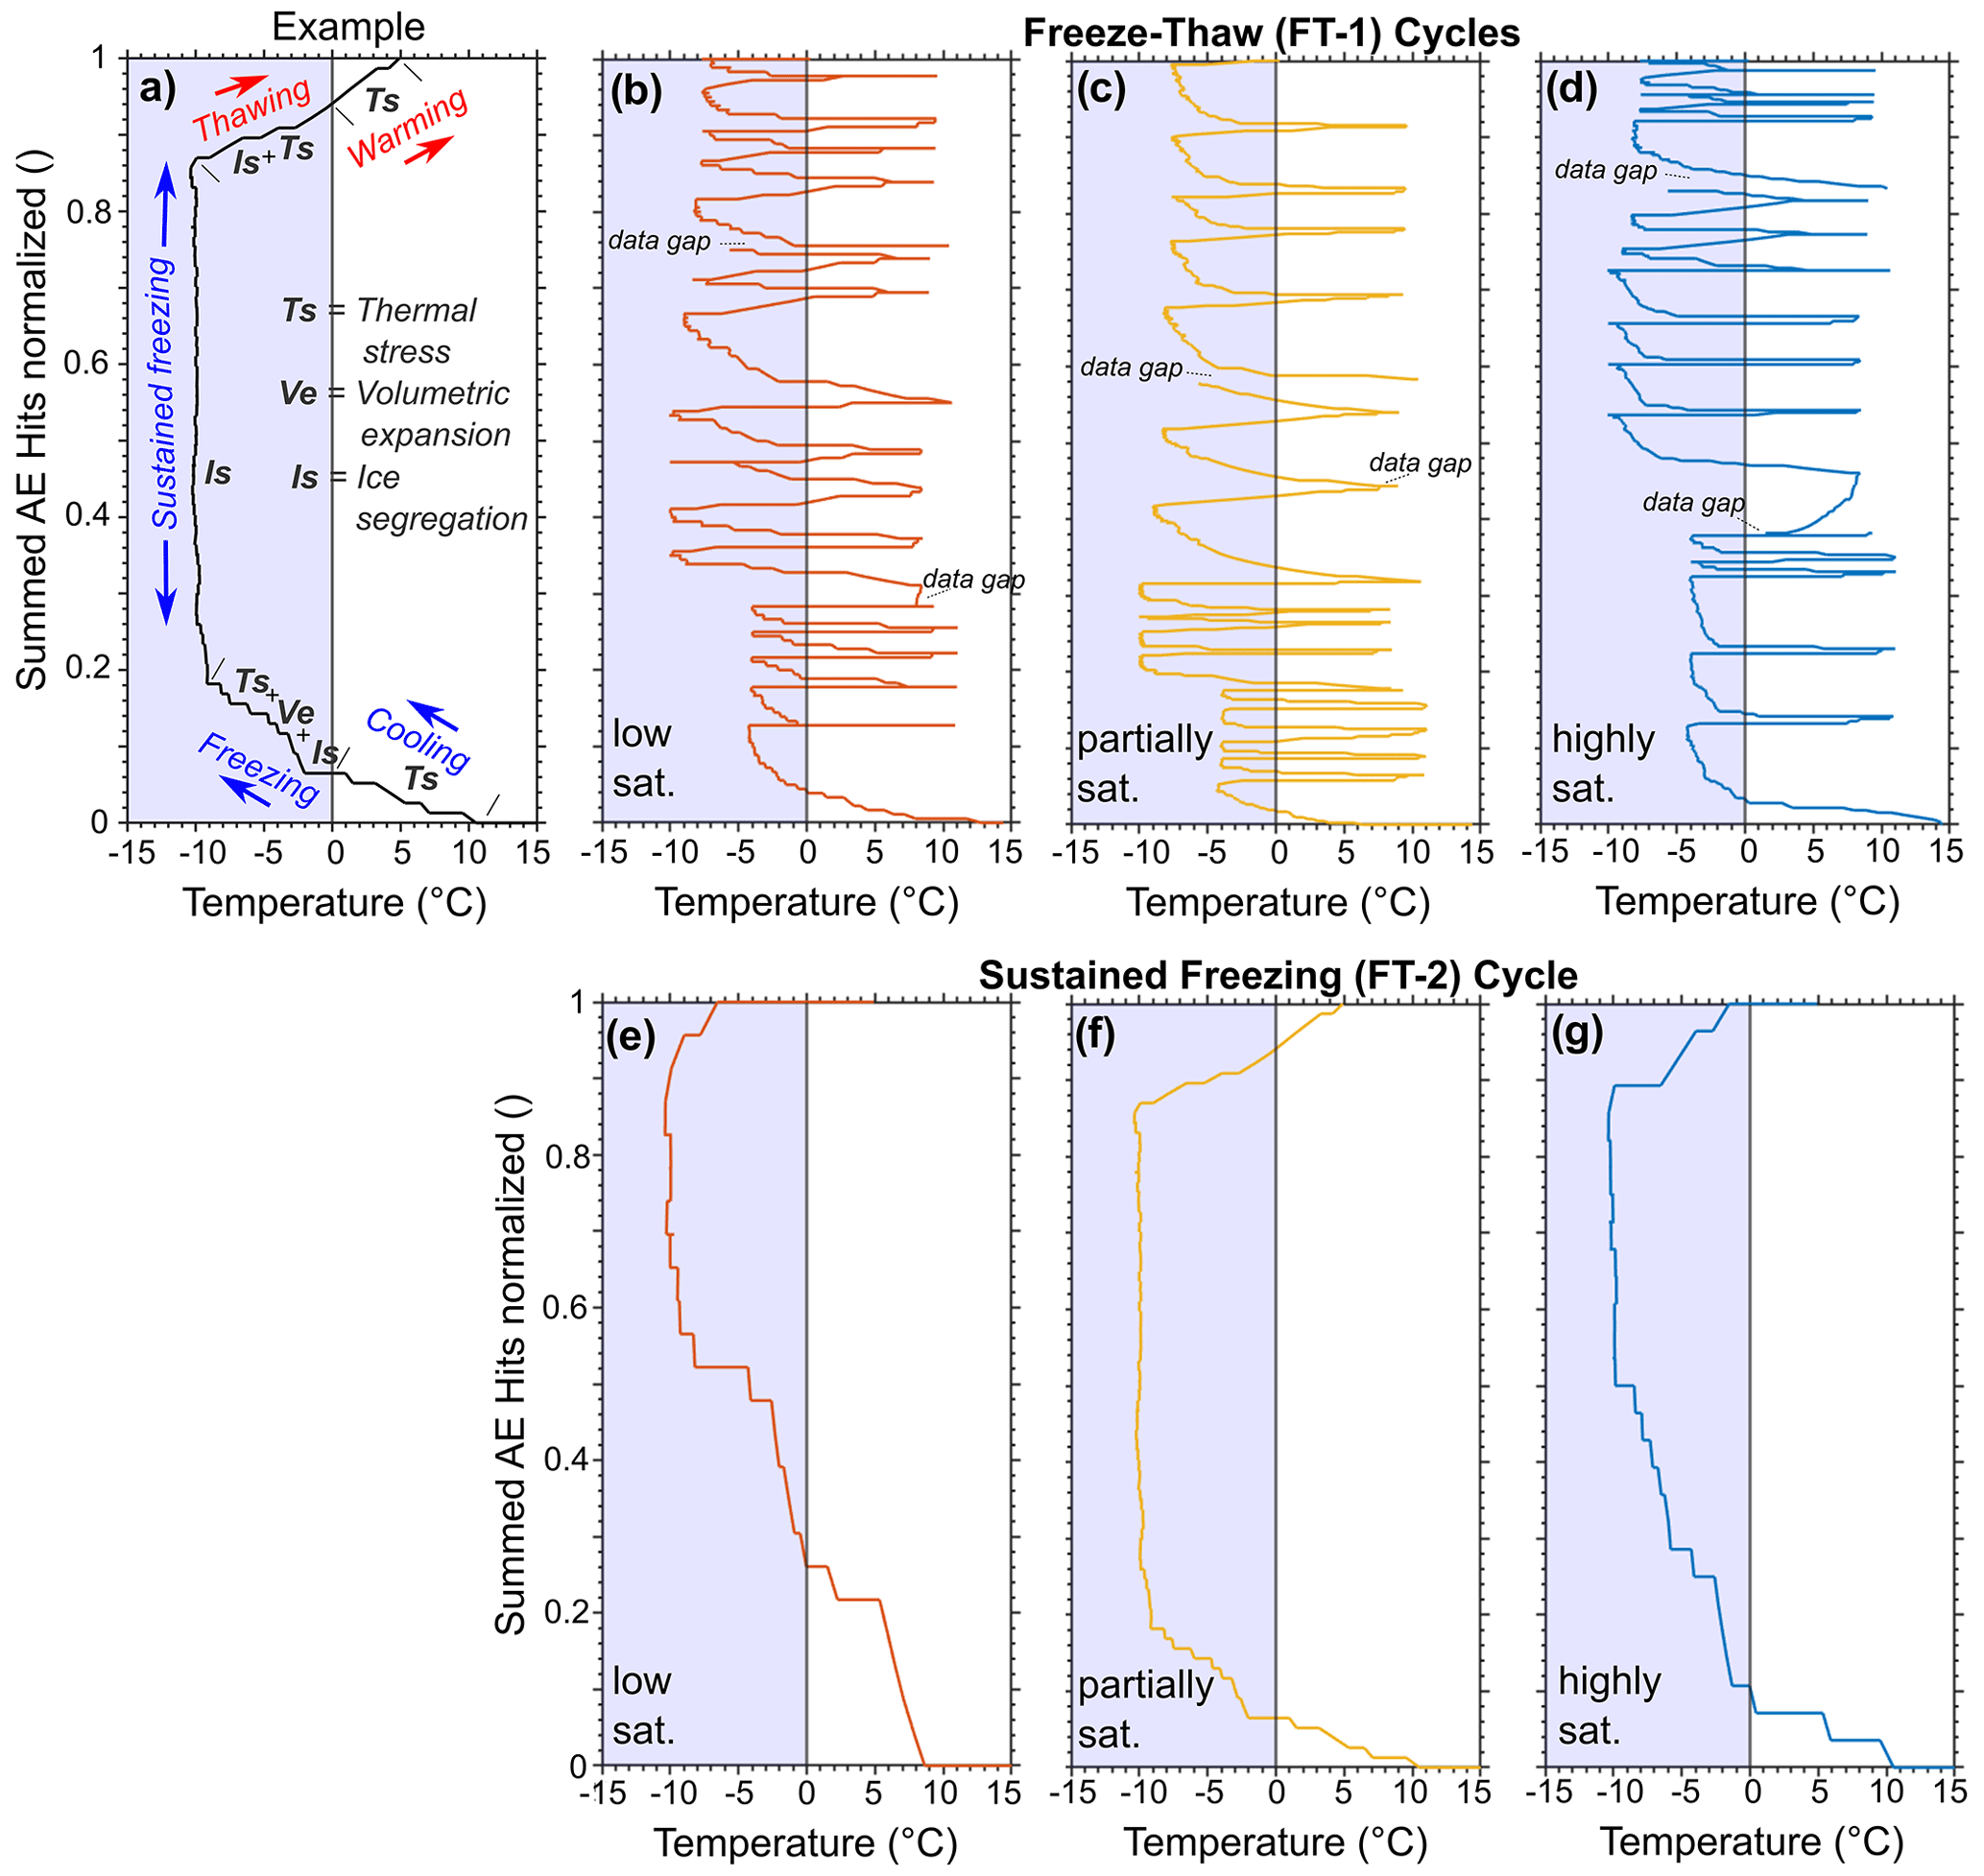
Figure 7Cooling phases accumulate more AE hits compared to warming phases, suggesting frost cracking as the main contributor to rock damage. (a) Example timings of potential stress occurrences, including thermal stresses during sample cooling and warming, volumetric expansion along with the expanding freezing front, and ice segregation under freezing conditions. Cumulative AE hits are plotted against the rock bottom temperature sensor for (b–d) FT-1 and (e–g) FT-2.
4.4 Implications for alpine rock walls
Our results revealed that the presence and arrangement of voids and fractures within rock significantly impact frost damage. We have shown that micro-crack expansion tends to follow pre-existing fractures, extending their width and length (Figs. 4 and 5g–l) and leading to a gradual increase in crack size. As a result, samples with a higher crack density experience more severe frost damage. In natural rock walls, both micro- and macro-cracks are present, the latter often arising from tectonic forces and/or weathering effects. These fractures play a crucial role in erosion processes as they influence rock cohesion and modify the dynamics, patterns, and locations of geomorphic activities on various spatial and temporal scales (Scott and Wohl, 2019). Studies by Hales and Roering (2009) and Draebing and Mayer (2021) have established a link between frost cracking intensity and the density of fractures, with rock walls that exhibit more fractures also showing greater evidence of frost cracking. Furthermore, Eppes et al. (2018) have demonstrated through both field and laboratory observations that an increase in the length and quantity of cracks leads to higher long-term erosion rates. Neely et al. (2019) revealed that higher fracture density decreases steepness of cliffs and increases catchment erosion rates. In New Zealand, Clarke and Burbank (2010) showed that bedrock fracturing by geomorphic processes including weathering controls the depths of erosive processes through bedrock landsliding. We infer that upscaling our findings from micro- to macro-cracks highlights the connection between erosion and fracture density. However, such extrapolation must consider the scale dependencies and complex fracture interactions influenced by broader geological and environmental factors, including tectonic forces, weathering effects, and variations in material properties, which could significantly modify erosion dynamics beyond micro-scale observations.
Our findings indicate that frost cracking is more effective during freeze–thaw cycles than during prolonged periods of freezing. Matsuoka et al. (1998) indicated that south-facing rock walls typically undergo more freeze–thaw cycles due to lack of snow cover, whereas those facing north are subject to longer durations of freezing. This leads to the initial assumption that south-facing rock walls would sustain more frost damage, contributing to increased erosion. However, the little empirical data that exists indicates that erosion rates are actually 2.5 to 3 times (Sass, 2005b), or up to 1 order of magnitude (Coutard and Francou, 1989), higher on north-facing rock walls. Matsuoka et al. (1998) suggested that while freeze–thaw cycles can cause shallow frost damage (up to 0.3 m deep), prolonged freezing can result in more significant frost damage (up to 5 m deep), leading to larger rockfalls. This indicates that the temporal scale of freeze–thaw cycles plays a crucial role in determining weathering and erosion rates – a concept further supported by Matsuoka (2008), who found that short-term freeze–thaw cycles cause minor crack expansion, whereas long-term freezing leads to more substantial crack widening.
Our research suggests a direct correlation between the frequency of AE events and the extent of rock damage as measured by µCT scanning. However, the highest occurrences of AE hits do not consistently correspond to the most significant observable rock damage. This discrepancy could be attributed to ice formation influenced by thermal gradients, as well as to changes and ageing in the ice, as discussed by Gerber et al. (2023). This insight has implications for studies that employ AE as an indicator for thermal-stress-induced cracking (Eppes et al., 2016; Collins et al., 2018) and frost cracking (Amitrano et al., 2012; Girard et al., 2013) in natural rock walls.
The estimated ice stresses in our simulations may significantly diverge from the actual ice stresses experienced, leading to differences between simulated ice stresses and observed rock damage, particularly in the FT-2 scenario. This mismatch between model predictions and actual frost damage observations could stem from the model's oversimplified representations of crack geometries and rock properties or from the relatively brief duration of sustained freezing in FT-2 when compared to conditions in a real rock wall. Research efforts such as those by Draebing and Mayer (2021) or Sanders et al. (2012), which utilize frost cracking models to assess frost damage, might have overemphasized the effects of frost weathering. Nonetheless, Draebing et al. (2022) showed that frost weathering simulations do correspond with the erosion rates observed on north-facing rock walls, where extended periods of freezing are more common.
In our investigation of frost-induced damage to Dachstein limestone, we employed X-ray-computed microtomography (µCT), acoustic emission (AE) monitoring, and frost cracking modelling to assess the damage. We aimed to distinguish between different mechanisms of rock damage by simulating thermal and ice-induced stresses and correlating them with AE activity in samples with varying saturation levels. Our research demonstrated that µCT measures frost damage effectively in low-porosity (0.1 %) rock, primarily revealing damage through the expansion or deepening of existing cracks rather than the creation of new ones. Our findings also revealed that the presence and distribution of voids and cracks significantly influence frost damage, with rocks that have a higher initial crack density exhibiting more damage. A direct link was found between the rate of AE events and the degree of rock damage as determined by µCT; however, the most frequent AE hits did not always match the areas of greatest visible damage, suggesting complexities in the relationship between AE activity and rock damage.
Our studies suggest that rock damage is primarily a result of thermal stresses and frost cracking during cooling phases, with frost cracking identified as a key contributor to damage. However, the ice stresses predicted by our simulations might differ greatly from the actual stresses, potentially due to the model's simplified assumptions or due to the short duration of sustained freezing in our FT-2 scenario. Analysis of µCT data revealed that repeated freeze–thaw cycles (FT-1) resulted in more effective cracking compared to extended periods of freezing (FT-2). This observation contrasts with field study outcomes that associate frost damage and rock wall erosion, showing greater erosion rates on north-facing rock walls, which typically undergo longer periods of sustained freezing rather than freeze–thaw cycles. We assume that the limited water accessibility in FT-2 due to the samples' low porosity or the dynamics of ice formation and the short experiment time might explain this discrepancy. Given the finite sample size and varied saturation levels, our experiments suggest that higher levels of saturation tend to increase frost-induced rock damage, as inferred from acoustic emission activity. This preliminary evidence emphasizes the need for additional research to fully understand the impact of saturation on frost damage.
Data are available at the UU depository (https://doi.org/10.24416/UU01-OLMSN0, Mayer et al., 2024).
The code for the frost cracking modelling is available at https://github.com/TillM90/Code_frost_cracking_model.git (last access: 12 June 2024; DOI: https://doi.org/10.5281/zenodo.11574002, Mayer, 2024).
The supplement related to this article is available online at: https://doi.org/10.5194/tc-18-2847-2024-supplement.
TM, MD, LS, and DD designed the experiments. TM, MD, and LS conducted the experiments, and TM processed the data with support from MD and LS. TM and DD wrote the paper with contributions from MD, LS, and VC.
The contact author has declared that none of the authors has any competing interests.
Publisher’s note: Copernicus Publications remains neutral with regard to jurisdictional claims made in the text, published maps, institutional affiliations, or any other geographical representation in this paper. While Copernicus Publications makes every effort to include appropriate place names, the final responsibility lies with the authors.
We acknowledge the valuable comments by Norikazu Matsuoka and one anonymous reviewer that improved this paper. We thank Timo Sprenger for help collecting rock samples in the field and the Dachstein cable car team for logistical support.
This project has received funding from the European Union Horizon 2020 research and innovation programme (under grant agreement no. 101005611 for transnational access conducted at Ghent University). The laboratory work was funded by the EXCITE grants FROST (grant no. EXCITE_TNA_C1_2022_06) and CRACK (grant no. EXCITE_TNA_C2_2022_004) and by the German Research Foundation (grant no. DR1070/3-1, 426793773). The Centre of Expertise, UGCT, is supported by the Ghent University Special Research Fund (BOF-UGent; grant no. BOF.COR.2022.0009).
This open-access publication was funded by the University of Bayreuth.
This paper was edited by Regula Frauenfelder and reviewed by Norikazu Matsuoka and one anonymous referee.
Amitrano, D., Gruber, S., and Girard, L.: Evidence of frost-cracking inferred from acoustic emissions in a high-alpine rock-wall, Earth Planet. Sc. Lett., 341–344, 86–93, https://doi.org/10.1016/j.epsl.2012.06.014, 2012.
Anderson, R. S.: Near-surface thermal profiles in alpine bedrock: Implications for the frost weathering of rock, Arct. Alp. Res., 30, 362–372, https://doi.org/10.2307/1552008, 1998.
Bazant, Z. P. and Planas, J.: Fracture and Size Effect in Concrete and Other Quasibrittle Materials 1st, New York, https://doi.org/10.1201/9780203756799, 1998.
Carloni, C., Santandrea, M., and Baietti, G.: Influence of the width of the specimen on the fracture response of concrete notched beams, Eng. Fract. Mech., 216, 106465, https://doi.org/10.1016/j.engfracmech.2019.04.039, 2019.
Cermák, V. and Rybach, L.: Thermal conductivity and specific heat of minerals and rocks, in: Landolt–Börnstein Zahlenwerte and Funktionen aus Naturwissenschaften und Technik, Neue Serie, Physikalische Eigenschaften der Gesteine (V/1a), edited by: Angeneister, G., Springer, Berlin, 305–343, 1982.
Clarke, B. A. and Burbank, D. W.: Bedrock fracturing, threshold hillslopes, and limits to the magnitude of bedrock landslides, Earth Planet. Sc. Lett., 297, 577–586, https://doi.org/10.1016/j.epsl.2010.07.011, 2010.
Cnudde, V. and Boone, M.: High-resolution X-ray computed tomography in geosciences: a review of the current technology and applications, Earth-Sci. Rev., 123, 1–17, https://doi.org/10.1016/j.earscirev.2013.04.003, 2013.
Collins, B. D., Stock, G. M., Eppes, M.-C., Lewis, S. W., Corbett, S. C., and Smith, J. B.: Thermal influences on spontaneous rock dome exfoliation, Nat. Commun., 9, 762, https://doi.org/10.1038/s41467-017-02728-1, 2018.
Coutard, J.-P. and Francou, B.: Rock Temperature Measurements in Two Alpine Environments: Implications for Frost Shattering, Arct. Alp. Res., 21, 399–416, https://doi.org/10.2307/1551649, 1989.
De Kock, T., Boone, M. A., De Schryver, T., Van Stappen, J., Derluyn, H., Masschaele, B., De Schutter, G., and Cnudde, V.: A Pore-Scale Study of Fracture Dynamics in Rock Using X-ray Micro-CT Under Ambient Freeze–Thaw Cycling, Environ. Sci. Technol., 49, 2867–2874, https://doi.org/10.1021/es505738d, 2015.
Deprez, M., De Kock, T., De Schutter, G., and Cnudde, V.: The role of ink-bottle pores in freeze-thaw damage of oolithic limestone, Construct. Build. Mater., 246, 118515, https://doi.org/10.1016/j.conbuildmat.2020.118515, 2020a.
Deprez, M., De Kock, T., De Schutter, G., and Cnudde, V.: A review on freeze-thaw action and weathering of rocks, Earth-Sci. Rev., 203, 103143, https://doi.org/10.1016/j.earscirev.2020.103143, 2020b.
Derjaguin, B. V. and Churaev, N. V.: Flow of nonfreezing water interlayers and frost heaving, Cold Reg. Sci. Technol., 12, 57–66, https://doi.org/10.1016/0165-232X(86)90020-0, 1986.
Dewanckele, J., Boone, M. A., De Kock, T., De Boever, W., Brabant, L., Boone, M. N., Fronteau, G., Dils, J., Van Hoorebeke, L., Jacobs, P., and Cnudde, V.: Holistic approach of pre-existing flaws on the decay of two limestones, Sci. Total Environ., 447, 403–414, https://doi.org/10.1016/j.scitotenv.2012.12.094, 2013.
DIN-EN 1097-6:2022-5: Tests for mechanical and physical properties of aggregates – Part 6: Determination of particle density and water absorption; German version EN 1097-6:2022, 64 pp., https://doi.org/10.31030/3290441, 2022.
DIN-EN 52102:2013-10: Test methods for aggregates – Determination of dry bulk density by the cylinder method and calculation of the ratio of density, 9 pp., https://doi.org/10.31030/2054684, 2013.
Draebing, D.: Identification of rock and fracture kinematics in high alpine rockwalls under the influence of elevation, Earth Surf. Dynam., 9, 977–994, https://doi.org/10.5194/esurf-9-977-2021, 2021.
Draebing, D. and Krautblatter, M.: P-wave velocity changes in freezing hard low-porosity rocks: a laboratory-based time-average model, The Cryosphere, 6, 1163–1174, https://doi.org/10.5194/tc-6-1163-2012, 2012.
Draebing, D. and Krautblatter, M.: The Efficacy of Frost Weathering Processes in Alpine Rockwalls, Geophys. Res. Lett., 46, 6516–6524, https://doi.org/10.1029/2019gl081981, 2019.
Draebing, D. and Mayer, T.: Topographic and geologic controls on frost cracking in Alpine rockwalls, J. Geophys. Res.-Earth, 126, e2021JF006163, https://doi.org/10.1029/2021JF006163, 2021.
Draebing, D., Krautblatter, M., and Hoffmann, T.: Thermo-cryogenic controls of fracture kinematics in permafrost rockwalls, Geophys. Res. Lett., 44, 3535–3544, https://doi.org/10.1002/2016GL072050, 2017a.
Draebing, D., Haberkorn, A., Krautblatter, M., Kenner, R., and Phillips, M.: Thermal and Mechanical Responses Resulting From Spatial and Temporal Snow Cover Variability in Permafrost Rock Slopes, Steintaelli, Swiss Alps, Permafrost Periglac., 28, 140–157, https://doi.org/10.1002/ppp.1921, 2017b.
Draebing, D., Mayer, T., Jacobs, B., and McColl, S. T.: Alpine rockwall erosion patterns follow elevation-dependent climate trajectories, Commun. Earth Environ., 3, 21, https://doi.org/10.1038/s43247-022-00348-2, 2022.
Duca, S., Occhiena, C., Mattone, M., Sambuelli, L., and Scavia, C.: Feasibility of Ice Segregation Location by Acoustic Emission Detection: A Laboratory Test in Gneiss, Permafrost Periglac., 25, 208–219, https://doi.org/10.1002/ppp.1814, 2014.
Egholm, D. L., Andersen, J. L., Knudsen, M. F., Jansen, J. D., and Nielsen, S. B.: The periglacial engine of mountain erosion – Part 2: Modelling large-scale landscape evolution, Earth Surf. Dynam., 3, 463–482, https://doi.org/10.5194/esurf-3-463-2015, 2015.
Eppes, M.-C. and Keanini, R.: Mechanical weathering and rock erosion by climate-dependent subcritical cracking, Rev. Geophys., 55, 470–508, https://doi.org/10.1002/2017RG000557, 2017.
Eppes, M. C., Magi, B., Hallet, B., Delmelle, E., Mackenzie-Helnwein, P., Warren, K., and Swami, S.: Deciphering the role of solar-induced thermal stresses in rock weathering, Geol. Soc. Am. Bull., 128, 1315–1338, https://doi.org/10.1130/b31422.1, 2016.
Eppes, M. C., Hancock, G. S., Chen, X., Arey, J., Dewers, T., Huettenmoser, J., Kiessling, S., Moser, F., Tannu, N., Weiserbs, B., and Whitten, J.: Rates of subcritical cracking and long-term rock erosion, Geology, 46, 951–954, https://doi.org/10.1130/G45256.1, 2018.
Eslami, J., Walbert, C., Beaucour, A.-L., Bourges, A., and Noumowe, A.: Influence of physical and mechanical properties on the durability of limestone subjected to freeze-thaw cycles, Construct. Build. Mater., 162, 420–429, https://doi.org/10.1016/j.conbuildmat.2017.12.031, 2018.
Everett, D. H.: The thermodynamics of frost damage to porous solids, T. Faraday Soc., 57, 1541–1551, https://doi.org/10.1039/TF9615701541, 1961.
Gerber, D., Wilen, L. A., Poydenot, F., Dufresne, E. R., and Style, R. W.: Stress accumulation by confined ice in a temperature gradient, P. Natl. Acad. Sci. USA, 119, e2200748119, https://doi.org/10.1073/pnas.2200748119, 2022.
Gerber, D., Wilen, L. A., Dufresne, E. R., and Style, R. W.: Polycrystallinity Enhances Stress Buildup around Ice, Phys. Rev. Lett., 131, 208201, https://doi.org/10.1103/PhysRevLett.131.208201, 2023.
Gilpin, R. R.: A model of the “liquid-like” layer between ice and a substrate with applications to wire regelation and particle migration, J. Colloid Interf. Sci., 68, 235–251, https://doi.org/10.1016/0021-9797(79)90277-7, 1979.
Gilpin, R. R.: A model for the prediction of ice lensing and frost heave in soils, Water Resour. Res., 16, 918–930, https://doi.org/10.1029/WR016i005p00918, 1980.
Girard, L., Gruber, S., Weber, S., and Beutel, J.: Environmental controls of frost cracking revealed through in situ acoustic emission measurements in steep bedrock, Geophys. Res. Lett., 40, 1748–1753, https://doi.org/10.1002/grl.50384, 2013.
Hales, T. C. and Roering, J. J.: A frost “buzzsaw” mechanism for erosion of the eastern Southern Alps, New Zealand, Geomorphology, 107, 241–253, https://doi.org/10.1016/j.geomorph.2008.12.012, 2009.
Hallet, B., Walder, J. S., and Stubbs, C. W.: Weathering by segregation ice growth in microcracks at sustained subzero temperatures: Verification from an experimental study using acoustic emissions, Permafrost Periglac., 2, 283–300, https://doi.org/10.1002/ppp.3430020404, 1991.
Jia, H., Xiang, W., and Krautblatter, M.: Quantifying Rock Fatigue and Decreasing Compressive and Tensile Strength after Repeated Freeze-Thaw Cycles, Permafrost Periglac., 26, 368–377, https://doi.org/10.1002/ppp.1857, 2015.
Kjelstrup, S., Ghoreishian Amiri, S. A., Loranger, B., Gao, H., and Grimstad, G.: Transport coefficients and pressure conditions for growth of ice lens in frozen soil, Acta Geotech., 16, 2231–2239, https://doi.org/10.1007/s11440-021-01158-0, 2021.
Lepique, M.: Empfehlung Nr. 10 des Arbeitskreises 3.3 “Versuchstechnik Fels” der Deutschen Gesellschaft für Geotechnik e. V.: Indirekter Zugversuch an Gesteinsproben – Spaltzugversuch, Bautechnik, 85, 623–627, https://doi.org/10.1002/bate.200810048, 2008.
Maji, V. and Murton, J. B.: Micro-computed tomography imaging and probabilistic modelling of rock fracture by freeze–thaw, Earth Surf. Proc. Land., 45, 666–680, https://doi.org/10.1002/esp.4764, 2020.
Maji, V. and Murton, J. B.: Experimental Observations and Statistical Modeling of Crack Propagation Dynamics in Limestone by Acoustic Emission Analysis During Freezing and Thawing, J. Geophys. Res.-Earth, 126, e2021JF006127, https://doi.org/10.1029/2021JF006127, 2021.
Matsuoka, N.: Mechanisms of rock breakdown by frost action: An experimental approach, Cold Reg. Sci. Technol., 17, 253–270, https://doi.org/10.1016/S0165-232X(05)80005-9, 1990.
Matsuoka, N.: Microgelivation versus macrogelivation: towards bridging the gap between laboratory and field frost weathering, Permafrost Periglac., 12, 299–313, https://doi.org/10.1002/ppp.393, 2001.
Matsuoka, N.: Frost weathering and rockwall erosion in the southeastern Swiss Alps: Long-term (1994–2006) observations, Geomorphology, 99, 353–368, https://doi.org/10.1016/j.geomorph.2007.11.013, 2008.
Matsuoka, N.: A multi-method monitoring of timing, magnitude and origin of rockfall activity in the Japanese Alps, Geomorphology, 336, 65–76, https://doi.org/10.1016/j.geomorph.2019.03.023, 2019.
Matsuoka, N. and Murton, J.: Frost weathering: Recent advances and future directions, Permafrost Periglac., 19, 195–210, https://doi.org/10.1002/ppp.620, 2008.
Matsuoka, N., Hirakawa, K., Watanabe, T., Haeberli, W., and Keller, F.: The role of diurnal, annual and millennial freeze-thaw cycles in controlling alpine slope instability, Proceedings of the seventh international conference on permafrost, Centre d'etudes nordiques, Universite Laval, 711–718, 1998.
Mayer, T.: Data set/code for frost cracking model, Zenodo [code], https://doi.org/10.5281/zenodo.11574002, 2024
Mayer, T., Eppes, M., and Draebing, D.: Influences Driving and Limiting the Efficacy of Ice Segregation in Alpine Rocks, Geophys. Res. Lett., 50, e2023GL102951, https://doi.org/10.1029/2023GL102951, 2023.
Mayer, T., Deprez, M., Schröer,L., Cnudde, V., and Draebing, D.: Micro Computational Tomography, Acoustic Emission and rock temperature data from frost weathering tests on Dachstein Limestone, Yoda [data set], https://doi.org/10.24416/UU01-OLMSN0, 2024.
Messenzehl, K., Viles, H., Otto, J.-C., Ewald, A., and Dikau, R.: Linking rock weathering, rockwall instability and rockfall supply on talus slopes in glaciated hanging valleys (Swiss Alps), Permafrost Periglac., 29, 135–151, https://doi.org/10.1002/ppp.1976, 2018.
Murton, J. B., Peterson, R., and Ozouf, J.-C.: Bedrock Fracture by Ice Segregation in Cold Regions, Science, 314, 1127–1129, https://doi.org/10.1126/science.1132127, 2006.
Neely, A. B., DiBiase, R. A., Corbett, L. B., Bierman, P. R., and Caffee, M. W.: Bedrock fracture density controls on hillslope erodibility in steep, rocky landscapes with patchy soil cover, southern California, USA, Earth Planet. Sc. Lett., 522, 186–197, https://doi.org/10.1016/j.epsl.2019.06.011, 2019.
Paul, G. C. D.: Materials science & engineering, CRC Press, Materials Park, Ohio, ASM International, ISBN 1615039848, 9781615039845, 1991.
Pei, L., Blöcher, G., Milsch, H., Deon, F., Zimmermann, G., Rühaak, W., Sass, I., and Huenges, E.: Thermal strain in a water-saturated limestone under hydrostatic and deviatoric stress states, Tectonophysics, 688, 49–64, https://doi.org/10.1016/j.tecto.2016.09.020, 2016.
Perras, M. A. and Diederichs, M. S.: A Review of the Tensile Strength of Rock: Concepts and Testing, Geotech. Geol. Eng., 32, 525–546, https://doi.org/10.1007/s10706-014-9732-0, 2014.
Pfiffner, O. A.: Geologie der Alpen, Haupt, 359 pp., https://doi.org/10.36198/9783838584164, 2010.
Prick, A.: Critical Degree of Saturation as a Threshold Moisture Level in Frost Weathering of Limestones, Permafrost Periglac., 8, 91–99, https://doi.org/10.1002/(SICI)1099-1530(199701)8:1<91::AID-PPP238>3.0.CO;2-4, 1997.
Sanders, J. W., Cuffey, K. M., Moore, J. R., MacGregor, K. R., and Kavanaugh, J. L.: Periglacial weathering and headwall erosion in cirque glacier bergschrunds, Geology, 40, 779–782, https://doi.org/10.1130/g33330.1, 2012.
Sass, O.: Rock moisture measurements: techniques, results, and implications for weathering, Earth Surface Proc. Land., 30, 359–374, https://doi.org/10.1002/esp.1214, 2005a.
Sass, O.: Spatial patterns of rockfall intensity in the northern Alps, Z. Geomorphologie, Supplementary Issues, 138, 51–65, 2005b.
Scherer, G. W.: Crystallization in pores, Cement Concrete Res., 29, 1347–1358, https://doi.org/10.1016/S0008-8846(99)00002-2, 1999.
Scott, D. N. and Wohl, E. E.: Bedrock fracture influences on geomorphic process and form across process domains and scales, Earth Surf. Proc. Land., 44, 27–45, https://doi.org/10.1002/esp.4473, 2019.
Sibley, D. N., Llombart, P., Noya, E. G., Archer, A. J., and MacDowell, L. G.: How ice grows from premelting films and water droplets, Nat. Commun., 12, 239, https://doi.org/10.1038/s41467-020-20318-6, 2021.
Walder, J. and Hallet, B.: A Theoretical-Model of the Fracture of Rock During Freezing, Geol. Soc. Am. Bull., 96, 336–346, https://doi.org/10.1130/0016-7606(1985)96<336:ATMOTF>2.0.CO;2, 1985.
Walder, J. S. and Hallet, B.: The Physical Basis of Frost Weathering – toward a More Fundamental and Unified Perspective, Arct. Alp. Res., 18, 27–32, https://doi.org/10.2307/1551211, 1986.
Wang, Y., Han, J. Q., and Li, C. H.: Acoustic emission and CT investigation on fracture evolution of granite containing two flaws subjected to freeze–thaw and cyclic uniaxial increasing-amplitude loading conditions, Construct. Build. Mater., 260, 119769, https://doi.org/10.1016/j.conbuildmat.2020.119769, 2020a.
Wang, Y., Feng, W. K., Wang, H. J., Li, C. H., and Hou, Z. Q.: Rock bridge fracturing characteristics in granite induced by freeze-thaw and uniaxial deformation revealed by AE monitoring and post-test CT scanning, Cold Reg. Sci. Technol., 177, 103115, https://doi.org/10.1016/j.coldregions.2020.103115, 2020b.
Webber, J. B. W., Dore, J. C., Strange, J. H., Anderson, R., and Tohidi, B.: Plastic ice in confined geometry: the evidence from neutron diffraction and NMR relaxation, J. Phys.-Condens Mat., 19, 415117, https://doi.org/10.1088/0953-8984/19/41/415117, 2007.
Whalley, W. B., Rea, B. R., and Rainey, M. M.: Weathering, Blockfields, and Fracture Systems and the Implications for Long-Term Landscape Formation: Some Evidence from Lyngen and Øksfordjøkelen Areas in North Norway, Polar Geogr., 28, 93–119, https://doi.org/10.1080/789610120, 2004.
Withers, P. J., Bouman, C., Carmignato, S., Cnudde, V., Grimaldi, D., Hagen, C. K., Maire, E., Manley, M., Du Plessis, A., and Stock, S. R.: X-ray computed tomography, Nature Rev. Meth. Primers, 1, 18, https://doi.org/10.1038/s43586-021-00015-4, 2021.