the Creative Commons Attribution 4.0 License.
the Creative Commons Attribution 4.0 License.
 | 02 Jan 2024
Assessment of rock glaciers and their water storage in Guokalariju, Tibetan Plateau
Mengzhen Li
Yanmin Yang
Zhaoyu Peng
Gengnian Liu
Rock glaciers are important hydrological reserves in arid and semi-arid regions. Their activity states can indicate the existence of permafrost. To help further explore the development mechanisms of rock glaciers in semi-arid and humid transition regions, this paper provides a detailed rock glacier inventory of the Guokalariju (also known as Goikarla Rigyu) area of the Tibetan Plateau (TP) using a manual visual interpretation of Google Earth Pro remote sensing imagery. We also estimated the water volume equivalent (WVEQ) in the study area for the first time. Approximately 5057 rock glaciers were identified, covering a total area of ∼404.69 km2. Rock glaciers are unevenly distributed within the three sub-regions from west to east, with 80 % of them concentrated in the central region, where climatic and topographic conditions are most favorable. Under the same ground temperature conditions, increases in precipitation are conducive to rock glaciers forming at lower altitudes. Indeed, the lower limit of rock glaciers' mean altitude decreased eastward with increasing precipitation. Estimates of the water storage capacity of rock glaciers obtained by applying different methods varied considerably, but all showed the potential hydrological value of rock glaciers. The possible water storage in the subsurface ice of rock glacier permafrost was 1.32–3.60 km3. The ratio between the amount of subsurface ice stored in rock glaciers and surface ice stored in local glaciers falls within the range of 1:2.32 to 1:1.26, with an average ratio of 1:1.69. In the west region, where the climate is the driest, the water storage capacity of rock glaciers was estimated to be up to twice as large as that of the sub-region's glaciers. Changes in water resources and permafrost stability in the area where rock glaciers occur will have implications for regional water resource management, disaster prevention, and sustainable development strategies.
- Article
(8898 KB) - Full-text XML
-
Supplement
(13044 KB) - BibTeX
- EndNote


Rock glaciers are periglacial landforms often observed above the timberline in alpine mountains. They are formed by rocks and ice that move down a slope, driven by gravity (French, 2007; RGIK, 2022a). As striking features of viscous flow in perennially frozen materials, they can reflect permafrost conditions in mountainous areas. Their lowest altitudes are often considered to represent the lower limit of discontinuous regional permafrost occurrence (Giardino and Vitek, 1988; Barsch, 1992, 1996; Kääb et al., 1997; Schmid et al., 2015; Selley et al., 2018; Baral et al., 2019; Hassan et al., 2021); their states (active or relict) can be used in Permafrost Zonation Index (PZI) models to predict the probability of permafrost occurrence where field observation data are scarce (Cao et al., 2021; Boeckli et al., 2012a). The large-scale distribution of active rock glaciers is influenced by the complex interaction of climatic and topographic factors (Schrott, 1996; Millar and Westfall, 2008; Pandey, 2019). Global climate change may result in permafrost thawing and ice melting in rock glaciers, thus impacting slope stability, runoff patterns, and water quality, with possible consequences for periodic landslides, debris flows, floods, and other geological disasters (Barsch, 1996; Schoeneich et al., 2015; Blöthe et al., 2019; Hassan et al., 2021; Yao et al., 2022). Exploring their spatial distribution and evolution is therefore significant for paleoclimatic modeling, disaster risk assessment, and infrastructure maintenance (Arenson and Jakob, 2010; Colucci et al., 2016; Selley et al., 2018; Alcalá-Reygosa, 2019). Furthermore, the slow thawing process through heat diffusion with latent heat exchange at depth, combined with the cooling effect of the ventilated coarse blocks at the surface of rock glaciers, makes them a long-term hydrological reserve in high-mountain systems (Bolch and Marchenko, 2009; Berthling, 2011; Bonnaventure and Lamoureux, 2013; Millar et al., 2013). The presence and abundance of rock glaciers can therefore affect the quantities and properties of runoff from high-mountain watersheds over extended time periods (Jones et al., 2019).
The Tibetan Plateau (TP) is among the key high-altitude areas of periglacial landform worldwide and is a region highly sensitive to climate change (Cui et al., 2019; Yao et al., 2019). Detailed rock glacier inventories have previously been constructed for the Gangdise Mountains (Zhang et al., 2022), the Daxue Mountains (Ran and Liu, 2018), the Nyainqêntanglha Range (Reinosch et al., 2021), and the Nepalese Himalaya (Jones et al., 2018b). The Yarlung Zangbo River Basin (YZRB) is one of the regions with the highest concentrations of modern glaciers on the TP; it is experiencing rapid geomorphic evolution today (Ji et al., 1999; Korup and Montgomery, 2008; Yu et al., 2011; Long et al., 2022). Although Guo (2019) characterized the spatial distribution of rock glaciers in the YZRB using manual visual interpretation, there remains a lack of any systematic and detailed rock glacier inventory, and the regional occurrence characteristics and indicative environmental significance of these rock glaciers are still unclear. Even though ground-penetrating radar (GPR), seismic refraction tomography (SRT), electrical resistivity tomography (ERT), and other geophysical techniques are widely used today and can provide new insights into understanding the ice volumes of rock glaciers and permafrost (Janke et al., 2015; Emmert and Kneisel, 2017; Bolch et al., 2019; Buckel et al., 2021; Halla et al., 2021; Mathys et al., 2022), it remains difficult to apply such methods to large-scale, field-based research on the TP. The distribution of permafrost and the hydrological contributions made by rock glaciers on the TP need more research.
To address this, our study aims to (i) compile a more comprehensive and systematic inventory of rock glaciers in Guokalariju (also known as Goikarla Rigyu), (ii) explore the regional occurrence characteristics and indicative environmental significance of these rock glaciers, (iii) assess the regional hydrological significance of rock glaciers and glaciers, and (iv) compare the distribution of Guokalariju's rock glaciers to the regional permafrost maps.
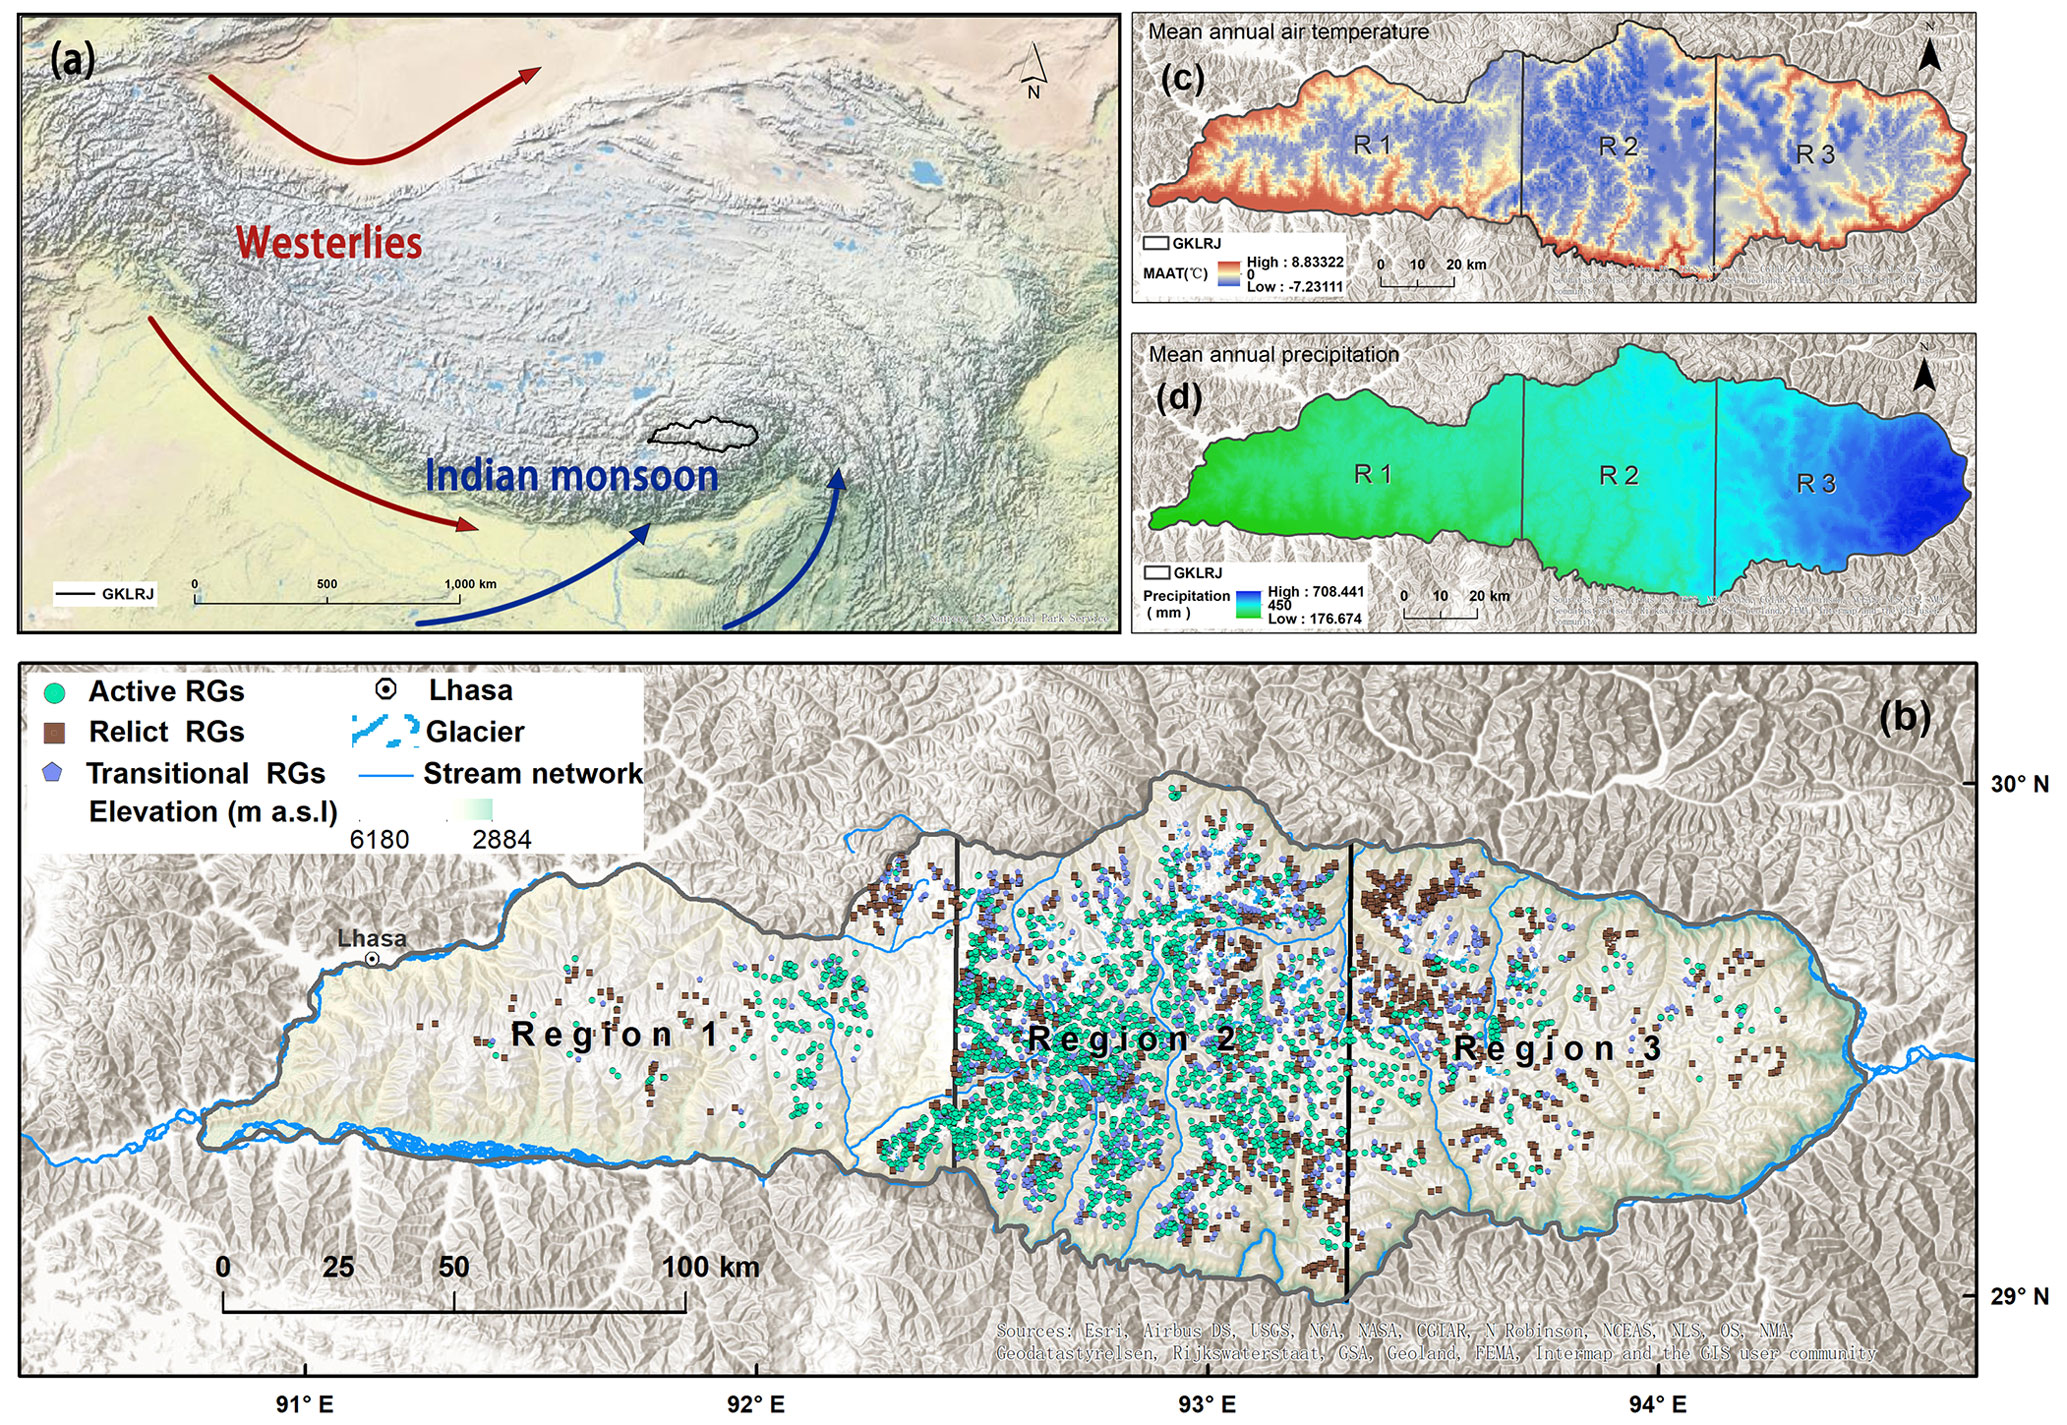
Figure 1(a) The location of Guokalariju on the TP; (b) the three sub-regions and the spatial distribution of streams. Rock glaciers are categorized as green (active rock glaciers), purple (transitional rock glaciers), and brown (relict rock glaciers), and glaciers are shown in light blue and white; (c) mean annual air temperature map for Guokalariju (Du and Yi, 2019a); (d) mean annual precipitation map for Guokalariju (Du and Yi, 2019b). Maps were created using ArcGIS® software by Esri.
Guokalariju is located between 92.916–93.276∘ N and 29.287–29.438∘ E, on the southeastern TP, adjacent to the Himalayas 0to the south and the Nyainqêntanglha Range to the north (Fig. 1a). It forms the eastern extension of the Gangdise Mountains as well as the watershed of the Yarlung Zangbo river and its tributary, the Niyang–Lhasa river, and belongs to the high-mountain, plateau–lake, basin-wide valley area of the middle and upper reaches of the Yarlung Zangbo and Nujiang rivers (Xiang, 2013). The region is also within the world's largest irrigated agricultural area and has a dense population (Yao et al., 2022).
Tectonically, the study area is located in the eastern part of the Ladakh–Gangdese–Xiachayu magmatic arc of the Gangdise–Himalayan collisional orogen; from the late Paleozoic to the Mesozoic, it experienced the same evolutionary tectonic processes as the Gangdise–Himalayan archipelagic arc–basin systems, i.e., back-arc spreading, arc–arc collision, and arc–continental collision (Pan et al., 2013). The main rock types in the study area include Late Cretaceous quartz monzonite, Eocene monzonite, and Eocene biotite granite. It is located in the transition belt between the TP's semi-arid and humid regions (Zheng et al., 2010), mainly dominated by the Indian summer monsoon (ISM). The middle and western parts of the study area belong to the TP's temperate, semi-arid zone, while the eastern part belongs to the plateau's temperate, humid region (Zheng et al., 2010). The mean annual air temperature (MAAT) ranges from −7.2 to 8.8 ∘C (Du and Yi, 2019a) (Table 1 and Fig. 1c), and the mean annual ground temperature (MAGT) ranges from −3.2 to 4.3 ∘C (Ran et al., 2020) (Table 1). The mean annual precipitation (MAP) is 177–708 mm, decreasing from east to west across the study area (Du and Yi, 2019b) (Table 1 and Fig. 1d). Changes in the imbalance between glaciers, permafrost, lakes, and rivers in this region under the influence of climate change may lead to spatial and temporal changes in local ecosystems and changes in water resources in downstream areas (Yao et al., 2022).
Table 1MAAT (Du and Yi, 2019a), MAGT (Ran et al., 2020), MAP (Du and Yi, 2019b), mean altitude (ASTER GDEM v3), and mean glacier ELA (RGI Consortium, 2017) for Guokalariju and its three sub-regions.
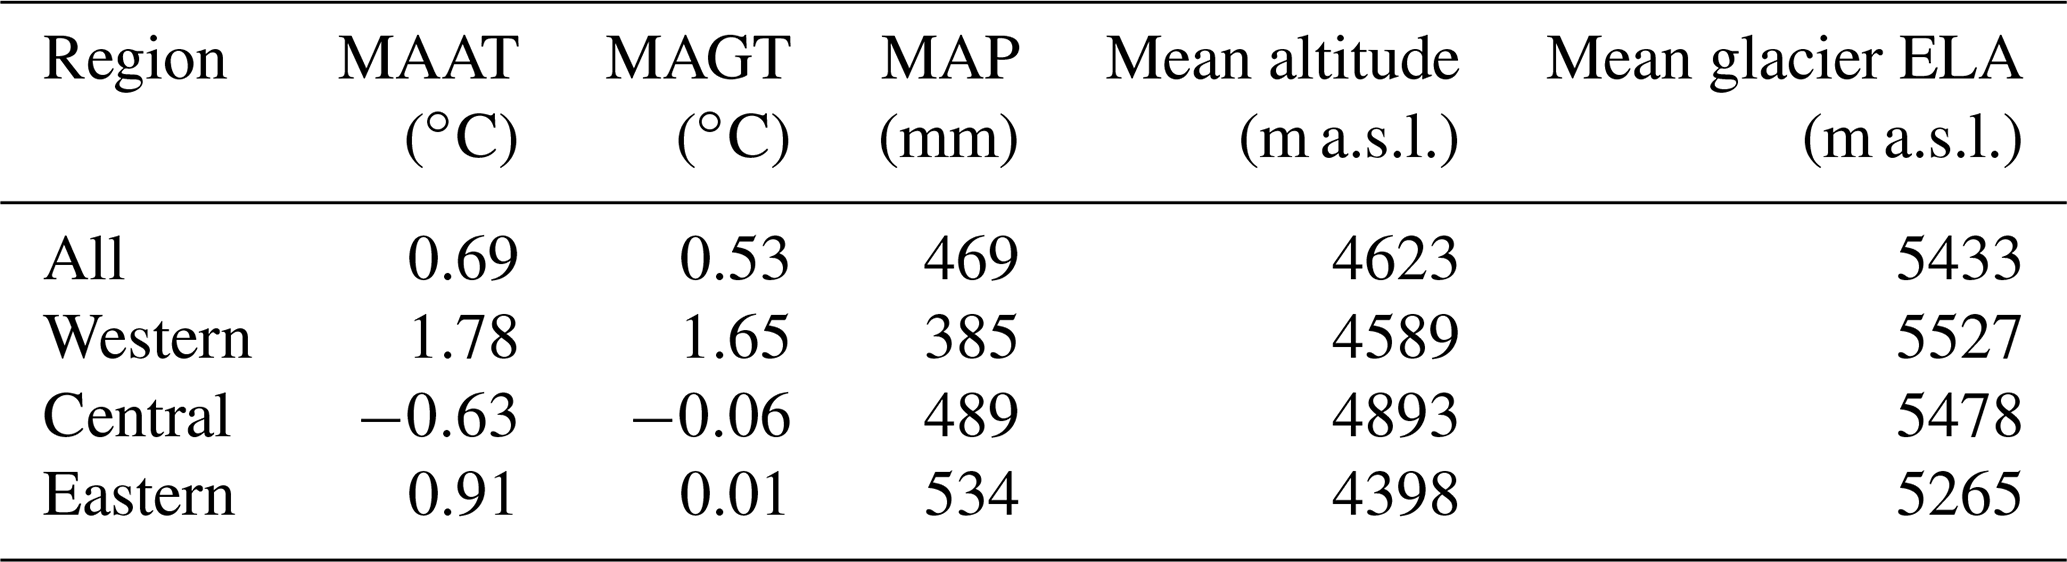
MAGT: mean annual ground temperature; MAAT: mean annual air temperature; MAP: mean annual precipitation.
We divided the study areas into the western, central, and eastern sub-regions. These divisions were geospatially based (Fig. 1b), where the western and central regions are bounded by the east marginal rift valley of the Oiga basin, and the central and eastern regions are bounded by Ni Qu, a tributary of the Niyang river. Each sub-region displays unique characteristics in terms of its topography and climate (Table 1). The whole of the western region is a semi-arid region, and the terrain is more complex here. The west side of the western region is composed of a deep alpine valley landscape formed by glacial–fluvial erosion cutting through the undulating terrain, while the east side is a basin formed by paleoglacial and fluvial erosion cutting through less undulating mountainous hills with relatively gentle tops (Wu et al., 2007). The central region is a semi-arid and semi-humid transition zone where the dividing line is located in its northeastern part; the mean altitude here is higher than in the other regions. The main peaks of glacier-carved mountains occur mostly above 5500 m a.s.l. The east region is located in a semi-humid zone where precipitation is more abundant and the terrain is on average ∼500 m lower than that of the central region.
3.1 Rock glacier inventory, classification, and database
We used high-resolution © Google Earth Pro remote sensing images from March 2004 to August 2020 to manually and visually interpret and compile a rock glacier inventory for the study area (Selley et al., 2018; Magori et al., 2020; Hassan et al., 2021). The inventorying strategy follows the RGI_PCv2.0 (RGIK, 2022b). According to the technical definition of rock glaciers, we conducted the detection of rock glacier landforms in the study area and confirmed the relevant landforms (system and unit). For areas with missing clear imagery and those covered by snow, we simultaneously used © Map World for comparison and verification, ensuring that all outline segments can be labeled with certainty. Each cataloged rock glacier system and unit was assigned a primary ID and delineated according to the extended standards, with the outline encompassing the entire rock glacier up to the rooting zone, including its external parts, such as the front and lateral margins (RGIK, 2022b). We followed as closely as possible the specific rules for delineating the upper boundaries of the rock glacier. Following the baseline concepts, the rock glacier without any (significant) headwall is classified as “debris-mantled-slope-connected” (Fig. 2a), the rock glacier unit subjacent and connected to a talus slope unit is classified as “talus-connected” (Fig. 2b), and the rock glacier developed within or from a (formerly) glaciated area is classified as “glacier-forefield-connected” (RGIK, 2022a) (Fig. 2c). In addition, any landform consisting of a single rock glacier unit or multiple spatially connected units is classified as a rock glacier system (RGIK, 2022a) (Fig. 2d). We also provided information on their morphological system and units as well as their upslope connection type in the attribute table in the Supplement (RGIK, 2022a, b). Due to the limited availability of accurate field observations and related data on rock glacier dynamics, their activity states were determined solely based on geomorphological criteria (RGIK, 2022a). In general, the “active” rock glacier has a steep front and freshly exposed material on top, indicating current movement (Fig. 2e); the “transitional” rock glacier has less distinct evidence of current movement compared to active ones in the same region (Fig. 2f); and the “relict” rock glacier shows no recent movement and has a subdued topography, has smooth lateral and frontal slopes/margins, and may have developed vegetation and soil cover (RGIK, 2022a) (Fig. 2g). The activity type of each rock glacier was recorded in the attribute table in the Supplement. Furthermore, we applied one-way ANOVA in SPSS27® software (IBM Corp, 2020) based on the F-test method to analyze the differences between groups of different types of rock glaciers in terms of mean altitude, mean area, and mean slope. The significance was evaluated at the level p<0.05.
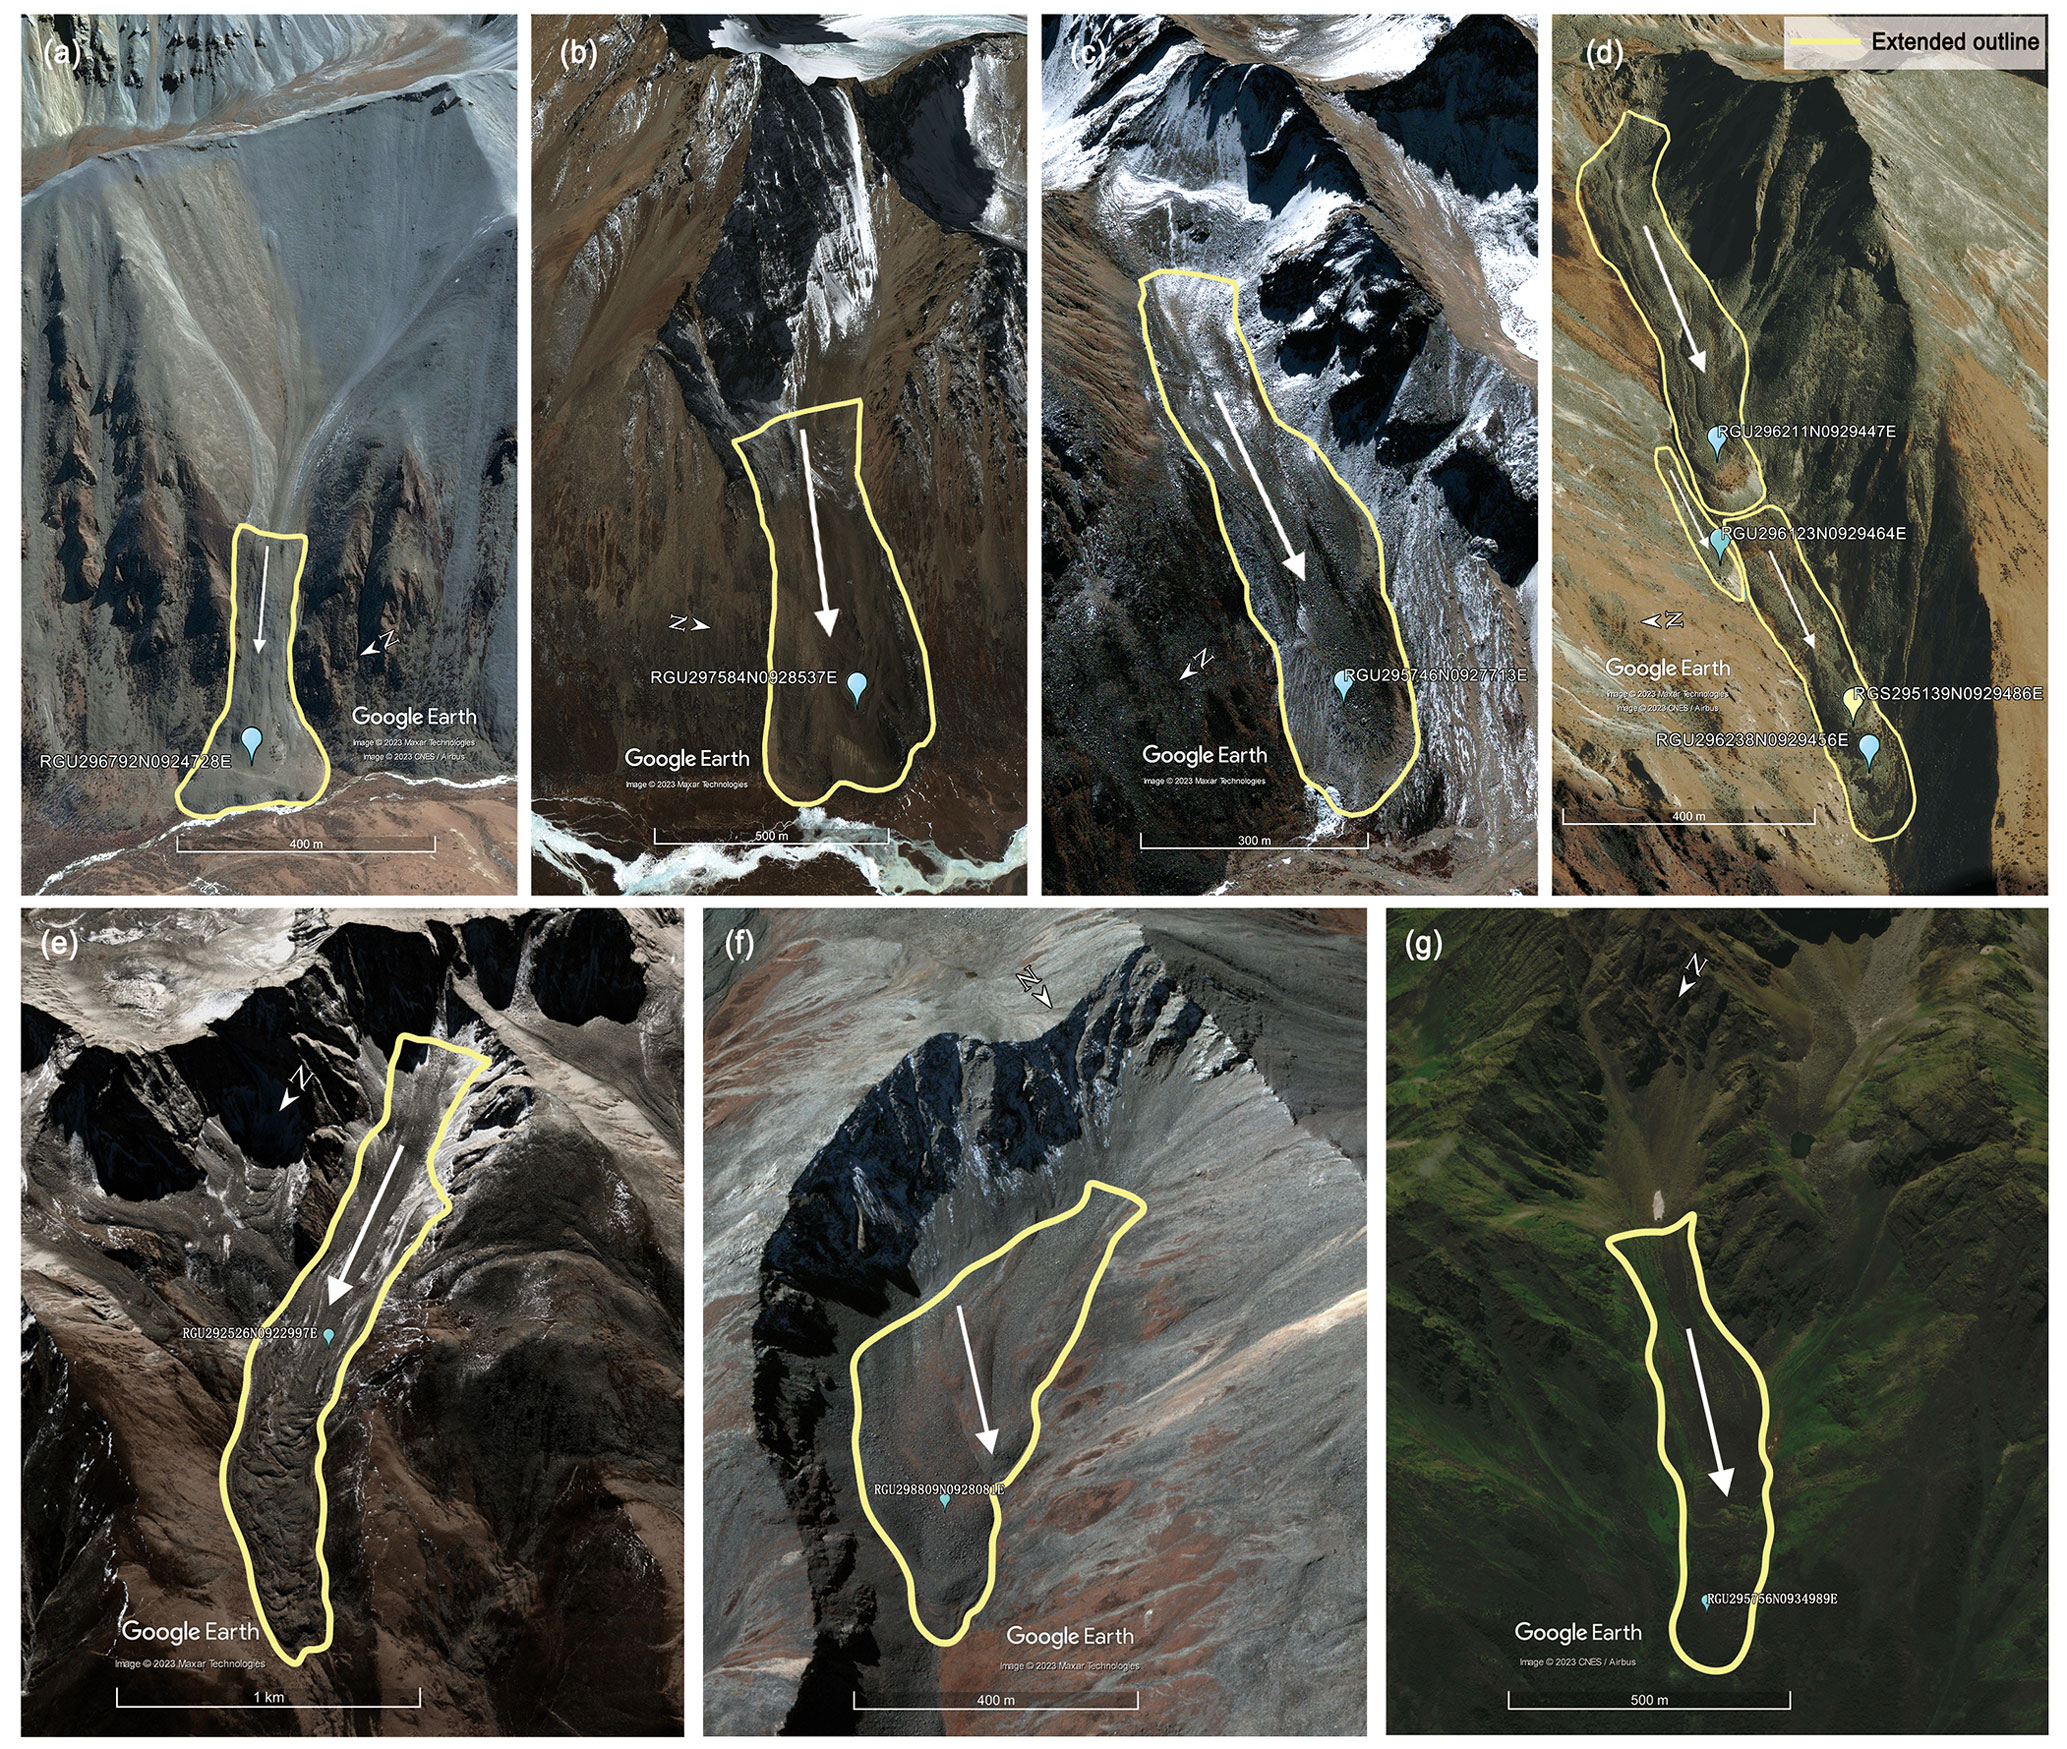
Figure 2Example images of different upslope boundary types of rock glaciers in Guokalariju. (a) A debris-mantled-slope-connected rock glacier; (b) a talus-connected rock glacier; (c) a glacier-forefield-connected rock glacier; (d) a rock glacier system; (e) an active rock glacier; (f) a transitional rock glacier; (g) a relict rock glacier. Images from © Google Earth.
3.2 Estimating the hydrological storage
To calculate more accurately the water content (water volume equivalent, WVEQ [km3]) of the perennially frozen rock glaciers and surface ice in glaciers in the study area (Jones et al., 2018b), we chose two different methods derived from Brenning (2005a) and Cicoira et al. (2021). The previous studies mostly treated active and transitional rock glaciers collectively as intact rock glaciers with the same ice content to calculate the water storage. Therefore, for comparison with the results of other studies, we also did not consider relict rock glaciers when calculating the hydrological storage of rock glaciers by using the methods of Brenning (2005a) and Cicoira et al. (2021). Meanwhile, we also provided calculations based on the Janke et al. (2015) proposal in the Supplement (Table S1).
The method for calculating the subsurface ice volumes of rock glacier permafrost provided by Brenning (2005a) requires multiplying the mean thickness, surface area, and ice content of each rock glacier as in Eq. (1) and then converting them to the WVEQ by assuming an ice density conversion factor of 0.9 g cm−3 (≡900 kg m−3) (Paterson, 1994; Jones et al., 2018b); thus,
Based on field data from Brenning (2005a) and a rule of thumb given by Barsch (1977) for the Swiss Alps, the rock glacier thickness was modeled empirically as Eq. (2); thus,
The method provided by Cicoira et al. (2021), based on the analysis of a dataset of 28 rock glaciers from the Alps (23) and the Andes (5), estimated rock glacier thickness using a perfectly plastic model arrived at by solving Eq. (4) for H, assuming a yield stress of τ=92 kPa (taking the mean driving stress from the dataset as a given); thus,
where τ is the shear stress (τ=92 kPa); g is the gravitational acceleration; H is the thickness of the moving rock glacier; α is the angle of the surface slope; and ρ is the density of the creeping material, which is given by the contribution of volumetric debris wd and ice content wi and the relative densities (ρi=910 kg m−3 and ρd=2700 kg m−3); thus,
The ice content in rock glacier permafrost is spatially variable. We therefore used global estimates of ice content within rock glaciers to further calculate their lower (40 %), mean (50 %), and upper (60 %) ice volumes (Hausmann et al., 2012; Krainer and Ribis, 2012; Rangecroft et al., 2015; Jones et al., 2018b; Wagner et al., 2021). In this study, the results of the calculations that used a 50 % ice content were used for subsequent comparisons with the surface ice in glaciers.
The ice volume of the glacier was calculated using Eq. (5); thus,
where V represents ice volume, A is the glacier surface area derived from the Randolph Glacier Inventory (RGI) version 6.0 (RGI Consortium, 2017), and H is the ice thickness. We chose to apply GlabTop2 to calculate ice thickness in the study area because it is more sensitive to the accuracy of both elevation and slope of the TP DEM data (Frey et al., 2014; Chen et al., 2022), and we also provide statistical values of the ice thickness results based on the Open Global Glacier Model (OGGM; Maussion et al., 2019) and the result provided by Farinotti et al. (2019) in the Supplement (Table S2). We assumed a 100 % ice content by volume and applied the above ice density conversion factor to calculate the water equivalent volume of the surface ice in glaciers.
To mitigate the additional impact caused by the uneven spatial distribution of glaciers and rock glaciers in the study area, we calculated a ratio of rock glaciers' water volume equivalence (WVEQ), including active and transitional rock glaciers, to glaciers' WVEQ by using the weighted average method that employs the following equation:
where the WVEQ ratio Rg:Glacier is the ratio of rock glaciers' WVEQ to glaciers' WVEQ; WVEQ RnRg (n=1, 2, 3) represents the WVEQ values for rock glaciers in the western, central, and eastern regions, respectively; RnRg (n=1, 2, 3) represents the numbers of rock glaciers in the three sub-regions, respectively; AllRg is the number of rock glaciers in the whole study area; WVEQ RnGlacier (n=1, 2, 3) represents the WVEQ values for glaciers in the three sub-regions, respectively; RnGlacier (n=1, 2, 3) represents the number of glaciers in the three sub-regions, respectively; and AllGlacier is the number of glaciers in the whole study area.
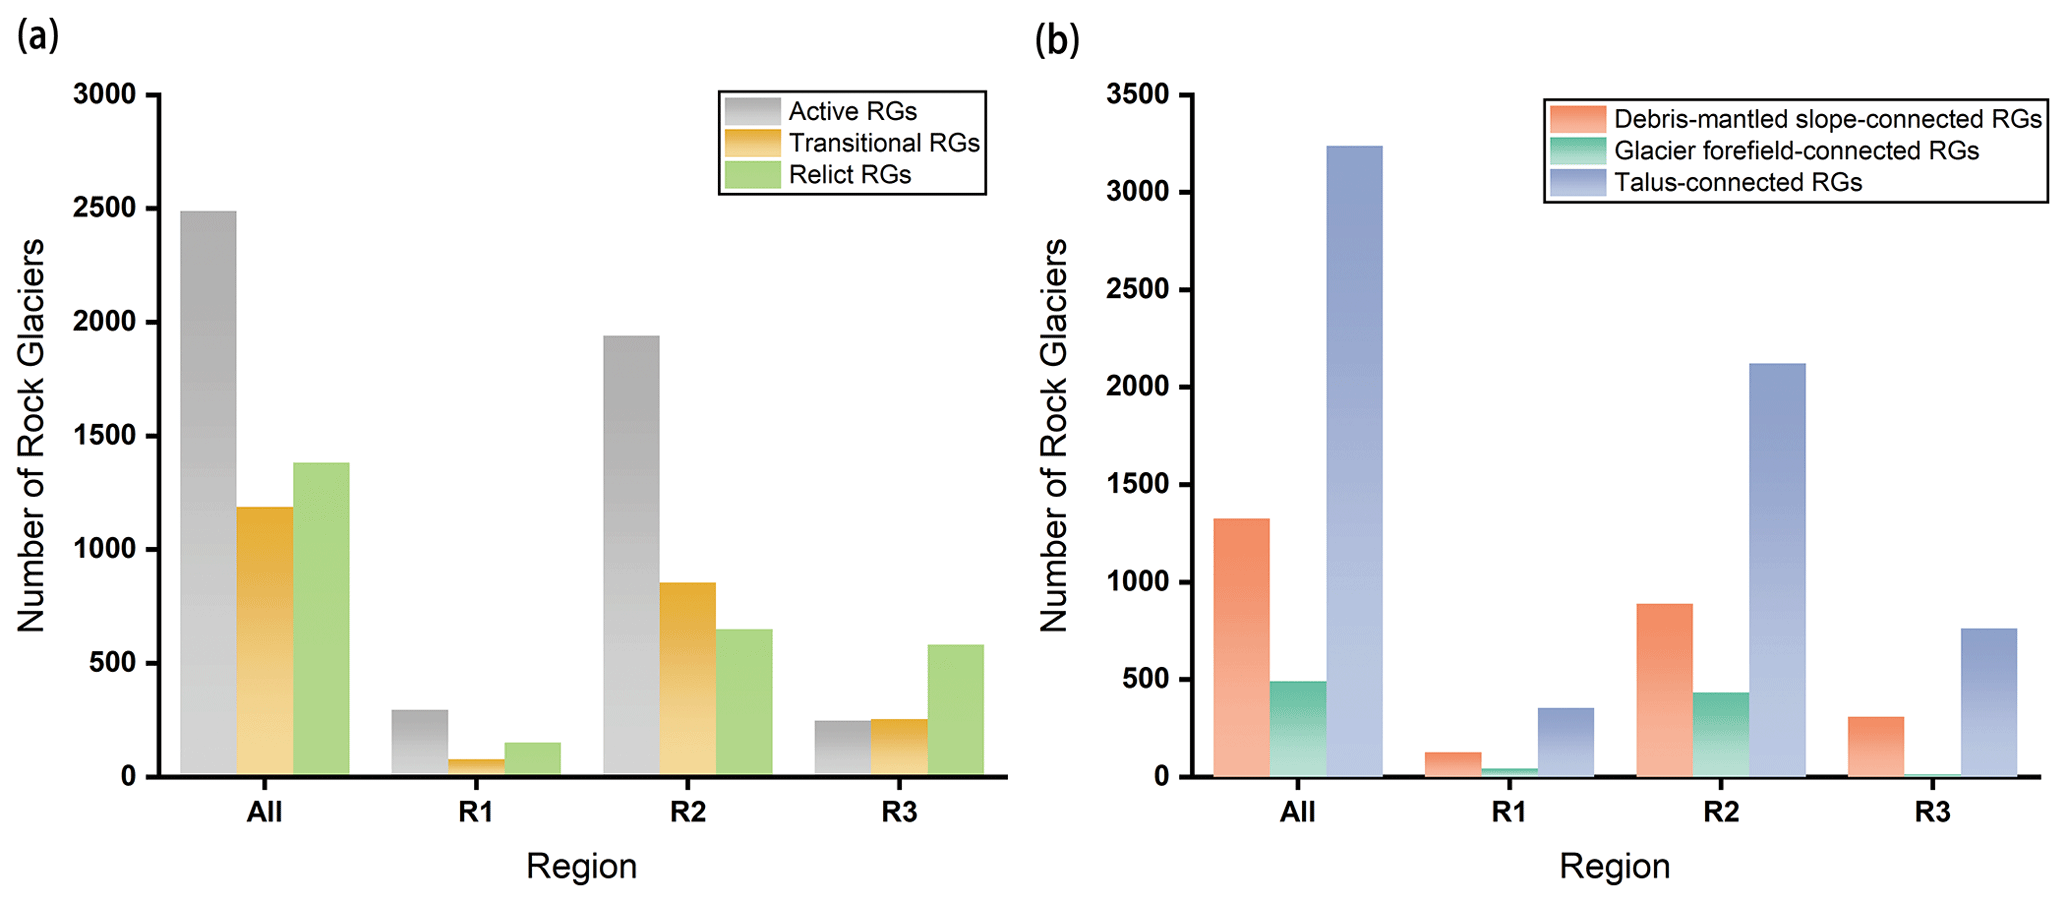
Figure 3The number of rock glaciers categorized by different (a) activity types and (b) upper-slope connection types in the entire study region and its sub-regions.
4.1 Rock glacier inventory analysis
We identified a total of 5057 rock glaciers in Guokalariju, including 2484 active rock glaciers (49.1 %), 1189 transitional rock glaciers (23.5 %), and 1384 relict rock glaciers (27.3 %). Active rock glaciers are predominant in the whole study area, except in the eastern region where a higher proportion of relict rock glaciers can be found (Fig. 3a). Among the total rock glaciers observed, ∼64 % of them (n=3239) were classified as talus-connected, ∼26 % (n=1327) as debris-mantled-slope-connected, and ∼10 % (n=491) as glacier-forefield-connected; this order of proportions is consistent across three sub-regions (Fig. 3b). On the whole, rock glaciers are unevenly distributed in three sub-regions, with nearly 70 % of rock glaciers (n=3447) distributed in the central region (Table 2).
Table 2Mean characteristics for rock glaciers in three sub-regions.
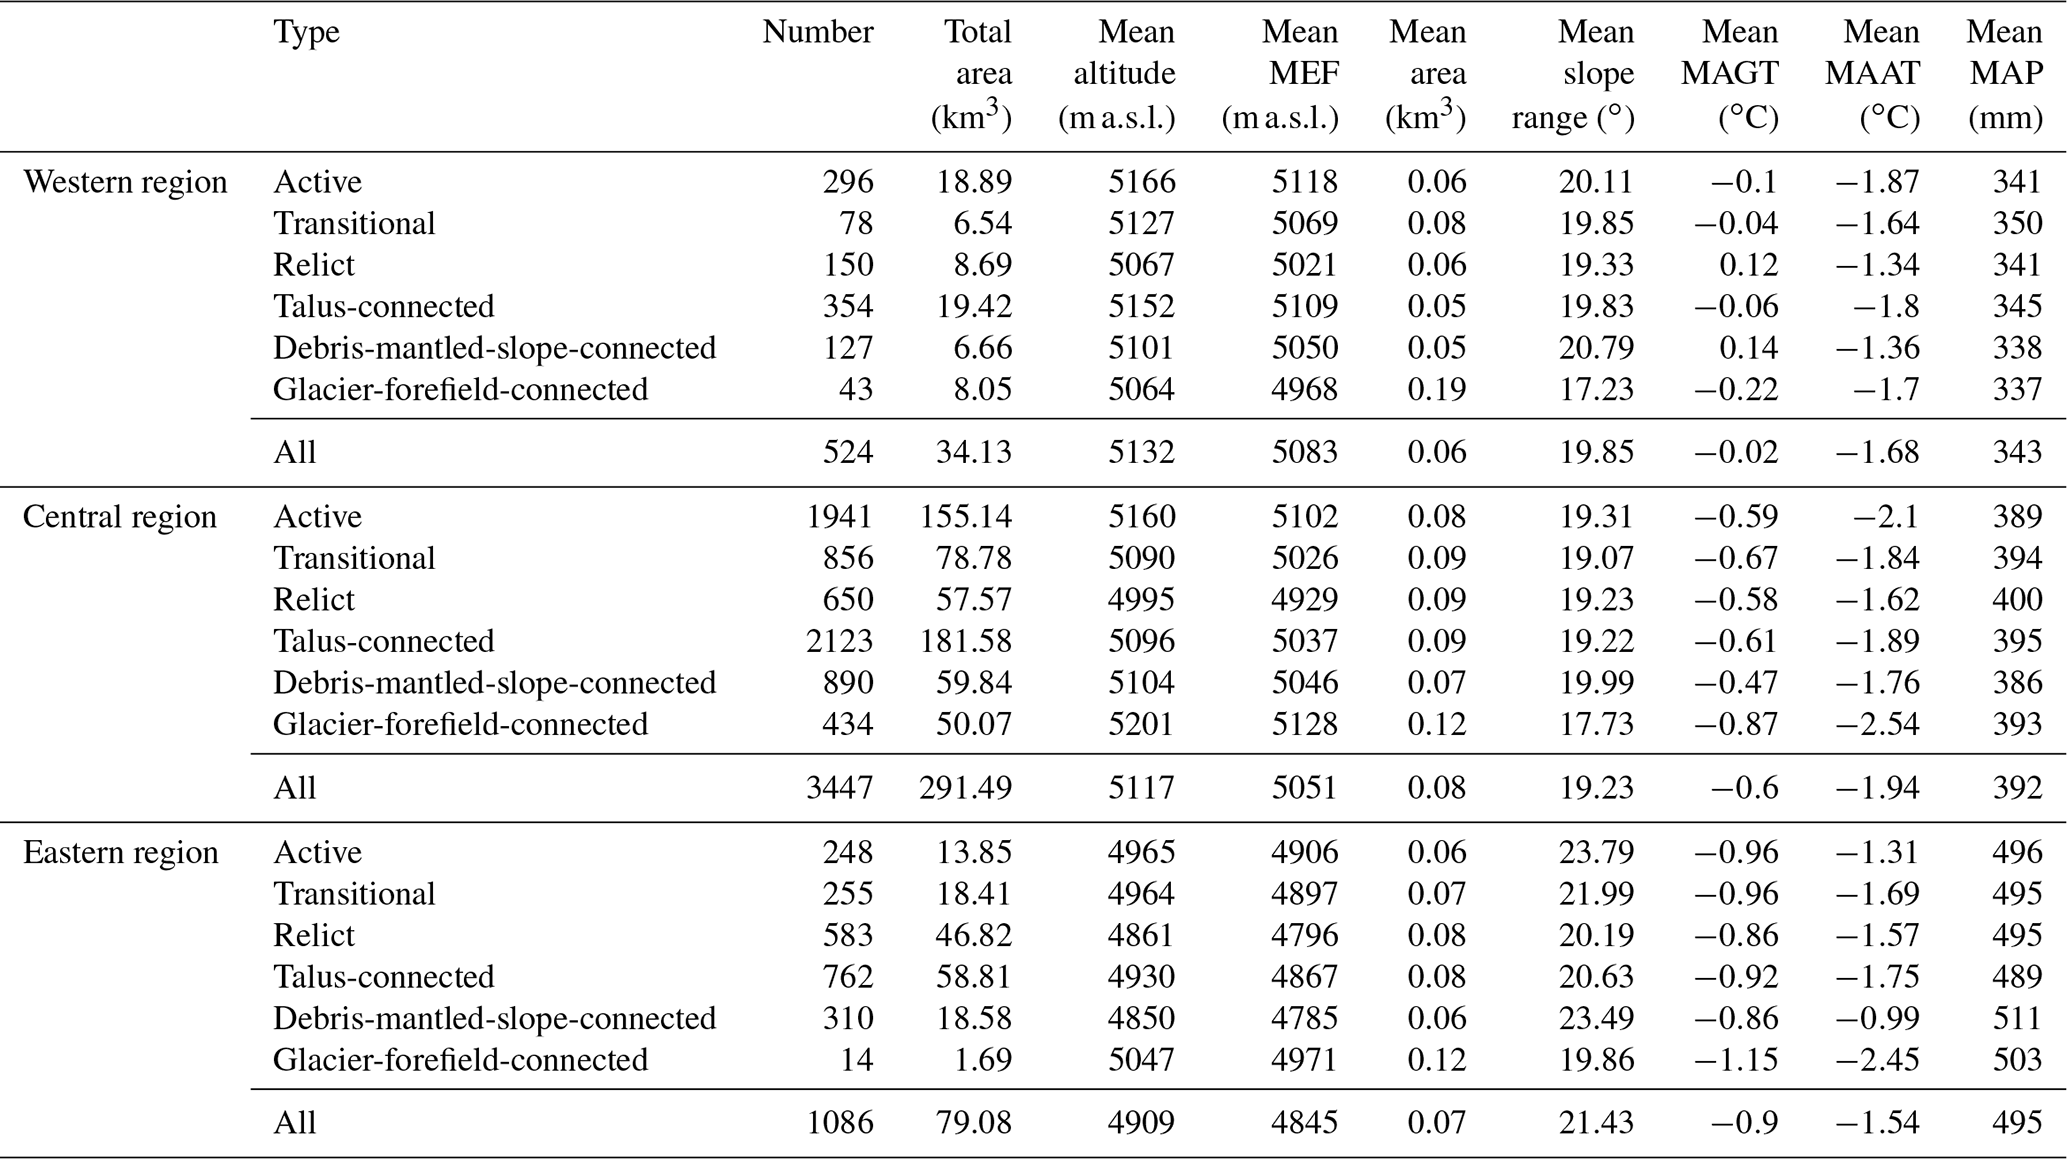
MEF: minimum altitude at the rock glacier front; MAGT: mean annual ground temperature; MAAT: mean annual air temperature; MAP: mean annual precipitation.
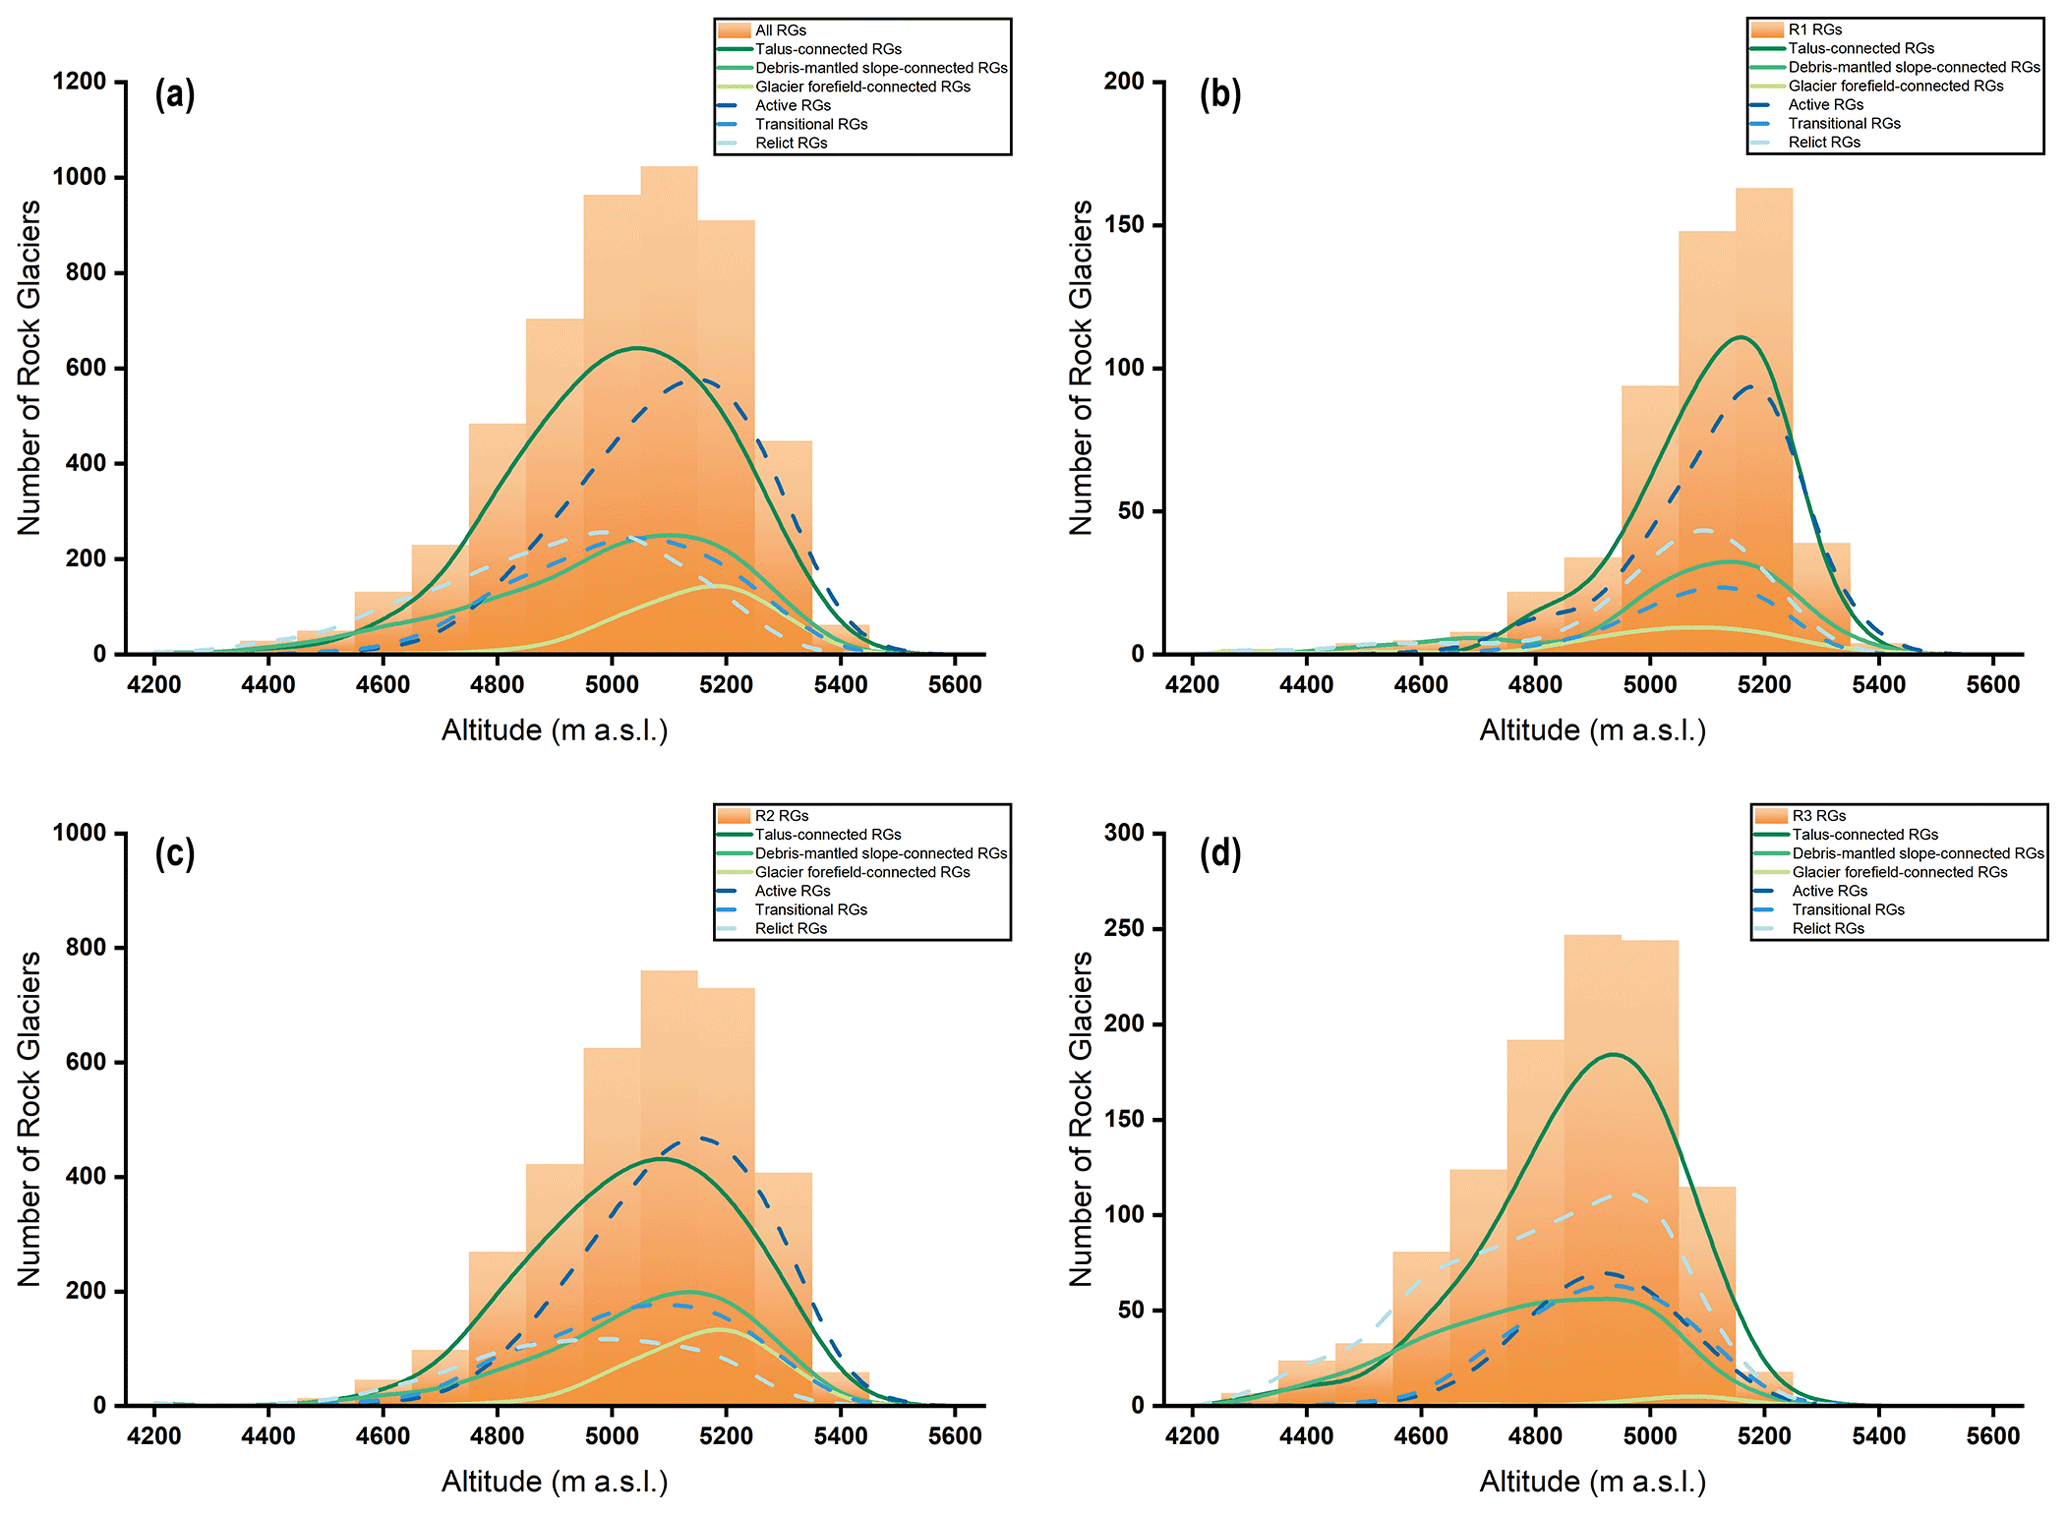
Figure 4The mean occurrence altitude of rock glaciers categorized by different activity and upper-slope connection types in (a) Guokalariju, (b) the western region, (c) the central region, and (d) the eastern region.
Around 90 % of the rock glaciers are located between 4800 and 5400 m a.s.l., with a mean altitude of ∼5070 m a.s.l. Active rock glaciers are statistically distributed at higher altitudes than transitional and relict rock glaciers (Table 3), at ∼76 and ∼195 m higher (Fig. 4a). The mean altitude of rock glaciers varies significantly depending on the type of spatial connection to the upper slope (Table 3). Compared to talus-connected (∼5063 m a.s.l.) and debris-mantled-slope-connected rock glaciers (∼5044 m a.s.l.), glacier-forefield-connected rock glaciers (∼5185 m a.s.l.) are more commonly found at higher elevations (Fig. 4a). The mean altitude of rock glaciers in the western region (∼5132 m a.s.l.) is higher than for those in the central (∼5112 m a.s.l.) and eastern region (∼4909 m a.s.l.) by ∼20 and ∼223 m, respectively (Table 2 and Fig. 4b–d). The lower altitudinal limit of rock glaciers declines as longitude increases eastward (Fig. 5).
Table 3The results of the one-way ANOVA. “df” stands for degrees of freedom.
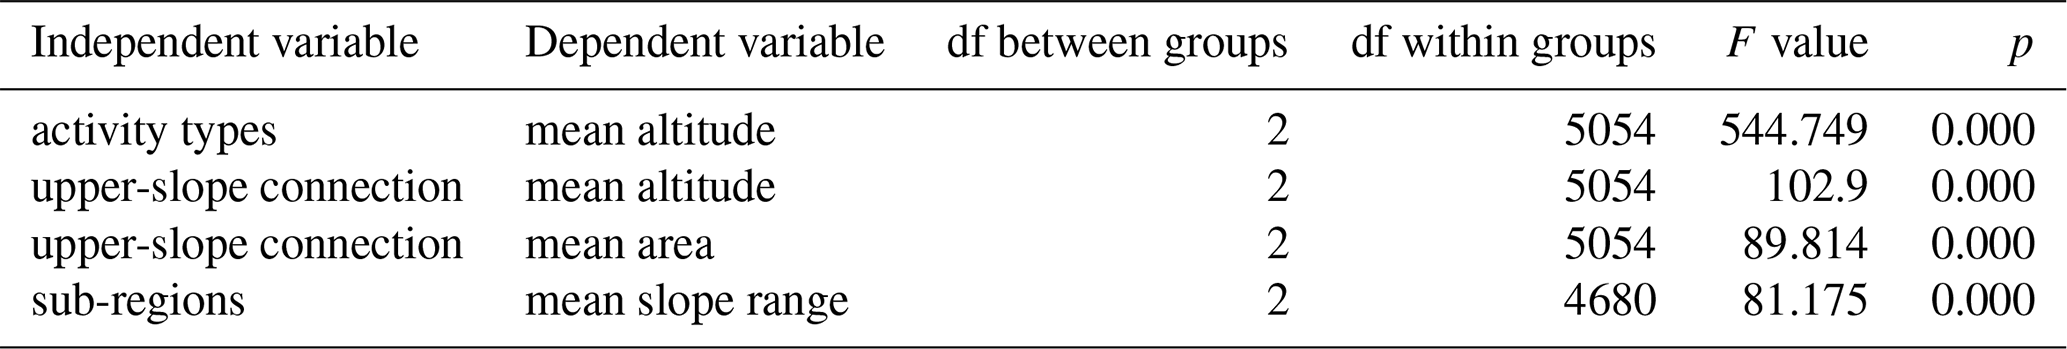
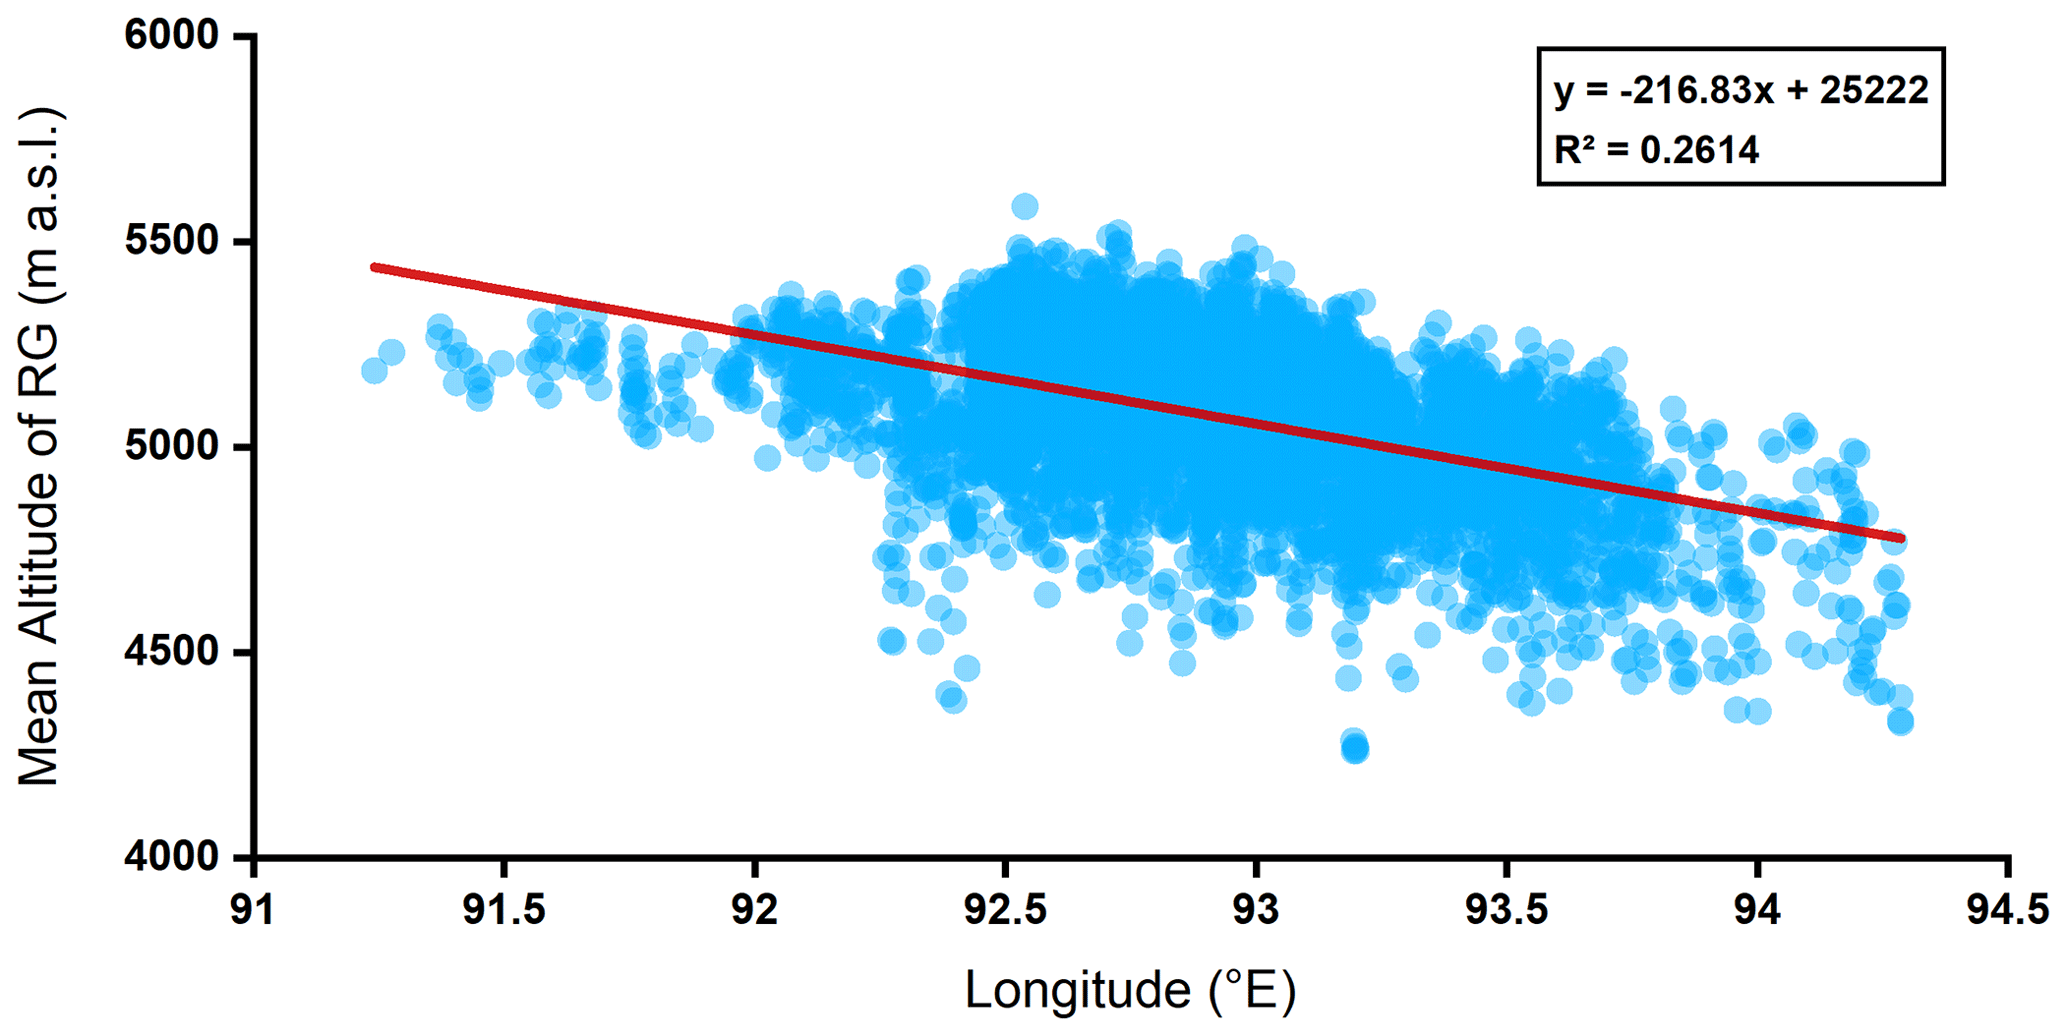
Figure 5Scatterplots and fitted curves of the mean altitudinal distribution of rock glaciers versus longitude.
In Guokalariju, the total area of rock glaciers is 404.69 km2, with active rock glaciers covering 187.88 km2, transitional rock glaciers covering 103.73 km2, and relict rock glaciers covering 113.09 km2, respectively. With the mean area of each rock glacier being 0.08 km2, the mean area of three different activity types of rock glaciers remains consistent with this value, but there are notable variations in the mean area of rock glaciers depending on their specific type of upper-slope connection (Table 3). Glacier-forefield-connected rock glaciers (0.12 km2) generally have a larger mean area than the talus-connected ones (0.08 km2) and the debris-mantled-slope-connected ones (0.06 km2). The mean area of most types of rock glaciers is the biggest in the central region and smallest in the western region (Table 2). Furthermore, the mean slope range of rock glaciers in the eastern region is significantly steeper compared to that in other sub-regions (Table 3).
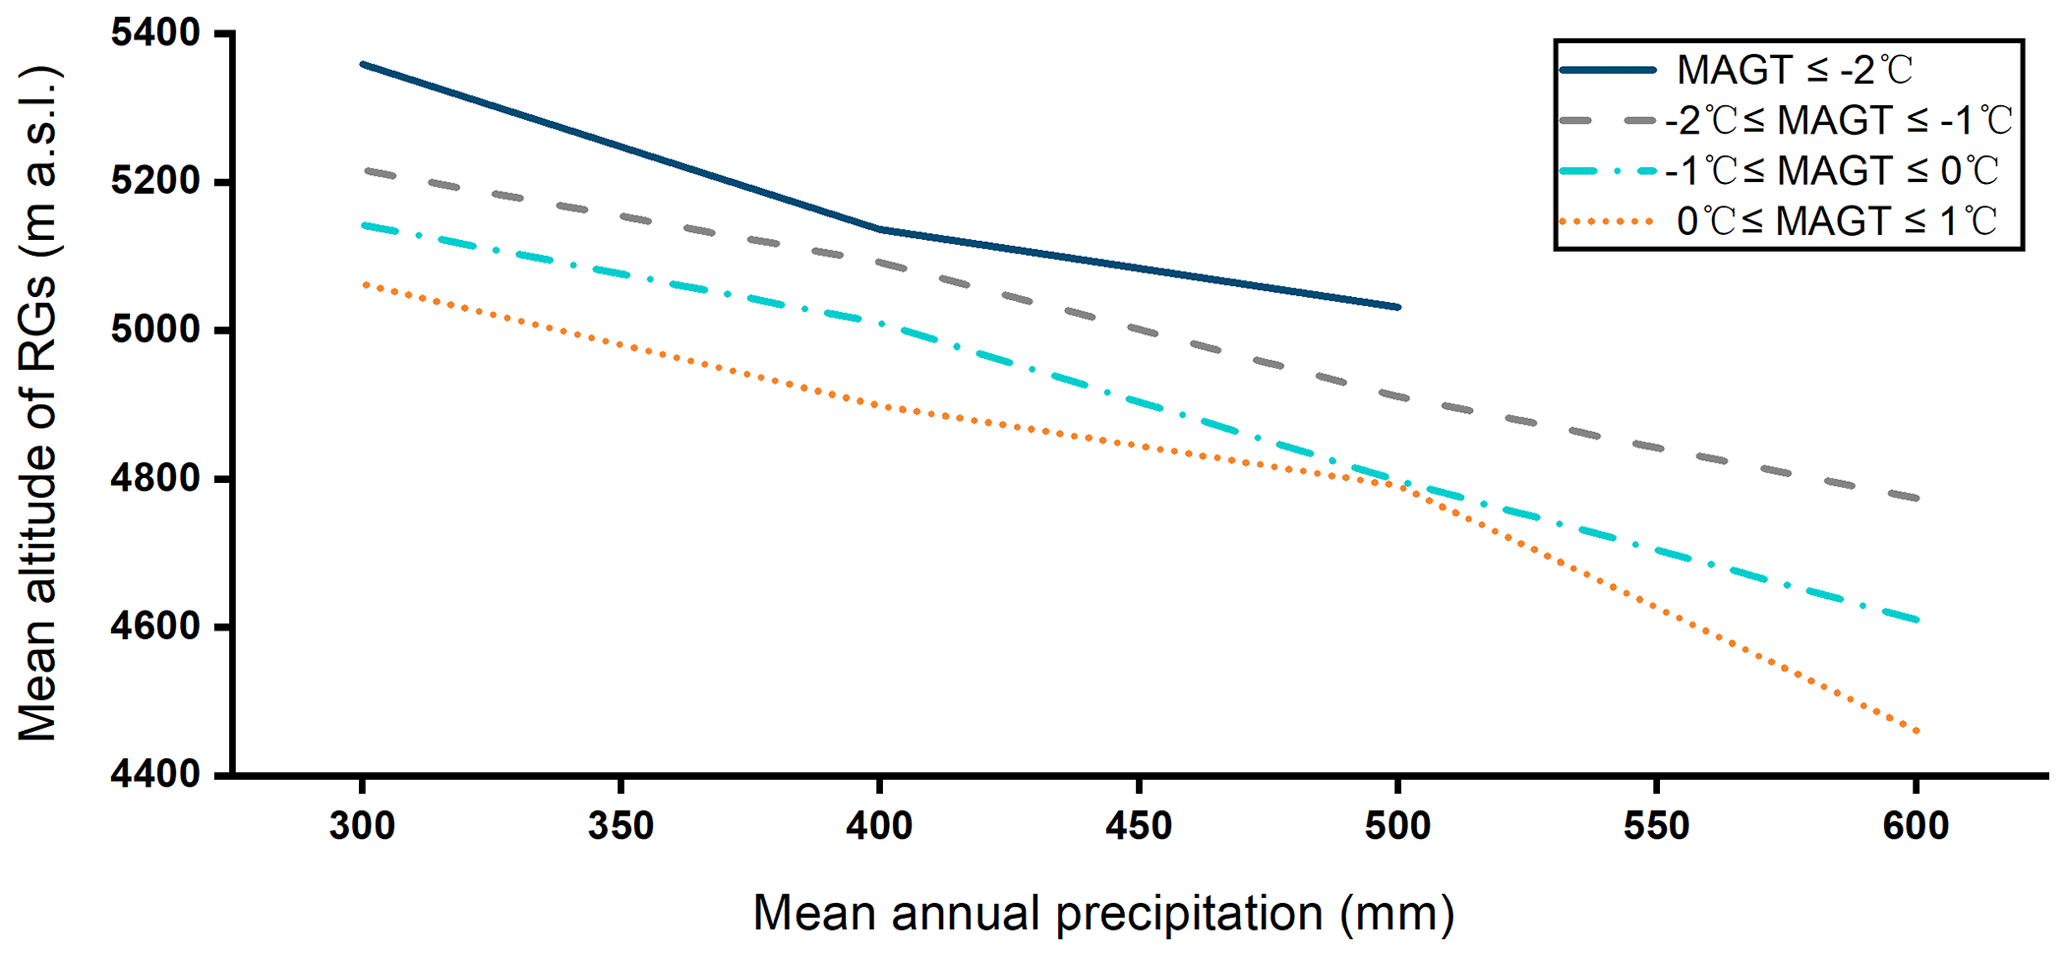
Figure 6The variation in mean altitude of rock glacier distribution with changes in mean annual precipitation for different mean MAGT states.
Around 90 % of the rock glaciers in Guokalariju are found in the region where the MAGT ranges from −2 to 0 ∘C. Additionally, the MAGT, MAAT, and MAP of the rock glaciers vary among the three sub-regions (Table 2). Specifically, the mean MAGT decreases gradually from the west to the east of the study area, while the mean MAP increases gradually. The mean MAAT follows the same order as the regional mean MAAT values listed in Table 1. With the same MAGT, the mean altitude of rock glacier distribution decreases with increasing MAP. Moreover, with the same MAP, the altitude of rock glacier distribution increases with decreasing MAGT (Fig. 6).
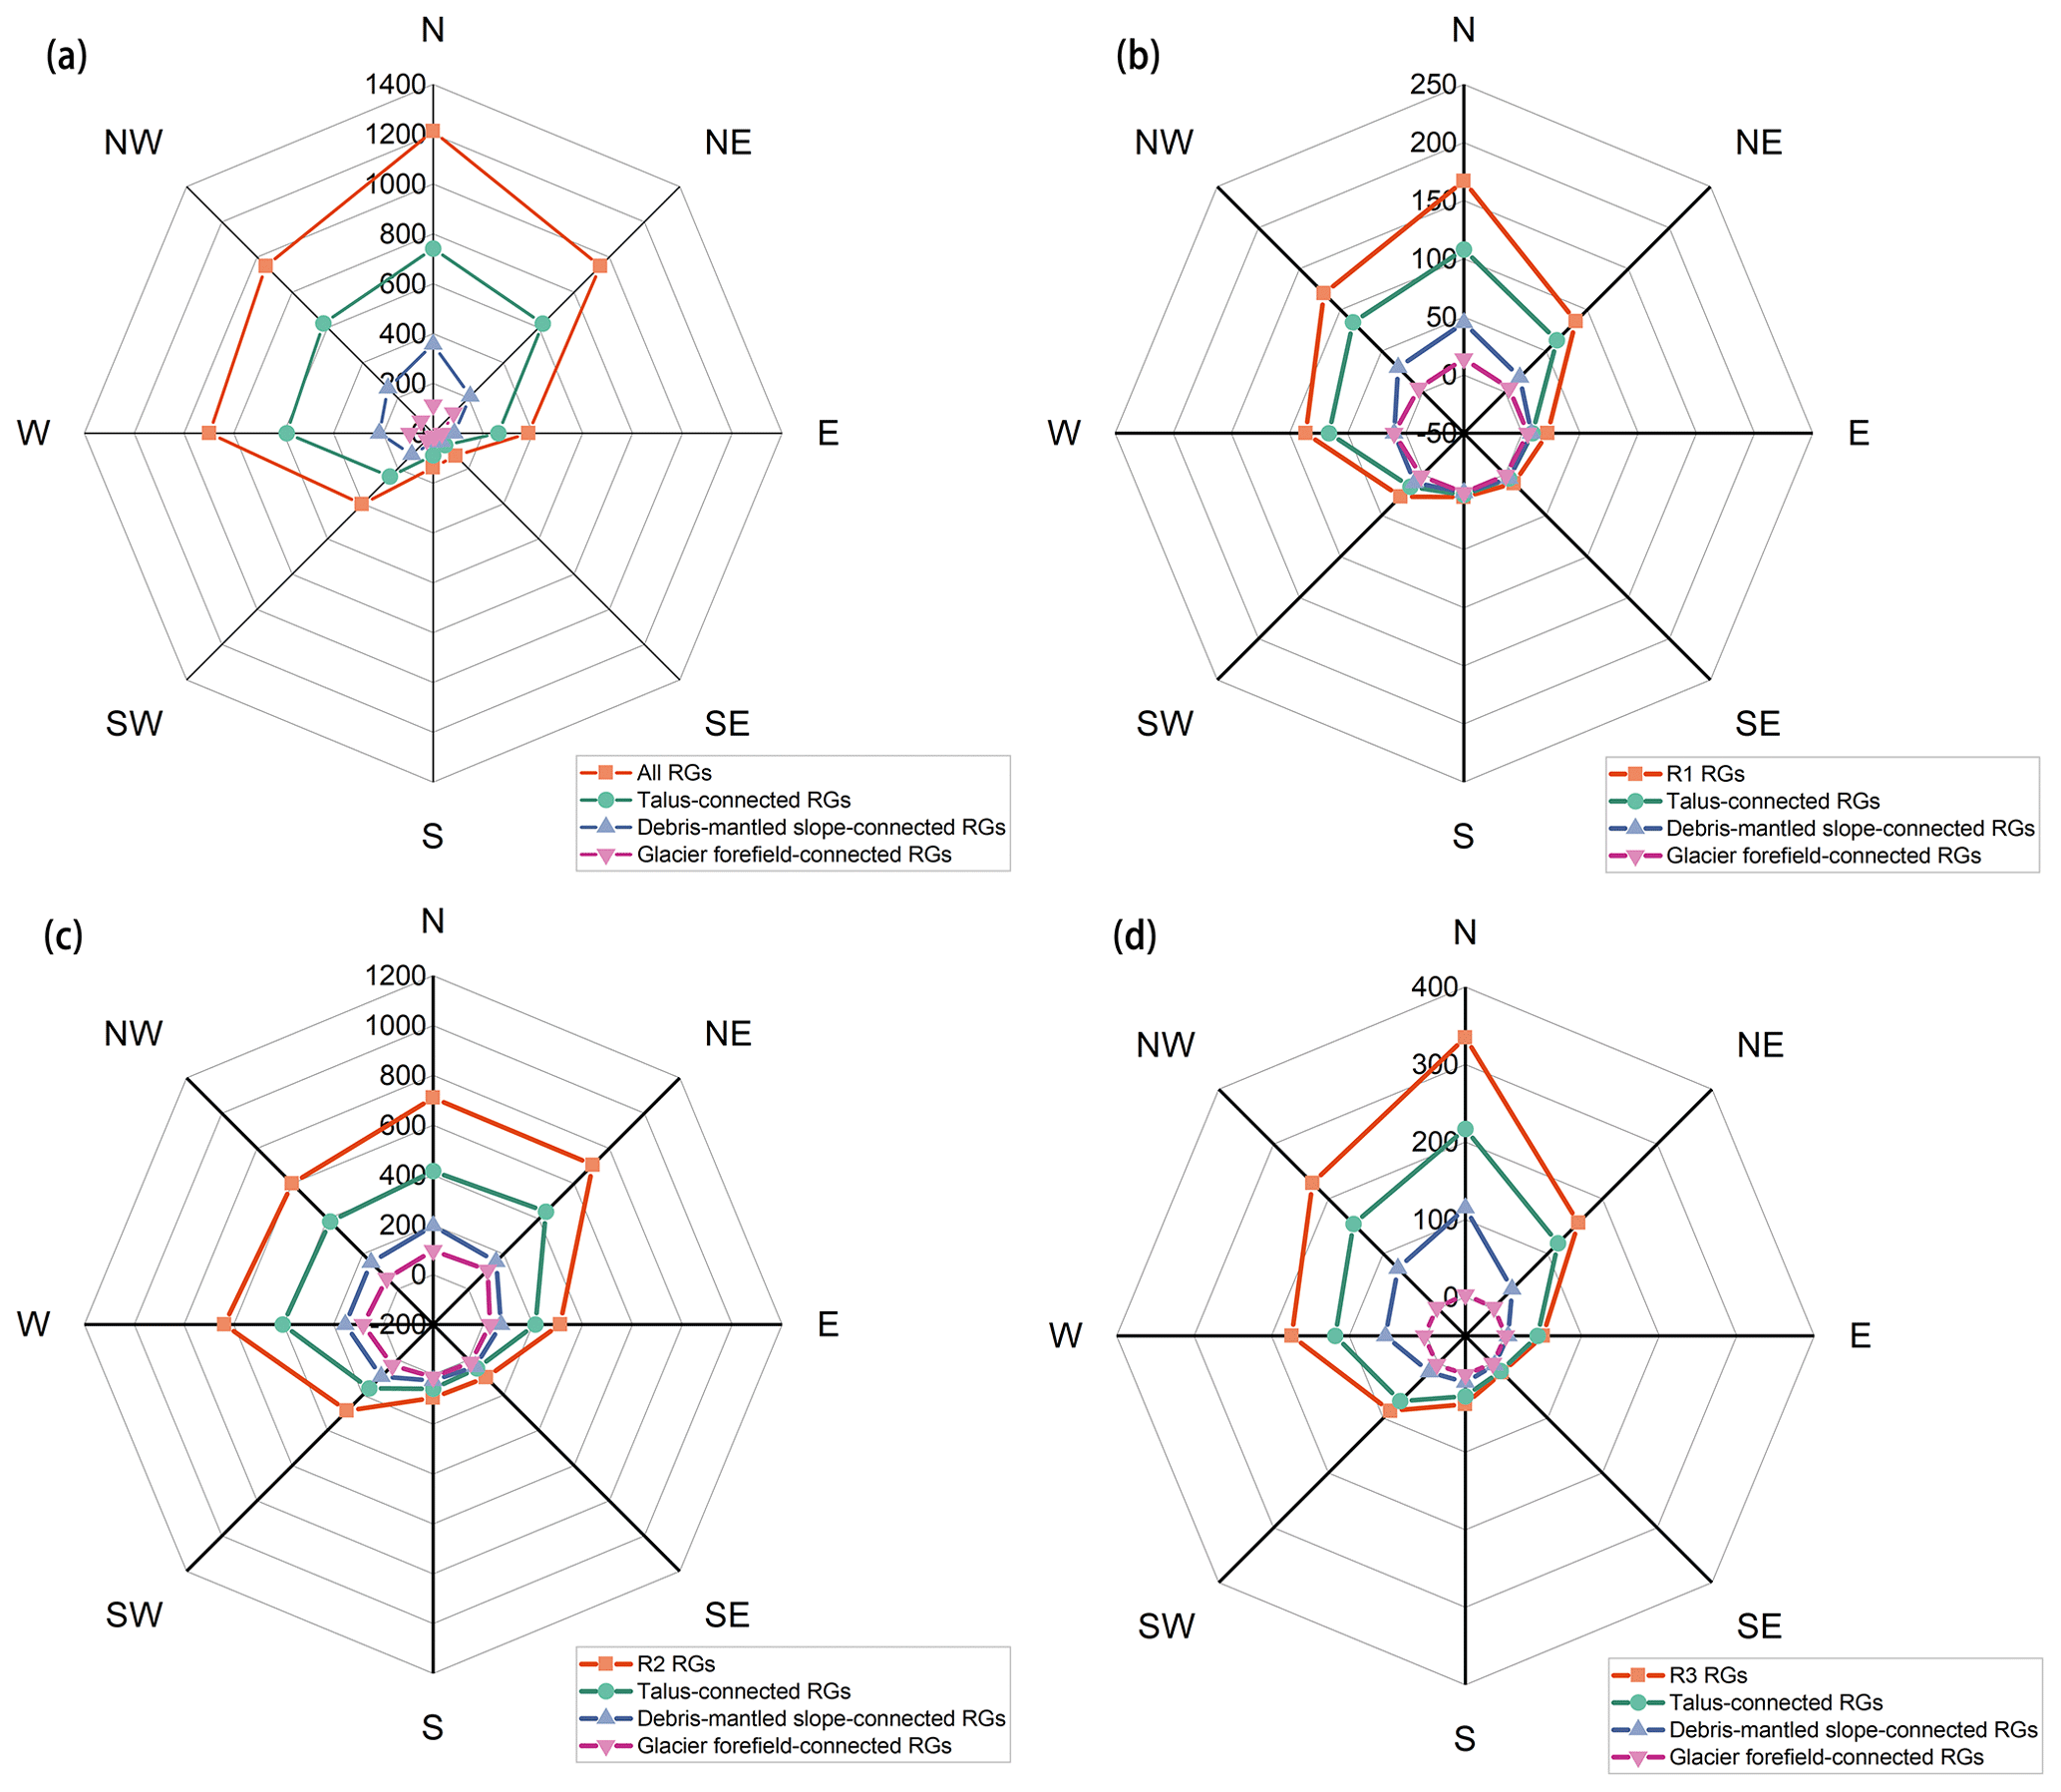
Figure 7Analysis of abundances of rock glaciers categorized by different upper-slope connection types in (a) Guokalariju, (b) the western region, (c) the central region, and (d) the eastern region. The numbers of rock glaciers for each aspect on the four radar plots are shown as percentages (%).
Rock glaciers predominantly occur on the north-facing aspect (23.9 %), northwest-facing aspect (18.7 %), and northeast-facing aspect (18.7 %), with some distributed on the west-facing aspect (17.7 %), and the fewest on the south-facing aspect (2.7 %), southeast-facing aspect (2.5 %), and southwest-facing aspect (7.9 %) (Fig. 7a). Compared with the obvious characteristics of the concentrated distribution of rock glaciers in the western and eastern region on the north-facing slope (Fig. 7b, d), rock glaciers in the central region are more evenly distributed on the slopes facing to the north, northeast, west, and northwest (Fig. 7c).
4.2 Water equivalent volumes
Based on the Randolph Glacier Inventory (RGI) version 6.0 (RGI Consortium, 2017), glaciers in Guokalariju cover an area of ∼183.96 km2. GlabTop2 provided estimated clean ice glacier thicknesses ranging between ∼1 and ∼208 m (mean = ∼23.87 m) (Frey et al., 2014). We estimated the total WVEQ of the region's glaciers to be ∼3.95 km3.
Table 4Ice volumes (km3) and corresponding WVEQs (km3) calculated using the empirical area-thickness formula (Brenning, 2005a) for sub-regions and Guokalariju-wide (All).
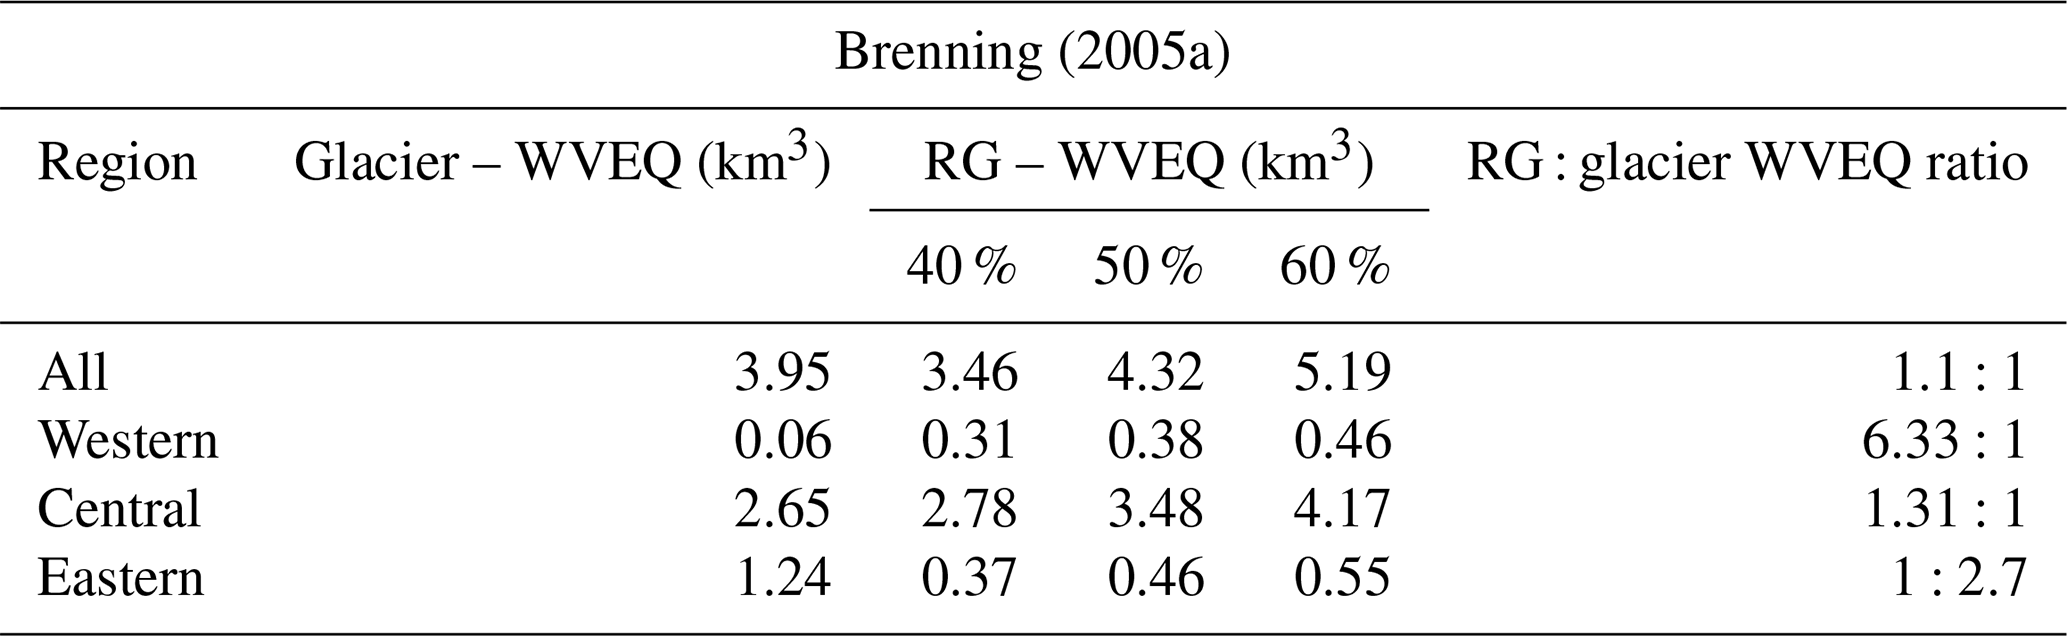
WVEQ: water volume equivalent.
The mean thickness of rock glaciers in Guokalariju estimated using the empirical area-thickness formula (Brenning, 2005a) is ∼28.36 m. The WVEQ storage lies between 3.46 and 5.19 km3, of which the central region stores ∼80 % of the water in the study area (i.e., 2.78–4.17 km3). The western region stores 0.31–0.46 km3 of water (9 % of all of Guokalariju's reserve). The eastern region stores ∼11 % of the water, or 0.37–0.55 km3 (Table 4). Compared to the WVEQ of glaciers, the result calculated using the weighted method showed that the ratio was 1.1:1, indicating that rock glaciers stored ∼1.1 times more water than glaciers.
Table 5Ice volumes (km3) and corresponding WVEQs (km3) calculated using the perfectly plastic model (Cicoira et al., 2021) for sub-regions and Guokalariju-wide (All).
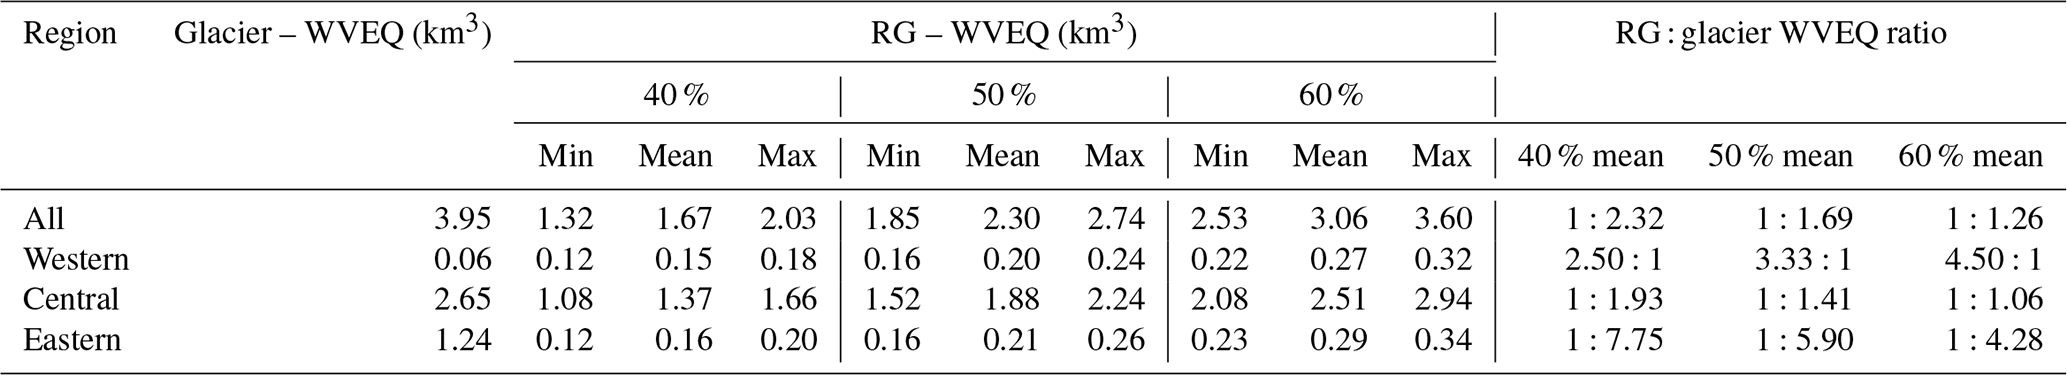
WVEQ: water volume equivalent.
The 40 %, 50 %, and 60 % represent the lower, mean, and upper limits of rock glacier ice volume, respectively. “Mean” corresponds to the WVEQ calculated based on the mean thickness of the rock glacier calculated in Eq. (2) without the ±3.4 m (Cicoira et al., 2021). `Min” and “Max” correspond to the WVEQ calculated based on the mean thickness −3.4 m and +3.4 m, respectively (Cicoira et al., 2021). The RG : glacier WVEQ ratio is the weighted average ratio calculated on the basis of the mean WVEQ of rock glaciers under different ice content assumptions (40 %, 50 %, 60 %).
The mean thickness of rock glaciers at 50 % ice content calculated using a perfectly plastic model (Cicoira et al., 2021) is 16.40±3.4 m, which is 11.96 m thinner than that estimated using the empirical area-thickness formula. The mean value of the WVEQ estimated using this method is 38 %–69 % of the mean value obtained using the Brenning method. As the estimated WVEQ of rock glaciers decreases, the ratio of rock glaciers' WVEQ to glaciers' WVEQ is also lower than that obtained using the Brenning method (Brenning, 2005a), indicating that the WVEQ of glaciers is ∼1.69 times that of rock glaciers (Table 5). However, the results obtained based on both methods reflect clear differences in the water storage of the three sub-regions (ANOVA: F value = 27.930; df within groups = 2; df between groups = 3671; p≤0.001).
5.1 Factors controlling rock glaciers
Rock glaciers are distributed heterogeneously throughout Guokalariju, with most concentrated within the central region. The study area spans a large area from east to west, with variations in topography and climatic conditions between the three sub-regions, thereby providing the basis for a spatially differentiated distribution of rock glaciers. The development of rock glaciers is a complex function of responses to air temperature, insolation, wind, and seasonal precipitation over a considerable period (Humlum, 1998), with the MAAT = −2 ∘C isotherm and the equilibrium line altitude (ELA) for local glaciers forming the lower and upper boundaries of the cryogenic belt where they have developed, respectively (Humlum, 1988; Brenning, 2005a; Rangecroft et al., 2015, 2016; Jones, 2018b). Topographically, the higher terrain in the central region has accommodated the development of more rock glaciers in the area above 4500 m a.s.l. The central region is located in the transition zone between the TP's semi-arid and sub-humid regions, with a mean ELA of ∼5478 m a.s.l. Compared with the eastern region, which has a lower ELA (mean ELA = 5265 m a.s.l.), and the western region, which has a higher MAAT, the central region exhibits a broader range of the cryogenic belt to meet the development and distribution of more rock glaciers. Additionally, the widespread glacial remains in the central region and the predominance of more easily weathered granite as bedrock in this area could also provide a richer source of material for rock glacier development (Wahrhaftig and Cox, 1959; Haeberli et al., 2006).
The mean and lower altitudinal limits of the rock glacier distribution in the whole study area decrease from west to east, from ∼5200 to ∼4900 m a.s.l. In the Gangdise Mountains, located in the same latitudinal range on the western side of the study area, rock glaciers show a similar trend of gradually decreasing altitude in line with increased moisture; indeed, the characteristics of the changes in the two regions show an overall continuity (Zhang et al., 2022). Limited by the range of the ISM, MAP gradually decreases from west to east from the Gangdise Mountains to Guokalariju. In the alpine tundra of this region, annual precipitation is dominated by snowfall in summer and autumn. Increases in snowfall in summer and autumn could help to preserve permafrost, allowing permafrost to develop at lower altitudes under similar climatic conditions (Zhou et al., 2000). Additionally, annual regional precipitation values may reflect reductions in shortwave insolation arising from cloud cover, at least to some extent (Boeckli et al., 2012). Relatively favorable hydrological conditions will be more conducive to freeze–thaw weathering, thereby increasing the generation rate of rock debris, which in turn is conducive to the development of rock glaciers (Hallet et al., 1991; Haeberli et al., 2006; Zhang et al., 2022). Increases in MAP are therefore likely to be conducive to the expansion of the range in the distribution of rock glaciers in semi-arid to sub-humid areas, meaning that the lower altitudinal limit of rock glacier distribution decreases with increases in annual precipitation.
Glacier-forefield-connected rock glaciers may have a more abundant source of materials compared to other types of rock glaciers. They occur in regions where glaciers have previously existed, and both glacial moraines and surrounding rock walls can provide debris as their materials. Therefore, they have a more diverse range of material sources, which may contribute to the development of larger-scale rock glaciers. However, debris-mantled-slope-connected rock glaciers lack significant headwall, and their debris is primarily produced by in situ bedrock weathering (RGIK, 2022a). This results in their relatively limited and homogeneous material sources, leading to slower development and smaller scale compared to other types of rock glaciers.
Rock glaciers in the study area are primarily distributed on north-facing and west-facing aspects, which is remarkably similar to the distribution pattern of rock glaciers in the Himalayas (Jones et al., 2018b), Gangdise Mountains (Zhang et al., 2022), Tianshan Mountains (Liu et al., 1995; Bolch and Marchenko, 2009), and the European Alps (Scotti et al., 2013). This is mainly because north-facing slopes receive less solar radiation as they are shaded, providing favorable conditions for the development and preservation of rock glaciers (Barsch, 1996). Additionally, the ample space and lower potential incoming solar radiation (PISR) on west-facing slopes, influenced by regional topographic conditions, also contribute to the development of rock glaciers here. This is evident in the central region where rock glaciers are more evenly distributed in the W, NW, N, and NE aspects compared to the distinct concentration of rock glaciers on the N aspect in the western and eastern regions.
5.2 Hydrological significance of rock glaciers
In comparison, we found that the thicknesses of rock glaciers calculated using the flow plasticity model (Cicoira et al., 2021) are significantly lower than the corresponding results calculated using the empirical area-thickness formula (Brenning, 2005a). By comparing the thickness of the rock glaciers calculated by both methods with the height of the rock glacier front measured in © Google Earth, the thickness of the rock glaciers calculated by the Cicoira method (Cicoira et al., 2021) seems to be closer to the real value. Therefore, we speculate that the thickness calculated based on the Brenning method (Brenning, 2005a) may be overestimated to a certain extent due to the following reasons. The applicability of different estimation methods may be different across the study area. The mean thickness of the sample rock glaciers in the study of Brenning (2005a) is about 30–50 m, which is higher than the sample of rock glaciers selected in the study of Cicoira et al. (2021) (15–30 m). We selected two rock glacier samples from Cicoira et al.'s (2021) research and used the Brenning method (Brenning, 2005a) to calculate their thickness (Müller et al., 2016). We observed that the calculated thickness (H=27 m) closely matched the actual thickness for the rock glacier with an area of 45 931 m2 and a real thickness of 30 m. However, there was a significant discrepancy with the other rock glacier sample (H=25 m), which had an area of 32 356 m2 and an actual thickness of 12 m. Therefore, the applicability of empirical formulas based on various samples may vary for estimating the thickness of rock glaciers in different areas. As the thickness of rock glaciers in our study area is relatively close to the sample selected by Cicoira et al. (2021), the application of the Brenning method (Brenning, 2005a) may lead to an overestimation of rock glacier thickness in this region.
Based on the above discussion, we choose to use the results calculated based on the Cicoira method (Cicoira et al., 2021), which may be closer to the actual water reserves in our study area for further comparison and discussion. These estimates indicate that the amount of water stored in rock glaciers in the study area is ∼2.4 % of the total previously identified rock glacier water reserves globally (95.49±12.40 Gt) (Jones et al., 2018a, b; Millar and Westfall, 2019; Jones et al., 2021a, b; Wagner et al., 2021) and ∼4.4 % of the existing water reserves in rock glaciers on the TP (50.83±10.17 Gt) (Jones et al., 2021b). The rock-glacier-to-glacier storage ratio in Guokalariju of 1:1.69 is ∼270 times bigger than the global ratio (1:456), excluding the Antarctic and subantarctic and Greenland periphery Randolph Glacier Inventory (RGI; Pfeffer et al., 2014; Jones et al., 2021a), which is ∼15 times bigger than that of the Himalayas to its south (1:25) (Jones et al., 2021b), ∼18 times bigger than that of the northern Tien Shan (1:30) (Bolch and Marchenko, 2009), and much closer to that of the Andes in South America (1:3) (Azócar and Brenning, 2010), where glacier presence is also limited/absent (Brenning, 2005b; Azócar and Brenning, 2010; Jones et al., 2019; Schaffer et al., 2019).
In Guokalariju, along with the continuous melting of glaciers in the study area, the area of active rock glaciers now exceeds the glacier area, and the estimated water storage of rock glaciers is about 59 % of the glacier water storage, which shows the indispensable hydrological significance of rock glaciers in the study area. Meanwhile, regional differences in the hydrological significance of rock glaciers under different climatic conditions also exist. In the central region, which is located in the transition zone between the semi-arid and semi-humid zones, the higher topography and suitable hydrothermal conditions lead to the highest concentration of glaciers and rock glaciers in this area, with rock glaciers accounting for 82 % of the rock glacier water storage in the entire study area and glaciers accounting for ∼67 % of the study area's glacial water storage, with a ratio of between them. However, in terms of the ratio of rock glaciers to glacial water storage alone, rock glaciers are of greater hydrological significance in the western region, which is warmer and drier, despite storing only 8.7 % of the total water volume of all rock glaciers. In the western region, the water stored in rock glaciers is approximately 3 times that of glacier water storage. This partly explains why rock glaciers have a greater hydrological significance and refuge potential than long-term reservoirs in arid regions with small and rapidly vanishing glaciers. Furthermore, the relationship between the proportion of the water cycle occupied by rock glaciers and the water requirements of regional populations should be considered in more detail. More research is needed into the hydrochemical composition of the stored water in rock glaciers and whether it can be used for irrigation and drinking.
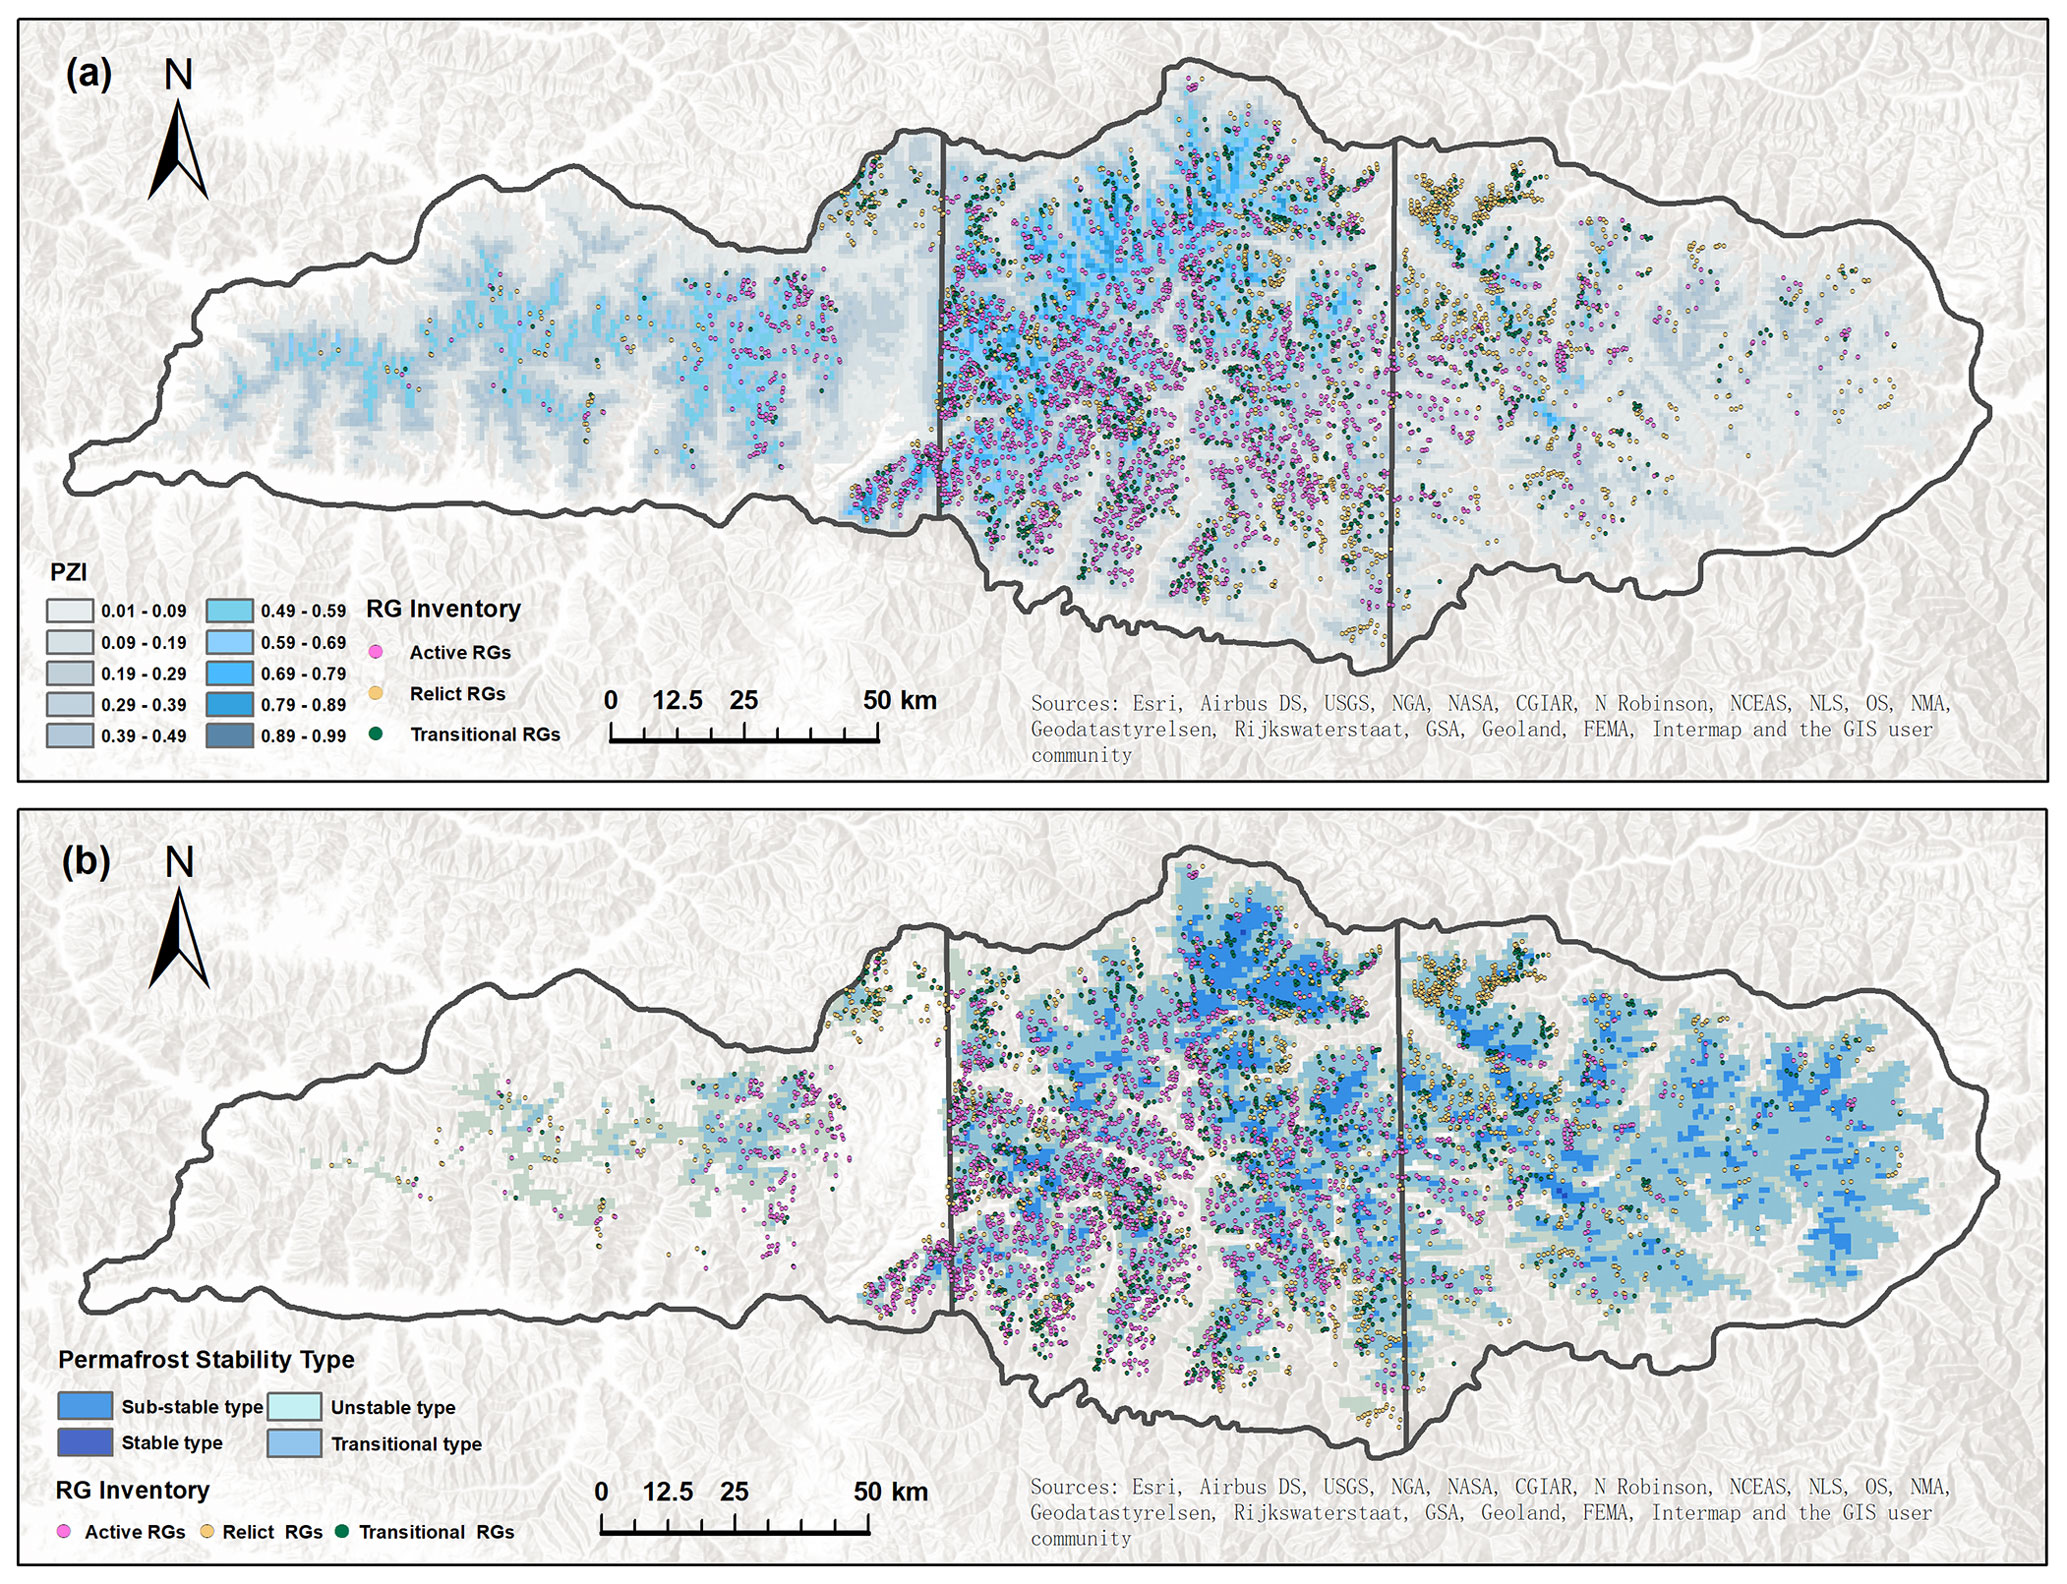
Figure 8Spatial distribution of rock glaciers vs. (a) Gruber's (2012) Permafrost Zonation Index (PZI) in Guokalariju and (b) map of the thermal stability of permafrost in Guokalariju (Ran et al., 2020).
5.3 Rock glaciers and permafrost presence
The MAGT in Guokalariju is relatively high (Ran et al., 2020; Ni et al., 2020). Approximately 90 % of the rock glaciers are distributed within the MAGT range of −2 to 0 ∘C, and they belong to the regions of sub-stable type (−3 ∘C < MAGT < −1.5 ∘C), transitional type (−1.5 ∘C < MAGT < −0.5 ∘C), and unstable type permafrost (−0.5 ∘C < MAGT < 0.5 ∘C) (Cheng et al., 2019). About 7 % of the rock glaciers occur in the seasonal frozen ground area with MAGT > 0 ∘C. Furthermore, we compared the spatial distribution of rock glaciers in the study area to the Permafrost Zonation Index (PZI), which is based on the model of permafrost extent and mainly related to the MAAT (Gruber, 2012). At the same time, we also compared it to the thermal stability of permafrost, which mainly depends on the accumulation of the MAGT measurement data and remote sensing big data (Ran et al., 2020). Overall, it aligns well with the regions of PZI ≥ 0.49 (Fig. 8a) and the map of the thermal stability of permafrost (Fig. 8b), especially in the central region and the eastern region's western part.
In the western region, the range of permafrost distribution provided by Ran et al. (2020) is significantly smaller than the region with PZI ≥ 0.49 in Gruber (2012), while the difference is larger in the eastern part of the eastern region (Fig. 8). We speculate that these differences may be attributed to variations in the data period used in these studies. When making detailed comparisons between the mean MAAT data from 1961 to 1990 used in the study of Gruber (2012) and MAAT data for the TP in 2015 provided by Du and Yi (2019a), we found that, except for a few areas in the eastern part of the eastern region, the mean MAATs of the western and central region increased by ∼2 ∘C. Although there may have been some errors in the data, the effect of temperature on the predicted permafrost distribution for the model based on the relationship between air temperature and the occurrence of permafrost may nonetheless be somewhat magnified.
Under the background of global warming, the warming rate of permafrost in the eastern part of the TP is significantly faster than that in the western part (Cheng et al., 2019). This could result in rapid changes in the movement speed and surface morphology of rock glaciers in the study area over a short period (Krainer and Mostler, 2000; Ikeda et al., 2008; Janke and Bolch, 2022). However, research has shown that despite the relatively rapid increase in ground temperatures in the deep layers of permafrost, the degradation of permafrost on the Tibetan Plateau occurs at a slow pace with full consideration of deep ground temperatures, subterranean ice, and geothermal gradients in permafrost (Cheng et al., 2019). It may take centuries, if not millennia, for the frozen material and corresponding subsurface ice in rock glaciers and permafrost to completely thaw and melt (Krainer et al., 2015).
We constructed an inventory of rock glaciers in Guokalariju and illustrated their regional distribution characteristics and environmental indications. We employed two methods to estimate and compare the water storage capacity of the region's rock glaciers. The results show that there are 5057 rock glaciers in the study area, covering an area of about 404.69 km2 in total. Among them, the area of active rock glaciers is about 187.88 km2, which exceeds the area of glaciers in the study area. Over 80 % of these rock glaciers are located within the central region. The high altitude (∼ 4900 m a.s.l.), low temperatures (MAAT ≤ −2 ∘C), and suitable precipitation (MAP ∼400 mm) in the semi-arid and semi-humid transition zone provide the widest cryogenic belt range for rock glacier distribution in the region. The lower altitudinal limit of the distribution of rock glaciers decreases gradually with increasing longitude from the western side of the study area, from the Gangdise Mountains to the interior of Guokalariju, indicating the positive effect of increased precipitation on the preservation of permafrost. We used two methods to estimate the thickness of rock glaciers and found that the results calculated based on the perfect plasticity model were more consistent with the actual situation in the study area. Based on the result, we calculated that about 1.32–3.60 km3 of water is stored in the subsurface ice of rock glacier permafrost, or ∼59 % of the water presently stored in the surface ice of glaciers. Despite differences from the two methods, both of their results reveal the previously neglected and important hydrological value of rock glaciers in the study area, particularly in the western region, which is the drier sub-region. The WVEQ in rock glaciers and the ratio of subsurface ice in rock glacier permafrost to surface ice in glaciers may continue to increase with global warming and as glaciers retreat in the future. And the stability of permafrost in the area of rock glacier distribution is likely to further decline.
The data associated with this article can be found in the Supplement. These data include the Google maps of the most important areas described in this article, as well as a tabulation of the parameters of the rock glaciers found in Guokalariju.
The supplement related to this article is available online at: https://doi.org/10.5194/tc-18-1-2024-supplement.
ML and GL designed the research. ML performed the analysis and wrote the paper. YY and ZP provided overall supervision and contributed to the writing.
The contact author has declared that none of the authors has any competing interests.
Publisher's note: Copernicus Publications remains neutral with regard to jurisdictional claims made in the text, published maps, institutional affiliations, or any other geographical representation in this paper. While Copernicus Publications makes every effort to include appropriate place names, the final responsibility lies with the authors.
The datasets are provided by the National Tibetan Plateau / Third Pole Environment Data Center (http://data.tpdc.ac.cn). We are grateful to Tobias Bolch, Wilfried Haeberli, and three anonymous reviewers for their thoughtful reviews that helped to significantly improve this paper.
This work was supported by the Second Tibetan Plateau Scientific Expedition and Research Program (STEP) (grant no. 2019QZKK0205).
This paper was edited by Tobias Bolch and reviewed by Wilfried Haeberli, Chantal Del Siro, and two anonymous referees.
Alcalá-Reygosa, J.: Rock glaciers of the mountains of Mexico; a review of current knowledge and paleoclimatic implications, J. S. Am. Earth Sci., 96, 102321, https://doi.org/10.1016/j.jsames.2019.102321, 2019.
Arenson, L. U. and Jakob, M.: The Significance of Rock Glaciers in the Dry Andes – A Discussion of Azocar and Brenning (2010) and Brenning and Azocar (2010), Permafrost Periglac. Process., 21, 282–285, https://doi.org/10.1002/ppp.693, 2010.
Azócar, G. F. and Brenning, A.: Hydrological and Geomorphological Significance of Rock Glaciers in the Dry Andes, Chile (27 degrees–33 degrees S), Permafrost Periglac. Process., 21, 42–53, https://doi.org/10.1002/ppp.669, 2010.
Baral, P., Haq, M. A., and Yaragal, S.: Assessment of rock glaciers and permafrost distribution in Uttarakhand, India, Permafrost Periglac. Process., 31, 31–56, https://doi.org/10.1002/ppp.2008, 2019.
Barsch, D.: Eine Abschätzung von Schuttproduktion und Schutttransport im Bereich aktiver Blockgletscher der Schweizer Alpen, GéoProdig, portail d'information géographique, 28, 148–160, 1977.
Barsch, D.: Permafrost creep and rock glaciers, Permafrost Periglac. Process., 3, 175–188, https://doi.org/10.1002/ppp.3430030303, 1992.
Barsch, D.: Rockglaciers: Indicators for the Present and Former Geoecology in High Mountain Environments, Springer-Verlag, Berlin, pp. 331, https://doi.org/10.2307/3060377, 1996.
Berthling, I.: Beyond confusion: Rock glaciers as cryo-conditioned landforms, Geomorphology, 131, 98–106, https://doi.org/10.1016/j.geomorph.2011.05.002, 2011.
Blöthe, J. H., Rosenwinkel, S., Höser, T., and Korup, O.: Rock-glacier dams in High Asia, Earth Surf. Process. Landf., 44, 808–824, https://doi.org/10.1002/esp.4532, 2019.
Boeckli, L., Brenning, A., Gruber, S., and Noetzli, J.: A statistical approach to modelling permafrost distribution in the European Alps or similar mountain ranges, The Cryosphere, 6, 125–140, https://doi.org/10.5194/tc-6-125-2012, 2012.
Bolch, T. and Marchenko, S. S.: Significance of glaciers, rockglaciers and ice-rich permafrost in the Northern Tien Shan as water towers under climate change conditions, in: Selected papers from the Workshop “Assessment of Snow, Glacier and Water Resources in Asia”, Almaty, Kazakhstan, 28–30 November 2006, edited by: Braun, L., Hagg, W., Severskiy, I. V., and Young, G. J., IHP/HWRP-Berichte vol. 8, 132–144, 2009.
Bolch, T., Rohrbach, N., Kutuzov, S., Robson, B. A., and Osmonov, A.: Occurrence, evolution and ice content of ice-debris complexes in the Ak-Shiirak, Central Tien Shan revealed by geophysical and remotely-sensed investigations, Earth Surf. Process. Landf., 44, 129–143, https://doi.org/10.1002/esp.4487, 2019.
Bonnaventure, P. P. and Lamoureux, S. F.: The active layer: A conceptual review of monitoring, modelling techniques and changes in a warming climate, Prog. Phys. Geogr.-Earth Environ., 37, 352–376, https://doi.org/10.1177/0309133313478314, 2013.
Brenning, A.: Climatic and geomorphological controls of rock glaciers in the Andes of Central Chile: Combining Statistical Modelling and Field Mapping. Humboldt-Universität zu Berlin, Berlin, Germany, 2005a.
Brenning, A.: Geomorphological, hydrological and climatic significance of rock glaciers in the Andes of Central Chile (33–35 degrees S), Permafrost Periglac. Process., 16, 231–240, https://doi.org/10.1002/ppp.528, 2005b.
Buckel, J., Reinosch, E., Hördt, A., Zhang, F., Riedel, B., Gerke, M., Schwalb, A., and Mäusbacher, R.: Insights into a remote cryosphere: a multi-method approach to assess permafrost occurrence at the Qugaqie basin, western Nyainqêntanglha Range, Tibetan Plateau, The Cryosphere, 15, 149–168, https://doi.org/10.5194/tc-15-149-2021, 2021.
Cao, B., Li, X., Feng, M., and Zheng, D.: Quantifying Overestimated Permafrost Extent Driven by Rock Glacier Inventory, Geophys. Res. Lett., 48, e2021GL092476, https://doi.org/10.1029/2021gl092476, 2021.
Chen, W., Yao, T., Zhang, G., Li, F., Zheng, G., Zhou, Y., and Xu, F.: Towards ice-thickness inversion: an evaluation of global digital elevation models (DEMs) in the glacierized Tibetan Plateau, The Cryosphere, 16, 197–218, https://doi.org/10.5194/tc-16-197-2022, 2022.
Cheng, G., Zhao, L., Li, R., Wu, X., Sheng, Y., Hu, G., Zou, D., Jin, H., Li, X., and Wu, B.: Characteristic, changes and impacts of permafrost on Qinghai-Tibet Plateau (in Chinese), Chinese Sci. B., 64, 2783–2795, https://doi.org/10.1360/TB-2019-0191, 2019.
Cicoira, A., Marcer, M., Gärtner-Roer, I., Bodin, X., Arenson, L. U., and Vieli, A.: A general theory of rock glacier creep based on in-situ and remote sensing observations, Permafrost Periglac. Process., 32, 139–153, https://doi.org/10.1002/ppp.2090, 2021.
Colucci, R. R., Boccali, C., Zebre, M., and Guglielmin, M.: Rock glaciers, protalus ramparts and pronival ramparts in the south-eastern Alps, Geomorphology, 269, 112–121, https://doi.org/10.1016/j.geomorph.2016.06.039, 2016.
Cui, P., Guo, X., Jiang, T., Zhang, G., and Jin, W.: Disaster Effect Induced by Asian Water Tower Change and Mitigation Strategies, B. Chinese Acad. Sci., 34, 1313–1321, https://doi.org/10.16418/j.issn.1000-3045.2019.11.014, 2019.
Du, Y. Y. and Yi, J. W.: Data of climatic factors of annual mean temperature in the Xizang (1990–2015), National Tibetan Plateau Data Center [data set], https://data.tpdc.ac.cn/zh-hans/data/a46b446e-12ac-4ba3-b0b9-1ec6195d2aa8 (last access: 1 November 2023), 2019a.
Du, Y. Y. and Yi, J. W.: Data set of annual rainfall and climate factors in Tibet (1990–2015), National Tibetan Plateau Data Center [data set], https://data.tpdc.ac.cn/zh-hans/data/b030352c-f1fa-47cf-8faf-a4daf8be7963 (last access: 1 November 2023), 2019b.
Emmert, A. and Kneisel, C.: Internal structure of two alpine rock glaciers investigated by quasi-3-D electrical resistivity imaging, The Cryosphere, 11, 841–855, https://doi.org/10.5194/tc-11-841-2017, 2017.
Farinotti, D., Huss, M., Fürst, J. J., Landmann, J., Machguth, H., Maussion, F., and Pandit, A.: A consensus estimate for the ice thickness distribution of all glaciers on Earth, Nat. Geosci., 12, 168–173, https://doi.org/10.1038/s41561-019-0300-3, 2019.
French, H. M.: The Periglacial Environments, 3rd edn., John Wiley & Sons Ltd, Chichester, UK, xviii + 458 pp., 2007.
Frey, H., Machguth, H., Huss, M., Huggel, C., Bajracharya, S., Bolch, T., Kulkarni, A., Linsbauer, A., Salzmann, N., and Stoffel, M.: Estimating the volume of glaciers in the Himalayan–Karakoram region using different methods, The Cryosphere, 8, 2313–2333, https://doi.org/10.5194/tc-8-2313-2014, 2014.
Giardino, J. R. and Vitek, J. D.: The significance of rock glaciers in the glacial-periglacial landscape continuum, J. Quaternary Sci., 3, 97–103, https://doi.org/10.1002/jqs.3390030111, 1988.
Gruber, S.: Derivation and analysis of a high-resolution estimate of global permafrost zonation, The Cryosphere, 6, 221–233, https://doi.org/10.5194/tc-6-221-2012, 2012.
Guo, Z: Inventorying and spatial distribution of rock glaciers in the Yarlung Zangbo River Basin, PhD thesis, Institute of International Rivers and Eco-Security, Yunnan University, China, 77 pp., 2019.
Haeberli, W., Hallet, B., Arenson, L., Elconin, R., Humlum, O., Kääb, A., Kaufmann, V., Ladanyi, B., Matsuoka, N., Springman, S., and Mühll, D. V.: Permafrost creep and rock glacier dynamics, Permafrost Periglac. Process., 17, 189–214, https://doi.org/10.1002/ppp.561, 2006.
Halla, C., Blöthe, J. H., Tapia Baldis, C., Trombotto Liaudat, D., Hilbich, C., Hauck, C., and Schrott, L.: Ice content and interannual water storage changes of an active rock glacier in the dry Andes of Argentina, The Cryosphere, 15, 1187–1213, https://doi.org/10.5194/tc-15-1187-2021, 2021.
Hallet, B., Walder, J. S., and Stubbs, C. W.: Weathering by segregation ice growth in microcracks at sustained subzero temperatures: Verification from an experimental study using acoustic emissions, Permafrost Periglac. Process., 2, 283–300, 1991.
Hassan, J., Chen, X., Muhammad, S., and Bazai, N. A.: Rock glacier inventory, permafrost probability distribution modeling and associated hazards in the Hunza River Basin, Western Karakoram, Pakistan, Sci. Total Environ., 782, 146833, https://doi.org/10.1016/j.scitotenv.2021.146833, 2021.
Hausmann, H., Krainer, K., Brueckl, E., and Ullrich, C.: Internal structure, ice content and dynamics of Ölgrube and Kaiserberg rock glaciers (Ötztal Alps, Austria) determined from geophysical surveys, Aust. J. Earth Sci., 105, 12–31, 2012.
Humlum, O.: Rock Glacier Appearance Level and Rock Glacier Initiation Line Altitude: A Methodological Approach to the Study of Rock Glaciers, Arct. Alp. Res., 20, 160–178, https://doi.org/10.2307/1551495, 1988.
Humlum, O.: The climatic significance of rock glaciers, Permafrost Periglac. Process., 9, 375–395, https://doi.org/10.1002/(sici)1099-1530(199810/12)9:4<375::Aid-ppp301>3.0.Co;2-0, 1998.
IBM Corp.: IBM SPSS Statistics for Windows, Version 27.0, Armonk, New York, 2020.
Ikeda, A., Matsuoka, N., and Kääb, A.: Fast deformation of perennially frozen debris in a warm rock glacier in the Swiss Alps: An effect of liquid water, J. Geophys. Res.-Earth Surf., 113, F01020, https://doi.org/10.1029/2007JF000859, 2008.
Janke, J. R. and Bolch, T.: 4.06 – Rock Glaciers, in: Treatise on Geomorphology (Second Edition), edited by: Shroder, J. F., Academic Press, Oxford, 75–118, https://doi.org/10.1016/B978-0-12-818234-5.00187-5, 2022.
Janke, J., Bellisario, A., and Ferrando, F.: Classification of debris-covered glaciers and rock glaciers in the Andes of central Chile, Geomorphology, 241, 98–121, https://doi.org/10.1016/j.geomorph.2015.03.034, 2015.
Ji, J.Q., Zhong, D. L., Ding, L., Zhang, J. J., and Yang, Y. C.: Genesis and scientific significance of the Yarlung Zangbo Canvon, Earth Sci. Front., 6, 231–235, https://doi.org/10.3321/j.issn:1005-2321.1999.04.005, 1999.
Jones, D. B., Harrison, S., Anderson, K., and Betts, R. A.: Mountain rock glaciers contain globally significant water stores, Sci. Rep.-UK, 8, 2834, https://doi.org/10.1038/s41598-018-21244-w, 2018a.
Jones, D. B., Harrison, S., Anderson, K., Selley, H. L., Wood, J. L., and Betts, R. A.: The distribution and hydrological significance of rock glaciers in the Nepalese Himalaya, Global Planet. Change, 160, 123–142, https://doi.org/10.1016/j.gloplacha.2017.11.005, 2018b.
Jones, D. B., Harrison, S., Anderson, K., and Whalley, W. B.: Rock glaciers and mountain hydrology: A review, Earth-Sci. Rev., 193, 66–90, https://doi.org/10.1016/j.earscirev.2019.04.001, 2019.
Jones, D. B., Harrison, S., Anderson, K., and Betts, R. A.: Author Correction: Mountain rock glaciers contain globally significant water stores, Sci. Rep.-UK, 11, 23536, https://doi.org/10.1038/s41598-021-02401-0, 2021a.
Jones, D. B., Harrison, S., Anderson, K., Shannon, S., and Betts, R. A.: Rock glaciers represent hidden water stores in the Himalaya, Sci. Total Environ., 793, 145368, https://doi.org/10.1016/j.scitotenv.2021.145368, 2021b.
Kääb, A., Haeberli, W., and Gudmundsson, G. H.: Analysing the creep of mountain permafrost using high precision aerial photogrammetry: 25 years of monitoring Gruben Rock Glacier, Swiss Alps, Permafrost Periglac. Process., 8, 409–426, https://doi.org/10.1002/(sici)1099-1530(199710/12)8:4<409::Aid-ppp267>3.0.Co;2-c, 1997.
Korup, O. and Montgomery, D. R.: Tibetan plateau river incision inhibited by glacial stabilization of the Tsangpo Gorge, Nature, 455, 786–784, https://doi.org/10.1038/nature07322, 2008.
Krainer, K. and Mostler, W.: Reichenkar rock glacier: a glacier derived debris-ice system in the western Stubai Alps, Austria, Permafrost Periglac. Process., 11, 267–275, 2000.
Krainer, K. and Ribis, M.: A rock glacier inventory of the Tyrolean alps (Austria), Aust. J. Earth Sci., 105, 32–47, 2012.
Krainer, K., Bressan, D., Dietre, B., Haas, J. N., Hajdas, I., Lang, K., Mair, V., Nickus, U., Reidl, D., Thies, H., and Tonidandel, D.: A 10,300-year-old permafrost core from the active rock glacier Lazaun, southern Ötztal Alps (South Tyrol, northern Italy), Quaternary Res., 83, 324–335, https://doi.org/10.1016/j.yqres.2014.12.005, 2015.
Liu, G. N., Xiong, H. G., Cui, Z. J., and Song, C. Q.: The morphological features and environmental condition of rock glaciers in Tianshan mountains, Scientia Geographica Sinica, 15, 226–233, 1995.
Long, D., Li, X. Y., Li, X. D., Han, P. F., Zhao, F. Y., Hong, Z. K., Wang, Y. M., and Tian, F. Q.: Remote sensing retrieval of water storage changes and underlying climatic mechanisms over the Tibetan Plateau during the past two decades, Adv. Water Sci., 33, 375–389, https://doi.org/10.14042/j.cnki.32.1309.2022.03.003, 2022.
Magori, B., Urdea, P., Onaca, A., and Ardelean, F.: Distribution and characteristics of rock glaciers in the Balkan Peninsula, Geografiska Annaler: Series A, Physical Geography, 102, 354–375, https://doi.org/10.1080/04353676.2020.1809905, 2020.
Mathys, T., Hilbich, C., Arenson, L. U., Wainstein, P. A., and Hauck, C.: Towards accurate quantification of ice content in permafrost of the Central Andes – Part 2: An upscaling strategy of geophysical measurements to the catchment scale at two study sites, The Cryosphere, 16, 2595–2615, https://doi.org/10.5194/tc-16-2595-2022, 2022.
Maussion, F., Butenko, A., Champollion, N., Dusch, M., Eis, J., Fourteau, K., Gregor, P., Jarosch, A. H., Landmann, J., Oesterle, F., Recinos, B., Rothenpieler, T., Vlug, A., Wild, C. T., and Marzeion, B.: The Open Global Glacier Model (OGGM) v1.1, Geosci. Model Dev., 12, 909–931, https://doi.org/10.5194/gmd-12-909-2019, 2019.
Millar, C. I. and Westfall, R. D.: Rock glaciers and related periglacial landforms in the Sierra Nevada, CA, USA; inventory, distribution and climatic relationships, Quaternary Int., 188, 90–104, https://doi.org/10.1016/j.quaint.2007.06.004, 2008.
Millar, C. I. and Westfall, R. D.: Geographic, hydrological, and climatic significance of rock glaciers in the Great Basin, USA, Arct. Antarct. Alp. Res., 51, 232–249, https://doi.org/10.1080/15230430.2019.1618666, 2019.
Millar, C. I., Westfall, R. D., and Delany, D. L.: Thermal and hydrologic attributes of rock glaciers and periglacial talus landforms: Sierra Nevada, California, USA, Quaternary Int., 310, 169–180, https://doi.org/10.1016/j.quaint.2012.07.019, 2013.
Müller, J., Vieli, A., and Gärtner-Roer, I.: Rock glaciers on the run – understanding rock glacier landform evolution and recent changes from numerical flow modeling, The Cryosphere, 10, 2865–2886, https://doi.org/10.5194/tc-10-2865-2016, 2016.
Ni, J., Wu, T., Zhu, X., Hu, G., Zou, D., Wu, X., Li, R., Xie, C., Qiao, Y., Pang, Q., Hao, J., and Yang, C.: Simulation of the Present and Future Projection of Permafrost on the Qinghai-Tibet Plateau with Statistical and Machine Learning Models, J. Geophys. Res.-Atmos., 126, e2020JD033402, https://doi.org/10.1029/2020JD033402, 2021.
Pan, G. T., Wang, L. Q., Zhang, W. P., and Wang, B. D.: Tectonic Map and Specification of Qinghai Tibet Plateau and Its Adjacent Areas (1:1 500 000), Geology Press, Beijing, 208 pp., 2013.
Pandey, P.: Inventory of rock glaciers in Himachal Himalaya, India using high-resolution Google Earth imagery, Geomorphology, 340, 103–115, https://doi.org/10.1016/j.geomorph.2019.05.001, 2019.
Paterson, W. S. B.: The Physics of Glaciers, Butterworth-Heinemann, Oxford, 480 pp., 1994.
Pfeffer, W. T., Arendt, A. A., Bliss, A., Bolch, T., Cogley, J. G., Gardner, A. S., Hagen, J. O., Hock, R., Kaser, G., Kienholz, C., Miles, E. S., Moholdt, G., Mölg, N., Paul, F., Radic, V., Rastner, P., Raup, B. H., Rich, J., and Sharp, M. J.: The Randolph Glacier inventory: a globally complete inventory of glaciers, J. Glaciol., 60, 537–552, https://doi.org/10.3189/2014JoG13J176, 2014.
Ran, Y., Li, X., Cheng, G., Nan, Z., Che, J., Sheng, Y., Wu, Q., Jin, H., Luo, D., Tang, Z., and Wu, X.: Mapping the permafrost stability on the Tibetan Plateau for 2005–2015, Sci. China Earth Sci., 64, 62–79, https://doi.org/10.1007/s11430-020-9685-3, 2020.
Ran, Z. and Liu, G.: Rock glaciers in Daxue Shan, south-eastern Tibetan Plateau: an inventory, their distribution, and their environmental controls, The Cryosphere, 12, 2327–2340, https://doi.org/10.5194/tc-12-2327-2018, 2018.
Rangecroft, S., Harrison, S., and Anderson, K.: Rock glaciers as water stores in the Bolivian Andes: an assessment of their hydrological importance, Arc. Antarct. Alp. Res., 47, 89–98, https://doi.org/10.1657/aaar0014-029, 2015.
Rangecroft, S., Suggitt, A. J., Anderson, K., and Harrison, S.: Future climate warming and changes to mountain permafrost in the Bolivian Andes, Clim. Change, 137, 231–243, https://doi.org/10.1007/s10584-016-1655-8, 2016.
Reinosch, E., Gerke, M., Riedel, B., Schwalb, A., Ye, Q., and Buckel, J.: Rock glacier inventory of the western Nyainqêntanglha Range, Tibetan Plateau, supported by InSAR time series and automated classification, Permafrost Periglac. Process., 32, 657–672, https://doi.org/10.1002/ppp.2117, 2021.
RGI Consortium: Randolph Glacier Inventory – A Dataset of Global Glacier Outlines, Version 6. [Indicate subset used]. Boulder, Colorado USA, NSIDC: National Snow and Ice Data Center, https://doi.org/10.7265/4m1f-gd79, 2017.
RGIK: Towards standard guidelines for inventorying rock glaciers: baseline concepts (version 4.2.2), IPA Action Group Rock glacier inventories and kinematics, 13 pp., 2022a.
RGIK: Towards standard guidelines for inventorying rock glaciers: practical concepts (version 2.0), IPA Action Group Rock glacier inventories and kinematics, 10 pp., 2022b.
Schaffer, N., MacDonell, S., Réveillet, M., Yáñez, E., and Valois, R.: Rock glaciers as a water resource in a changing climate in the semiarid Chilean Andes, Reg. Environ. Change, 19, 1263–1279, https://doi.org/10.1007/s10113-018-01459-3, 2019.
Schmid, M.-O., Baral, P., Gruber, S., Shahi, S., Shrestha, T., Stumm, D., and Wester, P.: Assessment of permafrost distribution maps in the Hindu Kush Himalayan region using rock glaciers mapped in Google Earth, The Cryosphere, 9, 2089–2099, https://doi.org/10.5194/tc-9-2089-2015, 2015.
Schoeneich, P., Bodin, X., Echelard, T., Kaufmann, V., KellererPirklbauer, A., Krysiecki, J.-M., and Lieb, G. K.: Velocity changes of rock glaciers and induced hazards, in: Engineering Geology for Society and Territory, Springer, 1, 223–227, 2015.
Schrott, L.: Some geomorphological-hydrological aspects of rock glaciers in the Andes (San Juan, Argentina), Zeitschrift fur Geomorphologie, Supplementband, 104, 161–173, 1996.
Scotti, R., Brardinoni, F., Alberti, S., Frattini, P., and Crosta, G. B.: A regional inventory of rock glaciers and protalus ramparts in the central Italian Alps, Geomorphology, 186, 136–149, https://doi.org/10.1016/j.geomorph.2012.12.028, 2013.
Selley, H., Harrison, S., Glasser, N., Wündrich, O., Colson, D., and Hubbard, A.: Rock glaciers in central Patagonia, Geografiska Annaler: Series A, Physical Geography, 101, 1–15, https://doi.org/10.1080/04353676.2018.1525683, 2018.
Wagner, T., Kainz, S., Helfricht, K., Fischer, A., Avian, M., Krainer, K., and Winkler, G.: Assessment of liquid and solid water storage in rock glaciers versus glacier ice in the Austrian Alps, Sci. Total Environ., 800, 149593, https://doi.org/10.1016/j.scitotenv.2021.149593, 2021.
Wahrhaftig, C. and Cox, A.: Rock glaciers in the Alaska Range, GSA Bulletin, 70, 383–436, https://doi.org/10.1130/0016-7606(1959)70[383:Rgitar]2.0.Co;2, 1959.
Wu, Z., Zhang, Y., Hu, D., Zhao, X., and Ye, P.: Quaternary Normal Faulting and Its Dynamics of the Oiga Graben in South-Eastern Tibet, Acta Geol. Sinica, 81, 144–160, https://doi.org/10.3321/j.issn:0001-5717.2007.10.003, 2007.
Xiang, S. Y.: 1:3 million Quaternary geological and geomorphological map of the Tibetan Plateau and its surrounding areas, China University of Geosciences Press, Wuhan, 104 pp., 2013.
Yao, T., Wu, G., Xu, B., Wang, W., Gao, J., and An, B.: Asian Water Tower Change and Its Impacts, B. Chinese Acad. Sci., 34, 1203–1209, https://doi.org/10.16418/j.issn.1000-3045.2019.11.003, 2019.
Yao, T., Bolch, T., Chen, D., Gao, J., Immerzeel, W., Piao, S., Su, F., Thompson, L., Wada, Y., Wang, L., Wang, T., Wu, G., Xu, B., Yang, W., Zhang, G., and Zhao, P.: The imbalance of the Asian water tower, Nat. Rev. Earth Environ., 3, 618–632, https://doi.org/10.1038/s43017-022-00299-4, 2022.
Yu, X., Ji, J., Gong, J., Sun, D., Qing, J., Wang, L., Zhong, D., and Zhang, Z.: Evidence of rapid erosion driven by climate in the Yarlung Zangbo (Tsangpo) Great Canyon, the eastern Himalayan syntaxis, Chinese Sci. B., 56, 1123–1130, https://doi.org/10.1007/s11434-011-4419-x, 2011.
Zhang, Q., Jia, N., Xu, H., Yi, C., Wang, N., and Zhang, L.: Rock glaciers in the Gangdise Mountains, southern Tibetan Plateau: Morphology and controlling factors, CATENA, 218, 106561, https://doi.org/10.1016/j.catena.2022.106561, 2022.
Zheng, J., Yin, Y., and Li, B.: A New Scheme for Climate Regionalization in China, Acta Geographica Sinica, 65, 3–12, https://doi.org/10.11821/xb201001002, 2010.
Zhou, Y., Guo, D., Qiu, G., Cheng, G., and Li, S.: Geocryology In China, Science Press, Beijing, 450 pp., 2000.