the Creative Commons Attribution 4.0 License.
the Creative Commons Attribution 4.0 License.
 | 20 Feb 2023
Using ice core measurements from Taylor Glacier, Antarctica, to calibrate in situ cosmogenic 14C production rates by muons
Michael N. Dyonisius
Vasilii V. Petrenko
Andrew M. Smith
Benjamin Hmiel
Peter D. Neff
Bin Yang
Quan Hua
Jochen Schmitt
Sarah A. Shackleton
Christo Buizert
Philip F. Place
James A. Menking
Ross Beaudette
Christina Harth
Michael Kalk
Heidi A. Roop
Bernhard Bereiter
Casey Armanetti
Isaac Vimont
Sylvia Englund Michel
Edward J. Brook
Jeffrey P. Severinghaus
Ray F. Weiss
Joseph R. McConnell
Cosmic rays entering the Earth's atmosphere produce showers of secondary particles such as protons, neutrons, and muons. The interaction of these particles with oxygen-16 (16O) in minerals such as ice and quartz can produce carbon-14 (14C). In glacial ice, 14C is also incorporated through trapping of 14C-containing atmospheric gases (14CO2, 14CO, and 14CH4). Understanding the production rates of in situ cosmogenic 14C is important to deconvolve the in situ cosmogenic and atmospheric 14C signals in ice, both of which contain valuable paleoenvironmental information. Unfortunately, the in situ 14C production rates by muons (which are the dominant production mechanism at depths of >6 m solid ice equivalent) are uncertain. In this study, we use measurements of in situ 14C in ancient ice (>50 ka) from the Taylor Glacier, an ablation site in Antarctica, in combination with a 2D ice flow model to better constrain the compound-specific rates of 14C production by muons and the partitioning of in situ 14C between CO2, CO, and CH4. Our measurements show that 33.7 % (±11.4 %; 95 % confidence interval) of the produced cosmogenic 14C forms 14CO and 66.1 % (±11.5 %; 95 % confidence interval) of the produced cosmogenic 14C forms 14CO2. 14CH4 represents a very small fraction (<0.3 %) of the total. Assuming that the majority of in situ muogenic 14C in ice forms 14CO2, 14CO, and 14CH4, we also calculated muogenic 14C production rates that are lower by factors of 5.7 (3.6–13.9; 95 % confidence interval) and 3.7 (2.0–11.9; 95 % confidence interval) for negative muon capture and fast muon interactions, respectively, when compared to values determined in quartz from laboratory studies (Heisinger et al., 2002a, b) and in a natural setting (Lupker et al., 2015). This apparent discrepancy in muogenic 14C production rates in ice and quartz currently lacks a good explanation and requires further investigation.
- Article
(3326 KB) - Full-text XML
-
Supplement
(1500 KB) - BibTeX
- EndNote


1.1 Potential applications of 14C measurements in ice and in situ cosmogenic 14C production from 16O in Earth's surface minerals
As snow accumulates on ice sheets, it gradually densifies into firn and ice (Herron and Langway, 1980). During the firn-to-ice transition, the air in the interstitial space between the ice grains becomes trapped into bubbles within the ice matrix (Buizert, 2013). Included in the paleoatmospheric air trapped in the bubbles are 14C-containing atmospheric gases (14CO2, 14CO, and 14CH4; Fireman and Norris, 1982). 14C in ice is also produced through interactions of secondary cosmic rays with 16O directly in the lattice of the ice grains (i.e., in situ; Lal et al., 1990). Following the cosmogenic nuclear reactions, the hot 14C atom interacts with atoms in the surrounding ice lattice to produce 14CO2, 14CO, and 14CH4 (Lal et al., 1990; Petrenko et al., 2013).
Both the trapped atmospheric and in situ cosmogenic 14C signals in ice have unique applications. For example, the paleoatmospheric component of 14CH4 in ice cores has been used to constrain past CH4 emissions from old carbon reservoirs such as methane hydrates, permafrost, and geologic seeps (Dyonisius et al., 2020; Hmiel et al., 2020; Petrenko et al., 2009, 2017). Paleoatmospheric 14CO2 can be potentially used for the absolute dating of ice core gases (Andree et al., 1984; Van De Wal et al., 1994) and to improve the radiocarbon calibration curve (Reimer et al., 2020; Hogg et al., 2020) in periods where tree ring data are not available. Measurements of 14CO in the modern atmosphere have been used to constrain the oxidative capacity of the atmosphere (Brenninkmeijer et al., 1992; Petrenko et al., 2021), and thus, paleoatmospheric 14CO in ice cores can be used for a similar application. The in situ cosmogenic component of 14CO at ice core sites can be potentially be used to reconstruct the past cosmic ray flux (BenZvi et al., 2019). Finally, measurements of the in situ cosmogenic component of 14CO2 and 14CO can be used to constrain the accumulation/ablation rate of the ice core site (e.g., Lal et al., 1990; Lal and Jull, 1990). Unfortunately, the paleoatmospheric and in situ cosmogenic components of 14C in ice exist in a combined form and cannot be separated analytically (Petrenko et al., 2016). To separate these signals, it is important to have accurate estimates of the cosmogenic 14C production rates and the partitioning among the in situ produced 14C species (14CO2, 14CO, and 14CH4) in ice.
In situ cosmogenic 14C production in ice is analogous to the production in quartz because both minerals share the same target atom (16O). Measurements of in situ cosmogenic nuclides (3He, 10Be, 14C, 21Ne, 26Al, and 36Cl) in near-surface rocks are commonly used as tools to constrain various Earth surface processes such as the timing of glacial retreat and erosion rates (Gosse and Phillips, 2001; Balco, 2020). Due to its short half-life of 5700 ±30 years (Kutschera, 2019), 14C in quartz is uniquely suited to characterize surface processes on millennial timescales (e.g., Spector et al., 2019; Pendleton et al., 2019). In situ cosmogenic 14C measurements are also often paired with measurements of longer-lived nuclides such as 10Be and 26Al (e.g., Hippe, 2017; Skov et al., 2019) to study complex surface processes such as subglacial erosion and millennial-scale glacier retreats and/or re-advances.
In situ cosmogenic 14C in Earth's surface minerals is produced from 16O by three nuclear reactions, namely (1) nucleon (neutron and proton)-induced spallation (Lal and Peters, 1967), (2) negative muon capture (Heisinger et al., 2002b), and (3) interactions with fast muons (Heisinger et al., 2002a). The depth dependence of the 14C production rate for each mechanism in ice is shown in Fig. 1. Nucleon-induced spallation dominates the 14C production at the surface but is quickly attenuated with depth. On the other hand, the relative contributions from the two muon mechanisms are lower near the surface but dominate at larger depths, as muons can penetrate deeper than nucleons (Fig. 1). Characterizing the in situ cosmogenic 14C production rates from muons is especially important for applications of cosmogenic surface exposure dating where the samples might be exposed to the subsurface cosmic ray flux for an extended period. One example of this would be a bedrock that is covered by a relatively thin (e.g., tens of meters) glacier.
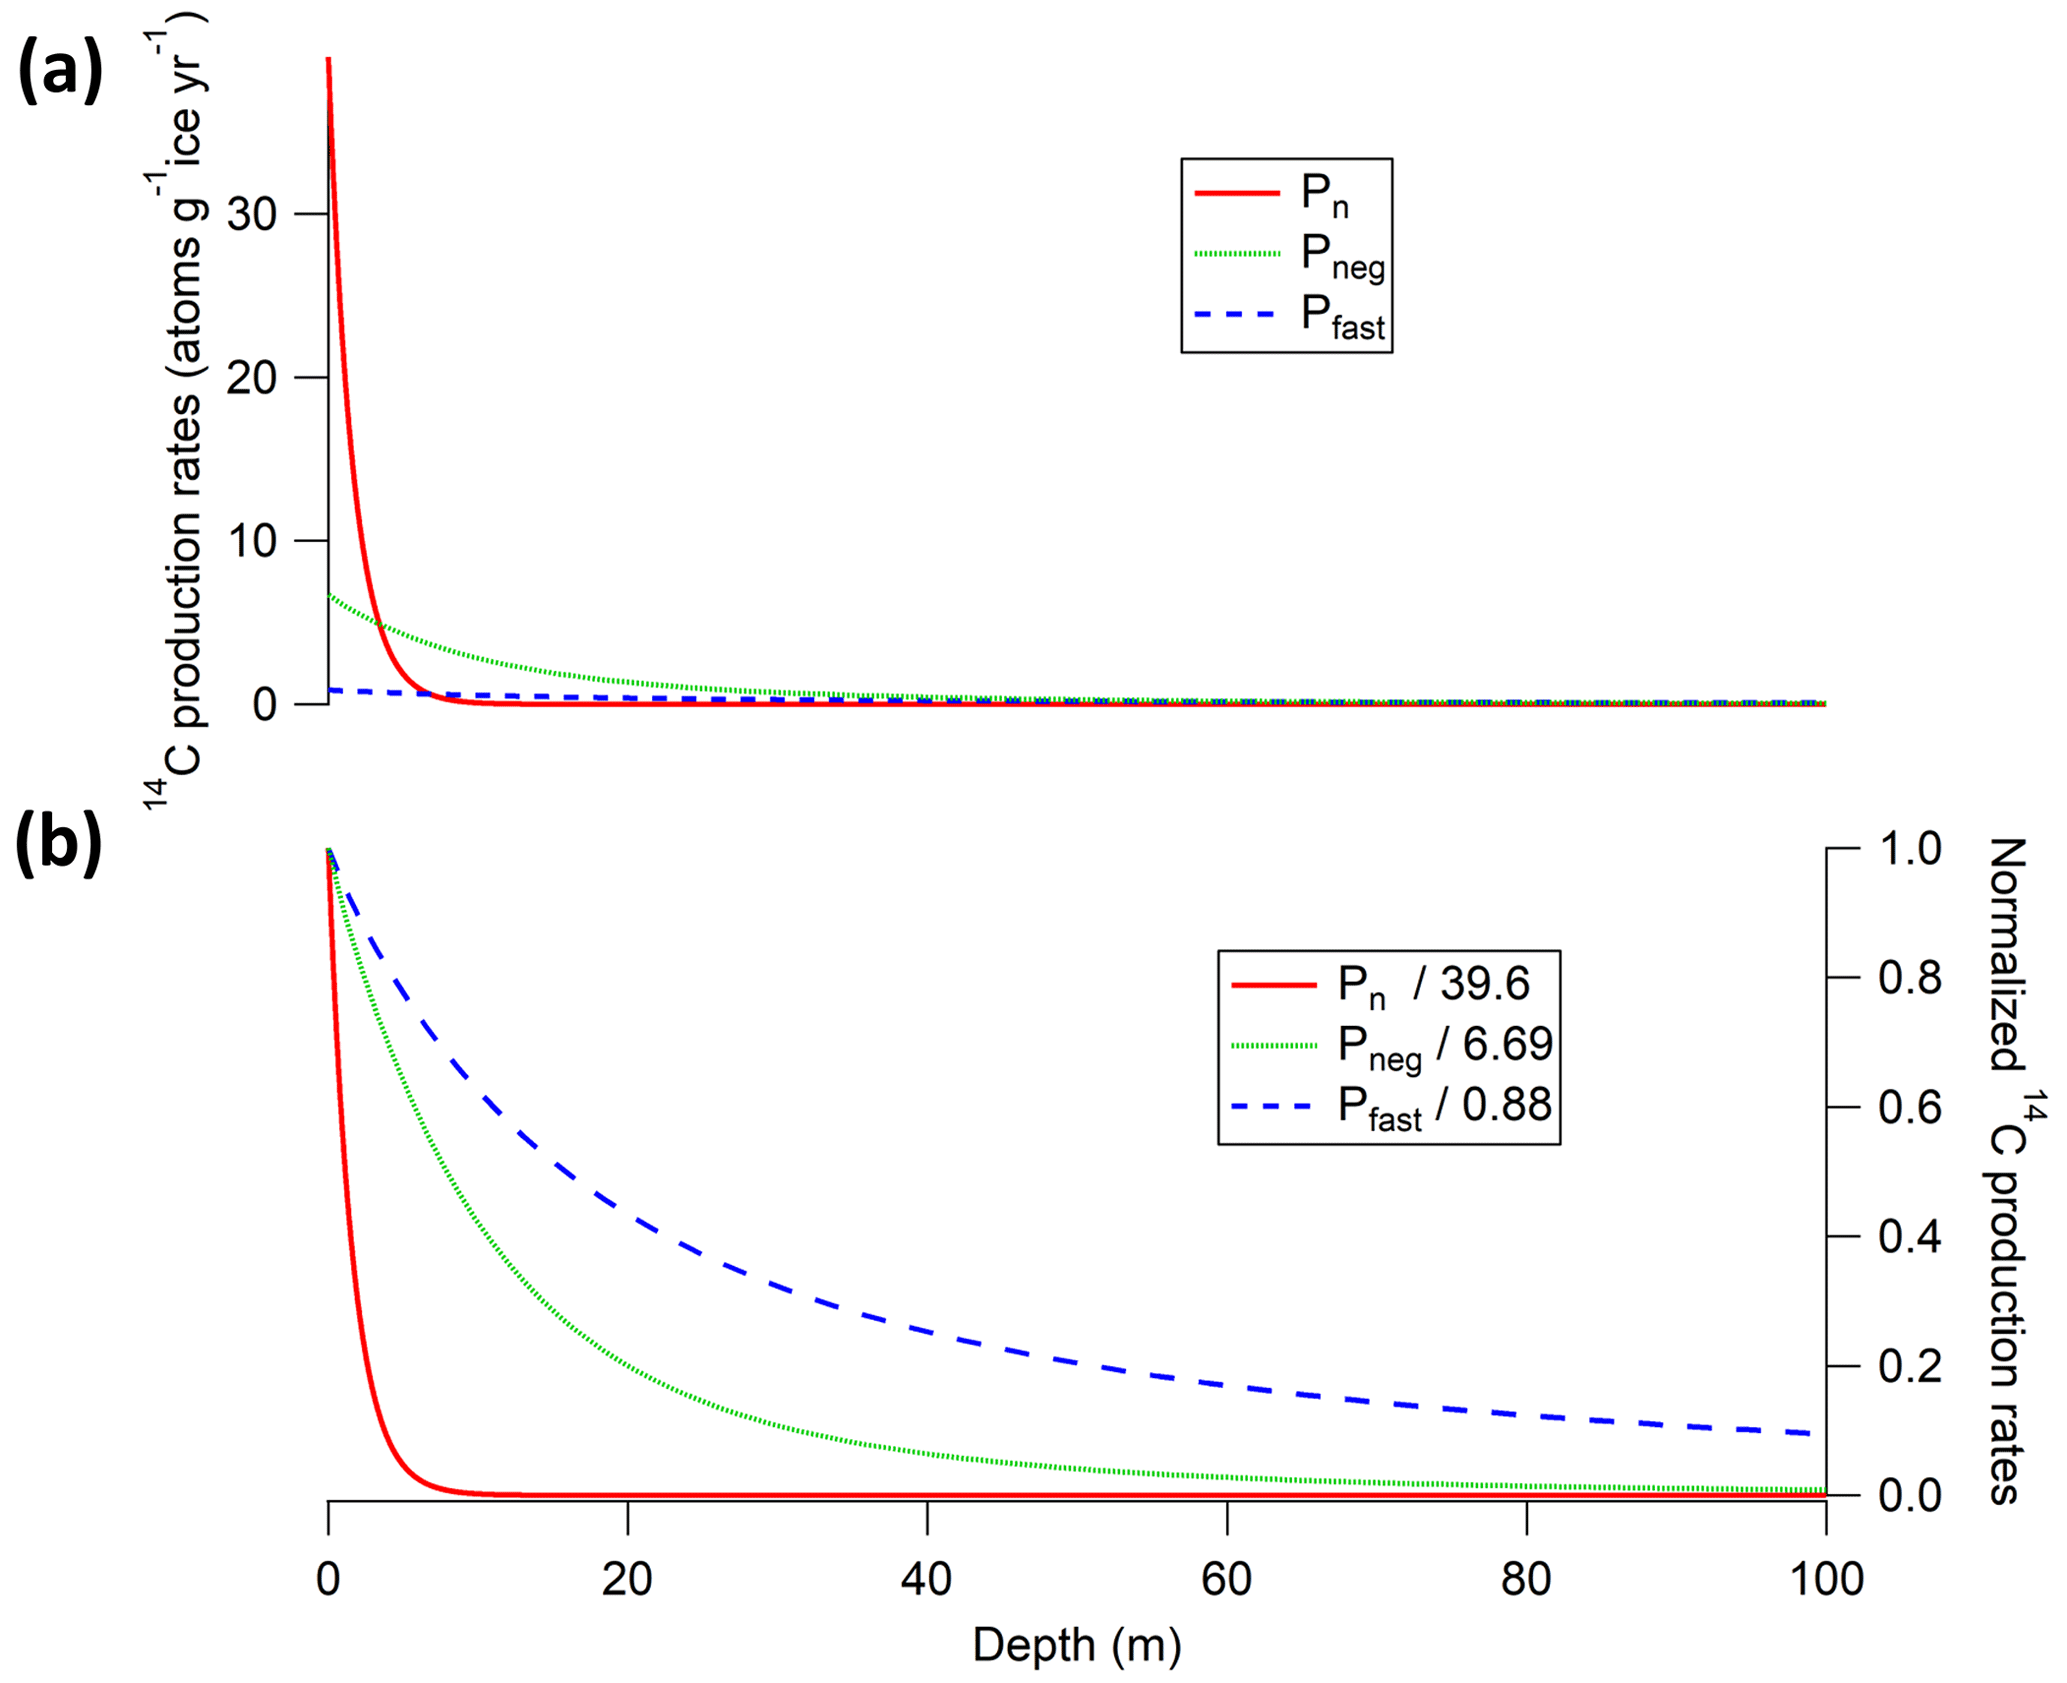
Figure 1(a) In situ cosmogenic 14C production rates scaled for the Taylor Glacier study site (77∘44′ S, 162∘10′ E; 526 m elevation) from the three nuclear mechanisms, i.e., nucleon-induced spallation (Pn), negative muon capture (Pneg), and fast muon interactions (Pfast). (b) Depth profiles of the three production mechanisms normalized to their respective surface production rates (the respective surface production rates are shown in the legend). For 14C production from neutron spallation, we used the surface production rate estimate from Young et al. (2014) with scaling from the Lifton et al. (2014) LSDn model. For the two muon mechanisms (negative and fast muons), we used the production rate model from Balco et al. (2008), which follows parameterizations by Heisinger et al. (2002a, b).
Understanding the muogenic 14C component is especially important for 14C studies in ice. Prior studies have shown that, at snow accumulation sites, most of the in situ 14C produced in the firn (including the majority of neutron-produced 14C) is lost to the atmosphere via gas movement in the firn open porosity (Petrenko et al., 2013; Van der Kemp et al., 2000; Wilson and Donahue, 1990). In situ cosmogenic 14C mainly starts to accumulate in deeper ice where gas exchange with the atmosphere no longer happens, and at these depths, the 14C production is entirely from the muon mechanisms. Thus, the in situ cosmogenic 14C signal in traditional deep ice cores is dominated by production from muons, and constraining the muogenic 14C production rates is critical to disentangle the in situ cosmogenic and atmospheric 14C signals in ice cores. Unfortunately, the in situ 14C production rates by muons in both ice and quartz are still highly uncertain (Hippe, 2017).
The production rates of cosmogenic nuclides are usually determined from calibration sites where independent controls on exposure history are available, such as 14C dating from organic materials (e.g., Lifton et al., 2015) or argon () dating from lava flows (e.g., Balbas and Farley, 2020; Fenton et al., 2019). However, the commonly used estimates of muogenic 14C production rates (for both negative muon capture and fast muon reactions) were derived through the laboratory irradiation of artificial target compounds (Heisinger et al., 2002a, b). To our knowledge, there is only one prior study (Lupker et al., 2015) that provided estimates of total muogenic in situ 14C production rates based on measurements in a natural setting. Using 14C measurements from a 15.5 m deep quartzite core from Leymon High, Spain, Lupker et al. (2015) estimated a sea level high latitude (SLHL) surface production rate of 3.34 () 14C atoms per gram of quartz per year for negative muon capture and 0 () 14C atoms per gram of quartz per year for fast muon interactions (1σ uncertainties). The large uncertainties in the 14C production rates (especially the production rate from fast muons) estimated by Lupker et al. (2015) were due to relatively large measurement uncertainty for their deepest samples and a small contribution to the 14C signal from fast muons. Balco (2017) also refitted the Leymon High data and obtained similar results regarding the magnitude of the SLHL 14C production rate from negative muon capture.
Petrenko et al. (2016) used 14C measurements (14CO, 14CO2, and 14CH4) in >50 ka ice for the 2–20 m depth range from Taylor Glacier, Antarctica, to constrain the 14C production rates in ice. The old age of the ice ensured that all in situ cosmogenic and paleoatmospheric 14C inherited from the ice accumulation site had decayed away. Unfortunately, Petrenko et al. (2016) were unable to accurately constrain the total 14C production rates because of the high uncertainty resulting from the melt–extraction technique used to obtain their 14CO2 measurements (see Sect. 1.3).
1.2 Overview of 14C production from muons
Following Heisinger et al. (2002b), the production rate of 14C (atoms per gram per year) by negative muon capture (Pneg) as a function of lithospheric depth (h; typically in g cm−2) is given by the following:
where Rμ−(z) is the stopping rate of negative muons (muons per gram per year) at lithospheric depth h, and ftot is the overall probability of 14C production in ice from a stopped negative muon (unitless). The stopping rate of negative muons at the given depth Rμ−(h) has been empirically determined from measurements at deep underground laboratories (Heisinger et al., 2002b). The lithospheric depth (h) is a product of actual depth (z) and density (ρ) of the target mineral (ρice=0.92 g cm−3).
The total probability (ftot) of 14C production from negative muon capture is expressed by the product of the chemical compound factor (fC), representing the probability that the stopped muon is captured by one of the target atoms (16O in case of 14C production), the probability that the negative muon does not decay in the K shell before nuclear capture (fD), and the effective probability for the production of cosmogenic nuclides after μ- capture by the target atom (f*; Eq. 2; Heisinger et al., 2002b; Lupker et al., 2015). All probability (f) terms in Eq. (2) are unitless. From experiments involving laboratory irradiation of artificial targets, the overall probability (ftot) for 14C production in ice from negative muon was estimated to be 0.025±0.002 (Heisinger et al., 2002b).
An expression for the production rate of nuclides by fast muon interactions (Pfast) as a function of lithospheric depth (h) is given by Heisinger et al. (2002a):
where ϕ(h) is the total muon flux at depth z (muons per centimeter squared per year per steradian), σ0 is the reference nuclear reaction cross section at muon energy of 1 GeV (millibarn, mb), β(h) is the unitless parameterized depth-dependence factor (Eq. 4), is the mean muon energy at depth h (GeV), α is a power factor that describes the energy dependence of the cross section (unitless; α=0.75), and N is the number of target nuclei per gram of the target mineral. The overall production rate of 14C from fast muons provided by Heisinger et al. (2002a) has a high (±50 %) uncertainty because of the uncertainty in the reference nuclear reaction cross section σ0 ( mb). Following Lupker et al. (2015), in this study we used ftot and σ0 as tuning parameters for the two muogenic production mechanisms in a cosmogenic nuclide production model (Sect. 3.2) to fit our 14C measurements.
1.3 Gas extraction methods for ice core 14C analysis
Common methods to liberate gas trapped in ice core bubbles include melting (wet extraction; e.g., Sowers et al., 1992; Mitchell et al., 2011) and mechanical destruction of the ice lattice (dry extraction; e.g., Bereiter et al., 2013; Ahn et al., 2009; Zumbrunn et al., 1982). Dry extraction is generally preferable for CO2 analysis because the presence of liquid water in a wet extraction introduces extraneous CO2 from the carbonate–acid reaction between the meltwater and impurities in the ice (e.g., Delmas et al., 1980; Raynaud et al., 1982). Multiple studies of 14CO2 in ice have used dry extraction methods (e.g., Van De Wal et al., 1994, 2007; Smith et al., 2000; Van der Kemp et al., 2000). However, dry extraction systems (e.g., Lüthi et al., 2008) can potentially introduce biases in the CO2 mole fraction [CO2] due to incomplete gas extraction (Bereiter et al., 2015). Considering that the in situ cosmogenic production of 14C occurs directly in the ice lattice (Lal et al., 1990), it has been argued that dry extraction may also not liberate all of the 14C from the ice (e.g., van Roijen et al., 1994).
Other studies of 14C in ice (e.g., Lal et al., 1990, 1997, 2001; Jull et al., 1994) have used wet extraction methods. These wet extraction studies involved an addition of acid to drive off all dissolved CO2 from the meltwater (Lal et al., 1990, 1997, 2001; Jull et al., 1994). The acidification process may have resulted in an additional CO2 release from impurities in the ice (e.g., carbonate dust). In dust-rich Greenland ice, the presence of liquid water in a wet extraction produced excess CH4 artifacts (Lee et al., 2020). It is thus possible that a wet extraction approach for 14C analysis may also result in additional C release from organics in the ice which are not 14C free.
A third method to liberate gases trapped in ice cores is sublimation under vacuum (e.g., Wilson and Donahue, 1989, 1990; Wilson and Long, 1997; Siegenthaler et al., 2005; Schmitt et al., 2011). Sublimation can occur when the pressure and temperature on the surface of the ice are below the triple point of the water-phase-change diagram. In addition to being free of problems associated with wet extraction methods, sublimation guarantees 100 % gas extraction efficiency (Schmitt et al., 2011; Bereiter et al., 2013, 2015), which includes any 14C trapped in the ice lattice. Therefore, sublimation is likely an optimal method for 14CO2 measurements in ice.
This study presents new 14C measurements in three gas species (14CO, 14CO2, and 14CH4) in ancient (>50 ka) ice from the ablation zone of the Taylor Glacier, Antarctica, to constrain the compound-specific 14C production rates in ice by muons. Ice at this location does not contain a significant amount of 14C inherited from the accumulation site (Petrenko et al., 2016), and the 14C content is entirely due to production by muons during transport within the glacier. We improved on the earlier work by Petrenko et al. (2016) by (1) using a newly developed ice sublimation extraction device for 14CO2 measurements (see Sect. 2.3.2), (2) collecting deeper samples to ∼72 m to better characterize the 14C production rate from the fast muon mechanism, and (3) using a more realistic 2D ice flow model from Buizert et al. (2012) to account for the flow trajectory and exposure history of the samples (see Sect. 3.1).
2.1 Site description
The blue ice area of the Taylor Glacier (Fig. 2) provides access to near-unlimited amounts of well-dated ancient ice (Baggenstos et al., 2017; Bauska et al., 2016; Menking et al., 2019; Schilt et al., 2014; Shackleton et al., 2020). This allows ice from Taylor Glacier to be measured for ultra-trace-gas species that require a very large amount of ice (Dyonisius et al., 2020; Petrenko et al., 2016, 2017; Buizert et al., 2014). In this study, we used the same site as Petrenko et al. (2016; 77∘43.699′ S, 161∘43.179′), where ice >50 ka in age at the surface has been previously identified.
2.2 Field sampling
Approximately 1000 kg of ice is needed to obtain both the necessary CH4-derived and CO-derived C mass for 14C analyses. Because of this large sample requirement, and to avoid post-coring in situ 14C production at the surface, the melt extraction for 14CH4 and 14CO samples was performed on site using the large-volume melter apparatus and technique described in Petrenko et al. (2016). The liberated air was transferred to 34.9 L electropolished stainless steel canisters and shipped to our laboratories for processing and analyses. Similar to other studies using this large-volume ice melter (e.g., Dyonisius et al., 2020; Petrenko et al., 2016, 2017), four procedural blanks (two with modern 14CH4 standard gas and two with 14C dead 14CH4 standard gas) were collected in the field. These field procedural blanks allow us to characterize the addition of extraneous 14C to the samples. The standard gases used in the field procedural blanks were passed through a Sofnocat 423 reagent, which removes CO (and thus 14CO) but leaves CH4 (and 14CH4) intact.
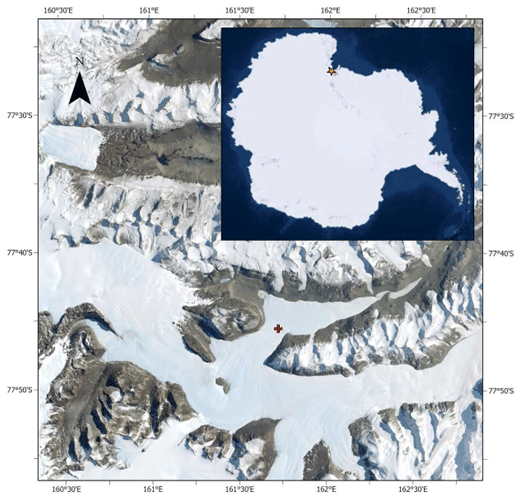
Figure 2Map of the Taylor Glacier study site. The sampling location is marked by a red cross on the map. The orange star in the inset map shows the location of the Taylor Glacier relative to the Antarctic continent. The map was made using ArcGIS Pro, with imagery layers from Esri and Earthstar Geographics.
The sampling scheme for this study is shown in Fig. S1 in the Supplement. We used the 9.5 in. (241 mm) diameter Blue Ice Drill (BID; Kuhl et al., 2014) to collect seven large-volume samples during the 2015/2016 austral summer field season for 14CO and 14CH4 analyses. The surface sample was collected from 21×1.5 m deep shallow cores, each with an average mid-depth of ∼0.75 m. Six additional deep samples with mid-depths of 19.5, 30, 40.5, 51, 61.5, and 72 m were also collected by combining ice from three ∼78 m deep boreholes. Each of the deep large-volume samples spanned approximately 10.5 m depth. Continuous sticks of ice subsamples (3×3 cm; spanning the whole length of the core) were taken from one of the three ice core boreholes (TGDeep3) for age control (see Sect. S3 in the Supplement). The continuous sample sticks were measured for the CH4 mole fraction [CH4] using the continuous flow analysis (CFA) system described in Rhodes et al. (2013) at Oregon State University (OSU).
In addition to the large-volume samples, we collected 26 smaller subsamples (∼1.5–2 kg) from 13 depth levels and two boreholes for 14CO2 measurements. Each depth level contained a pair of replicates; however, only 9 out of the 13 replicate pairs were true replicates (i.e., collected from the same borehole and cut from the same depth interval; Fig. S1). Collecting same depth-adjacent samples below 50 m depth from a single borehole was challenging because of the reduced core quality (i.e., more fractures in the ice), and thus, the replicates had to be collected from a different borehole. Immediately after removal from the borehole, ice samples become exposed to a more intense cosmic ray bombardment (post-coring in situ cosmogenic 14C production). Five artificial bubble-free ice (BFI) samples were manufactured in the field, following methods from Mitchell et al. (2011), but upscaled to produce 1.5–2 kg samples. The field-produced BFI samples were shipped together with the collected glacial ice samples to characterize the effects of the post-coring in situ cosmogenic 14CO2 production in the samples.
2.3 Laboratory analytical methods
2.3.1 Large-volume samples for 14CO and 14CH4 measurements
The detailed approach for sample processing, measurements, and associated procedural corrections for the large-volume samples have been previously described in detail (Petrenko et al., 2016). In this section, we only provide a brief overview and highlight the differences between our methods and those of Dyonisius et al. (2020). First, the δ13CH4 measurements were conducted at the Institute of Arctic and Alpine Research (INSTAAR), following the methods described by Miller et al. (2002; Table S1 in the Supplement). The δ13CH4 measurements were not corrected for gravitational (Sowers et al., 1992) and diffusive isotopic fractionation (Buizert et al., 2013) because these corrections are only necessary to reconstruct the paleoatmospheric δ13CH4 signal. In this study, the δ13CH4 values are only used to normalize and calculate the absolute 14CH4 abundance (in molec. per gram of ice).
The large-volume samples and field procedural blanks were measured for [CH4] using a gas chromatograph–multidetector (GC-MD) system (Prinn et al., 2008; Table S2). Pressure in the sample canisters was measured using a Paroscientific, Inc., Digiquartz® series 740 absolute pressure transducer at the Scripps Institution of Oceanography (SIO) for total air content (TAC) determination (Table S3). Two of the field procedural blanks were also measured for the , , and ratio (Table S4) at the Scripps Institution of Oceanography (SIO), following the procedures described in Bereiter et al. (2018). The noble gas ratios were used to constrain the degree of gas solubility during the melt extraction. The large-volume samples were measured for CO mole fraction [CO] using a Picarro G2401 analyzer (Table S5) and again for pressure at the University of Rochester (UR; Table S4).
The CH4 in the large-volume samples and blanks was combusted to CO2, cryogenically separated, and flame-sealed in glass ampules using the air processing line at the University of Rochester (Dyonisius et al., 2020). We also processed 3×100 µg of CH4-derived C samples each from the modern 14CH4 standard gas and 14C dead standard gas used for the field procedural blanks. The sample air that remained after CH4 processing (∼10 L standard temperature pressure, STP) was diluted with a gas containing 10.02±0.26 µmol mol−1 (95 % confidence interval, CI) of 14C-depleted CO (14CO pMC; 95 % CI) to increase the CO-derived C mass for the accelerator mass spectrometry (AMS) measurements. The dilutant gas was measured for δ13CO using methods described in Vimont (2017; δ13CO ‰; 95 %CI).
The CO- and CH4-derived CO2 was graphitized using the Australian Nuclear Science and Technology Organization (ANSTO) micro-furnaces, following Yang and Smith (2017). We used the 14C activity measured on the 100 µg samples as the true 14C activity of the standard gases (Table S6). Because of the larger sample size, the effect of extraneous C introduced by graphitization on these 100 µg samples is assumed to be negligible. Using a mass balance approach described in Petrenko et al. (2017), the total extraneous C mass for the 14CH4 samples was determined to be 0.63±0.28 µgC, and the corresponding 14C activity for the extraneous C was 16.7±10.2 pMC (95 % CI).
Table 1Measured 14CO2, 14CO, and 14CH4 after all associated corrections and calculated total 14C, ratios, 14CO2, and 14CO fractions. All errors presented indicate the 95 % CI. NA – not available.
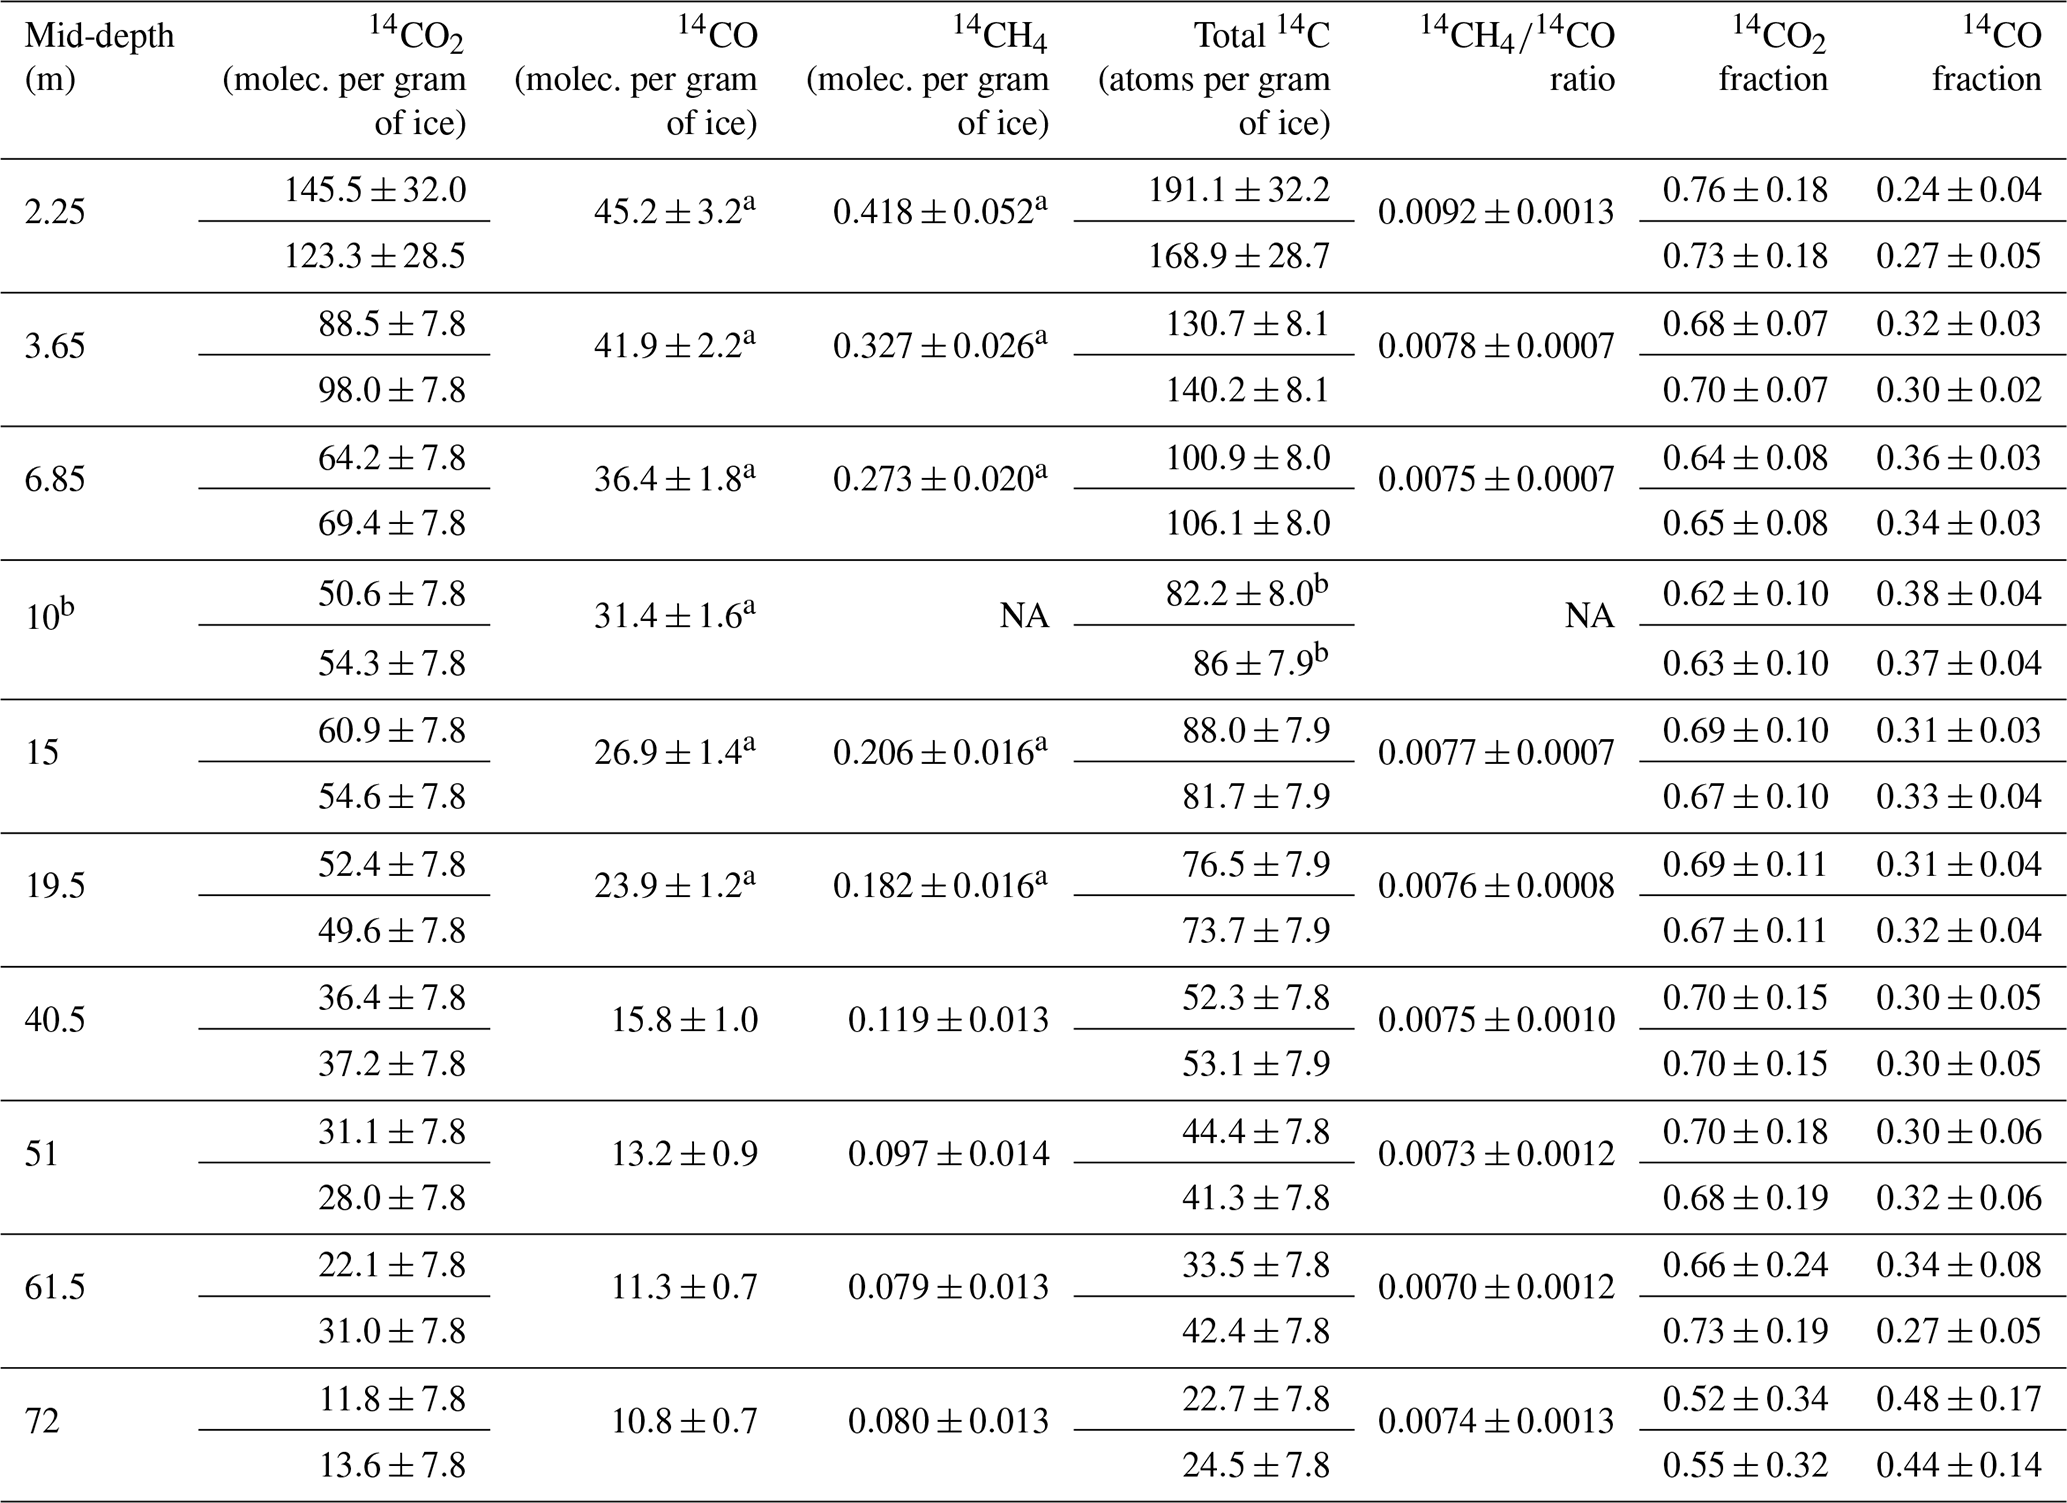
a Data from Petrenko et al. (2016). b The total 14C value for the 10 m sample was scaled by a factor of 1.003±0.003 (95 % CI) to account for the lack of 14CH4 measurements (Sect. 4.2).
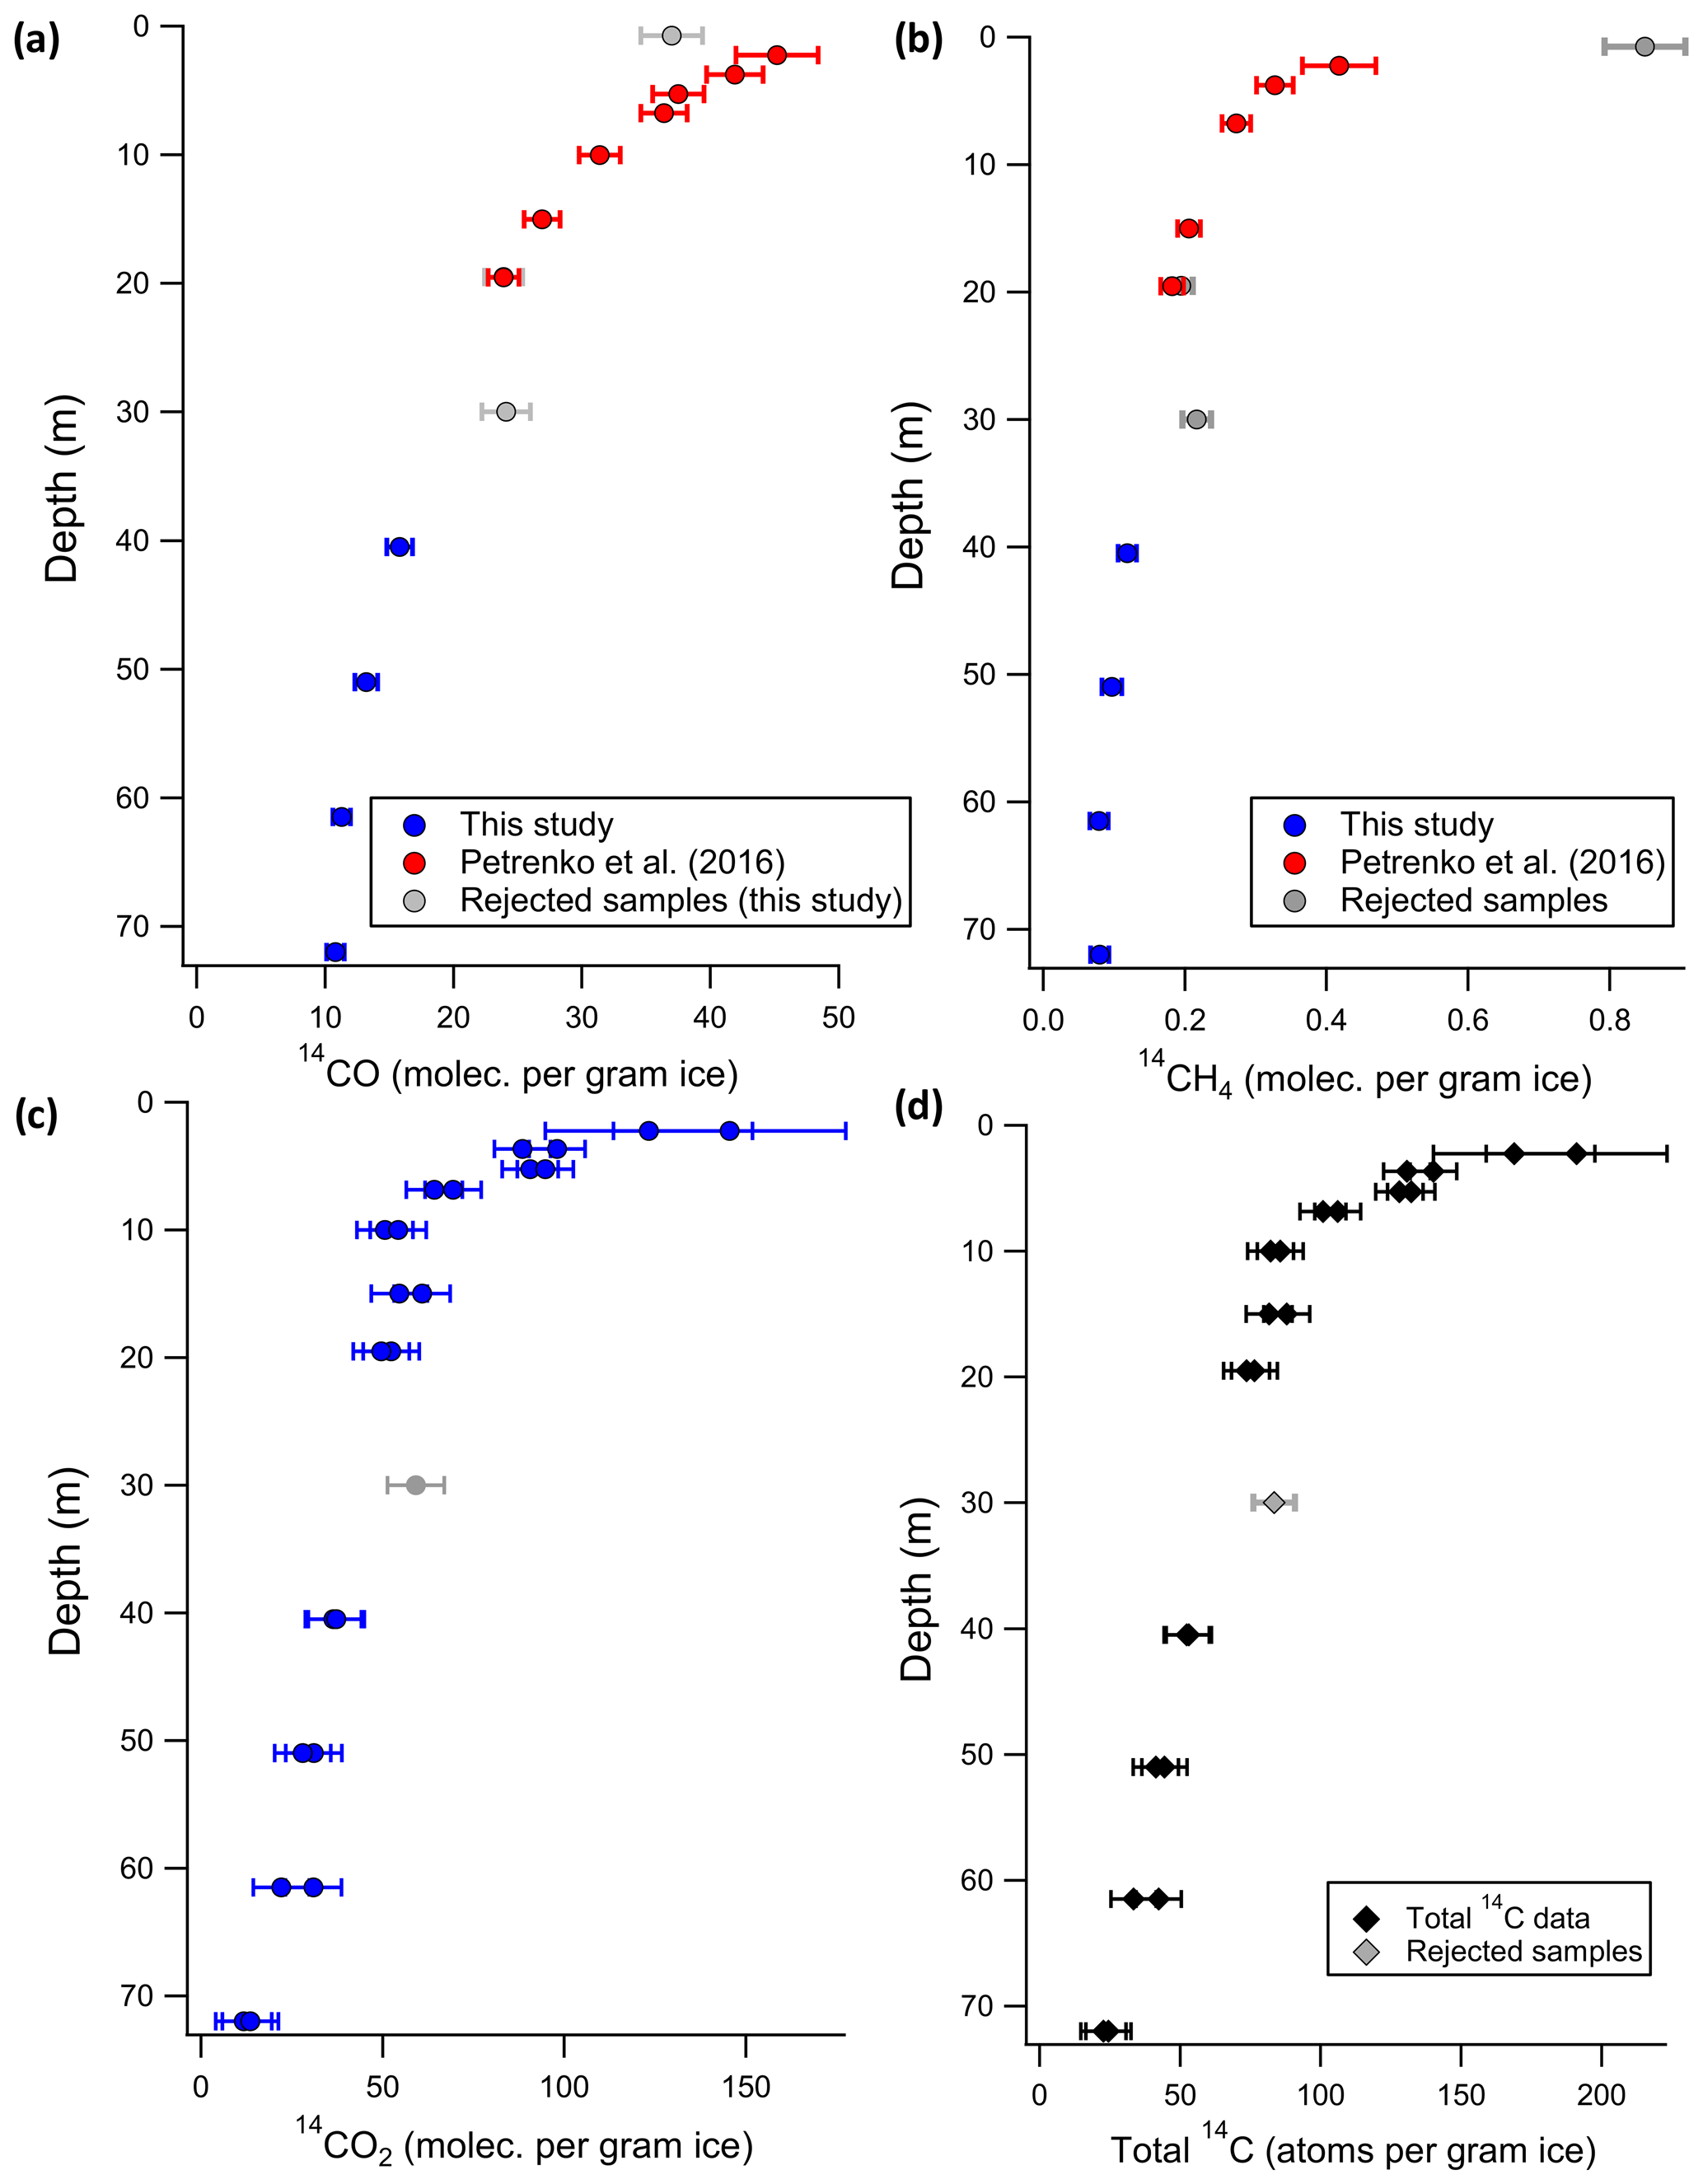
Figure 3(a) Measured 14CO molec. per gram of ice after all corrections. (b) Measured 14CH4 molec. per gram of ice after all corrections. (c) Measured 14CO2 molec. per gram of ice after all corrections. (d) Total measured 14C atoms per gram of ice. This represents the sum of 14CO, 14CH4, and sublimation-based 14CO2 measurements. All error bars shown in this figure are 95 % CI.
In prior studies (e.g., Dyonisius et al., 2020; Petrenko et al., 2017), 14CO measurements from the field procedural blanks were used to characterize the effects of extraneous 14C addition from sample extraction, handling, storage, transport, and processing (including the graphitization step). For this study, the field procedural blanks were still used to characterize the effects from in situ production of 14CO in the sample air canisters by cosmic rays during storage and transport. However, to better characterize the effects from the addition of extraneous C during the graphitization process, we used a linear empirical correction from 10 commensurately sized 14C standards and blanks at ANSTO (see Fig. S2a; Table S7), following Petrenko et al. (2021). This approach has the benefit of bracketing the effects of extraneous C from graphitization at ANSTO with low and high 14C standards, similar to the approach for the 14CH4 samples. The 14CO blank for this sample set is 22.45±3.24 molec. 14CO per cc of air STP (95 % CI), which is higher than the 14CO blanks reported in Dyonisius et al. (2020). This is mainly because there was an extra year between the retrieval and processing of the samples (thus, there was more in situ 14CO production in sample canisters during storage). The amount of 14C per gram of ice for 14CO, 14CH4, and 14CO2 (Table 1) is calculated using the same method as in Petrenko et al. (2016) and is consistent with the Hippe and Lifton (2014) formulations for in situ 14C concentrations. 14CH4 and 14CO measurements in our samples after all associated corrections, in addition to earlier Taylor Glacier results from Petrenko et al. (2016), are shown in Table 1 and Fig. 3.
2.3.2 Sublimation and processing of samples for 14CO2 measurements
CO2 was liberated from ice samples using a newly developed ice sublimation device at the University of Rochester (Hmiel, 2020), roughly following the design of Schmitt et al. (2011). To briefly summarize the procedure, 1.5–2 kg ice samples were loaded into a vacuum glass vessel. The vessel was then evacuated, and the ice was sublimated at vacuum with six infrared emitters (Emitted Energy, USA) for 8–10 h. We did not sublimate 100 % of the samples because, as the ice sublimates away, impurities such as dust and organics start to accumulate on the surface. The aggregation of impurities on the sublimation front might enhance unwanted chemical reactions that produce extraneous carbon (Schmitt et al., 2011). Furthermore, towards the end of the extraction, the sublimation became less efficient as less surface area was available to absorb radiation. Approximately 1 kg of ice was sublimated in 8–10 h. However, the incomplete sublimation does not compromise the 100 % extraction efficiency, as all the gases trapped in the ice that is sublimated away are still released (Schmitt et al., 2011).
The liberated CO2 was cryogenically trapped with liquid nitrogen, and the air was also cryogenically trapped with 5Å molecular sieve (Sigma-Aldrich, USA) under liquid nitrogen. After the sublimation was completed, the trapped CO2 and air were expanded into separate volume-calibrated manometers in which pressure measurements were taken to calculate the [CO2]. Finally, the isolated CO2 was cryogenically transferred to and flame-sealed into a Pyrex glass ampule. The CO2 was graphitized at ANSTO using the micro-furnaces (Yang and Smith, 2017), and the graphitized samples were measured for 14C activity at the ANTARES AMS facility (Smith et al., 2010). One 14CO2 sample (replicate for 30 m depth sample) was unfortunately lost during sublimation because the ice fractured under vacuum during the evacuation step.
A ∼50–75 g ice subsample was taken from every 14CO2 sample and shipped to OSU. The aliquots were measured for [CO2], following Ahn et al. (2009), and [CH4] and TAC, following Mitchell et al. (2013; Table S8). Five field-produced bubble-free ice (BFI) samples and nine laboratory-produced BFI samples were also sublimated along with the glacial ice samples. During the sublimation of the BFI samples, a standard gas with known 14CO2 activity and [CO2] was introduced into the bottom of the glass sublimation vessel at 0.15 scc min−1 flow rate for 8–10 h. The flow rate was set to mimic the rate of air liberation from glacial ice samples and the processing time also mimicked the amount of time needed to sublimate glacial ice samples. We used a standard gas with dead 14CO2 activity for four laboratory-produced BFI samples and a standard gas with modern 14CO2 activity for the other five laboratory-produced BFI samples. The CO2 was cryogenically trapped downstream, processed, and measured for 14C activity, following the same methods as the ice samples. In combination with the OSU [CO2] and TAC measurements, the BFI samples were used to constrain the amount of extraneous carbon and 14C introduced by sample transport, storage, and processing (see Sect. S1; Table S9). Finally, 11 commensurately sized 14C standards and blanks (14–16 µgC) with known 14C activities (in 0–135 pMC range) were prepared, graphitized, and measured at ANSTO, concurrently with all the samples (Table S7), to characterize the effects from the addition of extraneous C during the graphitization process.
The detailed corrections for the 14CO2 samples are discussed in the Supplement. We correct for the effects of extraneous C from graphitization and other ANSTO processing using a linear empirical correction from the commensurately sized 14C standards (Sect. S1.1; Fig. S2b). The effects of extraneous carbon from ice sublimation/CO2 extraction are calculated from the difference in measured 14C activity of the laboratory-produced BFI samples relative to the measured 14C activity of the standard gases with a mass balance approach (Sect. S1.2; Tables S8 and S9). Finally, the samples were corrected for the effects of post-coring in situ 14CO2 production in ice using results from the field-produced BFI samples (Sect. S1.3; Table S10). The 14CO2 measurements in our samples after all associated corrections with their error-propagated uncertainties are shown in Table 1 and Fig. 3.
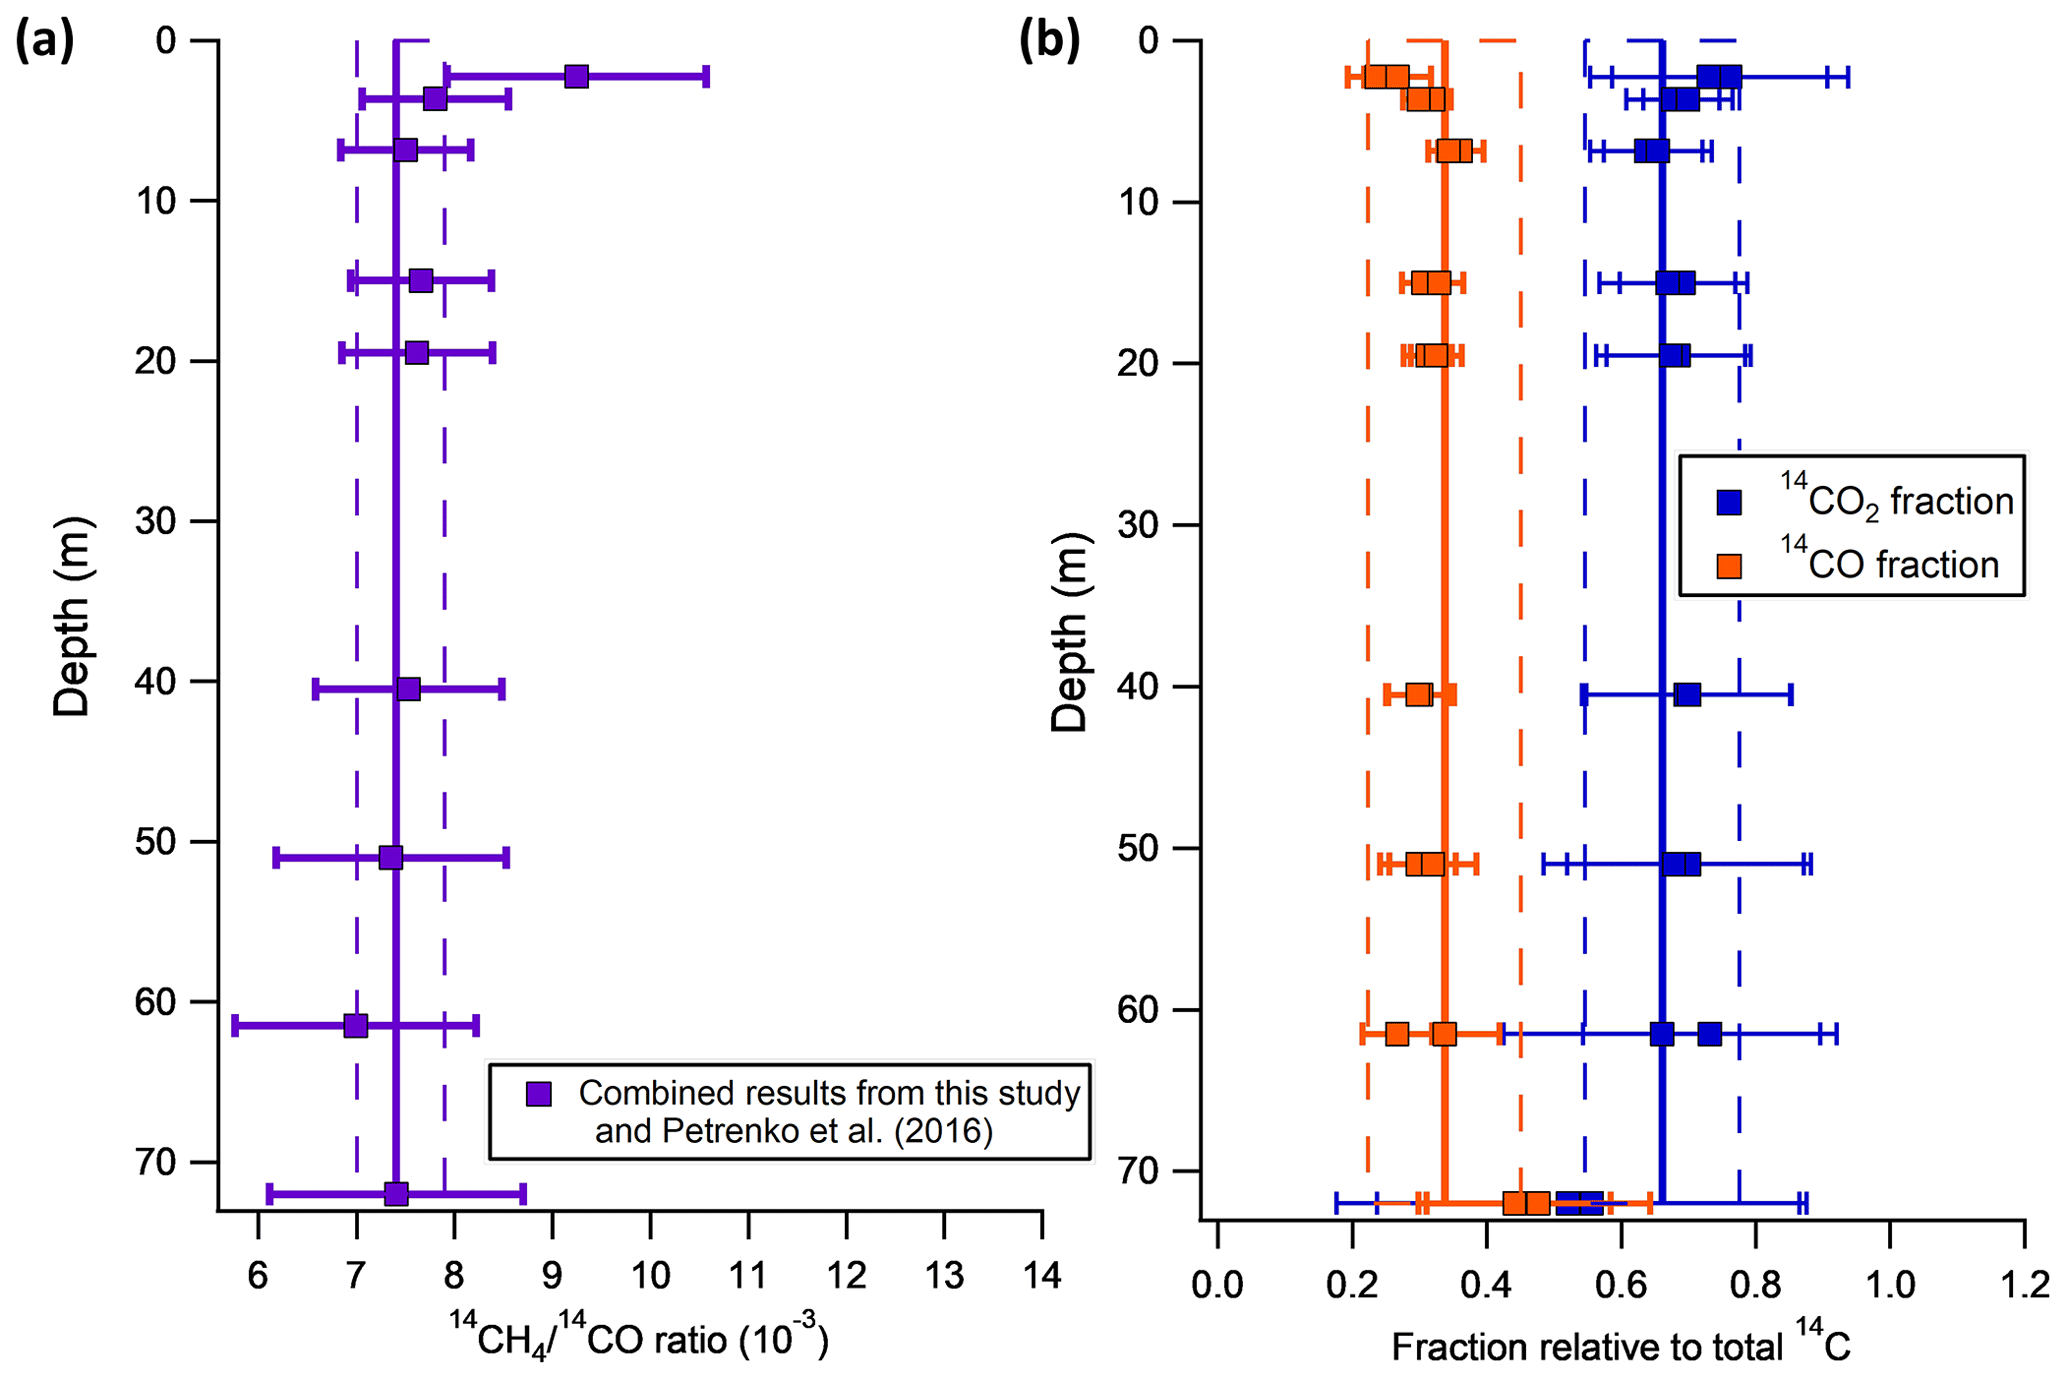
Figure 4(a) . (b) 14CO/total 14C and 14CO2/total 14C ratio. The solid lines represent the mean, and the dashed lines represent 2 standard deviations of the ratio, 14CO2, and 14CO fractions for samples deeper than 6.85 m where production by muons dominates. The ratios for rejected samples (Sects. 4.1, S2) are not shown. All error bars shown in this figure are 95 % CI.
An in-depth discussion about the analytical uncertainty in the 14CO2 measurements obtained from the sublimation method (which is important for the interpretation of the data because it is the largest source of uncertainty for total 14C) is provided in Sect. S1.4. In brief, we used the pooled standard deviation of replicate pairs (±7.8 14CO2 molec. per gram of ice; 2σ) as the uncertainty for all 14CO2 measurements, except the 2.25 m sample pair (where we used the error-propagated uncertainties instead; Table 1). For the rest of the paper, we refer to the sum of measured 14CO, 14CO2, and 14CH4 as the total 14C. The , 14CO/total and 14CO2/total 14C ratio of the samples are shown in Fig. 4.
2.4 Sample integrity
Several samples were excluded from the data analysis; the detailed reasoning for rejecting these samples is discussed in Sects. S2 and S3. The surface samples (0.75 m depth) for all three 14C species (14CO, 14CH4, and 14CO2) are rejected because of ambient air contamination from abundant fractures in the ice sample (due to thermal stresses in near-surface ice) and the likely chemical and/or biological alteration of CH4, CO, and CO2. The 19.5 and 30 m 14CO and 14CH4 samples from the 2015/2016 season were rejected because of anomalous alterations in TAC, [CO], and [CH4]. The 30 m 14CO2 sample was also rejected due to alteration in [CO2].
3.1 Ice flow model to constrain sample exposure history
We used a 2D ice flow model from Buizert et al. (2012) to generate flow trajectories for the ice parcels corresponding to each sample depth (Fig. 5). The model first computes the 2D steady-state ice flow velocity field based on the observed surface velocities, ablation rates, and glacier thickness and then generates an ice parcel back-trajectory using a 2D linear interpolation of the ice flow velocity field (Kavanaugh et al., 2009a, b; Kavanaugh and Cuffey, 2009; Bliss et al., 2011). The largest source of uncertainty for the trajectories are the ablation rates (Buizert et al., 2012), which are based on measurements of 163 poles initially planted in 2002/2003 (Kavanaugh et al., 2009b; Bliss et al., 2011). All survey poles were measured a year later, providing 1-year average ablation rate estimates (Kavanaugh et al., 2009b) and again in the 2006/2007 season. Additionally, 17 poles were remeasured in the 2009/2010 and 2010/2011 seasons (Buizert et al., 2012). The 4-year average ablation rates were 4.7 cm yr−1 higher than the 1-year average (Kavanaugh et al., 2009b); following Buizert et al. (2012), the ablation rate uncertainty for each pole was calculated by dividing 4.7 cm yr−1 with , where N is the length of the observation period in years (N=1, 4, 7, or 8). Figure S3 shows the ablation rates along the glacier and their uncertainties inferred from the survey pole data.
The ice flow model used a bedrock profile from Kavanaugh et al. (2009a); however, the bedrock profile only extends to 72 km away from the glacier terminus, a point which we refer to as the glacier head (Fig. 5). This bedrock profile corresponds to 5–6 kyr of ice flow history and approximately one 14C half-life. Beyond the constraints from the bedrock profile, we had to make assumptions about the depth of the long-term transport (zdeep). Morse et al. (1998) provided a radar-based bedrock profile that includes the Taylor Glacier snow accumulation area (Baggenstos et al., 2018) north of the Taylor Dome – approximately 60 km upstream from the glacier head, where the Kavanaugh et al. (2009a) bedrock profile ends. Based on the bedrock profile from Morse et al. (1998), at the Taylor Glacier accumulation area, the depth of ∼80 kyr ice (which corresponds to our 72 m sample) is ∼575 m. We thus assumed that the depth of long-term transport (zdeep) for the 72 m sample under the best-estimate ablation rate scenario (which we define as the reference sample) is 575 m. For other ice parcel trajectories (i), we scaled the depth of long-term transport (zdeep) as follows:
where zref represents the depth of the 72 m reference sample in the model at the glacier head under the best-estimate flowline (zref is 699 m), and zhead represents the depth of the ice parcel of interest at the glacier head. We assumed that the difference in depth between the reference sample and the sample of interest (i) at the glacier head and during long-term transport within the glacier is the same.
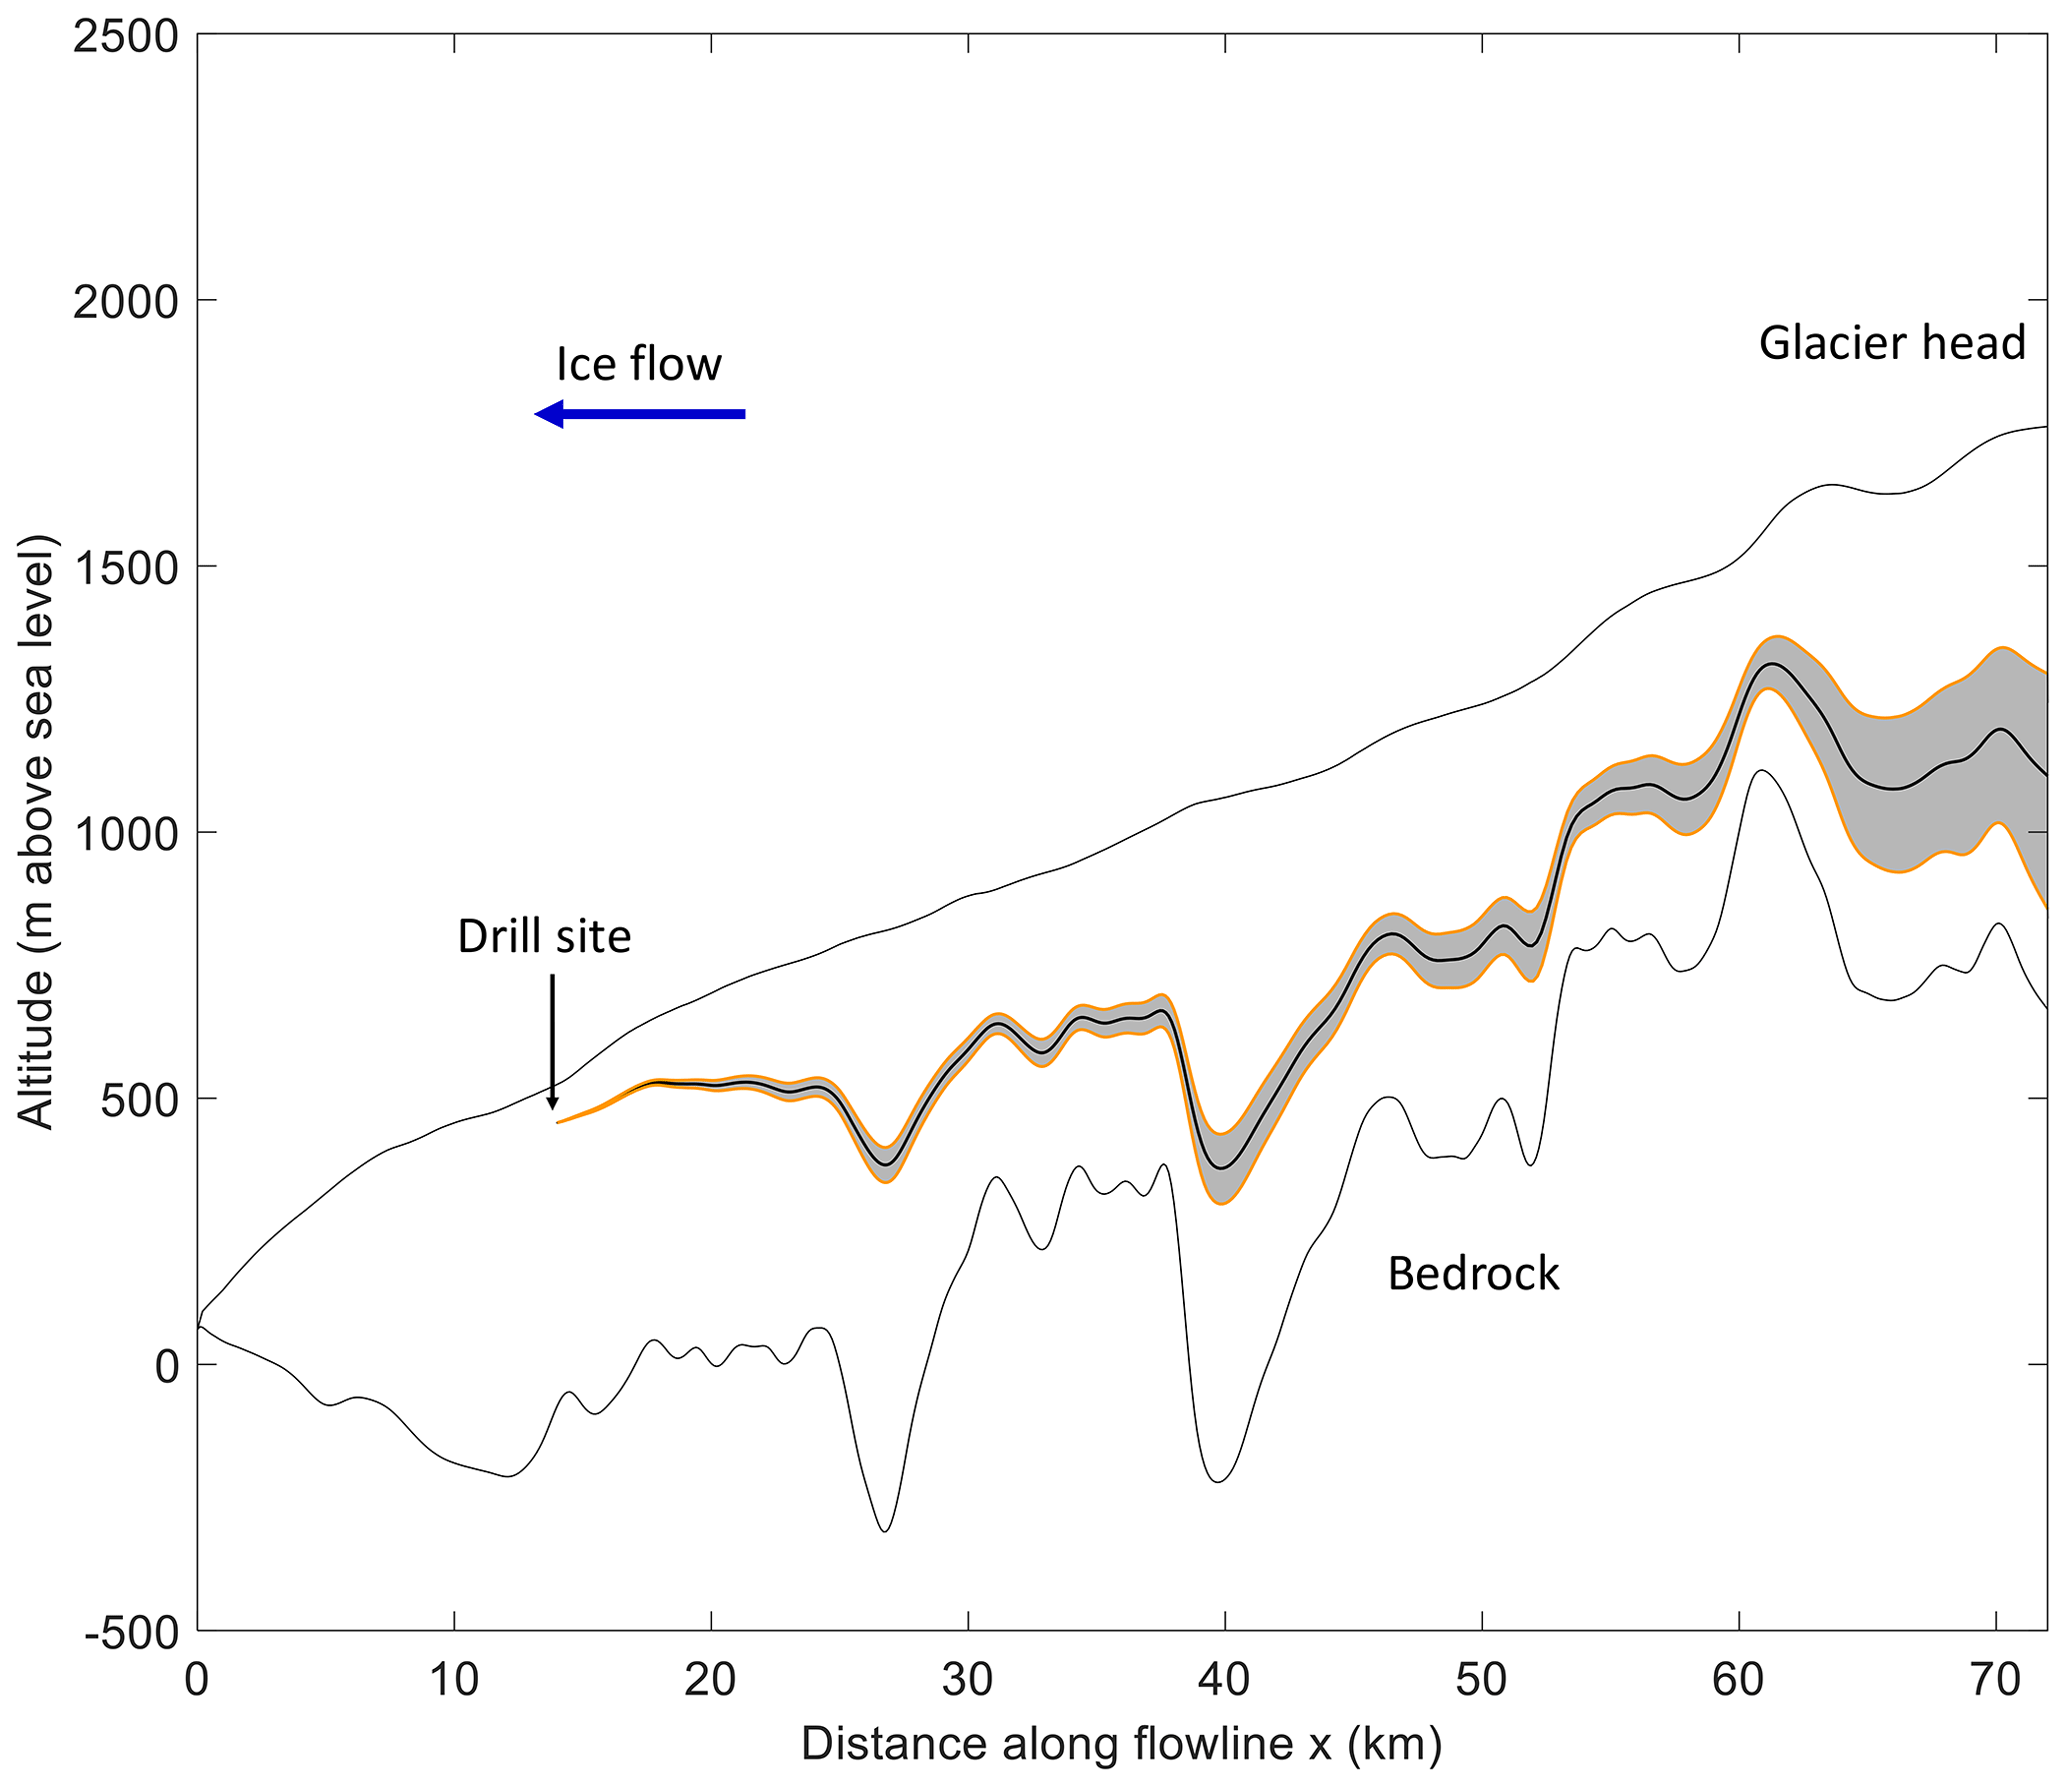
Figure 5Example of the ice parcel back-trajectory and associated uncertainties. For the Monte Carlo estimate of uncertainties (Sect. 5.4.2), for each given sample depth (72 m in this figure), 10 000 back-trajectories are generated. Each back-trajectory corresponds to a different ablation rate scenario (the ablation rates are perturbed within their experimental measurement uncertainties to generate the scenarios). The shaded region represents the 68 % CI uncertainty envelope of the flow trajectory.
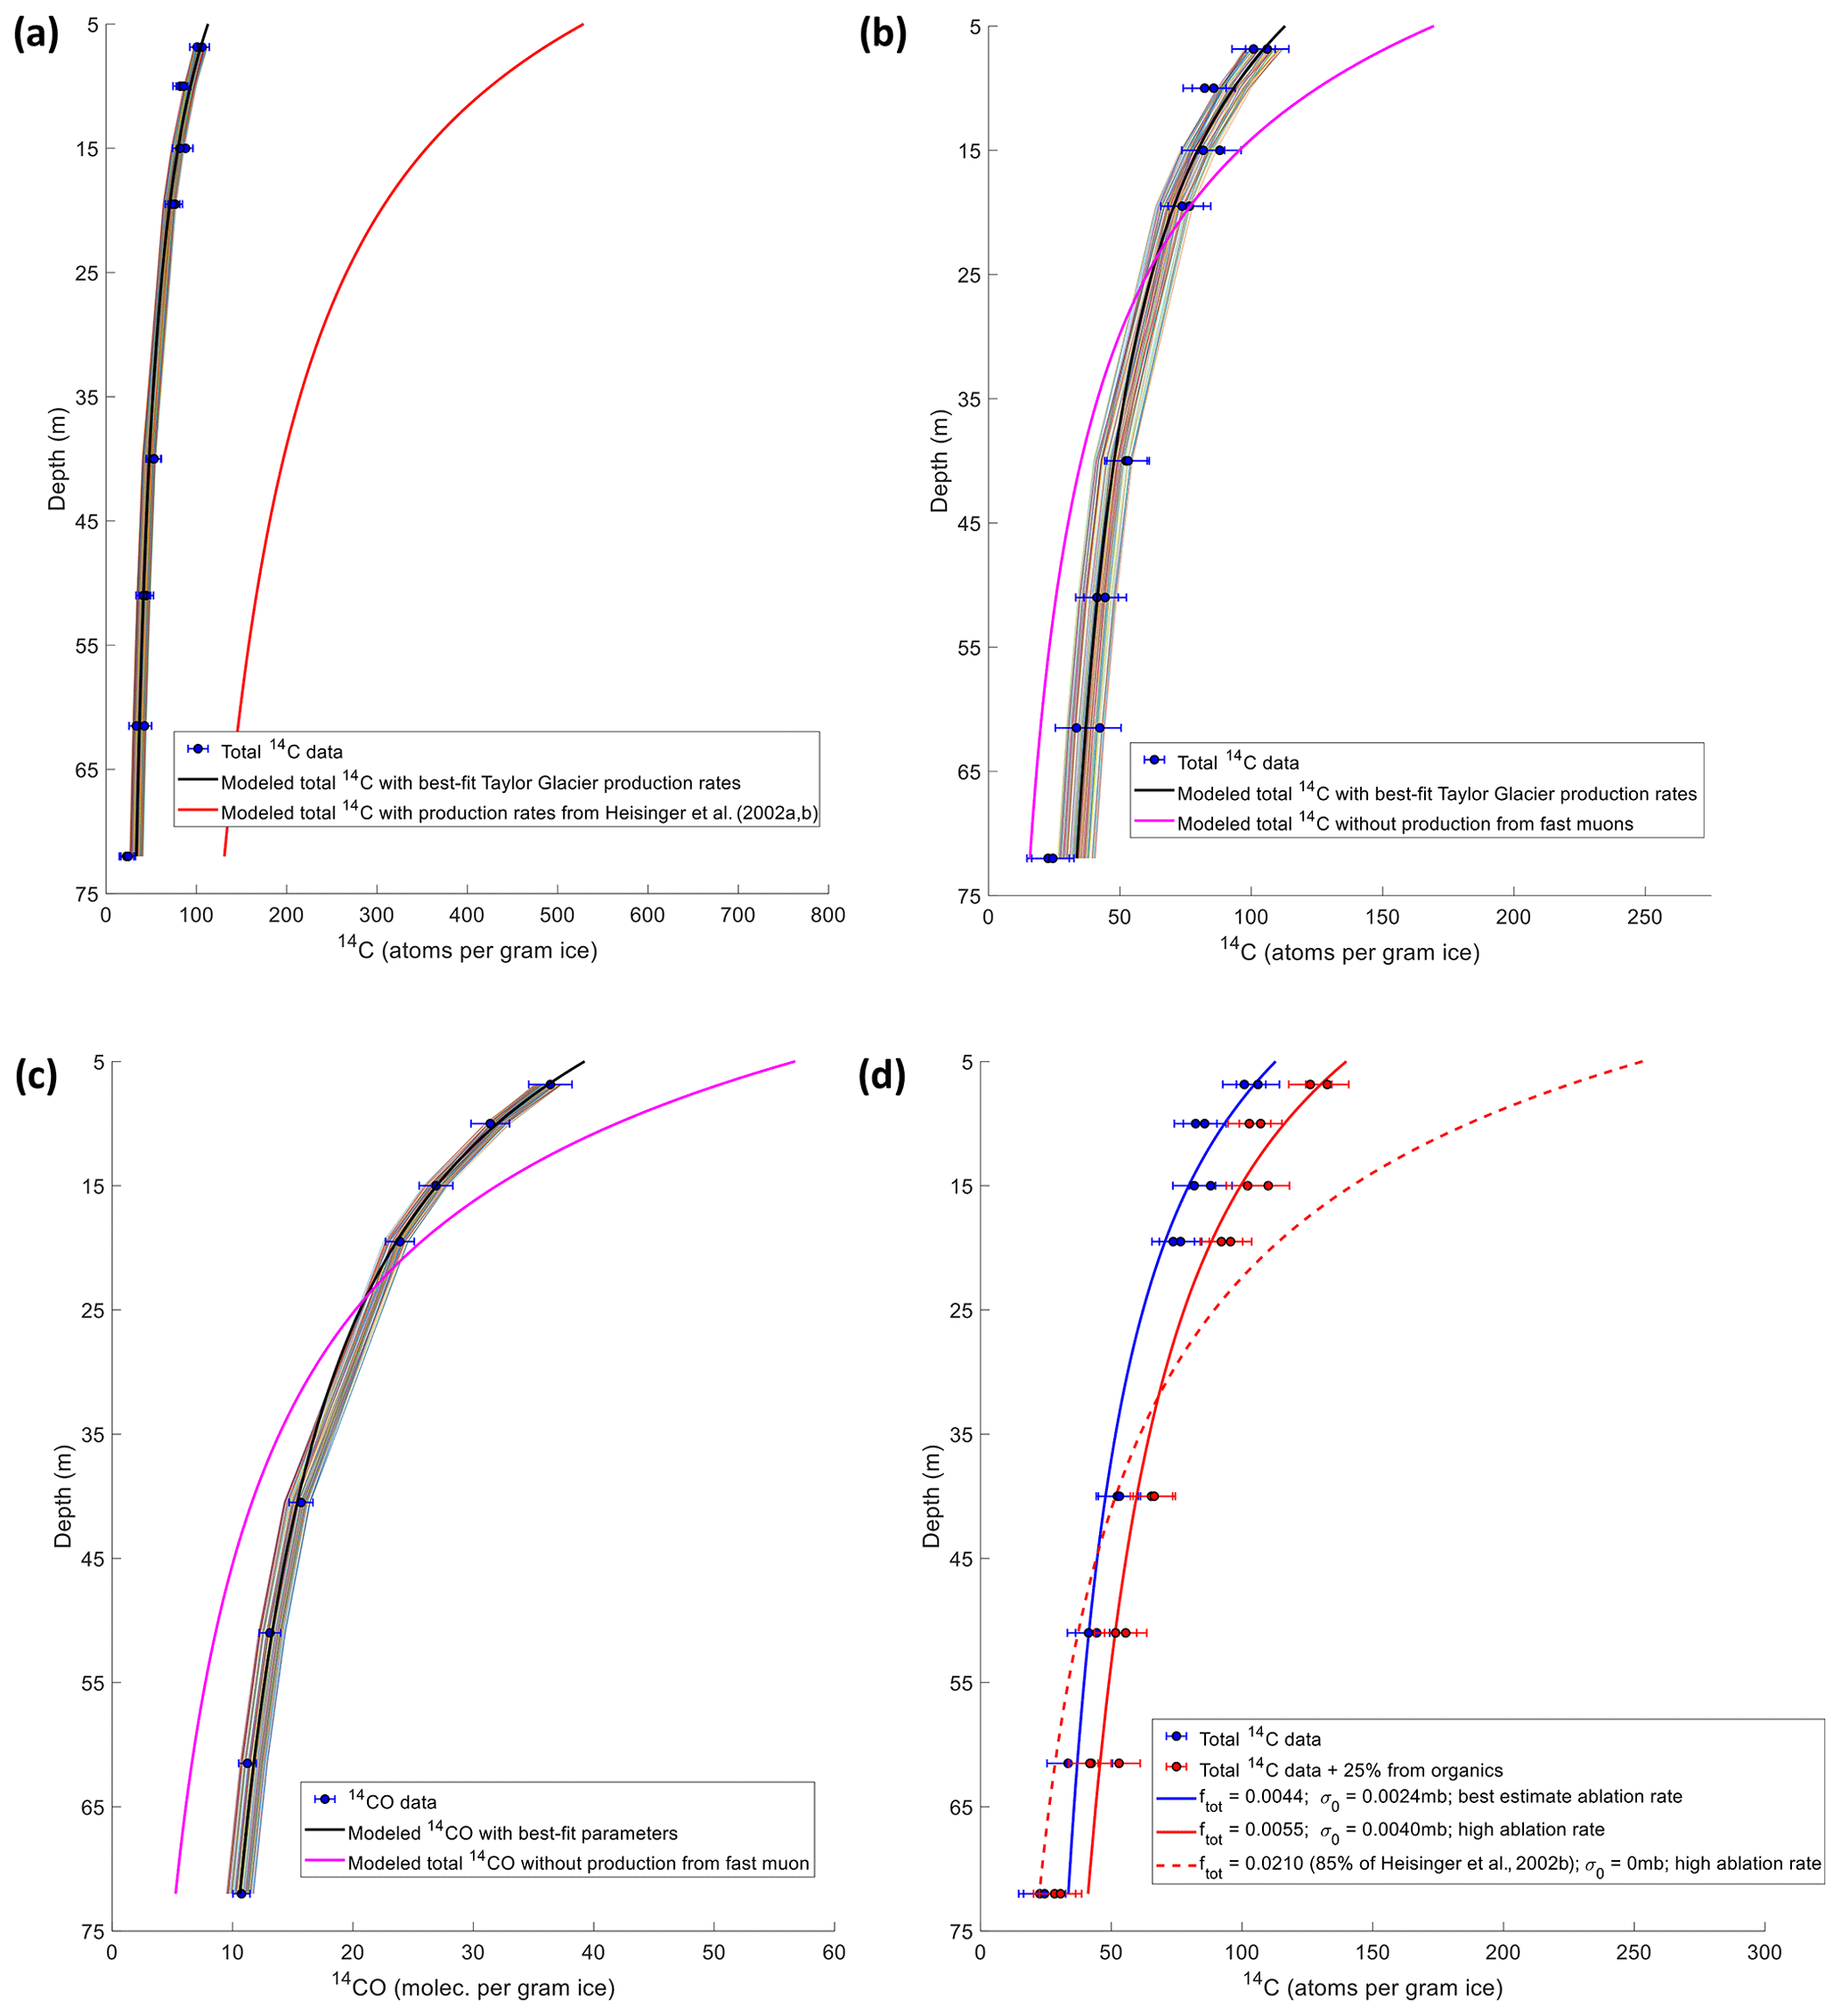
Figure 6(a) Comparison between total 14C measurements with modeled best-estimate σ0 and ftot parameters from this study and Heisinger et al. (2002a, b). (b) Comparison between total 14C measurements with modeled best-estimate σ0 and ftot parameters from this study and modeled total 14C with best-fit ftot when σ0 is forced to be zero. (c) Comparison between 14CO measurements with modeled best-estimate fneg and ffast parameters from this study and modeled 14CO with best-fit fneg when ffast is forced to be zero. (d) Comparison between total 14C measurements with modeled best-estimate σ0 and ftot parameters from this study and modeled total 14C from the sensitivity analyses when we assume 25 % contribution from organics and high ablation rate scenario (Fig. S9). The thin colored lines represent the 95 % CI envelope of the model results (corresponding to the contour plot of Fig. 7a for Fig. 6a and b and the contour plot of Fig. 7b for Fig. 6c). The error bars shown in the data are 95 % CI. In Fig. 6d, the solid blue line represents the 14C profile from the modeled best-estimate ftot and σ0 under the best-estimate ablation rate. The solid red line represents the 14C profile from the sensitivity analysis when ftot and σ0 are tuned to fit the total 14C data that are scaled by 25 % to account for contribution from organics (red dots) under high ablation rate scenario (Fig. S9). The dashed red line represents the 14C profile from the sensitivity analysis when ftot is kept constant at 0.021 (which is the minimum value provided by Heisinger et al., 2002b) and σ0=0 (which provides the best-fit against the data).
3.2 14C production in sample ice parcel
We used the model for in situ cosmogenic nuclide production by muons from Balco et al. (2008) and Balco (2017; model 1A in Balco, 2017), with all relevant parameters adjusted for ice (Fig. 1). This model in turn uses the Heisinger et al. (2002a, b) parameterizations described above and the additional altitude scaling of the muon fluxes described in Balco et al. (2008). We then used a forward model that numerically integrates the total 14C in the ice sample along its flow path. For the initial condition, we assumed that, at the depth of long-term transport (zdeep), the 14C concentration in the ice parcel is at the steady state, as follows:
The steady-state assumption means that, at zdeep, the rate of radioactive decay (C0λ) is balanced by production from negative muon capture (Pneg) and fast muon reaction (Pfast). We use a 14C decay constant yr−1 for all our calculations (including the conversion of 14C units in the previous section), which corresponds to the recommended 14C half-life of 5700 years (Kutschera, 2019). For each ice parcel, we calculated the steady state, the initial 14C concentration (C0) from Eq. (6), and then used the following differential equation,
to numerically integrate the 14C concentration of the ice parcel along the flow trajectory. To avoid interference from spallogenic 14C, we only considered samples with mean depths greater than 6.85 m depth.
We sampled the parameter space in a grid search approach to obtain the best-estimate values for muogenic 14C production parameters σ0 and ftot. Using the best-estimate flow trajectory, we calculated the expected 14C in the samples corresponding to all combinations of σ0 and ftot, with each of the parameters ranging between 0 % and 100 % of the values from Heisinger et al. (2002a, b). To save computational time, we first conducted the grid search at a coarse resolution of 10 % increments (Fig. S4a). The goodness of the fit (χ2) for each simulation was calculated as follows:
where Cobs(z) is the measured total 14C, and Cexp(z) is the total 14C (14CO2 + 14CO + 14CH4; Fig. 3d) calculated by the forward model at sample depth z. To find more precise best-estimate σ0 and ftot, we conducted the grid search again at a higher resolution in 0.2 % increments from the Heisinger et al. (2002a, b) values near the χ2 minimum, between 0 and 0.0352 mb for σ0 and 0 to 0.01 for ftot (Fig. S4b).
To estimate the uncertainties in σ0 and ftot, we used a Monte Carlo sampling of model parameters. We assumed that the ablation rate uncertainties (Fig. S3) represent 2σ normally distributed uncertainties. We then perturbed the ablation rates within their uncertainties and generated a pool of 10 000 possible flow trajectories for each sample depth. However, in 69 out of 10 000 flow scenarios, the ice parcel back-trajectories hit the bedrock and became unphysical afterwards. These unphysical trajectories were removed from the pool of possible ice flow trajectories. Next, we started with the best-estimate σ0 and ftot and assumed a normally distributed and large 200 % (1σ) error for each parameter (Fig. S5a) as the prior distribution for the Monte Carlo method. We removed σ0 and ftot values that are below zero from the prior distribution because they are unphysical and conducted 100 000 Monte Carlo simulations using the forward 14C production model. For each Monte Carlo simulation, we randomly picked one of the previously generated possible ice flow trajectories and a random pair of σ0 and ftot from the generated prior distributions (Fig. S5a). We then calculated the expected 14C concentrations for each sample depth using the forward model and compared the model–data fit. We accept all pairs of σ0 and ftot values that produce the model-calculated total 14C within the 95 % CI (7.8 14C atoms per gram of ice) and 67 % CI (3.9 14C atoms per gram of ice) analytical uncertainty of the best-fit, model-calculated total 14C (black line in Fig. 6). The ranges of accepted σ0 and ftot pairs are shown in Fig. 7a as contours. The discussion about the selection of acceptance criteria for estimating σ0 and ftot uncertainties is provided in Sect. S1.4.
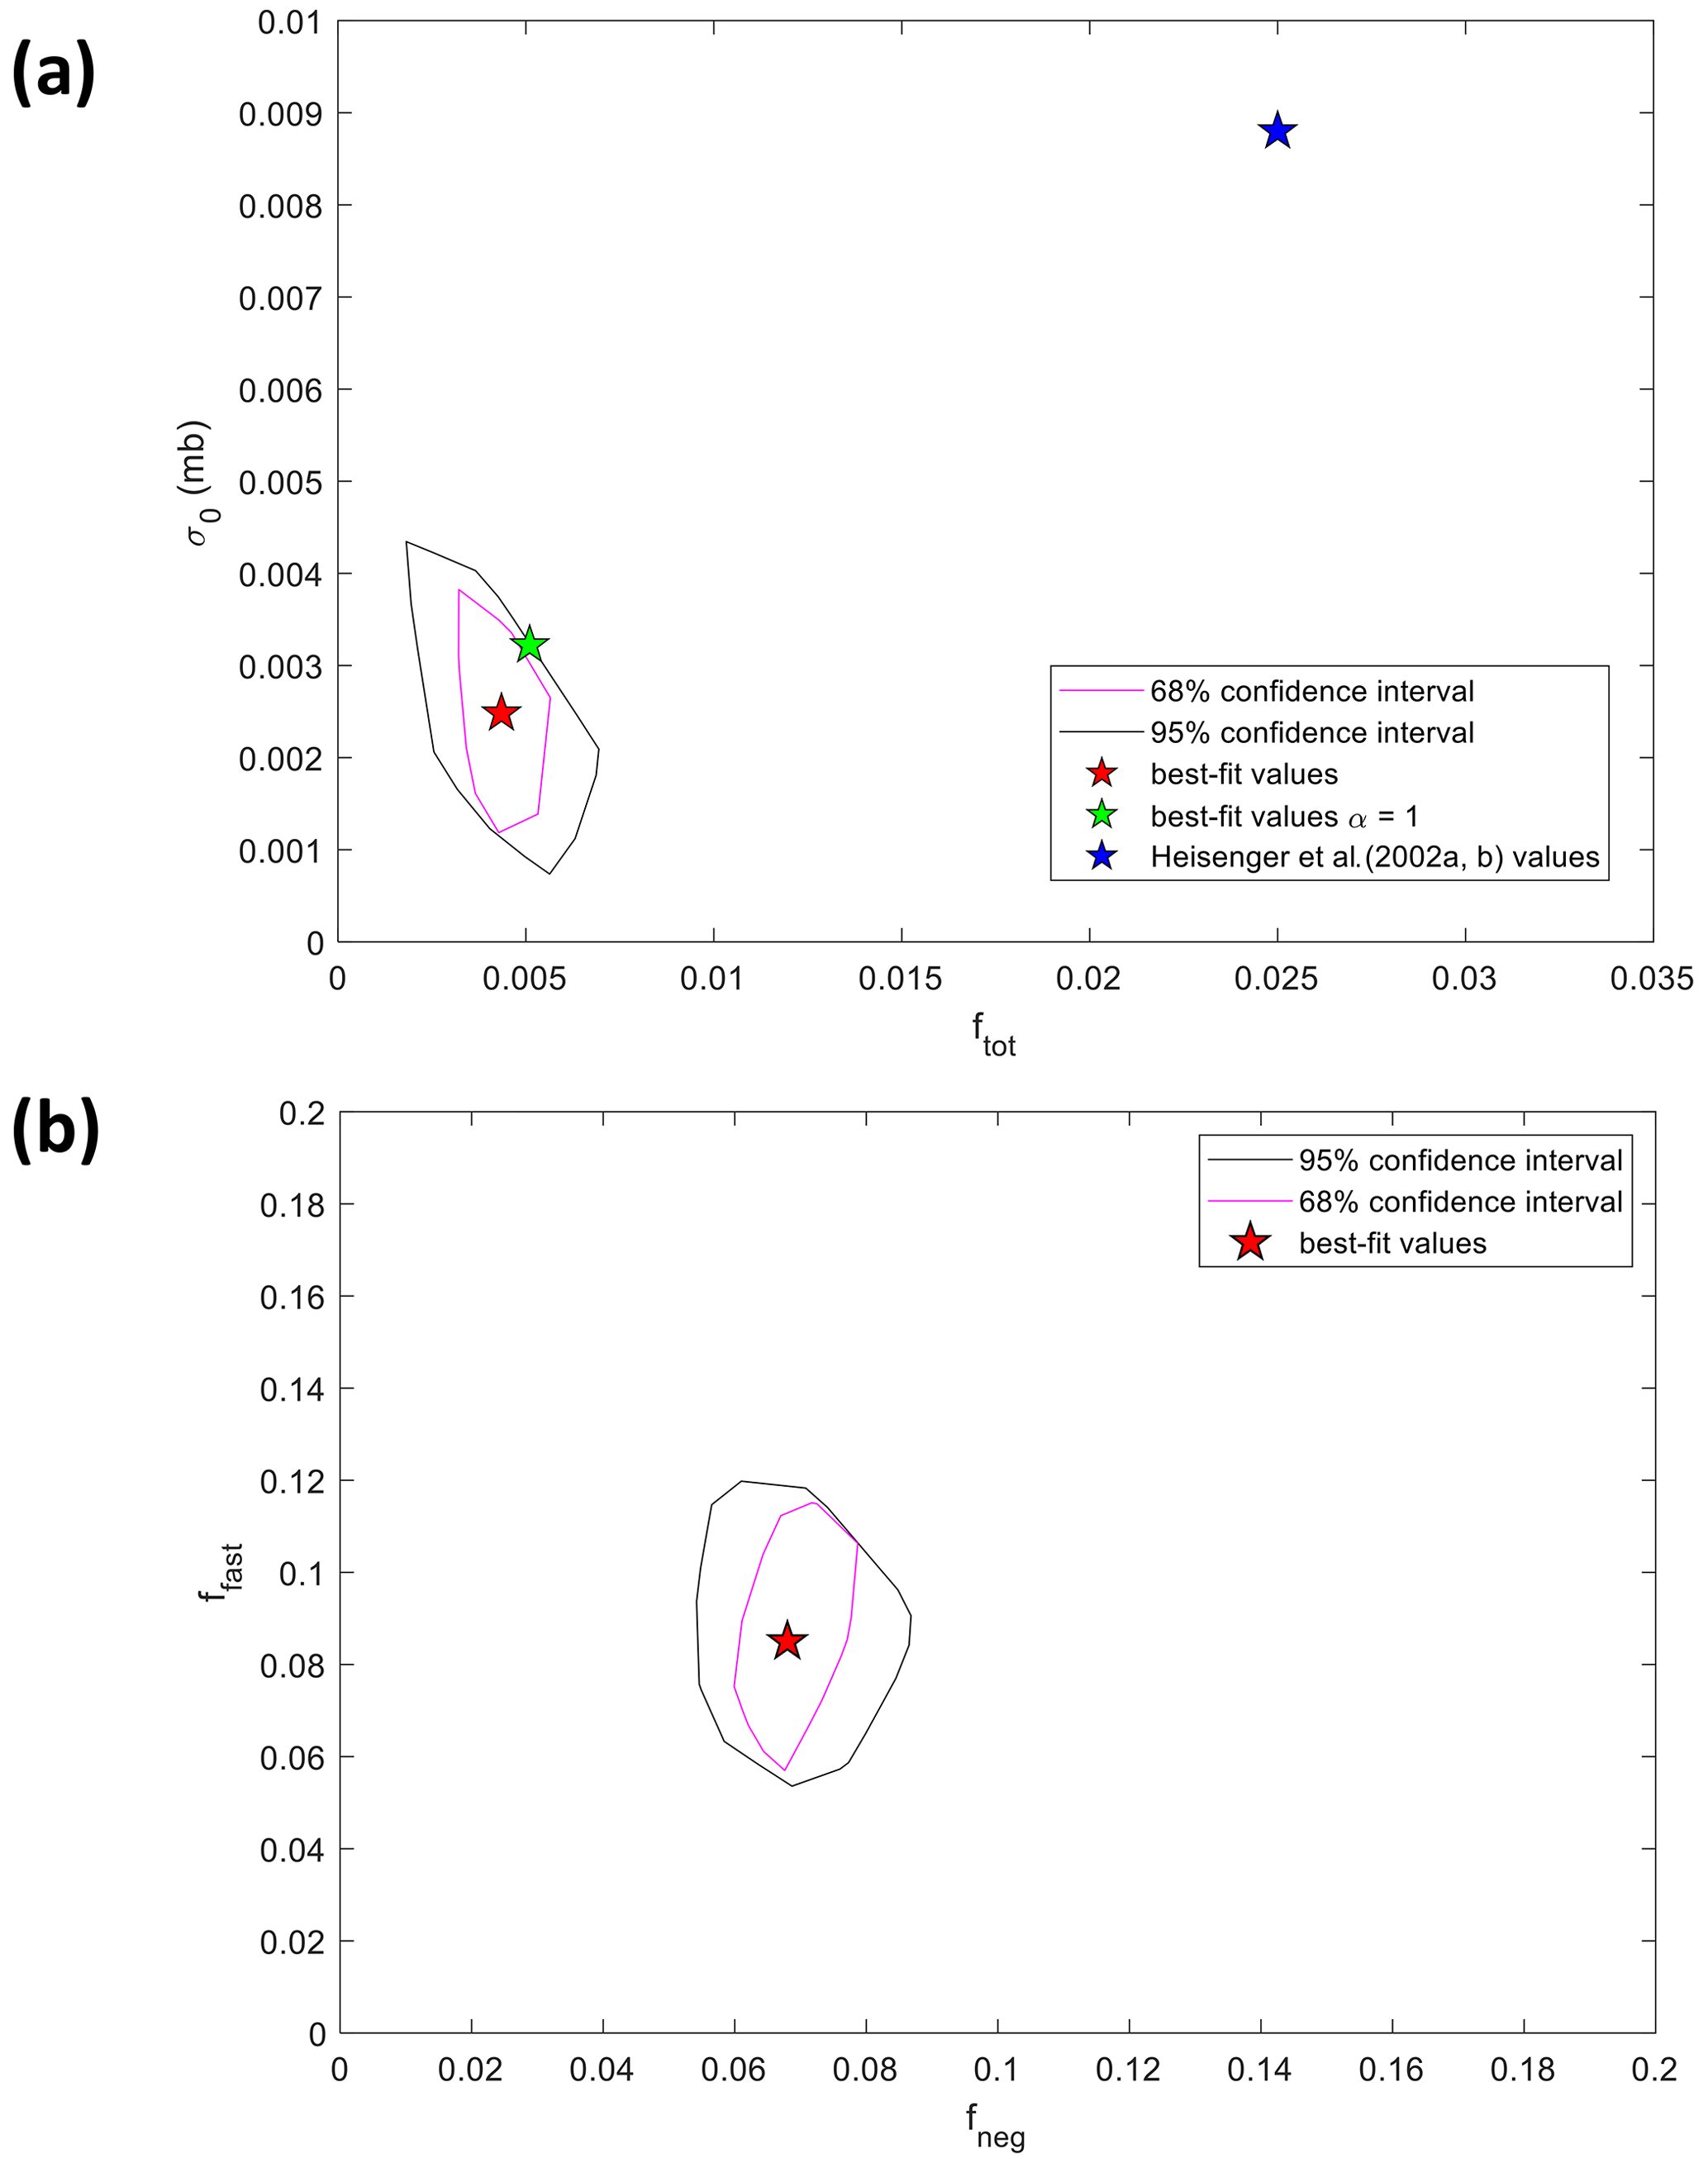
Figure 7(a) The 68 % and 95 % CI contours of accepted σ0 and ftot values for total 14C. (b) The 68 % and 95 % CI contours of accepted fneg and ffast values for 14CO (see Sect. 5.4.3). For comparison, the σ0 and ftot values from Heisinger et al. (2002a, b) are shown as a blue star. The best-fit values for σ0, ftot, fneg, and ffast are shown as a red star in both figures. The best-fit values for σ0 and ftot are when α (energy scaling in Eq. 3).
3.3 14CO production model in sample ice parcel
The in situ cosmogenic 14CO production rates in ice are of specific interest, as discussed in Sect. 1.1. To characterize the 14CO production rates, we introduced additional scaling factors fneg and ffast for negative muon and fast muon mechanisms, respectively, as tuned model parameters. The differential equation of Eq. (7) is modified into the following:
We note that Pneg and Pfast in Eq. (9) are the total 14C production rates calculated from the Balco et al. (2008) model. The scaling factors fneg and ffast each encompass two terms, i.e., one that adjusts the total 14C production rates and another that accounts for the 14CO fraction of total 14C. The determination of best-estimate fneg and ffast and their uncertainties was similar to the approach for σ0 and ftot described above. The χ2 grid search was conducted with all combinations of fneg and ffast values ranging from 0 to 0.2 at 0.001 resolution (Fig. S4c). Similar to the total 14C data, we used the average analytical uncertainty in the 14CO sample set as the acceptance criteria for the Monte Carlo simulations to estimate the uncertainties of fneg and ffast. We accepted all sets of fneg and ffast from the 100 000 Monte Carlo simulations that yielded model-predicted 14CO within 1.2 14CO molec. per gram of ice (95 % CI uncertainty) and 0.6 14CO molec. per gram of ice (68 % CI uncertainty) from the best-fit model (Fig. 8). Figure 7b shows (as contours) the accepted sets of fneg and ffast values.
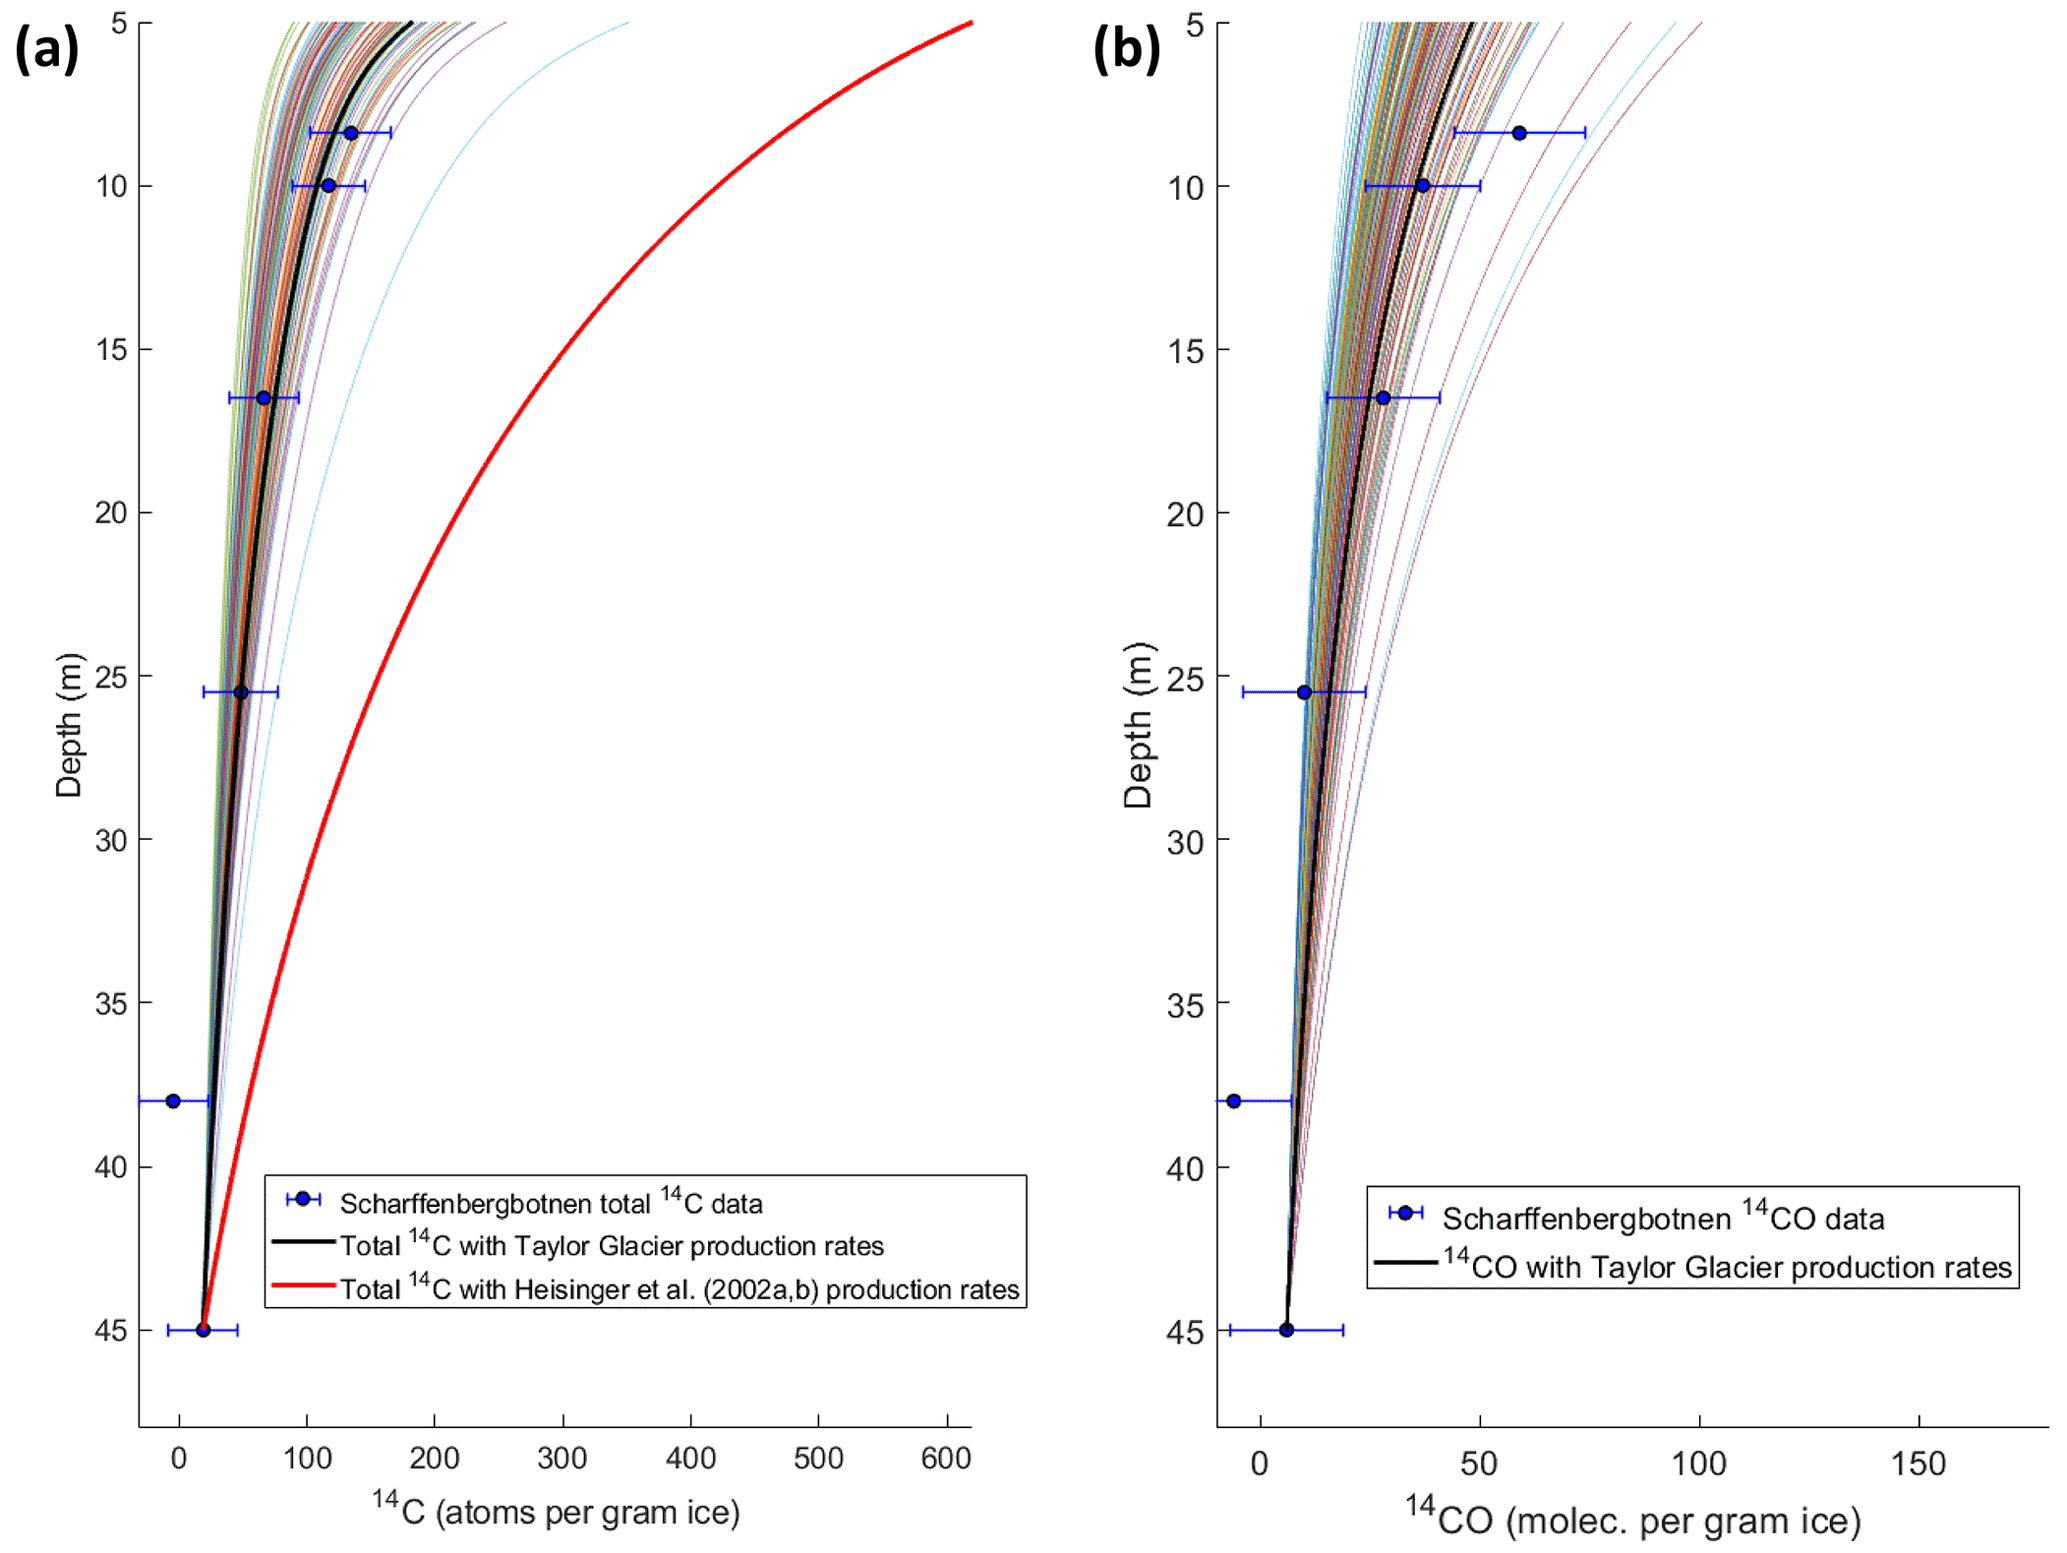
Figure 8(a) Comparison between measured total 14C from Scharffenbergbotnen, expected total 14C using the production rates inferred in this study, and expected total 14C using the Heisinger et al. (2002a, b) production rates. (b) Comparison between measured 14CO from Scharffenbergbotnen and expected 14CO, using the production rates inferred from Taylor Glacier. The colored lines in both figures represent the 95 % CI envelope of the model results. At the depths plotted in this figure (deeper than 5 m), the production from neutron-induced spallation is negligible.
3.4 Comparison with Scharffenbergbotnen ablation site
Van der Kemp et al. (2002) measured 14CO2 and 14CO in ice from the Scharffenbergbotnen ice ablation site, Antarctica. Using a 1D ablation model, we examined how the estimates of muogenic 14C production rates from Taylor Glacier compare to the Scharffenbergbotnen data. We assumed that the measured 14CO2 plus 14CO from Scharffenbergbotnen are comparable to our measurements of total 14C in Taylor Glacier (since our data show that less than 0.3 % of the total 14C from muon production forms 14CH4; Sect. 4.1). We then used the 14C concentration from the deepest Scharffenbergbotnen sample (45 m) as the initial condition. In the 1D ablation model, the Scharffenbergbotnen ice parcel moves upward at a rate () equal to the ablation rate from stake measurements (Eq. 10; cm yr−1).
The expected 14C concentration in the ice is given by the differential equation (Eq. 11), where is the 14C spallogenic production rate from Young et al. (2014; 12.0±0.9 atoms per gram of quartz per year at the surface), first scaled to the SLHL production rate in ice (20.0±1.5 atoms per gram of ice per year at the surface) accounting for the number of 16O atoms per gram of ice vs. quartz (variable N; Eq. 3; Petrenko et al., 2016) and then to the production rate at the Scharffenbergbotnen site (1173 m above sea level or m a.s.l.) using the Lifton et al. (2014) LSDn nuclide-specific model ( atoms per gram of ice per year at the surface). and are the muogenic production rates inferred from the Taylor Glacier data scaled to the elevation of Scharffenbergbotnen (1173 m a.s.l.), using the altitude scaling factors from Balco (2017). We also repeated this calculation for 14CO only to compare the muogenic 14CO production rates with the 14CO data from Scharffenbergbotnen.
4.1 Measured 14C values and partitioning of 14CO2, 14CO, and 14CH4
Table 1 and Fig. 3a–c show the depth profiles of 14CO, 14CH4, and 14CO2 after all corrections. For the 14CO2 measurements, comparison with prior results that used a wet extraction approach (Fig. S6) confirms the caveats discussed by Petrenko et al. (2016) in that their 14CO2 measurements were uncertain and represent the upper bound. The ratios from the new samples (0.0074±0.0004; 95 % CI; n=4; from all samples below 19.5 m) appear to be constant within uncertainties (Fig. 4a), which is in agreement with earlier results (0.0076±0.0004; 95 % CI; n=4) from Petrenko et al. (2016). This confirms that the two muon reactions produce 14C in a constant ratio. The 14CO and 14CO2 fractions of total 14C are also relatively constant at depth (Fig. 4b), suggesting that the two muon reactions produce all three 14C species in constant ratios.
For samples deeper than 6.85 m, on average 33.7 % (±11.4 %; 95 % CI) of the produced cosmogenic 14C becomes 14CO and 66.1 % (±11.5 %; 95 % CI) of the produced cosmogenic 14C becomes 14CO2 (Fig. b). The uncertainties of 14CO and 14CO2 fractions on the deepest samples (72 m depth) are relatively large because of the small 14CO2 signal (11.8 to 13.6 14CO2 molec. per gram of ice) relative to the uncertainty in our measurements (±7.8 14CO2 molec. per gram of ice; 95 % CI). The 14CO2 fraction in samples that are deeper than 6.85 m (0.66±0.12; 95 % CI) is also in agreement with prior reported 14CO2 fraction of 0.69 from the Scharffenbergbotnen ablation site (Van der Kemp et al., 2002). Finally, the shallow samples (<6 m ice equivalent) show higher ratios (Fig. 4a) and 14CO2 total 14C ratios. This may indicate that spallation produces higher amounts of 14CH4 and 14CO2 relative to 14CO (Petrenko et al., 2016) or that CO (and 14CO) is not well-preserved in near-surface ice of the Taylor Glacier.
At depths where production from muons dominates (>6 m), less than 0.3 % of the produced cosmogenic 14C in ice forms 14CH4 (Table 1; Fig. 4). Although the 14CH4 measurement from the 10 m depth sample is not available (Petrenko et al., 2016), we still include the 10 m data point in the total 14C dataset used to infer σ0 and ftot values and their uncertainties. The contribution from 14CH4 (which would have been on the order of ∼0.2 14CH4 molec. per gram of ice; Fig. 3b) is insignificant compared to the uncertainty in total 14C. We account for the lack of 14CH4 measurement at this depth by scaling the total 14C of the 10 m sample by a factor of 1.003±0.003 (95 % CI; Table 1).
Table 2Probability of the 14C production from stopped negative muons (ftot), reference nuclear reaction cross section for production via fast muon interactions (σ0), and total 14C production rates in ice at the surface from the two muon reactions rescaled to SLHL (sea level high latitude), using the Lifton et al. (2014) LSDn scaling. All errors shown represent the 95 % confidence interval.
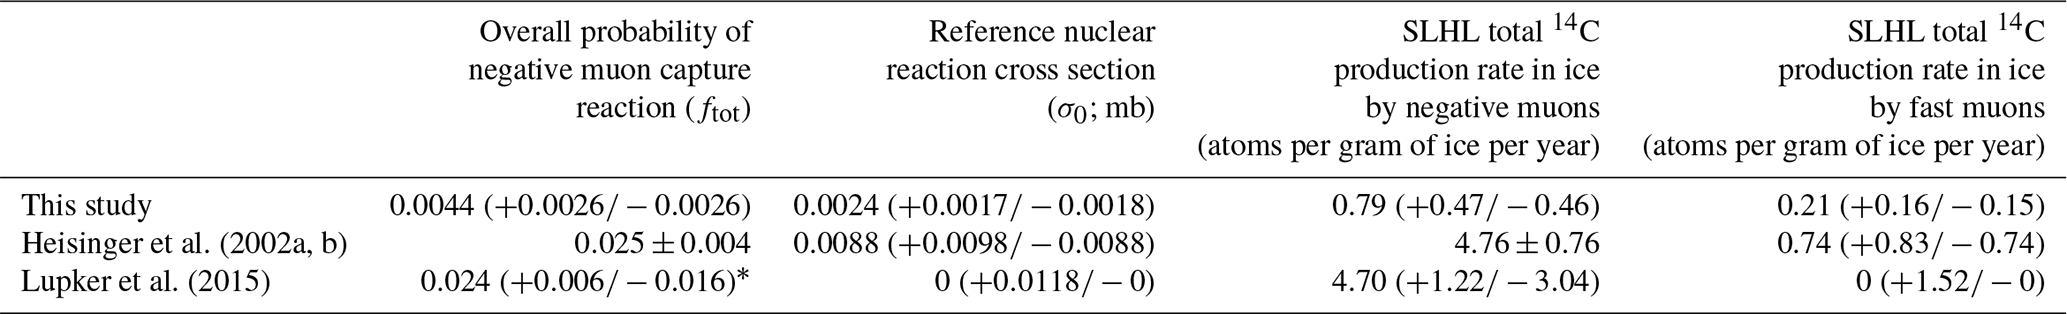
* Adjusted to ice, assuming that the chemical compound factor (fc) of ice is 1.0, and fc for quartz is 0.704 (Heisinger et al., 2002b).
4.2 Inferred muogenic 14C production rates in ice and comparison with production rates in quartz
Assuming that the majority of in situ cosmogenic 14C in ice forms 14CO2, 14CO, and 14CH4, the muogenic 14C production parameters from Heisinger et al. (2002a, b; ftot for negative muon capture and σ0 for fast muon reaction) are well outside the confidence intervals of our measurements (Table 2; Figs. 6a and 7a). Using the larger uncertainty for 14CO2 measurements obtained from step-by-step error propagation (Sect. S1.4; Fig. S7) does not change this conclusion. We calculated factors of 5.7 (3.6–13.9; 95 % CI) and 3.7 (2.0–11.9; 95 % CI) lower probability of the negative muon capture reaction (ftot) and the reference cross section for the fast muon mechanism (σ0) compared to the values given by Heisinger et al. (2002a, b).
One possible explanation for the disagreement between our results and those of Heisinger et al. (2002a, b) is that our 14C measurements (mostly either 14CO or 14CO2, as 14CH4 only constitutes <0.3 % of total 14C) might be incorrect. However, in the following we thoroughly explore this possibility and argue that it is very unlikely. Our 14CO measurements used a well-established analytical technique (e.g., Dyonisius et al., 2020; Hmiel et al., 2020; Petrenko et al., 2013, 2017, 2021). With regards to 14CO measurements in air, this analytical technique (Petrenko et al., 2021) yields comparable results to independent, atmospheric 14CO measurements from other research groups (e.g., Manning et al., 2005; Mak and Southon, 1998). We also have no reason to believe that there is a systematic loss of 14CO during the ice melting process. The ice melting (wet extraction) ensures that all 14C and CO are liberated. CO is not very soluble in water (the dissolved CO fraction at equilibrium in our system is on the order of 1 %), and we used the measured (Table S4) to correct for the solubility effects for both [CO] and [CH4]. The on-site field extraction within hours of the sample retrieval ensures that there is minimal post-coring gas loss. Finally, ice core and firn air 14CO measurements at Summit, Greenland, are consistent within uncertainties with muogenic 14CO production rates inferred from Taylor Glacier (Hmiel et al., 2020; Hmiel, 2020).
The sublimation technique used for our 14CO2 measurements also ensures the 100 % extraction efficiency of gases (Schmitt et al., 2011). We tested the system performance by sublimating BFI (bubble-free ice) samples while adding standard gases with known 14CO2 activities. As mentioned in Sect. 2.3.2, we used two standard gases with known 14CO2 activities, i.e., one with modern 14CO2 activity and the other with dead 14CO2 activity, when sublimating the BFI samples. There is neither a significant alteration in the CO2 mole fraction and 14CO2 activity of both standard gases (Table S8) nor in the CO2 mole fraction of the ice samples (Table S9), which suggests that the processes of sublimating ice and flowing gas through the system components do not result in loss of 14CO2. Finally, we can also rule out the possibility of post-coring 14CO2 loss. In a separate measurement campaign (Hmiel, 2020), we brought the sublimation system to Summit, Greenland, and sublimated the ice samples on site (within days from the time when the ice core was drilled). We compared the 14CO2 from the on-site field sublimation with the 14CO2 from depth-adjacent replicates sublimated at the University of Rochester laboratory and found that they are indistinguishable within uncertainty.
We argue that another strong indication that our measurements are robust is the good agreement with independent results from Van der Kemp et al. (2002). Van der Kemp et al. (2002) measured 14CO2 and 14CO in ice from the Scharffenbergbotnen ice ablation site using a dry extraction technique. The total measured 14C values were significantly lower than the expected values, based on the stake-measured ablation rates and muogenic production rates based on laboratory irradiations of quartz targets (Heisinger et al., 2000a, b). Van der Kemp et al. (2002) initially hypothesized that the low extraction efficiency of dry mechanical extraction (which can result in an incomplete release of the in situ produced 14C from the ice grains) might be responsible for this discrepancy. However, we used a sublimation method for our 14CO2 measurements and a melt extraction method for our 14CO measurements; both methods guarantee that all in situ cosmogenic 14C in the ice lattice is released. Figure 8 shows that the Scharffenbergbotnen data are consistent with the expected total 14C and 14CO from the Taylor-Glacier-derived production rates.
The good agreement in the ratio of 14C compounds (14CO2 fraction is 0.66±0.12 in this study and 0.69 in Van der Kemp et al., 2002) suggests that our extraction methods and analytical techniques were not systematically losing 14CO or 14CO2 (which would then bias the 14CO2 and 14CO fraction). It is theoretically possible that both our measurements and Van der Kemp et al. (2002) are wrong. However, to produce the same ratio of 14C compounds, it would require all three analytical systems from these studies to be systematically wrong in the same direction and by the same magnitude, which is highly unlikely. The good agreement between the Taylor Glacier and Scharffenbergbotnen data suggests that dry mechanical extraction used by Van der Kemp et al. (2002) is a valid technique for extracting 14CO2 and 14CO from bubbly, non-clathrated ice cores. One possible explanation is that, after production, in situ 14CO2 and 14CO quickly migrates from the ice matrix to the air bubbles. This result is consistent with previous observations that the retention of in situ cosmogenic 14C in firn grains is very low (Petrenko et al., 2013; Van der Kemp et al., 2000; Wilson and Donahue, 1990).
One way to reconcile our measurements and those of Van der Kemp et al. (2002) with the Heisinger et al. (2002a, b) production rates would be to have much higher (factor of 3 or greater) long-term (hundreds to thousands of years) ablation rates at Taylor Glacier and Scharffenbergbotnen compared to recent ablation stakes measurements. The ablation rate over the last 100 years is especially important with regards to in situ 14C production rate from negative muon capture (Fig. S9). The ablation rate at blue ice areas is controlled by climate via a combination of temperature, insolation, and wind (mainly katabatic; e.g., Bintanja, 1999). To obtain much higher long-term ablation rates at both Taylor Glacier and Scharffenbergbotnen (which are on opposite sides of Antarctica), we would need either the temperatures to have dropped sharply in the last couple of decades, the winds to have slowed dramatically, or for insolation to have sharply decreased. However, the two deep ice cores nearest to Taylor Glacier, namely Taylor Dome (Steig et al., 2000) and RICE (Roosevelt Island Climate Evaluation; Bertler et al., 2018) have not shown large climate changes in the region over the last 1000 years. The European Project for Ice Coring in Antarctica (EPICA) Dronning Maud Land (EDML) ice core drilled nearby Scharffenbergbotnen blue ice area also has not shown large climate variability in the region over the Holocene period (EPICA Community Members, 2010). The glaciological survey of Taylor Glacier also indicated that the glacier is approximately at steady state, given the stake-measured ablation rates (Kavanaugh et al., 2009a, b). The 30-year record of weather observations over the McMurdo Dry Valleys area show that the recent climate in this region has been stable (Obryk et al., 2020). Finally, a 14-year-long observation study (Sinisalo et al., 2003) over the Scharffenbergbotnen blue ice area has also shown no significant recent change in the ablation rates. We thus argue that a large decrease in ablation rates in recent years, as compared to the long-term average (over the last hundreds to thousands of years), does not seem to be a realistic explanation.
Table 314CO-specific surface production rates in ice from the two muon mechanisms normalized to the SLHL (sea level high latitude) site using the Lifton et al. (2014) LSDn scaling. All errors shown represent the 95 % confidence interval.
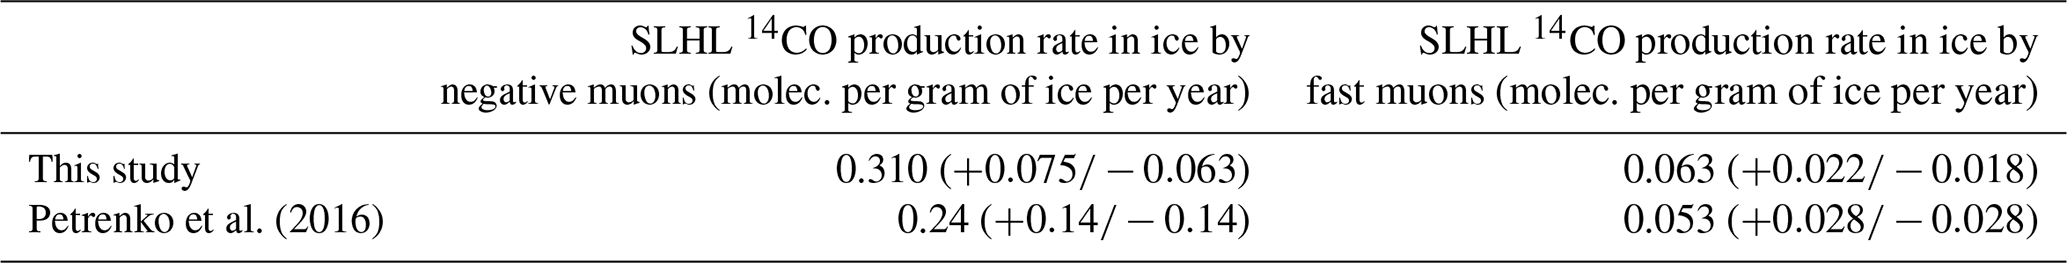
For direct comparison with other studies, we used the scaling factors from the Lifton et al. (2014) LSDn model to calculate the corresponding sea level high latitude (SLHL) total 14C and 14CO-specific production rates in ice (Tables 2 and 3). Our estimates of the 14CO-specific production rates agree with those of Petrenko et al. (2016), within errors (Table 3). Compared with the results from Petrenko et al. (2016), we also calculated a slightly smaller uncertainty in the 14CO-specific production rate by negative muon capture (Table 3). We converted the Lupker et al. (2015) estimates of ftot in quartz into ftot for ice (Table 2), using the chemical compound factors (fC) for quartz and ice from Heisinger et al. (2002b). With regards to the negative muon capture, the Lupker et al. (2015) estimate of ftot is in close agreement with Heisinger et al. (2002b; Table 2). This result is supported by Balco (2017), who refitted the Leymon High data and obtained similar ftot estimates. However, the high ftot in Lupker et al. (2015), as compared to our result, was offset by their best σ0 estimate of zero (lower than our result). For a direct comparison with results from Lupker et al. (2015), we fit our data, while forcing σ0 (and hence 14C production from fast muons) to be zero (Fig. 6b) and cannot find a scenario with reasonable model–data agreement.
Because of the relatively large uncertainty in the 14CO2 measurements, the total 14C data still allow σ0 to be close to zero, given a sufficiently large ftot (Fig. 7a). However, our 14CO data (which have much lower relative uncertainties and use a more established measurement technique) unambiguously show that σ0 and 14C production from fast muons cannot be zero (Figs. 8, 7b). As discussed in Lupker et al. (2015) and Balco (2017), the 14C data from the 15.5 m Leymon High quartzite core might not cover the depth range in which production from fast muons dominates. In contrast, when integrated over the whole flow history, production from fast muons represents the dominant source of 14C in our deeper samples. The very high-end estimate of our reference nuclear reaction cross section σ0 (for 14C production from fast muons) is still within the large uncertainty of σ0 from both Heisinger et al. (2002a) and Lupker et al. (2015; Table 2). However, our estimated total probability of negative muon capture (ftot; and hence the 14C production rate from negative muon) is well outside the confidence intervals of ftot reported by both Heisinger et al. (2002b) and Lupker et al. (2015; Table 2).
One caveat to our estimated in situ muogenic 14C production rates in ice (and that of Van der Kemp et al., 2002) is that the total 14C from the gas species we measured (14CO, 14CO2, and 14CH4) might not account for all the muogenic in situ 14C. Although 14CO2 and 14CO likely constitute the large majority (Lal et al., 1997, 2000), a small amount of in situ 14C can also form 14C-bearing organic materials. Measurements of 14C in organic carbon from alpine ice for the purpose of radiocarbon dating have shown elevated 14C values attributed to in situ cosmogenic production (Fang et al., 2021; Hoffmann, 2016). A laboratory irradiation experiment of glacier ice with an artificial neutron flux showed that 11 %–25 % of produced 14C form organic compounds (Hoffmann, 2016). Earlier work involving the irradiation of ice samples to produce 14C (e.g., Roessler et al., 1984) also found that organics accounted for a minor fraction of the total 14C. However, we are not aware of any existing studies that specifically investigated production of 14C-bearing organic materials in ice from muons. Measuring 14C in organic compounds is unfortunately beyond the scope of this study, as it requires an entirely different analytical setup.
Another possible explanation for the disagreement is that the 2D ice flow model (and thus the time-dependent exposure history of the ice parcels) might be inaccurate. In the following, we conducted sensitivity analyses to combine both uncertainties by using the +2.4σ maximum ablation rate scenario (which corresponds to the deepest physically possible ice trajectory; Fig. S8) and scaling our total 14C upward by 25 % to account for the in situ produced 14C in organics (red dots in Fig. 6d). First, we kept ftot as a constant (ftot=0.021, which is the minimum ftot from the reported uncertainty in Heisinger et al., 2002b) and tuned σ0 to fit the measurements (dashed red line in Fig. 6d) under the high ablation rate scenario. We find that the best-fit σ0 (and in situ 14C production from fast muon) is zero. The modeled total 14C under this scenario underestimates the total 14C at lower depths where production from fast muon dominates (>20 m depth) and overestimates the total 14C at depths where production from negative muon capture dominates (<20 m depth). This means that, even under these extreme scenarios, the 14C production rate from negative muon capture has to be lower than the lower-bound estimate of Heisinger et al. (2002b), and some production from fast muons is needed to compensate for the lower production rate from negative muon capture to improve the fit. We then repeated our grid search approach (Sect. 3.2) to find the best-fit ftot and σ0 that correspond to the 25 % higher total 14C and maximum ablation rate scenario (solid red line in Fig. 6d). The best-fit ftot is 0.0055, which is 22 % of the Heisinger et al., 2002b, value) and the best-fit σ0 is 0.0040 mb (which is 46 % of the Heisinger et al., 2002a, value). We note that these values are within uncertainties in our original best-fit ftot and σ0 (Table 2) and still cannot be reconciled with values from Heisinger et al. (2002a, b). We conclude that additional uncertainties from the ice flow history and 14C contribution from organics likely cannot reconcile the difference between the negative muon capture 14C production rate inferred by our data and that of Heisinger et al. (2002b).
In their experimental determination of the 14C production rate by fast muons, Heisinger et al. (2002a) used a single muon energy of 190 GeV (σ(E)). The reference nuclear reaction cross section at 1 GeV (σ0) was then scaled using the following equation:
where α is a power factor that describes the energy dependence of the cross section (unitless). However, the mean muon energy () of 190 GeV used by Heisinger et al. (2002a) and the muon flux intensity were much higher than those expected in the first few hundred meters of ice in natural settings (for the top 200 m of Taylor Glacier, GeV; Fig. S10). It may be possible that the power factor α of 0.75 is incorrect. Balco (2017) has tried fitting the calibration data with α=1 (which simplifies Eq. 12 into a linear relationship between σ and E). Following Balco (2017), we conducted a sensitivity analysis, fitting our data with similar methods to those described above but with α=1. Increasing α from 0.75 to 1, while keeping σ0 constant, reduces the overall 14C production rate from fast muons (Fig. S13). To compensate for the lower production rate from fast muons, the new best-fit σ0 is now 0.0032 mb, which is 29.8 % higher than the best-fit σ0 when α=0.75 and 36.6 % that of Heisinger et al. (2002b) value. The best-fit ftot (overall probability of 14C production from negative muon capture) becomes 0.0051, which is 17.2 % higher than the best-fit ftot when α=0.75 and 20.4 % that of Heisinger et al. (2002a) value (Fig. 7a). These values are within the uncertainties in the ftot and σ0 derived with α=0.75 that we presented (Table 2; Fig. 7a) and still cannot be reconciled with original Heisinger et al. (2002a, b) values.
This study presents 14CO2 measurements in ablating ice obtained via a new ice sublimation technique, combined with 14CO and 14CH4 measurements obtained from a well-established large-volume melt–extraction method to estimate the species-specific and total in situ muogenic 14C production rates in ice. Under the assumption that the majority of in situ 14C in ice exists as 14CO, 14CO2, and 14CH4, we estimated lower muogenic in situ 14C production rates in ice (by a factor of 5.7 (3.6–13.9) and 3.7 (2.0–11.9) with 95 % CI for negative muon capture and fast muon interactions, respectively) compared to values inferred from laboratory irradiation experiments (Heisinger et al., 2002a, b) and measurements in quartz (Lupker et al., 2015; Balco 2017). Prior ice core measurements from Scharffenbergbotnen (Van der Kemp et al., 2002) obtained with an independent technique also appear to be consistent with these lower muogenic 14C production rates in ice. This comparison with the Van der Kemp et al. (2002) results also suggests that a dry extraction technique appears to release essentially all in situ 14C in bubbly (non-clathrated) ice.
At present, there does not appear to be a way to reconcile our Taylor Glacier ice core results and the independent ice core measurements from Scharffenbergbotnen (Van der Kemp et al., 2002) with the muogenic 14C production rates determined in quartz (Heisinger et al., 2002a, b; Lupker et al., 2015). This is a problem that needs further investigation, and we recommend that future studies address this via laboratory muon irradiation experiments involving both ice and quartz targets and studies that include a quantification of the organic fraction of muogenic 14C in ice.
Finally, the constraints on muogenic 14C production rates in ice and the partitioning between the in situ produced 14C-bearing gas species provided by this study will allow for future measurements of 14C-containing gases in other ice cores to be used for several applications, including using 14CO2 measurements for the absolute dating of the bubbles in ice cores (Andree et al., 1984; Van De Wal et al., 1994) and using 14CO measurements to either constrain the past oxidative capacity of the atmosphere (Brenninkmeijer et al., 1992; Petrenko et al., 2021) or reconstruct the past cosmic ray flux (BenZvi et al., 2019).
Data from this work will be made available through the U.S. Antarctic Program Data Center (https://www.usap-dc.org/view/project/p0000283, Dyonisius and Petrenko, 2023).
The supplement related to this article is available online at: https://doi.org/10.5194/tc-17-843-2023-supplement.
VVP, EJB, and JPS designed the study. MND and VVP conducted field logistical preparations. MND, VVP, PN, AMS, JAM, SAS, HR, BB, EJB, and JRM conducted the field sampling, on-site sample cutting, and processing. MND, VVP, AMS, and PN extracted the large air samples using the on-site large-volume melter. MND extracted the CH4 and CO from large air samples. BH, VVP, MND, and PFP developed and tested the sublimation system with input from JS. MND extracted the CO2 using the newly built sublimation system, with assistance from BH and PFP. QH and BY graphitized the 14C samples. AMS conducted the 14C measurements. CA and JAM conducted the CH4 CFA measurements under the supervision of EJB. CA developed the age scale under the supervision of EJB. SEM and IV made the δ13C-CH4 stable isotopes measurements. JPS did the , , and measurements. RB made the δ15N2, δ18Oatm, , , and measurements. CH did the [CH4] and halogenated trace gas measurements under the supervision of RFW. MK made the discrete [CH4] mole fraction and total air content measurements. IV did the δ13CO measurement for the CO dilution gas. CB developed the ice flow model. MND developed the 14C production model, with input from CB and VVP. MND, BH, and VVP analyzed the results and wrote the paper, with input from all co-authors.
The contact author has declared that none of the authors has any competing interests.
Publisher’s note: Copernicus Publications remains neutral with regard to jurisdictional claims in published maps and institutional affiliations.
We thank Mike Jayred of the U.S. Ice Drilling Program (IDP), for ice drilling, camp manager Kathy Schroeder, for assistance in the field, and the United States Antarctic Program (USAP), for logistical support. We thank Emily Mesiti, for her assistance in the Rochester ice core lab during the sublimation extraction campaign. This work has been supported by the U.S. NSF awards (grant nos. PLR-1245659 for VVP, PLR-1245821 for EJB, and PLR-1246148 for JPS) and the Packard Fellowship for Science and Engineering (VVP).
This research has been supported by the Office of Polar Programs (grant nos. PLR-1245659, PLR-1245821, and PLR-1246148).
This paper was edited by Benjamin Smith and reviewed by Greg Balco, Nathaniel A. Lifton, and one anonymous referee.
Ahn, J., Brook, E. J., and Howell, K.: A high-precision method for measurement of paleoatmospheric CO2 in small polar ice samples, J. Glaciol., 55, 499–506, 2009.
Andree, M., Moor, E., Beer, J., Oeschger, H., Stauffer, B., Bonani, G., Hofmann, H. J., Morenzoni, E., Nessi, M., and Suter, M.: 14C dating of polar ice, Nucl. Instrum. Meth. B, 5, 385–388, 1984.
Baggenstos, D., Bauska, T. K., Severinghaus, J. P., Lee, J. E., Schaefer, H., Buizert, C., Brook, E. J., Shackleton, S., and Petrenko, V. V.: Atmospheric gas records from Taylor Glacier, Antarctica, reveal ancient ice with ages spanning the entire last glacial cycle, Clim. Past, 13, 943–958, https://doi.org/10.5194/cp-13-943-2017, 2017.
Baggenstos D., Severinghaus J. P., Mulvaney R., McConnell J. R., Sigl M., Maselli O., Petit J.-R., Grente B., and Steig E. J.: A horizontal ice core from Taylor Glacier, its implications for Antarctic climate history, and an improved Taylor Dome ice core time scale, Paleoceanogr. Paleoclimatol., 33, 778–794, 2018.
Balbas, A. M. and Farley, K. A.: Constraining in situ cosmogenic nuclide paleo-production rates using sequential lava flows during a paleomagnetic field strength low, Chem. Geol., 532, 119355, https://doi.org/10.1016/j.chemgeo.2019.119355, 2020.
Balco, G.: Production rate calculations for cosmic-ray-muon-produced 10Be and 26Al benchmarked against geological calibration data, Quat. Geochronol., 39, 150–173, 2017.
Balco, G.: Glacier change and paleoclimate applications of cosmogenic-nuclide exposure dating, Annu. Rev. Earth. Pl. Sc., 48, 21–48, 2020.
Balco, G., Stone, J. O., Lifton, N. A., and Dunai, T. J.: A complete and easily accessible means of calculating surface exposure ages or erosion rates from 10Be and 26Al measurements, Quat. Geochronol., 3, 174–195, 2008.
Bauska, T. K., Baggenstos, D., Brook, E. J., Mix, A. C., Marcott, S. A., Petrenko, V. V., Schaefer, H., Severinghaus, J. P., and Lee, J. E.: Carbon isotopes characterize rapid changes in atmospheric carbon dioxide during the last deglaciation, P. Natl. Acad. Sci. USA, 113, 3465–3470, 2016.
BenZvi, S., Petrenko, V. V., Hmiel, B., Dyonisius, M., Smith, A. M., Yang, B., and Hua, Q.: Obtaining a History of the Flux of Cosmic Rays using In Situ Cosmogenic 14C Trapped in Polar Ice, arXiv [preprint], https://doi.org/10.48550/arXiv.1909.07994, 2019.
Bereiter, B., Stocker, T. F., and Fischer, H.: A centrifugal ice microtome for measurements of atmospheric CO2 on air trapped in polar ice cores, Atmos. Meas. Tech., 6, 251–262, https://doi.org/10.5194/amt-6-251-2013, 2013.
Bereiter, B., Eggleston, S., Schmitt, J., Nehrbass-Ahles, C., Stocker, T. F., Fischer, H., Kipfstuhl, S., and Chappellaz, J.: Revision of the EPICA Dome C CO2 record from 800 to 600 kyr before present, Geophys. Res. Lett., 42, 541–549, 2015.
Bereiter, B., Kawamura, K., and Severinghaus, J. P.: New Methods for Measuring Atmospheric Heavy Noble Gas Isotope and Elemental Ratios in Ice Core Samples, Rapid. Commun. Mass. Sp., 32, 801–814, 2018.
Bertler, N. A. N., Conway, H., Dahl-Jensen, D., Emanuelsson, D. B., Winstrup, M., Vallelonga, P. T., Lee, J. E., Brook, E. J., Severinghaus, J. P., Fudge, T. J., Keller, E. D., Baisden, W. T., Hindmarsh, R. C. A., Neff, P. D., Blunier, T., Edwards, R., Mayewski, P. A., Kipfstuhl, S., Buizert, C., Canessa, S., Dadic, R., Kjær, H. A., Kurbatov, A., Zhang, D., Waddington, E. D., Baccolo, G., Beers, T., Brightley, H. J., Carter, L., Clemens-Sewall, D., Ciobanu, V. G., Delmonte, B., Eling, L., Ellis, A., Ganesh, S., Golledge, N. R., Haines, S., Handley, M., Hawley, R. L., Hogan, C. M., Johnson, K. M., Korotkikh, E., Lowry, D. P., Mandeno, D., McKay, R. M., Menking, J. A., Naish, T. R., Noerling, C., Ollive, A., Orsi, A., Proemse, B. C., Pyne, A. R., Pyne, R. L., Renwick, J., Scherer, R. P., Semper, S., Simonsen, M., Sneed, S. B., Steig, E. J., Tuohy, A., Venugopal, A. U., Valero-Delgado, F., Venkatesh, J., Wang, F., Wang, S., Winski, D. A., Winton, V. H. L., Whiteford, A., Xiao, C., Yang, J., and Zhang, X.: The Ross Sea Dipole – temperature, snow accumulation and sea ice variability in the Ross Sea region, Antarctica, over the past 2700 years, Clim. Past, 14, 193–214, https://doi.org/10.5194/cp-14-193-2018, 2018.
Bintanja, R.: On the glaciological, meteorological, and climatological significance of Antarctic blue ice areas, Rev. Geophys., 37, 337–359, https://doi.org/10.1029/1999RG900007, 1999.
Bliss, A. K., Cuffey, K. M., and Kavanaugh, J. L.: Sublimation and surface energy budget of Taylor Glacier, Antarctica, J. Glaciol., 57, 684–696, 2011.
Brenninkmeijer, C. A. M., Manning, M. R., Lowe, D. C., Wallace, G., Sparks, R. J., and Volz-Thomas, A.: Interhemispheric asymmetry in OH abundance inferred from measurements of atmospheric 14CO, Nature, 356, 50–52, 1992.
Buizert, C.: ICE CORE METHODS – Studies of Firn Air, in: Encyclopedia of Quaternary Science (Second Edition), edited by: Mock, S. A. E. J., Elsevier, Amsterdam, 361–372, https://doi.org/10.1016/B978-0-444-53643-3.00330-7, 2013.
Buizert, C., Petrenko, V. V., Kavanaugh, J. L., Cuffey, K. M., Lifton, N. A., Brook, E. J., and Severinghaus, J. P.: In situ cosmogenic radiocarbon production and 2-D ice flow line modeling for an Antarctic blue ice area, J. Geophys. Res., 117, F2, https://doi.org/10.1029/2011JF002086, 2012.
Buizert, C., Sowers, T., and Blunier, T.: Assessment of diffusive isotopic fractionation in polar firn, and application to ice core trace gas records, Earth. Planet. Sc. Lett., 361, 110–119, 2013.
Buizert, C., Baggenstos, D., Jiang, W., Purtschert, R., Petrenko, V. V., Lu, Z.-T., Müller, P., Kuhl, T., Lee, J., Severinghaus, J. P., and Brook, E. J.: Radiometric 81Kr dating identifies 120,000-year-old ice at Taylor Glacier, Antarctica, P. Natl. Aacad. Sci. USA, 111, 6876–6881, 2014.
Delmas, R. J., Ascencio, J.-M., and Legrand, M.: Polar ice evidence that atmospheric CO2 20,000 yr BP was 50 % of present, Nature, 284, 155–157, 1980.
Dyonisius, M. N. and Petrenko, V.: Taylor Glacier in situ cosmogenic 14C data, U.S. Antarctic Program (USAP) Data Center [data set], https://www.usap-dc.org/view/project/p0000283, last access: 16 February 2023.
Dyonisius, M. N., Petrenko, V. V., Smith, A. M., Hua, Q., Yang, B., Schmitt, J., Beck, J., Seth, B., Bock, M., Hmiel, B., Vimont, I., Menking, J. A., Shackleton, S. A., Baggenstos, D., Bauska, T. K., Rhodes, R. H., Sperlich, P., Beaudette, R., Harth, C., Kalk, M., Brook, E. J., Fischer, H., Severinghaus, J. P., and Weiss, R. F.: Old carbon reservoirs were not important in the deglacial methane budget, Science, 367, 907–910, https://doi.org/10.1126/science.aax0504, 2020.
EPICA Community Members: Stable oxygen isotopes of ice core EDML, PANGAEA, https://doi.org/10.1594/PANGAEA.754444, 2010.
Fang, L., Jenk, T. M., Singer, T., Hou, S., and Schwikowski, M.: Radiocarbon dating of alpine ice cores with the dissolved organic carbon (DOC) fraction, The Cryosphere, 15, 1537–1550, https://doi.org/10.5194/tc-15-1537-2021, 2021.
Fenton, C. R., Niedermann, S., Dunai, T., and Binnie, S. A.: The SPICE project: Production rates of cosmogenic 21Ne, 10Be, and 14C in quartz from the 72 ka SP basalt flow, Quat. Geochronol., 54, 101019, https://doi.org/10.1016/j.quageo.2019.101019, 2019.
Fireman, E. L. and Norris, T. L.: Ages and composition of gas trapped in Allan Hills and Byrd core ice, Earth Planet. Sc. Lett., 60, 339–350, https://doi.org/10.1016/0012-821X(82)90072-3, 1982.
Gosse, J. C. and Phillips, F. M.: Terrestrial in situ cosmogenic nuclides: theory and application, Quaternary Sci. Rev., 20, 1475–1560, 2001.
Heisinger, B., Lal, D., Jull, A. J. T., Kubik, P., Ivy-Ochs, S., Neumaier, S., Knie, K., Lazarev, V., and Nolte, E.: Production of selected cosmogenic radionuclides by muons: 1. Fast muons, Earth. Planet. Sc. Lett., 200, 345–355, 2002a.
Heisinger, B., Lal, D., Jull, A. J. T., Kubik, P., Ivy-Ochs, S., Knie, K., and Nolte, E.: Production of selected cosmogenic radionuclides by muons: 2. Capture of negative muons, Earth. Planet. Sc. Lett., 200, 357–369, 2002b.
Herron, M. M. and Langway, C. C.: Firn densification: an empirical model, J. Glaciol., 25, 373–385, 1980.
Hippe, K.: Constraining processes of landscape change with combined in situ cosmogenic 14C-10Be analysis, Quaternary Sci. Rev., 173, 1–19, 2017.
Hippe, K. and Lifton, N. A.: Calculating Isotope Ratios and Nuclide Concentrations for In Situ Cosmogenic 14C Analyses, Radiocarbon, 56, 1167–1174, 2014.
Hmiel, B.: A Study of In Situ Cosmogenic 14C and Paleoatmospheric 14CH4 From Accumulating Ice at Summit, Greenland, PhD Thesis, University of Rochester, https://search.proquest.com/openview/35ca42e03ab8952d735e2962e9fcd3cc/1?pq-origsite=gscholar&cbl=18750&diss=y (last access: 27 January 2023), 2020.
Hmiel, B., Petrenko, V. V., Dyonisius, M., Buizert, C., Smith, A. M., Place, P. F., Harth, C. M., Beaudette, R., Hua, Q., Yang, B., Vimont, I., Michel, S. E., Severinghaus, J. P., Etheridge, D. M., Bromley, T. M., Schmitt, J., Fain, X., Weiss, R. F., and Dlugokencky, E. J.: Preindustrial 14CH4 indicates that anthropogenic fossil CH4 emissions are underestimated, Nature, 578, 409–412, 2020.
Hoffmann, M.: Micro radiocarbon dating of the particulate organic carbon fraction in Alpine glacier ice: method refinement, critical evaluation and dating applications, PhD Dissertation, University of Heidelberg, http://archiv.ub.uni-heidelberg.de/volltextserver/20712/1/Dissertation_Helene_Hoffmann.pdf (last access: 27 January 2023), 2016.
Hogg, A. G., Heaton, T. J., Hua, Q., Palmer, J. G., Turney, C. S., Southon, J., Bayliss, A., Blackwell, P. G., Boswijk, G., and Ramsey, C. B.: SHCal20 Southern Hemisphere calibration, 0–55,000 years cal BP, Radiocarbon, 62, 759–778, 2020.
Jull, A. T., Lal, D., Donahue, D. J., Mayewski, P., Lorius, C., Raynaud, D., and Petit, J. R.: Measurements of cosmic-ray-produced 14C in firn and ice from Antarctica, Nucl. Instrum. Meth. B, 92, 326–330, 1994.
Kavanaugh, J. L. and Cuffey, K. M.: Dynamics and mass balance of Taylor Glacier, Antarctica: 2. Force balance and longitudinal coupling, J. Geophys. Res., 114, F04011, https://doi.org/10.1029/2009JF001329, 2009.
Kavanaugh, J. L., Cuffey, K. M., Morse, D. L., Conway, H., and Rignot, E.: Dynamics and mass balance of Taylor Glacier, Antarctica: 1. Geometry and surface velocities, J. Geophys. Res., 114, F04010, https://doi.org/10.1029/2009JF001309, 2009a.
Kavanaugh, J. L., Cuffey, K. M., Morse, D. L., Bliss, A. K., and Aciego, S. M.: Dynamics and mass balance of Taylor Glacier, Antarctica: 3. State of mass balance, J. Geophys. Res., 114, F04012, https://doi.org/10.1029/2009JF001331, 2009b.
Kuhl, T. W., Johnson, J. A., Shturmakov, A. J., Goetz, J. J., Gibson, C. J., and Lebar, D. A.: A new large-diameter ice-core drill: the Blue Ice Drill, Ann. Glaciol., 55, 1–6, 2014.
Kutschera, W.: The Half-Life of 14C–Why Is It So Long?, Radiocarbon, 61, 1135–1142, 2019.
Lal, D. and Jull, A. J. T.: On determining ice accumulation rates in the past 40,000 years using in situ cosmogenic 14C, Geophys. Res. Lett., 17, 1303–1306, 1990.
Lal, D. and Peters, B.: Cosmic Ray Produced Radioactivity on the Earth, in: Kosmische Strahlung II/Cosmic Rays II, edited by: Sitte, K., Springer Berlin Heidelberg, Berlin, Heidelberg, 551–612, https://doi.org/10.1007/978-3-642-46079-1_7, 1967.
Lal, D., Jull, A. J. T., Donahue, D. J., Burtner, D., and Nishiizumi, K.: Polar ice ablation rates measured using in situ cosmogenic 14C, Nature, 346, 350–352, 1990.
Lal, D., Jull, A. T., Burr, G. S., and Donahue, D. J.: Measurements of in situ 14C concentrations in Greenland Ice Sheet Project 2 ice covering a 17-kyr time span: Implications to ice flow dynamics, J. Geophys. Res.-Oceans, 102, 26505–26510, 1997.
Lal, D., Jull, A. J. T., Burr, G. S., and Donahue, D. J.: On the characteristics of cosmogenic in situ 14C in some GISP2 Holocene and late glacial ice samples, Nucl. Instrum. Meth. B, 172, 623–631, 2000.
Lal, D., Jull, A. J. T., Donahue, D. J., Burr, G. S., Deck, B., Jouzel, J., and Steig, E.: Record of cosmogenic in situ produced 14C in Vostok and Taylor Dome ice samples: Implications for strong role of wind ventilation processes, J. Geophys. Res., 106, 31933–31941, 2001.
Lee, J. E., Edwards, J. S., Schmitt, J., Fischer, H., Bock, M., and Brook, E. J.: Excess methane in Greenland ice cores associated with high dust concentrations, Geochim. Cosmochim. Ac., 270, 409–430, 2020.
Lifton, N., Sato, T., and Dunai, T. J.: Scaling in situ cosmogenic nuclide production rates using analytical approximations to atmospheric cosmic-ray fluxes, Earth. Planet. Sc. Lett, 386, 149–160, 2014.
Lifton, N., Caffee, M., Finkel, R., Marrero, S., Nishiizumi, K., Phillips, F. M., Goehring, B., Gosse, J., Stone, J., Schaefer, J., Theriault, B., Jull, A. J. T., and Fifield, K.: In situ cosmogenic nuclide production rate calibration for the CRONUS-Earth project from Lake Bonneville, Utah, shoreline features, Quat. Geochronol., 26, 56–69, 2015.
Lupker, M., Hippe, K., Wacker, L., Kober, F., Maden, C., Braucher, R., Bourlès, D., Romani, J. R. V., and Wieler, R.: Depth-dependence of the production rate of in situ 14C in quartz from the Leymon High core, Spain, Quat. Geochronol., 28, 80–87, 2015.
Lüthi, D., Le Floch, M., Bereiter, B., Blunier, T., Barnola, J.-M., Siegenthaler, U., Raynaud, D., Jouzel, J., Fischer, H., Kawamura, K., and Stocker, T. F.: High-resolution carbon dioxide concentration record 650,000–800,000 years before present, Nature, 453, 379, https://doi.org/10.1038/nature06949, 2008.
Mak, J. E. and Southon, J. R.: Assessment of tropical OH seasonality using atmospheric 14CO measurements from Barbados, Geophys. Res. Lett., 25, 2801–2804, 1998.
Manning, M. R., Lowe, D. C., Moss, R. C., Bodeker, G. E., and Allan, W.: Short-term variations in the oxidizing power of the atmosphere, Nature, 436, 1001, https://doi.org/10.1038/nature03900, 2005.
Obryk, M. K., Doran, P. T., Fountain, A. G., Myers, M., and McKay, C. P.: Climate From the McMurdo Dry Valleys, Antarctica, 1986–2017: Surface Air Temperature Trends and Redefined Summer Season, J. Geophys. Res.-Atmos., 125, e2019JD032180, https://doi.org/10.1029/2019JD032180, 2020.
Petrenko, V. V., Severinghaus, J. P., Smith, A. M., Riedel, K., Baggenstos, D., Harth, C., Orsi, A., Hua, Q., Franz, P., Takeshita, Y., Brailsford, G. W., Weiss, R. F., Buizert, C., Dickson, A., and Schaefer, H.: High-precision 14C measurements demonstrate production of in situ cosmogenic 14CH4 and rapid loss of in situ cosmogenic 14CO in shallow Greenland firn, Earth Planet. Sc. Lett., 365, 190–197, https://doi.org/10.1016/j.epsl.2013.01.032, 2013.
Petrenko, V. V., Smith, A. M., Schaefer, H., Riedel, K., Brook, E., Baggenstos, D., Harth, C., Hua, Q., Buizert, C., Schilt, A., Fain, X., Mitchell, L., Bauska, T., Orsi, A., Weiss, R. F., and Severinghaus, J. P.: Minimal geological methane emissions during the Younger Dryas–Preboreal abrupt warming event, Nature, 548, 443–446, https://doi.org/10.1038/nature23316, 2017.
Petrenko, V. V., Smith, A. M., Crosier, E. M., Kazemi, R., Place, P., Colton, A., Yang, B., Hua, Q., and Murray, L. T.: An improved method for atmospheric 14CO measurements, Atmos. Meas. Tech., 14, 2055–2063, https://doi.org/10.5194/amt-14-2055-2021, 2021.
Sinisalo, A., Moore, J. C., Wal, R. S. W. V. D., Bintanja, R., and Jonsson, S.: A 14 year mass-balance record of a blue-ice area in Antarctica, Ann. Glaciol., 37, 213–218, https://doi.org/10.3189/172756403781816013, 2003.
Steig, E. J., Morse, D. L., Waddington, E. D., Stuiver, M., Grootes, P. M., Mayewski, P. A., Twickler, M. S., and Whitlow, S. I.: Wisconsinan and Holocene Climate History from an Ice Core at Taylor Dome, Western Ross Embayment, Antarctica, Geogr. Ann. A, 82, 213–235, https://doi.org/10.1111/j.0435-3676.2000.00122.x, 2000.
Menking, J. A., Brook, E. J., Shackleton, S. A., Severinghaus, J. P., Dyonisius, M. N., Petrenko, V., McConnell, J. R., Rhodes, R. H., Bauska, T. K., Baggenstos, D., Marcott, S., and Barker, S.: Spatial pattern of accumulation at Taylor Dome during Marine Isotope Stage 4: stratigraphic constraints from Taylor Glacier, Clim. Past, 15, 1537–1556, https://doi.org/10.5194/cp-15-1537-2019, 2019.
Miller, J. B., Mack, K. A., Dissly, R., White, J. W., Dlugokencky, E. J., and Tans, P. P.: Development of analytical methods and measurements of 13C/12C in atmospheric CH4 from the NOAA Climate Monitoring and Diagnostics Laboratory Global Air Sampling Network, J. Geophys. Res-Atmos, 107, https://doi.org/10.1029/2001JD000630, 2002.
Mitchell, L., Brook, E., Lee, J. E., Buizert, C., and Sowers, T.: Constraints on the Late Holocene Anthropogenic Contribution to the Atmospheric Methane Budget, Science, 342, 964–966, 2013.
Mitchell, L. E., Brook Edward J., Sowers Todd, McConnell J. R., and Taylor Kendrick: Multidecadal variability of atmospheric methane, 1000–1800 C.E., J. Geophys. Res.-Biogeo., 116, https://doi.org/10.1029/2010JG001441, 2011.
Morse D. L., Waddington E. D., and Steig E. J.: Ice Age storm trajectories inferred from radar stratigraphy at Taylor Dome, Antarctica, Geophys. Res. Lett., 25, 3383–3386, 1998.
Obryk, M. K., Doran, P. T., Fountain, A. G., Myers, M., and McKay, C. P.: Climate From the McMurdo Dry Valleys, Antarctica, 1986–2017: Surface Air Temperature Trends and Redefined Summer Season, J. Geophys. Res.-Atmos., 125, https://doi.org/10.1029/2019JD032180, 2020.
Pendleton, S., Miller, G., Lifton, N., and Young, N.: Cryosphere response resolves conflicting evidence for the timing of peak Holocene warmth on Baffin Island, Arctic Canada, Quaternary Sci. Rev., 216, 107–115, 2019.
Petrenko, V. V., Smith, A. M., Brook, E. J., Lowe, D., Riedel, K., Brailsford, G., Hua, Q., Schaefer, H., Reeh, N., Weiss, R. F., Etheridge, D., and Severinghaus, J. P.: 14CH4 Measurements in Greenland Ice: Investigating Last Glacial Termination CH4 Sources, Science, 324, 506–508, 2009.
Petrenko, V. V., Severinghaus, J. P., Smith, A. M., Riedel, K., Baggenstos, D., Harth, C., Orsi, A., Hua, Q., Franz, P., Takeshita, Y., Brailsford, G. W., Weiss, R. F., Buizert, C., Dickson, A., and Schaefer, H.: High-precision 14C measurements demonstrate production of in situ cosmogenic 14CH4 and rapid loss of in situ cosmogenic 14CO in shallow Greenland firn, Earth. Planet. Sc. Lett., 365, 190–197, 2013.
Petrenko, V. V., Severinghaus, J. P., Schaefer, H., Smith, A. M., Kuhl, T., Baggenstos, D., Hua, Q., Brook, E. J., Rose, P., Kulin, R., Bauska, T., Harth, C., Buizert, C., Orsi, A., Emanuele, G., Lee, J. E., Brailsford, G., Keeling, R., and Weiss, R. F.: Measurements of 14C in ancient ice from Taylor Glacier, Antarctica constrain in situ cosmogenic 14CH4 and 14CO production rates, Geochim. Cosmochim. Ac., 177, 62–77, 2016.
Petrenko, V. V., Smith, A. M., Schaefer, H., Riedel, K., Brook, E., Baggenstos, D., Harth, C., Hua, Q., Buizert, C., Schilt, A., Fain, X., Mitchell, L., Bauska, T., Orsi, A., Weiss, R. F., and Severinghaus, J. P.: Minimal geological methane emissions during the Younger Dryas–Preboreal abrupt warming event, Nature, 548, 443–446, 2017.
Petrenko, V. V., Smith, A. M., Crosier, E. M., Kazemi, R., Place, P., Colton, A., Yang, B., Hua, Q., and Murray, L. T.: An improved method for atmospheric 14CO measurements, Atmos. Meas. Tech., 14, 2055–2063, https://doi.org/10.5194/amt-14-2055-2021, 2021.
Prinn, R. G., Weiss, R. F., Krummel, P. B., O'Doherty, S., Fraser, P., Muhle, J., Reimann, S., Vollmer, M., Simmonds, P. G., and Malone, M.: The ALE/GAGE/AGAGE Network, Massachusetts Institute of Technology, Cambridge, MA (USA), https://doi.org/10.3334/CDIAC/atg.db1001, 2008.
Raynaud, D., Delmas, R., Ascencio, J. M., and Legrand, M.: Gas Extraction From Polar Ice Cores: A Critical Issue For Studying The Evolution of Atmospheric CO2 and Ice-Sheet Surface Elevation, Ann. Glaciol., 3, 265–268, 1982.
Reimer, P. J., Austin, W. E., Bard, E., Bayliss, A., Blackwell, P. G., Ramsey, C. B., Butzin, M., Cheng, H., Edwards, R. L., and Friedrich, M.: The IntCal20 northern hemisphere radiocarbon age calibration curve (0–55 cal kBP), Radiocarbon, 62, 725–757, 2020.
Rhodes, R. H., Faïn, X., Stowasser, C., Blunier, T., Chappellaz, J., McConnell, J. R., Romanini, D., Mitchell, L. E., and Brook, E. J.: Continuous methane measurements from a late Holocene Greenland ice core: Atmospheric and in-situ signals, Earth. Planet. Sc. Lett., 368, 9–19, 2013.
Roessler, K., Jung, H.-J., and Nebeling, B.: Hot atoms in cosmic chemistry, Adv. Space Res., 4.12, 83–95, 1984.
Schilt, A., Brook, E. J., Bauska, T. K., Baggenstos, D., Fischer, H., Joos, F., Petrenko, V. V., Schaefer, H., Schmitt, J., Severinghaus, J. P., Spahni, R., and Stocker, T. F.: Isotopic constraints on marine and terrestrial N2O emissions during the last deglaciation, Nature, 516, 234–237, 2014.
Schmitt, J., Schneider, R., and Fischer, H.: A sublimation technique for high-precision measurements of δ13CO2 and mixing ratios of CO2 and N2O from air trapped in ice cores, Atmos. Meas. Tech., 4, 1445–1461, https://doi.org/10.5194/amt-4-1445-2011, 2011.
Shackleton, S., Baggenstos, D., Menking, J. A., Dyonisius, M. N., Bereiter, B., Bauska, T. K., Rhodes, R. H., Brook, E. J., Petrenko, V. V., McConnell, J. R., Kellerhals, T., Häberli, M., Schmitt, J., Fischer, H., and Severinghaus, J. P.: Global ocean heat content in the Last Interglacial, Nat. Geosci., 13, 77–81, 2020.
Siegenthaler, U., Stocker, T. F., Monnin, E., Lüthi, D., Schwander, J., Stauffer, B., Raynaud, D., Barnola, J.-M., Fischer, H., and Masson-Delmotte, V.: Stable carbon cycle–climate relationship during the late Pleistocene, Science, 310, 1313–1317, 2005.
Sinisalo, A., Moore, J. C., Wal, R. S. W. V. D., Bintanja, R., and Jonsson, S.: A 14 year mass-balance record of a blue-ice area in Antarctica, Ann. Glaciol., 37, 213–218, 2003.
Skov, D. S., Egholm, D. L., Jansen, J. D., Sandiford, M., and Knudsen, M. F.: Detecting landscape transience with in situ cosmogenic 14C and 10Be, Quat. Geochronol., 54, 101008, https://doi.org/10.1016/j.quageo.2019.101008, 2019.
Smith, A. M., Levchenko, V. A., Etheridge, D. M., Lowe, D. C., Hua, Q., Trudinger, C. M., Zoppi, U., and Elcheikh, A.: In search of in-situ radiocarbon in Law Dome ice and firn, Nucl. Instrum. Meth. B, 172, 610–622, 2000.
Smith, A. M., Hua, Q., Williams, A., Levchenko, V., and Yang, B.: Developments in micro-sample 14C AMS at the ANTARES AMS facility, Nucl. Instrum. Meth. B, 268, 919–923, 2010.
Sowers, T., Bender, M., Raynaud, D., and Korotkevich, Y. S.: δ15N of N2 in air trapped in polar ice: A tracer of gas transport in the firn and a possible constraint on ice age-gas age differences, J. Geophys. Res., 97, 15683–15697, 1992.
Spector, P., Stone, J., and Goehring, B.: Thickness of the divide and flank of the West Antarctic Ice Sheet through the last deglaciation, The Cryosphere, 13, 3061–3075, https://doi.org/10.5194/tc-13-3061-2019, 2019.
Steig, E. J., Morse, D. L., Waddington, E. D., Stuiver, M., Grootes, P. M., Mayewski, P. A., Twickler, M. S., and Whitlow, S. I.: Wisconsinan and Holocene Climate History from an Ice Core at Taylor Dome, Western Ross Embayment, Antarctica, Geogr. Ann. A., 82, 213–235, 2000.
van De Wal, R. S. W., Van Roijen, J. J., Raynaud, D., Van der Borg, K., De Jong, A. F. M., Oerlemans, J., Lipenkov, V., and Huybrechts, P.: From 14C/12C measurements towards radiocarbon dating of ice, Tellus B, 46, 94–102, 1994.
van De Wal, R. S. W., Meijer, H. A. J., De Rooij, M., and Van der Veen, C.: Radiocarbon analyses along the EDML ice core in Antarctica, Tellus B, 59, 157–165, 2007.
Van der Kemp, W. J. M., Alderliesten, C., Van der Borg, K., Holmlund, P., de Jong, A. F. M., Karlöf, L., Lamers, R. A. N., Oerlemans, J., Thomassen, M., and Van de Wal, R. S. W.: Very little in situ produced radiocarbon retained in accumulating Antarctic ice, Nucl. Instrum. Meth. B, 172, 632–636, 2000.
Van der Kemp, W. J. M., Alderliesten, C., Van der Borg, K., De Jong, A. F. M., Lamers, R. A. N., Oerlemans, J., Thomassen, M., and Van De Wal, R. S. W.: In situ produced 14C by cosmic ray muons in ablating Antarctic ice, Tellus B, 54, 186–192, 2002.
van Roijen, J. J., Bintanja, R., Van der Borg, K., van den Broeke, M. R., de Jong, A. F. M., and Oerlemans, J.: Dry extraction of 14CO2 and 14CO from Antarctic ice, Nuclear Instruments and Methods in Physics Research Section B: Beam Interactions with Materials and Atoms, Nucl. Instrum. Meth. B, 92, 331–334, 1994.
Vimont, I.: Carbon Monoxide Stable Isotopes: Extraction Technique Development and Urban Atmospheric Analysis, PhD Thesis, University of Colorado Boulder, https://www.proquest.com/docview/1985027740?pq-origsite=gscholar&fromopenview=true (last access: 27 January 2023), 2017.
Wilson, A. T. and Donahue, D. J.: The recovery and dating of carbon dioxide in polar ice cores, Radiocarbon, 31, 579–584, 1989.
Wilson, A. T. and Donahue, D. J.: AMS carbon-14 dating of ice: progress and future prospects, Nucl. Instrum. Meth. B, 52, 473–476, https://doi.org/10.1016/0168-583X(90)90460-C, 1990.
Wilson, A. T. and Long, A.: New approaches to CO2 analysis in polar ice cores, J. Geophys. Res.-Oceans, 102, 26601–26606, 1997.
Yang, B. and Smith, A. M.: Conventionally Heated Microfurnace for the Graphitization of Microgram-Sized Carbon Samples, Radiocarbon, 59, 859–873, 2017.
Zumbrunn, R., Neftel, A., and Oeschger, H.: CO2 measurements on 1-cm3 ice samples with an IR laserspectrometer (IRLS) combined with a new dry extraction device, Earth. Planet. Sc. Lett., 60, 318–324, 1982.