the Creative Commons Attribution 4.0 License.
the Creative Commons Attribution 4.0 License.
 | 13 Feb 2023
Antarctic sea ice regime shift associated with decreasing zonal symmetry in the Southern Annular Mode
Serena Schroeter
Terence J. O'Kane
Paul A. Sandery
Across the long-term (∼43-year) satellite record, Antarctic sea ice extent shows a small overall circumpolar increase, resulting from opposing regional sea ice concentration anomalies. Running short-term samples of the same sea ice concentration data, however, show that the long-term trend pattern is dominated by the earliest years of the satellite record. Compensating regional anomalies diminish over time, and in the most recent decade, these tend towards spatial homogeneity instead. Running 30-year trends show the regional pattern of sea ice behaviour reversing over time; while in some regions, trend patterns abruptly shift in line with the record anomalous sea ice behaviour of recent years, in other regions a steady change predates these record anomalies. The shifting trend patterns in many regions are co-located with enhanced north–south flow due to an increasingly wave-3-like structure of the Southern Annular Mode. Sea surface temperature anomalies also shift from a circumpolar cooling to a regional pattern that resembles the increasingly asymmetric structure of the Southern Annular Mode, with warming in regions of previously increasing sea ice such as the Ross Sea.
- Article
(11677 KB) - Full-text XML
-
Supplement
(629 KB) - BibTeX
- EndNote


Contrary to expectations of sea ice coverage under a warming climate, sea ice in the Southern Ocean has not decreased over the satellite record as it has in the Arctic Ocean; rather, large diametrically opposed regional sea ice trends have resulted in a small overall increase in Antarctic sea ice extent (Turner et al., 2015; Simmonds, 2015; Parkinson, 2019; Comiso et al., 2017). A small, steady increase in areal coverage between 1979–1999 was followed by an accelerated increase between 2000–2014 (Meehl et al., 2019), culminating in record high sea ice extent in 2014 (Comiso et al., 2017) before an unprecedentedly steep spring retreat in 2016 (Turner et al., 2017), as well as record low ice between 2017 and 2019 (Parkinson, 2019; Raphael and Handcock, 2022). While Antarctic sea ice returned to near-average coverage in 2020, sea ice extent during the summer of 2021–2022 reached the lowest point of the ∼43-year satellite record (Raphael and Handcock, 2022; Wang et al., 2022; Turner et al., 2022). Sea ice is sensitive to changes in and interactions between the atmosphere and ocean (Hobbs et al., 2016), and indeed both atmospheric and oceanic influences have been identified to help explain the recent erratic behaviour (Turner et al., 2017; Stuecker et al., 2017; Wang et al., 2019, 2022; Schlosser et al., 2018, 2020; Meehl et al., 2019). However, consensus is still lacking for not only the processes and mechanisms driving historical sea ice trends but also the dominant drivers of internal variability (Eayrs et al., 2019, 2021). Low confidence is currently placed in the simulation of mean and historical Antarctic sea ice in global coupled climate models, which tend not to accurately capture the spatial heterogeneity or the seasonality of observed sea ice trends (Turner et al., 2013a; Hobbs et al., 2016; Eayrs et al., 2019). The disparity between simulated and observed sea ice is further complicated by the non-linearity of sea ice trends on both short-term and decadal scales (Handcock and Raphael, 2020; Eayrs et al., 2021). Additionally, the extent to which internal variability can account for the observed increase (as well as the disparity between observed and simulated trends) remains contested (Turner et al., 2013a; Mahlstein et al., 2013; Shu et al., 2015, 2020; Roach et al., 2020).
Recent examinations of Antarctic sea ice cover have generally considered the mean state and trends over the long-term, continuous satellite record (e.g. Eayrs et al., 2021; Raphael and Handcock, 2022; Parkinson, 2019). Climatological averaging smooths internal variability (which for Antarctic sea ice is known to be high) and is taken as being reflective of the expected background state of Antarctic sea ice from which anomalies can be calculated. In a stationary or slowly evolving variable, the climatological estimate can quite closely align with data points throughout the averaging period (Livezey et al., 2007). However, if significant trends exist in the averaging period, the background estimate may not be a realistic expectation from which future projections can be calculated (Arguez and Vose, 2011). It has long been noted that significant trends have existed during periods of the satellite record (Parkinson, 2019; Handcock and Raphael, 2020; Eayrs et al., 2021), which potentially shift the background estimate over time. Sea ice is strongly affected by atmospheric changes such as temperature, for which shorter 15-year temporal averages for climatological norms have been suggested (Arguez and Vose, 2011). Furthermore, while much of the literature reviewing Antarctic sea ice condenses metrics such as extent or areal cover into spatial averages or sums, as either a circumpolar total or a sector-based approach utilizing geographical constraints (e.g. Zwally et al., 1983; Parkinson and Cavalieri, 2012; Parkinson, 2019) or spatial autocorrelation dividing sea ice into regions of distinct interannual variability (e.g. Raphael and Hobbs, 2014), Antarctic sea ice trends are spatially heterogeneous, and large-scale averaging may neglect important small-scale regional trend characteristics.
This study presents a detailed examination of the temporal and spatial changes in Antarctic sea ice variability, comparing 15-year running samples of sea ice concentration with samples of large-scale atmospheric and oceanic variability patterns. Data and methods are described in Sect. 2, with results illustrated in Sect. 3. A discussion and concluding remarks are presented in Sect. 4.
The monthly mean passive microwave satellite sea ice concentration data from the Climate Data Record are obtained from the National Snow and Ice Data Center (NSIDC), encompassing January 1979–May 2021 (Meier et al., 2021b; Peng et al., 2013). This time series is then supplemented with monthly averages of the daily near-real-time Climate Data Record (Meier et al., 2021a) for June–December 2021. Satellite data are obtained on the native equal-area 25 km polar stereographic grid (https://nsidc.org/data/ease, last access: 9 February 2023). In order to obtain estimates of sea ice area and extent at each longitude point, the sea ice concentration (SIC) data are reprojected and regridded onto a regular 1∘ latitude by 1∘ longitude grid. Following convention, at each longitude, sea ice extent (SIE) is calculated as the sum of the product of grid cell area for cells with at least 15 % ice coverage, and sea ice area (SIA) is calculated as the sum of the product of grid cell area and ice area fraction (e.g. Roach et al., 2020).
Monthly averaged mean sea level pressure (SLP) between January 1979–December 2021 from the Japanese Meteorological Agency (JMA) global atmospheric reanalysis JRA-55 (Kobayashi et al., 2015) is obtained from the Research Data Archive at the National Center for Atmospheric Research, Computational and Information Systems Laboratory (https://doi.org/10.5065/D60G3H5B, JMA, 2013). Sea surface temperature (SST) data are obtained from the Met Office Hadley Centre (https://www.metoffice.gov.uk/hadobs/hadisst/, last access: 9 February 2023) Sea Ice and Sea Surface Temperature dataset version 2 (HadISST.2.2.0.0, hereafter HadISST2; Titchner and Rayner, 2014). HadISST2 is provided by the Met Office on a 1∘ latitude by 1∘ longitude grid; the 1.25∘ JRA-55 data are regridded onto the same grid for consistency in comparing with SIC and SST.
To prepare data for analysis, each dataset is sliced into running 15-year (e.g. January 1979–December 1993, January 1980–December 1994) or 30-year samples depending on the context, from which climatological means and monthly anomalies are calculated. Eigenvectors are produced via empirical orthogonal analysis (EOF) to show patterns of maximum variance in SIC, SIA, and SLP; these EOF patterns are calculated from monthly and seasonal anomalies from means of the 15-year samples (following detrending and weighting by cosine of latitude to compensate for the convergence of meridians near the pole). Trends are calculated using linear least-squares regression, and the resulting residual variance and standard error calculations are modified to account for temporal autocorrelation using an effective sample size based on lag-1 autocorrelation coefficients (Santer et al., 2000 is statistically significant are shown by overlaid stippling.
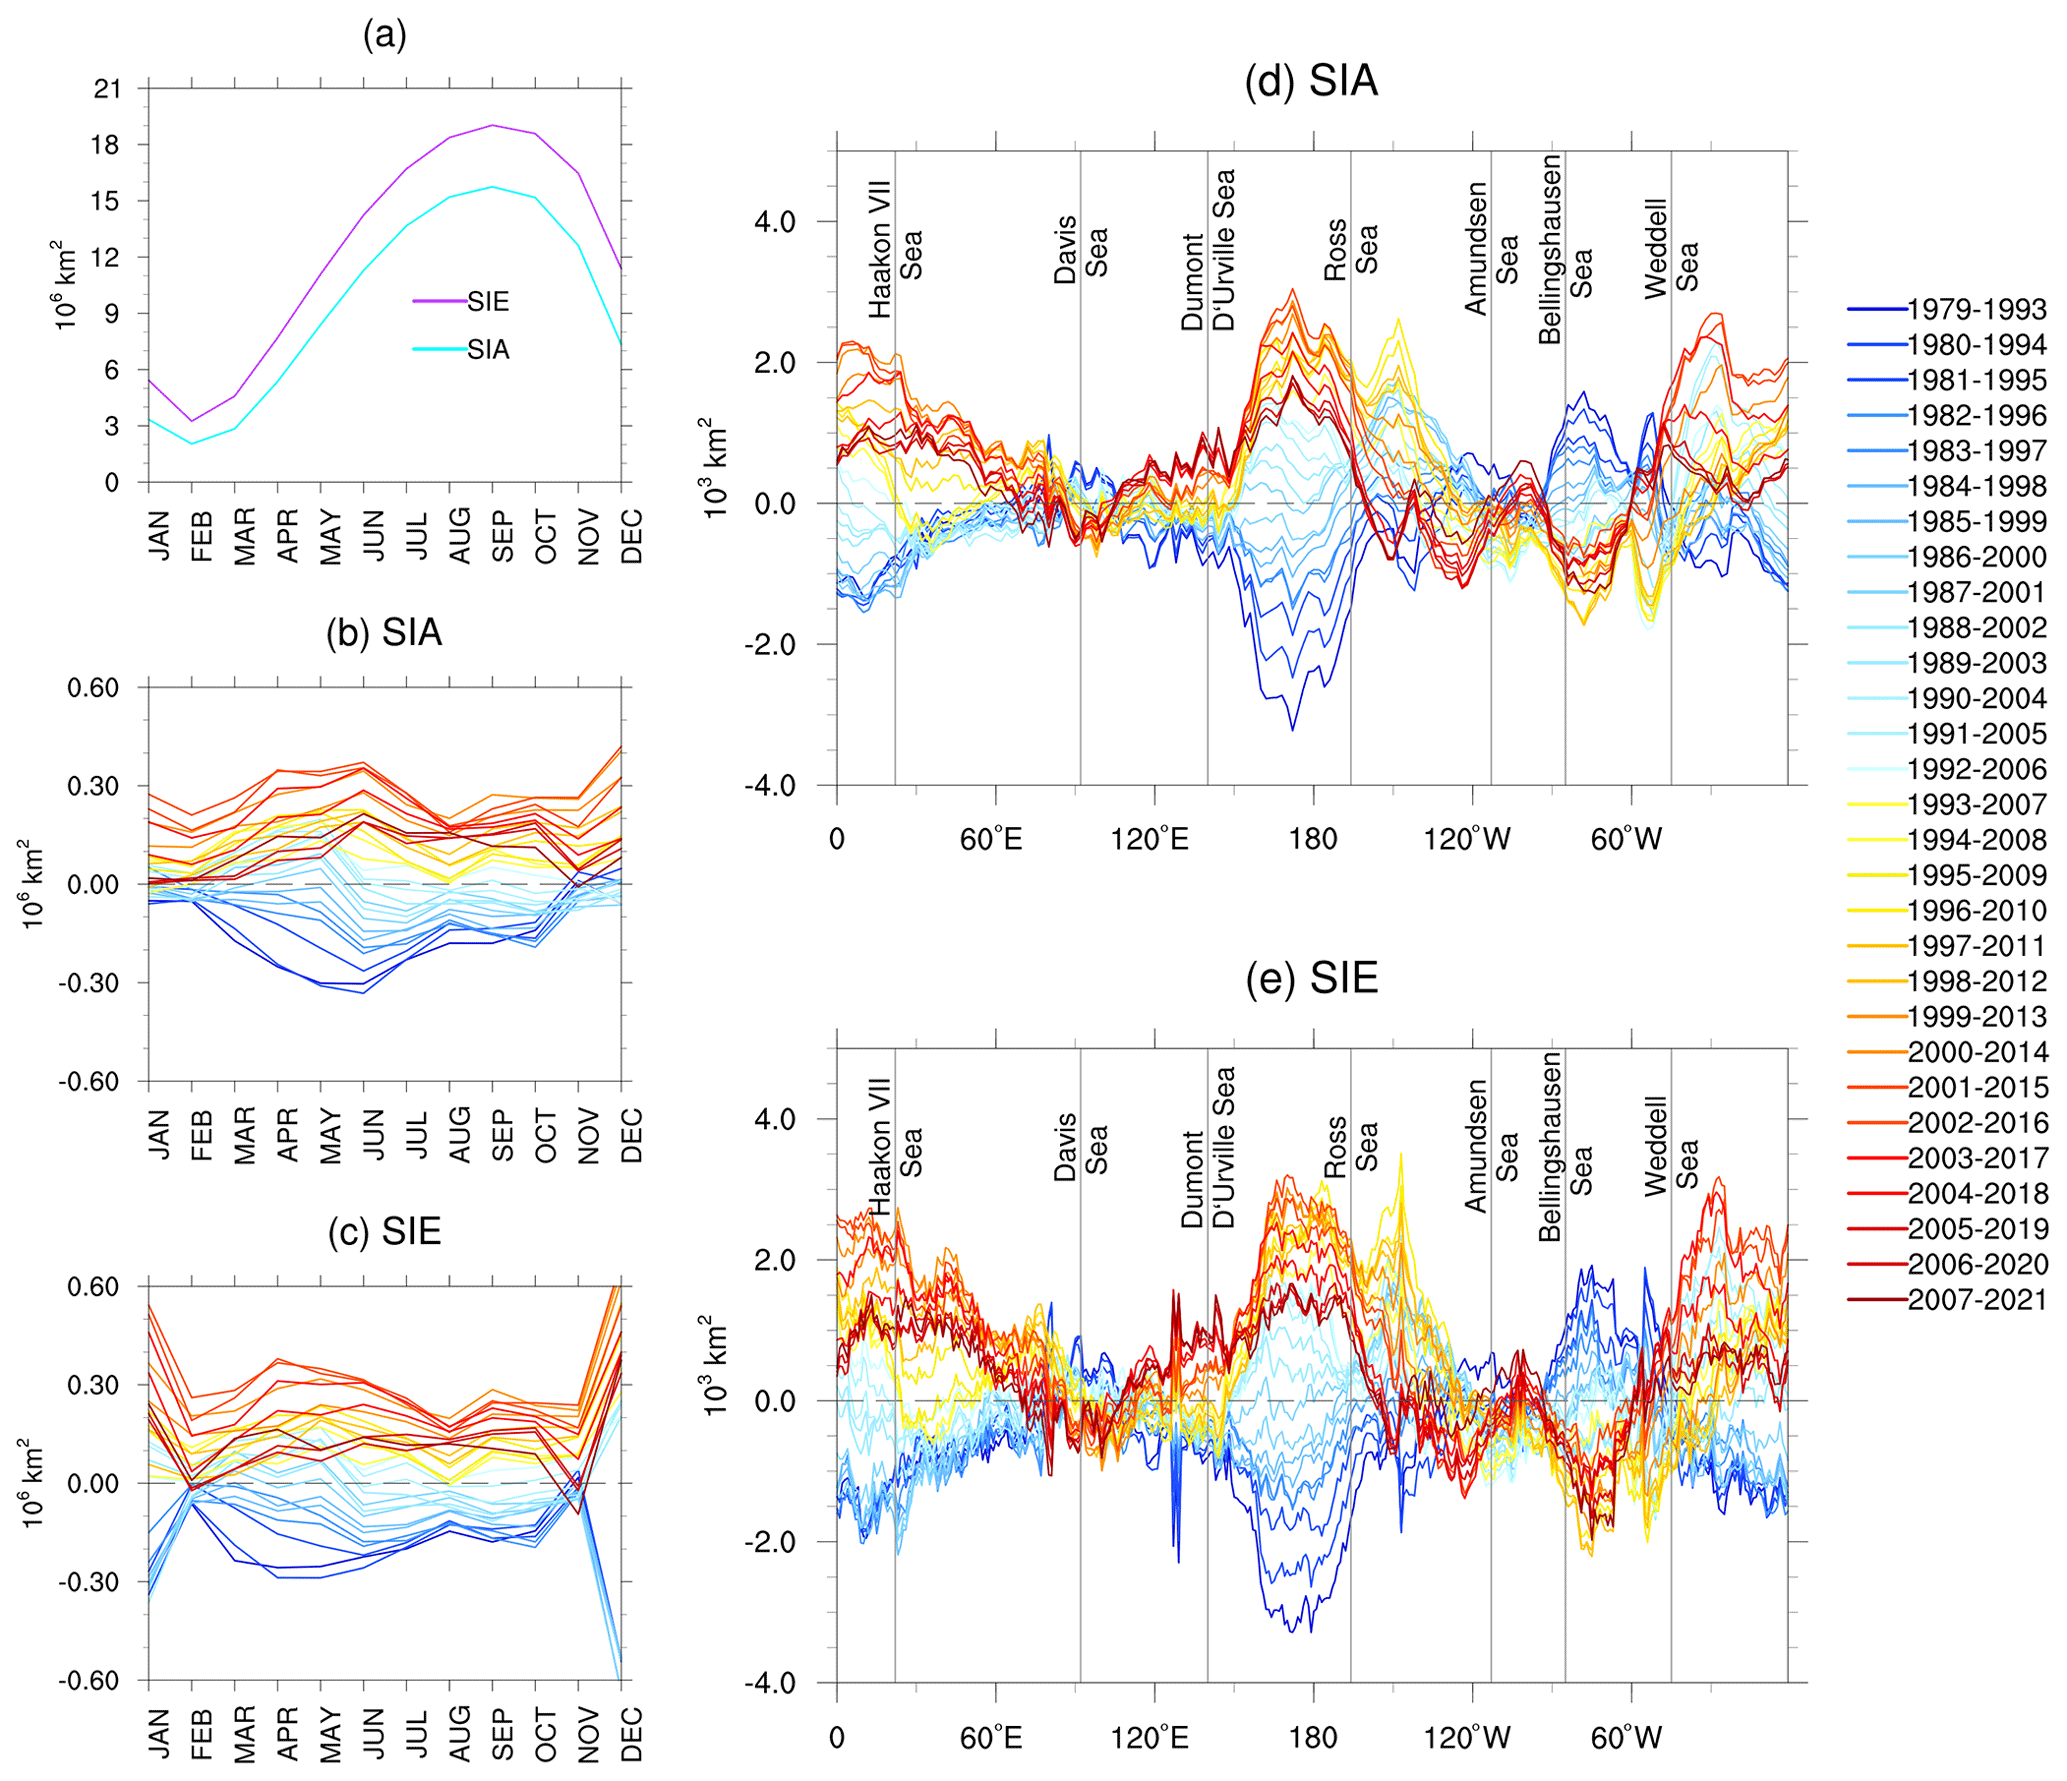
Figure 1Running 15-year SIA climatology for (a) integrated circumpolar total SIA and SIE, (b–c) difference of each 15-year climatology from the 1979–2021 climatology of SIA and SIE, respectively, and (d–e) differences of regional 15-year annual mean SIA and SIE from 1979–2021 annual means. Lines are coloured from earliest (1979–1993, dark blue) to most recent (2007–2021, dark red) 15-year samples. Vertical lines indicate the approximate mid-point of each geographical location; zero difference from the long-term mean is denoted by the horizontal dotted line.
3.1 Variability and trends in Antarctic sea ice
The large annual cycle of Antarctic sea ice (Fig. 1a) has shifted over time, with running 15-year monthly differences of average SIE and SIA from the 1979–2021 mean clearly showing a steady increase over the satellite record that reverses in the most recent samples (Fig. 1b–c). Given the anomalously low sea ice occurring between 2016–2021 (described in Sect. 1), these shorter-than-typical climatologies merely highlight the nullifying impact of recent record low sea ice events. However, the proportion of 15-year samples exceeding the 1979–2021 mean is greater than half year-round, indicating that despite recent record low sea ice the long-term mean of both SIA and SIE is dominated by the earliest years. The disproportionality of samples above the mean is particularly high during late summer and autumn (e.g. 22 of 29 SIA samples above the 1979–2021 mean in April–May and December), which is also when the largest sea ice trends have been observed (Hobbs et al., 2016; Holland, 2014; Eayrs et al., 2019). Calculating anomalies from a biased long-term sea ice average may obscure or misrepresent variability at short-term timescales, hindering the robust interpretation of sea ice behaviour and trends. We posit that the magnitude or even sign of observed anomalous sea ice behaviour changes substantially under different time spans: for example, if sea ice anomalies were calculated from a sample encompassing only the most recent decades, the short-term climatologies imply that the negative anomalies since 2016 would appear even more extreme, as mean sea ice is of a higher magnitude than the mean of the ∼43-year climatology.
Spatially, the increasing mean SIE and SIA described above are most notable from west of the Dumont D'Urville Sea to the Ross Sea, as well as in the Haakon VII Sea, while mean sea ice steadily decreases in the Bellingshausen and western Weddell seas (Fig. 1d–e). Compensating anomalies and opposing trends have long been noted in the aforementioned regions (Parkinson, 2019; Parkinson and Cavalieri, 2012; Comiso et al., 2017; Turner et al., 2015; Simmonds, 2015), with a “cancellation” effect of negative regional anomalies reducing the magnitude of the positive regional anomalies to produce a smaller circumpolar value. Despite statistically significant positive trends in Antarctic sea ice existing at some points during the satellite record, strong non-linearity occurs within the trend due to high decadal and sub-decadal variability (Handcock and Raphael, 2020). For example, trends of SIE and SIA between 1979 and 2021 are positive (but statistically insignificant): 7.3×10³ km2 yr−1 for SIE (p>0.17) and 5.7×10³ km2 yr−1 for SIA (p>0.2) (Fig. 2a); trends of annual circumpolar SIE and SIA anomalies for only the most recent 30 years (1992–2021) are negative (also statistically insignificant): km2 yr−1 for SIE and km2 for SIA (both p>0.6).

Figure 2(a) Annual average spatially integrated anomalies of SIA and SIE for long-term satellite record duration (1979–2021) and most recent 30-year period (1992–2021), (b) monthly average standard deviation of spatial anomalies from the 1979–2021 mean, and (c) annual average anomalies of SIA from the 1979–2021 climatology. Vertical lines in (c) indicate the approximate mid-point of each geographical location.
Regional variability (shown by the standard deviation of annual SIE and SIA anomalies over the longitudinal domain) shows peaks mostly in the earlier half of the satellite record (e.g. 1980, 1985–1986, 1992, 1999, 2003) interspersed with troughs (1984, 1993, 1997) indicating higher year-to-year variation in opposing regional anomalies (Fig. 2b). Since 2004, however, regional variability is comparatively moderate with much smaller year-to-year variation, and a small decline between 2018–2021 implies a relatively persistent reduction in opposing anomalies. Contours of annual SIA anomalies by region (Fig. 2c; SIA is presented instead of SIE as it is less noisy, though both show the same decreasing variability pattern) indeed show that strongly opposing regional anomalies tended to occur earlier in the satellite record. In much of the most recent decade, however, anomalies have veered toward the same sign in the Haakon VII, Ross, and Weddell regions (Fig. 2c), so despite the anomalies tending to be lower magnitude than in the “peaks” of earlier years, the compounding effect of spatially homogeneous anomalies rather than spatially compensating anomalies leads to higher-magnitude annual average anomalies overall (Fig. 2a).
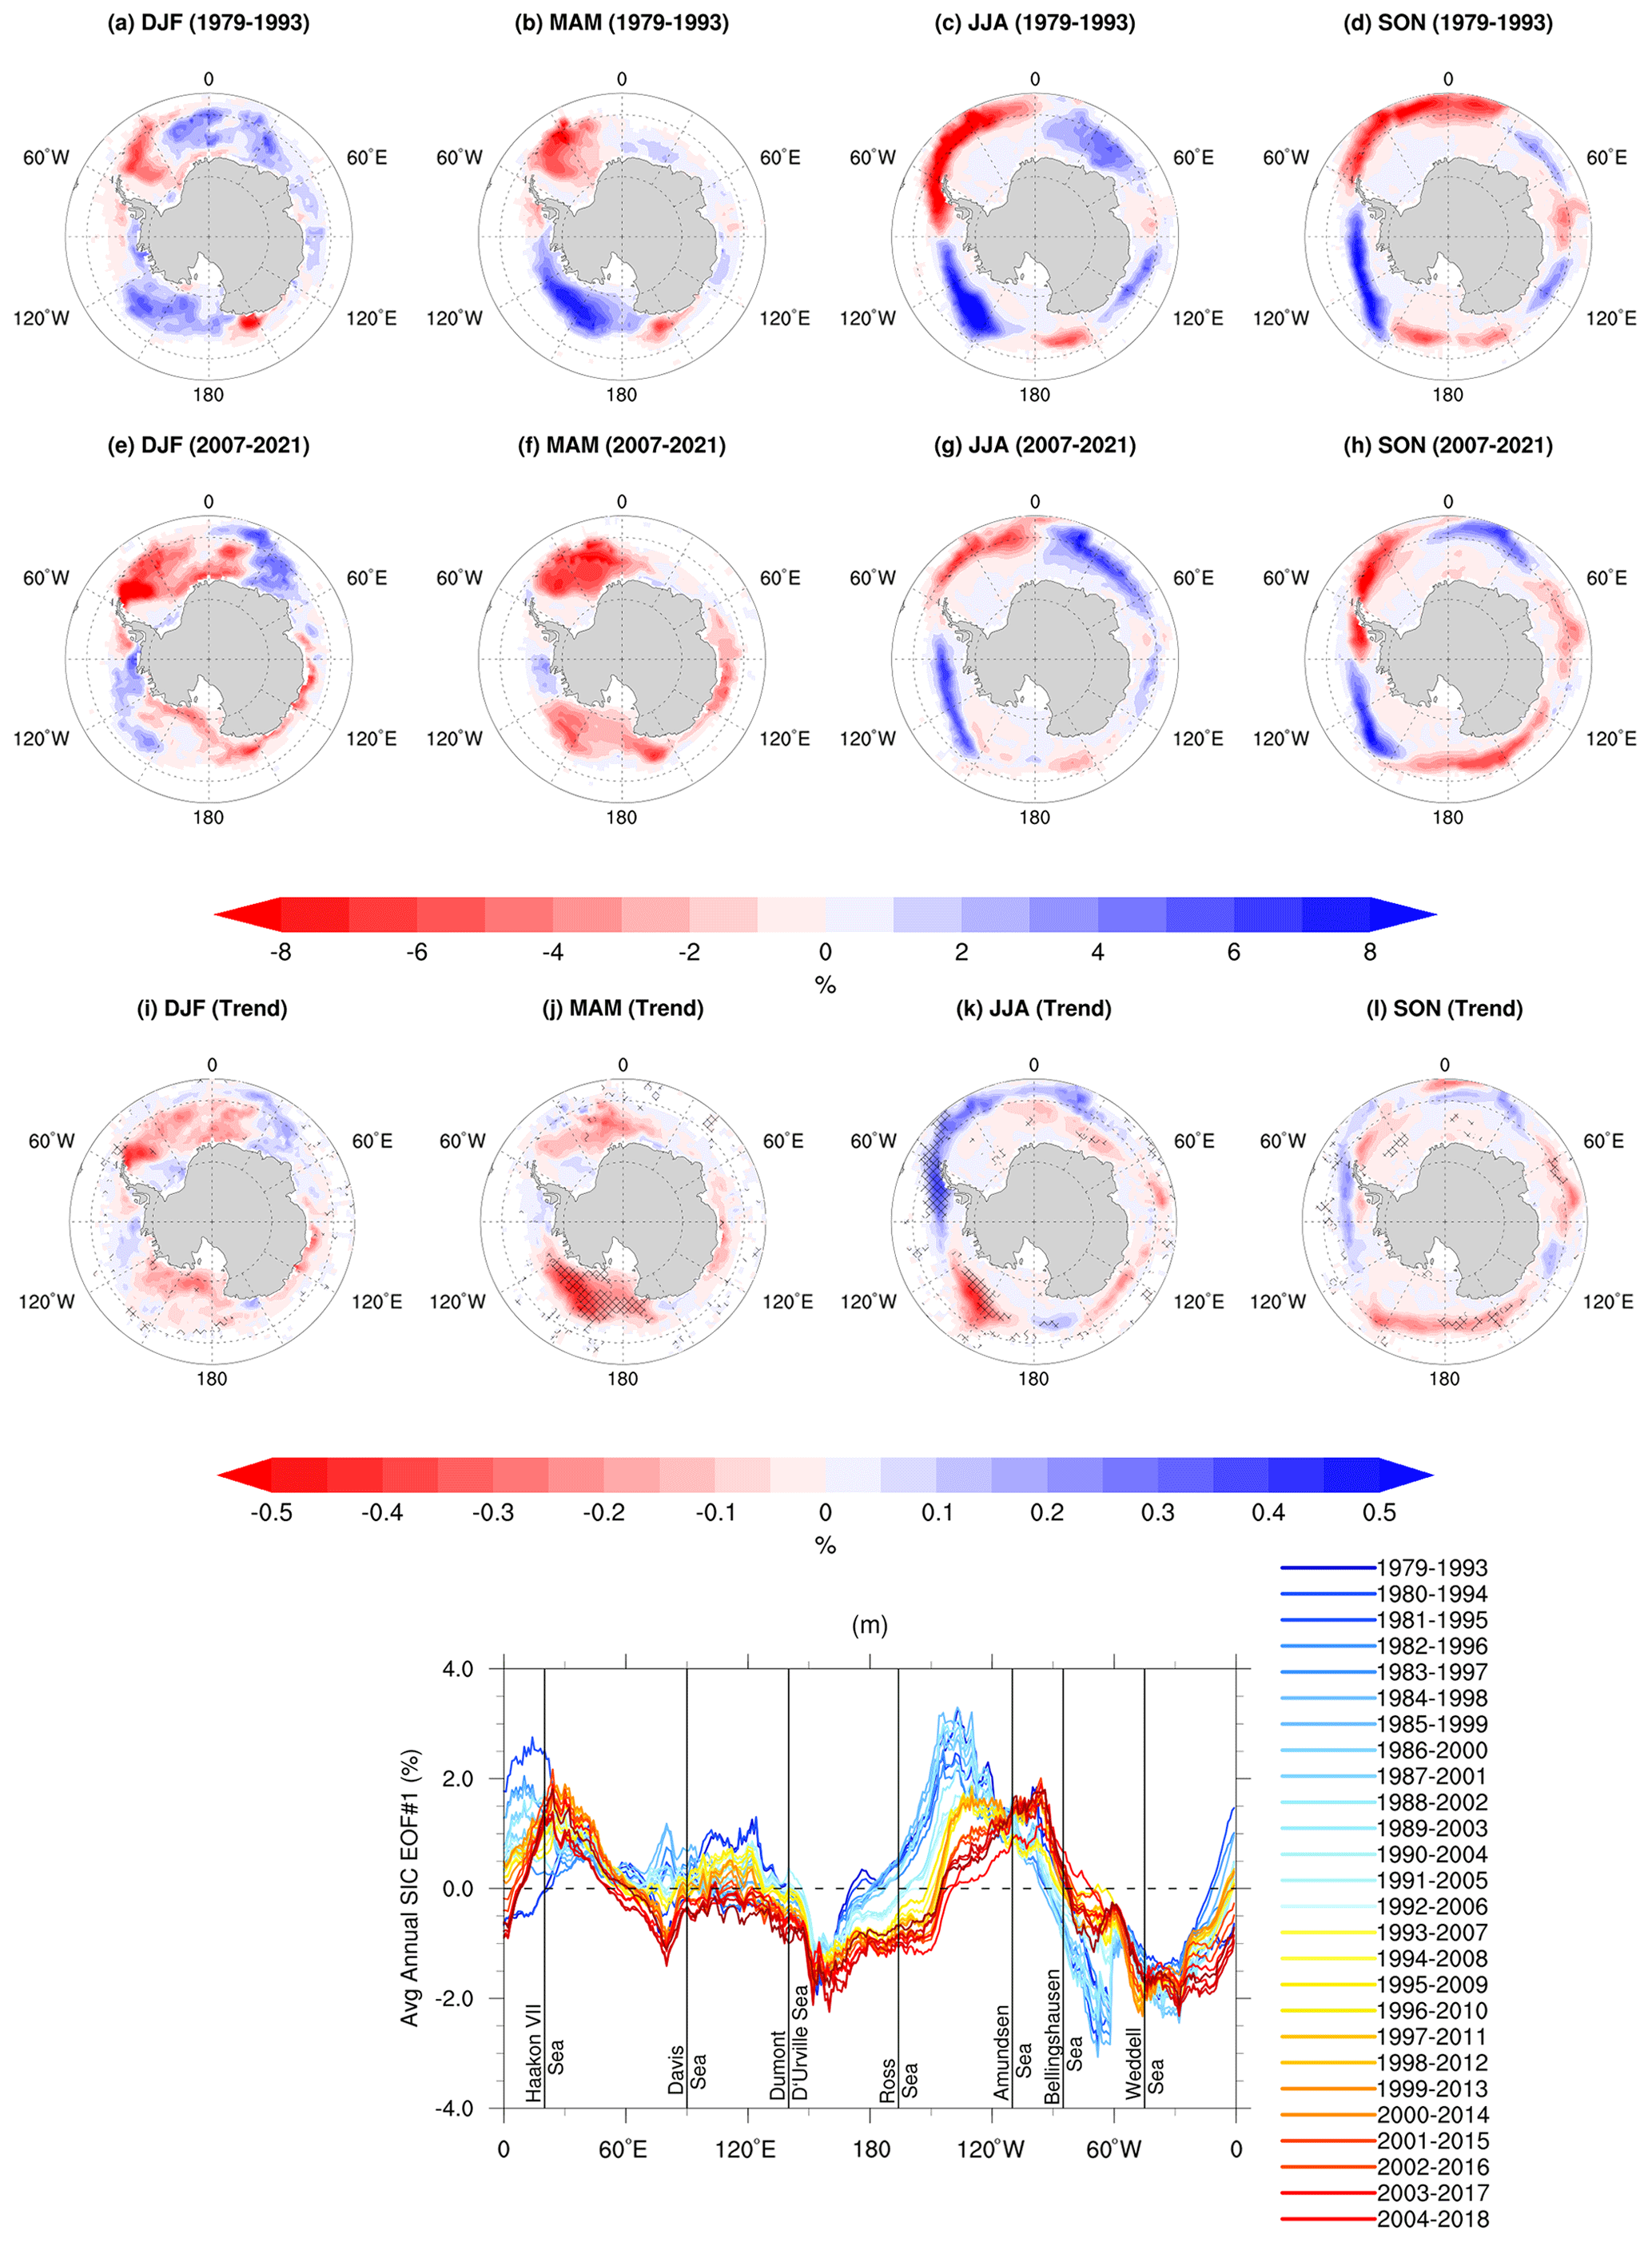
Figure 3EOF1 of detrended seasonal SIC anomalies for (a–d) 1979–1993 and (e–h) 2007-2021; (i–l) trend across running 15-year EOF1 patterns; (m) annual SIC EOF1 averaged over each longitude for each 15-year sample. Lines are coloured from earliest (1979–1993, dark blue) to most recent (2007–2021, dark red) 15-year sample. Vertical grey lines indicate the approximate mid-point of each geographical location depicted by vertical text. Stippling shows regions where trend patterns are statistically significant (p<0.05).
Eigenvectors produced through empirical orthogonal analysis (EOF; also known as principal component analysis) show the spatial pattern that accounts for the maximum proportion of variance in detrended anomalies. The first (highest-variance-explained) pattern, EOF1, for the earliest sample (all monthly anomalies between 1979–1993) of sea ice concentration (SIC) in all four seasons shows opposing anomalies between the Ross–Amundsen and Weddell seas (Fig. 3a–d), while June–August (JJA) and September–November (SON) also have opposing anomalies around the rest of the continent in a wave-3-like pattern (Fig. 3c, d). The most recent sample (2007–2021) produces a very different pattern during December–February (DJF) and March–May (MAM), in which the opposing anomalies weaken and diminish spatially, and anomalies of the same sign appear around much of the continent instead (Fig. 3e, f), with trends calculated across the 15-year samples tending towards increasing zonally symmetry (which is statistically significant (p<0.05) in the Ross Sea region during MAM) (Fig. 3i, j). During JJA and SON, the opposing anomalies in the earliest patterns of maximum variance (Fig. 3c, d) persist (though more weakly) in the more recent samples (Fig. 3g, h). The weakening of the dipole pattern of anomalies between the Ross–Amundsen and Weddell seas during JJA is also statistically significant in part of the Ross Sea and around the Antarctic Peninsula (Fig. 3k). As the sign of anomalies is fairly consistent at each longitude, we show the steady reduction in the pattern of opposing anomalies over time by averaging EOF1 across the latitudes at each longitude for all monthly anomalies in each 15-year sample (Fig. 3m). The results emphasize growing spatial homogeny in the pattern of anomalies around much of East Antarctica, a steady diminution through time of opposing anomalies between the Ross and Amundsen seas and Bellingshausen Sea, and an eastward shift in the location of maximum “opposing” anomalies from a dipole between the Ross–Amundsen and Weddell seas to the Amundsen–Bellingshausen and Weddell seas. The changing pattern of EOF1 of SIC, particularly the eastward shift in the dipole pattern, alludes to potential changes in regional trend patterns that may be visible on shorter timescales. The high internal variability in sea ice, however, precludes the use of 15-year samples of sea ice anomalies to calculate discernible trends, and we utilize 30-year samples instead to calculate running trend patterns.
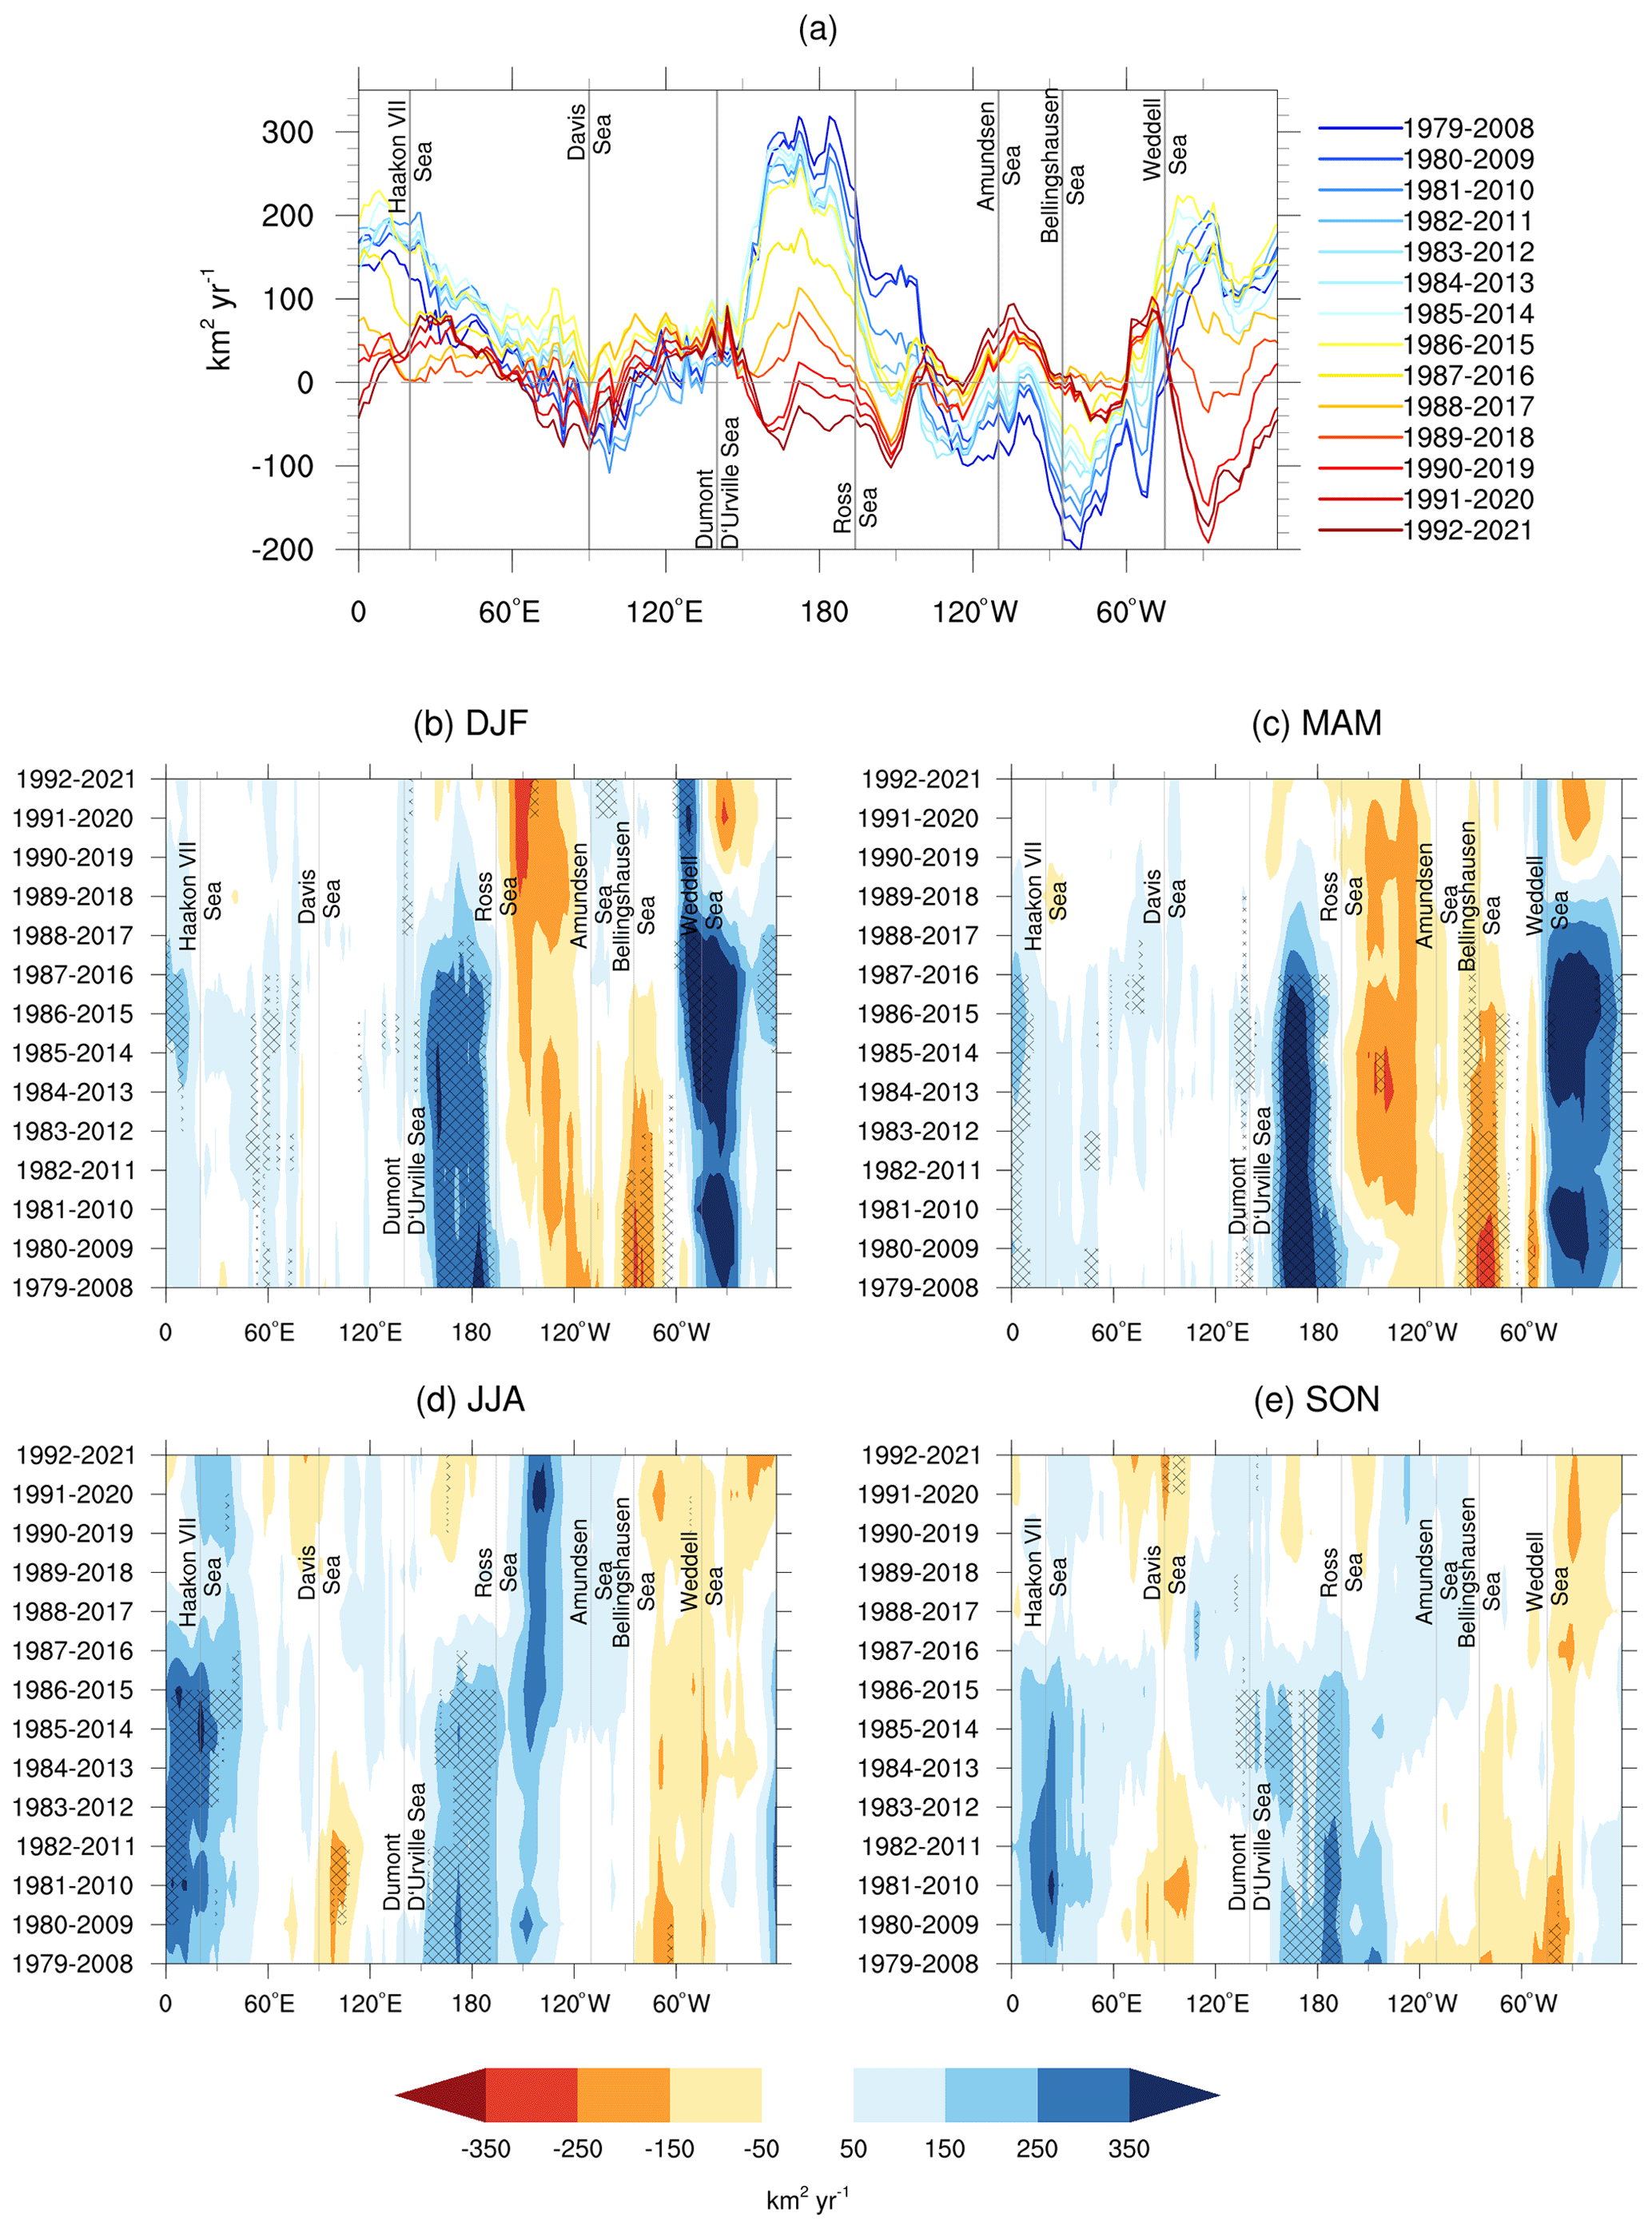
Figure 4Running 30-year linear least-squares regression coefficients (trends) of (a) annual SIA anomalies and (b) seasonal SIA anomalies. Lines in (b) are coloured from earliest (1979–2008, dark blue) to most recent (1992–2021, dark red) 30-year sample. Grey lines indicate the approximate mid-point of each geographical location depicted by vertical text. Stippling shows regions where trend patterns are statistically significant (p<0.05).
Trends of anomalies from 30-year samples reveal a very different picture than the long-term trend implies (Fig. 4). Annual average trends show that the compensating dipole of regional trends described above (positive in the Ross, central and eastern Weddell, and western Haakon VII seas, negative in the Davis, Amundsen, and Bellingshausen seas) is substantially dampened over time (Fig. 4a). Diminishing negative trends in the Amundsen, Bellingshausen, and western Weddell seas are consistent through time, clearly pre-dating the recent anomalously low sea ice years. In contrast, changing patterns in the Ross, eastern Weddell, and Haakon VII seas are noisy in the earliest samples but abruptly shift in samples that coincide with the anomalously sharp sea ice retreat in 2016 and beyond, which has been attributed to unusual atmospheric and oceanic conditions in the Southern Ocean (Turner et al., 2017; Stuecker et al., 2017; Wang et al., 2019; Schlosser et al., 2018; Meehl et al., 2019).
From a seasonal perspective, trend patterns clearly differ between DJF/MAM and JJA/SON, with the regionally opposing trends much stronger in the former (Fig. 4b–e). Statistically significant (p<0.05) increasing trends in the western and central Ross Sea occur throughout the first two-thirds of the samples in DJF and MAM but disappear in the most recent samples (Fig. 4b–c). A persistent decreasing trend in the eastern Ross and western Amundsen seas intensifies in recent samples in DJF, becoming statistically significant in the two most recent 30-year periods, while an increasing trend in the eastern Amundsen and western Bellingshausen seas appears in DJF in samples from 1987–2016 onwards (also statistically significant in the two most recent samples). The Weddell Sea has a positive trend throughout DJF and MAM samples (statistically significant along the western boundary in the more recent half of the DJF samples), while the sign of the trend in the central Weddell Sea switches to negative (statistically insignificant) from 1990–2019 onwards. By comparison, while the magnitude of the trends in JJA and SON is smaller, an eastward shift is evident from positive, statistically significant trends in the western and central Ross Sea in the first half of the samples towards positive (but statistically insignificant) trends in the Amundsen/eastern Bellingshausen seas in the second half of the samples (Fig. 4d–e). Instead, in the five most recent patterns, the western/central Ross Sea has weakly negative or neutral trends in JJA and SON. Those same five JJA and SON samples also shift towards more wave-3-like trend patterns, positive over the Haakon VII, Dumont D'Urville, and Amundsen–Bellingshausen seas and negative in the Davis, Ross, and Weddell seas. Statistically insignificant negative winter and spring trends in the Weddell Sea are fairly consistent across the samples, contrasting with large (statistically significant at times) positive trends in DJF and MAM for most samples. Indeed, it is only in the three most recent samples that the DJF and MAM trends turn negative (statistically insignificant), indicating the effect of the record low ice of recent years and, with a persistent, year-round negative trend, explaining the sudden high-magnitude negative annual trend patterns for those samples, reaching almost the same strength as the earliest negative annual trend in the Bellingshausen Sea (Fig. 4a).
The eastward shift in positive sea ice anomalies from the Ross Sea to the Amundsen–Bellingshausen seas could be due to several potential drivers, such as the strength and latitudinal/longitudinal position of the climatological low-pressure centre in the Amundsen Sea (the Amundsen Sea Low; Fogt et al., 2012b; Raphael et al., 2015; Turner et al., 2013b), which impacts seasonal and interannual sea ice variability (Raphael et al., 2019), low-frequency large-scale atmospheric forcing and high-frequency synoptic variability (weather) (Matear et al., 2015), and decadal-scale ocean drivers such as anomalous sub-surface ocean cooling via the Antarctic Circumpolar Current (Morioka et al., 2022). It has long been understood that the complex temporal sea ice variability on seasonal, multi-year, decadal, and multi-decadal scales, as well as the spatially heterogeneous relationships between Antarctic sea ice in various sectors with different atmospheric and oceanic drivers, indicates Antarctic sea ice variability and trends are unlikely to be associated with a single driver (Holland, 2014). Recently, however, Kimura et al. (2022) found similar contrasting annual trends between 2003–2019 of increasing SIC in the Amundsen and Bellingshausen seas and parts of East Antarctica and decreasing SIC elsewhere, and they demonstrated the dominance of dynamic wind forcing in driving the seasonal evolution of sea ice in the regions of increasing SIC. Seasonal and regional variability and trends in Antarctic sea ice are strongly influenced by wind, through both thermodynamic and dynamic effects (e.g. Hobbs et al., 2016; Raphael and Hobbs, 2014; Schroeter et al., 2017; Matear et al., 2015; Holland and Kwok, 2012; Haumann et al., 2014; Hall and Visbeck, 2002; Bernades Pezza et al., 2012; Stammerjohn et al., 2008). We turn now to short-term variability and trends in the dominant mode of Southern Hemisphere atmospheric variability, the Southern Annular Mode (SAM).
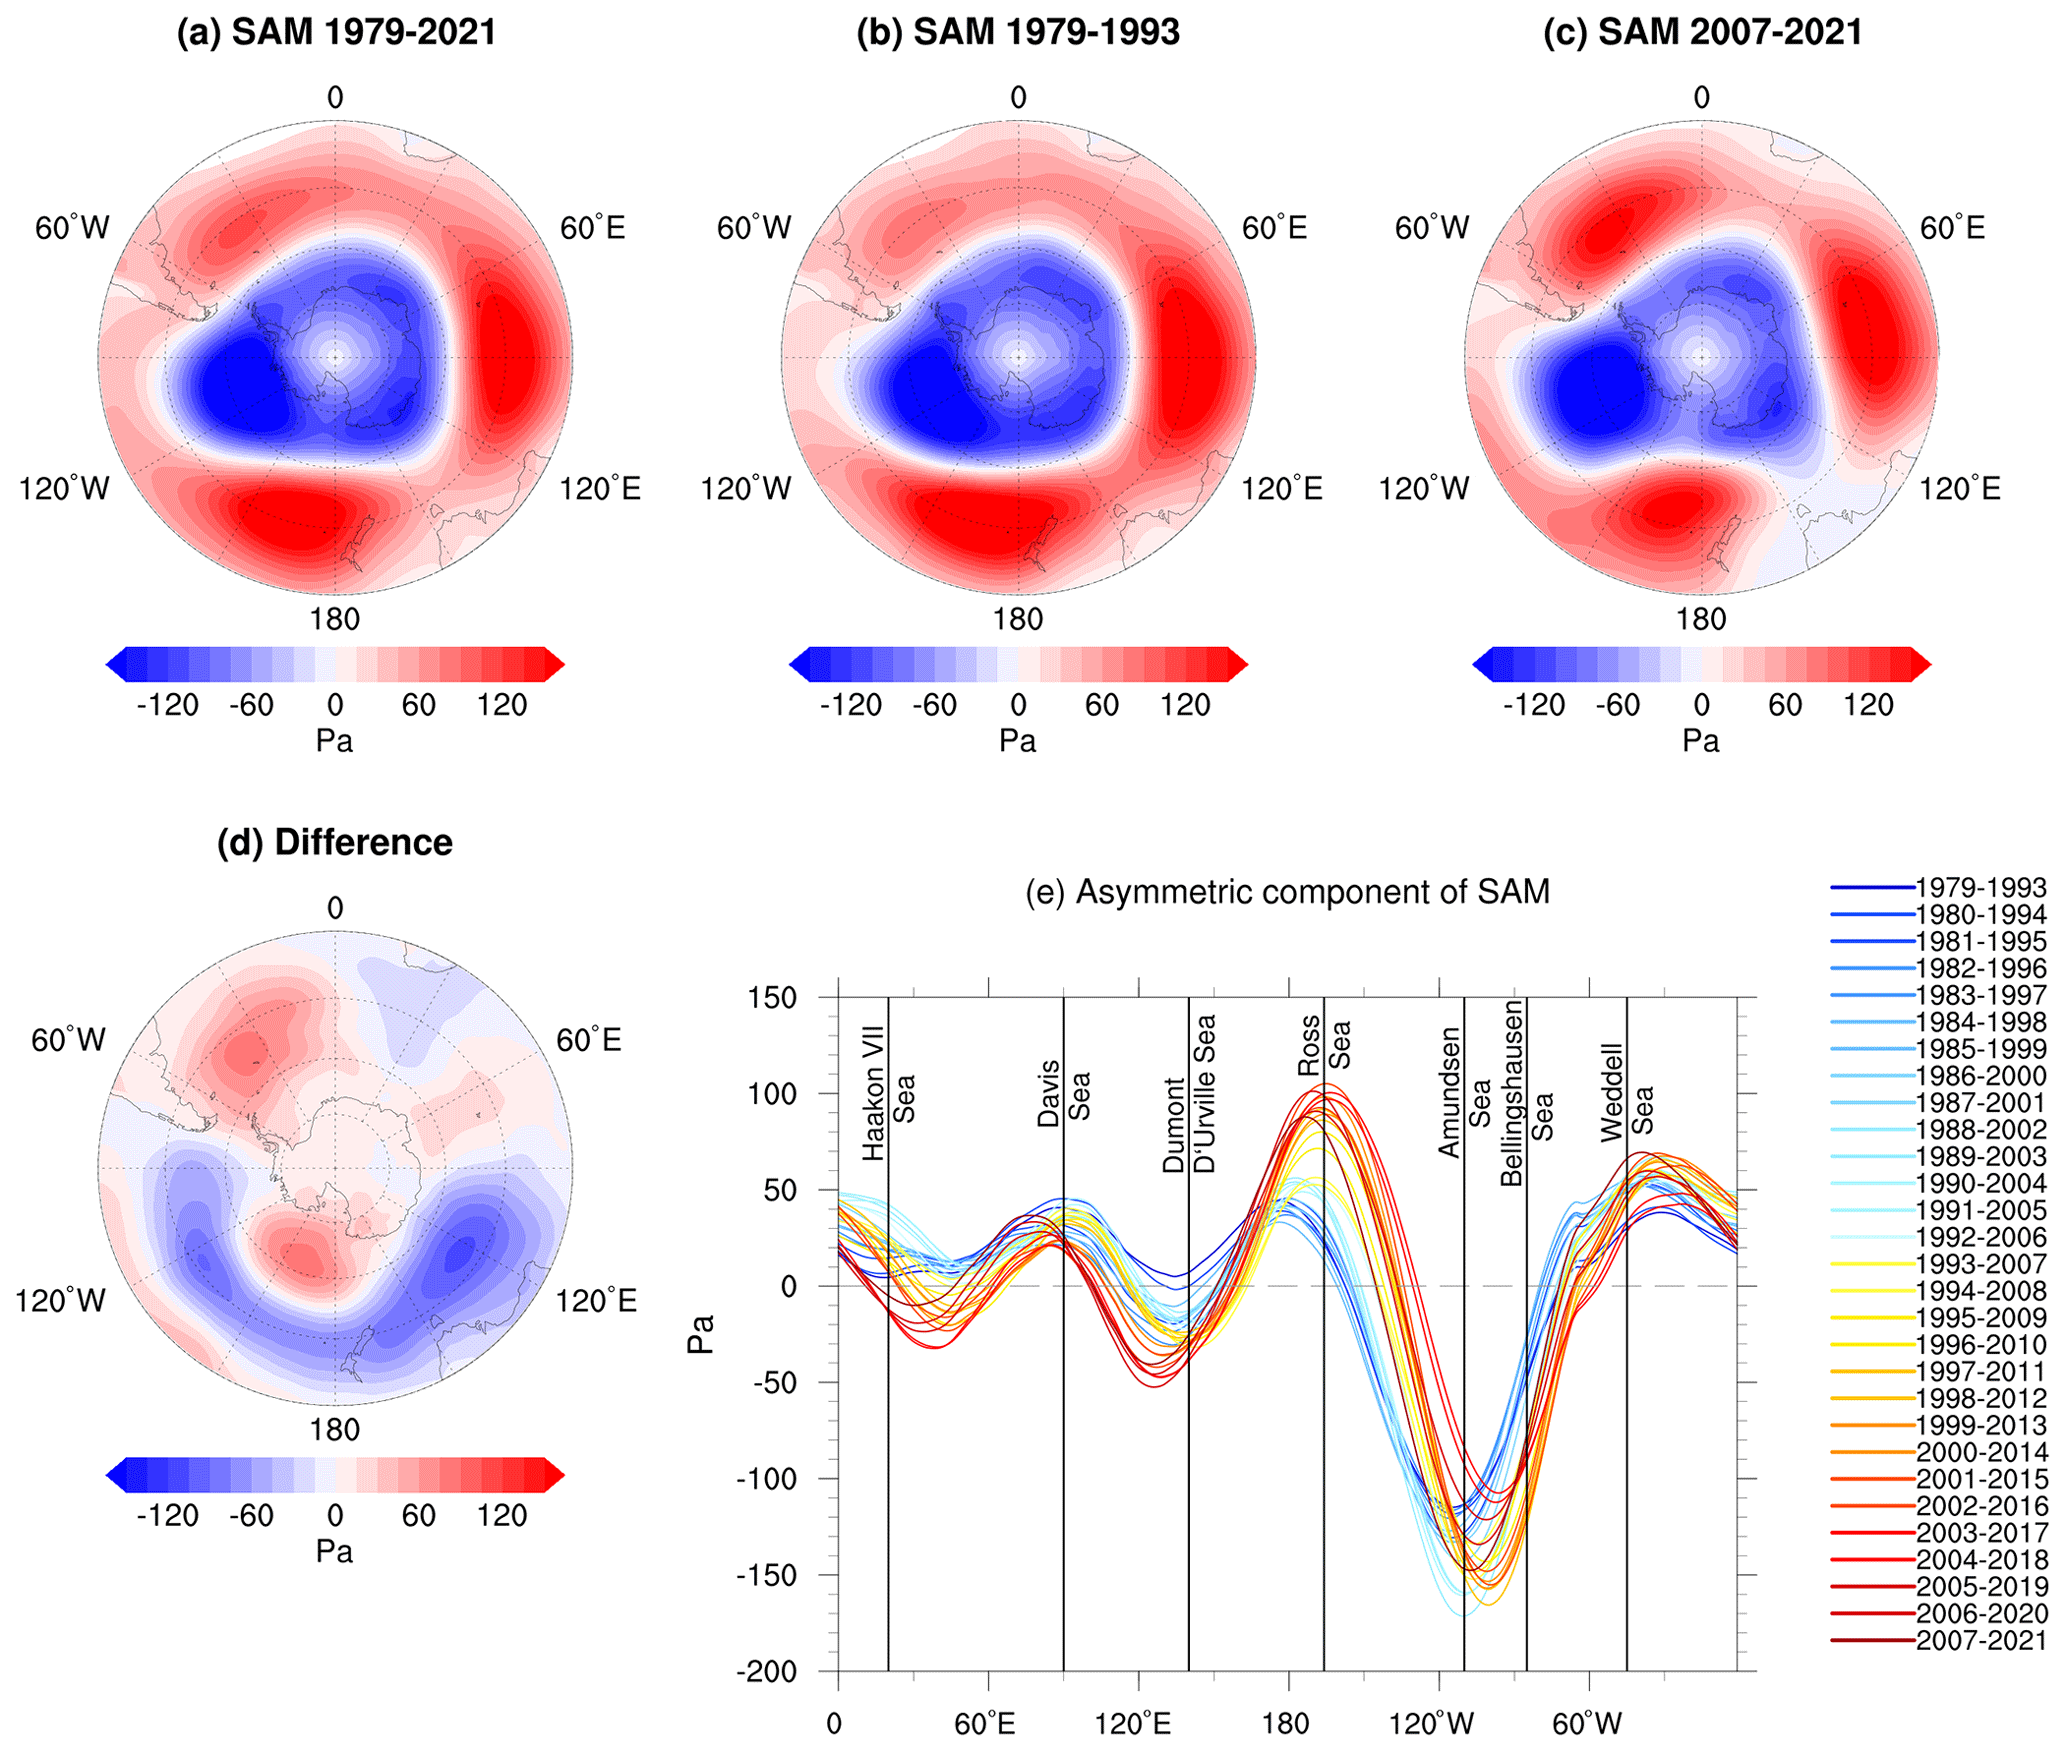
Figure 5EOF1 of detrended SLP anomalies for (a) 1979–2021, (b) 1979–1993, (c) 2007–2021, and (d) difference between (b) and (c), as well as (e) average zonal anomaly of EOF1 between 70 and 55∘ S for each 15-year sample. Lines are coloured from earliest (1979–1993, dark blue) to most recent (2007–2021, dark red) 15-year sample. Vertical lines indicate the approximate mid-point of each geographical location depicted by vertical text.
3.2 Meridional structure shift in the Southern Annular Mode
Atmospheric circulation in the Southern Hemisphere high latitudes is predominantly zonally symmetric, with a strong westerly polar jet encircling the continent near 60∘ S (Kidson and Sinclair, 1995). SAM is often described as a predominantly zonally symmetric, annular (ring-like) structure of opposing anomalies between the middle and high latitudes (Gong and Wang, 1999; Thompson and Wallace, 2000; Marshall, 2003). However, there are mechanisms of asymmetric flow embedded within the otherwise zonal atmospheric circulation (Van Loon, 1972), such as poleward-propagating Rossby wave trains from the tropics known as the Pacific–South American (PSA) modes (Mo and Higgins, 1998; Mo and Paegle, 2001), as well as the quasi-stationary zonal waves 1 and 3 (ZW3) (Hobbs and Raphael, 2010; Raphael, 2004). A zonal-wave-3 pattern is embedded with the SAM itself, with the annular pattern around Antarctica containing three non-annular components, juxtaposed with three non-annular components of opposing anomalies in the mid-latitude belt (Fig. 5a). SAM has both a positive- (deepening pressure anomalies over the high latitudes and increasingly high-pressure anomalies over the mid-latitudes) and a negative-phase (vice versa) polarity, and trends calculated since 1979 show SAM tending towards its positive phase (Fogt and Marshall, 2020). During the positive SAM phase, negative pressure anomalies occur over the Antarctic region, projecting onto the Amundsen Sea Low (ASL), resulting in enhanced local meridional winds and disparate regional sea ice behaviour in the Ross, Amundsen, Bellingshausen, and Weddell seas (Holland et al., 2017). Positive SAM is also associated with a strengthening of the westerly polar jet, which is evident in 15-year running samples of 850 hPa zonal winds (see Fig. S1 in the Supplement). An increasingly annular pattern of atmospheric flow implies stronger zonal winds over the sea ice zone (outside the ASL region) and would tend to produce more northward sea ice transport through the Ekman effect (Hall and Visbeck, 2002). However, in recent years, the structure of the SAM has become increasingly asymmetric (Wachter et al., 2020; Campitelli et al., 2022), indicating more north–south airflow around the continent and, as a result, more spatially heterogeneous sea ice behaviour. In EOF1 of monthly detrended SLP anomalies between 1979 and 1993 (Fig. 5b), the ring-like, annular structure of SAM is evident, more so than in the long-term mean (Fig. 5a). In more recent 15-year samples (e.g. 2007–2021; Fig. 5c), though, the annular structure becomes more wave-like, as the non-annular components in the mid-latitudes contract southwards. The difference between early samples and more recent samples (Fig. 5d) essentially reproduces the pattern of the asymmetric SAM component at 700 hPa (Campitelli et al., 2022). The asymmetric SAM component is calculated as anomalies from the zonal mean of the SAM pattern, as well as a spatial average calculated for each longitude between 70 and 55∘ S to encompass the region of maximum ZW3 amplitude and much of the sea ice zone (Campitelli et al., 2022). The resulting longitudinal averages shows a consistent shift in structure from annular to increasingly like wave 3 (Fig. 5e). The deepening and longitudinal contraction of the non-annular component in the Amundsen Sea positions it further eastward, away from the Ross Sea, with a clear reduction in cyclonic flow over the west of this region (Fig. 5c).
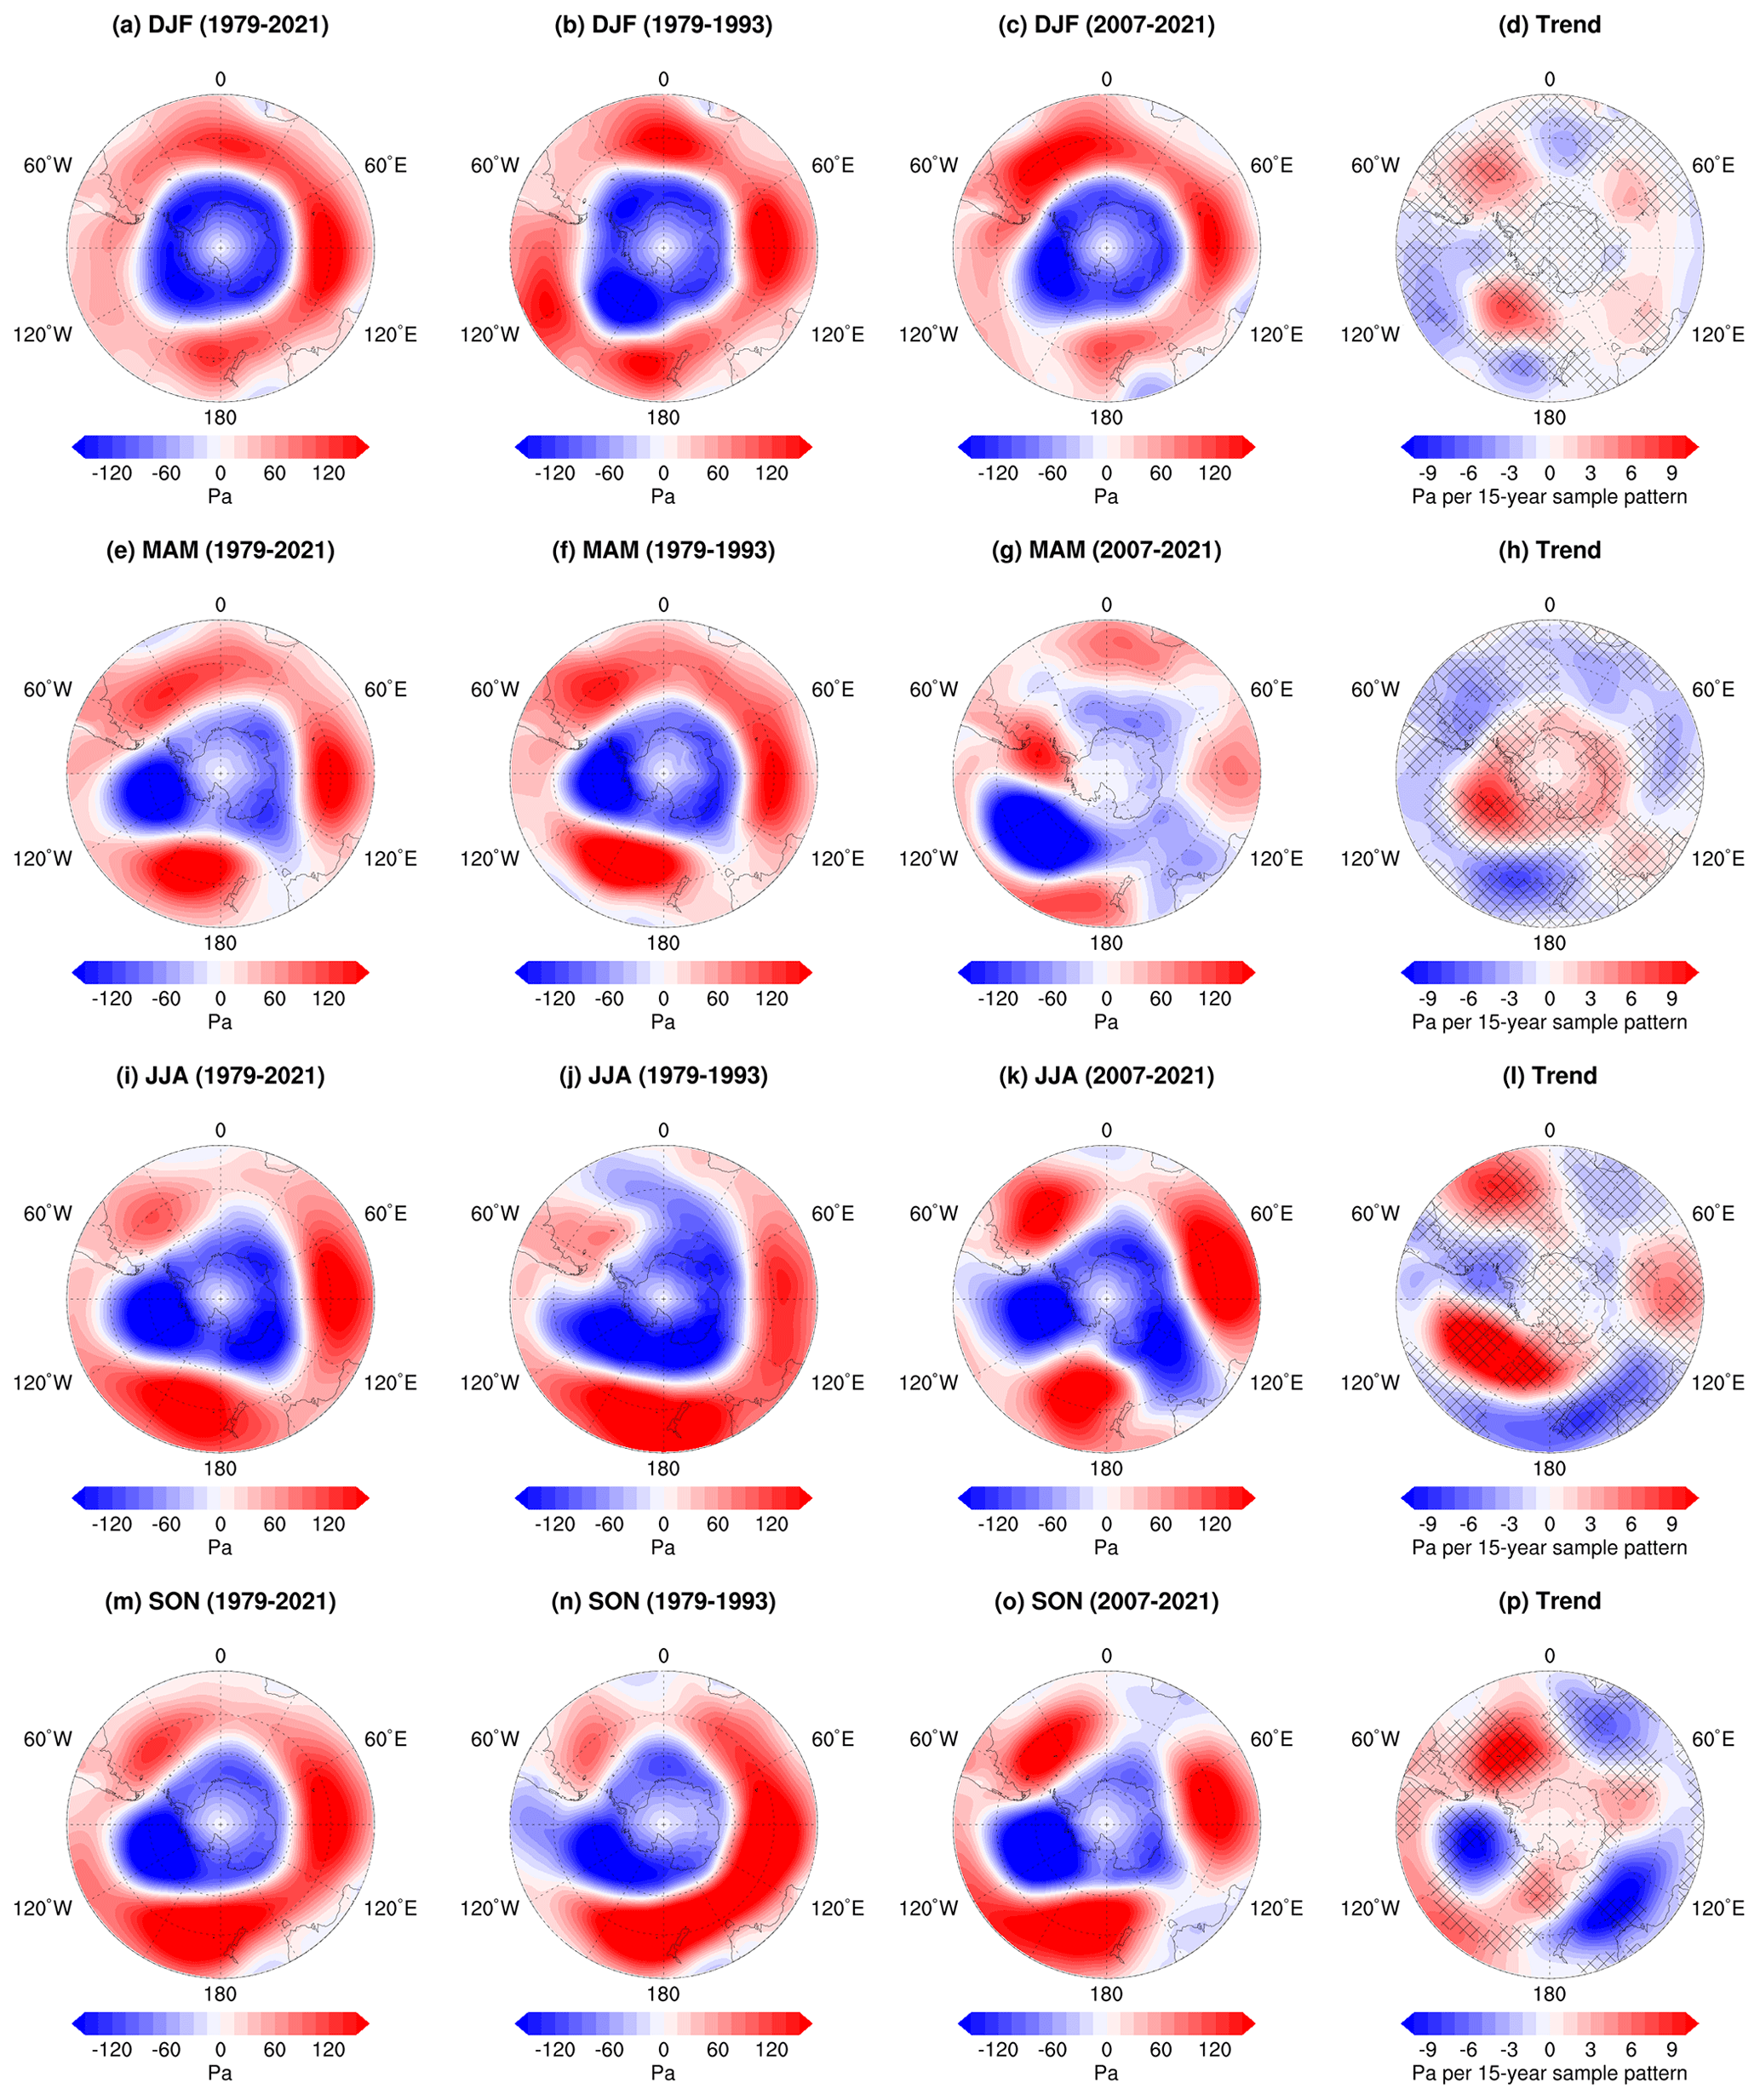
Figure 6EOF1 of detrended seasonal SLP anomalies for (a, e, i, m) 1979–2021, (b, f, j, n) 1979–1993, and (c, g, k, o) 2007–2021, as well as (d, h, l, p) trends of running 15-year seasonal EOFs. Stippling shows regions where trend patterns are statistically significant (p<0.01).
The spatial pattern of SAM is more zonally symmetric when calculated from monthly or annual mean anomalies rather than seasonal mean anomalies, and it is important to note that the structure of SAM has substantial seasonal and decadal variability (Fogt et al., 2012a; Fogt and Marshall, 2020). Seasonal EOFs spanning the long-term record (1979–2021) demonstrate the strongest zonally symmetric flow during the summer months (Fig. 6a) and greater asymmetric flow during the austral autumn, winter, and spring (Fig. 6e, i, m). Trends calculated across running EOFs of 15-year samples of detrended DJF anomalies (Fig. 6d) show a reduction in the non-annular components seen in earlier samples (Fig. 6b) towards an intensification of the zonally symmetric pattern in the high- and mid-latitude bands in the most recent patterns (Fig. 6c), in line with trends identified in other studies (Fogt et al., 2012a; Fogt and Marshall, 2020). Though the aforementioned studies also found a smaller trend towards a more annular spatial pattern of SAM during the austral autumn, the trend pattern across the 15-year MAM sample patterns (Fig. 6h) shows that, at least on shorter timescales, there is a diminution of the strength of the annular pattern of opposing anomalies in the mid- and high-latitude belts in early samples (Fig. 6e), tending towards a strong dipole in an otherwise relatively weak asymmetric pattern of anomalies in the sample encompassing 2007–2021 (Fig. 6g). The strength of the asymmetric intensification of winter (JJA) and spring (SON) spatial patterns of SAM in winter is substantially stronger (Fig. 6j, k, n, o), with trends in the cool season 15-year EOFs demonstrating a clear wave-3-like pattern of strengthening non-annular components in both the mid- and high-latitude belts (Fig. 6l, p).
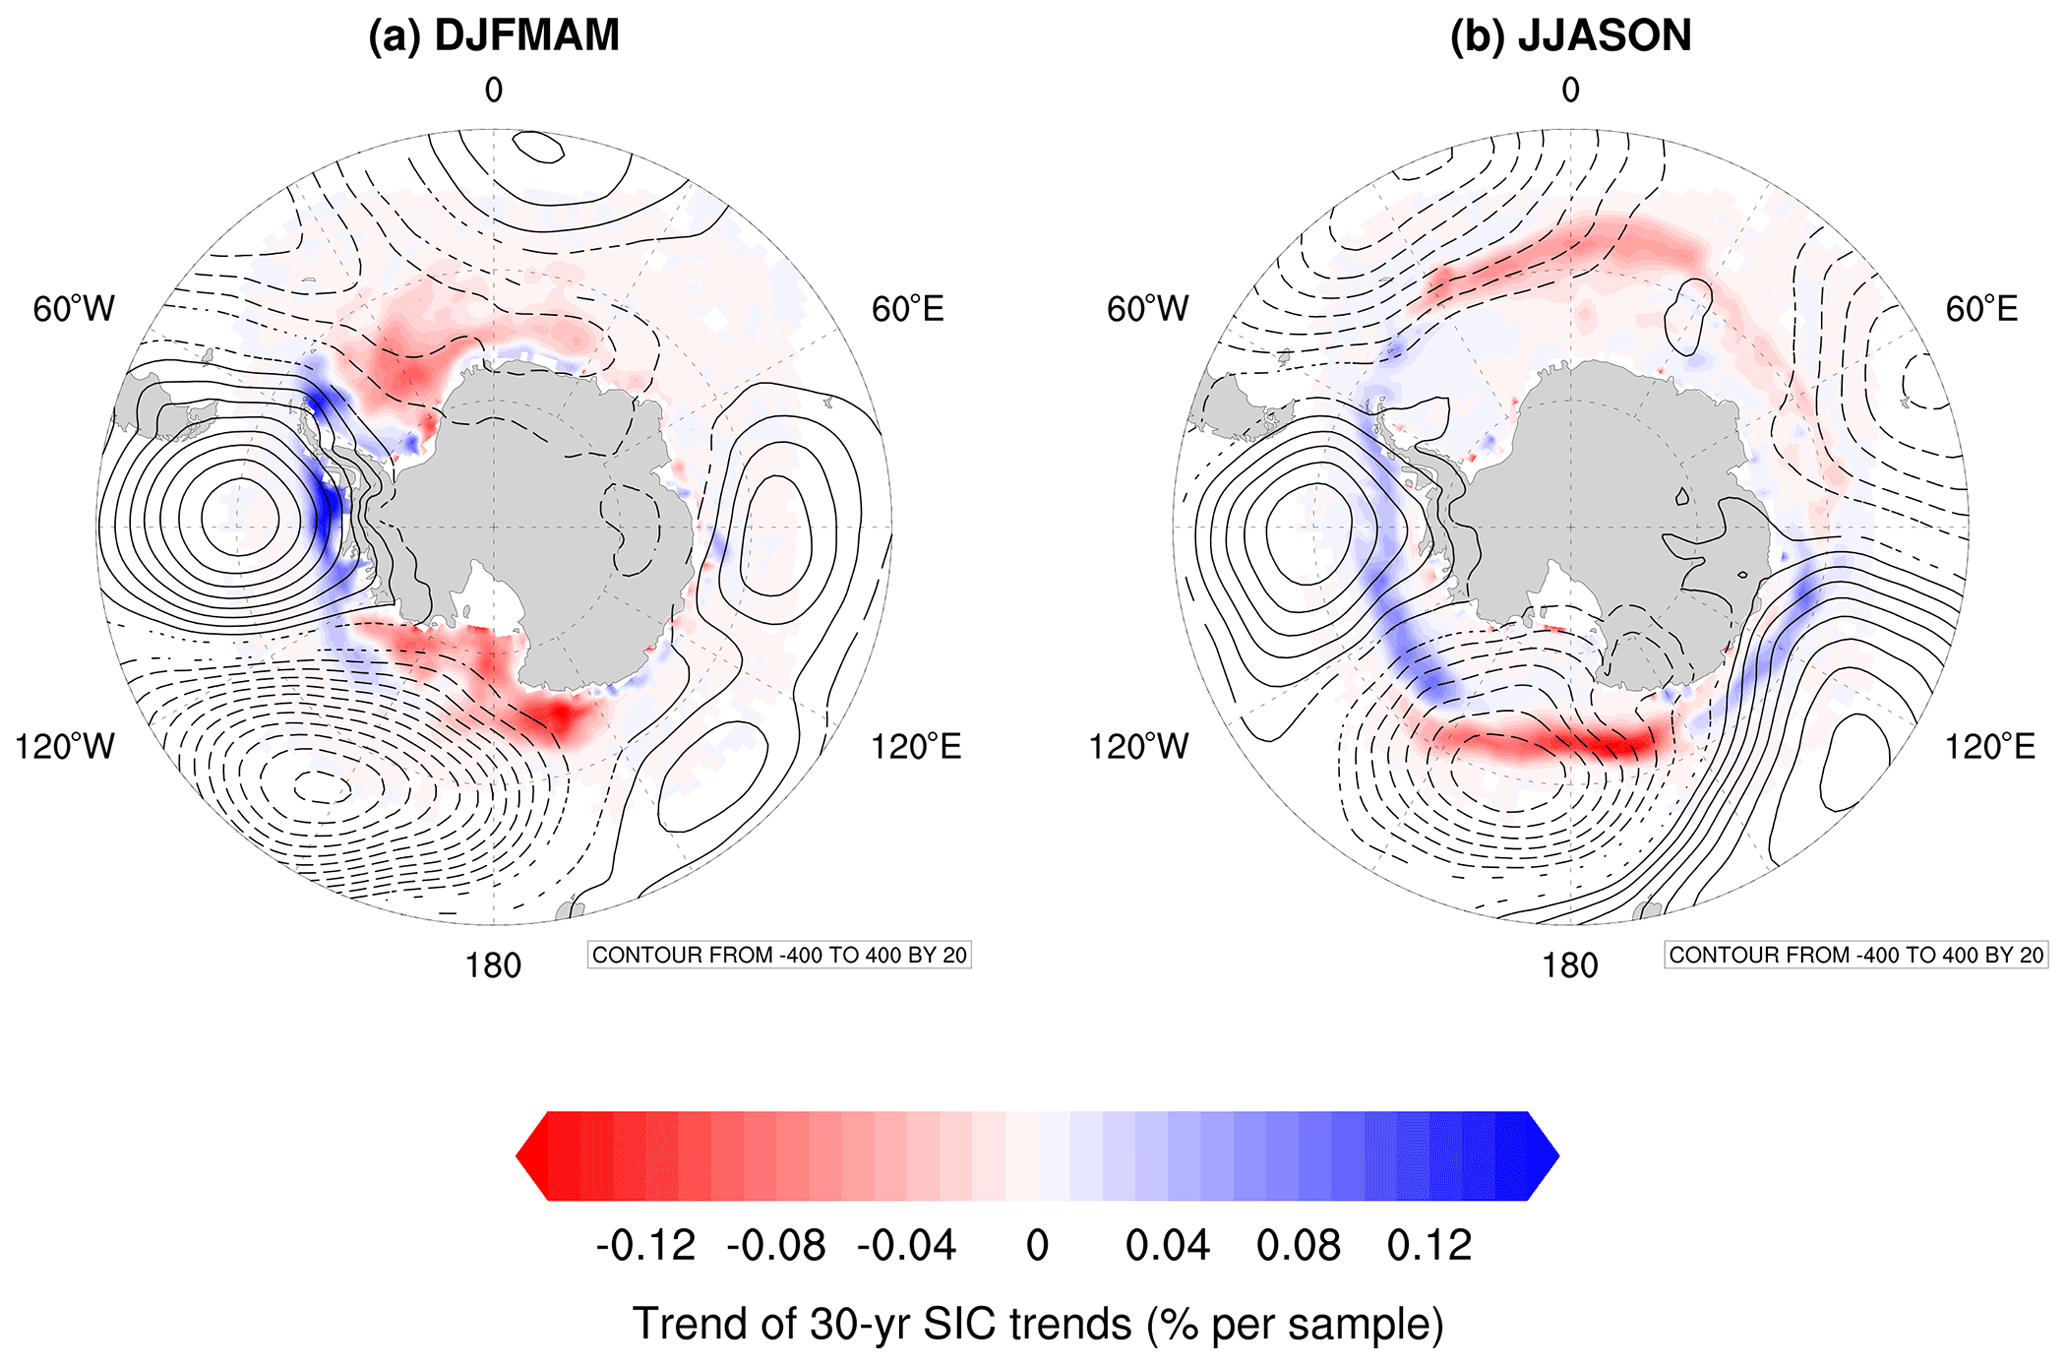
Figure 7Shading shows the slope of running 30-year seasonal trends of sea ice concentration (SIC) during (a) December–May and (b) June–November, overlaid by contour lines depicting the difference in the asymmetric component of SAM between the earliest 15-year sample (1979–1993) and the most recent (2007–2021). Negative contours (enhanced anticyclonic flow) are shown by dashed lines; positive contours (enhanced cyclonic flow) are shown by solid lines.
Sea ice is most sensitive to the influence of SAM (particularly meridional forcing from its non-annular components and projection upon the ASL) during the seasons of JJA and SON, particularly the Ross and Bellingshausen seas (Simpkins et al., 2012). As shown in Sect. 3.1, the sign of sea ice trends in the Ross, Amundsen, Bellingshausen, and western Weddell seas has essentially reversed throughout the samples, which in the Amundsen and Bellingshausen seas is a gradual progression that precedes the recent record anomalous sea ice behaviour (Fig. 4a). The slope of the 30-year SIC trend patterns (the trend of the trends) is overlaid with contours showing the difference between the earliest and most recent pattern of the asymmetric SAM component (which Fig. 5e shows to be fairly consistent and gradual around much of the continent) for the average seasons of December to May (DJFMAM) and June to November (JJASON) (as in Arblaster and Meehl, 2006) (Fig. 7). Negative values (shown by dashed contour lines) indicate increasing anticyclonic flow and positive values the reverse. In both seasons, several regions show striking consistency between the slope of SIC trends and changes in the asymmetric SAM flow pattern. In the warmer months (DJFMAM), the negative slope of trend patterns in the Ross Sea is co-located with an increasingly anti-cyclonic pattern of asymmetric SAM flow (Fig. 7a). At the western edge of the Ross Sea, strengthened northerly flow suggests warmer surface temperatures aiding summer melt and dynamic effects of constraining equatorward ice transport; at the eastern boundary between the Ross and Amundsen seas, the enhanced southerly flow coincides with a negative SIC trend slope at the coast and positive slope nearer the ice edge, implying a dynamic effect of pushing more ice northward. Across the Amundsen and Bellingshausen seas, the cyclonic flow of asymmetric SAM is strengthened and shifted eastward, co-located with a positive SIC trend slope. Easterly flow over the Bellingshausen implies coastward constraining of the ice, while the thermodynamic and dynamic effects of northerly flow from the juxtaposition of the edges of the cyclonic and anticyclonic flow patterns are shifted eastward towards the Weddell Sea, where ice is compacted along the western boundary but reduced in the centre and eastwards over the Haakon VII Sea.
During the cool season months, JJASON, the intensified SAM asymmetry is similarly co-located with changes in SIC trends around much of the continent (Fig. 7b). Increasing SIC around the Dumont D'Urville region is overlaid by increasing northerly flow; Kimura et al. (2022) suggest this region is sensitive to dynamic changes more than thermodynamic changes, and the pattern implies that the increasing SIC slope in this part of East Antarctica could result from the coastward compaction of ice. A southward and longitudinal contraction of the anticyclonic flow over the Ross Sea and the juxtaposition of the opposing flow patterns of the Ross and Amundsen seas suggest enhanced northward flow and associated equatorward ice transport in the eastern Ross and western Amundsen seas, coincident with a positive SIC slope. By comparison, the eastward shift in this pattern and enhanced northerly flow over the western Ross Sea is co-located with a negative slope of SIC trends.
Not all regions around Antarctica show a clear relationship with the changes in asymmetric SAM, however. For example, during JJASON, strengthening mid-latitude anomalies north of the Weddell Sea result in enhanced westerly flow across the north of the Weddell region and diminished northerly flow at the western edge (Fig. 7b). This enables SIC to increase north of the western boundary; however, SIC decreases in the central and eastern Weddell Sea. Decadal sea ice variability is known to be high in this region (e.g. see annual average SIA anomalies in Fig. 2c). Multiple mechanisms have been identified as drivers of Weddell Sea decadal sea ice variability, including the strength of westerly winds: over the satellite period, sea ice increases in the Weddell Sea have been preceded by weakened zonal wind forcing towards the north, which leads to a reduction in equatorward ocean currents and less Ekman upwelling of warm water, producing cooler temperatures in the upper ocean and conditions favourable for sea ice production (Morioka and Behera, 2021). The increasingly zonal flow to the JJASON asymmetric SAM pattern in this region (Fig. 7b) suggests the opposite, though, implying increased northward currents, enhanced upwelling, and warmer upper-ocean temperature, with subsequent decreases in ice coverage. However, on longer timescales (∼20 years), sea ice in the Weddell Sea is also influenced by local atmosphere–ice–ocean interactions, in which decreased sea ice coverage in the Weddell Sea permits greater surface evaporation and thus higher salinity in the upper ocean, strengthening the Weddell Gyre which in turn reduces upper-ocean temperatures, producing conditions favourable for sea ice expansion (Morioka and Behera, 2021). Multiple analyses have shown that sea ice trends in the Weddell Sea are influenced by a combination of large-scale atmospheric forcing (including SAM) and synoptic-scale variability (Matear et al., 2015; Schroeter et al., 2017; Raphael and Hobbs, 2014), so in this region at least, the effect of a shifting SAM structure may be more tempered by other drivers than in other areas of West Antarctica upon which SAM has a strong influence. Similarly, around much of East Antarctica, sea ice anomalies are known to be dominated by synoptic variability and cyclonic activity rather than large-scale atmospheric modes (Matear et al., 2015; Schroeter et al., 2017; Turner et al., 2015), and therefore, despite increasing SAM asymmetry in these regions, sea ice trends between the Haakon VII and Davis seas show no clear corresponding response (Fig. 7b).

Figure 8Annual average regression coefficients of Southern Ocean SST between (a) 1979–2021, (b) 1992–2021, and (c) 2007–2021 and (d) 30-year running samples averaged over the region north of the ice edge (55 to 40∘ S). Lines are coloured from earliest (1979–2008, dark blue) to most recent (1992–2021, dark red) 30-year SST sample. Vertical lines indicate the approximate mid-point of each geographical location depicted by vertical text. Stippling shows regions where trend patterns are statistically significant (p<0.05).
3.3 Changes in Southern Ocean sea surface temperature
Climatological reconstructions suggest that sea surface temperature (SST) across the Southern Ocean increased across much of the early and mid-20th century before exhibiting a reversal in the late 1970s (Turney et al., 2017). In the decades following, a regime shift occurs towards a “warm state” in which the Indian Ocean and western boundary currents of the Southern Ocean warm but the high-latitude SSTs cool (Freitas et al., 2015). In line with the increase in mean Antarctic sea ice since 1979, high-latitude SSTs in the Southern Ocean have decreased, associated with strengthening westerly winds and negative pressure anomalies (Fan et al., 2014; Armour et al., 2016; Blanchard-Wrigglesworth et al., 2021). The shift to positive SAM is also associated with thermodynamic atmospheric changes, such as enhanced cooling and drying of the atmosphere overlying the high-latitude Southern Ocean, and reduced downwelling long-wave radiation, which lead to negative SST anomalies (Kusahara et al., 2017; Doddridge and Marshall, 2017). A non-monotonic, two-timescale Southern Ocean SST response to SAM is seen in many global coupled climate models, in which abrupt SST cooling through anomalous equatorward Ekman drift occurs under a transition to positive SAM, but gradually reverts towards a warming signal due to either advective or mixing-based mechanisms over the longer term (Kostov et al., 2017; Ferreira et al., 2015; Seviour et al., 2019; Doddridge et al., 2021). However, a warming SST signal has eluded the observational record thus far, with mechanisms such as eddy compensation potentially dampening the effect of wind-driven upwelling (Doddridge et al., 2019). Nonetheless, recent work shows that observed sea ice trend patterns cannot be explained by winds alone, requiring nudging of SST north of the sea ice edge towards observations in order to reproduce observed trends (Blanchard-Wrigglesworth et al., 2021). Given the close association of SST in the region north of the sea ice edge to both sea ice anomalies and SAM, as well as the shifting patterns of both, we now examine running anomalies of SST.
Although the long-term (1979–2021) trend of sea surface temperature (SST) within the sea ice zone and just north of the sea ice edge is negative, mid-latitude SSTs are increasing (Fig. 8a). Considering the regression coefficients of only the most recent 30-year period (1992–2021), the trend pattern is less widespread around the western Ross Sea but more so in the Amundsen and Bellingshausen seas (Fig. 8b). Over the last 15 years (2007–2021), however, a wave-3-like pattern of SST anomalies appears instead (Fig. 8c), bearing resemblance to the enhanced meridional pattern of SAM (Fig. 5d).
Regression coefficients of 30-year samples of SST anomalies north of the ice edge (55 to 40∘ S) show a reversal of the dipole between the region above the western and eastern Ross Sea; whereas in early 30-year samples the region north of the western Ross Sea was clearly cooling compared to warming to the east, SSTs are increasing across the region in the most recent sample (Fig. 8d). SSTs are also increasing north of the Bellingshausen Sea but declining sharply in recent samples across the neighbouring region above the Amundsen Sea. North of the Weddell Sea, 30-year trends of SSTs above the sea ice zone are decreasing to the west and showing little clear tendency above the central Weddell Sea. Only in the far east, adjacent to Haakon VII Sea, do SST trends show an increasing tendency before dropping again, in line with enhanced southerly flow under the increased asymmetry of SAM.
We use short-term running means and anomalies to show that, while climatological Antarctic sea ice has increased over the satellite record, the long-term pattern is dominated by the earliest years and is reversing across much of the sea ice zone, particularly in the Haakon VII, Ross, and Bellingshausen seas. The long-term trend of circumpolar sea ice anomalies shows a small expansion over time, which has long been cited as the result of high-magnitude opposing regional anomalies; however, the regional sea ice dipole has decreased over the past decade, with smaller but more spatially homogeneous compounding anomalies. Trends of anomalies based on running 30-year samples reveal a reversal of both the increasing trend in the Ross, Weddell, and Haakon VII seas and the decreasing trend in the Amundsen and Bellingshausen seas. Indeed, the most recent 30-year sample shows negative trends in the Ross and eastern Weddell seas, positive trends in the Amundsen and western Weddell seas, and close to zero trend in the Bellingshausen Sea. Though some of these trend patterns shift more abruptly due to the recent anomalous sea ice declines, the reversal in other regions has been consistent across the samples.
It is clear that the long-term circumpolar sea ice increase has been abruptly interrupted by the record low sea ice between 2016–2019, with the rate of decline over those few years equalling the rate of decline over 30 years in the Arctic (Handcock and Raphael, 2020; Parkinson, 2019; Eayrs et al., 2021). However, several studies using ice cores and whaling records also identified sharp sea ice declines in the decades preceding the satellite sea ice record, particularly in the late 1970s just prior to the launch of the satellite record (Kukla and Gavin, 1981; De La Mare, 1997, 2009; Curran et al., 2003; Cotte and Guinet, 2007). A recent reconstruction suggests that Antarctic sea ice declined through much of the period from 1905 until just prior to satellite observations, particularly in the Ross, Amundsen, and Haakon VII seas, and that the observed overall increasing trend since 1979 is unique in the context of the 20th century (Fogt et al., 2022). Simulations investigating multi-decadal sea ice trends which reproduced the small overall increase in Antarctic sea ice also produced decreasing sea ice in the decades prior to the satellite record (Goosse et al., 2009). That these sea ice declines were then followed by the observed overall increase for several decades raises speculation as to whether Antarctic sea ice is simply very responsive to sharp changes in atmospheric or oceanic conditions and is capable of recovering from those declines over the ensuing decades (Parkinson, 2019; Eayrs et al., 2021).
As the dominant mode of large-scale atmospheric circulation in the Southern Hemisphere, SAM has a strong impact on sea ice, particularly in the West Antarctic region (Lefebvre and Goosse, 2005; Lefebvre et al., 2004; Holland et al., 2017; Doddridge and Marshall, 2017; Stammerjohn et al., 2008; Schroeter et al., 2017; Raphael and Hobbs, 2014; O'kane et al., 2013b). Several studies have noted that, prior to 1978, Southern Hemisphere mid-latitude circulation was dominated by a metastable blocking regime, in which zonally symmetric circulation is suppressed in favour of heightened meridional motion (O'kane et al., 2013a; Freitas et al., 2015). Following the late 1970s, however, a regime shift occurred in all seasons in which SAM (which was previously associated with a transition state) replaced the negative phase of this blocking pattern, increasing zonally symmetric (annular) circulation in both frequency and intensity and reducing the occurrence and persistence of blocking (O'kane et al., 2013a; Freitas et al., 2015; Franzke et al., 2015). Surface air temperatures and Southern Ocean SSTs reflected the weakened blocking state (Freitas et al., 2015; O'kane et al., 2013b; Franzke et al., 2015), and the strength of the sub-tropical jet decreased, while upper-tropospheric zonal wind strength increased north of the sea ice zone (Frederiksen et al., 2011; Frederiksen and Frederiksen, 2007).
The shift towards positive SAM polarity in the austral summer months is often described as predominantly a forced response to external forcing from ozone depletion in the stratosphere and upper troposphere, as well as the combination of ozone depletion and increasing greenhouse gases in the lower troposphere, with smaller contributions of varying sign from natural sources (such as solar forcing and volcanic aerosols) and anthropogenic sulfate aerosols (Arblaster and Meehl, 2006; Fogt and Marshall, 2020). However, initial signs of recovery have been detected in ozone levels in the Antarctic stratosphere (Solomon et al., 2016), and as ozone levels recover, a previously complementary relationship between ozone depletion and increasing greenhouse gases driving zonally symmetric atmospheric forcing in the middle and high latitudes of the Southern Hemisphere will presumably become compensatory instead (Polvani et al., 2011). Model studies project that, depending on the level of emissions mitigation, continuing greenhouse gas increases and the associated radiative forcing can maintain the shift towards positive SAM (Shindell and Schmidt, 2004; Arblaster and Meehl, 2006; Holland et al., 2022). Furthermore, the atmospheric response of greenhouse gas and solar forcing contains more asymmetry than that of ozone (Arblaster and Meehl, 2006), and the effect of ozone is limited largely to the warmer months of the year, whereas greenhouse gases dominate when all seasons are considered (Franzke et al., 2015).
As SAM has a zonal-wave-3 structure embedded within it (Van Loon, 1972), the intensifying annular mode has in recent years undergone a shift towards its asymmetric component (Wachter et al., 2020; Campitelli et al., 2022), increasing meridional (north–south) flow over the sea ice zone. We show the co-location of spatial changes in the asymmetric component of SAM (and the corresponding north–south wind changes) with regions from Dumont D'Urville Sea to the Antarctic Peninsula where much of the spatial pattern of sea ice trends is reversing. Annual regional anomalies present a somewhat counterintuitive narrative, changing over time from strongly opposing anomalies (producing small circumpolar average anomalies) to more spatially homogeneous sea ice anomalies (which compound to large averages) despite the increasingly wave-3-like pattern of SAM. However, the pattern of annual anomalies does hint at the changing spatial asymmetry of SAM and SSTs, with a consistent sign of anomalies in the eastern Haakon VII, Ross, and Weddell seas where negative pressure is intensifying, as well as relatively small or neutral anomalies in the intervening regions where the wave-3 pattern is tending towards positive as the mid-latitude pressure anomalies shift south. Seasonal trends show a clear, opposing wave-3 trend pattern emerging during winter and spring, when the link between SAM and sea ice is strongest (Simpkins et al., 2012), which is diminished through annual averaging by opposing trends during summer and autumn. We also show that the increasing asymmetry of SAM does not fit well with sea ice anomalies around parts of East Antarctica and the Weddell Sea that are known to be dominated by other mechanisms (such as weather, tropical forcing, etc.), indicating that the influence of a changing SAM structure is most important in the regions (such as the Ross, Amundsen, and Bellingshausen seas) where SAM is known to strongly influence sea ice variability.
Though rebounding of sea ice has followed sharp declines in the past, an increase in the occurrence and intensity of the positive phase of SAM leads to increased temperatures in the sub-surface ocean, as well as increased upwelling close to the continent (Verfaillie et al., 2022), with substantial implications for sea ice as vertical heat transport and storage precondition sea ice for rapid retreat in the coming seasons (Doddridge et al., 2021). Our results also show that Southern Ocean SSTs are shifting away from circumpolar cooling in the sea ice zone towards an intensified regional pattern. Compared with earlier decades of the satellite record, the SST anomaly pattern north of the sea ice zone in recent years also alludes to the wave-3 pattern of the asymmetric SAM structure; if both the wave-3 SST pattern and warmer SSTs persist, a rapid sea ice recovery in coming years is unlikely.
The NSIDC monthly mean passive microwave satellite sea ice concentration climate data record is available at https://doi.org/10.7265/efmz-2t65 (Meier et al., 2021a). The daily near-real-time climate data record is available at https://doi.org/10.7265/tgam-yv28 (Meier et al., 2021b). The Japanese Meteorological Agency (JMA) global atmospheric reanalysis JRA-55 data are available at https://doi.org/10.5065/D60G3H5B (JMA, 2013). The Met Office Hadley Centre Sea Ice and Sea Surface Temperature dataset version 2 (HadISST.2.2.0.0) is available at https://www.metoffice.gov.uk/hadobs/hadisst/ (Titchner and Rayner, 2014).
The supplement related to this article is available online at: https://doi.org/10.5194/tc-17-701-2023-supplement.
SS designed the study, performed the analysis, created the plots, and drafted the manuscript. TJO'K and PAS provided important guidance, and all authors discussed and revised the manuscript.
The contact author has declared that none of the authors has any competing interests.
Publisher’s note: Copernicus Publications remains neutral with regard to jurisdictional claims in published maps and institutional affiliations.
Serena Schroeter was supported by a CSIRO Early Research Career Fellowship. This research/project was undertaken with the assistance of resources and services from the National Computational Infrastructure (NCI), which is supported by the Australian Government.
This paper was edited by Nicolas Jourdain and reviewed by two anonymous referees.
Arblaster, J. M. and Meehl, G. A.: Contributions of external forcings to southern annular mode trends, J. Climate, 19, 2896–2905, 2006.
Arguez, A. and Vose, R. S.: The definition of the standard WMO climate normal: The key to deriving alternative climate normals, B. Am. Meteorol. Soc., 92, 699–704, 2011.
Armour, K. C., Marshall, J., Scott, J. R., Donohoe, A., and Newsom, E. R.: Southern Ocean warming delayed by circumpolar upwelling and equatorward transport, Nat. Geosci., 9, 549–554, https://doi.org/10.1038/ngeo2731, 2016.
Bernades Pezza, A., Rashid, H. A., and Simmonds, I.: Climate links and recent extremes in Antarctic sea ice, high-latitude cyclones, Southern Annular Mode and ENSO, Clim. Dynam., 38, 57–73, 2012.
Blanchard-Wrigglesworth, E., Roach, L. A., Donohoe, A., and Ding, Q.: Impact of winds and Southern Ocean SSTs on Antarctic sea ice trends and variability, J. Climate, 34, 949–965, 2021.
Campitelli, E., Díaz, L. B., and Vera, C.: Assessment of zonally symmetric and asymmetric components of the Southern Annular Mode using a novel approach, Clim. Dynam., 58, 161–178, 2022.
Comiso, J. C., Gersten, R. A., Stock, L. V., Turner, J., Perez, G. J., and Cho, K.: Positive trend in the Antarctic sea ice cover and associated changes in surface temperature, J. Climate, 30, 2251–2267, 2017.
Cotte, C. and Guinet, C.: Historical whaling records reveal major regional retreat of Antarctic sea ice, Deep-Sea Res. Pt. I, 54, 243–252, 2007.
Curran, M. A., van Ommen, T. D., Morgan, V. I., Phillips, K. L., and Palmer, A. S.: Ice core evidence for Antarctic sea ice decline since the 1950s, Science, 302, 1203–1206, 2003.
de la Mare, W. K.: Abrupt mid-twentieth-century decline in Antarctic sea-ice extent from whaling records, Nature, 389, 57–60, https://doi.org/10.1038/37956, 1997.
de la Mare, W. K.: Changes in Antarctic sea-ice extent from direct historical observations and whaling records, Clim. Change, 92, 461–493, https://doi.org/10.1007/s10584-008-9473-2, 2009.
Doddridge, E. W. and Marshall, J.: Modulation of the Seasonal Cycle of Antarctic Sea Ice Extent Related to the Southern Annular Mode, Geophys. Res. Lett., 44, 9761–9768, https://doi.org/10.1002/2017GL074319, 2017.
Doddridge, E. W., Marshall, J., Song, H., Campin, J. M., Kelley, M., and Nazarenko, L.: Eddy compensation dampens Southern Ocean sea surface temperature response to westerly wind trends, Geophys. Res. Lett., 46, 4365–4377, 2019.
Doddridge, E. W., Marshall, J., Song, H., Campin, J.-M., and Kelley, M.: Southern Ocean heat storage, reemergence, and winter sea ice decline induced by summertime winds, J. Climate, 34, 1403–1415, 2021.
Eayrs, C., Holland, D., Francis, D., Wagner, T., Kumar, R., and Li, X.: Understanding the Seasonal Cycle of Antarctic Sea Ice Extent in the Context of Longer-Term Variability, Rev. Geophys., 57, 1037–1064, 2019.
Eayrs, C., Li, X., Raphael, M. N., and Holland, D. M.: Rapid decline in Antarctic sea ice in recent years hints at future change, Nat. Geosci., 14, 460–464, https://doi.org/10.1038/s41561-021-00768-3, 2021.
Fan, T., Deser, C., and Schneider, D. P.: Recent Antarctic sea ice trends in the context of Southern Ocean surface climate variations since 1950, Geophys. Res. Lett., 41, 2419–2426, https://doi.org/10.1002/2014GL059239, 2014.
Ferreira, D., Marshall, J., Bitz, C. M., Solomon, S., and Plumb, A.: Antarctic ocean and sea ice response to ozone depletion: A two-time-scale problem, J. Climate, 28, 1206–1226, https://doi.org/10.1175/JCLI-D-14-00313.1, 2015.
Fogt, R. L. and Marshall, G. J.: The Southern Annular Mode: variability, trends, and climate impacts across the Southern Hemisphere, Wiley Interdisciplinary Reviews, Clim. Change, 11, e652, https://doi.org/10.1002/wcc.652, 2020.
Fogt, R. L., Jones, J. M., and Renwick, J.: Seasonal zonal asymmetries in the Southern Annular Mode and their impact on regional temperature anomalies, J. Climate, 25, 6253–6270, 2012a.
Fogt, R. L., Wovrosh, A. J., Langen, R. A., and Simmonds, I.: The characteristic variability and connection to the underlying synoptic activity of the Amundsen-Bellingshausen Seas Low, J. Geophys. Res.-Atmos., 117, D07111, https://doi.org/10.1029/2011JD017337, 2012b.
Fogt, R. L., Sleinkofer, A. M., Raphael, M. N., and Handcock, M. S.: A regime shift in seasonal total Antarctic sea ice extent in the twentieth century, Nat. Clim. Change, 12, 54–62, 2022.
Franzke, C. L. E., O'Kane, T. J., Monselesan, D. P., Risbey, J. S., and Horenko, I.: Systematic attribution of observed Southern Hemisphere circulation trends to external forcing and internal variability, Nonlin. Processes Geophys., 22, 513–525, https://doi.org/10.5194/npg-22-513-2015, 2015.
Frederiksen, J., Frederiksen, C., Osbrough, S., and Sisson, J. M.: Changes in Southern Hemisphere rainfall, circulation and weather systems, 19th International Congress on Modelling and Simulation, Perth, Australia, 12–16 December 2011, 2712–2718, http://hdl.handle.net/102.100.100/102006?index=1, 2011.
Frederiksen, J. S. and Frederiksen, C. S.: Interdecadal changes in southern hemisphere winter storm track modes, Tellus A, 59, 599–617, 2007.
Freitas, A. C., Frederiksen, J. S., Whelan, J., O'Kane, T. J., and Ambrizzi, T.: Observed and simulated inter-decadal changes in the structure of Southern Hemisphere large-scale circulation, Clim. Dynam., 45, 2993–3017, 2015.
Gong, D. and Wang, S.: Definition of Antarctic oscillation index, Geophys. Res. Lett., 26, 459–462, 1999.
Goosse, H., Lefebvre, W., de Montety, A., Crespin, E., and Orsi, A. H.: Consistent past half-century trends in the atmosphere, the sea ice and the ocean at high southern latitudes, Clim. Dynam., 33, 999–1016, 2009.
Hall, A. and Visbeck, M.: Synchronous Variability in the Southern Hemisphere Atmosphere, Sea Ice, and Ocean Resulting from the Annular Mode, J. Climate, 15, 3043–3057, 2002.
Handcock, M. S. and Raphael, M. N.: Modeling the annual cycle of daily Antarctic sea ice extent, The Cryosphere, 14, 2159–2172, https://doi.org/10.5194/tc-14-2159-2020, 2020.
Haumann, F. A., Notz, D., and Schmidt, H.: Anthropogenic influence on recent circulation-driven Antarctic sea ice changes, Geophys. Res. Lett., 41, 8429–8437, https://doi.org/10.1002/2014GL061659, 2014.
Hobbs, W. R. and Raphael, M. N.: Characterizing the zonally asymmetric component of the SH circulation, Clim. Dynam., 35, 859–873, 2010.
Hobbs, W. R., Massom, R., Stammerjohn, S., Reid, P., Williams, G., and Meier, W.: A review of recent changes in Southern Ocean sea ice, their drivers and forcings, Global Planet. Change, 143, 228–250, https://doi.org/10.1016/j.gloplacha.2016.06.008, 2016.
Holland, M. M., Landrum, L., Kostov, Y., and Marshall, J.: Sensitivity of Antarctic sea ice to the Southern Annular Mode in coupled climate models, Clim. Dynam., 49, 1813–1831, 2017.
Holland, P. R.: The seasonality of Antarctic sea ice trends, Geophys. Res. Lett., 41, 4230–4237, https://doi.org/10.1002/2014GL060172, 2014.
Holland, P. R. and Kwok, R.: Wind-driven trends in Antarctic sea-ice drift, Nat. Geosci., 5, 872–875, https://doi.org/10.1038/ngeo1627, 2012.
Holland, P. R., O'Connor, G. K., Bracegirdle, T. J., Dutrieux, P., Naughten, K. A., Steig, E. J., Schneider, D. P., Jenkins, A., and Smith, J. A.: Anthropogenic and internal drivers of wind changes over the Amundsen Sea, West Antarctica, during the 20th and 21st centuries, The Cryosphere, 16, 5085–5105, https://doi.org/10.5194/tc-16-5085-2022, 2022.
JMA: JRA-55: Japanese 55-year Reanalysis, Monthly Means and Variances, Research Data Archive at the National Center for Atmospheric Research, Computational and Information Systems Laboratory [data set], https://doi.org/10.5065/D60G3H5B, 2013.
Kidson, J. W. and Sinclair, M. R.: The influence of persistent anomalies on Southern Hemisphere storm tracks, J. Climate, 8, 1938–1950, 1995.
Kimura, N., Onomura, T., and Kikuchi, T.: Processes governing seasonal and interannual change of the Antarctic sea-ice area, J. Oceanogr., 1–13, https://doi.org/10.1007/s10872-022-00669-y, 2022.
Kobayashi, S., Ota, Y., Harada, Y., Ebita, A., Moriya, M., Onoda, H., Onogi, K., Kamahori, H., Kobayashi, C., and Endo, H.: The JRA-55 reanalysis: General specifications and basic characteristics, J. Meteorol. Soc. Jpn., 93, 5–48, 2015.
Kostov, Y., Marshall, J., Hausmann, U., Armour, K. C., Ferreira, D., and Holland, M. M.: Fast and slow responses of Southern Ocean sea surface temperature to SAM in coupled climate models, Clim. Dynam., 48, 1595–1609, 2017.
Kukla, G. and Gavin, J.: Summer ice and carbon dioxide, Science, 214, 497–503, 1981.
Kusahara, K., Williams, G. D., Massom, R., Reid, P., and Hasumi, H.: Roles of wind stress and thermodynamic forcing in recent trends in Antarctic sea ice and Southern Ocean SST: An ocean-sea ice model study, Global Planet. Change, 158, 103–118, https://doi.org/10.1016/j.gloplacha.2017.09.012, 2017.
Lefebvre, W. and Goosse, H.: Influence of the Southern Annular Mode on the sea ice-ocean system: the role of the thermal and mechanical forcing, Ocean Sci., 1, 145–157, https://doi.org/10.5194/os-1-145-2005, 2005.
Lefebvre, W., Goosse, H., Timmermann, R., and Fichefet, T.: Influence of the Southern Annular Mode on the sea ice–ocean system, J. Geophys. Res.-Oceans, 109, C09005, https://doi.org/10.1029/2004JC002403, 2004.
Livezey, R. E., Vinnikov, K. Y., Timofeyeva, M. M., Tinker, R., and van den Dool, H. M.: Estimation and extrapolation of climate normals and climatic trends, J. Appl. Meteorol. Clim., 46, 1759–1776, 2007.
Mahlstein, I., Gent, P. R., and Solomon, S.: Historical Antarctic mean sea ice area, sea ice trends, and winds in CMIP5 simulations, J. Geophys. Res.-Atmos., 118, 5105–5110, https://doi.org/10.1002/jgrd.50443, 2013.
Marshall, G. J.: Trends in the Southern Annular Mode from Observations and Reanalyses, J. Climate, 16, 4134–4143, 2003.
Matear, R. J., O'Kane, T. J., Risbey, J. S., and Chamberlain, M.: Sources of heterogeneous variability and trends in Antarctic sea-ice, Nat. Commun., 6, 8656, https://doi.org/10.1038/ncomms9656, 2015.
Meehl, G. A., Arblaster, J. M., Chung, C. T., Holland, M. M., DuVivier, A., Thompson, L., Yang, D., and Bitz, C. M.: Sustained ocean changes contributed to sudden Antarctic sea ice retreat in late 2016, Nat. Commun., 10, 14, https://doi.org/10.1038/s41467-018-07865-9, 2019.
Meier, W. N., Fetterer, F., Windnagel, A. K., and Stewart, J. S.: Near-Real-Time NOAA/NSIDC Climate Data Record of Passive Microwave Sea Ice Concentration, Version 2, NSIDC: National Snow and Ice Data Center [data set], https://doi.org/10.7265/tgam-yv28, 2021a.
Meier, W. N., Fetterer, F., Windnagel, A. K., and Stewart, J. S.: NOAA/NSIDC Climate Data Record of Passive Microwave Sea Ice Concentration, Version 4, NSIDC: National Snow and Ice Data Center [data set], https://doi.org/10.7265/efmz-2t65, 2021b.
Mo, K. C. and Higgins, R. W.: The Pacific–South American Modes and Tropical Convection during the Southern Hemisphere Winter, Mon. Weather Rev., 126, 1581–1596, 1998.
Mo, K. C. and Paegle, J. N.: The Pacific–South American modes and their downstream effects, Int. J. Climatol., 21, 1211–1229, https://doi.org/10.1002/joc.685, 2001.
Morioka, Y. and Behera, S. K.: Remote and local processes controlling decadal sea ice variability in the Weddell Sea, J. Geophys. Res.-Oceans, 126, e2020JC017036, https://doi.org/10.1029/2020JC017036, 2021.
Morioka, Y., Iovino, D., Cipollone, A., Masina, S., and Behera, S. K.: Decadal Sea Ice Prediction in the West Antarctic Seas with Ocean and Sea Ice Initializations, Commun. Earth Environ., 3, 189, https://doi.org/10.1038/s43247-022-00529-z, 2022.
O'Kane, T. J., Risbey, J. S., Franzke, C., Horenko, I., and Monselesan, D. P.: Changes in the metastability of the midlatitude Southern Hemisphere circulation and the utility of nonstationary cluster analysis and split-flow blocking indices as diagnostic tools, J. Atmos. Sci., 70, 824–842, 2013a.
O'Kane, T. J., Matear, R. J., Chamberlain, M. A., Risbey, J. S., Sloyan, B. M., and Horenko, I.: Decadal variability in an OGCM Southern Ocean: Intrinsic modes, forced modes and metastable states, Ocean Model., 69, 1-21, 2013b.
Parkinson, C. L.: A 40-y record reveals gradual Antarctic sea ice increases followed by decreases at rates far exceeding the rates seen in the Arctic, P. Natl. Acad. Sci. USA, 116, 14414–14423, 2019.
Parkinson, C. L. and Cavalieri, D. J.: Antarctic sea ice variability and trends, 1979–2010, The Cryosphere, 6, 871–880, https://doi.org/10.5194/tc-6-871-2012, 2012.
Peng, G., Meier, W. N., Scott, D. J., and Savoie, M. H.: A long-term and reproducible passive microwave sea ice concentration data record for climate studies and monitoring, Earth Syst. Sci. Data, 5, 311–318, https://doi.org/10.5194/essd-5-311-2013, 2013.
Polvani, L. M., Waugh, D. W., Correa, G. J., and Son, S.-W.: Stratospheric ozone depletion: The main driver of twentieth-century atmospheric circulation changes in the Southern Hemisphere, J. Climate, 24, 795–812, 2011.
Raphael, M.: A zonal wave 3 index for the Southern Hemisphere, Geophys. Res. Lett., 31, L23212, https://doi.org/10.1029/2004GL020365, 2004.
Raphael, M., Marshall, G., Turner, J., Fogt, R., Schneider, D., Dixon, D., Hosking, J., Jones, J., and Hobbs, W.: The Amundsen Sea Low: Variability, Change and Impact on Antarctic Climate, B. Am. Meteorol. Soc., 97, 111–121, https://doi.org/10.1175/BAMS-D-14-00018.1, 2015.
Raphael, M. N. and Handcock, M. S.: A new record minimum for Antarctic sea ice, Nat. Rev. Earth Environ., 1–2, 2022.
Raphael, M. N. and Hobbs, W.: The influence of the large-scale atmospheric circulation on Antarctic sea ice during ice advance and retreat seasons, Geophys. Res. Lett., 41, 5037–5045, https://doi.org/10.1002/2014GL060365, 2014.
Raphael, M. N., Holland, M. M., Landrum, L., and Hobbs, W. R.: Links between the Amundsen Sea Low and sea ice in the Ross Sea: seasonal and interannual relationships, Clim. Dynam., 52, 2333–2349, 2019.
Roach, L. A., Dörr, J., Holmes, C. R., Massonnet, F., Blockley, E. W., Notz, D., Rackow, T., Raphael, M. N., O'Farrell, S. P., and Bailey, D. A.: Antarctic sea ice area in CMIP6, Geophys. Res. Lett., 47, e2019GL086729, https://doi.org/10.1029/2019GL086729, 2020.
Santer, B. D., Wigley, T., Boyle, J., Gaffen, D. J., Hnilo, J., Nychka, D., Parker, D., and Taylor, K.: Statistical significance of trends and trend differences in layer-average atmospheric temperature time series, J. Geophys. Res.-Atmos., 105, 7337–7356, 2000.
Schlosser, E., Haumann, F. A., and Raphael, M. N.: Atmospheric influences on the anomalous 2016 Antarctic sea ice decay, The Cryosphere, 12, 1103–1119, https://doi.org/10.5194/tc-12-1103-2018, 2018.
Schossler, V., Aquino, F. E., Reis, P. A., and Simões, J. C.: Antarctic atmospheric circulation anomalies and explosive cyclogenesis in the spring of 2016, Theor. Appl. Climatol., 141, 537–549, 2020.
Schroeter, S., Hobbs, W., and Bindoff, N. L.: Interactions between Antarctic sea ice and large-scale atmospheric modes in CMIP5 models, The Cryosphere, 11, 789–803, https://doi.org/10.5194/tc-11-789-2017, 2017.
Seviour, W., Codron, F., Doddridge, E. W., Ferreira, D., Gnanadesikan, A., Kelley, M., Kostov, Y., Marshall, J., Polvani, L., and Thomas, J.: The Southern Ocean sea surface temperature response to ozone depletion: a multimodel comparison, J. Climate, 32, 5107–5121, 2019.
Shindell, D. T. and Schmidt, G. A.: Southern Hemisphere climate response to ozone changes and greenhouse gas increases, Geophys. Res. Lett., 31, L18209, https://doi.org/10.1029/2004GL020724, 2004.
Shu, Q., Song, Z., and Qiao, F.: Assessment of sea ice simulations in the CMIP5 models, The Cryosphere, 9, 399–409, https://doi.org/10.5194/tc-9-399-2015, 2015.
Shu, Q., Wang, Q., Song, Z., Qiao, F., Zhao, J., Chu, M., and Li, X.: Assessment of sea ice extent in CMIP6 with comparison to observations and CMIP5, Geophys. Res. Lett., 47, e2020GL087965, https://doi.org/10.1029/2020GL087965, 2020.
Simmonds, I.: Comparing and contrasting the behaviour of Arctic and Antarctic sea ice over the 35 year period 1979–2013, Ann. Glaciol., 56, 18–28, 2015.
Simpkins, G. R., Ciasto, L. M., Thompson, D. W. J., and England, M. H.: Seasonal relationships between large-scale climate variability and antarctic sea ice concentration, J. Climate, 25, 5451–5469, https://doi.org/10.1175/JCLI-D-11-00367.1, 2012.
Solomon, S., Ivy, D. J., Kinnison, D., Mills, M. J., Neely III, R. R., and Schmidt, A.: Emergence of healing in the Antarctic ozone layer, Science, 353, 269–274, 2016.
Stammerjohn, S. E., Martinson, D. G., Smith, R. C., Yuan, X., and Rind, D.: Trends in Antarctic annual sea ice retreat and advance and their relation to El Niño-Southern Oscillation and Southern Annular Mode variability, J. Geophys. Res.-Oceans, 113, C03S90, https://doi.org/10.1029/2007JC004269, 2008.
Stuecker, M. F., Bitz, C. M., and Armour, K. C.: Conditions leading to the unprecedented low Antarctic sea ice extent during the 2016 austral spring season, Geophys. Res. Lett., 44, 9008–9019, 2017.
Thompson, D. W. J. and Wallace, J. M.: Annular Modes in the Extratropical Circulation. Part I: Month-to-Month Variability, J. Climate, 13, 1000–1016, https://doi.org/10.1175/1520-0442(2000)013<1000:AMITEC>2.0.CO;2, 2000.
Titchner, H. A. and Rayner, N. A.: The Met Office Hadley Centre sea ice and sea surface temperature data set, version 2: 1. Sea ice concentrations, J. Geophys. Res.-Atmos., 119, 2864–2889, https://doi.org/10.1002/2013JD020316, 2014 (data available at: https://www.metoffice.gov.uk/hadobs/hadisst/, last access: 9 February 2023).
Turner, J., Bracegirdle, T. J., Phillips, T., Marshall, G. J., and Scott Hosking, J.: An initial assessment of antarctic sea ice extent in the CMIP5 models, J. Climate, 26, 1473–1484, https://doi.org/10.1175/JCLI-D-12-00068.1, 2013a.
Turner, J., Phillips, T., Hosking, J. S., Marshall, G. J., and Orr, A.: The Amundsen Sea low, Int. J. Climatol., 33, 1818–1829, https://doi.org/10.1002/joc.3558, 2013b.
Turner, J., Hosking, J. S., Bracegirdle, T. J., Marshall, G. J., and Phillips, T.: Recent changes in Antarctic sea ice, Philos. T. Roy. Soc. A, 373, 20140163, https://doi.org/10.1098/rsta.2014.0163, 2015.
Turner, J., Phillips, T., Marshall, G. J., Hosking, J. S., Pope, J. O., Bracegirdle, T. J., and Deb, P.: Unprecedented springtime retreat of Antarctic sea ice in 2016, Geophys. Res. Lett., 44, 6868–6875, 2017.
Turner, J., Holmes, C., Caton Harrison, T., Phillips, T., Jena, B., Reeves-Francois, T., Fogt, R., Thomas, E. R., and Bajish, C.: Record low Antarctic sea ice cover in February 2022, Geophys. Res. Lett., 49, e2022GL098904, https://doi.org/10.1029/2022GL098904, 2022.
Turney, C. S. M., Fogwill, C. J., Palmer, J. G., van Sebille, E., Thomas, Z., McGlone, M., Richardson, S., Wilmshurst, J. M., Fenwick, P., Zunz, V., Goosse, H., Wilson, K.-J., Carter, L., Lipson, M., Jones, R. T., Harsch, M., Clark, G., Marzinelli, E., Rogers, T., Rainsley, E., Ciasto, L., Waterman, S., Thomas, E. R., and Visbeck, M.: Tropical forcing of increased Southern Ocean climate variability revealed by a 140-year subantarctic temperature reconstruction, Clim. Past, 13, 231–248, https://doi.org/10.5194/cp-13-231-2017, 2017.
van Loon, H.: Pressure in the southern hemisphere, in: Meteorology of the Southern hemisphere, Springer, 59–86, https://doi.org/10.1007/978-1-935704-33-1_4, 1972.
Verfaillie, D., Pelletier, C., Goosse, H., Jourdain, N. C., Bull, C., Dalaiden, Q., Favier, V., Fichefet, T., and Wille, J. D.: The circum-Antarctic ice-shelves respond to a more positive Southern Annular Mode with regionally varied melting, Commun. Earth Environ., 3, 139, https://doi.org/10.1038/s43247-022-00458-x, 2022.
Wachter, P., Beck, C., Philipp, A., Höppner, K., and Jacobeit, J.: Spatiotemporal variability of the Southern Annular Mode and its influence on Antarctic surface temperatures, J. Geophys. Res.-Atmos., 125, e2020JD033818, https://doi.org/10.1029/2020JD033818, 2020.
Wang, G., Hendon, H. H., Arblaster, J. M., Lim, E.-P., Abhik, S., and van Rensch, P.: Compounding tropical and stratospheric forcing of the record low Antarctic sea-ice in 2016, Nat. Commun., 10, 13, https://doi.org/10.1038/s41467-018-07689-7, 2019.
Wang, J., Luo, H., Yang, Q., Liu, J., Yu, L., Shi, Q., and Han, B.: An Unprecedented Record Low Antarctic Sea-ice Extent during Austral Summer 2022, Adv. Atmos. Sci., 39, 1591–1597, https://doi.org/10.1007/s00376-022-2087-1, 2022.
Zwally, H. J., Comiso, C., Parkinson, C. L., Campbell, W. J., Carsey, F. D., and Gloersen, P.: Antarctic Sea Ice, 1973–1976: Satellite Passive-Microwave Observations, NASA SP-459, NASA Special Publication, 459, 1983.