the Creative Commons Attribution 4.0 License.
the Creative Commons Attribution 4.0 License.
 | 08 Feb 2023
Lake volume and potential hazards of moraine-dammed glacial lakes – a case study of Bienong Co, southeastern Tibetan Plateau
Hongyu Duan
Xiaojun Yao
Yuan Zhang
Huian Jin
Qi Wang
Zhishui Du
Jiayu Hu
Bin Wang
Qianxun Wang
The existence of glacial lakes in the southeastern Tibetan Plateau (SETP) is a potential hazard to downstream regions, as the outburst of such lakes has the potential to result in disastrous glacial lake outburst floods (GLOFs). In the present study, we conducted a comprehensive investigation of Bienong Co, a moraine-dammed glacial lake in the SETP. First, the lake basin morphology was determined, and the lake volume was estimated, showing that the maximum lake depth is ∼181 m and the lake volume is m3. These scenarios included the possibility of GLOFs being triggered by ice avalanches (Scenarios A1–3) from the mother glacier or by landslides from the lateral moraines (Scenarios B1–3 and C1–3). Avalanche volumes of the nine trigger scenarios were obtained from the Rapid Mass Movement Simulation (RAMMS) modeling results. Next, the Basic Simulation Environment for Computation of Environmental Flow and Natural Hazard Simulation (BASEMENT) model was used to simulate the generation and propagation of the avalanche-induced displacement waves in the lake. With the model, the overtopping flows and erosion on the moraine dam and the subsequent downstream floods were also simulated. The results indicate that the ice avalanche scenario may cause the largest mass volume entering the lake, resulting in a displacement wave up to 25.2 m in amplitude (Scenario A3) near the moraine dam. Landslide scenarios with smaller volumes entering the lake result in smaller displacement waves. Scenarios A1, A2, and A3 result in released water volumes from the lake of 24.1×10⁶, 25.3×10⁶, and 26.4×10⁶ m3, respectively. Corresponding peak discharges at the moraine dam are 4996, 7817, and 13 078 m3 s−1, respectively. These high discharges cause erosion of the moraine dam, resulting in breach widths of 295, 339, and 368 m, respectively, with the generally similar breach depth of approximately 19 m. In landslide scenarios, only overtopping flows generated by Scenarios B3 and C3 cause erosion on the moraine dam, with breach depths of 6.5 and 7.9 m and breach widths of 153 and 169 m, respectively. According to our simulations, GLOFs generated by Scenarios A1–3 all flow through 18 settlements downstream in 20 h, threatening more than half of them. Both Scenarios B3 and C3 produce GLOFs that flow through the first eight settlements downstream in 20 h and have a relatively small impact on them. Comparisons of the area, depth, and volume of glacial lakes for which the bathymetry data are available show that Bienong Co is the deepest known glacial lake with the same surface area on the Tibetan Plateau. This study could provide a new insight into moraine-dammed glacial lakes in the SETP and be a valuable reference for GLOF disaster prevention for the local government.
- Article
(15574 KB) - Full-text XML
- BibTeX
- EndNote


Due to global warming, the accelerated retreat and thinning of glaciers has occurred in most regions compared to the last century (Zemp et al., 2019), resulting in a rapid increase in the number, area, and volume of glacial lakes worldwide (Shugar et al., 2020; Wang et al., 2020). Glacial meltwater can be confined and stored in certain depressions dammed by moraine, ice, or bedrock (Vilímek et al., 2013). Once the dam is damaged, the water can be suddenly released to form glacial lake outburst floods (GLOFs), which could have a significant downstream social and geomorphic impact across several dozens of kilometers (Lliboutry, 1977; Richardson and Reynolds, 2000; Osti and Egashira, 2009; Carrivick and Tweed, 2016; Cook et al., 2018; Harrison et al., 2018; Zheng et al., 2021). Moraine-dammed glacial lakes are of particular concern due to their vast volumes (Fujita et al., 2013; Veh et al., 2019), weak dam composition, and exposure to various triggers, such as ice or rock avalanches, heavy precipitation, and intense glacier meltwater (Emmer and Cochachin, 2013; Nie et al., 2018). The Himalayas and the southeastern Tibetan Plateau (SETP) are regions of frequent GLOFs caused by moraine-dammed glacial lakes (Wang, 2016). Veh et al. (2019) deemed that the Himalayas, particularly the southern region, would likely experience more GLOFs in the coming decades.
The SETP is a broad mountainous region with highly complicated terrains, including the central and eastern Nyainqêntanglha ranges, the eastern Himalayas, and the western Hengduan Mountains (Ke et al., 2014). A substantial number of temperate glaciers have developed here under the influence of the warm and humid Indian monsoons (Yang et al., 2008). These glaciers have characteristics of adequate recharge, intense ablation, low snowline distribution, high temperature, fast movements, and strong geomorphological effects (Li et al., 1986; Qin et al., 2012; Liu et al., 2014). In the past decades, glaciers in this region have undergone significant negative mass balances (Kääb et al., 2012; Neckel et al., 2014; Kääb et al., 2015; Brun et al., 2017; Dehecq et al., 2019). Therefore, the combination of active glacial processes and heavy rainfall during the monsoon season makes the region prone to glacier-related natural hazards (X. Wang et al., 2012b). Studies of glacial lakes in the SETP have mainly focused on the regional-scale assessments of glacial lake changes (Wang et al., 2011b; Song et al., 2016; Wang et al., 2017; Zhang et al., 2020, 2021), identifications of potentially dangerous glacial lakes (Wang et al., 2011b; Liu et al., 2019; Duan et al., 2020; Qi et al., 2020), site-specific analyses of formation mechanisms, development trends, risk evolution and management measures of GLOFs (Cui et al., 2003; Cheng et al., 2008, 2009; Sun et al., 2014; Liu et al., 2021; Wang et al., 2021), and explorations of geological features of an individual glacial lake (Yuan et al., 2012; Liu et al., 2015; Huang et al., 2016). Fewer studies applied hydrodynamic models to simulate GLOFs in the SETP. Wang et al. (2011a) evaluated the applicability of the ASTER GDEM (the global digital elevation model) and the Shuttle Radar Topography Mission (SRTM) DEM in GLOF simulations based on the HEC-RAS hydrodynamic model (Brunner, 2002). Zheng et al. (2021) reconstructed the GLOF process chain of Jinwu Co using published empirical relationships and the GIS-based r.avaflow model (Mergili et al., 2017; Pudasaini and Mergili, 2019; Mergili and Pudasaini, 2020).
Lake volume is a key factor related to the peak discharge and drainable volume of a GLOF event (Evans, 1987; Huggel et al., 2002), but it is difficult to obtain using a remote sensing approach directly. Currently, the volume of a glacial lake is generally estimated using empirical formulas and its area information from remote sensing images. Empirical formulas linking the area and volume of glacial lakes were generally developed based on the bathymetry data of a small number of glacial lakes (O'Connor et al., 2001; Huggel et al., 2002; Yao et al., 2014). However, the estimated volume may be inaccurate because of the unique geographical conditions of different glacial lakes (Cook and Quincey, 2015). Despite the high incidence of GLOFs in the SETP region (Sun et al., 2014; Zheng et al., 2021; Zhang et al., 2023), there are few available bathymetry data of glacial lakes. The previous bathymetry works on the Tibetan Plateau were carried out mainly for glacial lakes located in the Himalayas (LIGG/WECS/NEA, 1988; Geological Survey of India, 1995; Yamada, 1998; Mool et al., 2001; Sakai et al., 2003; Yamada et al., 2004; ICIMOD, 2011; Sakai, 2012; Yao et al., 2012; Wang et al., 2015; Haritashya et al., 2018; Sharma et al., 2018; Li et al., 2021). It is unfavorable to fully understand the morphology of glacial lakes and the optimal disaster prevention strategy in the SETP region. In recent years, unmanned surface vessels (USVs) have developed rapidly (Liu et al., 2016) and have been widely used in specific scenarios, such as bathymetric map creation, transportation, environmental monitoring, and marine surveys (Larrazabal and Peñas, 2016; Yan et al., 2010; Specht et al., 2019), due to personnel safety and the high flexibility in complex environments. Glacial lakes are mainly located at high altitudes and in harsh environments (Zhang et al., 2020). The application of USVs makes the underwater topography measurement of glacial lakes more accurate, efficient, and safer (Li et al., 2021).
In this study, we aim to complete an investigation of the potential GLOF hazard of a moraine-dammed glacial lake, Bienong Co (“Co” means “lake” in Tibetan) in the SETP based on field bathymetric data and remote sensing data using a multi-model combination method. First, we determined the lake basin morphology of Bienong Co. Then, we simulated the GLOF process chain starting with the initial mass movements from the mother glacier and the lateral moraines, the generation and propagation of displacement waves in the lake, the overtopping flows and erosion on the moraine dam, and the subsequent downstream floods. This study will assist the local government in understanding the potential hazards of Bienong Co and serve as a reference for studying glacial lakes and GLOFs in the SETP region.
Bienong Co is located in the upper region of the Yi'ong Zangbo (“Zangbo” means “river” in Tibetan) basin (30∘05′–31∘03′ N, 92∘52′–95∘19′ E) in the SETP (Fig. 1a). As a one-level tributary of the Parlung Zangbo and a two-level tributary of the Yarlung Zangbo (i.e., the Brahmaputra River), the Yi'ong Zangbo drains an area of 13 533 km2. With tall mountains and deep valleys, the terrain is high in the west and low in the east. The region experiences a warm and humid climate with a mean annual precipitation of 958 mm and a mean annual temperature of 8.8 ∘C (Ke et al., 2013, 2014). In 2016, there were 105 moraine-dammed glacial lakes with a total area of 16.87 km2 in the Yi'ong Zangbo basin (Duan et al., 2020). Seven glacial lakes in the basin, including Bienong Co, were considered to have high GLOF potential (Duan et al., 2020), of which Jinwu Co failed on 26 June 2020 (Zheng et al., 2021). Three catastrophic GLOFs have occurred in the Yi'ong Zangbo basin as of 2021, all of which significantly damaged infrastructure downstream (Sun et al., 2014; Yao et al., 2014; Zheng et al., 2021) (Fig. 1b). Bienong Co is a moraine-dammed lake constrained by the mother glacier (Mulang Glacier) to the south and a massive unconsolidated moraine dam to the northwest (Fig. 1c). In 2021, it had an area of 1.15±0.05 km2 and a surface elevation of 4745 m. Mulang Glacier, which has remained stable in size over the past 45 years, had an area of 8.29±0.22 km2 with an average surface slope of ∼18.28∘ in 2021. The glacier ablation zone, however, underwent an intense thinning at a speed of −6.5 m a−1. One of the major tributaries of the upper Yi'ong Zangbo, Xiong Qu (“Qu” means “river” in Tibetan), receives the outflow from Bienong Co (Fig. 1b). The flow channel from Bienong Co to the confluence of Xiong Qu and Song Qu (the other major tributary of the upper Yi'ong Zangbo) is ∼53 km long with a longitudinal drop ratio of 14.48 ‰. There are 18 settlements, 13 bridges, and a substantial area of cultivated land along the flow channel. Additionally, the Jiazhong highway extends adjacent to the river (Fig. 1d).
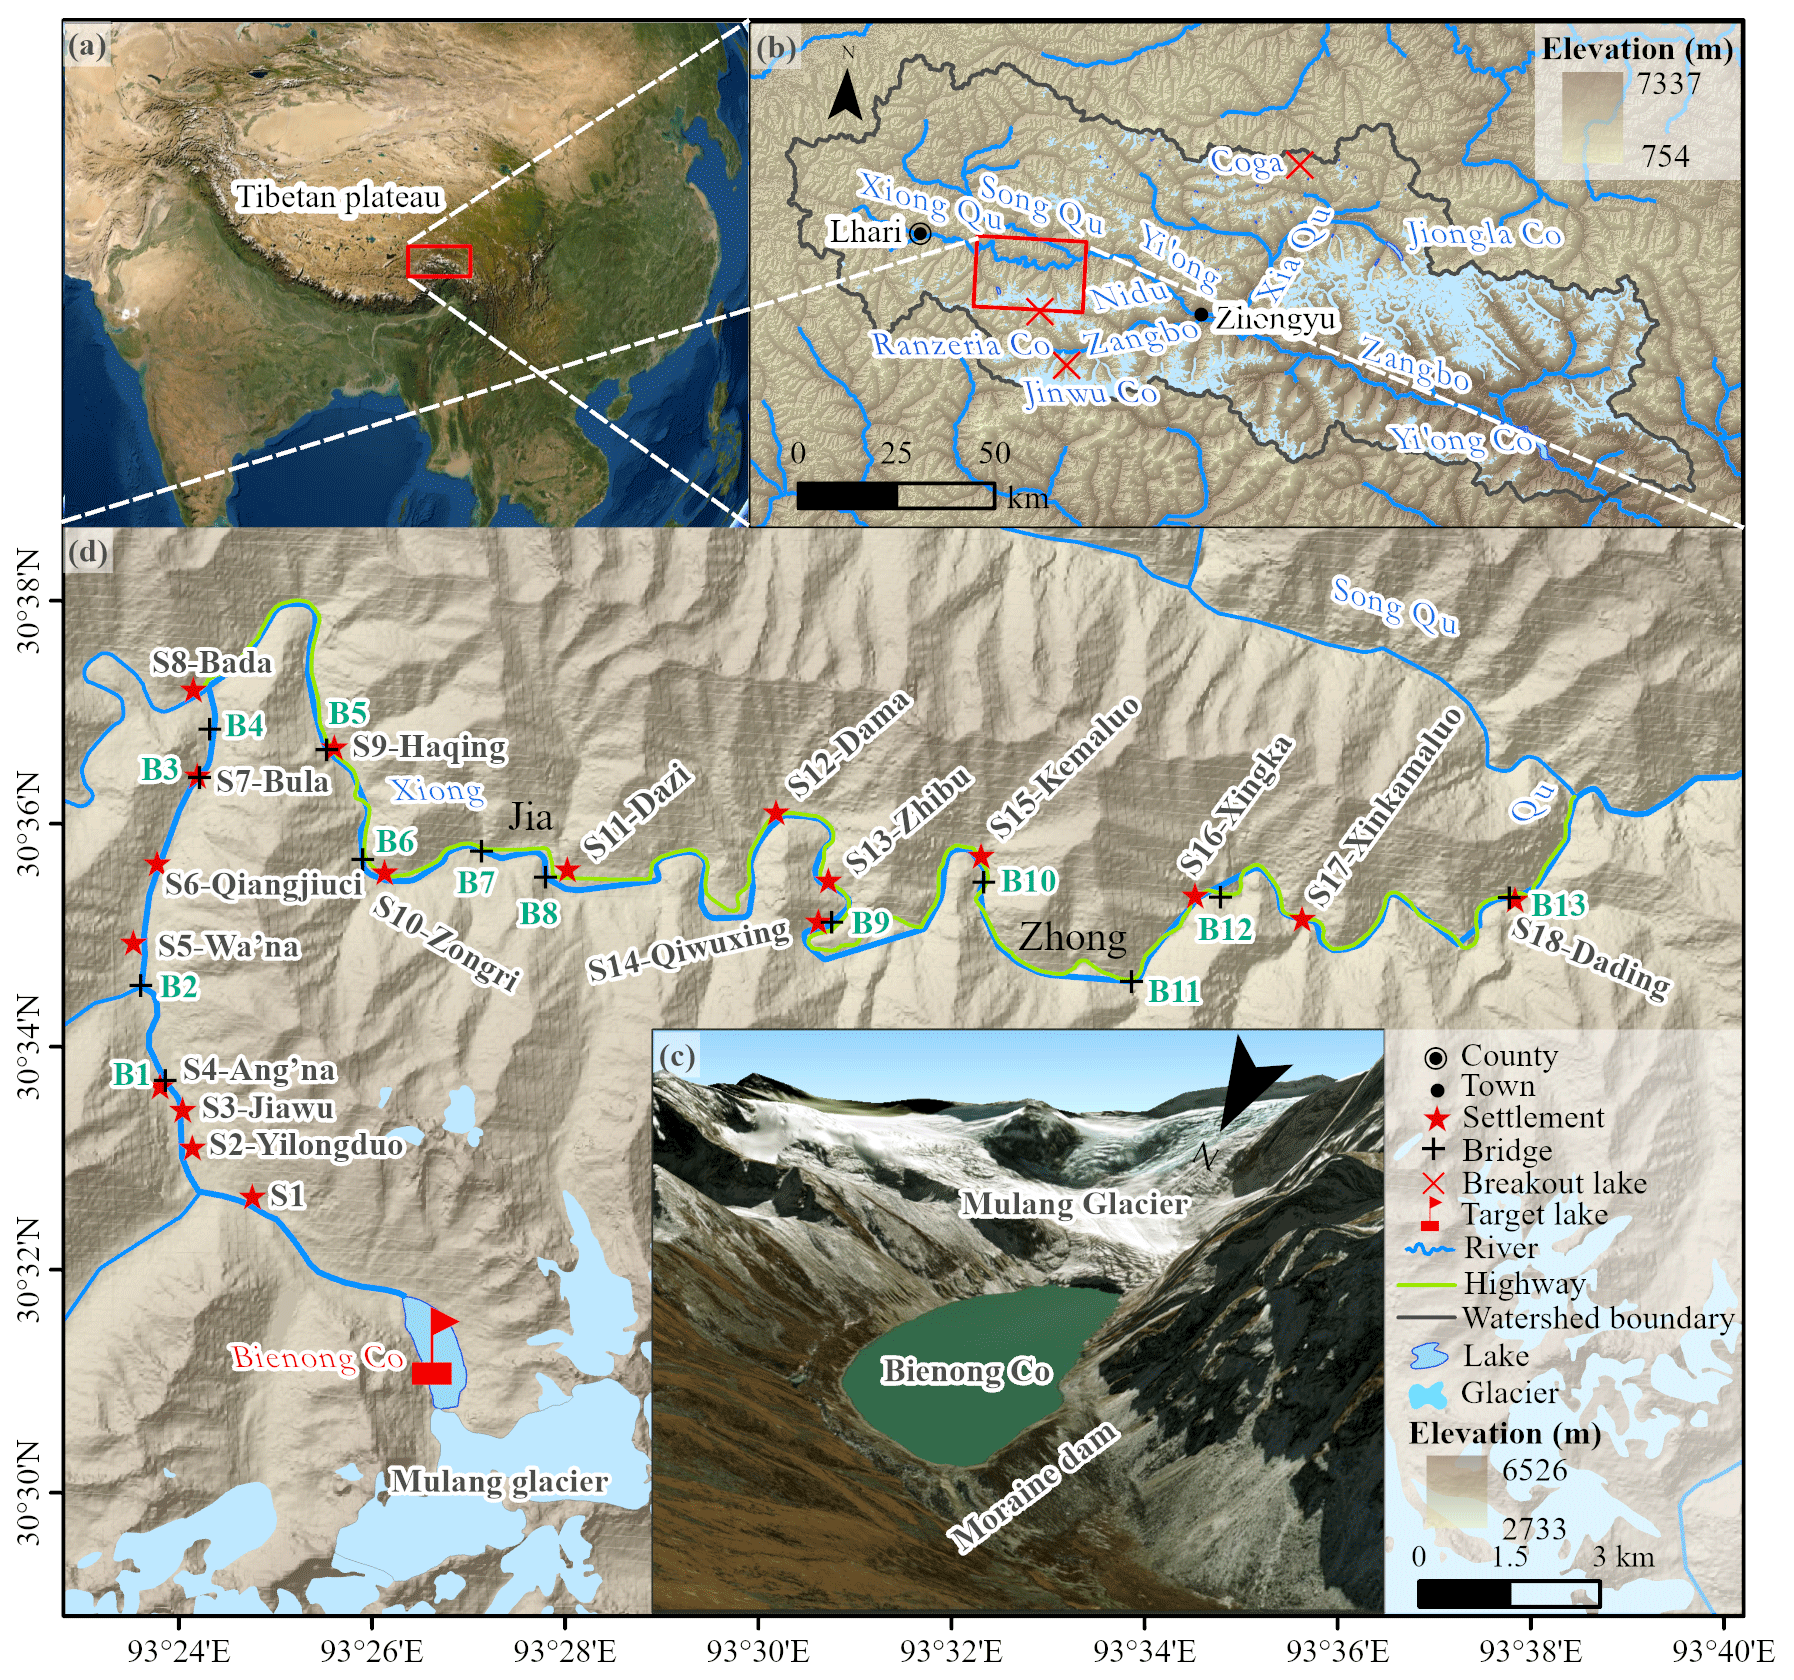
Figure 1Overview of the study area. (a) The location of the Yi'ong Zangbo basin, (b) the location of Bienong Co, (c) a close view of Bienong Co, and (d) the distribution of settlements and bridges within ∼53 km downstream of Bienong Co. The background of panels (a) and (c) is a MapWorld image, based on which settlements, bridges, and the Jiazhong highway along the flow channel are identified. The background of panels (b) and (d) is the Advanced Land Observing Satellite (ALOS) Phased Array type L-band Synthetic Aperture Radar (PALSAR) digital elevation model (DEM).
The area of Bienong Co has changed minimally over the last 40 years. However, the area of 1.15±0.05 km2 in 2021 was nearly twice as large as the two nearby outburst moraine-dammed glacial lakes, Jinwu Co (Zheng et al., 2021) and Ranzeria Co (Sun et al., 2014; Zhang et al., 2022), which are only 24 and 9 km to the southeast of Bienong Co, respectively. With an average height of 72 m, Bienong Co's moraine dam encloses a water volume of 65.2×10⁶ m3, accounting for 64 % of the total lake volume (Fig. 2e). Overall, the greater the volume of water retained in the lake, the greater the volume of water available for a potential flood (Westoby et al., 2014) and the greater the hazard caused by a GLOF. GLOFs are highly complicated phenomena, each being a unique individual event influenced by triggers, lake geometries, the composition and structural integrity of the moraine dam, and the topography and geology of the flow path (Westoby et al., 2014). According to historical GLOF studies, the most common cause of glacial lakes' failure in the Himalayas is overtopping and erosion of moraine dams (Risio et al., 2011) triggered by mass movements (snow, ice, rock, or mixtures) entering lakes (Richardson and Reynolds, 2000; X. Wang et al., 2012a; Emmer and Cochachin, 2013; Worni et al., 2014). Mulang Glacier directly connects to Bienong Co; its tongue (here is the ablation zone) contains well-developed ice crevasses with an average slope of 20∘ (Fig. 2a and b). According to Lv et al. (1999), ice avalanches are more likely to occur when the slope of the mother glacier tongue is greater than 8∘. Moreover, climate-warming-induced glacial meltwater can lubricate glaciers, increasing the possibility of overhanging ice sliding into lakes (Wang et al., 2015). Therefore, Mulang Glacier's ice disintegration may be a potential trigger of the GLOF of Bienong Co. Additionally, the GLOF of Jinwu Co was triggered by an initial moraine landslide with a slope range of 30–45∘ on the left side (Zheng et al., 2021). According to Bolch et al. (2011) and Rounce et al. (2016), non-glacierized areas around lakes with a slope greater than 30∘ are potential locations of rockfall, landslide, or other solid mass movements. Around Bienong Co, multiple moraine-covered places fit into the slope range (Fig. 2c–e). Therefore, lateral moraine landslides may also be a potential trigger of Bienong Co's GLOF.
The stability of a moraine dam is affected by several parameters, including the geometry features (freeboard, width-to-height ratio, distal face slope), the material property, and the ice-cored condition (Huggel et al., 2004; Wang et al., 2011b; Prakash and Nagarajan, 2017). Freeboard is the vertical distance between the lake surface and the lowest point on the dam crest, which reflects the minimum wave amplitude necessary for overtopping to occur (Emmer and Vilímek, 2014). A higher freeboard does not favor the occurrence of overtopping. A natural outlet with a width of ∼50 m is on the right (facing downstream) of the moraine dam (Fig. 2e and f). As a result, the freeboard of Bienong Co is 0 m, indicating a high potential of overtopping. The moraine dam has a width of ∼520 m and an average height of ∼72 m, giving a width-to-height ratio of 7.2 (Fig. 2e). According to the thresholds favoring GLOFs with a dam width smaller than 60 m proposed by Lv et al. (1999) and a width-to-height ratio smaller than 0.2 proposed by Huggel et al. (2004), the moraine dam of Bienong Co is stable. However, the freeboard of 0 m and the distal-facing slope of 35∘ are instability conditions of the moraine dam based on the favorable thresholds smaller than 25 m (Mergili and Schneider, 2011) and larger than 20∘ (Lv et al., 1999). The surface layer of the moraine dam of Bienong Co is made of larger-grained stones covered with vegetation. Tiny granules of loose moraines make up the lower layer, which is easily destroyed by water force (Fig. 2e). The existence of ice cores within the moraine dam of Bienong Co is unknown. However, there are none in Jinwu Co's breached dam, which is ∼320 m lower than the former. Furthermore, according to Mckillop and Clague (2007), moraine dams with rounded surfaces and minor superimposed ridges are considered ice-cored; in contrast, narrow, sharp-crested moraines with angular cross-sections are regarded as ice-free. The moraine dam of Bienong Co fits the latter category.
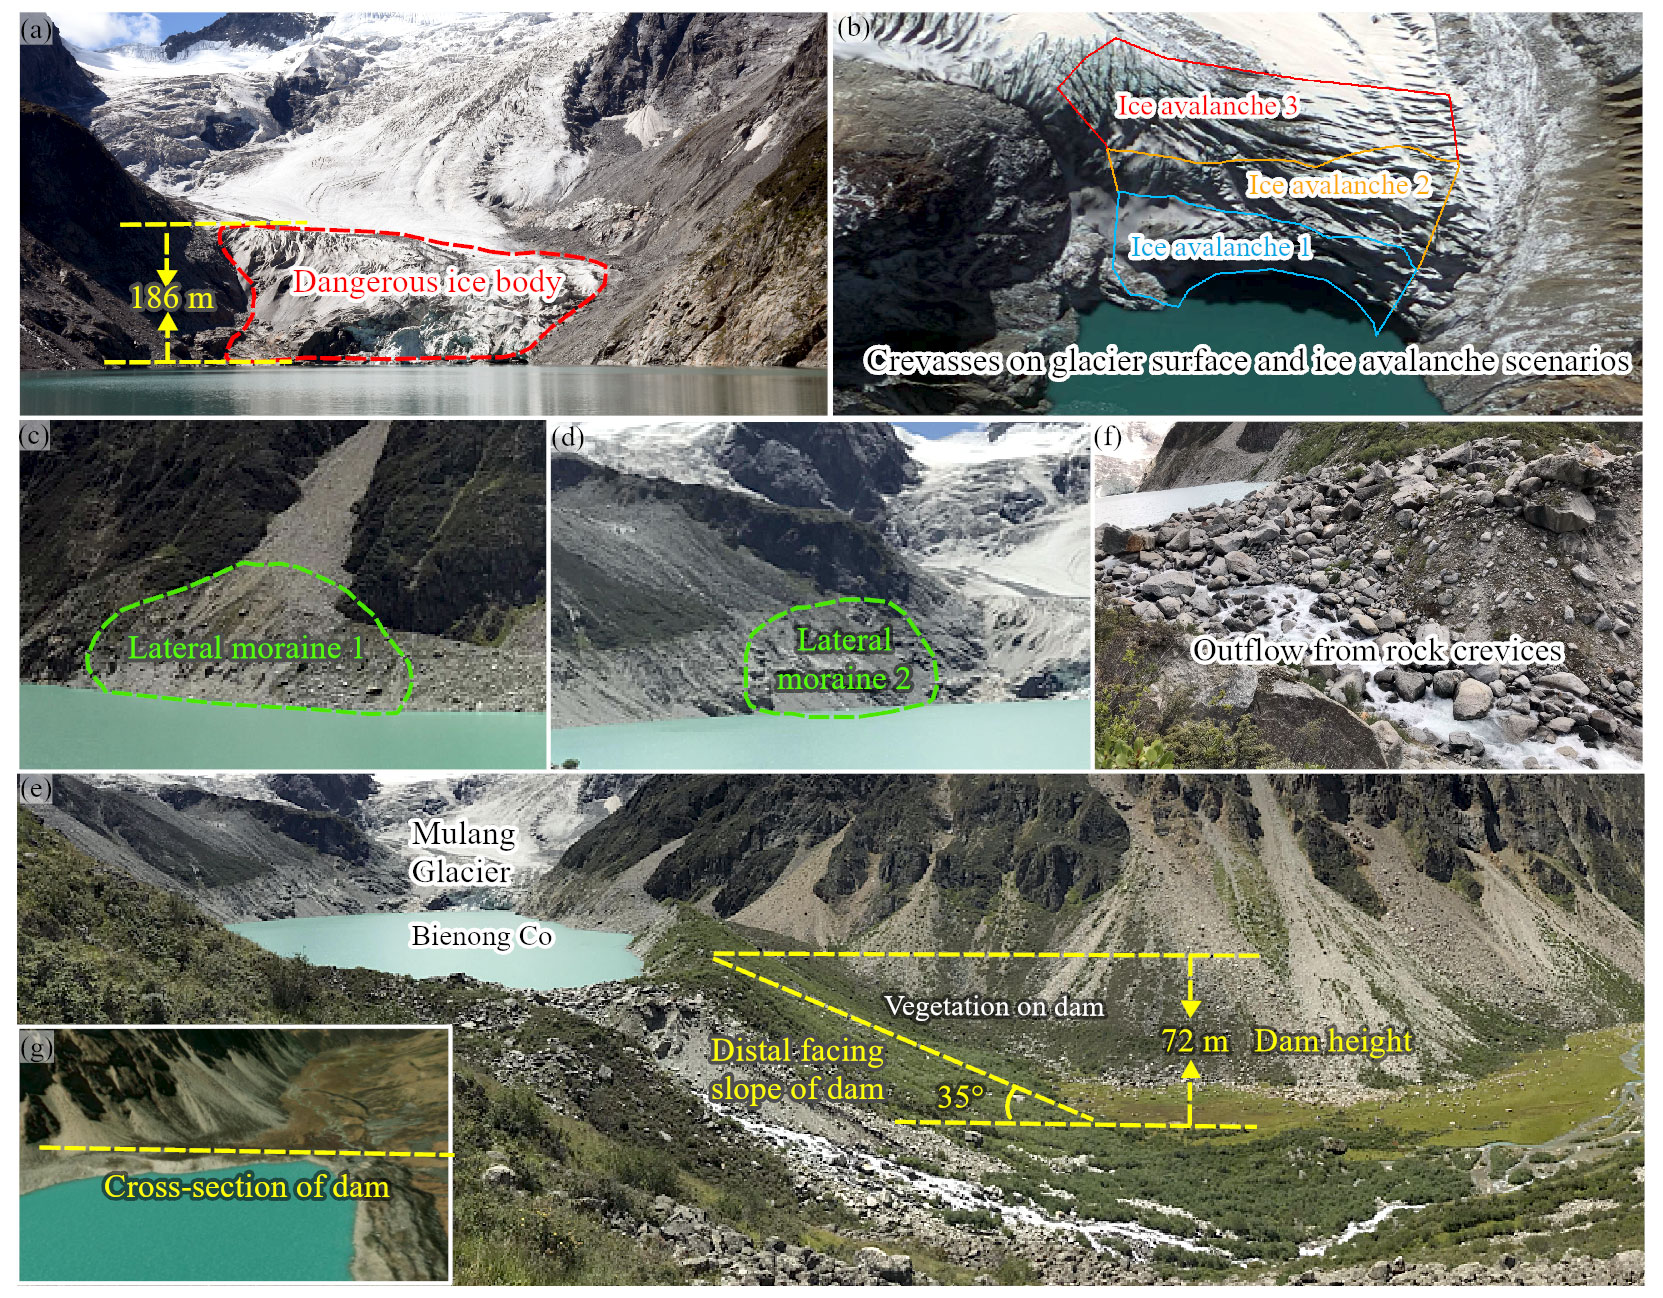
Figure 2The hazard assessment of Bienong Co. (a) The connection condition of Mulang Glacier and Bienong Co, (b) the crevasses on the glacier surface and the assumed ice avalanche scenarios of Mulang Glacier, (c) and (d) the assumed lateral moraine location, (e) and (f) the moraine dam of Bienong Co, and (g) a cross-section of the moraine dam for statistical purposes. Panels (b) and (g) are based on a MapWorld image, while the other photographs were taken by Xiaojun Yao and Qi Wang on 27 August 2020.
3.1 Bathymetry and modeling
Lake bathymetry data can be used to depict the underwater topography and calculate the lake volume, which is one of the most critical parameters for the simulation of the GLOF process chain (Westoby et al., 2014). In this study, the bathymetry data of Bienong Co were obtained using a USV (APACHE 3) system, which consists of four main parts: the data acquisition module, the data transmission module, the positioning and navigation control module, and the power module (Li et al., 2021) (Fig. 3a and b). The USV system has a draft of 10 cm, which is smaller than the inflatable kayaks used in previous investigations (Haritashya et al., 2018; Sattar et al., 2019, 2021). The D230 single-frequency depth sounder mounted on the USV has a measurement range of 0.15–300 m with a depth resolution of 1 cm and a bathymetry error of ±1 cm + 0.1 % ×h (water depth). The sounder can operate at 200 kHz and a water temperature range of −30–60 ∘C. Meanwhile, a real-time kinematic system enables precise positioning for the bathymetric position with a horizontal error of ±8 mm, a vertical error of ±15 mm, and a directional error of 0.2∘ on the 1 m baseline. Field investigation was carried out on 27 August 2020. We designed four longitudinal routes and 13 transverse routes before the survey, along which the measurements were conducted (Fig. 3c). The maximum speed of the USV can reach 8 m s−1, and our survey was carried out at a speed of 2 m s−1 over a total route of 22.58 km in Bienong Co. With no obstructions in the lake, the USV's strong performance and the real-time monitoring allowed the survey to be accurately completed along the designed route. A total of 16 020 valid sounding points were measured, essentially covering the entire glacial lake, which fulfilled the data density requirement to model the lake basin topography of Bienong Co (Fig. 3c).
The DEM of the lake basin was created within ArcGIS Pro software using the natural neighbor interpolation algorithm (Thompson et al., 2016; Haritashya et al., 2018; Watson et al., 2018). In addition, Surfer software was employed to simulate the 3D morphology of Bienong Co's lake basin. Lake volume can be understood as the volume between a certain spatial curved surface and a certain horizontal surface (Shi et al., 1991). In this study, the volume of Bienong Co was obtained by multiplying the depth value and the DEM resolution (5 m) as follows:
where V is the volume (m3) of Bienong Co, Hi is the depth (m) at the ith pixel, n is the number of pixels in the lake area, and λ is the pixel resolution (m2) of the DEM of the lake basin.
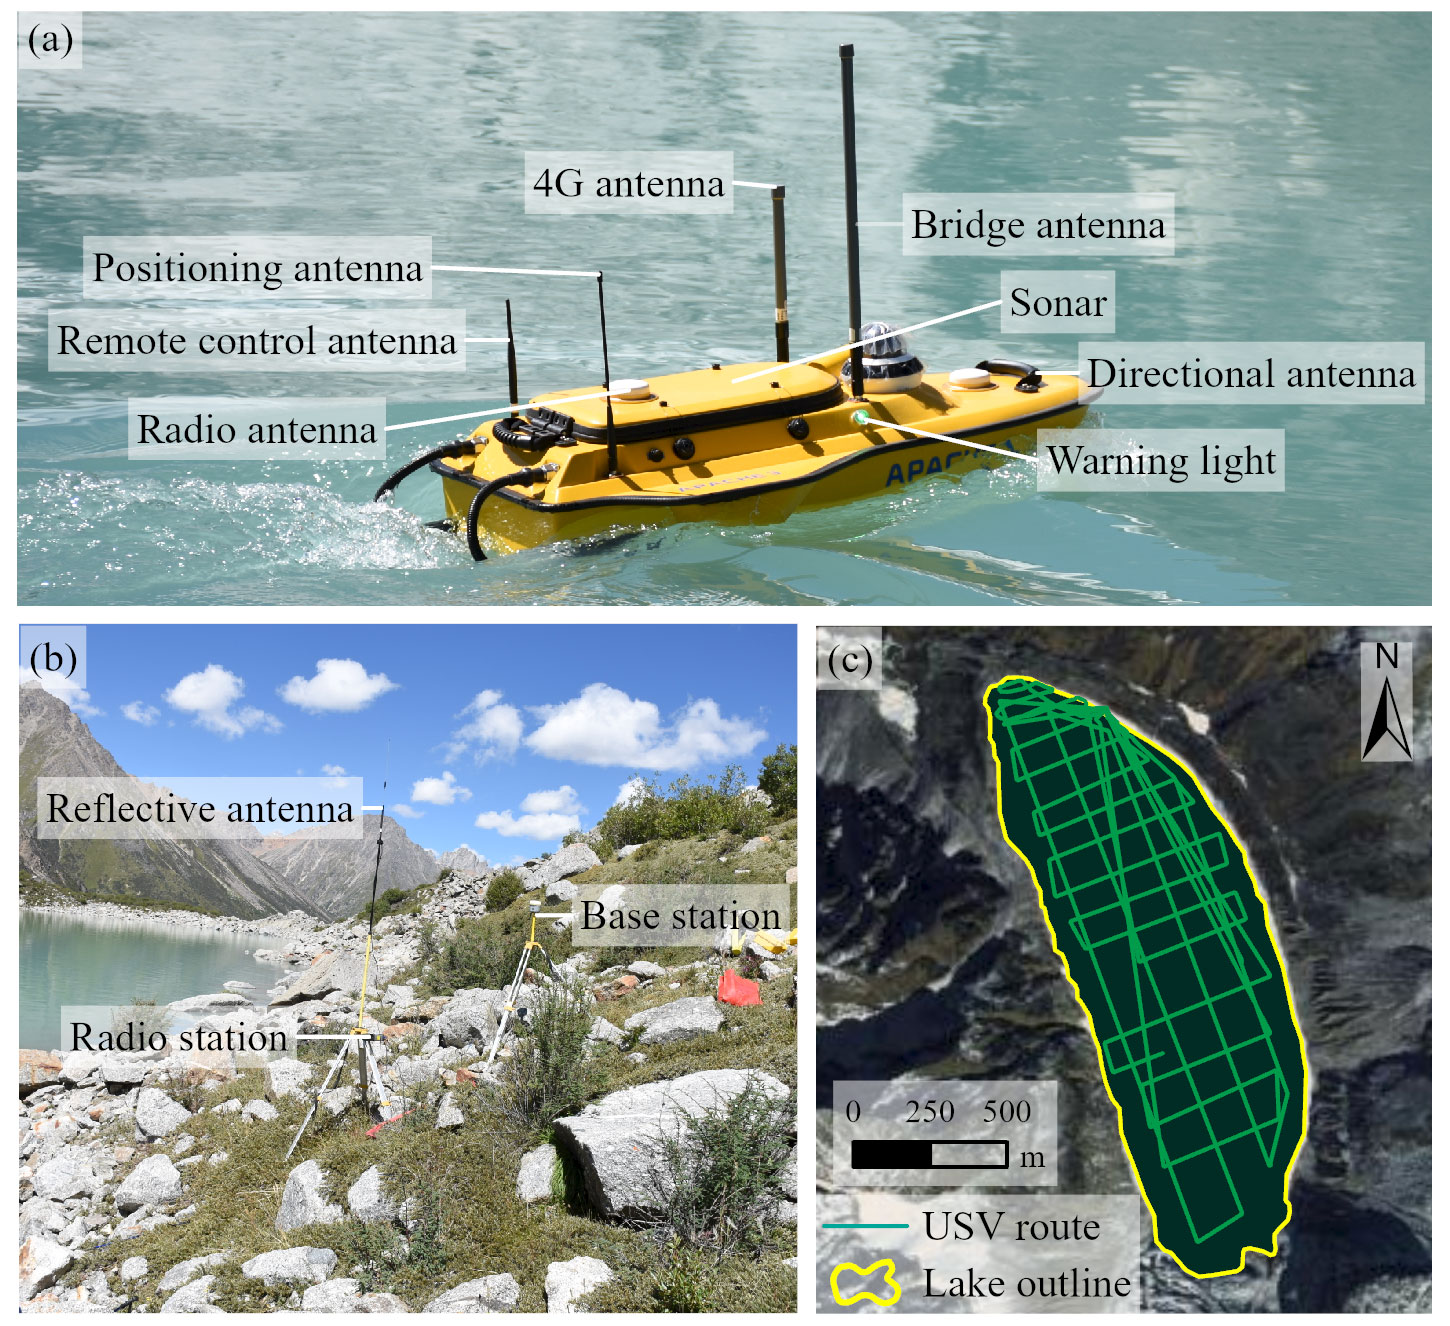
Figure 3The bathymetry of Bienong Co. (a) The USV sampling equipment in water and (b) on land; (c) the sampling path of the USV in Bienong Co covering the base map of the MapWorld image. Photographs were taken by Xiaojun Yao on 27 August 2020.
3.2 Potential GLOF modeling
Emmer and Vilímek (2014) and Haeberli et al. (2001) suggested that the assessment of glacial lake hazards should be based on a systematic and scientific analysis of lake types, moraine dam characteristics, outburst mechanisms, downstream processes in the river valley, and possible process cascades. The methodology of this study is based on the GLOF process chain proposed by Worni et al. (2014), which was used by Somos-Valenzuela et al. (2016) and Lala et al. (2018) to research Imja Tsho in Nepal and the Palcacocha and Huaraz lakes in Peru, respectively. In this study, we intend to depict the potential GLOFs triggered by ice avalanches from the mother glacier (Fig. 2a and b) and landslides from the lateral moraines (Fig. 2c and d). Displacement waves caused by mass movements entering a lake could overtop the moraine dam and initiate an erosive breaching process, releasing considerable amounts of water and debris into the downstream flow channel (Somos-Valenzuela et al., 2016). Three models were used to simulate the GLOF process chain: the Rapid Mass Movement Simulation (RAMMS) model (RAMMS, 2017) was used to simulate the mass movements; the Basic Simulation Environment for Computation of Environmental Flow and Natural Hazard Simulation (BASEMENT) model (Vetsch et al., 2022) was used to simulate the displacement waves in the lake; and the Heller–Hager model was used to calibrate the BASEMENT modeling results. The BASEMENT model was also adopted to simulate the dynamic breaching process of the moraine dam and the downstream inundation. In the following sections, simulating methods are described in detail.
3.2.1 Trigger determination and simulation
Ice avalanches are the most common GLOF trigger in Tibet in China (Yao et al., 2014; Liu et al., 2019). Displacement waves caused by mass movements entering a lake might result in overtopping flows that destroy the moraine dam or disrupt the hydrostatic pressure-bearing capacity of the moraine dam (Somos-Valenzuela et al., 2016). Based on the investigation of Bienong Co, ice avalanches from the mother glacier and landslides from the lateral moraines at two locations were selected as potential triggers of GLOFs. W. C. Wang et al. (2012) defined the dangerous ice body of a glacier as either the volume from the location of the abrupt change in slope to the glacier termini or the volume of the glacier tongue where ice cracks are well developed. In this study, the crevasse-developed ice body of Mulang Glacier with a surface area of 0.19 km2, as shown in the MapWorld image (Fig. 2a), was selected as the potential ice avalanche source. For convenience of the subsequent description, the ice-avalanche-triggered situation was named after Scenario A. The elevation difference between the top of the dangerous ice body and the lake surface was measured to be approximately 155–208 m based on the Advanced Land Observing Satellite (ALOS) Phased Array type L-band Synthetic Aperture Radar (PALSAR) DEM. We divided the dangerous ice body into three parts according to elevation ranges as ice avalanche scenarios of different magnitudes (ice avalanche 1, 2, and 3 in Fig. 2b). Scenario A1 was defined as a low-magnitude trigger; the ice body with an elevation below 4844 m yields a release area of 0.05 km2 with maximum and average elevation differences of 99 and 75.8 m from the lake surface, respectively. Scenario A2 was defined as a moderate-magnitude trigger; the ice body below 4889 m yields a release area of 0.11 km2 with maximum and average elevation differences of 144 and 102.7 m from the lake surface, respectively. Scenario A3 was defined as an extreme-magnitude trigger; the total ice body of crevasses with an area of 0.19 km2 was set as a release area, with the average elevation difference between the glacier surface and the lake surface of 131 m. In the above three scenarios, we assumed that the release depths of ice avalanches are the average elevation differences from the glacier surface to the lake surface; i.e., the glacier is supported by a flat bedrock located at the height of the lake surface.
A lateral moraine landslide being the GLOF trigger is not common on the Tibetan Plateau, but the GLOF of Jinwu Co in 2020 was caused by a lateral moraine landslide (Liu et al., 2021; Zheng et al., 2021). Therefore, it was taken as a trigger of a potential GLOF of Bienong Co. Two locations of lateral moraines within the slope range of 30–45∘ were selected as potential landslide sites. One is located on the left bank of Bienong Co, near the moraine dam with an area of 0.015 km2, which we named Scenario B (Fig. 2c). The other is located on the right bank, near the mother glacier with an area of 0.024 km2, which we named Scenario C (Fig. 2d). Furthermore, we set three different release depths of 2 m (Scenarios B1 and C1), 5 m (Scenarios B2 and C2), and 10 m (Scenarios B3 and C3) for each release area as low-, moderate-, and extreme-magnitude triggers, respectively. Therefore, a total of two different types, three different locations, and nine different magnitudes of mass movements entering the lake were designed as the potential triggers for the GLOF of Bienong Co. The above design took account of the impact of triggers of different magnitudes on Bienong Co, and the results were used as the input for the subsequent simulation.
In this study, ice avalanches and lateral moraine landslides in Bienong Co were simulated using the Avalanche module of the RAMMS model (Somos-Valenzuela et al., 2016; Lala et al., 2018; Sattar et al., 2021). It adopts the Voellmy–Salm finite volume method to solve depth-averaged equations governing mass flow in two dimensions (Christen et al., 2010). Based on the inputs of DEM data, the initial release area and depth, calculation domain, and friction parameters μ (the velocity-independent dry Coulomb term) and ξ (the velocity-dependent turbulent term), the RAMMS model can calculate the runout distance, flow height, and flow velocity of mass movements. Then, the time series of the volume of mass entering the lake was taken as the input for subsequent simulations. In this study, the initial release area was determined by combining the MapWorld image (0.5 m) (https://www.tianditu.gov.cn/, last access: 29 January 2023) and ALOS PALSAR DEM (12.5 m) (https://asf.alaska.edu/data-sets/derived-data-sets/alos-palsar-rtc/alos-palsar-radiometric-terrain-correction/, last access: 29 January 2023). Values of μ=0.12, ξ=1000 m s−2, and ρ=1000 kg m−3 for ice avalanche and ρ=2000 kg m−3 for landslide were used, which agree with values used in previous avalanche-induced GLOF studies (Schneider et al., 2014; Somos-Valenzuela et al., 2016).
3.2.2 Displacement wave simulation
Processes following mass movements entering the lake, such as the generation and propagation of displacement waves, the overtopping flow and erosion on the moraine dam, and the downstream inundation were modeled using the BASEMENT model, developed by the Laboratory of Hydraulics, Glaciology and Hydrology (VAW), ETH Zurich. BASEMENT is both a hydrodynamic model and a sediment transport model, making it well suited to model much of the GLOFs process chain (Worni et al., 2014). It solves the 2D shallow water equations (SWEs) in combination with sediment transport equations, primarily the Shields parameters and the Meyer-Peter and Müller (MPM) equations (Vetsch et al., 2022). The simulation of displacement waves in the lake is performed using the BASEMENT 2D module based on unstructured grids. The BASEmesh plugin in QGIS software (QGIS Development Team, 2016) greatly facilitates the generation of mesh. The bathymetry data were produced as a DEM with a spatial resolution of 5 m using ArcGIS Pro software to reflect the topography of Bienong Co's lake basin. The triangular irregular network (TIN) within the lake was set to a maximum area of 500 m2 to simulate the generation and propagation of displacement waves in the lake effectively and accurately. The inflow boundary condition is the time series of ice avalanches or landslides obtained from the RAMMS modeling results. The RAMMS model can calculate the sediment volume for each time step. The time series of ice avalanches or landslides can be determined by counting the sediment volume within the lake boundary at different time steps. The density of pure rock landslides ranges from 1950 to 2200 kg m−3 (Wang et al., 2017), and most ice-dominated avalanches have a density of approximately 1000 kg m−3. In this study, the densities of ice avalanches and landslides were set as 1000 and 2000 kg m−3, respectively. The BASEMENT model only accepts water as an inflow. Therefore, the ice avalanches and landslides were converted to water with a density scale of 1.0 and 2.0 (i.e., 1000 kg m−3 of water is equivalent to 1000 kg m−3 of ice but only 500 kg m−3 of moraine) to accurately describe the momentum transfer of ice avalanches and landslides entering the lake.
It was shown that the 2D SWEs in the BASEMENT model leads to excessive wave attenuation inherently. The Heller–Hager model combining analytical and empirical equations is often used to simulate impulse wave generation, propagation, and run-up resulting from mass movements entering a lake (Lala et al., 2018). Although the model relies on simplified measurements of lakes' geometry, it has been used to simulate multiple actual events successfully. It characterizes impulse waves in lakes well, making it a simple but helpful calibration measure for more complex hydrodynamic models (Somos-Valenzuela et al., 2016). Waves simulated by the BASEMENT model were usually considered more accurate when they were on the same order of magnitude as those simulated by the Heller–Hager model. However, when they were not, the mass entry rate was changed by adjusting the inflow hydrograph and the boundary width to match the amplitude of the initial wave trajectory near the dam for the Heller–Hager model (Byers et al., 2018; Lala et al., 2018). In this study, we adjusted the wave amplitude near the moraine dam in the BASEMENT model to be close to (difference within 1 m) that calculated by the Heller–Hager model by adjusting the width of the inflow boundary. The Heller–Hager model simulates waves in two cases: (a) with longitudinal impacting slide and confined transverse wave propagation and (b) with the slide impacting across the reservoir and completely free radial wave propagation. In this study, ice avalanches belong to case (a), and landslides belong to case (b). Compared to case (a), the impulse wave (its amplitude and energy) in case (b) decreases more rapidly because it propagates over a larger area and is accompanied by wave refraction and reflection.
3.2.3 Moraine dam erosion simulation
Overtopping flows are the most common trigger for moraine dam breaching (Richardson and Reynolds, 2000). They initiate dam erosion, leading to greater outflow and increasing hydrodynamic force that progressively enlarge the breach (Singh, 1996). In this study, the erosion-driven dam failure of Bienong Co was simulated by the BASEMENT model. The model characterizes sediment transports using the MPM equation and estimates suspended and nudged mass fluxes by calculating the shear stress in flows through the modified Shields parameter (Vetsch et al., 2022). The mesh of the moraine dam was generated from the ALOS PALSAR DEM, with a maximum TIN area of 200 m2. We set a cross-section along the crest of the moraine dam (Fig. 2g), at which the erosion of the moraine dam and outflow discharges were analyzed. The BASEMENT model provides both single-grain (MPM) and multi-grain (MPM-multi) algorithms to simulate material transport. The MPM-multi algorithm simulates hiding and armoring processes, potentially leading to an unrealistically low level of erosion (Vetsch et al., 2022). The MPM algorithm ignores these processes, however, which can lead to an overestimation of erosion. In this study, we used the MPM-multi algorithm to simulate the bed-load transport of the dam composed of moraines of different grain sizes. In addition, a correction factor of 2.0 was used to increase the bed-load transport rate. Values between 0.5 (low transport) and 1.7 (high transport) are generally realistic (Wong and Parker, 2006), whereas a value of 2.0 provides a high-sediment-transport condition (Somos-Valenzuela et al., 2016) to compensate for the lower erosion of the MPM-multi algorithm. The specific grain size distribution of Bienong Co's moraine dam was not measured. It was instead taken from an inventory of glacial lakes in the Indian Himalayas (Worni et al., 2013) that had performed well in reconstructing previous GLOFs in Nepal (Byers et al., 2020). The moraine dam of Bienong Co consists of large grains with a thickness of approximately 0.5 m from the top and small grains underneath, which are visible on the side wall of the channel scoured by outflows (Fig. 2e). We set two soil layers in the BASEMENT model to represent the above situation. The upper layer with the large grain (d50=180 mm) has a depth of 0.5 m; the lower layer with the same grain size distribution as Worni et al. (2013) has a depth of 71.5 m (considering the mean height of the moraine dam of 72 m).
3.2.4 Downstream impact analysis
The flow channel from Bienong Co to the convergence with Song Qu stretches ∼53 km (Fig. 1d), along which 18 settlements, 13 bridges, and the Jiazhong highway are distributed. This study used the BASEMENT model to simulate the hydrodynamic behavior of potential GLOFs along the flow channel. We assessed the hazard of GLOFs by analyzing the inundation extent and depth, flow velocity, and flood arrival time at these settlements. The BASEMENT 2D module for an unsteady hydraulic simulation requires inputs of terrain data and boundary conditions. The terrain was represented by a 2D mesh covering the entire flow channel, obtained from the ALOS PALSAR DEM. The mesh was generated by the BASEmesh plugin of QGIS software, and the maximum TIN areas of the main flow channel and other regions were set as 500 and 5000 m2, respectively, for the accuracy requirement of the simulation and the computation efficiency of the model. The friction of a flow channel was determined by Manning's roughness coefficient (Coon, 1998), which is dependent on land use and cover. In this study, the GLC10 LULC product (http://data.ess.tsinghua.edu.cn/fromglc10_2017v01.html, last access: 29 January 2023) with a spatial resolution of 10 m was used to obtain the value of Manning's N in the flow channel. The inflow boundary is the outflow hydrograph from the lake. The outflow boundary is the water-level–discharge relationship of a cross-section downstream, estimated by the critical depth method (Byers et al., 2018).
4.1 Morphology and lake volume estimation of Bienong Co
The basin morphology of Bienong Co was determined based on the bathymetry data (Fig. 3). As shown in Fig. 4, the lake has a relatively flat bottom and steep flanks. The slope of the lake shore near the glacier is steeper than that near the moraine dam, which is similar to most moraine-dammed glacial lakes (Yao et al., 2012; Zhou et al., 2020). The water depth profile from the moraine dam to the mother glacier shows that the lake's depth reaches a maximum of ∼181 m at approximately 1000 m from the moraine dam, corresponding to a slope of 11.3∘. The depth remains stable at distances of 1000 to 1500 m from the moraine dam. The distance from the mother glacier to the deepest point of the lake is 600 m with a slope of 16.5∘. A depth profile from the left side to the right side shows that the left bank is steeper than the right bank. The glacial lake reaches its deepest point at 200 m from the left shore with a slope of 43.4∘ and then remains flat to 430 m, and the distance between the bottom and the right shore is 273 m with a slope of 32∘. The volume of Bienong Co was approximately 102.3×10⁶ m3 in 2020.
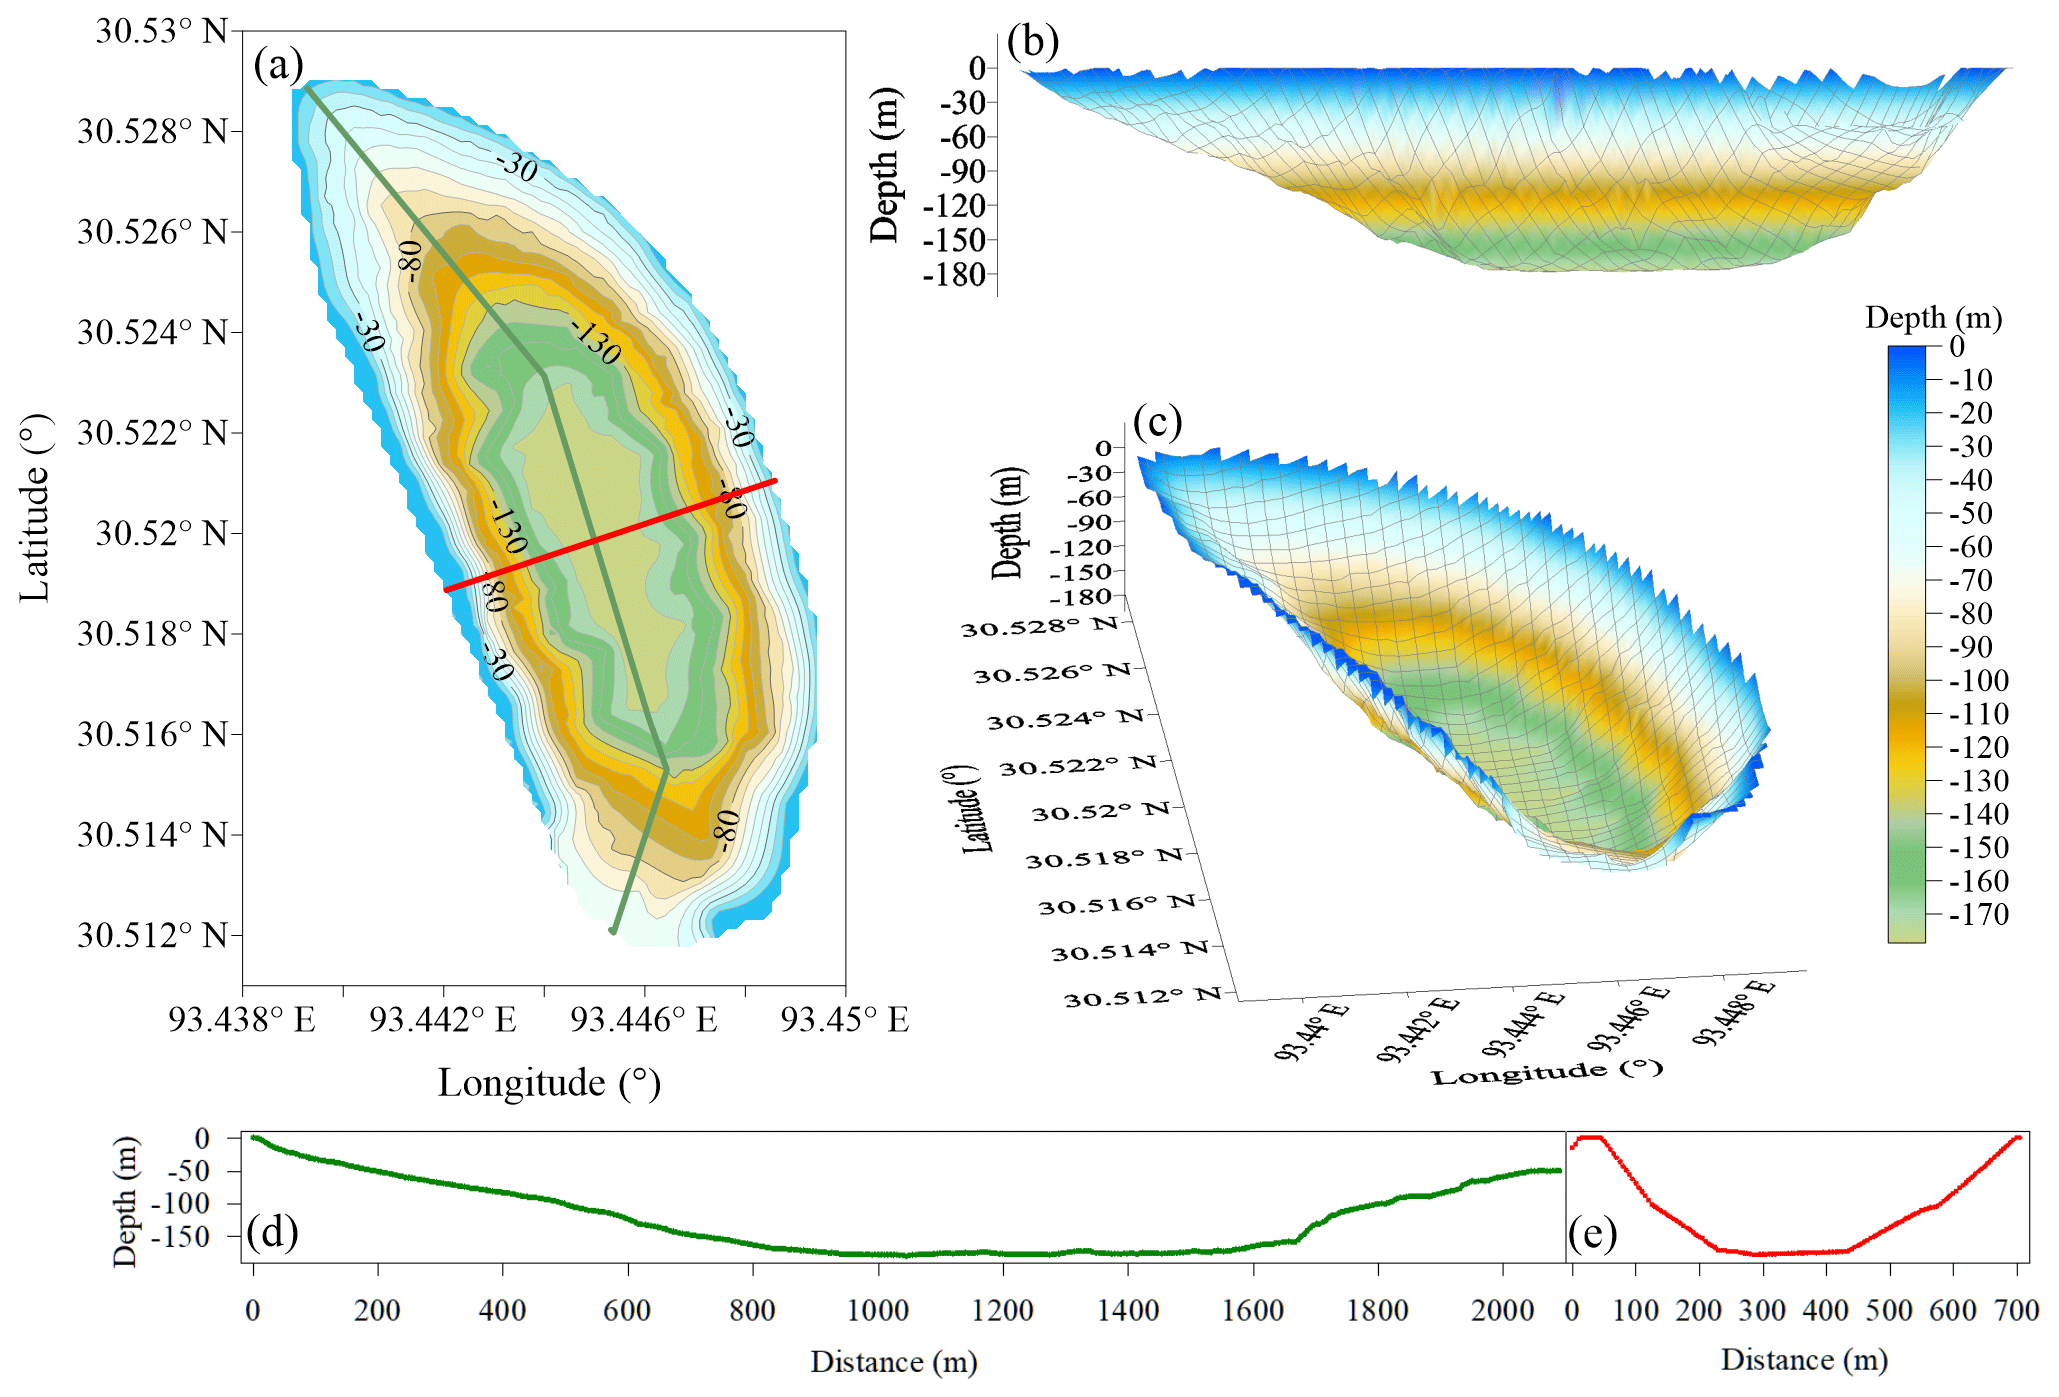
Figure 4Morphology modeling of Bienong Co in 2020, as well as equal-scale profiles of distance and depth from the moraine dam to Mulang Glacier (green line) and from the left shore to right shore (red line).
4.2 Potential GLOF modeling
4.2.1 Ice avalanches and lateral moraine landslides
As calculated by RAMMS, the volumes of ice avalanches entering Bienong Co for Scenarios A1, A2, and A3 are 3.8×10⁶, 4.9×10⁶, and 5.8×10⁶ m3 (Fig. 5a), respectively. Most of the ice body enters the lake within approximately 120 s. Based on an area of ∼1.15 km2 in 2021, the above three scenarios could result in a rise in lake level of approximately 3.3, 4.2, and 5.1 m, respectively. The volumes of landslides entering the lake are much smaller than those of ice avalanches (Fig. 5b and c). In Scenarios B1, B2, and B3, the volumes of moraines entering the lake are 0.03×10⁶, 0.09×10⁶, and 0.17×10⁶ m3, respectively. In Scenarios C1, C2, and C3, the volumes of moraines entering the lake are 0.06×10⁶, 0.15×10⁶, and 0.30×10⁶ m3, respectively. It takes less time for the moraines to enter the lake, with Scenarios B1–3 being completed in approximately 10 s and Scenarios C1–3 in approximately 15 s.
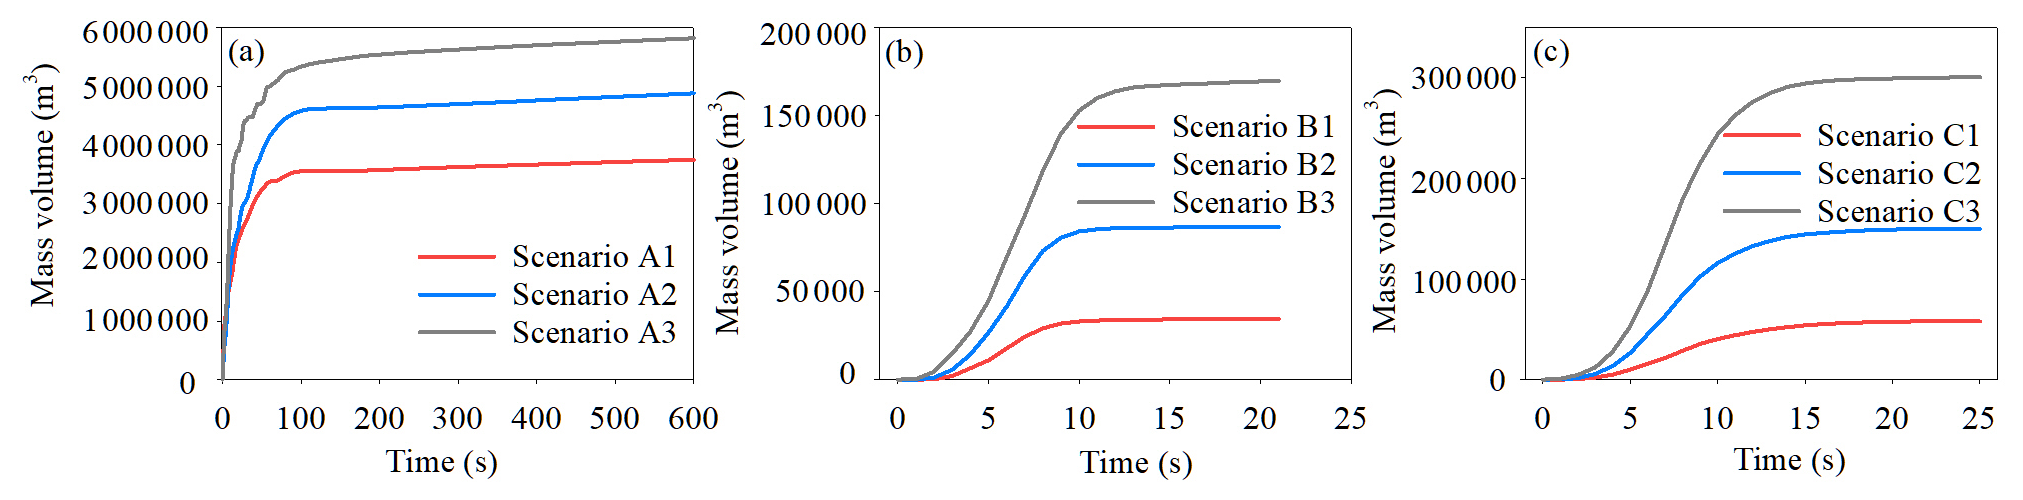
Figure 5Volume of material entering Bienong Co for different (a) ice avalanche scenarios and (b) and (c) landslide scenarios.
The impact zones caused by mass entering the lake differ for different scenarios. They are 0.27, 0.31, and 0.38 km2 for Scenarios A1, A2, and A3, with horizontal distances of 549, 629, and 752 m from the inflow boundary, respectively (Fig. 6). In contrast, each scenario of Scenarios B1–3 and C1–3 results in relatively small impact zones, with Scenario C3 having the largest of 0.14 km2 and Scenario B1 the smallest of 0.04 km2. Scenarios A1, A2, and A3 produce the maximum flow heights of 39.5, 46.2, and 53.5 m and the average flow heights of 12.2, 14.6, and 12.3 m in the impact zones, respectively. The maximum and the average flow heights of Scenarios B1–3 range from 6.8 to 14.6 m and from 1.8 to 3.5 m, respectively. The ranges of the maximum and the average flow heights of Scenarios C1–3 are 5.7–29.2 and 2.0–4.7 m, respectively (Fig. 6). The maximum flow velocities of Scenarios A1, A2, and A3 are 34.9, 43.1, and 51.4 m s−1, with the average flow velocities of 11.1, 12.3, and 16.8 m s−1, respectively. The maximum and average flow velocities of Scenarios B1, B2, and B3 and C1, C2, and C3 are in the range of 21.3–33.6 and 8.5–14.2 m s−1, respectively (Fig. 6).

Figure 6Maximum flow height (left) and maximum flow velocity (right) for different ice avalanches and landslide scenarios.
4.2.2 Generation and propagation of displacement waves
By counting the volumes of ice avalanches and landslides entering Bienong Co in different time steps obtained from the RAMMS model, we derived the time series of the mass-entering rate, as shown in Fig. 7. In Scenarios A1–3, Scenario A1 has the highest peak flow rate of 439 952.57 m3 s−1; however, it decreases rapidly after reaching the peak within 2 s of the ice avalanche; i.e., the ice avalanche occurs in a brief moment. Scenarios A2 and A3 exhibit apparent fluctuations in the process of ice avalanches entering the lake, with the sub-peaks comparable to the peaks. The peak and sub-peak flow rates of Scenarios A2 and A3 are 263 922 and 238 086 m3 s−1, as well as 386 359 and 373 449 m3 s−1, respectively, both occurring at the 2nd and 8th seconds of the ice avalanches. Scenarios A2 and A3 have larger volumes of ice avalanches and further transfer distances than Scenario A1, leading to the more complex processes of ice bodies entering the lake. The processes of landslides entering the lake are simpler in Scenarios B1–3 and C1–3. The peak flows increase sequentially from Scenarios B1 and C1 to B2 and C2 and then to B3 and C3. The values of Scenarios B3 and C3 are 50 849 and 92 529 m3 s−1, respectively, which are approximately 3.8 times and 6.5 times those of Scenarios B1 and C1. The peak flows of Scenarios B1–3 and C1–3 occur in 6–8 s (Fig. 7).
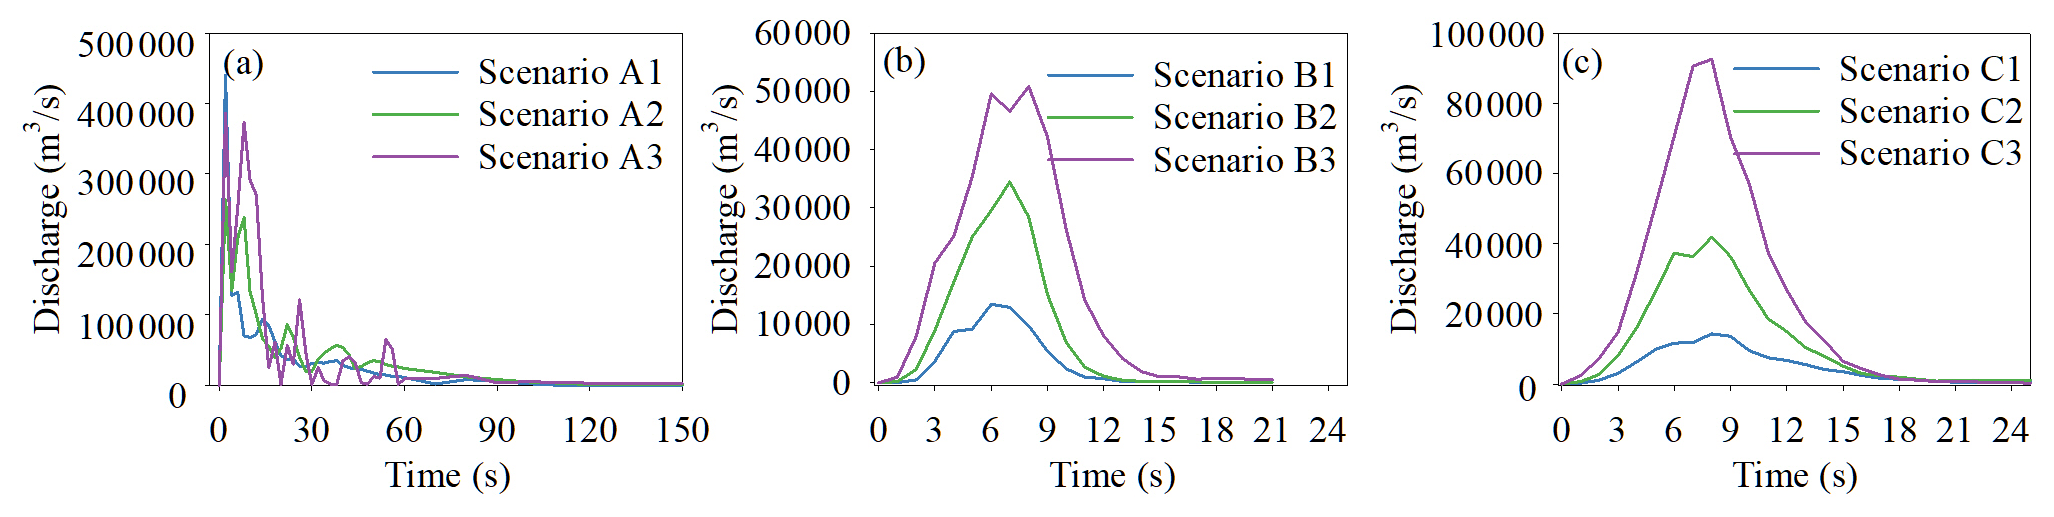
Figure 7Time series of material entry into the lake for different ice avalanche and landslide scenarios.
The time–volume relationship of mass entering a lake has an important effect on the generation and propagation of displacement waves in a lake. Ice avalanche scenarios (A1, A2, and A3) have a much greater impact on Bienong Co than the landslide scenarios (B1, B2, B3, C1, C2, and C3) because the release volumes of ice avalanches are much greater than those of landslides. In Scenario A, displacement waves propagate straight from the glacier to the moraine dam, arriving at the vicinity of the moraine dam at approximately 70 s. Scenarios A1, A2, and A3 produce the highest wave amplitudes in the lake of 35.2, 39.0, and 66.4 m, respectively, and the wave amplitudes near the moraine dam are 17.1, 20.2, and 25.2 m, respectively (Fig. 8). Compared with Scenarios A1–3, the wave amplitudes of Scenarios B1–3 and C1–3 are markedly lower. In Scenarios B1–3, the landslides occur at the left shore of Bienong Co near the moraine dam (Fig. 2c). The displacement waves first propagate to the opposite shore in a perpendicular direction to the inflow boundary, and then they propagate to the moraine dam with the expansion. The maximum wave amplitudes in Bienong Co of Scenarios B1, B2, and B3 are 6.5, 14.1, and 18.0 m, respectively, and the wave amplitudes near the moraine dam are 1.2, 3.0, and 5.3 m, respectively (Fig. 8). The landslides in Scenarios C1–3 occur at the right shore of Bienong Co near the mother glacier. The displacement waves propagate in the same way as in Scenarios B1–3, in which waves propagate to the opposite shore first after moraines enter the lake, with the maximum wave amplitudes of 4.8, 9.6, and 24.7 m for Scenarios C1, C2, and C3, respectively. Unlike Scenarios B1–3, the displacement waves in Scenarios C1–3 cross the entire lake, with wave amplitudes of 0.6, 2.2, and 4.9 m near the moraine dam, respectively (Fig. 8). Therefore, although the volumes of landslides in Scenarios C1–3 are larger than those in Scenarios B1–3, the wave amplitudes near the moraine dam are smaller than those in Scenarios B1–3.

Figure 8Propagation of displacement waves in the lake for different ice avalanche and landslide scenarios.
4.2.3 Overtopping flow and erosion on the moraine dam
Since the freeboard of the moraine dam is 0 m, the occurrence of overtopping is inevitable in all scenarios, but there are differences in the magnitude of overtopping. In Scenarios A1–3, the moraine dam is eroded by enormous discharges, forming a breach. The peak discharges at the breach are 4996, 7817, and 13 078 m3 s−1, corresponding to the total released volumes of 24.1×10⁶, 25.3×10⁶, and 26.4×10⁶ m3, respectively (Fig. 9). The discharges at the breach stabilize after ice avalanches enter Bienong Co at approximately 18 000, 10 800, and 7200 s, respectively. Therefore, the erosion of the moraine dam and the total volume of water lost from the lake were counted based on the above time points. Due to the similar volume of water released in Scenarios A1–3, the depth of the breach is similar at approximately 19.0 m (Fig. 10). However, the peak discharges differ among the three scenarios, resulting in different breach widths of 295.0, 339.4, and 368.5 m, respectively. Scenarios B1, B2, and B3 and C1, C2, and C3 result in overtopping flows of 0.6×10⁶, 1×10⁶, and 2.6×10⁶ m3 and 0.1×10⁶, 0.9×10⁶, and 3.4×10⁶ m3, respectively, with only Scenarios B3 and C3 causing erosion of the moraine dam and forming a breach. In Scenarios B3 and C3, the discharges at the breach become stable after 18 000 s of the moraines entering the lake. The peak discharges are 504 and 733 m3 s−1, with breach depths of 6.5 and 7.9 m and breach widths of 153 and 169 m, respectively.
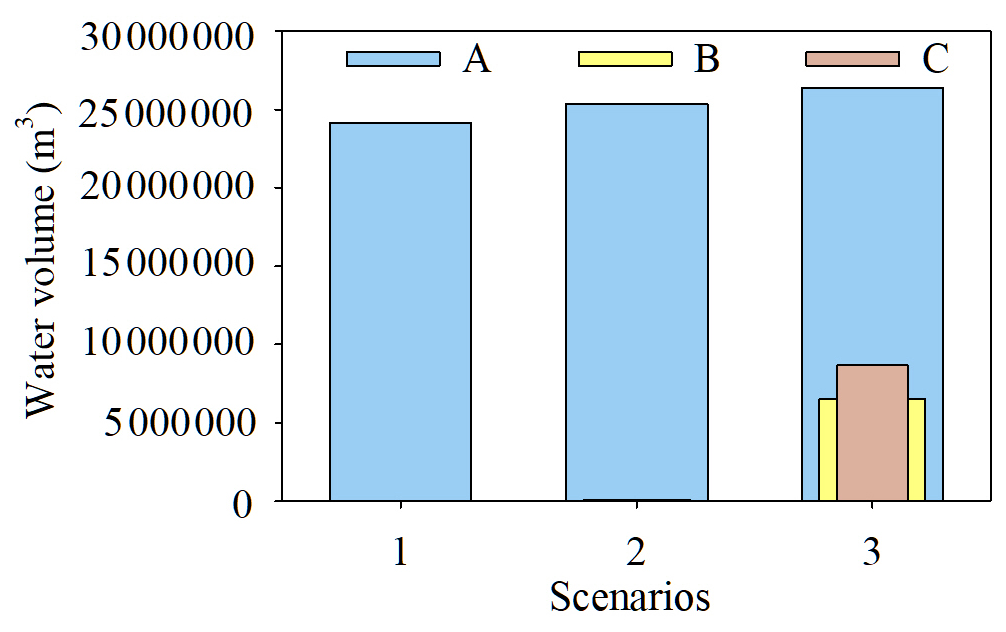

Figure 10Erosion of the moraine dam under different conditions at the cross-section in Fig. 2g.
4.2.4 GLOF impact in the downstream region
The hydraulic behavior of GLOFs in the flow channel from the moraine dam to the convergence with Song Qu (∼53 km) was simulated using the BASEMENT model. The small baseflows in the flow channel were neglected due to the lack of reliable data. Considering the differences between scenarios, we evaluated the propagation of GLOFs in the downstream channel within 20 h. The peak discharges at the breach of Scenarios A1, A2, and A3 are 4996, 7817, and 13 078 m3 s−1, respectively, all occurring approximately 600 s after ice bodies enter the lake (abbreviated as after 600 s). GLOFs of the three scenarios all pass through 18 settlements in the downstream flow channel in 20 h. The inundation areas of Scenarios A1, A2, and A3 are 7.6, 8.0, and 8.5 km2, respectively, with the average water depths of 8.4, 9.1, and 10.0 m, respectively (Fig. 11). Scenarios B1 and C1 result in small overtopping flows, with peak discharges of 106 m3 s−1 (after 40 s) and 12 m3 s−1 (after 50 s), respectively. Scenarios B2 and C2 produce limited overtopping flows with peak discharges of 177 m3 s−1 (after 240 s) and 186 m3 s−1 (after 480 s), respectively. Outflows remain only within approximately 1 km downstream of the moraine dam. The peak discharges at the breach of Scenarios B3 and C3 are 504 m3 s−1 (after 240 s) and 733 m3 s−1 (after 480 s), yielding the inundation areas of 1.7 and 2.2 km2 with the average water depths of 1.9 and 2.4 m in the downstream region, respectively. Both GLOFs pass through the first eight settlements, but the flood of Scenario C3 flows farther (Fig. 11). In the nine scenarios, only Scenarios A1–3, B3, and C3 result in GLOFs propagating in the downstream flow channel over a considerable distance; Scenario A3 has the largest flood magnitude, whereas Scenario B3 has the smallest flood magnitude.
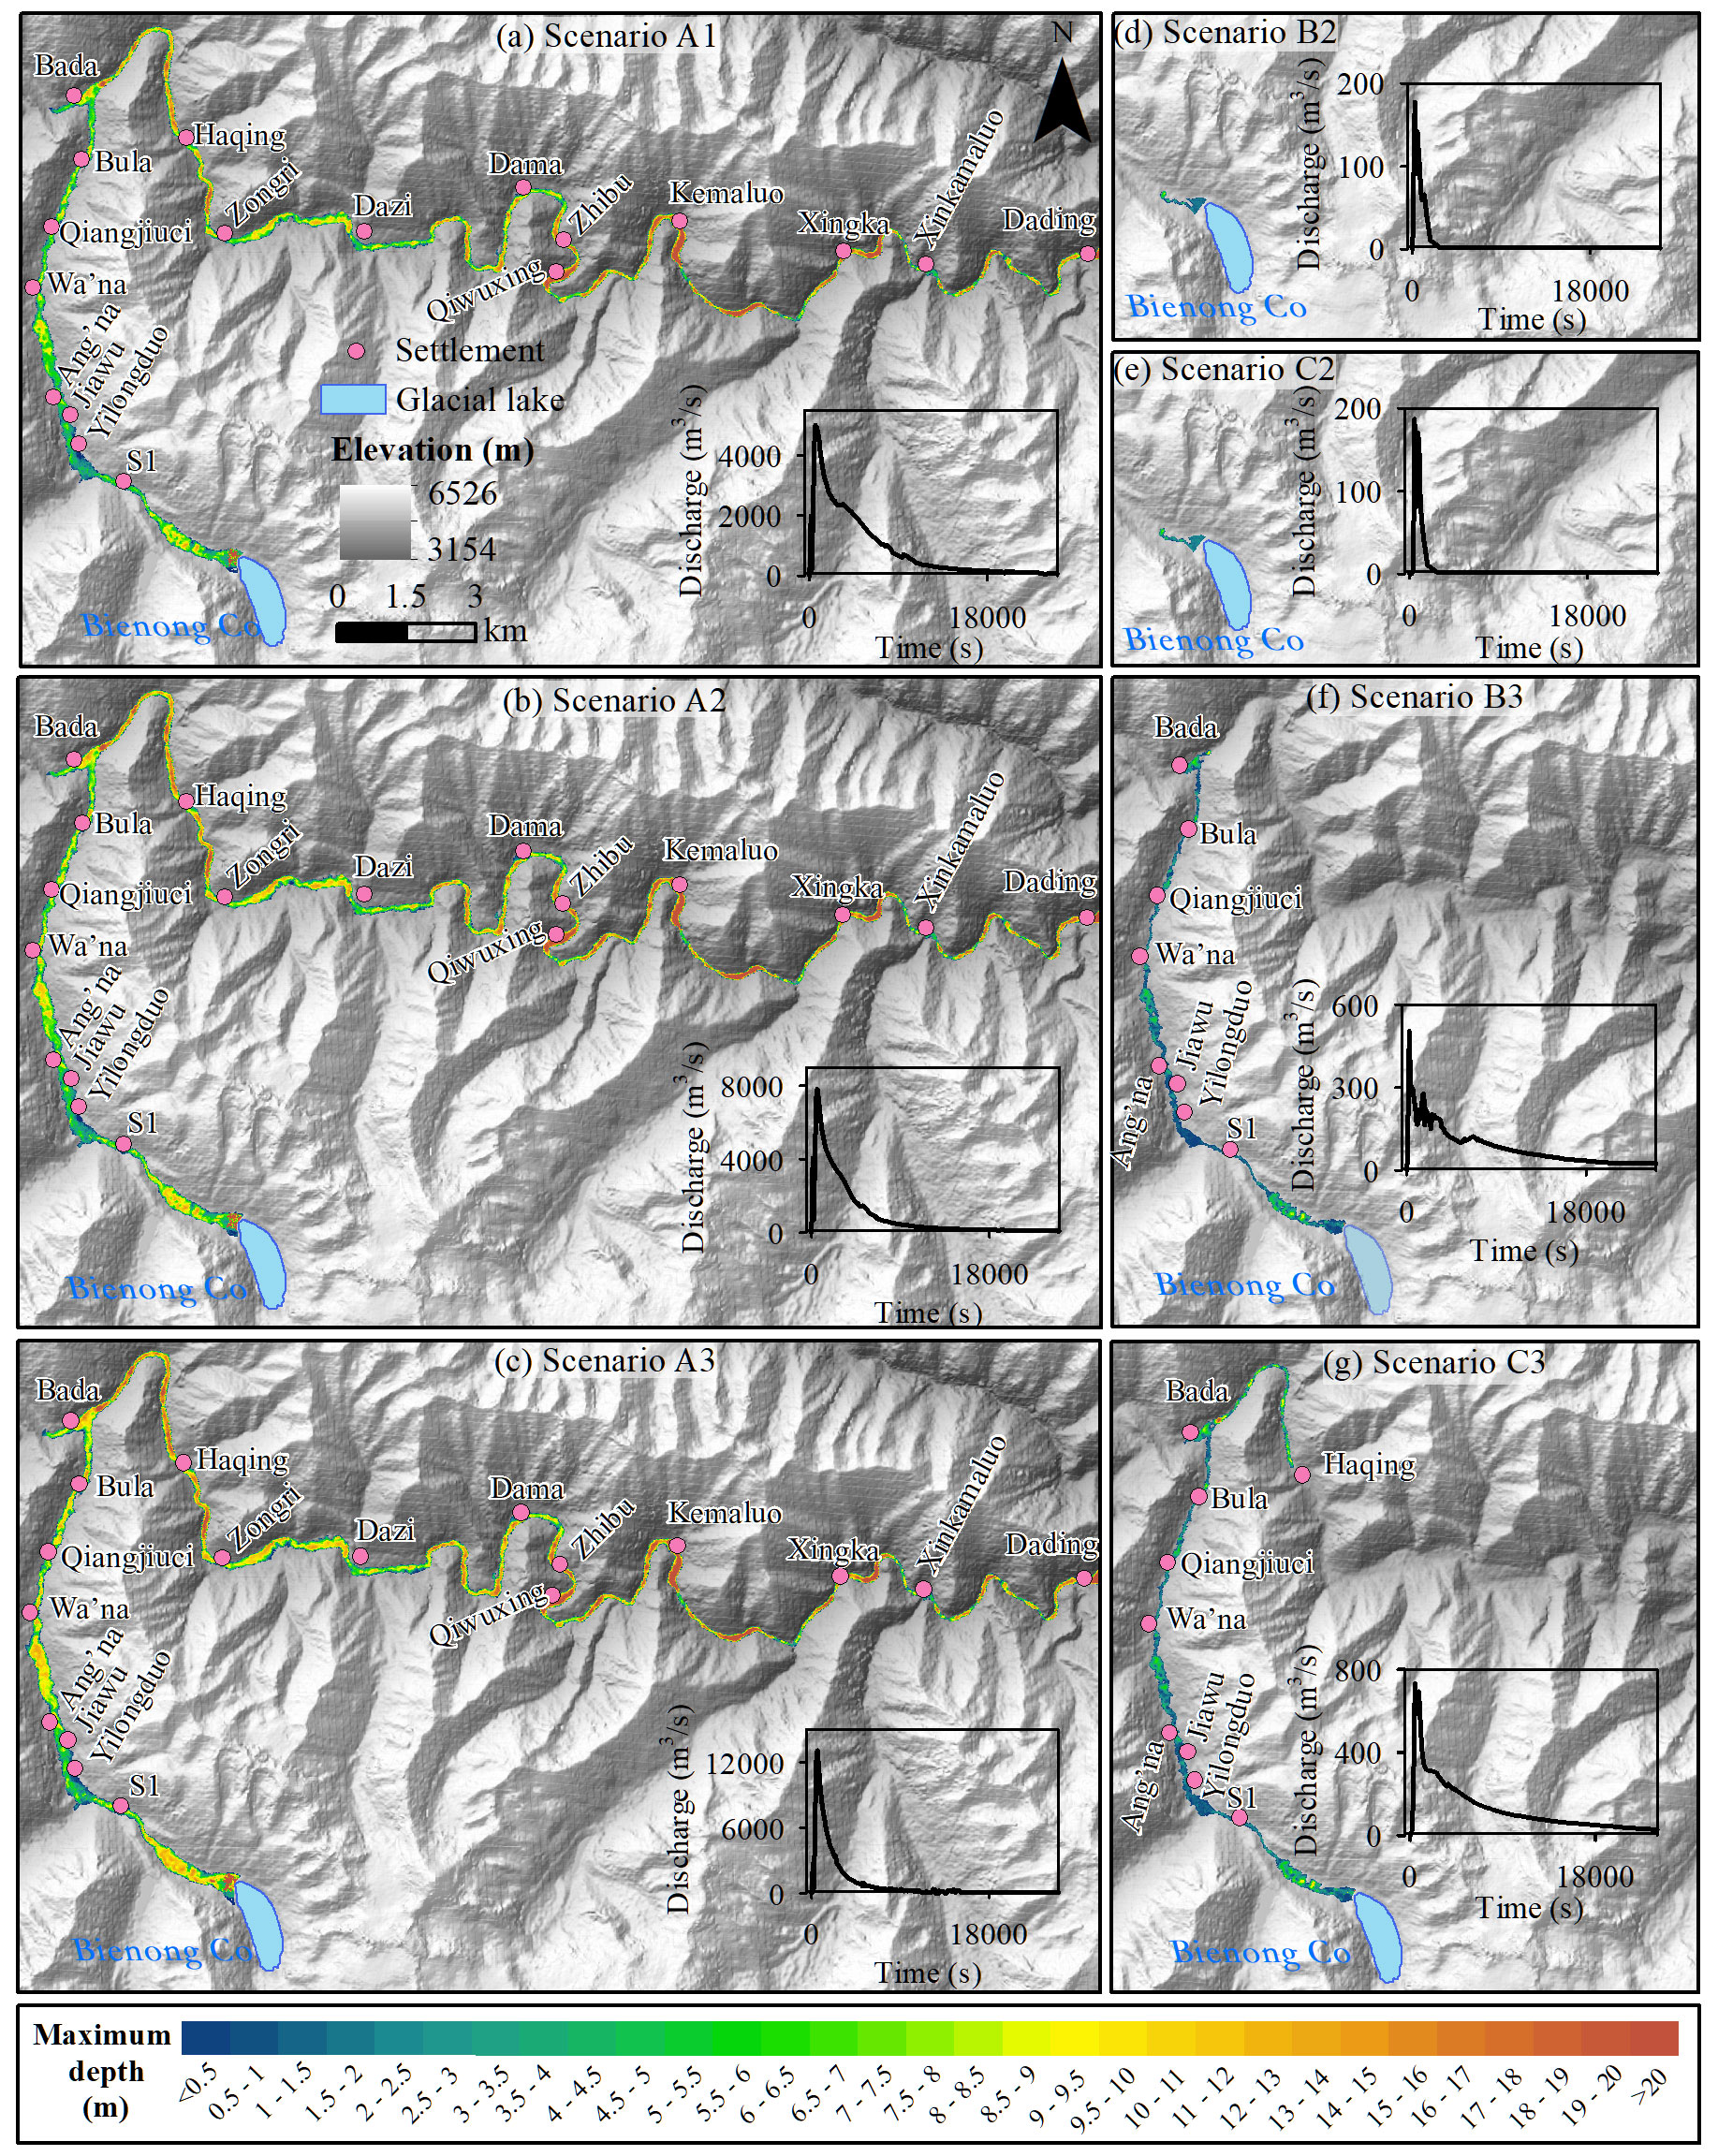
Figure 11Propagation of flood water downstream and the time series of discharge at the breach outlet (inset) for different scenarios.
GLOFs of different magnitudes pose different hazards to settlements along the flow channel. Scenario A3 produces the most severe threat to the downstream region. Six settlements are entirely submerged by the flood, including the villages of Ang'na, Wa'na, Haqing, Kemaluo, Xingka, and Dading. Kemaluo, located 37.9 km downstream of Bienong Co, experiences the largest maximum flow depth of 19.8 m, and the village of Ang'na, located 6.0 km from Bienong Co, experiences the smallest maximum flow depth of 6.1 m. Wa'na is the village most affected by the GLOF due to the largest flooded area. Eight settlements are partially flooded, including S1, Qiangjiuci, Bula, Bada, Dama, Zhibu, Qiwuxing, Xingka, and Xinkamaluo. The maximum flow depth in Bada is the largest (11.0 m); that in Dama and Zhibu is the smallest (7.2 m). Four settlements, the villages of Yilongduo, Jiawu, Zongri, and Dazi, are spared from flooding. Among them, Yilongduo may be slightly affected; Dazi is the safest village due to its far distance from the river. The GLOF of Scenario A2 has a more minor impact on downstream villages than that of Scenario A3, with the reduced inundation extent and flow depth. The flooding extent in Ang'na and Haqing has a reduction. The villages of Wa'na, Kemaluo, Xingka, and Dading are still entirely flooded; however, the maximum flow depths are decreased from 16.5, 19.8, 12.5, and 17.5 m to 13.6, 19.3, 12.0, and 16.6 m, respectively. The nine villages partially affected in Scenario A3 are still affected by the GLOF of Scenario A2 except for Dama, but the impact magnitude is diminished. Scenario A1 differs from Scenario A3 in that Dama and Xinkamaluo are spared from the flood, and other villages experience greatly reduced flooding extents and inundation depths. The GLOFs of Scenarios B3 and C3 have a significantly more minor impact on the downstream flow channel than Scenarios A1–3. Only Wa'na, Qiangjiuci, and Bula are partially affected, with the maximum flow depths of 3.1, 1.9, and 2.0 m in Scenario B3 and 4.0, 2.4, and 2.7 m in Scenario C3, respectively (Fig. 12). The total areas of houses, courtyards, and farmland (around settlement) affected by Scenarios A1, A2, A3, B3, and C3 are 23 984, 32 076, 41 038, 3820, and 3918 m2, respectively. In Scenarios A1–3, all 13 bridges and approximately 35 km of roads (including the Jiazhong highway) are in the flooding zone. In Scenarios B3 and C3, four bridges and approximately 3.6 and 6.7 km of roads are in the flooding zone. Here we only assess the potential impact of GLOFs on the artificial structures, but the concrete impact magnitude is beyond the scope of this study.
Peak discharges and velocities of GLOFs gradually decrease from upstream to downstream. Meanwhile, the arrival times of peak discharges are prolonged, favoring the evacuation of residents in the downstream region. The peak discharges at S1, Yilongduo, Jiawu, and Ang'na are similar: they are ∼4000 m3 s−1 in Scenario A1, ∼ 6000 m3 s−1 in Scenario A2, and ∼10 000 m3 s−1 in Scenario A3. Wa'na, Qiangjiuci, and Bula have similar peak discharges, which are ∼3800, ∼5000, and ∼ 8000 m3 s−1 for Scenarios A1, A2, and A3, respectively. From the village of Bula, the peak discharges decrease significantly towards the downstream region. Taking Scenario A3 as an example, the peak discharge is 7512 m3 s−1 at Bula; then it is gradually less than 6000, 4000, 3000, and 1000 m3 s−1 from Haqing, Dama, and Qiwuxing to Xingka (Fig. 13). The velocities of GLOFs vary dramatically from upstream to downstream. At village S1, the maximum velocities of Scenarios A1, A2, and A3 are 8.9, 12.2, and 14.9 m s−1, respectively. At Dading, the maximum velocities in Scenarios A1, A2, and A3 are all approximately 2 m s−1.
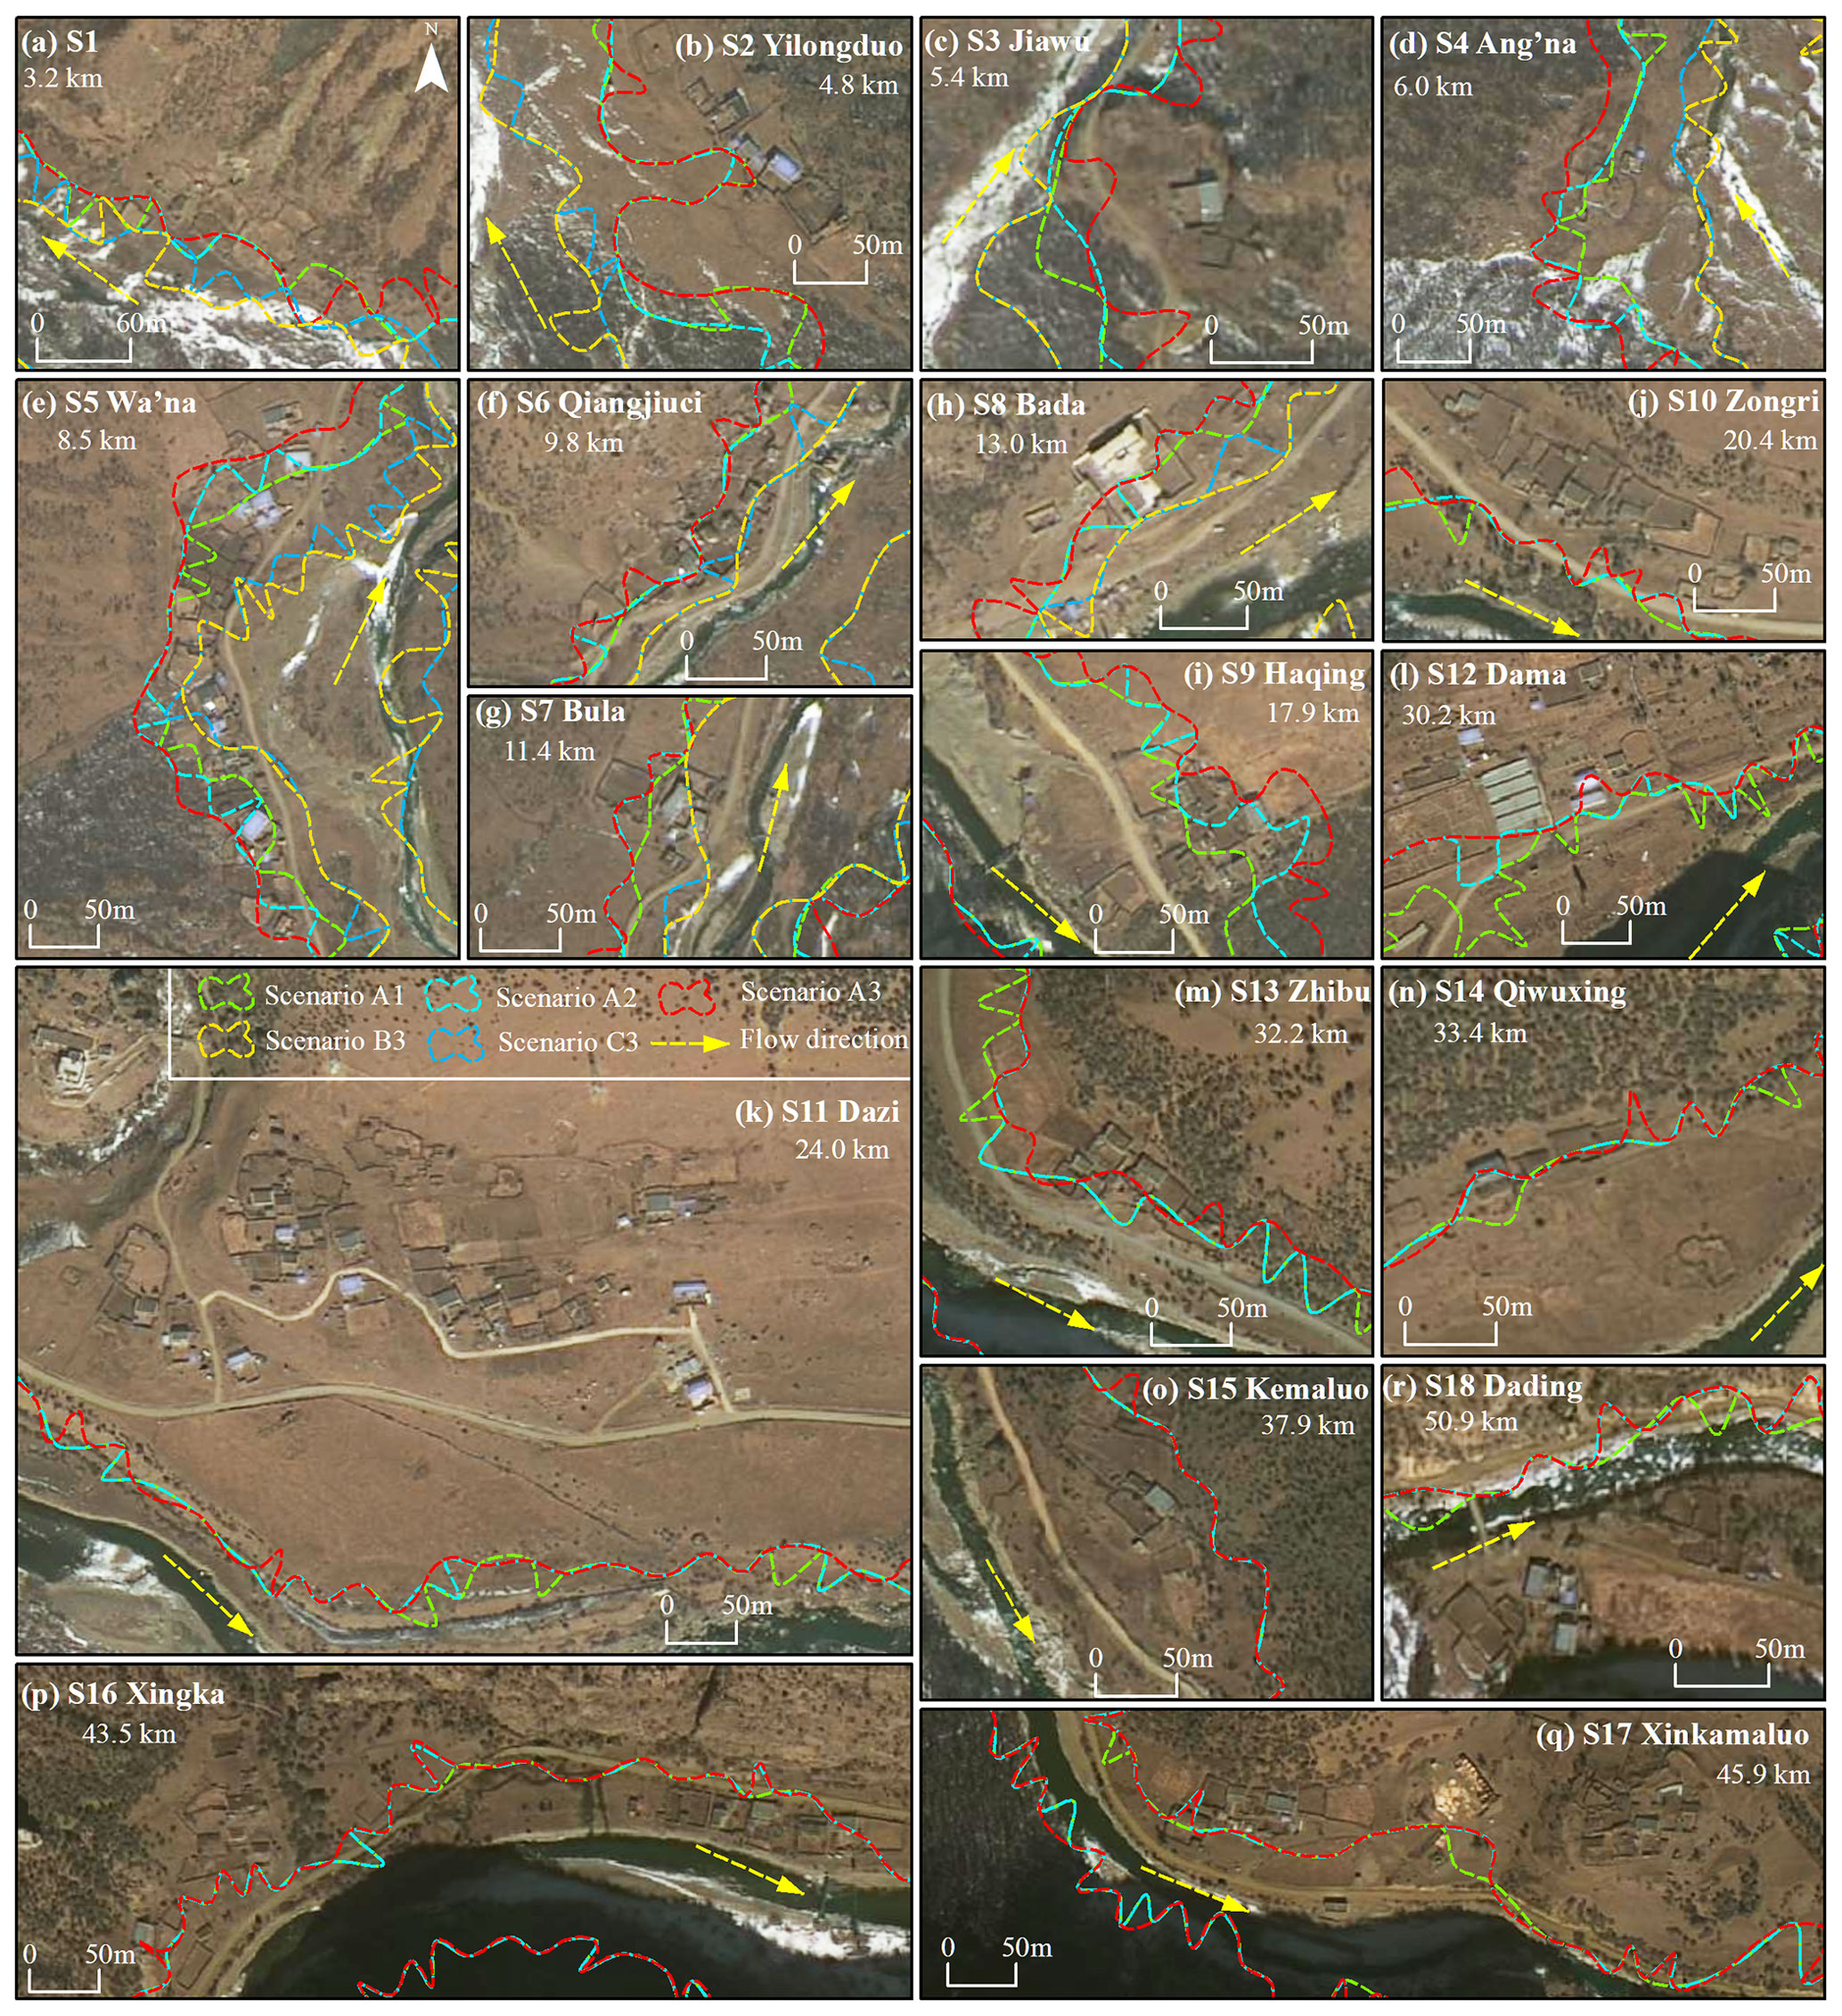
Figure 12The potential threat of GLOFs to settlements and roads downstream under different ice avalanche and landslide scenarios (the background is the MapWorld image).
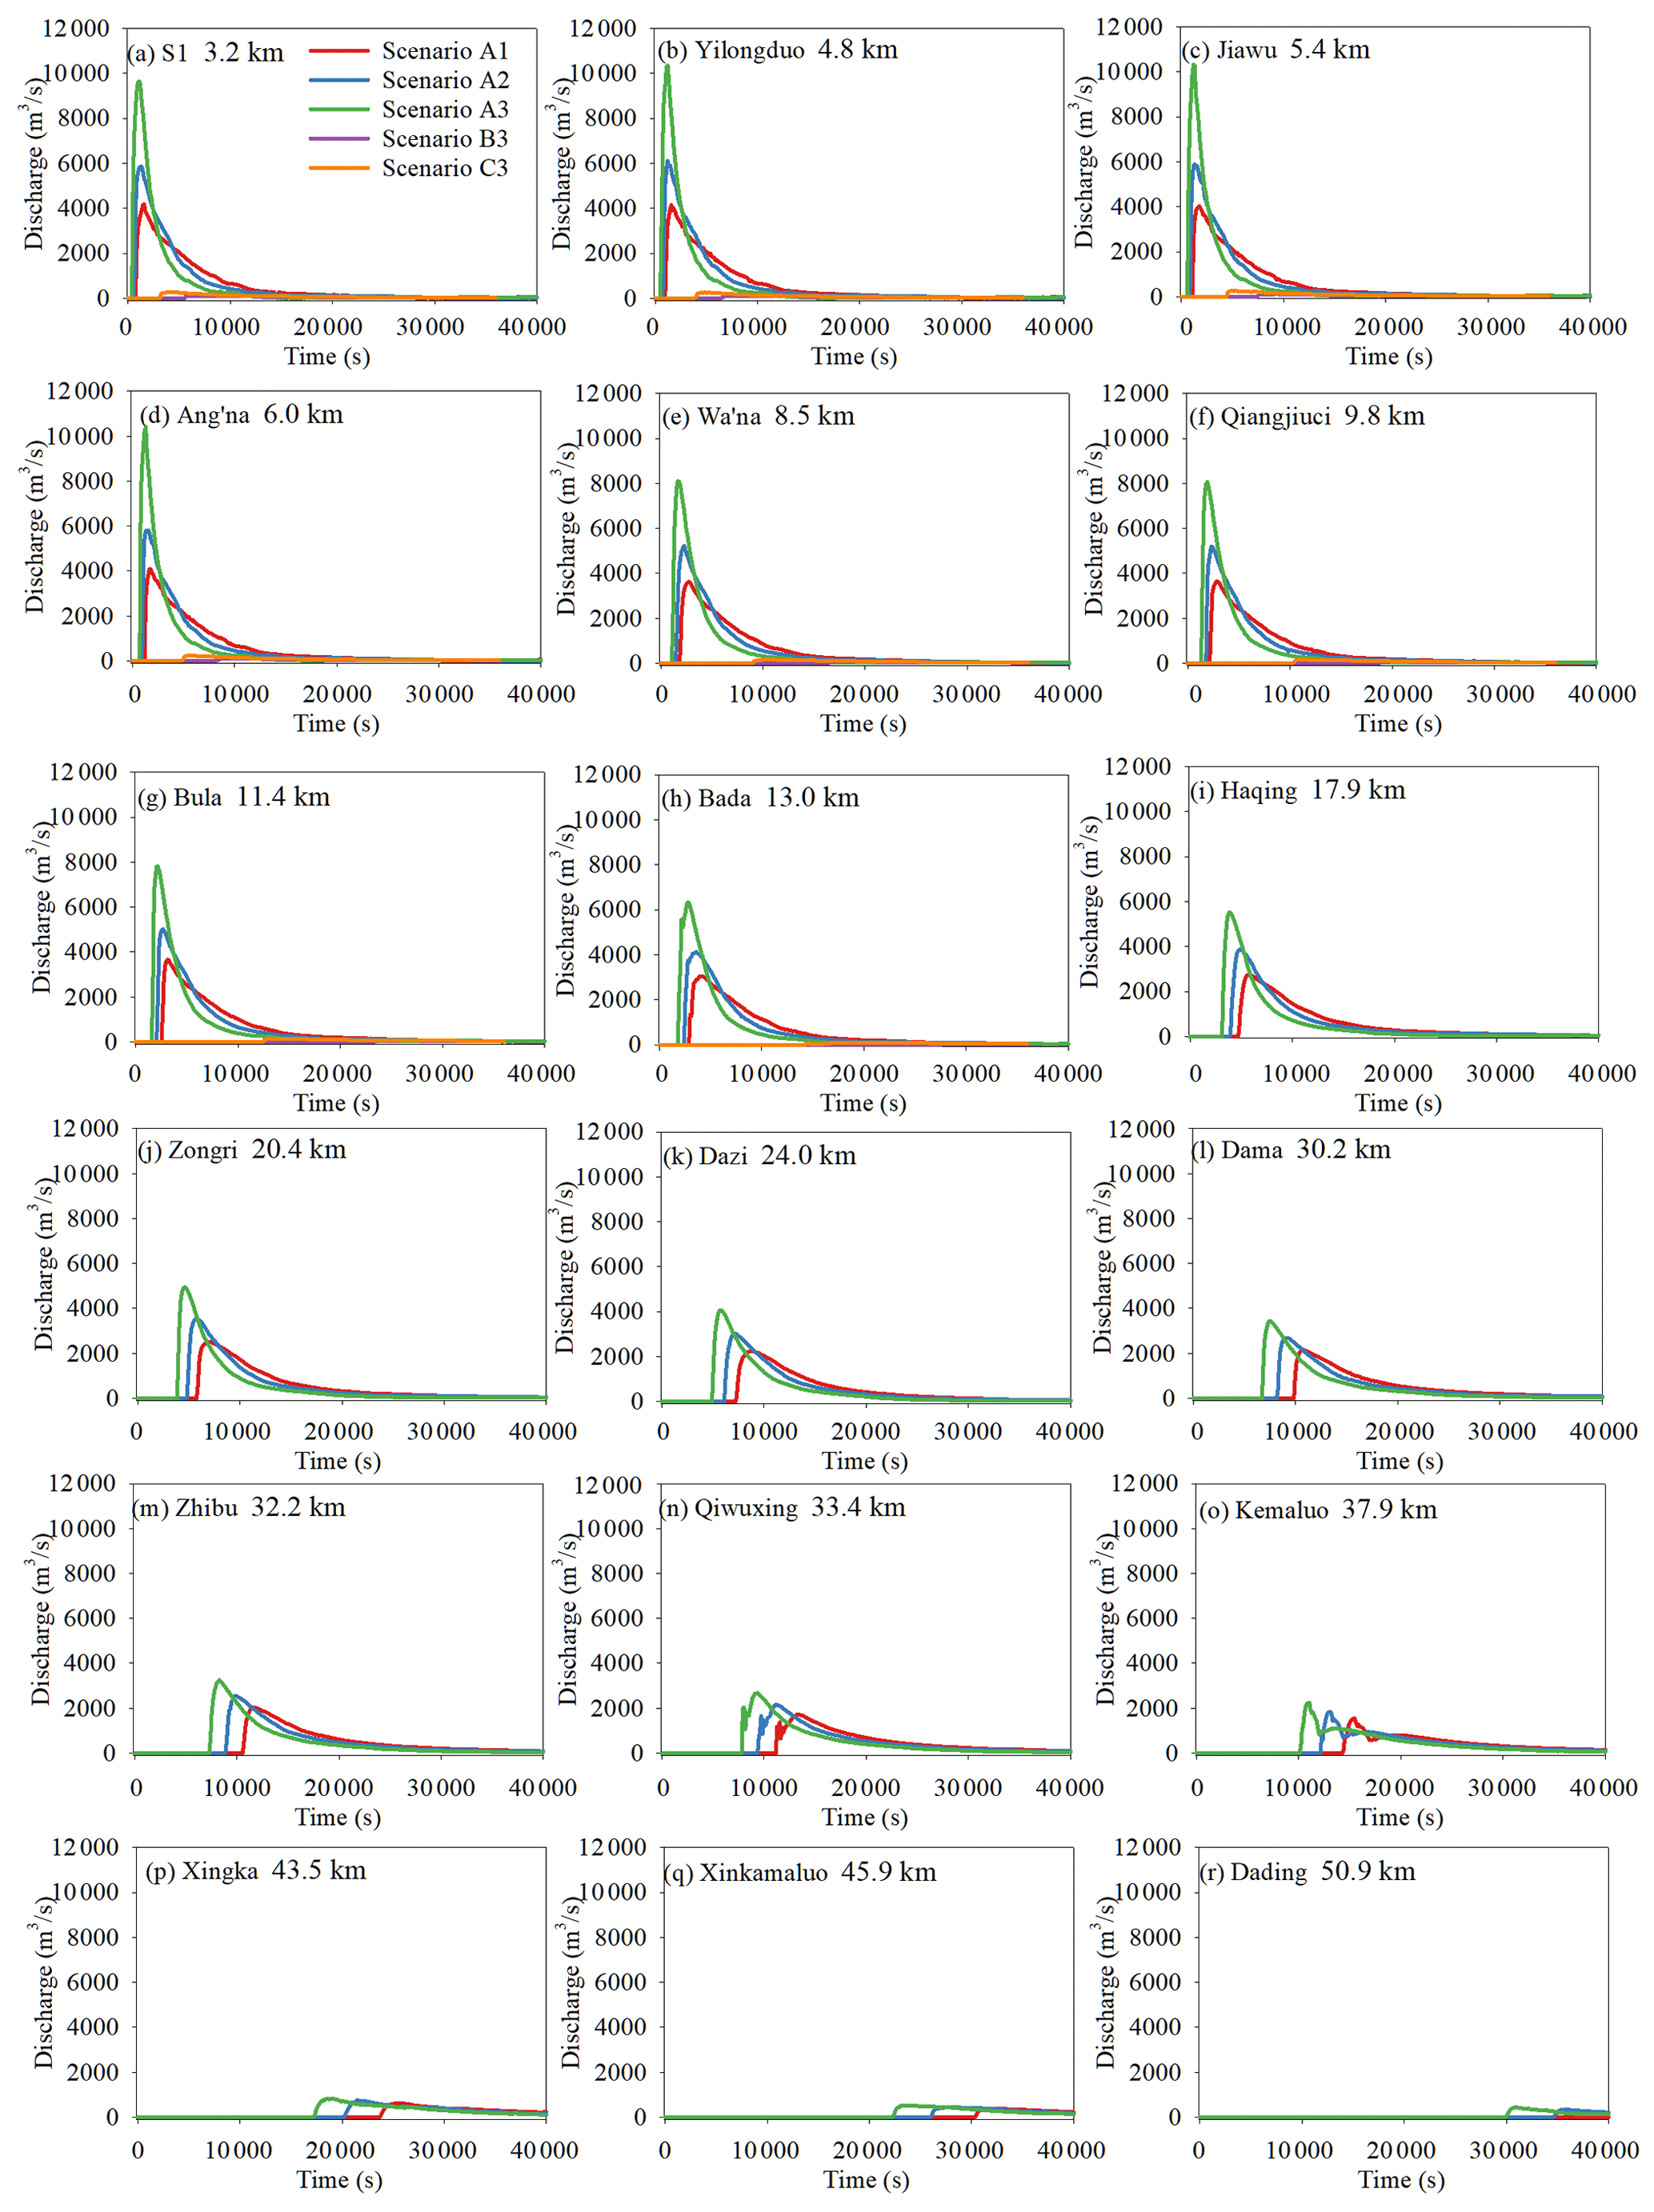
Figure 13Time series of discharge at different settlements along the flow channel (locations in Fig. 1) of different scenarios.

Figure 14Time series of velocity at different settlements along the flow channel (locations in Fig. 1) of different scenarios.
5.1 Lake volume of Bienong Co
Based on the accurate bathymetry data from the USV, we obtained the maximum and the average depths of Bienong Co of 181 and 85.4 m, respectively, in August 2020, with a lake volume of 102.3×10⁶ m3. Considering the rarity of bathymetry data but the frequent GLOFs in the Yi'ong Zangbo basin, we attempted to find more information about glacial lakes in the region from the bathymetry data of Bienong Co. First, relationships for area–volume, area–depth, and depth–volume of Bienong Co were established (Fig. 15). It is hoped that this information could provide a valuable reference for future studies of Bienong Co and other glacial lakes in the region. Then, we compared the area, depth, and volume of Bienong Co with other glacial lakes for which the bathymetry data are available. Bathymetry data are currently available for a small number of glacial lakes on the Tibetan Plateau, which are mainly concentrated in the Himalayas of Nepal and the Poiqu basin of Tibet, China. Longbasaba is a moraine-dammed glacial lake located at the northern slope of the Himalayas, which had an area of 1.22±0.02 km2 in 2009, with the average and the maximum depths of 48±2 and 102±2 m, respectively, and the volume of 64×106 m3 (Yao et al., 2012). Although the area of Longbasaba is approximately 6 % larger than that of Bienong Co, the volume is only 60 % of that of Bienong Co. Lugge glacial lake in Bhutan had an area of approximately 1.17 km2 in 2004, with the maximum and the average depths of 49.8 and 126 m, respectively, and the volume of 58×106 m3 (Yamada et al., 2004). The area of Lugge glacial lake is slightly larger than that of Bienong Co, but the average and the maximum depths are smaller than the corresponding values of Bienong Co. At the time of bathymetry, both South Lhonak lake in India and Imja glacial lake in Nepal had an area of approximately 1.3 km2, which is approximately 13 % larger than that of Bienong Co, but both lakes have volumes that are 64 % and 76 % of Bienong Co's volume, respectively (Sharma et al., 2018; Haritashya et al., 2018). Areas of Raphsthren glacial lake in Bhutan and Tsho Rolpa glacial lake in Nepal were 1.4 and 1.5 km2 when bathymetries were carried out (Geological Survey of India, 1995; ICIMOD, 2011), which are 22 % and 30 % larger than these of Bienong Co. However, their volumes are 65 % and 84 % of these of Bienong Co, respectively. The area of Lower Barun glacial lake in Nepal was 1.8 km2 when it was measured (Haritashya et al., 2018), which is 57 % larger than that of Bienong Co. However, the volume (112×106 m3) is only 9 % larger than that of Bienong Co.
Additionally, due to the scarcity of glacial lake bathymetry data and their significance for glacial lake hazard studies, scholars have proposed relationships to estimate glacial lake volume by area, width, and length (O'Connor et al., 2001; Huggel et al., 2002; Sakai, 2012; Wang et al., 2012a; Yao et al., 2012; Cook and Quincey, 2015; Qi et al., 2022). We estimated the volume of Bienong Co using published relationships based on glacial lakes on the Tibetan Plateau. The results show that the eight published volume–area and width–length relationships all underestimate the volume of Bienong Co to varying degrees (Table 1). It can be inferred that Bienong Co is the deepest glacial lake with the same surface area among the glacial lakes with bathymetry data on the Tibetan Plateau.
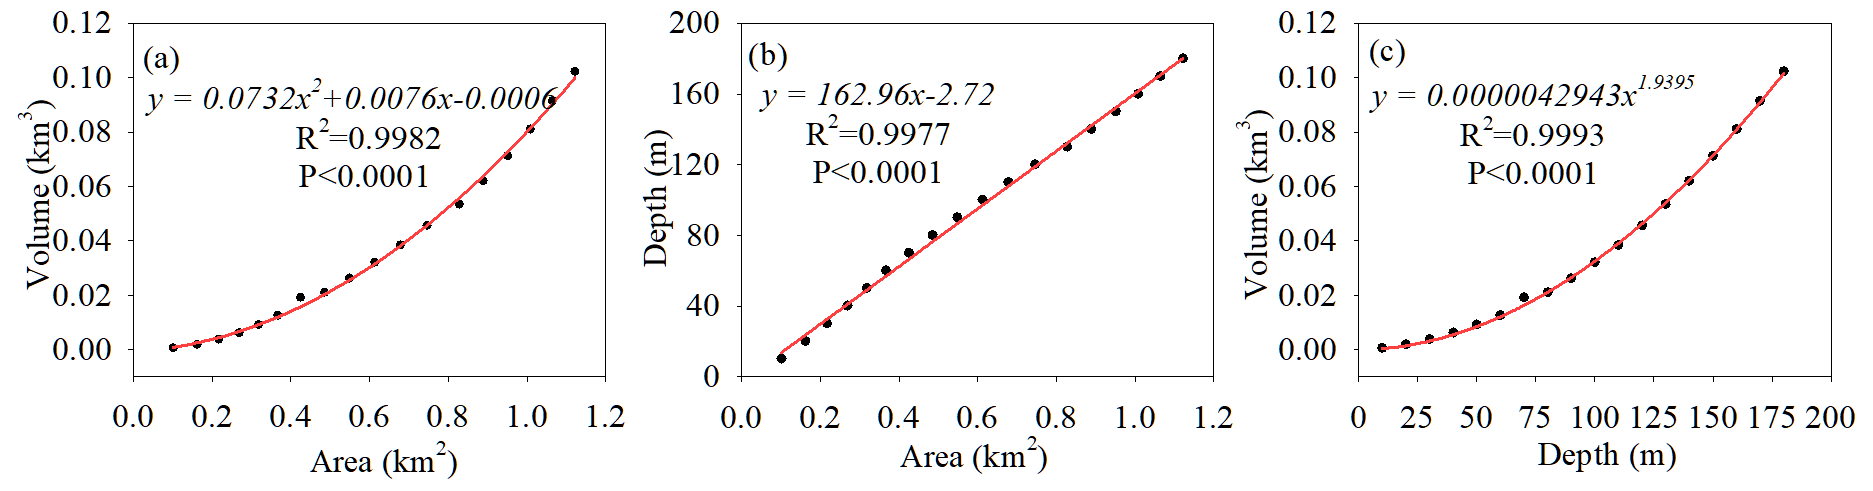
Figure 15Fitting relationship of (a) area and volume, (b) area and depth, and (c) depth and volume of Bienong Co.
Table 1Calculated volume of Bienong Co based on published volume–area relationships for glacial lakes on the Tibetan Plateau.

Note: error = (volume of empirical formulas − bathymetrically derived volume) bathymetrically derived volume × 100 %.
5.2 Modeling explanation
The GLOF process chain simulated in this study starts with triggers, including ice avalanches from the mother glacier and landslides from the lateral moraines. Other triggers are not considered, such as increased glacial meltwater or heavy precipitation. The magnitude, location, and probability of ice avalanches and landslides are the most significant uncertainty sources of this study. Ice avalanches triggered more than 70 % of GLOFs on the Tibetan Plateau, but reliable data on the release area and depth from previous ice avalanche events are scarce. Ice avalanches in this study come from the mother glacier tongue, where the slope is steep and the fissures are well developed. We simulated three ice avalanches with different magnitudes, and each scenario assumes that the ice body breaks off in the vertical direction until it reaches the lake surface, which is unrealistic and may overestimate the volumes of ice avalanches. The RAMMS model can estimate the possible release volume based on the input of the DEM and the release area and depth. The estimated release volumes of Scenarios A1, A2, and A3 are 5×10⁶, 13.1×10⁶, and 41.3×10⁶ m3, respectively. However, simulations show that approximately 76 % (3.8×10⁶ m3), 37 % (4.9×10⁶ m3), and 14 % (5.8×10⁶ m3) of the estimated release volumes enter the lake in Scenarios A1, A2, and A3, respectively. The simulation duration was set to 600 s to ensure the integrity of ice avalanche processes, with most of the ice body entering the lake within the first 100 s. The difference between the volume of the ice avalanche entering the lake and the estimated release volume is mainly determined by the slope and distance between the released source and the lake. In Scenarios A2 and A3, the ice bodies entering the lake account for a small part of the estimated release volumes due to a gentle slope and great distance between the released sources and the lake. The ice avalanche processes are also affected; for example, Scenarios A2 and A3 fluctuate more dramatically than Scenario A1. In addition, the landslide is determined as a trigger given the failure of Jinwu Co in 2020. We selected two release areas by referring to the slope and location of Jinwu Co's landslide. However, the release depth has no specifically quantified reference. We assumed three release depths of 2, 5, and 10 m for each release area to simulate multiple scenarios.
In this study, a reliable simulation of potential future disaster events, such as ice avalanches or landslides, can assist people in understanding the possible risk and raising prevention awareness. However, an accurate prediction is generally difficult due to the limited geological information and triggering mechanism details. In this study, the RAMMS model was used to simulate the movements of potential ice avalanches and landslides. The accuracy of DEM data is crucial for the calculation of the model, which significantly affects the paths, precision, and processes of mass movements (Schneider et al., 2010). The accuracy of the DEM is mainly related to two aspects. One is the topographic change in the glacial environment that occurs in the period between the DEM data acquisition and the avalanche event. The other is the spatial resolution of the DEM: a lower one can lead to an overestimation of sediment area and an underestimation of sediment thickness (Cesca and D'Agostino, 2008). ALOS PALSAR DEM data used in this study were released globally in October 2014 with a spatial resolution of 12.5 m, which can reflect the intensity and path of ice avalanches and landslides simulated in this study. Moreover, the dry Coulomb-type friction μ and the viscous-turbulent friction ξ also influence the modeling results (Bezak et al., 2019). Mikoš and Bezak (2021) found that the magnitude of a mass movement slightly decreases and increases with increasing friction parameters μ and ξ, respectively, while the correlation is not strong. Schneider et al. (2014) found that a higher μ and ξ combination leads to a higher peak velocity, faster stopping mechanism, and shorter process duration. The values of μ and ξ have covered wide ranges in past applications (Mikoš and Bezak, 2021), and they were usually calibrated by actual events. In this study, we chose the values of 0.12 and 1000 m s−2 for μ and ξ, which were used in the avalanche simulation of Lake 513 (Schneider et al., 2014).
The BASEMENT model was applied to simulate the GLOF process chain following the ice avalanche and landslide. Much of the work on the generation, propagation, and run-up of the impulse wave has been focused on empirical models that replicate wave characteristics based on laboratory observations (Heller and Hager, 2010). Numerical simulations have been limited to simplified 2D SWEs (Ghozlani et al., 2013). However, the 2D SWEs do not perform very well in avalanche-generated wave simulations because of the large energy dissipation caused by significant vertical accelerations (Lala et al., 2018). Therefore, empirical models are often used to calibrate the numerical simulations. For example, the Heller–Hager modeling result was employed to calibrate the simulation of the BASEMENT model in previous studies (Byers et al., 2018; Lala et al., 2018). Nevertheless, the numerous parameters required by the Heller–Hager model are still subject to potential uncertainties because most of them are simple quantifications of a lake's geometry. Additionally, the BASEMENT model can only accept inflow in the form of water and not actual mass such as moraines, ice, snow, or mixtures (Kafle et al., 2016). Therefore, the actual situation of avalanches mixing with lake water cannot be simulated because the energy dissipation of water and avalanche entering the lake is different (Somos-Valenzuela et al., 2016). Furthermore, the maximum area of TIN slightly influences the wave amplitude in a lake. The grain size distribution of a moraine dam is critical to the dam erosion simulation. In this study, simulations were performed by referencing an inventory of the grain size distribution of glacial lakes in the Indian Himalayas. The inventory has been validated as being generally reliable (Worni et al., 2013); however, the error in Bienong Co is inevitable.
The ALOS PALSAR DEM has been widely used in studies on cryospheric changes and disasters. In this study, the preprocessing of sink filling for the DEM was performed, but the phenomenon of flood water accumulating in deep puddles still exists, especially in relatively narrow valleys. We manually smoothed several large bumps according to the upstream and downstream elevation. Nevertheless, there are still some smaller bumps that converge the flood to some areas of the flow channel, mainly in the downstream region. The GLOF impact in Qiwuxing, Kemaluo, Xingka, and Dading might be overestimated, especially in the former two villages because they are relatively far away from the river. The latter two villages are still very likely to be threatened by GLOFs due to the proximity to the river. More accurate simulations of GLOFs in the flow channel are limited by the resolution of the ALOS PALSAR DEM. Therefore, more precise topographic data, such as a DEM generated from panchromatic stereo images with spatial resolutions better than 0.8 m obtained by the Gaofen-7 satellite and low-cost UAV-derived DEM products, are prospective. The frictional resistance in the downstream flow channel of Bienong Co is derived from the GLC10 LULC data, which basically fit the reality and have little error in the simulations. GLOF flow processes can be very complex (Zhou et al., 2019), and flows can transform from a clear water flow to a hyper-concentrated flow and then to a debris flow, and these rheological transformations can occur in both space and time as the flow evolves (Worni et al., 2014). In this study, we do not consider the effects of sediment on flow rheology nor the erosion and deposition of sediment along the flow path.
Emmer et al. (2022) divided the research evolution of GLOF process chain simulations into three stages, and this study belongs to the second stage, i.e., applying tailored physically based simulation tools for each component of the process chain and coupling them at the process boundaries. The third stage is the two-phase (Pudasaini, 2012) and three-phase (Pudasaini and Mergili, 2019) mass flow models and related simulation tools (Mergili et al., 2017; Mergili and Pudasaini, 2021) and the integrated simulations of the entire GLOF process chain in one single simulation step. The main advantage of the methods in the second stage is the simplicity and operability, with the convenient graphical user interface (GUI) of the software in different links. Models for different links have been matured and widely applied in corresponding fields with reliable performance and accessibility of the required parameters. However, the third stage is undoubtedly the focus of future research to investigate the whole GLOF flooding process in more detail, in depth, and better in order to reduce uncertainty in the coupling between different models. This will certainly involve more detailed parameters, increasing the difficulty of the simulation.
As a moraine-dammed glacial lake located in the SETP, Bienong Co has received significant attention from local government due to its larger area and the high potential for GLOF hazard. Based on bathymetry data, remote sensing images, and DEM data, combined with multiple models of RAMMS, BASEMENT, and Heller–Hager, we conducted a comprehensive investigation of the potential GLOF process chain of Bienong Co, including initial mass movements from the mother glacier and the lateral moraines, displacement waves' generation and propagation in the lake, overtopping flows and erosion on the moraine dam, and subsequent downstream floods. The following main results were obtained.
-
According to the bathymetry data, the morphology of Bienong Co's lake basin features a relatively flat bottom and steep flanks, with the slope near the glacier (16.5∘) being steeper than that near the moraine dam (11.3∘). The volume of Bienong Co was m3 in August 2020, with a maximum depth of ∼181 m. Bienong Co is highly prone to a potential GLOF due to the huge volume, the fissure-developed mother glacier tongue, steep slopes of lateral moraines, the steep distal-facing slope of the moraine dam, and the low freeboard.
-
The volumes of mass entering the lake for the three ice avalanche scenarios (A1–3) are much larger than those of the six landslide scenarios (B1–3 and C1–3). Volumes of ice avalanches entering the lake in Scenarios A1, A2, and A3 are 3.8×10⁶, 4.9×10⁶, and 5.8×10⁶ m3, respectively. Among the six landslide scenarios, Scenario B1 releases the minimum volume of 0.03×10⁶ m3, and Scenario C3 releases the maximum volume of 0.30×10⁶ m3. As a result, the impact zones, maximum flow heights, and maximum flow velocities in the lake of Scenarios A1–3 are significantly larger than those of Scenarios B1–3 and C1–3. Wave amplitudes near the moraine dam in Scenarios A1, A2, and A3 are 17.1, 20.2, and 25.2 m, respectively. Overtopping flows of all three scenarios cause dam erosion, with little difference in breach depth (19.0, 19.1, and 19.3 m), but the larger difference in breach width (295.0, 339.4, and 368.5 m). The volumes of water lost in the lake of Scenarios A1, A2, and A3 are 24.1×10⁶, 25.3×10⁶, and 26.4×10⁶ m3 with peak discharges of 4996, 7817, and 13 078 m3 s−1, respectively. Among Scenarios B1–3 and C1–3, only Scenarios B3 and C3 with larger magnitudes cause dam erosion, with breach depths of 6.5 and 7.9 m and breach widths of 153 and 169 m, respectively.
-
GLOFs in Scenarios A1–3 all pass through 18 settlements in the downstream flow channel in 20 h, with inundation areas of 7.6, 8.0, and 8.5 km2 and average water depths of 8.4, 9.1, and 10.0 m, respectively. Floods threaten more than half of the villages in the downstream flow channel. Scenarios B1, B2, C1, and C2 produce limited overtopping flows that cannot pose a threat to the downstream settlements. Both Scenarios B3 and C3 produce GLOFs that flow through the first eight downstream settlements in 20 h, but the impact is relatively small.
-
Bienong Co is the deepest known glacial lake with the same surface area on the Tibetan Plateau. There are uncertainties in the GLOF process chain simulation. However, this study is significant for understanding the potential hazard of Bienong Co.
The Landsat MSS/TM/OLI images are available from the United States Geological Survey (2023; https://earthexplorer.usgs.gov/, last access: 29 January 2023). The AST14DEM dataset and ALOS PALSAR DEM used in this study can be obtained from the National Aeronautics and Space Administration (NASA) Earthdata website (https://doi.org/10.5067/ASTER/AST14DEM.003; NASA/METI/AIST/Japan Spacesystems and U.S./Japan ASTER Science Team, 2001). The MapWorld images are provided by the National Platform for Common Geospatial Information Services (2023; https://www.tianditu.gov.cn/, last access: 29 January 2023). The GLC10 LULC product is available from http://data.ess.tsinghua.edu.cn/fromglc10_2017v01.html (last access: 31 January 2023; Gong et al., 2019).
HD contributed to the conceptualization, methodology, software, formal analysis, visualization, and writing of the original draft. XY contributed to the conceptualization, supervision, funding acquisition, and investigation of the glacial lake, as well as review and editing of the manuscript. YZ, HJ, and QiW contributed to the investigation of the glacial lake. ZD, BW, and QiaW contributed to the model progress. JH contributed to setting up the experimental equipment and obtaining data.
The contact author has declared that none of the authors has any competing interests.
Publisher's note: Copernicus Publications remains neutral with regard to jurisdictional claims in published maps and institutional affiliations.
We express our sincere gratitude to the editors and the two reviewers for their valuable comments on the revision and enhancement of this article. We also thank Wilfried Haeberli, who provided constructive comments on this article.
This research has been supported by the National Key Research Program of China (grant no. 2019YFE0127700), the National Natural Science Foundation of China (grant nos. 41861013 and 42071089), “Innovation Star” of the Outstanding Graduate Student Program in Gansu Province (grant no. 2021-CXZX-215), Northwest Normal University's 2020 Graduate Research Grant Program (grant no. 2020KYZZ001012), and the Outstanding PhD Student Program in Gansu Province (grant no. 22JR5RA139).
This paper was edited by Daniel Farinotti and reviewed by Adam Emmer and one anonymous referee.
Bezak, N., Sodnik, J., and Mikoš, M.: Impact of a random sequence of Debris flows on torrential fan formation, Geosciences, 9, 64, https://doi.org/10.3390/geosciences9020064, 2019.
Bolch, T., Peters, J., Yegorov, A., Pradhan, B., Buchroithner, M., and Blagoveshchensky, V.: Identification of potentially dangerous glacial lakes in the northern Tien Shan, Nat. Hazards, 59, 1691–1714, https://doi.org/10.1007/s11069-011-9860-2, 2011.
Brun, F., Berthier, E., Wagnon, P., Kääb, A., and Treichler, D.: A spatially resolved estimate of High Mountain Asia glacier mass balances from 2000 to 2016, Nat. Geosci., 10, 668–673, https://doi.org/10.1038/ngeo2999, 2017.
Brunner, G. W.: HEC-RAS River Analysis System: User's Manual. US Army Corps of Engineers, Institute for Water Resources, Hydrologic Engineering Center, 2002.
Byers, A. C., Rounce, D. R., and Shugar, D. H.: A rockfall-induced glacial lake outburst flood, Upper Barun Valley, Nepal, Landslides, 16, 533–549, https://doi.org/10.1007/s10346-018-1079-9, 2018.
Byers, A. C., Chand, M. B., and Lala, J.: Reconstructing the history of glacial lake outburst floods (GLOF) in the Kanchenjunga conservation area, east Nepal: an interdisciplinary approach, Sustainability, 12, 5407, https://doi.org/10.3390/su12135407, 2020.
Carrivick, J. L. and Tweed, F. S.: A global assessment of the societal impacts of glacier outburst floods, Global. Planet. Change., 144, 1–16, https://doi.org/10.1016/j.gloplacha.2016.07.001, 2016.
Cesca, M. and D'Agostino, V.: Comparison between FLO-2D and RAMMS in debris-flow modelling: a case study in the Dolomites, WIT Trans. Eng. Sci., 60, 197–206, https://doi.org/10.2495/DEB080201, 2008.
Cheng, Z. L., Zhu, P., Dang, C., and Liu, J. J.: Hazards of debris flow due to glacier lake outburst in Southeastern Tibet, J. Glaciol. Geocryol., 30, 954–959, 2008.
Cheng, Z. L., Liu, J. J., and Liu, J. K.: Debris flow induced by glacial-lake break in Southeast Tibet, Earth Sci. Front., 16, 207–214, https://doi.org/10.2495/DEB100091, 2009.
Christen, M., Kowalski, J., and Bartelt, P.: RAMMS: numerical simulation of dense snow avalanches in three-dimensional terrain, Cold Reg. Sci. Technol., 63, 1–14, 2010.
Cook, K. L., Andermann, C., Gimbert, F., Adhikari, B. R., and Hovius, N.: Glacial lake outburst floods as drivers of fluvial erosion in the Himalaya, Science, 362, 53–57, https://doi.org/10.1126/science.aat4981, 2018.
Cook, S. J. and Quincey, D. J.: Estimating the volume of Alpine glacial lakes, Earth Surf. Dynam., 3, 559–575, https://doi.org/10.5194/esurf-3-559-2015, 2015.
Coon, W. F.: Estimation of roughness coefficients for natural stream channels with vegetated banks, United States Geological Survey water-supply paper, 2441, 1998.
Cui, P., Ma, D. T., and Chen, N. S.: The initiation, motion and mitigation of debris flow caused by glacial lake outburst, Quaternary Sci., 23, 621–628, https://doi.org/10.1016/S0955-2219(02)00073-0, 2003.
Dehecq, A., Gourmelen, N., Gardner, A. S., Brun, F., Goldberg, D., Nienow, P. W., Berthier, E., Vincent, C., Wagnon, P., and Trouvé, E.: Twenty-first century glacier slowdown driven by mass loss in High Mountain Asia, Nat. Geosci., 12, 22–27, https://doi.org/10.1038/s41561-018-0271-9, 2019.
Duan, H. Y., Yao, X. J., Zhang, D. H., Qi, M. M., and Liu, J.: Glacial lake changes and identification of potentially dangerous glacial lakes in the Yi'ong Zangbo River Basin, Water-Sui, 12, 538, https://doi.org/10.3390/w12020538, 2020.
Emmer, A. and Cochachin, A.: The causes and mechanisms of moraine-dammed lake failures in the Cordillera Blanca, North American Cordillera and Himalaya, AUC. Geogr., 48, 5–15, https://doi.org/10.14712/23361980.2014.23, 2013.
Emmer, A. and Vilímek, V.: New method for assessing the susceptibility of glacial lakes to outburst floods in the Cordillera Blanca, Peru, Hydrol. Earth Syst. Sci., 18, 3461–3479, https://doi.org/10.5194/hess-18-3461-2014, 2014.
Emmer, A., Allen, S. K., Carey, M., Frey, H., Huggel, C., Korup, O., Mergili, M., Sattar, A., Veh, G., Chen, T. Y., Cook, S. J., Correas-Gonzalez, M., Das, S., Diaz Moreno, A., Drenkhan, F., Fischer, M., Immerzeel, W. W., Izagirre, E., Joshi, R. C., Kougkoulos, I., Kuyakanon Knapp, R., Li, D., Majeed, U., Matti, S., Moulton, H., Nick, F., Piroton, V., Rashid, I., Reza, M., Ribeiro de Figueiredo, A., Riveros, C., Shrestha, F., Shrestha, M., Steiner, J., Walker-Crawford, N., Wood, J. L., and Yde, J. C.: Progress and challenges in glacial lake outburst flood research (2017–2021): a research community perspective, Nat. Hazards Earth Syst. Sci., 22, 3041–3061, https://doi.org/10.5194/nhess-22-3041-2022, 2022.
Evans, S. G.: The maximum discharge of outburst floods caused by the breaching of man-made and natural dams, Can. Geotech. J., 24, 385–387, https://doi.org/10.1139/t87-062, 1987.
Fujita, K., Sakai, A., Takenaka, S., Nuimura, T., Surazakov, A. B., Sawagaki, T., and Yamanokuchi, T.: Potential flood volume of Himalayan glacial lakes, Nat. Hazards Earth Syst. Sci., 13, 1827–1839, https://doi.org/10.5194/nhess-13-1827-2013, 2013.
Geological Survey of India: Geology environmental hazards and remedial measures of the Lunana Area, Gasa Dzongkhang, Report of 1995 Indo-Bhutan Expedition, Bhutan Unit, Geological Survey of India, Samtse, 1995.
Ghozlani, B., Zouhaier, H., and Khlifa, M.: Numerical study of sur- face water waves generated by mass movement, Fluid Dyn. Res., 45, 055506, https://doi.org/10.1088/0169-5983/45/5/055506, 2013.
Gong, P., Liu, H., Zhang, M. N., Li, C. C., Wang, J., Huang, H. B., Clinton, N., Ji, L. Y., Li, W. Y., Bai, Y. Q., Chen, B., Xu, B., Zhu, Z. L., Yuan, C., Suen, H. P., Guo, L., Xu, N., Li, W. J., Zhao, Y. Y., Yang, J., Yu, C. Q., Wang, X., Fu, H. H., Yu, L., Dronova, I., Hui, F. M., Cheng, X., Shi, X. L., Xiao, F. J., Liu, Q. F., and Song, L. C.: Stable classification with limited sample: Transferring a 30-m resolution sample set collected in 2015 to mapping 10-m resolution global land cover in 2017, Sci. Bull., 64, 370–373, https://doi.org/10.1016/j.scib.2019.03.002, 2019 (data available at: http://data.ess.tsinghua.edu.cn/fromglc10_2017v01.html, last access: 31 January 2023).
Haeberli, W., Kääb, A., Vonder Mühll, D., and Teysseire, P.: Prevention of outburst floods from periglacial lakes at Grubengletscher, Valais, Swiss Alps, J. Glaciol., 47, 111–122, https://doi.org/10.3189/172756501781832575, 2001.
Haritashya, U. K., Kargel, J. S., Shugar, D. H., Leonard, G. J., Strattman, K., Watson, C. S., Shean, D., Harrison, S., Mandli, K. T., and Regmi, D.: Evolution and controls of large glacial lakes in the Nepal Himalaya, Remote Sens.-Basel, 10, 798, https://doi.org/10.3390/rs10050798, 2018.
Harrison, S., Kargel, J. S., Huggel, C., Reynolds, J., Shugar, D. H., Betts, R. A., Emmer, A., Glasser, N., Haritashya, U. K., Klimeš, J., Reinhardt, L., Schaub, Y., Wiltshire, A., Regmi, D., and Vilímek, V.: Climate change and the global pattern of moraine-dammed glacial lake outburst floods, The Cryosphere, 12, 1195–1209, https://doi.org/10.5194/tc-12-1195-2018, 2018.
Heller, V. and Hager, W. H.: Impulse product parameter in landslide generated impulse waves, J. Waterw. Port. Coast., 136, 145–155, https://doi.org/10.1061/(ASCE)WW.1943-5460.0000037, 2010.
Huang, L., Zhu, L. P., Wang, J. B., Ju, J. T., Wang, Y., Zhang, J. F., and Yang, R. M.: Glacial activity reflected in a continuous lacustrine record since the early Holocene from the proglacial Laigu Lake on the southeastern Tibetan Plateau, Palaeogeogr. Palaeocl., 456, 37–45, https://doi.org/10.1016/j.palaeo.2016.05.019, 2016.
Huggel, C., Kääb, A., Haeberli, W., Teysseire, P., and Paul, F.: Remote sensing based assessment of hazards from glacier lake outbursts: a case study in the Swiss Alps, Can. Geotech. J., 39, 316–330, https://doi.org/10.1139/t01-099, 2002.
Huggel, C., Haeberli, W., Kääb, A., Bieri, D., and Richardson, S.: An assessment procedure for glacial hazards in the Swiss Alps, Can. Geotech. J., 41, 1068–1083, https://doi.org/10.1139/t04-053, 2004.
International Centre for Integrated Mountain Development (ICIMOD): Glacial lakes and glacial lake outburst floods in Nepal, ICIMOD, Kathmandu, 99, 2011.
Kääb, A., Berthier, E., Nuth, C., Gardelle, J., and Arnaud, Y.: Contrasting patterns of early twenty-first-century glacier mass change in the Himalayas, Nature, 488, 495–498, https://doi.org/10.1038/nature11324, 2012.
Kääb, A., Treichler, D., Nuth, C., and Berthier, E.: Brief Communication: Contending estimates of 2003–2008 glacier mass balance over the Pamir–Karakoram–Himalaya, The Cryosphere, 9, 557–564, https://doi.org/10.5194/tc-9-557-2015, 2015.
Kafle, J., Pokhrel, P. R., Khattri, K. B., Kattel, P., Tuladhar, B. M., and Pudasain, S. P.: Landslide-generated tsunami and particle transport in mountain lakes and reservoirs, Ann. Glaciol., 57, 232–244, https://doi.org/10.3189/2016AoG71A034, 2016.
Ke, C. Q., Kou, C., Ludwig, R., and Qin, X.: Glacier velocity measurements in the eastern Yigong Zangbo basin, Tibet, China, J. Glaciol., 59, 1060–1068, https://doi.org/10.3189/2013jog12j234, 2013.
Ke, C. Q., Han, Y. F., and Kou, C.: Glacier change in the Yigong Zangbu Basin, Tibet, China (1988 to 2010), Dragon 3Mid Term Results, 724, https://articles.adsabs.harvard.edu/pdf/2014ESASP.724E..16K (last access: 29 January 2023), 2014.
Khanal, N. R., Hu, J. M., and Mool, P.: Glacial lake outburst flood risk in the Poiqu/Bhote Koshi/Sun Koshi River Basin in the Central Himalayas, The International Mountain Society Department of Psychology, Indiana University, Bloomington, 4, 47405, https://doi.org/10.1659/MRD-JOURNAL-D-15-00009, 2015.
Lala, J. M., Rounce, D. R., and McKinney, D. C.: Modeling the glacial lake outburst flood process chain in the Nepal Himalaya: reassessing Imja Tsho's hazard, Hydrol. Earth Syst. Sci., 22, 3721–3737, https://doi.org/10.5194/hess-22-3721-2018, 2018.
Larrazabal, J. M. and Peñas, M. S.: Intelligent rudder control of an unmanned surface vessel, Expert. Syst. Appl., 55, 106–117, https://doi.org/10.1016/j.eswa.2016.01.057, 2016.
Li, D., Shangguan D. H., Wang, X. Y., Ding, Y. J., Su, P. C., Liu, R. L., and Wang, M. X.: Expansion and hazard risk assessment of glacial lake Jialong Co in the central Himalayas by using an unmanned surface vessel and remote sensing, Sci. Total. Environ., 784, 147249, https://doi.org/10.1016/j.scitotenv.2021.147249, 2021.
Li, J. J., Zheng, B. X., Yang, X. J., Xie, Y. Q., Zhang, L. Y., Ma, Z. H., Xu, S. Y., and Zhu, S. T. (Eds.): Glaciers in Tibet, Science Press, Beijing, China, 13–14 pp., ISBN 130313274, 1986.
LIGG/WECS/NEA: Report on first expedition to glaciers and glacier lakes in the Pumqu (Arun) and Poiqu (Bhote-Sun Koshi) River Basins, Xizang (Tibet), China, Sino-Nepalese Joint Investigation of Glacier Lake Outburst Flood in Himalayas in 1987, 192, 1988.
Liu, J. K., Zhang, J. J., Gao, Bo., Li, Y. L., Li, M. Y., Wujin, D. J., and Zhou, L. X.: An overview of glacial lake outburst flood in Tibet, China, J. Glaciol. Geocryol., 41, 1335–1347, https://doi.org/10.7522/j.issn.1000-0240.2019.0073, 2019.
Liu, J. K., Zhou, L. X., Zhang, J. J., and Zhao, W. Y.: Characteristics of Jiwencuo GLOF, Lhari county, Tibet, Geol. Rev., 67, 17–18, https://doi.org/10.16509/j.georeview.2021.s1.007, 2021.
Liu, S. Y., Pu, J. C., Deng, X. F., Su, Z., Zhao, J. D., and He, J. C.: Glaciers and Glacier Landscapes in China. Shanghai Popular Science Press, Shanghai, China, 38–41 pp., ISBN 9787542759924, 2014.
Liu, W. M., Lai, Z. P., Hu, K. H., Ge, Y. G, Cui, P., Zhang, X. G., and Liu, F.: Age and extent of a giant glacial-dammed lake at Yarlung Tsangpo gorge in the Tibetan Plateau, Geomorphology, 246, 370–376, https://doi.org/10.1016/j.geomorph.2015.06.034, 2015.
Liu, Z. X., Zhang, Y. M., Yu, X., and Yuan, C.: Unmanned surface vehicles: an overview of developments and challenges, Annu. Rev. Control., 41, 71–39, https://doi.org/10.1016/j.arcontrol.2016.04.018, 2016.
Lliboutry, L.: Glaciological problems set by the control of dangerous lakes in Cordillera Blanca, Peru, II. Movement of a covered glacier embedded within a rock glacier, J. Glaciol., 18, 255–274, https://doi.org/10.3189/S0022143000021341, 1977.
Lv, R. R., Tang, X. B., and Li, D. J.: Glacial lake outburst mudslide in Tibet, Chengdu University of Science and Technology Press, Chengdu, 69–105, 1999.
Mckillop, R. J. and Clague, J.: Statistical, remote sensing-based approach for estimating the probability of catastrophic drainage from moraine-dammed lakes in southwestern British Columbia, Global Planet. Change, 56, 153–171, https://doi.org/10.1016/J.GLOPLACHA.2006.07.004, 2007.
Mergili, M. and Pudasaini, S. P.: r.avaflow-The open source mass flow simulation model, r.avaflow [code], https://www.avaflow.org/ (last access: 1 October 2021), 2020.
Mergili, M. and Schneider, J. F.: Regional-scale analysis of lake outburst hazards in the southwestern Pamir, Tajikistan, based on remote sensing and GIS, Nat. Hazards Earth Syst. Sci., 11, 1447–1462, https://doi.org/10.5194/nhess-11-1447-2011, 2011.
Mergili, M., Fischer, J.-T., Krenn, J., and Pudasaini, S. P.: r.avaflow v1, an advanced open-source computational framework for the propagation and interaction of two-phase mass flows, Geosci. Model Dev., 10, 553–569, https://doi.org/10.5194/gmd-10-553-2017, 2017.
Mikoš, M. and Bezak, N.: Debris flow modelling using RAMMS model in the Alpine environment with focus on the model parameters and main characteristics, Front. Earth Sci., 8, 605061, https://doi.org/10.3389/feart.2020.605061, 2021.
Mool, P. K., Bajracharya, S. R., and Joshi, S. P.: Inventory of glaciers, glacial lakes and glacial lake outburst floods, monitoring and early warning systems in the Hindu Kush- Himalayan region: Nepal, ICIMOD & UNEP RRC-AP, 363, 2001.
NASA/METI/AIST/Japan Spacesystems and U.S./Japan ASTER Science Team: ASTER DEM Product, NASA EOSDIS Land Processes DAAC [data set], https://doi.org/10.5067/ASTER/AST14DEM.003, 2001.
National Platform for Common Geospatial Information Services: https://www.tianditu.gov.cn/, last access: 29 January 2023.
Neckel, N., Kropáček, J., Bolch, T., and Hochschild, V.: Glacier mass changes on the Tibetan Plateau 2003–2009 derived from ICESat laser altimetry measurements, Environ. Res. Lett., 9, 468–475, https://doi.org/10.1088/1748-9326/9/1/014009, 2014.
Nie, Y., Liu, Q., Wang, J. D., Zhang, Y. L., Sheng, Y. W., and Liu, S. Y.: An inventory of historical glacial lake outburst floods in the Himalayas based on remote sensing observations and geo-morphological analysis, Geomorphology, 308, 91–106, https://doi.org/10.1016/j.geomorph.2018.02.002, 2018.
O'Connor, J. E., Hardison, J. H., and Costa, J. E.: Debris flows from failures of neoglacial-age moraine dams in the Three Sisters and Mount Jefferson wilderness areas, Oregon, United States Geological Survey Professional Paper, 1606, 11–40, https://doi.org/10.1007/BF01211117, 2001.
Osti, R. and Egashira, S.: Hydrodynamic characteristics of the Tam Pokhari glacial lake outburst flood in the Mt. Everest region, Nepal, Hydrol. Process., 23, 2943–2955, https://doi.org/10.1002/hyp.7405, 2009.
Prakash, C. and Nagarajan, R.: Outburst susceptibility assessment of moraine-dammed lakes in Western Himalaya using an analytic hierarchy process, Earth. Surf. Proc. Land., 42, 2306–2321, https://doi.org/10.1002/esp.4185, 2017.
Pudasaini, S. P.: A general two-phase debris flow model, J. Geophys. Res., 117, F03010, https://doi.org/10.1029/2011JF002186, 2012.
Pudasaini, S. P. and Mergili, M.: A multi-phase mass flow model, J. Geophys. Res.-Sol. Ea., 124, 2920–2942, https://doi.org/10.1029/2019jf005204, 2019.
QGIS Development Team: QGIS Geographic Information System, Open Source Geospatial Foundation, http://qgis.org (last access: 1 November 2017), 2016.
Qi, M. M., Liu, S. Y., Yao, X. J., Grünwald, R., and Liu, J.: Lake inventory and potentially dangerous glacial lakes in the Nyang Qu Basin of China between 1970 and 2016, J. Mt. Sci.-Engl., 17, 851–870, https://doi.org/10.1007/s11629-019-5675-5, 2020.
Qi, M. M., Liu, S. Y., Wu, K. P., Zhu, Y., Xie, F. M., Jin, H. A., Gao, Y. P., and Yao, X. J.: Improving the accuracy of glacial lake volume estimation: a case study in the Poiqu basin, central Himalayas, J. Hydrol., 610, 127973, https://doi.org/10.1016/j.jhydrol.2022.127973, 2022.
Qin, D. H., Dong, W. J., and Luo, Y.: Climate and environment change in China, China Meteorological Press, Beijing, 116–121, 2012.
RAMMS: AVALANCHE User Manual, v1.70, Switzerland: ETH, https://ramms.slf.ch/ramms/downloads/RAMMS_AVAL_Manual.pdf (last access: 29 January 2023), 2017.
Richardson, S. D. and Reynolds, J. M.: An overview of glacial hazards in the Himalayas, Quatern. Int., 65, 31–47, https://doi.org/10.1016/S1040-6182(99)00035-X, 2000.
Risio, M., Girolamo, P. D., and Beltrami, G. M.: Forecasting landslide generated Tsunamis: a review, the Tsunami threat-research and technology, 81–106, https://doi.org/10.5772/13767, 2011.
Rounce, D. R., McKinney, D. C., Lala, J. M., Byers, A. C., and Watson, C. S.: A new remote hazard and risk assessment framework for glacial lakes in the Nepal Himalaya, Hydrol. Earth Syst. Sci., 20, 3455–3475, https://doi.org/10.5194/hess-20-3455-2016, 2016.
Sakai, A.: Glacial lakes in the Himalayas: a review on formation and expansion processes, Global Environ. Res., 16, 23–30, 2012.
Sakai, A., Yamada, T., and Fujita, K.: Volume change of Imja Glacial Lake in the Nepal Himalayas, International Symposium on Disaster Mitigation & Basin Wide Water Management, 7–10 December 2003, Niigata, 556–561, 2003.
Sattar, A., Goswami, A., and Kulkarni, A. V.: Hydrodynamic moraine-breach modeling and outburst flood routing – a hazard assessment of the South Lhonak lake, Sikkim, Sci. Total. Environ., 668, 362–378, https://doi.org/10.1016/j.scitotenv.2019.02.388, 2019.
Sattar, A., Haritashya, U. K., Kargel, J. S., Leonard, G. J., and Chase, D. V.: Modeling lake outburst and downstream hazard assessment of the Lower Barun Glacial Lake, Nepal Himalaya, J. Hydrol., 598, 126208, https://doi.org/10.1016/j.jhydrol.2021.126208, 2021.
Schneider, D., Bartelt, P., Caplan-Auerbach, J., Christen, M., Huggel, C., and W. McArdell, B.: Insights into rock-ice avalanche dynamics by combined analysis of seismic recordings and a numerical avalanche model, J. Geophys. Res., 115, F04026, https://doi.org/10.1029/2010JF001734, 2010.
Schneider, D., Huggel, C., Cochachin, A., Guillén, S., and García, J.: Mapping hazards from glacier lake outburst floods based on modelling of process cascades at Lake 513, Carhuaz, Peru, Adv. Geosci., 35, 145–155, https://doi.org/10.5194/adgeo-35-145-2014, 2014.
Sharma, R. K., Pradhan, P., Sharma, N. P., and Shrestha, D. G.: Remote sensing and in situ-based assessment of rapidly growing South Lhonak glacial lake in eastern Himalaya, India, Nat. Hazards., 93, 393, https://doi.org/10.1007/s11069-018-3348-2, 2018.
Shi, W. L., Yang, C. T., You, G. X., and Jin, M. X.: The measurement of reserve of glacier block lake on the upper stream of Yerqiang river and the calculation of its maximum flood, Arid Land Geography, 14, 31–35, 1991.
Shugar, D., Burr, A., Haritashya, U. K., Kargel, J. S., Watson, C. S., Kennedy, M. C., Bevington, A. R., Betts, R. A., Harrison, S., and Strattman, K.: Rapid worldwide growth of glacial lakes since 1990, Nat. Clim. Change., 10, 939–945, https://doi.org/10.1038/s41558-020-0855-4, 2020.
Singh, V. P.: Dam Breach Modelling Technology, Kluwer Academic Publishers, Dordrecht, Boston, London, ISBN 978-94-015-8747-1, https://doi.org/10.1007/978-94-015-8747-1, 1996.
Somos-Valenzuela, M. A., Chisolm, R. E., Rivas, D. S., Portocarrero, C., and McKinney, D. C.: Modeling a glacial lake outburst flood process chain: the case of Lake Palcacocha and Huaraz, Peru, Hydrol. Earth Syst. Sci., 20, 2519–2543, https://doi.org/10.5194/hess-20-2519-2016, 2016.
Song, C. Q., Sheng, Y. W., Ke, L. H., Nie, Y., and Wang, J. D.: Glacial lake evolution in the southeastern Tibetan Plateau and the cause of rapid expansion of proglacial lakes linked to glacial-hydrogeomorphic processes, J. Hydrol., 540, 504–514, https://doi.org/10.1016/j.jhydrol.2016.06.054, 2016.
Specht, M., Specht, C., Lasota, H., and Cywiński, P.: Assessment of the steering precision of a hydrographic unmanned surface vessel (USV) along sounding profiles using a low-cost multi-global navigation satellite system (GNSS) receiver supported autopilot, Sensors-Basel, 19, 3939, https://doi.org/10.3390/s19183939, 2019.
Sun, M. P., Liu, S. Y., Yao, X. J., and Li, L.: The cause and potential hazard of glacial lake outburst flood occurred on July 5, 2013 in Jiali County, Tibet, J. Glaciol. Geocryol., 36, 158–165, https://doi.org/10.7522/j.issn.1000-0240.2014.0020, 2014.
Thompson, S., Benn, D. I., Mertes, J., and Luckman, A.: Stagnation and mass loss on a Himalayan debris-covered glacier: Processes, patterns and rates, J. Glaciol., 62, 467–485, https://doi.org/10.1017/jog.2016.37, 2016.
United States Geological Survey: https://earthexplorer.usgs.gov/, last access: 29 January 2023.
Veh, G., Korup, O., Specht, S. V., Roessner, S., and Walz, A.: Unchanged frequency of moraine-dammed glacial lake outburst floods in the Himalaya, Nat. Clim. Change., 9, 379–383, https://doi.org/10.1038/s41558-019-0437-5, 2019.
Vetsch, D., Siviglia, A., Bürgler, M., Caponi, F., Ehrbar, D., Facchini, M., Faeh, R., Farshi, D., Gerber, M., Gerke, E., Kammerer, S., Koch, A., Mueller, R., Peter, S., Rousselot, P., Vanzo, D., Veprek, R., Volz, C., Vonwiller, L., and Weberndorfer, M.: System manuals of BASEMENT, Version 2.8.2 Laboratory of Hydraulics, Glaciology and Hydrology (VAW), ETH Zurich, http://www.basement.ethz.ch, last access: 3 October 2022.
Vilímek, V., Emmer, A., Huggel, C., Schaub, Y., and Würmli, S.: Database of glacial lake outburst floods (GLOFs)-IPL project no. 179, Landslides, 11, 161–165, https://doi.org/10.1007/s10346-013-0448-7, 2013.
Wang, S. J., Che, Y. J., and Ma, X. G.: Integrated risk assessment of glacier lake outburst flood (GLOF) disaster over the Qinghai-Tibetan Plateau (QTP), Landslides, 17, 2849–2863, https://doi.org/10.1007/s10346-020-01443-1, 2020.
Wang, S. J., Yang, Y., Gong, W., Che, Y., Ma, X., and Xie, J.: Reason analysis of the Jiwenco glacial lake outburst flood (GLOF) and potential hazard on the Qinghai-Tibetan Plateau, Remote Sens.-Basel, 13, 3114, https://doi.org/10.3390/rs13163114, 2021.
Wang, W. C., Yang, X. X., and Yao, T. D.: Evaluation of ASTER GDEM and SRTM and their suitability in hydraulic modelling of a glacial lake outburst flood in southeast Tibet, Hydrol. Process., 26, 213–225, https://doi.org/10.1002/hyp.8127, 2011a.
Wang, W. C., Yao, T. D., Gao, Y., Yang, X. X., and Kattel, D. B.: A first-order method to identify potentially dangerous glacial lakes in a region of the southeastern Tibetan Plateau, Mt. Res. Dev., 31, 122–130, https://doi.org/10.1659/MRD-JOURNAL-D-10-00059.1, 2011b.
Wang, W. C., Yao, T. D., Yang, W., Joswiak, D., and Zhu, M. L.: Methods for assessing regional glacial lake variation and hazard in the southeastern Tibetan Plateau: a case study from the Boshula mountain range, China, Environ. Earth. Sci., 67, 1441–1450, https://doi.org/10.1007/s12665-012-1589-z, 2012.
Wang, W. C., Gao, Y., Anacona, P. I., Lei, Y. B., Xiang, Y., Zhang G. Q., Li, S. H., and Lu, A. X.: Integrated hazard assessment of Cirenmaco glacial lake in Zhangzangbo valley, Central Himalayas, Geomorphology, 306, 292–305, https://doi.org/10.1016/j.geomorph.2015.08.013, 2015.
Wang, X.: Methodology and application of moraine lake outburst hazard evaluation in the Chinese Himalayas, Science Press, Beijing, edited by: Zhou, W., ISBN 978-7-03-042004-6, 2016.
Wang, X., Liu, S., Ding, Y., Guo, W., Jiang, Z., Lin, J., and Han, Y.: An approach for estimating the breach probabilities of moraine-dammed lakes in the Chinese Himalayas using remote-sensing data, Nat. Hazards Earth Syst. Sci., 12, 3109–3122, https://doi.org/10.5194/nhess-12-3109-2012, 2012a.
Wang, X., Liu, S. Y., Guo, W. Q., Yao, X. J., Jiang, Z. L., and Han, Y. S.: Using remote sensing data to quantify changes in glacial lakes in the Chinese Himalaya, Mt. Res. Dev., 32, 203–212, https://doi.org/10.1659/MRD-JOURNAL-D-11-00044.1, 2012b.
Wang, X., Chai, K. G., Liu, S. Y., Wei, J. F., Jiang, Z. L., and Liu, Q. H.: Changes of glaciers and glacial lakes implying corridor-barrier effects and climate change in the Hengduan Shan, southeastern Tibetan Plateau, J. Glaciol., 63, 535–542, https://doi.org/10.1017/jog.2017.14, 2017.
Watson, C. S., Quincey, D. J., Carrivick, J. L., Smith, M. W., Rowan, A. V., and Richardson, R.: Heterogeneous water storage and thermal regime of supraglacial ponds on debris covered glaciers, Earth. Surf. Proc. Land., 43, 229–241, https://doi.org/10.1002/esp.4236, 2018.
Westoby, M. J., Glasser, N. F., Brasington, J., Hambrey, M. J., Quincey, D. J., and Reynolds, J. M.: Modelling outburst floods from moraine-dammed glacial lakes, Earth-Sci. Rev., 134, 137–159, https://doi.org/10.1016/j.earscirev.2014.03.009, 2014.
Wong, M. and Parker, G.: Reanalysis and correction of bed-load relation of meyer-peter and müller using their own database, J. Hydraul. Eng., 132, 1159–1168, https://doi.org/10.1111/j.1600-0587.1978.tb00950.x, 2006.
Worni, R., Huggel, C., and Stoffel, M.: Glacial lakes in the Indian Himalayas – from an area-wide glacial lake inventory to an on-site and modeling based risk assessment of critical glacial lakes, Sci. Total Environ., 468, S71–S84, https://doi.org/10.1016/j.scitotenv.2012.11.043, 2013.
Worni, R., Huggel, C., Clague, J. J., Schaub, Y., and Stoffel, M.: Coupling glacial lake impact, dam breach, and flood processes: A modeling perspective, Geomorphology, 224, 161–176, https://doi.org/10.1016/j.geomorph.2014.06.031, 2014.
Yamada, T.: Glacier lake and its outburst flood in the Nepal Himalaya, Data Center for Glacier Research, Japanese Society of Snow and Ice, 1, 96, 1998.
Yamada, T., Naito, N., Kohshima, S., Fushimi, H., Nakazawa, F., Segawa, T., Uetake, J., Suzuki, R., Sato, N., Karma, Chhetri, I. K., Gyenden, L., Yabuki, H., and Chikita, K.: Outline of 2002: research activity on glaciers and glacier lakes in Lunana region, Bhutan Himalayas, Bull. Glaciol. Res., 21, 79–90, 2004.
Yan, R. J., Pang, S., Sun, H. B., and Pang, Y. J.: Development and missions of unmanned surface vehicle, J. Mar. Sci. Appl., 9, 451–457, https://doi.org/10.1007/s11804-010-1033-2, 2010.
Yang, W., Yao, T. D., Xu, B. Q., Wu, G. J., Ma, L. L., and Xin, X. D.: Quick ice mass loss and abrupt retreat of the maritime glaciers in the Kangri Karpo Mountains, southeast Tibetan Plateau, Chin, Sci. Bull., 53, 2547–2551, https://doi.org/10.1007/s11434-008-0288-3, 2008.
Yao, X. J., Liu, S. Y., Sun, M. P., Wei, J. F., and Guo, W. Q.: Volume calculation and analysis of the changes in moraine-dammed lakes in the north Himalaya: a case study of Longbasaba lake, J. Glaciol., 58, 753–760, https://doi.org/10.3189/2012JoG11J048, 2012.
Yao, X. J., Liu, S. Y., Sun, M. P., and Zhang, X. J.: Study on the glacial lake outburst flood events in Tibet since the 20th century, J. Nat. Resour., 8, 1377–1390, https://doi.org/10.11849/zrzyxb.2014.08.010, 2014.
Yuan, G. and Zeng, Q.: Glacier-dammed Lake in Southeastern Tibetan Plateau during the Last Glacial Maximum, J. Geol. Soc. India., 79, 295–301, https://doi.org/10.1007/s12594-012-0041-z, 2012.
Zemp, M., Huss, M., Thibert, E., Eckert, N., McNabb, R., Huber, J., Barandun, M., Machguth, H., Nussbaumer, S. U., Gartner-Roer, I., Thomson, L., Paul, F., Maussion, F., Kutuzov, S., and Cogley, J. G.: Global glacier mass changes and their contributions to sea-level rise from 1961 to 2016, Nature, 568, 382–386, https://doi.org/10.1038/s41586-019-1071-0, 2019.
Zhang, B., Liu, G. X., Zhang, R., Fu, Y., and Li, Z. L.: Monitoring dynamic evolution of the glacial lakes by using time series of Sentinel-1A SAR images, Remote Sens.-Basel, 13, 1313, https://doi.org/10.3390/rs13071313, 2021.
Zhang, D. H., Zhou, G., Li, W., Han, L., Zhang, S., Yao, X. J., and Duan, H. Y.: A robust glacial lake outburst hazard assessment system validated by GLOF event in 2020 in the Nidu Zangbo Basin, Tibetan Plateau, Catena, 220, 106734, https://doi.org/10.2139/ssrn.3962879, 2023.
Zhang, M., Chen, F., Tian, B., Liang, D., and Yang, A.: High-frequency glacial lake mapping using time series of Sentinel-1A/1B SAR imagery: An assessment for southeastern Tibetan Plateau, Nat. Hazards Earth Syst. Sci. Discuss. [preprint], https://doi.org/10.5194/nhess-2019-219, 2019.
Zhang, Y., Yao, X. J., Duan, H. Y., and Wang, Q.: Simulation of glacial lake outburst flood in Southeastern Qinghai-Tibet plateau – a case study of Jiwen Co Glacial Lake, Front. Earth Sci., 10, 1–13, https://doi.org/10.3389/feart.2022.819526, 2022.
Zheng, G., Mergili, M., Emmer, A., Allen, S., Bao, A., Guo, H., and Stoffel, M.: The 2020 glacial lake outburst flood at Jinwuco, Tibet: causes, impacts, and implications for hazard and risk assessment, The Cryosphere, 15, 3159–3180, https://doi.org/10.5194/tc-15-3159-2021, 2021.
Zhou, G. G. D., Zhou, M. J., Shrestha, M. S., Song, D. R., Choi, C. E., Cui, K. F. E., Peng, M., Shi, Z. M., Zhu, X. H., and Chen, H. Y.: Experimental investigation on the longitudinal evolution of landslide dam breaching and outburst floods, Geomorphology, 334, 29–43, https://doi.org/10.1016/j.geomorph.2019.02.035, 2019.
Zhou, L. X., Liu, J. K., and Li, Y. L.: Calculation method of mathematical model of the moraine dammed lake storage capacity, Sci. Technol. Eng., 20, 9804–9809, 2020.