the Creative Commons Attribution 4.0 License.
the Creative Commons Attribution 4.0 License.
 | 24 Nov 2023
Antarctic permafrost processes and antiphase dynamics of cold-based glaciers in the McMurdo Dry Valleys inferred from 10Be and 26Al cosmogenic nuclides
Jacob T. H. Anderson
Toshiyuki Fujioka
David Fink
Alan J. Hidy
Gary S. Wilson
Klaus Wilcken
Andrey Abramov
Nikita Demidov
Soil and sediment mixing and associated permafrost processes are not widely studied or understood in the McMurdo Dry Valleys of Antarctica. In this study, we investigate the stability and depositional history of near-surface permafrost sediments to ∼ 3 m depth in the Pearse and lower Wright valleys using measured cosmogenic 10Be and 26Al depth profiles. In Pearse Valley, we estimate a minimum depositional age of ∼ 74 ka for the active layer and paleoactive-layer sediments (< 0.65 m). Combined depth profile modelling of 10Be and 26Al gives a depositional age for near-surface (< 1.65 m) permafrost in Pearse Valley of 180 ka, implying that the deposition of permafrost sediments predates MIS 5 advances of Taylor Glacier. Deeper permafrost sediments (> 2.09 m) in Pearse Valley are thus inferred to have a depositional age of > 180 ka. At a coastal, lower-elevation site in neighbouring lower Wright Valley, 10Be and 26Al depth profiles from a second permafrost core exhibit near-constant concentrations with depth and indicate the sediments are either vertically mixed after deposition or sufficiently young so that post-depositional nuclide production is negligible relative to inheritance. concentration ratios for both depth profiles range between 4.0 and 5.2 and are all lower than the nominal surface production rate ratio of 6.75, indicating that prior to deposition, these sediments experienced complex, yet similar, exposure–burial histories. Assuming a single-cycle exposure–burial scenario, the observed ratios are equivalent to a total minimum exposure–burial history of ∼ 1.2 Myr.
In proximity to the depth profile core site, we measured cosmogenic 10Be and 26Al in three granite cobbles from thin, patchy drift (Taylor 2 Drift) in Pearse Valley to constrain the timing of retreat of Taylor Glacier. Assuming simple continuous exposure, our minimum, zero-erosion exposure ages suggest Taylor Glacier partially retreated from Pearse Valley no later than 65–74 ka. The timing of retreat after 65 ka and until the Last Glacial Maximum (LGM) when Taylor Glacier was at a minimum position remains unresolved. The surface cobble ages and permafrost processes reveal Taylor Glacier advances during MIS 5 were non-erosive or mildly erosive, preserving the underlying permafrost sediments and peppering boulders and cobbles upon an older, relict surface. Our results are consistent with ages from central Taylor Valley and suggest changes in moisture delivery over Taylor Dome during MIS 5e, 5c, and 5a appear to be associated with the extent of the Ross Ice Shelf and sea ice in the Ross Sea. These data provide further evidence of antiphase behaviour through retreat of a peripheral lobe of Taylor Glacier in Pearse Valley, a region that was glaciated during MIS 5. We suggest a causal relationship of cold-based glacier advance and retreat that is controlled by an increase in moisture availability during retreat of sea ice and perhaps the Ross Ice Shelf, as well as, conversely, a decrease during times of sea ice and Ross Ice Shelf expansion in the Ross Sea.
- Article
(10768 KB) - Full-text XML
-
Supplement
(709 KB) - BibTeX
- EndNote


Permafrost (perennially frozen ground) in the McMurdo Dry Valleys, Antarctica, contains valuable records of paleoenvironmental information, yet the stability of permafrost sediments and the processes that influence sediment transport, erosion, and deposition in the McMurdo Dry Valleys are not well understood. Previous studies investigating the chronology and stability of glacial drift deposits, sediments, and permafrost in the McMurdo Dry Valleys and Transantarctic Mountains typically focused on high-elevation sites (e.g. Bergelin et al., 2022; Bibby et al., 2016; Morgan et al., 2011, 2010; Ng et al., 2005; Schäfer et al., 2000; Sugden et al., 1995). The objective of these studies has largely been to constrain the ages and/or erosion and sublimation rates of early Pleistocene, Pliocene, and Miocene landscapes. There only appears to be one study investigating the age and stability of permafrost below 1000 m elevation (Morgan et al., 2010). Yet, understanding the depositional environment and stability of permafrost at low elevations is important for interpreting landscape evolution, geomorphic processes, and polar climate change on Earth, as well as being a terrestrial analogue for Mars (e.g. Marchant and Head, 2007). Studies have also revealed that permafrost contains frozen reservoirs of ice, greenhouse gases, ancient bacteria, and viruses (Adriaenssens et al., 2017; Gilichinsky et al., 2007; Ruggiero et al., 2023). Future thawing of low-elevation environments, from increasing atmospheric temperatures, could increase microbial activity and release previously frozen gases and nutrients, leading to unprecedented changes in hydrological and biogeochemical cycles.
Permafrost usually contains an active, cryoturbated, mobile sediment layer up to ∼ 70 cm in depth. Active layer thickness, thawing, and permeability are modulated by seasonal variations. Permafrost sediments are episodically covered by advancing and retreating ice (Atkins, 2013), which can further complicate the interpretation of permafrost stability, sediment transport, and mixing. In the McMurdo Dry Valleys, there is currently no clear trend of increase or decrease in active layer thickness between 2006 and 2019 (Hrbáèek et al., 2023). The lack of understanding permafrost dynamics limits our ability to reconstruct permafrost stability or evolution through time. Further research is needed to explore the rates and mechanisms by which sediments are transported and mixed via aeolian, fluvial, and periglacial processes.
Key components influencing permafrost processes and overlying geomorphic landforms are the climatic conditions and extent of the Antarctic ice sheets. During Plio-Pleistocene warm intervals, the West Antarctic Ice Sheet (WAIS) and marine-based sectors of the East Antarctic Ice Sheet (EAIS) underwent extensive retreat (Naish et al., 2009; Pollard and DeConto, 2009; Cook et al., 2013; Blackburn et al., 2020; Patterson et al., 2014). Warmer-than-present global temperatures and higher-than-present sea levels are also observed in recent prominent interglacial periods, i.e. MIS 31 (∼ 1.07 Ma), MIS 11 (∼ 400 ka), and MIS 5e (130–115 ka) (Dutton et al., 2015; Naish et al., 2009; Pollard and DeConto, 2009). The extent of ice sheet retreat during these recent warm intervals varied significantly within different drainage basins and through time. During the penultimate interglacial (MIS 5e), the average global temperature was ∼ 1–2 ∘C warmer than the pre-industrial period (Fischer et al., 2018; Otto-Bliesner et al., 2013), Antarctic temperatures were ∼ 3–5 ∘C warmer (Jouzel et al., 2007), and global mean sea levels were ∼ 6–9 m higher than at present (Dutton and Lambeck, 2012; Kopp et al., 2009). With a global average temperature currently ∼ 1.1 ∘C warmer than pre-industrial levels and predicted to be ≥ 1.5 ∘C in the coming decades (IPCC, 2021), interglacial conditions, such as during MIS 5, are an important analogue for evaluating future ice sheet behaviour and global climate processes under future warming scenarios.
Simulated ice sheet retreat during MIS 5e by Golledge et al. (2021) suggested ice loss in the Thwaites and Pine Island sectors of the WAIS, whereas the Ross Ice Shelf remained intact. Conversely, simulations by DeConto and Pollard (2016) and Turney et al. (2020) suggested a retreat of the Ross Ice Shelf, followed by a retreat of the WAIS interior. The δ18O ice core records from Talos Dome reveal the EAIS was relatively intact during MIS 5 (Sutter et al., 2020), and recent studies suggest partial ice sheet lowering in Wilkes Subglacial Basin but no grounding line retreat (Fig. 1; Golledge et al., 2021; Sutter et al., 2020; Wilson et al., 2018). Ice core studies reveal increased accumulation rates at Taylor Dome (Steig et al., 2000) and the Allan Hills blue ice area (Yan et al., 2021) near the onset of the Last Interglacial. Yan et al. (2021) hypothesised that high accumulation rates during warm interglacials may reflect open-ocean conditions in the Ross Sea, caused by reduced sea ice extent and possibly retreat of the Ross Ice Shelf relative to its present-day position. This hypothesis is supported by a depleted δ18O value (−0.175 ‰) from ice core records at Roosevelt Island, indicating high sea level and reduced ice sheets during MIS 5a (Lee et al., 2020).
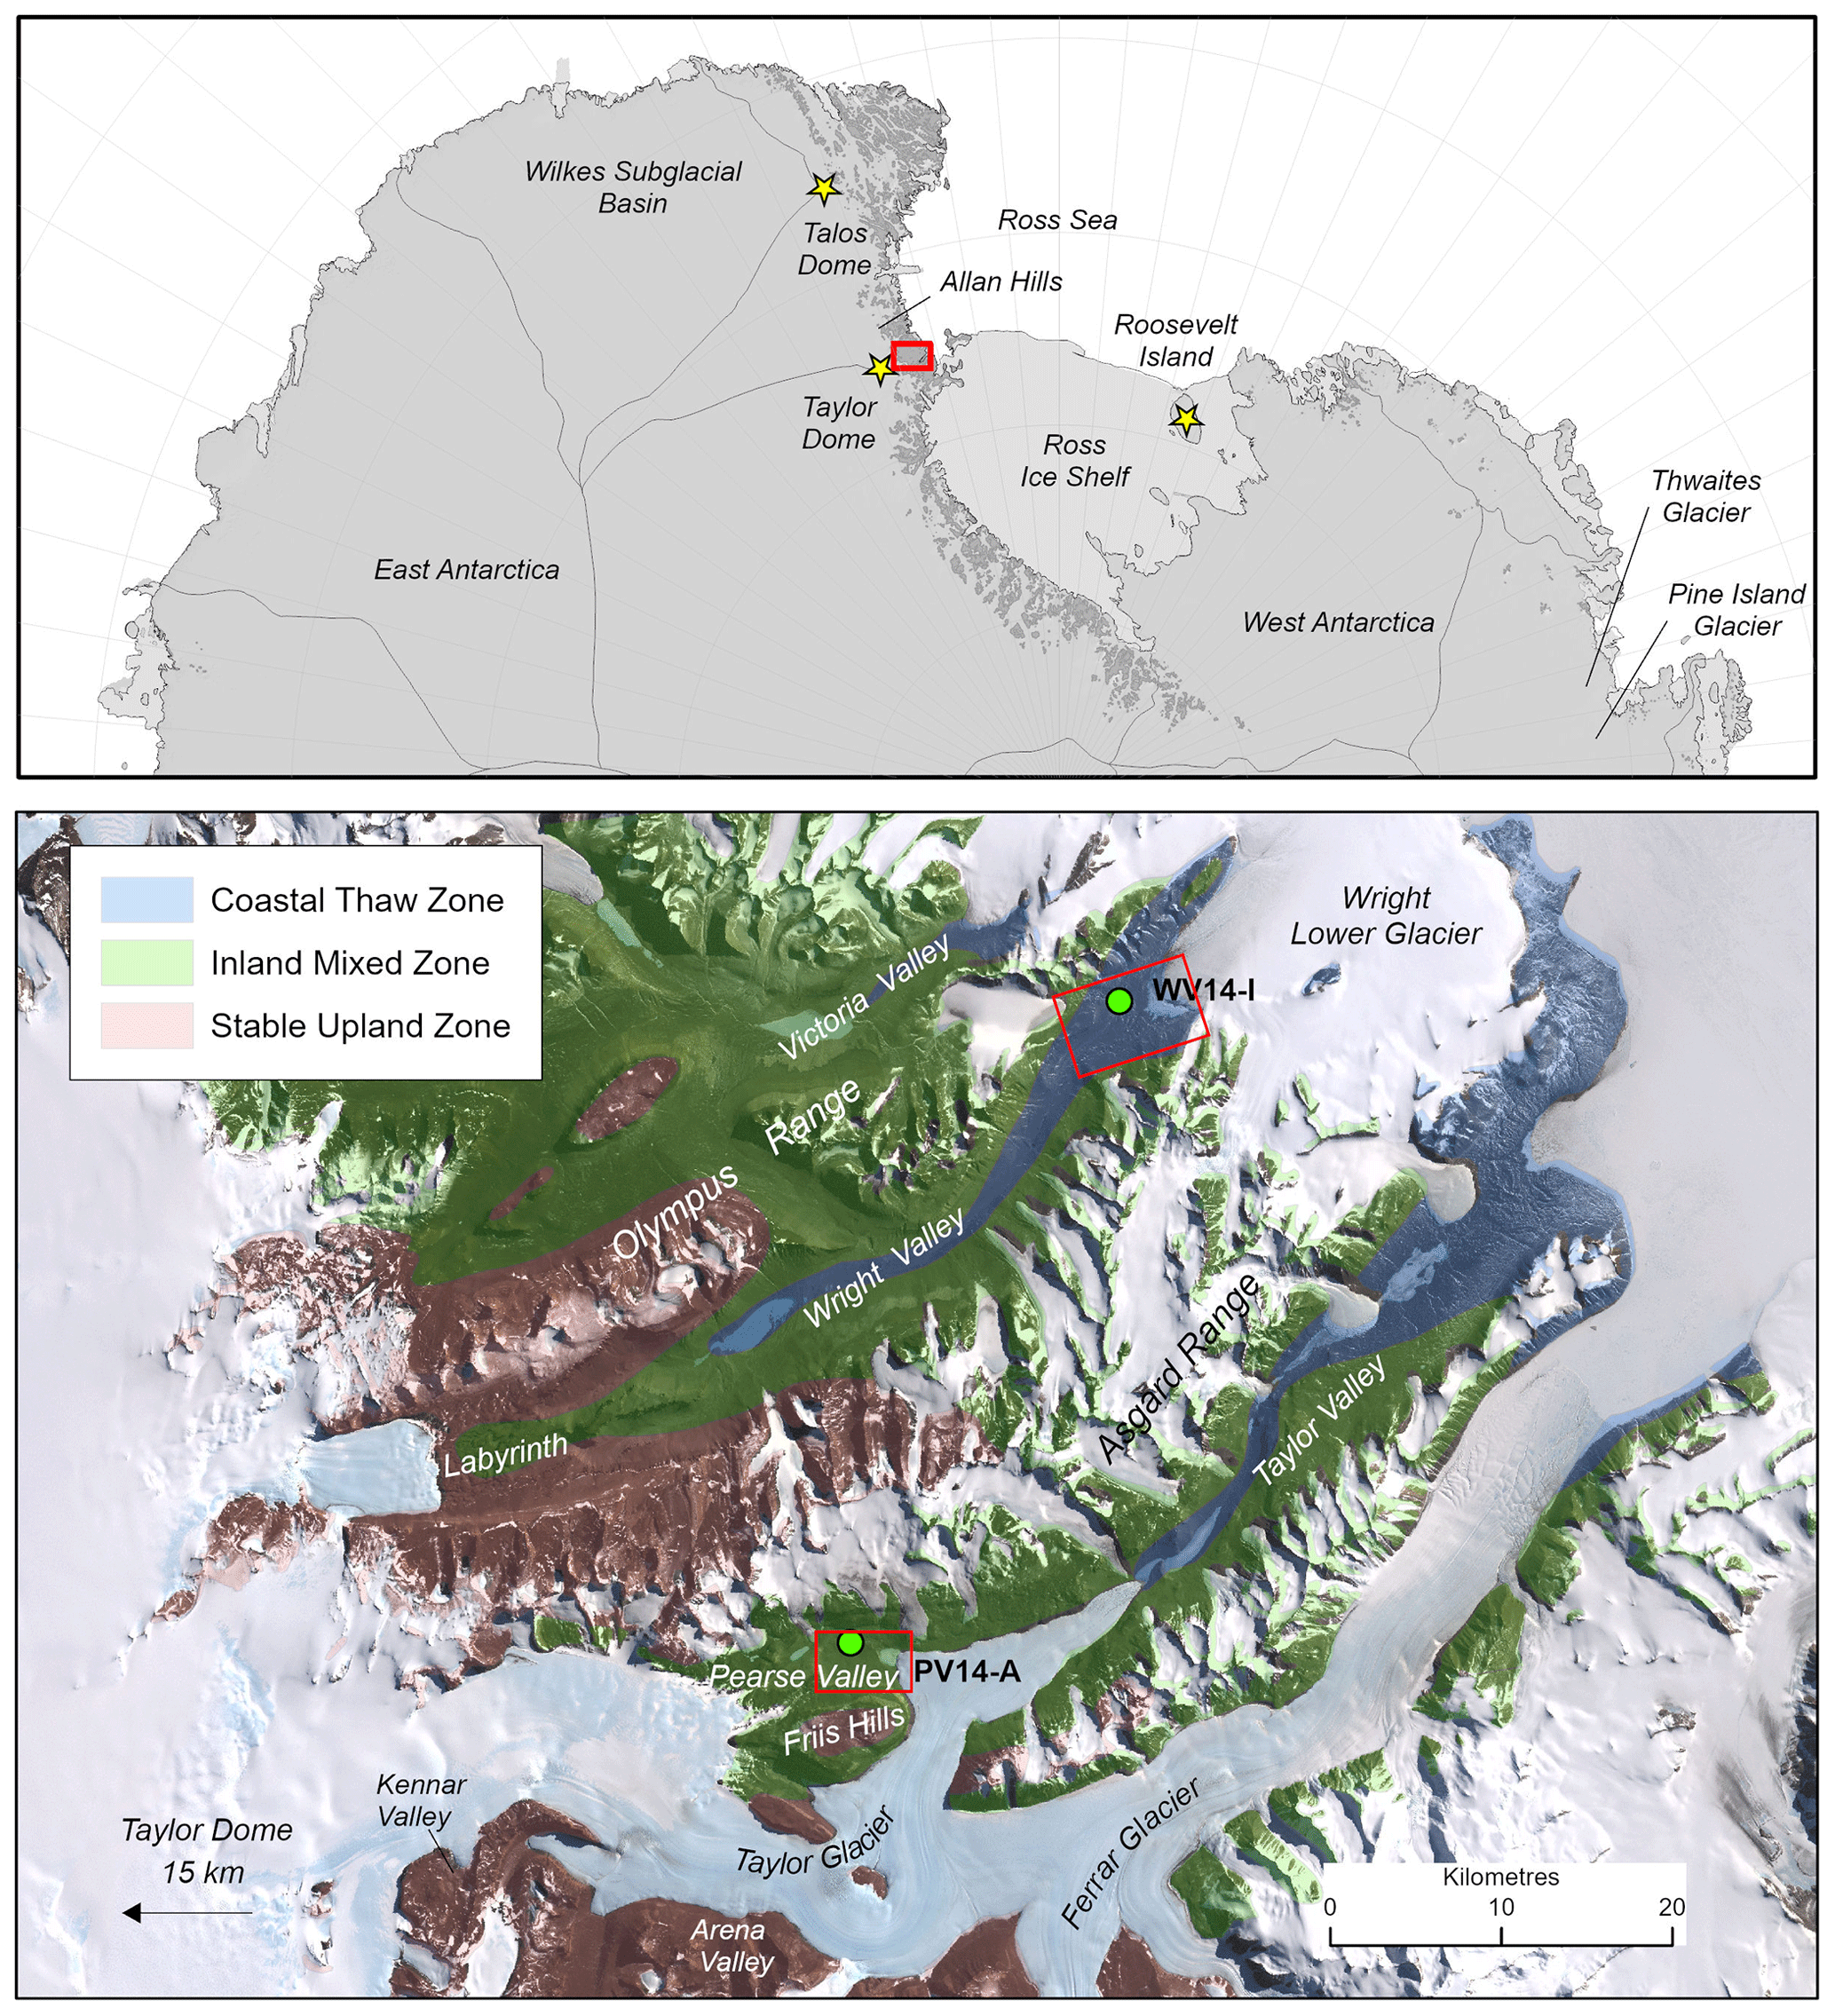
Figure 1Study area and location of the McMurdo Dry Valleys. Yellow stars show ice core sites discussed in the text. The green circles show the locations of the Pearse Valley and lower Wright Valley sites where permafrost cores were recovered. The three microclimatic zones are the stable upland zone (brown), inland mixed zone (green), and coastal thaw zone (blue). Modified from Marchant and Head (2007) and Salvatore and Levy (2021). Red rectangles in the lower diagram show the locations of Pearse Valley in Fig. 2 and lower Wright Valley in Fig. 3.
In contrast, terrestrial evidence from the McMurdo Dry Valleys suggests Taylor and Ferrar glaciers were larger than at present during warm interglacials of the mid-Pliocene climatic optimum (3.0–3.1 Ma), MIS 31 (1.07 Ma) (Swanger et al., 2011), and MIS 5 (Brook et al., 1993; Higgins et al., 2000a). These glacier advances appear to be out of phase with WAIS retreat and ocean warming during interglacial periods. Alpine glaciers in the McMurdo Dry Valleys also appear out of phase with marine-based ice sheet retreat, advancing during MIS 11 (Swanger et al., 2017), MIS 5 (Swanger et al., 2019) and MIS 3 (Joy et al., 2017). The past ice volume and extent of Taylor Glacier (during interglacial periods) have been derived from cosmogenic nuclide studies and mapping drift and moraine deposits in lower Kennar Valley (Swanger et al., 2011) and lower Arena Valley (Brook et al., 1993; Marchant et al., 1994), as well as dating in central Taylor Valley (Higgins et al., 2000a). MIS-5-aged glacial deposits in central Taylor Valley and Arena Valley are mapped as Taylor 2 Drift (Bockheim et al., 2008; Brook et al., 1993; Cox et al., 2012; Denton et al., 1970), termed Bonney Drift by Higgins et al. (2000b). By inference, glacial deposits on the valley floor of Pearse Valley are mapped as Taylor 2 Drift (Bockheim et al., 2008; Cox et al., 2012; Denton et al., 1970). ages of algal carbonates in central Taylor Valley suggest multiple advance–retreat cycles of the Taylor Glacier snout during MIS 5, with retreat of Taylor Glacier continuing after the MIS 5–4 transition (Higgins et al., 2000a). The δ18O values measured from buried ice in northern Pearse Valley also support the advance of Taylor Glacier during MIS 5 (Swanger et al., 2019). However, the timing of advance and retreat of Taylor Glacier in central Taylor Valley and in Pearse Valley remains poorly constrained.
In this study, we investigate the stability and depositional history of near-surface permafrost sediments using paired 10Be and 26Al depth profiles of permafrost from the Pearse and lower Wright valleys. We compare the exposure–burial history of the permafrost cores from the two sites and the long-term recycling processes of McMurdo Dry Valleys sediments. We also investigate the relationship between thin, patchy drift overlying permafrost sediments in Pearse Valley. Thin, patchy drift is the only evidence of cold-based glacial overriding and is defined as a scattering of clasts overlying older, undisturbed desert pavements (Atkins, 2013). We present cosmogenic nuclide surface exposure ages from three cobbles in Pearse Valley to determine the age of Taylor 2 Drift and provide constraints on the timing of retreat of a peripheral lobe of Taylor Glacier during MIS 5. Combining permafrost depth profiles and exposure ages of cobbles from the drift, we infer the depositional history of the permafrost sediments and constrain a minimum age of Taylor Glacier retreat. These data from Pearse Valley provide insight into Taylor Glacier behaviour and associated geomorphic processes during MIS 5.
The McMurdo Dry Valleys are a hyperarid, cold polar desert and can be subdivided into three geographic zones (stable upland, inland mixed, and coastal thaw), which are defined by their microclimatic parameters of atmospheric temperature, soil moisture, and relative humidity (Fig. 1; Marchant and Denton, 1996; Marchant and Head, 2007). The stability and evolution of geomorphic features and permafrost are controlled by subtle variations within each microclimatic zone. The active layer in permafrost is defined as soil horizons where the ground temperature fluctuates above and below 0 ∘C seasonally (Davis, 2001; Yershov, 1998). Antarctic permafrost soils along the floors and flanks of ice-free valleys are vertically mixed, initially through the deposition of reworked sediments and secondarily through active layer cryoturbation up to 70 cm depth of the surface (Bockheim et al., 2007, 2008). Cryoturbation is defined as soil movement due to repeated freeze–thaw, generally within the active layer of permafrost (French, 2017). Active layers can be distinguished by the presence (wet active layer) or absence (dry active layer) of water. Soils in the coastal thaw zone are seasonally moist and comprise wet active layers, whereas soils in the inland mixed zone are dry and comprise dry active layers (Marchant and Head, 2007). Our study sites focused on two different microclimatic zones (Fig. 1): Pearse Valley in the inland mixed zone and lower Wright Valley in the coastal thaw zone, which differ in age, elevation, and distance from the coast.
2.1 Pearse Valley
Pearse Valley is an ice-free valley that is bounded by the Friis Hills in the south and the Asgard Range in the north and opens onto peripheral lobes of Taylor Glacier in the east and west (Fig. 1). Taylor Glacier flows east from Taylor Dome of the EAIS, terminating in Taylor Valley. At the eastern end of Pearse Valley, a lobe of Taylor Glacier terminates into Lake Joyce, a closed-basin proglacial lake (Fig. 2). Taylor Glacier and local alpine glaciers have advanced in the present interglacial and have occupied their maximum position since the Last Glacial Maximum (LGM) (Higgins et al., 2000a). At the head of Pearse Valley, glacially incised bedrock sits at a similar elevation to the Labyrinth platform in upper Wright Valley, likely formed by a network of subglacial drainage channels under wet-based glacial conditions during the Miocene Climate Transition (Fig. 1; Lewis and Ashworth, 2016; Chorley et al., 2023). The northern valley wall comprises gelifluction lobes, buried snowpack deposits, meltwater channels derived from ephemeral streams, and fans fed by the meltwater channels in front of the lobes (Heldmann et al., 2012; Swanger et al., 2019). The valley floor consists of a lower-elevation area on the southern side and a higher-elevation area on the northern side of the valley. The PV14-A core and cobble samples are located on the central northern side of the valley floor (Fig. 2).
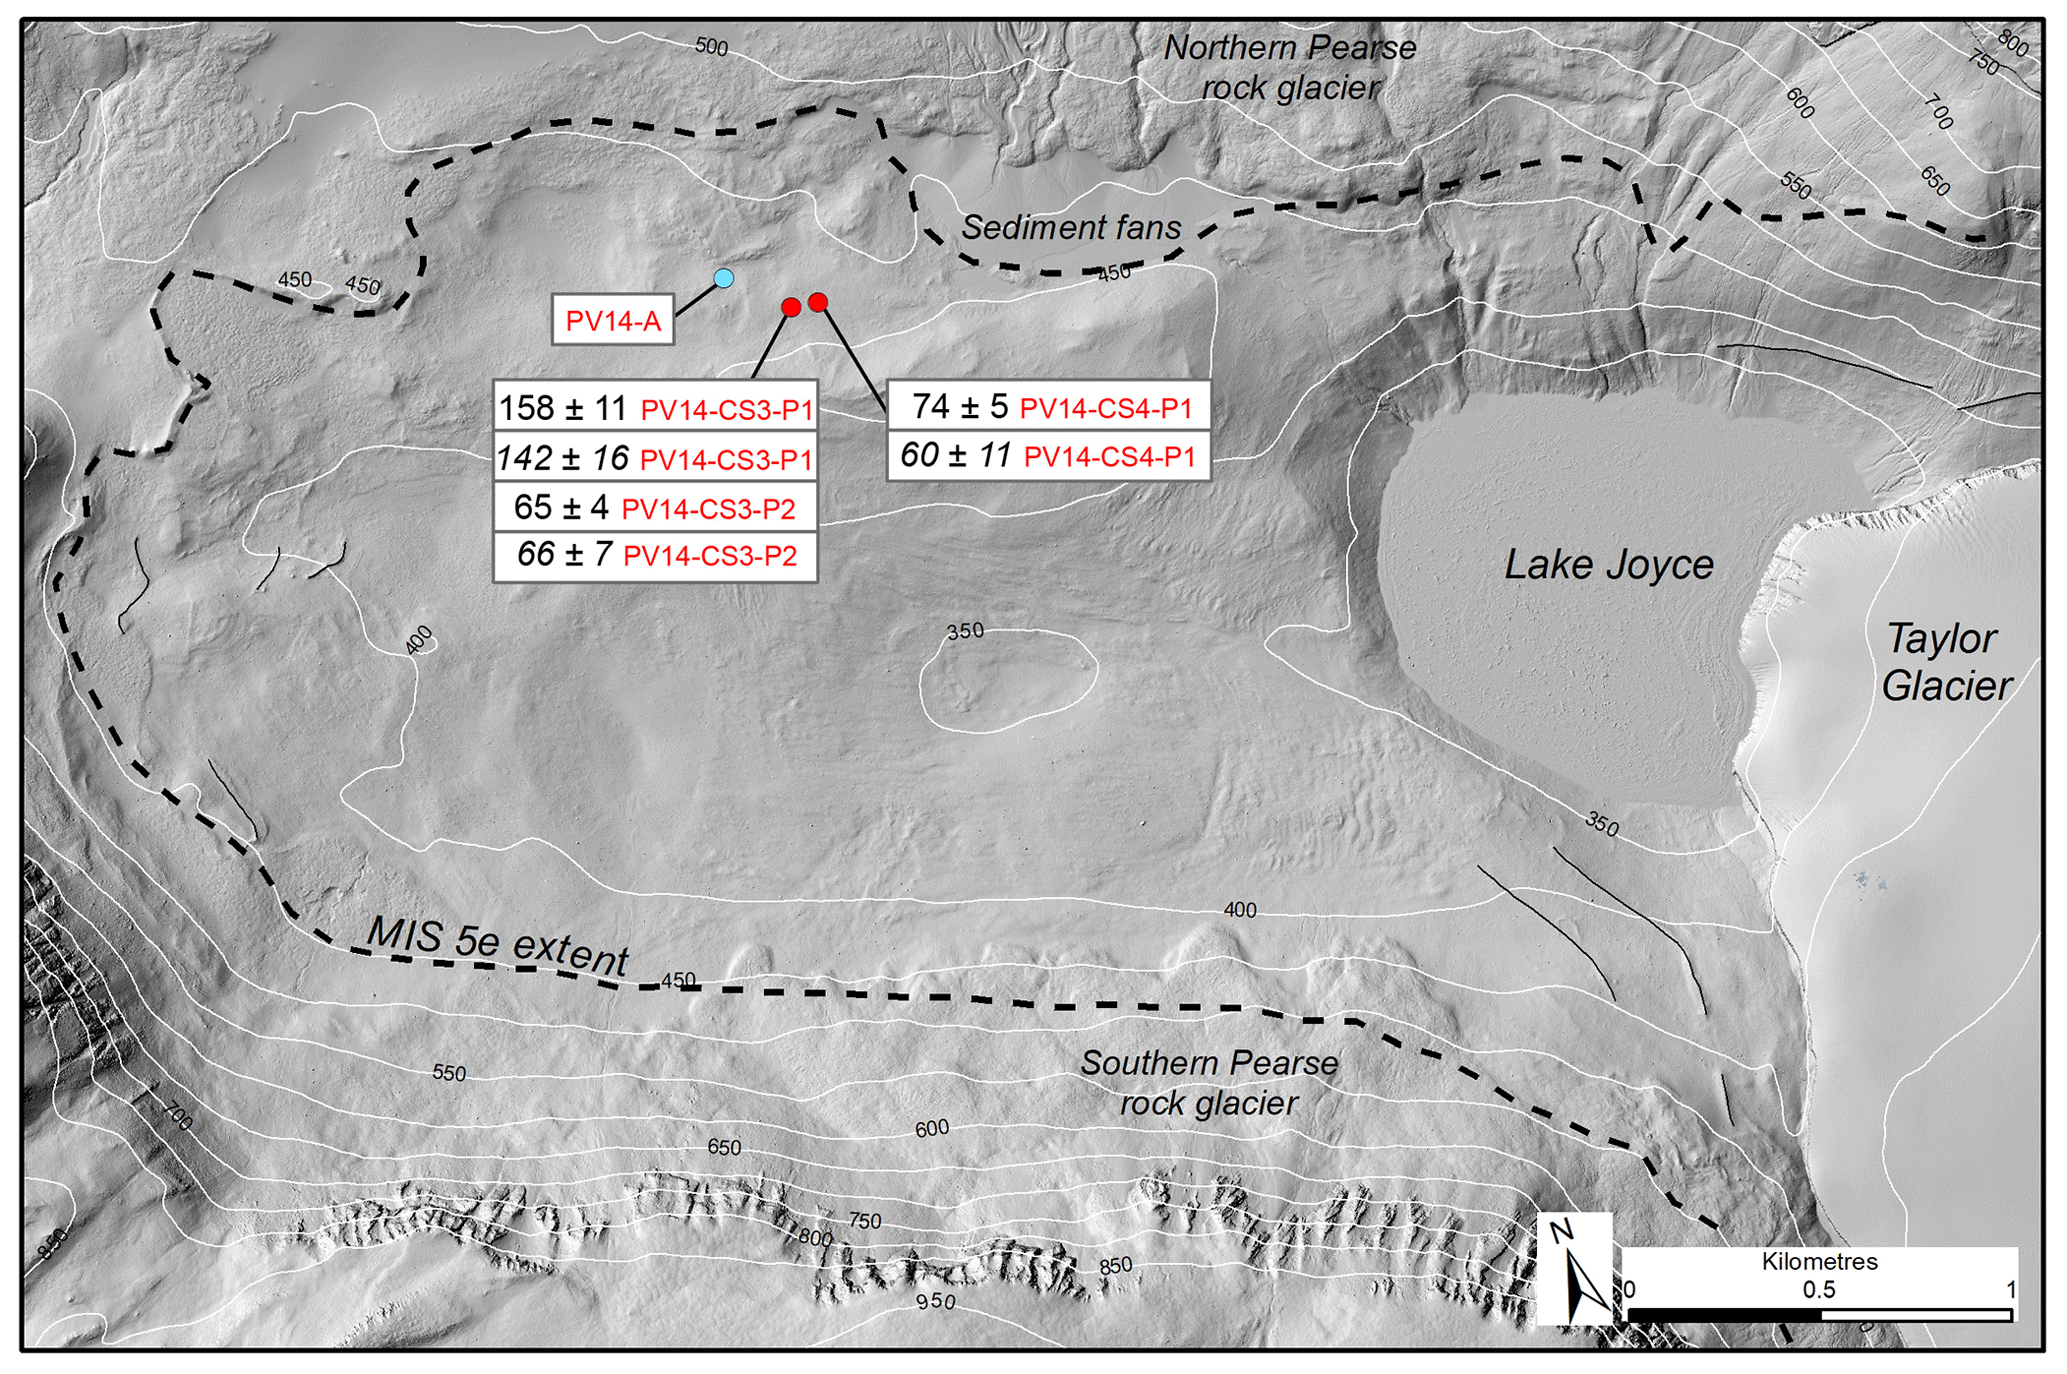
Figure 2Map of Pearse Valley with MIS 5e extent of Taylor Glacier (dashed black line; Cox et al., 2012), sample locations, and PV14-A permafrost drill site (blue circle). Thin black lines trace undated moraines. PV14-A drill site and measured 10Be and 26Al (italics) ages of cobbles residing on boulders are shown in kiloyears with 1σ uncertainties (red circles). Lidar image from Fountain et al. (2017).
The local bedrock comprises basement granites and Ferrar dolerite intrusives (Cox et al., 2012; Gunn and Warren, 1962). Glacial deposits on the valley floor are mapped as Taylor 2 Drift (Bockheim et al., 2008; Denton et al., 1970). These sediments were inferred as waterlain and melt-out tills following the penultimate down-valley advance of the Taylor Glacier during MIS 5 (70–130 ka) (Cox et al., 2012; Higgins et al., 2000a; Swanger et al., 2019). The valley floor landscape is characterised by hummocky moraines with a combination of glacigenic and fluvial deposits and aeolian sediments. Variably weathered granite boulders (up to 3 m in diameter) form a lag deposit on the drift surface, inferred as a till deflation or a separate younger depositional unit (Higgins et al., 2000b). The northern and southern Pearse Valley walls comprise extensive rock glaciers (Swanger et al., 2019).
Modern climate
Pearse Valley is situated in the inland mixed zone of the McMurdo Dry Valleys (Marchant and Denton, 1996). The valley has a mean annual temperature of −18 ∘C (Marchant et al., 2013) and precipitation rates of 20–50 mm yr−1 (water equivalent) and 100–200 mm yr−1 in the adjacent Asgard Range, the source region for the local alpine glaciers (Fountain et al., 2010). Mean summer air temperatures (December through February) in Pearse Valley are −2 to −7 ∘C (Marchant et al., 2013). Ground surface temperatures measured at the Pearse Valley meteorological station between 27–28 November 2009 recorded a peak temperature of 10 ∘C due to solar heating (Heldmann et al., 2012). Winds in Pearse Valley are strong enough to mobilise sand grains and form aeolian surface features such as sand dunes (Heldmann et al., 2012).
2.2 Lower Wright Valley
Lower Wright Valley is ice-free and is bounded by the Asgard Range in the south and the Olympus Range in the north (Fig. 1). The mouth of the valley at the eastern end is cut off from the Ross Sea by the Wright Lower Glacier, a lobe of the Wilson Piedmont Glacier. Lake Brownworth, a proglacial lake fed by the Wright Lower Glacier, supplies the westward-flowing Onyx River. The WV14-I core is located on the northern side of lower Wright Valley (Fig. 3). Radiocarbon dates of lacustrine algae from glaciolacustrine deposits suggest Lake Brownworth is a small remnant of a much larger lake that existed during the LGM and early Holocene (Hall et al., 2001). The post-glacial, Holocene-aged landscapes form hummocky moraines, with a combination of deltas, shorelines, and glaciolacustrine sediments (Hall et al., 2001). Glacial meltwater streams drain into Lake Brownworth and the Onyx River from the north and south valley walls. The local bedrock comprises basement metasediments and granites, as well as Ferrar dolerite intrusives (Cox et al., 2012). Metasediments, granite, dolerite, and occasional basalt sediments in lower Wright Valley have accumulated since the last deglaciation by lacustrine, fluvial, and aeolian processes (Hall et al., 2001; Hall and Denton, 2005).
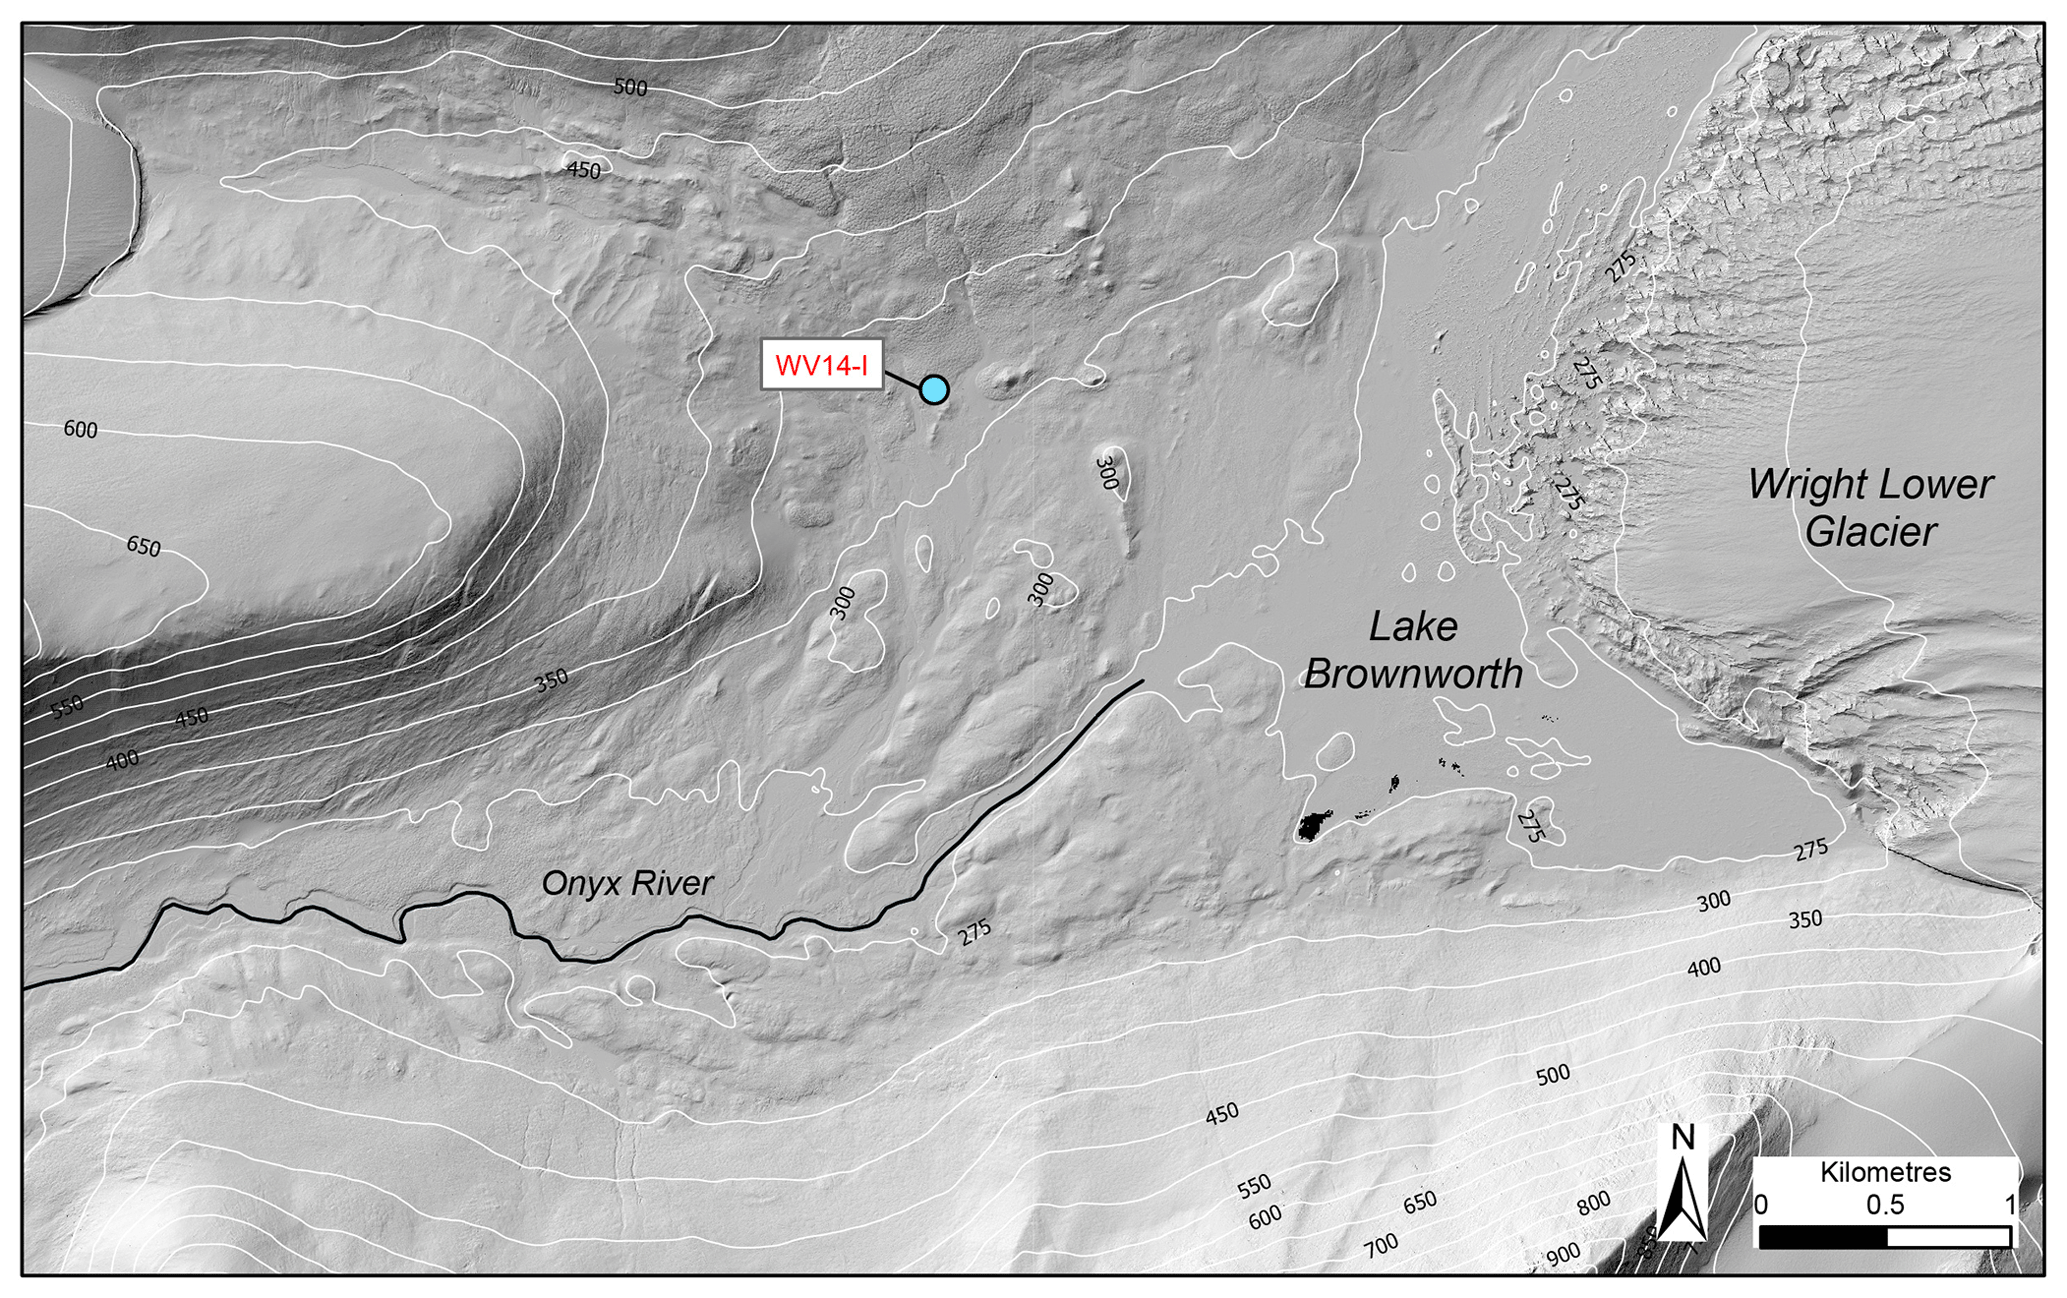
Figure 3Map of lower Wright Valley and WV14-I permafrost drill site (blue circle). Lidar image from Fountain et al. (2017).
Modern climate
Lower Wright Valley is situated in the coastal thaw zone of the McMurdo Dry Valleys (Marchant and Denton, 1996) and has a mean annual temperature of −21 ∘C (Doran et al., 2002) and precipitation rates of 26–51 mm yr−1 (water equivalent) (Fountain et al., 2010). Mean summer air temperatures (December through February) in lower Wright Valley are −5 to −7 ∘C and can exceed 0 ∘C for > 6 d yr−1 (Doran et al., 2002). Meltwater forms during summer months (December and January) when temperatures can rise to as high as 10 ∘C at some locations (Hall et al., 2001).
3.1 Permafrost core locations and characteristics
During the 2014/15 austral field season, permafrost cores were recovered from Pearse Valley and lower Wright Valley using a gasoline-powered dry drilling technique (Fig. 1). These two cores were sampled for sedimentological and cosmogenic nuclide analysis. After extraction, the core sections were divided into ∼ 10 cm portions for sub-sampling and analysis. The upper sections were collected in Whirl-Pak bags as the core recovery was poor. Core integrity below the active layer in ice-cemented permafrost sediments was good, and cores were collected as rigid intact sections in PVC core liners.
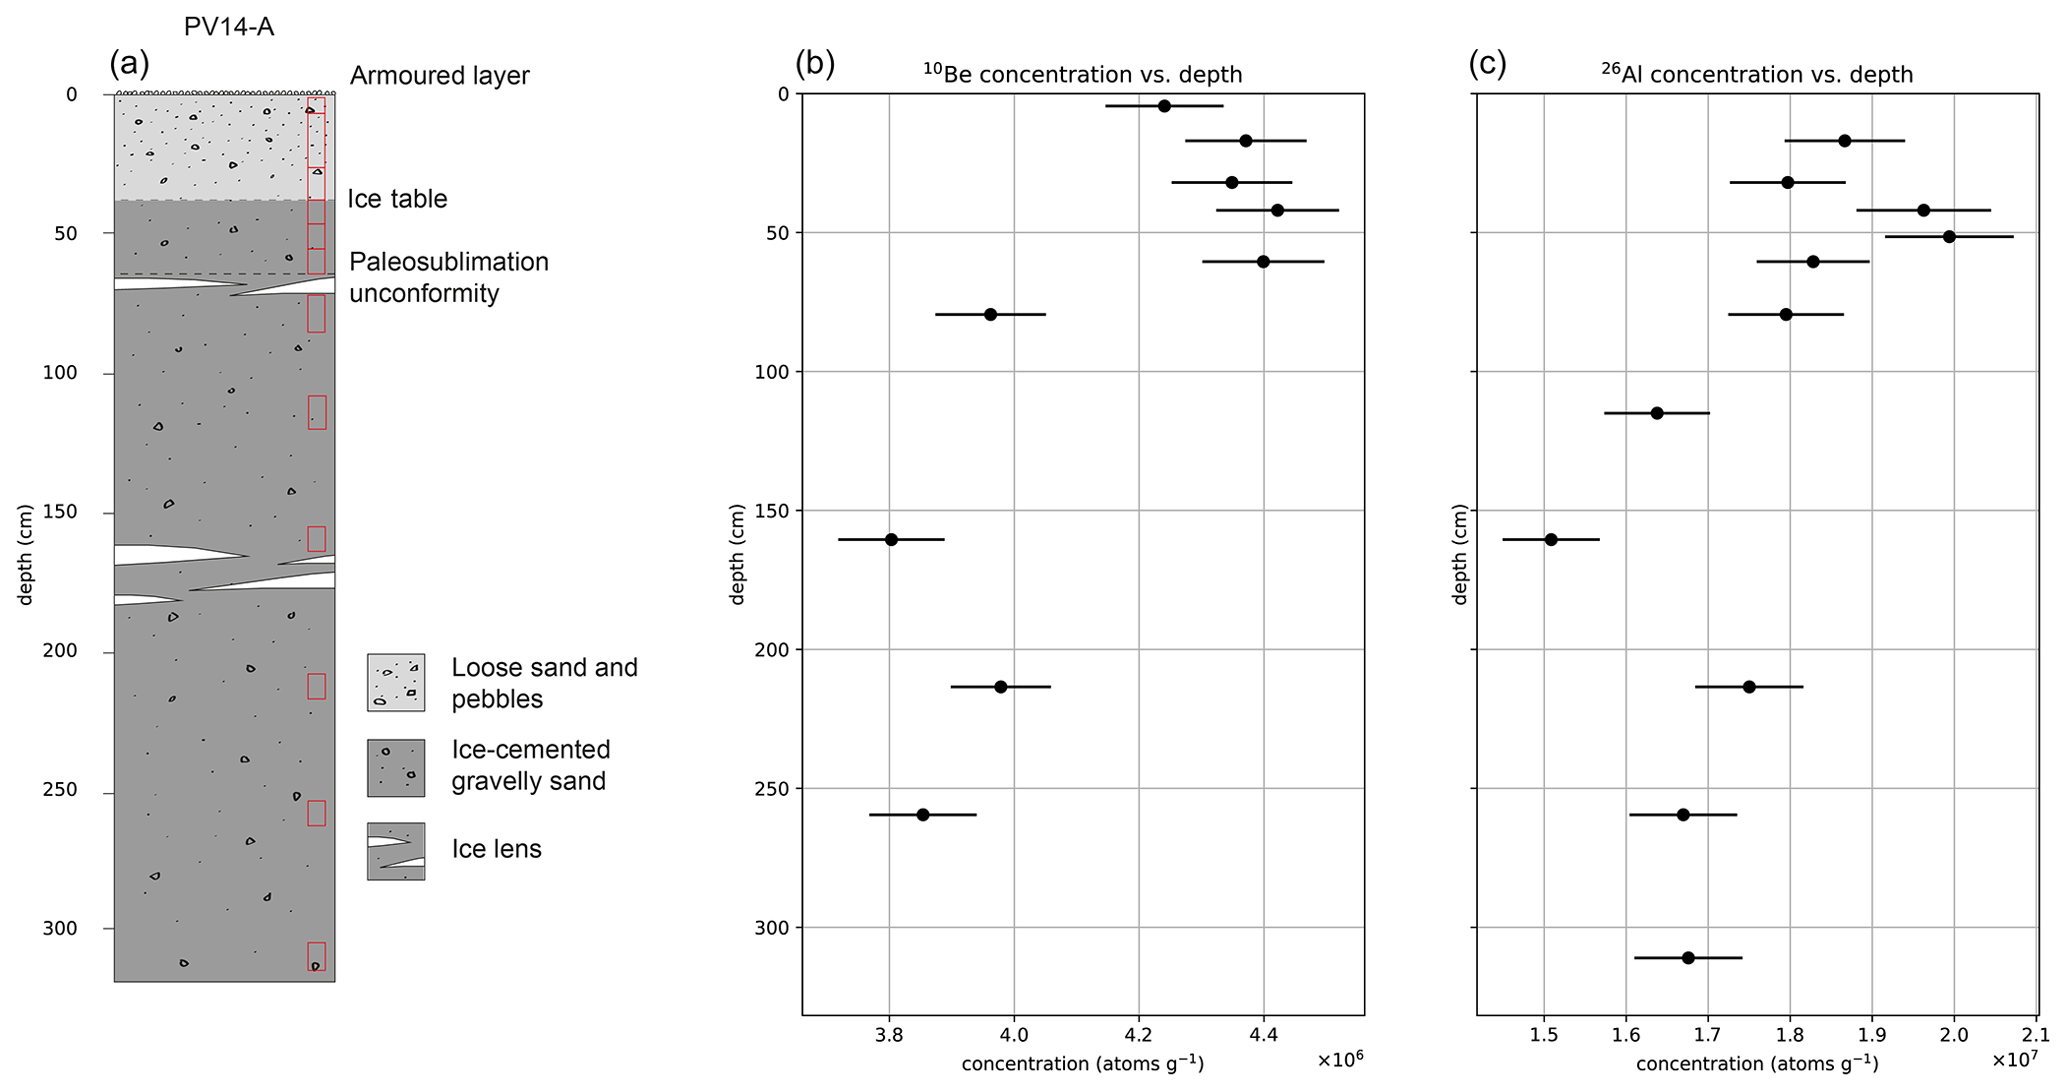
Figure 4Pearse Valley (PV14-A) permafrost core sedimentology (a). Locations of cosmogenic nuclide samples shown in red boxes. The modern active layer is from 0–0.37 m depth. Pearse Valley (PV14-A) permafrost core depth profiles with measured 10Be and 26Al concentrations (black data points) with 1σ uncertainties (b, c). For all samples between 0.02–0.65 m depth, we used the average concentration of all five 10Be and 26Al measurements to represent the effect of cryoturbation of sediments in the active and paleoactive layer (see text). Note the rise in 10Be and 26Al concentrations below 2.09 m.
3.1.1 Pearse Valley borehole core
The PV14-A core is located on an elevated bench that extends along the northern side of the valley floor at 450 m a.s.l. (above sea level; 77.7062∘ S, 161.5467∘ E), ∼ 3 km north-west of the present position of the Taylor Glacier lobe (Fig. 2). The core was recovered to a depth of 3.16 m (Fig. 4). The active layer (0–0.37 m) above the ice-cemented permafrost consists of a thin armoured surface layer of desert pavement (∼ 0.02 m thick) and a layer of loose, dry sand (∼ 0.35 m thick). Recovered sediments from beneath the armoured desert pavement comprise a dry active layer of loose sand and pebbles down to 0.37 m depth. Below 0.37 m depth, the recovered sediments comprise ice-cemented permafrost, with grains of sand and pebbles forming the matrix and the pore spaces filled with ice. The 10Be and 26Al depth profiles (Fig. 4) start below the 0.02 m thick armoured surface pavement. The first three samples were collected from the dry active layer followed by nine from the ice-cemented permafrost. Sediments within the permafrost core comprise gravelly sands derived from weathered Beacon Supergroup, granite, granodiorite, diorite, and dolerite origins. They appear structureless or weakly bedded, which we interpret to be fluvio-glacial and aeolian deposits. Between 0.73–0.86 m depth, the core comprises several ice lenses indicative of ice accumulation below a paleosublimation unconformity. Several small ice lenses were also recovered between 1.57–1.87 m depth. The ice lenses are typically clean ice or debris-poor ice compared to adjacent upper and lower segments. Only two of the three active layer samples and six of the nine permafrost core samples were successful in providing paired 10Be and 26Al concentrations (Fig. 4; Table 1).
Table 1Depth profile data from Pearse Valley and lower Wright Valley.
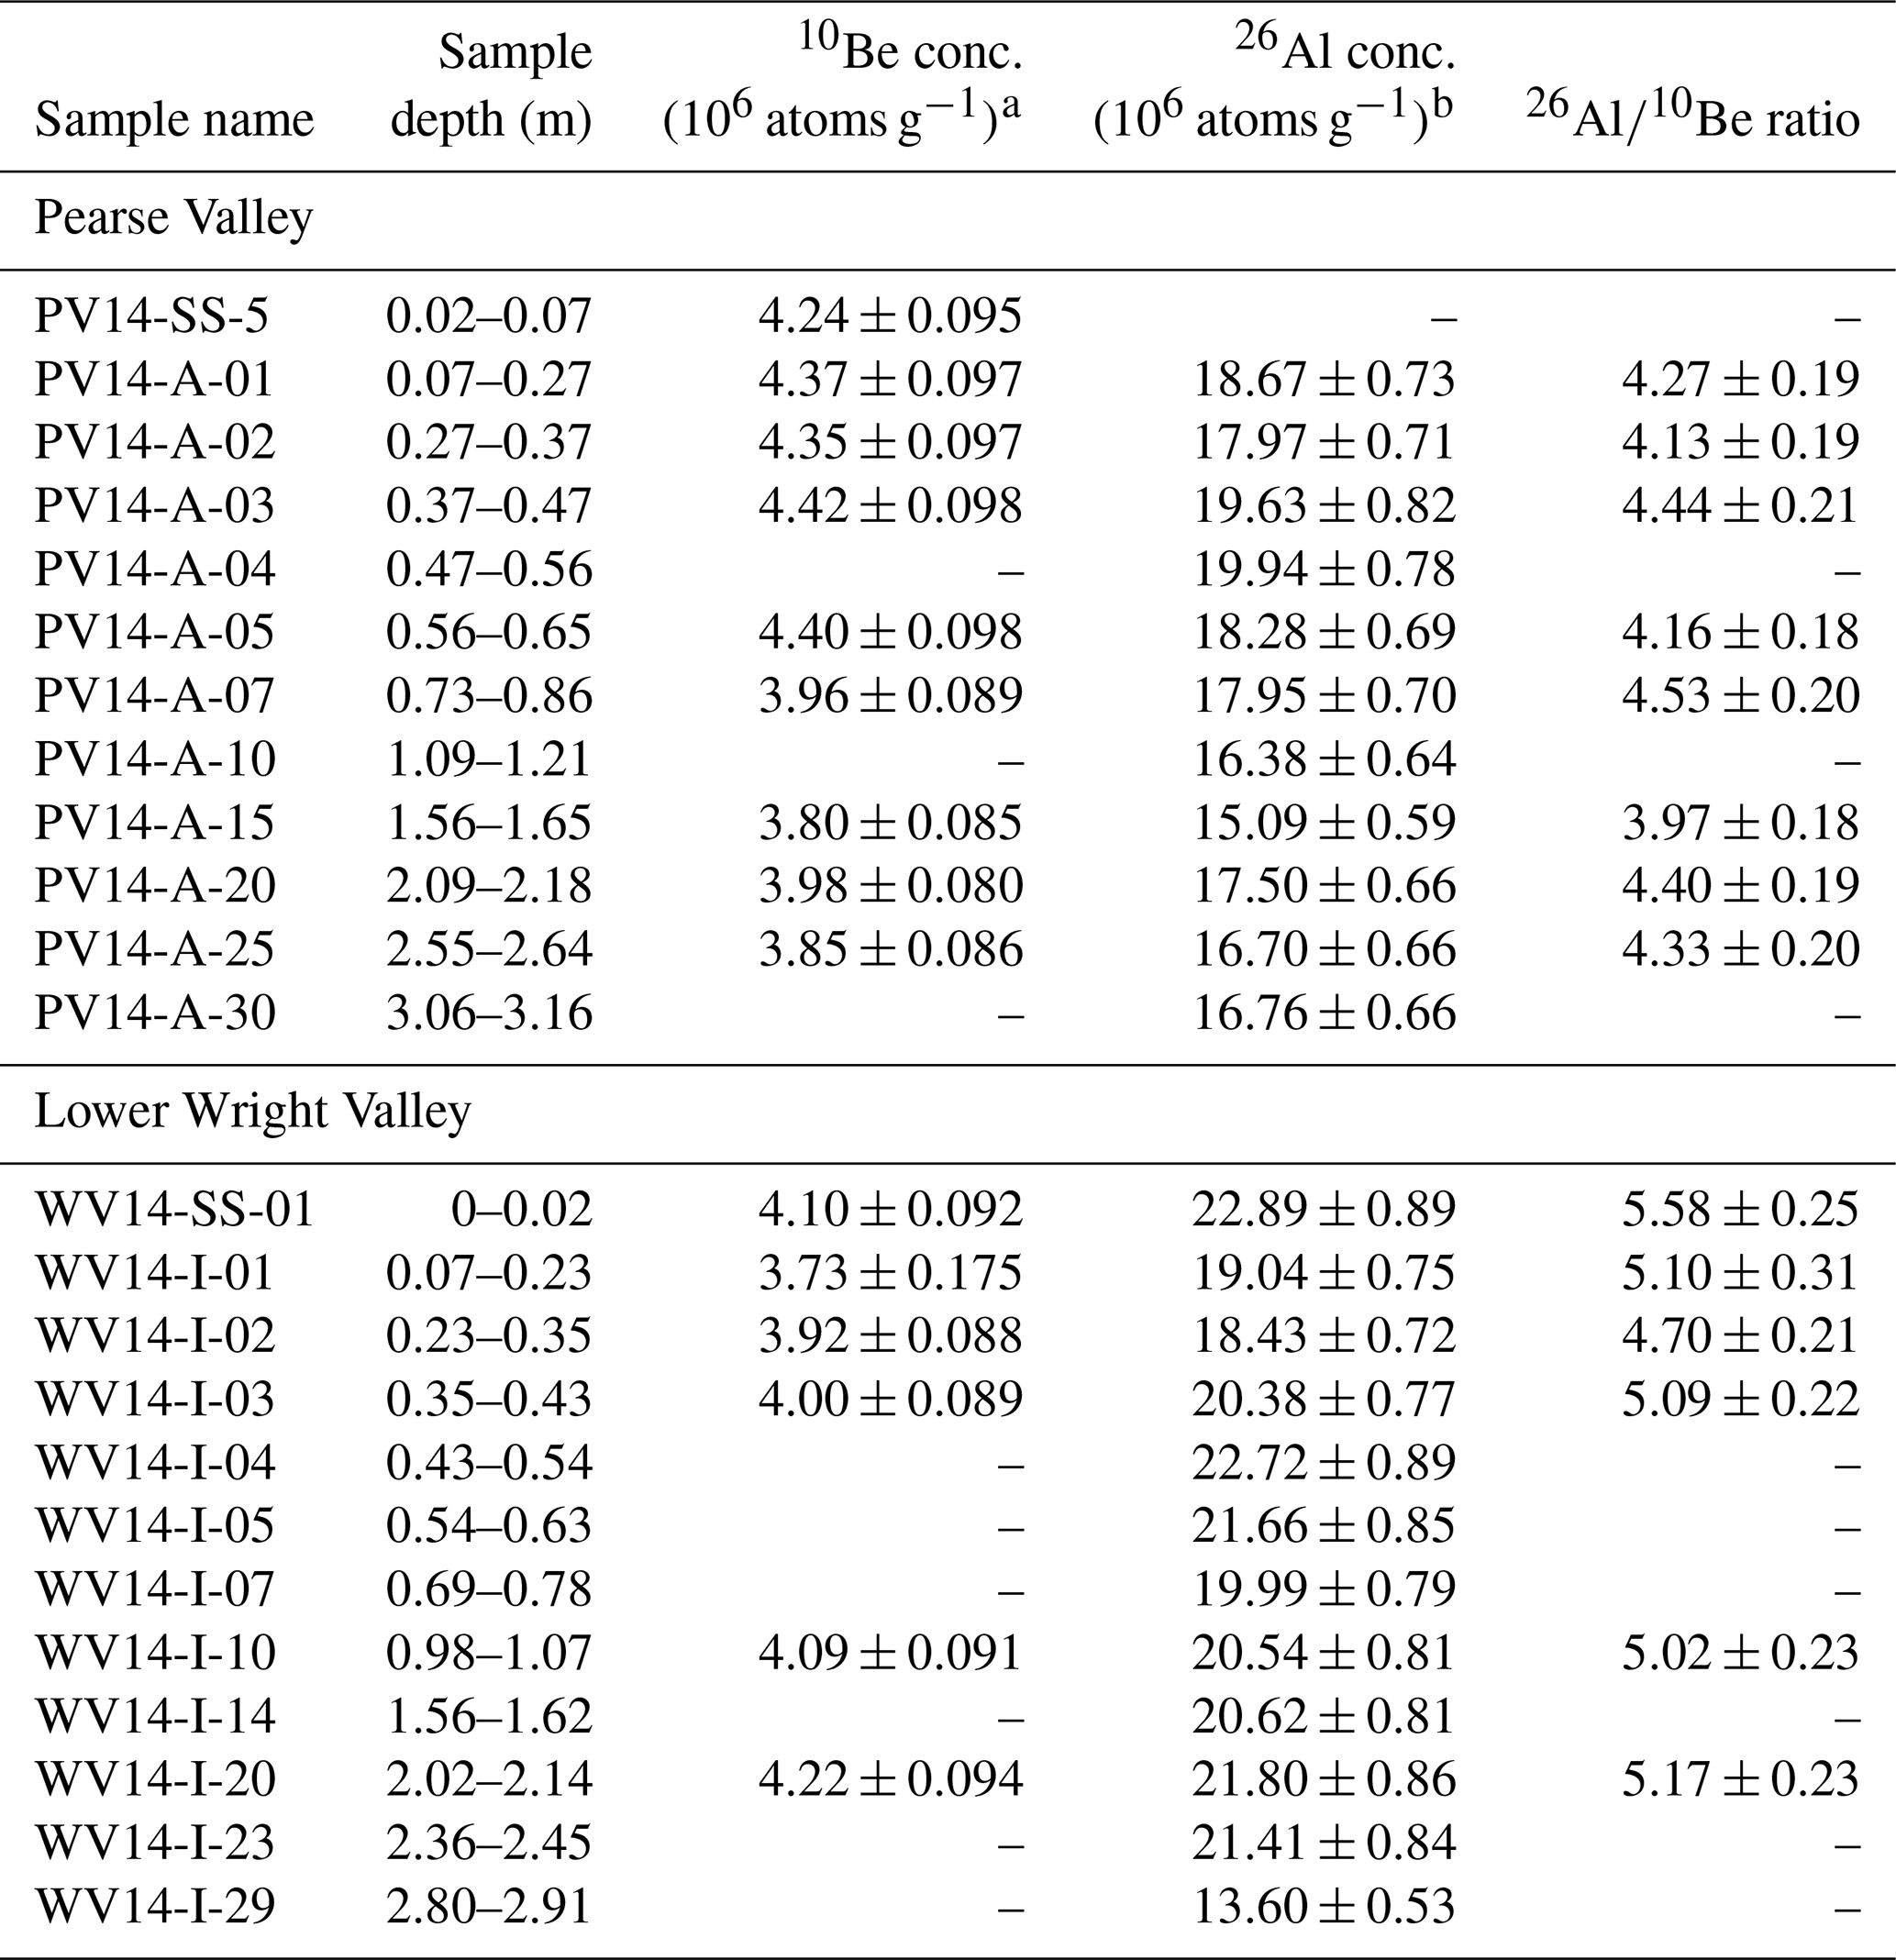
We assume a constant bulk density of 1.7 ± 0.1 g cm−3 based on bulk density measurements made on two core samples.
Topographic shielding is 0.9932 for Pearse Valley and 0.9968 for lower Wright Valley.
a Normalised to the 07KNSTD (KN-5.2) standard of Nishiizumi et al. (2007).
b Normalised to the KNSTD (KN-4.2) standard of Nishiizumi (2004).
3.1.2 Lower Wright Valley borehole core
The WV14-I core is located in eastern Wright Valley at 326 m a.s.l. (77.4252∘ S, 162.6664∘ E), ∼ 2 km west of Wright Lower Glacier (Fig. 3). The core was recovered to a depth of 2.91 m (Fig. 5). The active layer (0–0.28 m) above the ice-cemented permafrost consists of a thin armoured surface layer of desert pavement (∼ 0.02 m thick) and a layer of loose sand and pebbles (∼ 0.26 m thick). Below 0.28 m depth, the recovered sediments comprised ice-cemented permafrost. The 10Be and 26Al depth profiles start on the armoured desert pavement. A total of 2 samples were collected from the active layer and 10 from the ice-cemented permafrost (Fig. 5). The permafrost sediments are structureless to thinly laminated, fine to coarse, and pebbly granular sands, which we interpret to be fluvial and aeolian deposits. Sediments within the core are derived from weathered granite, metasedimentary, dolerite, and basalt origins. From 0–0.98 m depth, core sections were broken and loose sediment was recovered. Sediments recovered from 0.98–2.91 m were ice-cemented, except when encountering ice lenses. Several small ice lenses were recovered between 1.80–2.03 m depth. Hall et al. (2001) suggested sediments in lower Wright Valley are delta, shoreline, and glaciolacustrine deposits associated with a large proglacial lake at the LGM and in the early Holocene (25–7 ka). Only 4 of the 10 permafrost core samples were successful in providing paired 10Be and 26Al concentrations (Fig. 5; Table 1).
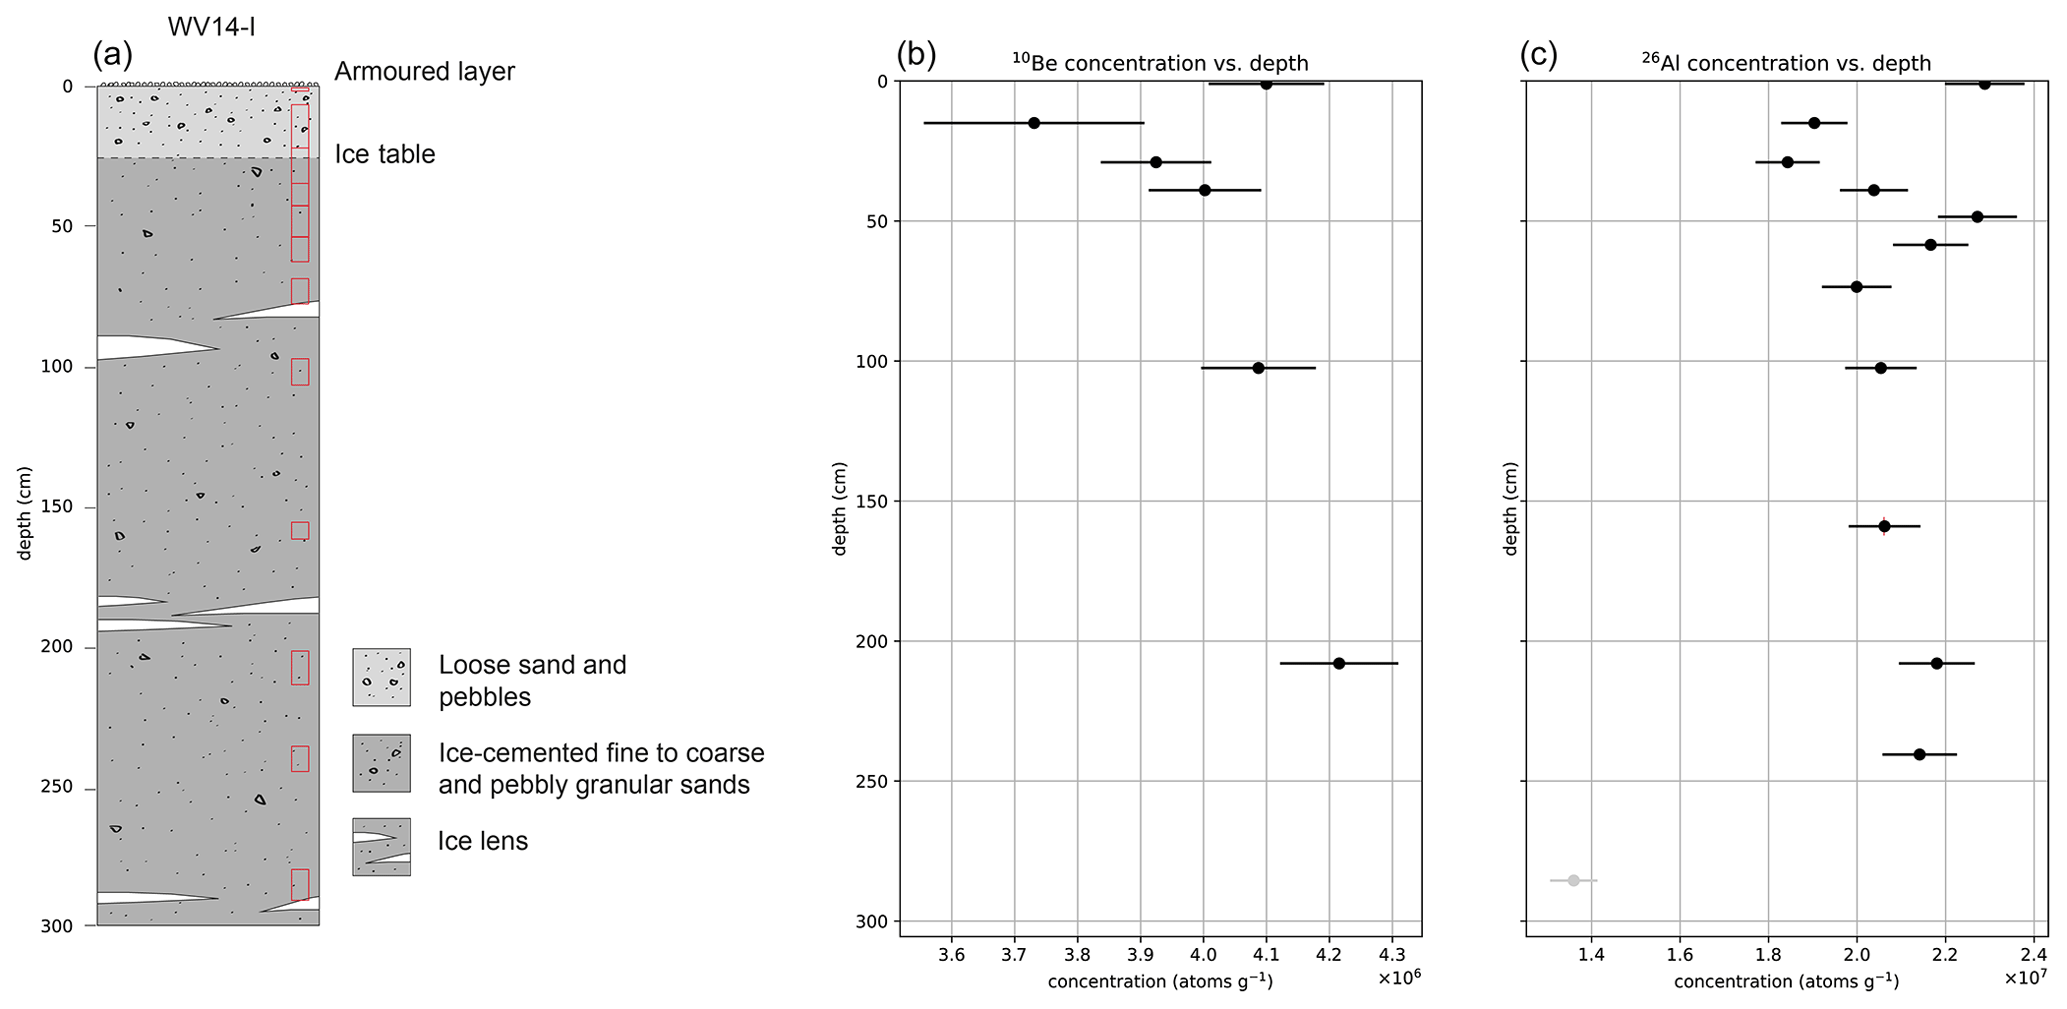
Figure 5Lower Wright Valley (WV14-I) permafrost core sedimentology (a). Locations of cosmogenic nuclide samples shown in red boxes. The modern active layer is from 0–0.28 m depth. Lower Wright Valley (WV14-I) permafrost core depth profiles with measured 10Be and 26Al concentrations (black data points) with 1σ uncertainties (b, c).
3.2 Surface cobbles in Pearse Valley
Three granite cobble samples were collected for surface exposure analysis from Pearse Valley (Table 2; Fig. 2). We targeted perched cobbles resting on larger flat boulders to minimise the possibility of post-depositional disturbance and hence best reflect deposition from retreating glacier ice or from surface deflation through sublimation. Samples that showed minimal weathering or fracturing were selected. The three cobbles were perched on larger host boulders (> 1 m diameter) which were elevated above the local surface permafrost valley deposits (Fig. 6). Two samples (PV14-CS3-P1 and PV14-CS3-P2) are small cobbles perched on the same host boulder, while the third sample (PV14-CS4-P1) is a slightly larger cobble perched on a different host boulder less than 80 m away.
Table 2Cosmogenic 10Be and 26Al concentrations and apparent exposure ages from Pearse Valley.
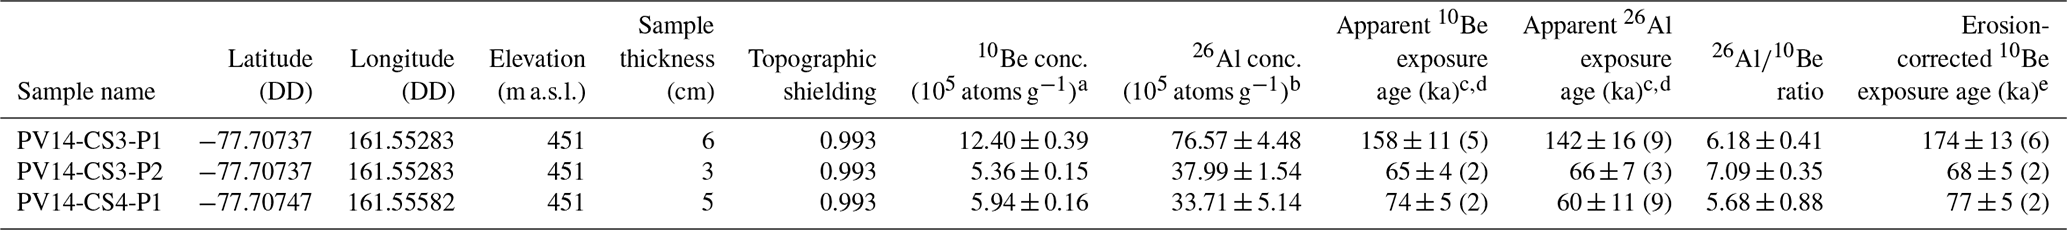
All samples are granite cobbles and have a density of 2.65 g cm−3.
DD signifies decimal degree.
a Normalised to the 07KNSTD (KN-5.2) standard of Nishiizumi et al. (2007).
b Normalised to the KNSTD (KN-4.2) standard of Nishiizumi (2004).
c Exposure ages calculated using the CRONUS-Earth calculator (http://hess.ess.washington.edu/math/, last access: November 2022), using the LSDn scaling scheme.
d Both internal and external uncertainties (shown at the 1σ level). Internal uncertainties (given in parentheses) are analytical uncertainties only, and external uncertainties are absolute uncertainties and include production rate and scaling errors.
e Calculated using an erosion rate of 0.65 mm kyr−1.
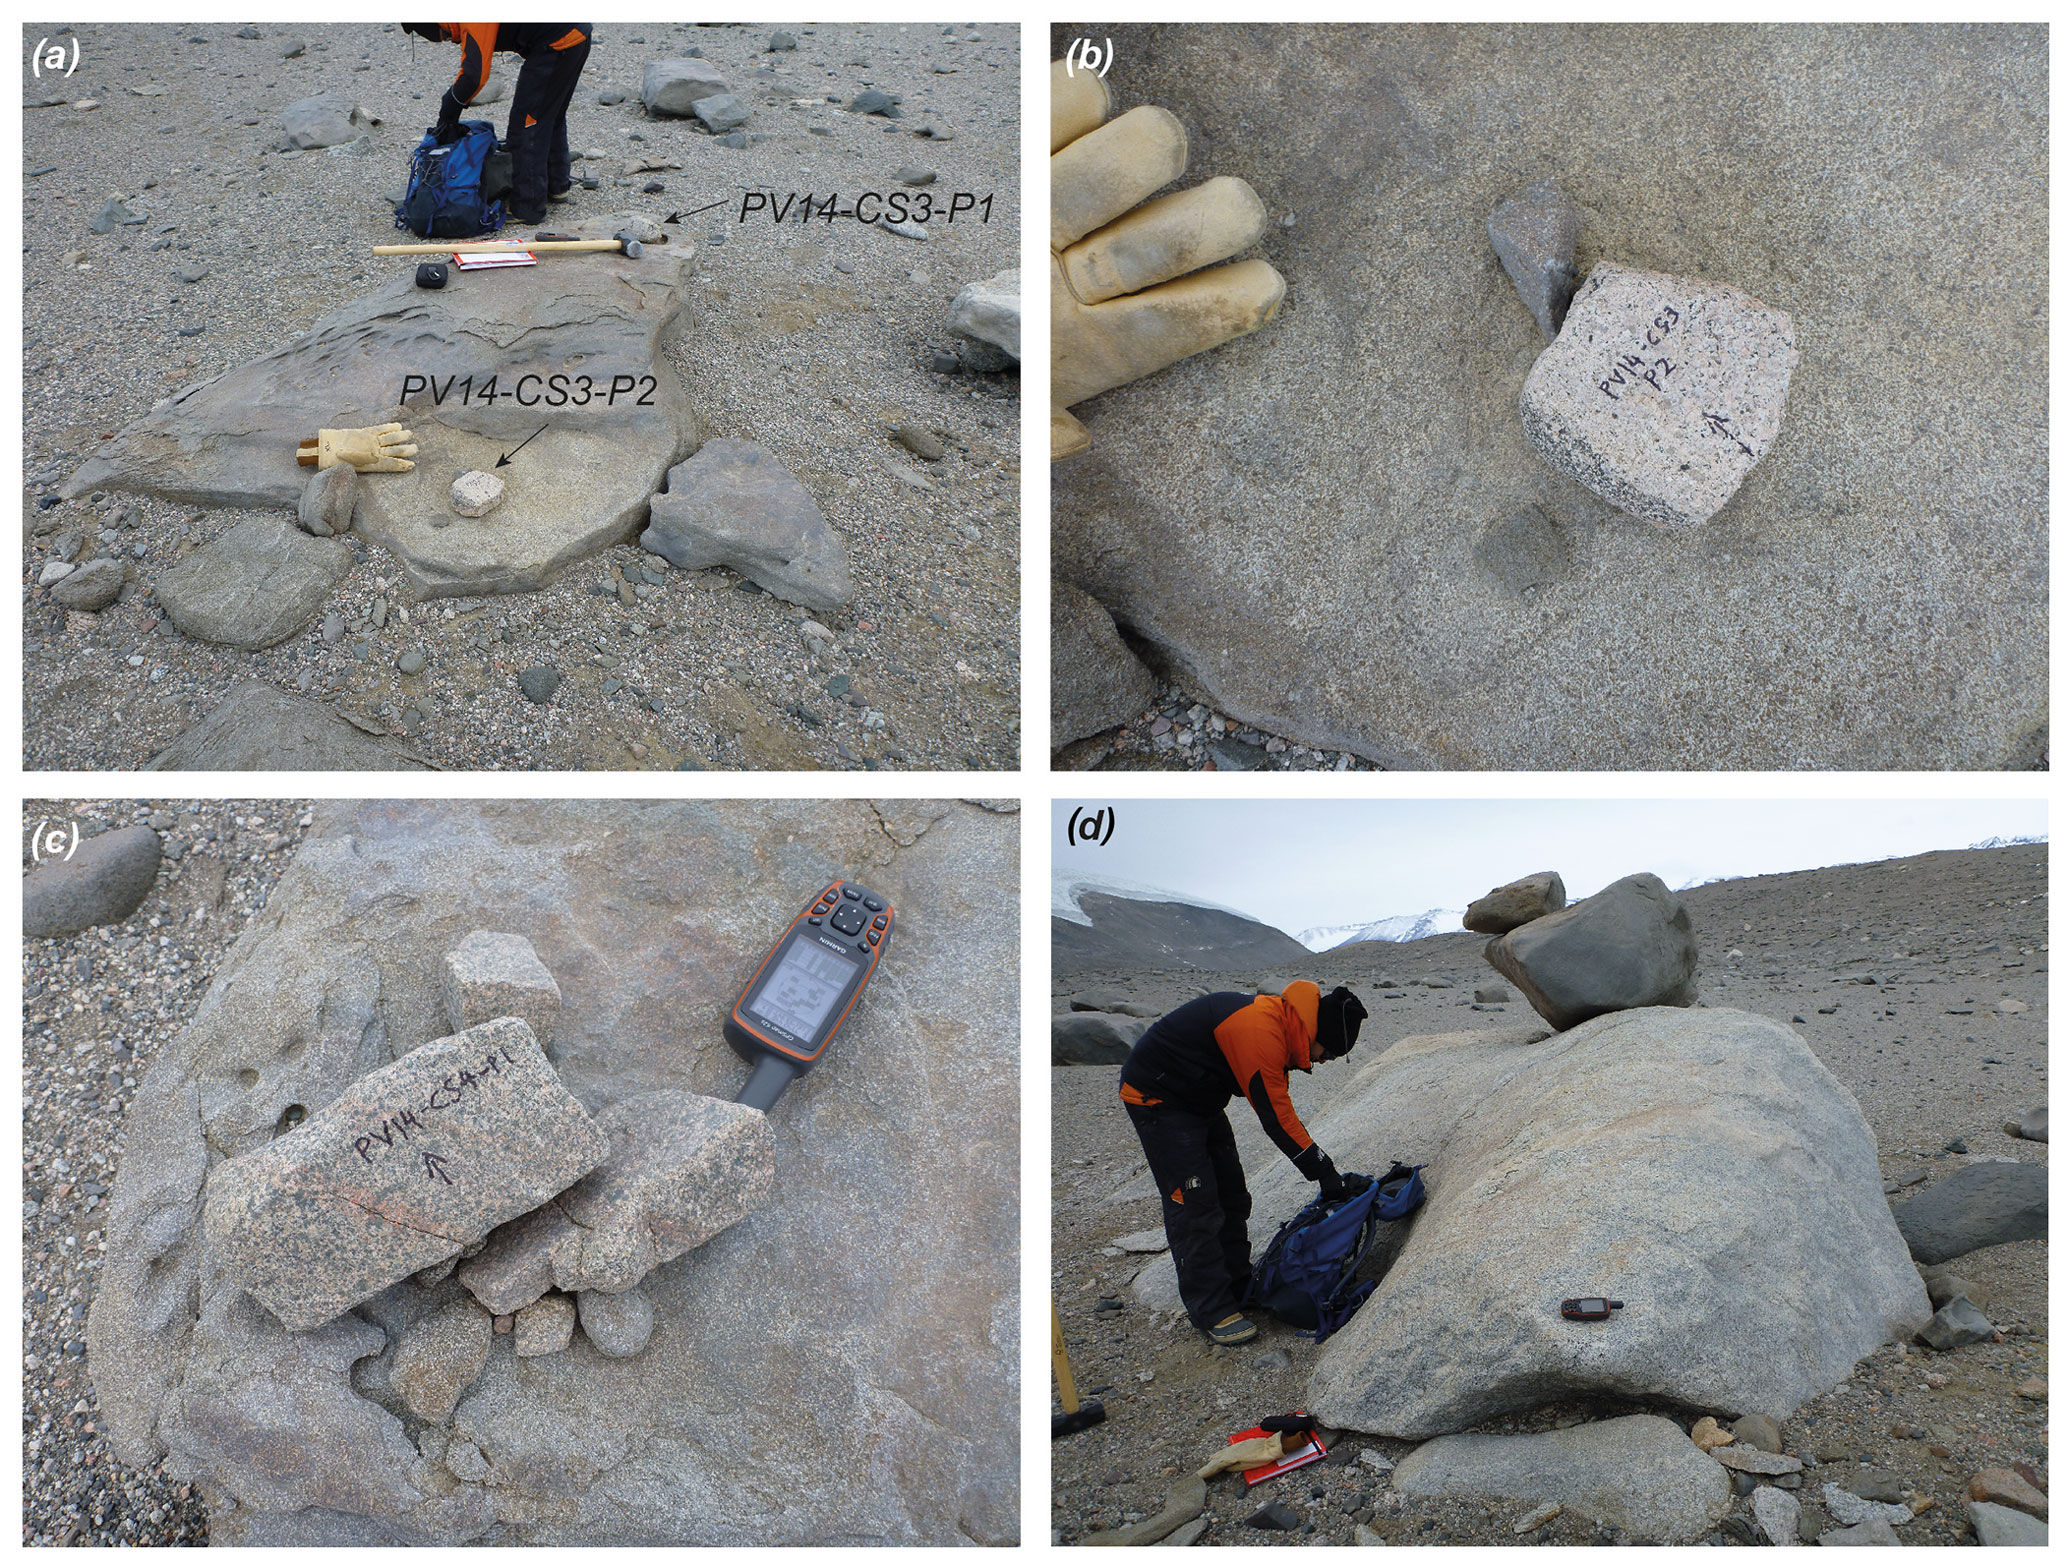
Figure 6Boulders and cobbles from Taylor 2 Drift on the central northern side of Pearse Valley. (a) PV14-CS3-P1 and PV14-CS3-P2 cobbles perched on a dolerite boulder. (b) Close-up view of PV14-CS3-P2. (c) PV14-CS4-P1 cobble hosted on dolerite boulder. (d) A granite boulder, hosting a dolerite boulder.
3.3 Analytical methods
Each core sample processed for cosmogenic nuclide analysis was heated at 100 ∘C overnight to remove ice and dry the sediment. Dried core samples and cobble surface samples were crushed and sieved to obtain the 250–500 µm fraction. Quartz was separated and purified using the hot phosphoric acid method (Mifsud et al., 2013), and beryllium and aluminium were extracted from quartz via conventional HF dissolution and ion exchange chromatography (Child et al., 2000). Isotope ratios were measured by accelerator mass spectrometry on the SIRIUS accelerator at the Australian Nuclear Science and Technology Organisation (Wilcken et al., 2019).
Measured ratios were normalised to the 07KNSTD (KN-5.2) standard of Nishiizumi et al. (2007) with a nominal ratio of . Measured ratios were normalised to the KNSTD (KN-4.2) standard of Nishiizumi (2004) with a nominal ratio of 30 . The nuclide concentration data for the Pearse Valley and lower Wright Valley depth profiles and the perched cobbles from Pearse Valley are shown in Tables 1 and 2, respectively. Full procedural blanks were obtained using carrier solutions derived from dissolved beryl with known 9Be concentrations (1068 and 1048 µg g−1 (solution)) and resulted in ratios of 1.9 ± and 1.3 ± . Blank corrections to measured ratios amounted to < 2 %. Procedural blanks were processed from standard reference ICP aluminium solutions (1000 µg mL−1 ± 1 %) and resulted in ratios of 3.6 ± and 1.3 ± . Blank corrections to measured ratios amounted to 4 % to 35 % for Pearse Valley erratics and < 1 % for all other samples. Final errors in 10Be and 26Al concentrations are obtained by quadrature addition of the final accelerator mass spectrometry (AMS) analytical error (the larger of the total statistical or standard mean error), a reproducibility error based on the standard deviation of the set of standard reference samples measured during the run (typically 1–2 % for either 10Be or 26Al), a 1 % error in Be spike concentration, and a representative 3 % error for ICP Al concentration of the native 27Al in the final purified quartz powder. Unless otherwise stated, all analytical uncertainties are 1σ.
Surface exposure ages for the cobble samples were calculated using version 3 of the CRONUS-Earth calculator (http://hess.ess.washington.edu/, last access: November 2022; Balco et al., 2008) using the LSDn scaling scheme (Lifton et al., 2014) and the primary default calibration data set of Borchers et al. (2016) (Table 1). Complete analytical data for all measurements are shown in Table S1 in the Supplement, and data from surface samples are archived on the ICE-D Antarctica database (http://antarctica.ice-d.org, last access: December 2022).
3.4 Dual-nuclide depth profile models and parameters
The 10Be and 26Al data from core samples in the Pearse and lower Wright valleys were modelled as simple exposure depth profiles (sensu Anderson et al., 1996). From a process perspective this assumes that (1) the modelled sediment package is vertically well-mixed at the time of deposition such that inherited nuclide concentration is constant with depth, (2) post-depositional sediment mixing is absent and changes in bulk density do not occur over time, and (3) surface erosion is steady-state. While the sedimentology of the cores clearly indicates that these assumptions were not fully realised, this simplified model provides a useful tool for exploring the impact of various soil and permafrost processes while providing useful chronologic constraints. We implemented a modified version of the Monte Carlo-based code of Hidy et al. (2010) that allows profiles of both 10Be and 26Al to be modelled jointly (after Hidy et al., 2018). For shallow profiles in sediments, where non-unique solutions for exposure age and erosion rate are likely, this approach allows estimation of exposure age and pre-depositional nuclide concentration (i.e. inheritance) given reasonable observation-based constraints on erosion rate or net erosion (e.g. Bergelin et al., 2022; Hidy et al., 2010, 2018; Mercader et al., 2012; Morgan et al., 2010). The inheritance determined by the best-fit depth profile asymptote can be subtracted from the measured values for each sample (Hidy et al., 2018). As described in Sect. 3.1 above, the upper ∼ 0.3 m of both cores consists of loose sandy sediment that is mobile or active. Figure 7 shows a schematic evolution of a cosmogenic nuclide depth profile over time with the added feature of a near-constant 10Be concentration in a cryoturbated active layer above ice-cemented permafrost. The presence of a surface mixed layer does not negate the assumption that these sediments were comprised of a combination of well-mixed, thick glacial tills and fluvial and aeolian sediments that were deposited at a given time when the glaciers retreated from each valley. However, consideration needs to be given on how to represent the measured 10Be and 26Al concentrations in the surface mixed layer with the depth profiles and resultant sensitivity of the model outputs. We discuss these aspects in Sect. 4 below.
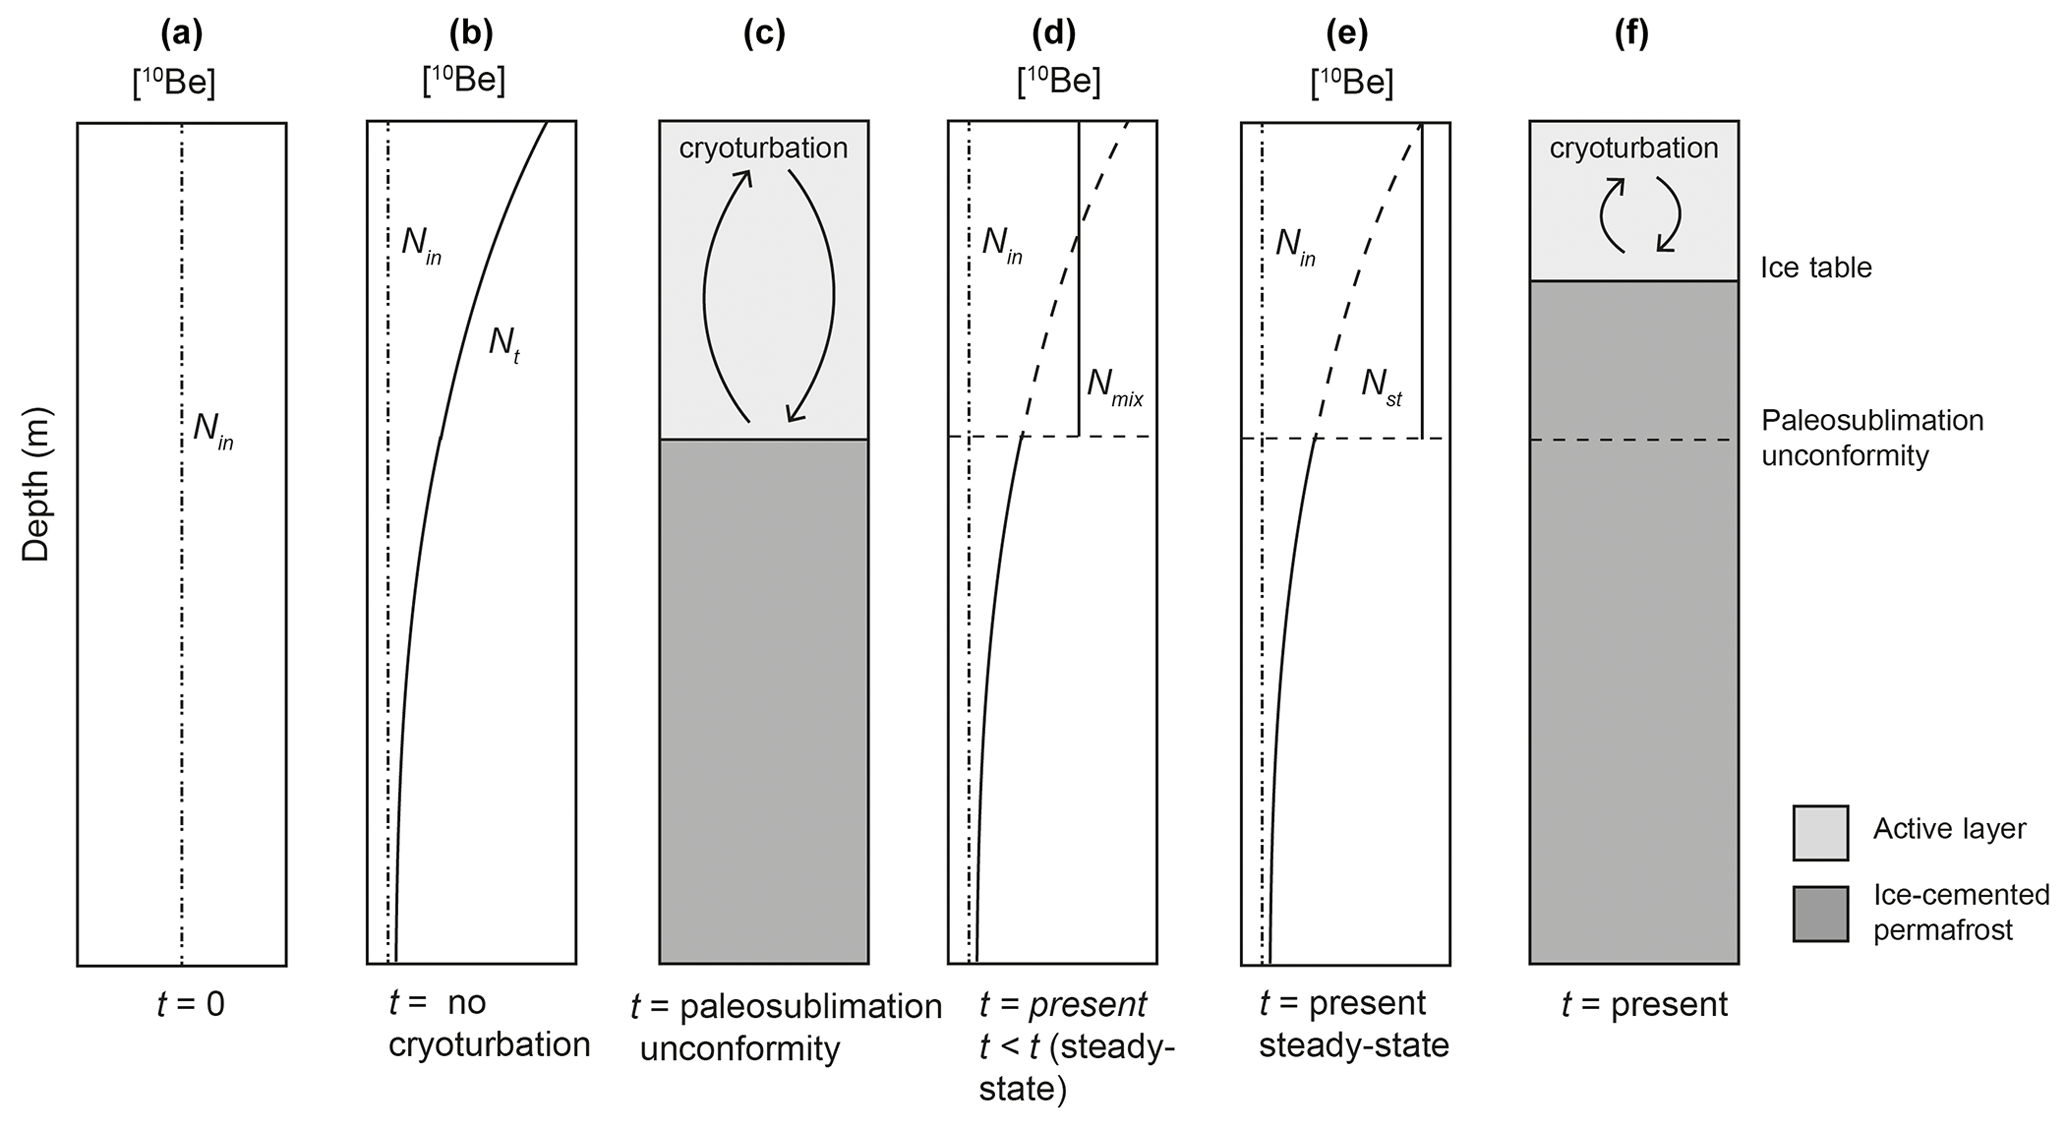
Figure 7Schematic representation of a 10Be depth profile in permafrost modified by active layer cryoturbation. (a) Initial 10Be profile (constant with depth) in well-mixed glacial till or sediment. All quartz grains are assumed to have been deposited with a common nuclide inheritance (Nin). (b) After prolonged exposure and in the absence of sediment mixing, an exponentially decreasing nuclide depth profile is obtained. (c) Permafrost profile during an interval when air temperature is warmer than at present, allowing near-surface sediments to form an active layer above the paleosublimation depth. Sediments below the unconformity are perennially frozen. Vertical mixing via active layer cryoturbation results in an average 10Be value (Nmix) (d) and with steady-state erosion (Nst) (e). An exponentially decreasing 10Be profile remains below the unconformity. (f) Present-day permafrost profile with shallower active layer and ice table than shown in (c).
To ensure consistency with the cobble exposure ages, we obtain production rates applied in the depth profile model from the CRONUS-Earth calculator. For the PV14-A core, we use a site-specific spallation 10Be surface production rate of 8.40 atoms g−1 (quartz) yr−1 and a 26Al surface production rate of 59.7 atoms g−1 (quartz) yr−1. For the WV14-I core, we use a site-specific spallation 10Be surface production rate of 7.47 atoms g−1 (quartz) yr−1 and a 26Al surface production rate of 53.2 atoms g−1 (quartz) yr−1. These production rates were calculated using LSDn scaling (Lifton et al., 2014) and the primary calibration data set of Borchers et al. (2016). These production rates yield surface production rate ratios of 7.11 and 7.12 for Pearse Valley and lower Wright Valley, respectively. We assume a neutron attenuation length of 140 ± 5 g cm−2, as used in previous Antarctic studies for 10Be and 26Al (Bergelin et al., 2022; Borchers et al., 2016). Spallogenic production rate uncertainty has not been included in the modelling. Muogenic production with depth, including an assumed 8 % uncertainty, followed Model 1A from Balco (2017). We assume bulk density to be constant with depth but sampled from a normal distribution of 1.7 ± 0.1 g cm−3 based on bulk density measured from two core samples for loose sediment and ice-cemented permafrost. In most cases, the ice lenses were less than 5 cm thick. The change in density in these thin ice lenses is not included in our assumed bulk density, and we acknowledge the small difference this assumption could have on the overall model outputs. Erosion rate and net erosion were constrained between 0–0.4 cm kyr−1 and 400 cm, respectively, based on field observations described in Sect. 4.3. Within these constraints, exposure age, surface erosion rate, and inheritance for 10Be and 26Al were simulated with uniform distributions, and model output was based on n=100 000 acceptable depth profile solutions.
4.1 Cosmogenic nuclide depth profiles
Both the Pearse Valley (Fig. 4) and lower Wright Valley (Fig. 5) depth profiles share two common observations. Neither depth profile displays a marked exponential decrease in measured nuclide concentration over the full ∼ 3 m core depth profile, and both cores have shallow, active mixed layers where measured nuclide concentrations are effectively constant.
In the Pearse Valley permafrost core, there is a marked decrease in all 10Be and 26Al concentrations for samples below ∼ 0.65 m depth. However, the reduction in 10Be (and 26Al) between shallow (active layer) and deep samples from only ∼ 4.4 to atoms g−1 (and, respectively, from ∼ 19.9 to atoms g−1 for 26Al) indicates a high inherited cosmogenic concentration supporting a marginal post-depositional increase in 10Be and 26Al. Moreover, the average ratio, which ranges between 4.0 and 4.5, suggests a long history of total exposure and burial for these permafrost sediments (i.e. in addition to their presence in the core as permafrost). One feature worthy of note is the distinct increase in both 10Be and 26Al for the deepest three samples below 2.09 m depth compared to samples < 1.65 m depth, suggesting that the Pearse Valley permafrost core may not have been a single depositional event. In contrast, the lower Wright Valley depth profiles for 10Be and 26Al show more scatter than the Pearse Valley depth profiles, and there is no decrease in concentration with depth. Effectively the lower Wright Valley profile is depth-independent with a 10Be concentration of and a 26Al concentration of atoms g−1. The magnitudes of the concentrations for the Pearse and Wright valleys are remarkably similar, as is the range of ratio from 4.7 to 5.6, suggesting that lower Wright Valley permafrost sediments have had a similar total exposure–burial history as Pearse Valley sediments.
These depth profiles present complications to any modelling aiming for non-unique solutions of deposition age and surface erosion due to the presence of a surface mixed layer and marginal (in Pearse Valley) to near-absent (in lower Wright Valley) post-depositional build-up of 10Be and 26Al in the shallow subsurface sediments. We note that applying a depth profile model that assumes nuclide concentration attenuation to a profile that contains a surface mixed layer and depth concentration inversions has limitations with respect to chronological information. In the following sections we describe the modified depth modelling exercises taken to accommodate the complication presented in the Pearse Valley and lower Wright Valley data sets.
4.2 Minimum age estimate for Pearse Valley core
Prior to any depth profile modelling, a simple calculation was carried out to estimate the depositional age of the upper ∼ 0.65 m of the Pearse Valley permafrost by comparing maximum and minimum nuclide concentrations. Assuming zero erosion and a surface production rate determined at the coring site, a minimum “exposure age” (tmin) can be calculated using the following equation:
where Nmax is the absolute maximum 10Be concentration, Nmin is the absolute minimum 10Be concentration (assumed inheritance) for all mixed sediments, and P is the production rate (atoms g−1) at the sample site. The absolute maximum and minimum 10Be concentrations for the Pearse Valley depth profile using Eq. 1 are reported in Table 3. Equation (1) yielded a minimum deposition age of ∼ 74 ka for the Pearse Valley core (Table 3).
4.3 Cosmogenic nuclide depth profiles in Pearse Valley
Below the surface mixed layer, between 0.65 and 1.65 m, both 10Be and 26Al concentrations display attenuation with depth. Below 1.65 m, the attenuation is interrupted by a considerable increase in nuclide concentrations from 2.09 m depth. This suggests that the depth profile is of a composite structure, which is supported by the observation that ice lenses appearing at ∼ 0.7 m and at ∼ 1.70–1.80 m (see Fig. 4) are associated with distinct changes in 10Be and 26Al concentrations. No acceptable depth profile model fit was obtained when all measured 10Be and 26Al concentrations were included as a single depositional episode (see Fig. S1). Hence, consideration was given to restrict our depth profile model to only fit samples from 0.02 to 1.65 m depth and to consider how to incorporate the surface mixed layer with the depth profile.
The five 10Be and five 26Al nuclide concentrations from 0.02–0.65 m exhibit a uniform concentration with depth with averages of 4.36 atoms g−1 and 1.89 atoms g−1, respectively, with no attenuation, indicating that these upper sediments have been vertically mixed (or possibly deposited sufficiently recently so that nuclide depth profiles effectively reflect only inheritance without significant post-depositional production). In continuously vertically mixed surface soils (such as those in the McMurdo Dry Valleys), where mixing times are short compared to radionuclide decay rates, the average production rate in the mixed layer is constant with depth (Granger and Riebe, 2014). Under these conditions, the average cosmogenic nuclide concentration in the mixed layer will attain a constant value at erosional equilibrium (Fig. 7). Hence, we use the mean 10Be and 26Al concentrations in the upper 0.65 m to approximate the surface mixing processes that resulted in the uniform profile. Figure 8 shows the model best-fit to samples from 0.02–1.65 m, with all samples between 0.02 and 0.65 m depth converging to a single mean concentration in order to determine the younger depositional phase. When solving for the four free parameters, namely age, erosion rate, 10Be, and 26Al inheritance, the best-fit modelled nuclide concentrations for the PV14-A depth profile, when restricted to samples from 0.02 to 1.65 m depth, fall within the 25th to 75th percentile of the measured concentrations. The reduced chi-squared statistical test for the best-fit to a profile using a mean concentration for the surface mixed layer with the upper-sediment samples (0.02 to 1.65 m depth) gives a value of 0.88 with 3 degrees of freedom (n=7), which is significantly better than the reduced chi-squared value of 2.71 with 16 degrees of freedom (n=20) for the full profile using all nuclide measurements (0.02–3.16 m) (see Table S2), confirming our modified approach improved model fitting. We constrained the erosion rate of the depth profiles using information from surface cobble PV14-CS3-P2 which sits ∼ 10–20 cm above the desert pavement and has a minimum exposure age of 65 ka (Fig. 6a). Based on this observation we can assume a maximum surface lowering rate of ∼ 0.3 cm kyr−1. Using this field observation, we applied a conservatively high erosion rate limit of 0.4 cm kyr−1 for our depth profile modelling. The solutions yield the most probable 10Be and 26Al inheritance concentrations of 3.59×10⁶ and 1.42×10⁷ atoms g−1, respectively (Figs. 8, S2), constrain the depositional age of the sediment (< 1.65 m depth) at 180 ka (Fig. 9), and yield an erosion rate of 0.24 cm kyr−1 (Fig. S2). By inference, the lower part of the profile (> 2.09 m depth) predates the sediments above and must be deposited before ∼ 180 ka.
Table 3Maximum and minimum 10Be concentrations and minimum deposition age for the Pearse Valley core.
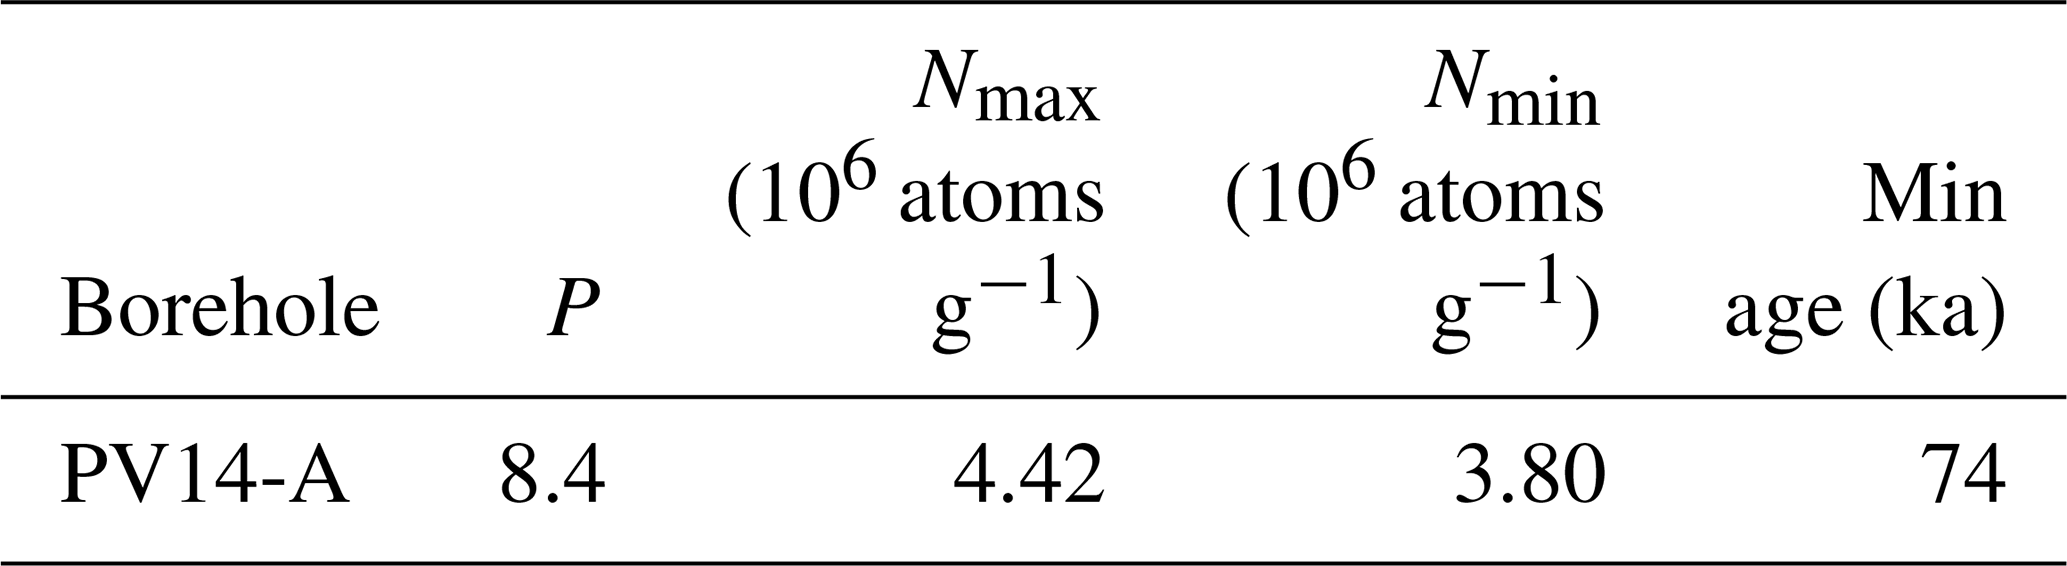
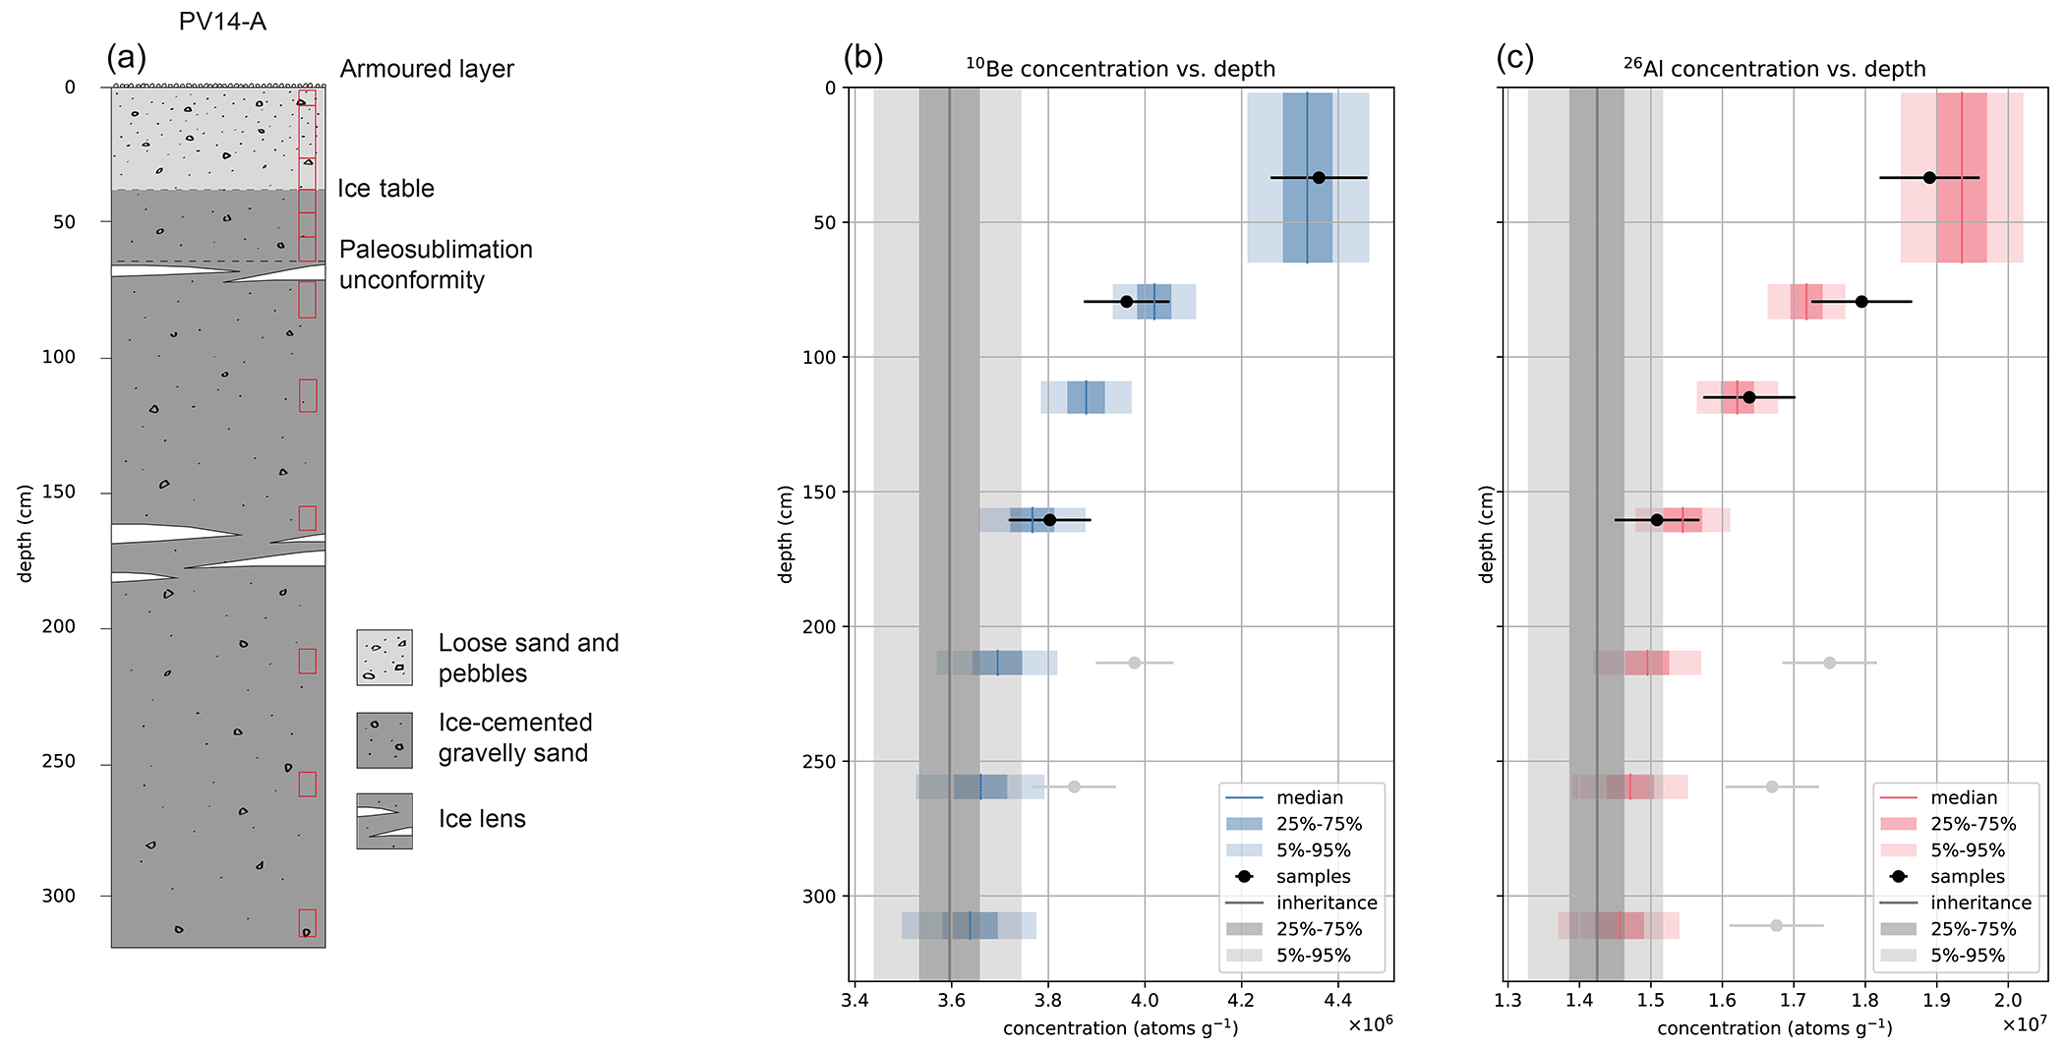
Figure 8Pearse Valley (PV14-A) permafrost core sedimentology (a). Locations of cosmogenic nuclide samples shown in red boxes. Pearse Valley (PV14-A) permafrost core depth profiles with measured 10Be and 26Al concentrations (black data points) with 1σ uncertainties (b, c). For all samples between 0.02–0.65 m depth, we used the average concentration of all five 10Be and 26Al measurements to represent the effect of cryoturbation of sediments in the active layer. Blue (10Be) and red (26Al) boxes show simulated nuclide concentrations at each depth. 10Be and 26Al concentrations (grey data points) below 2.09 m were not included in the model.
4.4 Cosmogenic nuclide depth profiles in lower Wright Valley
The 10Be and 26Al depth profiles from the permafrost core and overlying active layer used for depth profile modelling in lower Wright Valley are shown in Fig. 10. For the lower Wright Valley 10Be and 26Al concentration profiles exhibit near-constant concentrations with depth, with average values of 4.01 ± 0.10×10⁶ atoms g−1 and atoms g−1, respectively. The absence of a discernible exponential attenuation indicates all sediments in the depth profile are either continuously vertically mixed after deposition or sufficiently young so that post-depositional nuclide production is negligible relative to inheritance.
The depth profile model does not work well for non-attenuating profiles and usually fails to give well-constrained results. The modelled nuclide concentration depth profiles do not fit within the 5th to 95th percentile for our measured concentrations in the lower Wright Valley depth profile (Fig. 10). The solutions yield the most probable 10Be and 26Al inheritance concentrations of 4.03×10⁶ and 2.06×10⁷ atoms g−1, respectively (Figs. 10, S4). Our simulations yield the depositional age of the permafrost at 4.4 ka (5th to 95th percentile) and an erosion rate of 0.2 cm kyr−1 (Fig. S4).
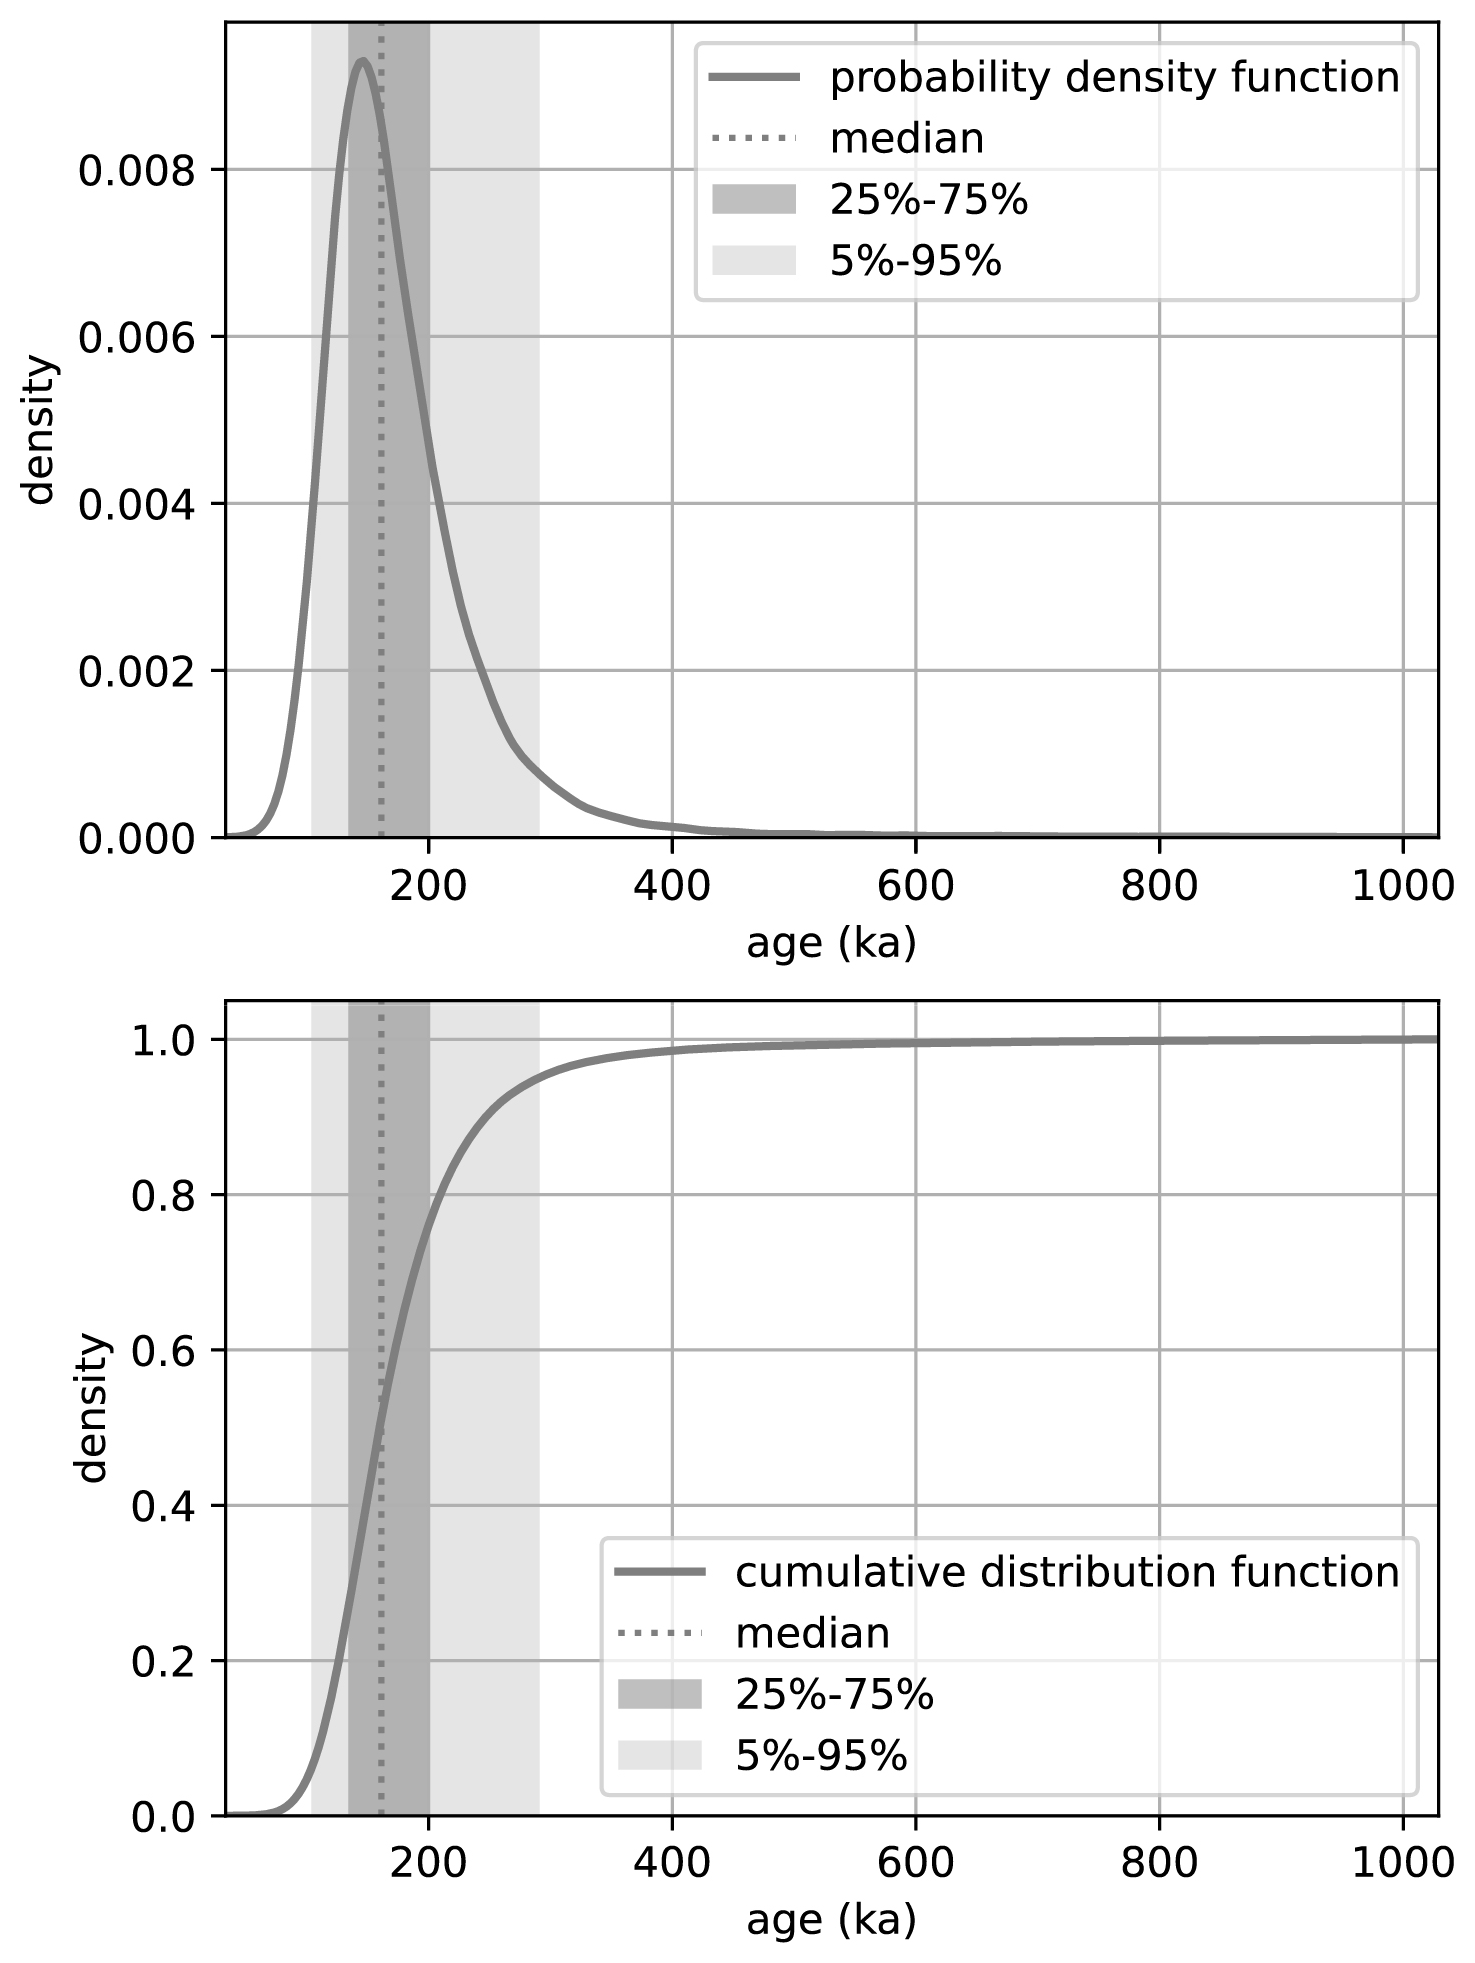
Figure 9Probability density function and cumulative distribution function for exposure age, using dual-nuclide depth profile modelling between 0.02–1.65 m depth for PV14-A.
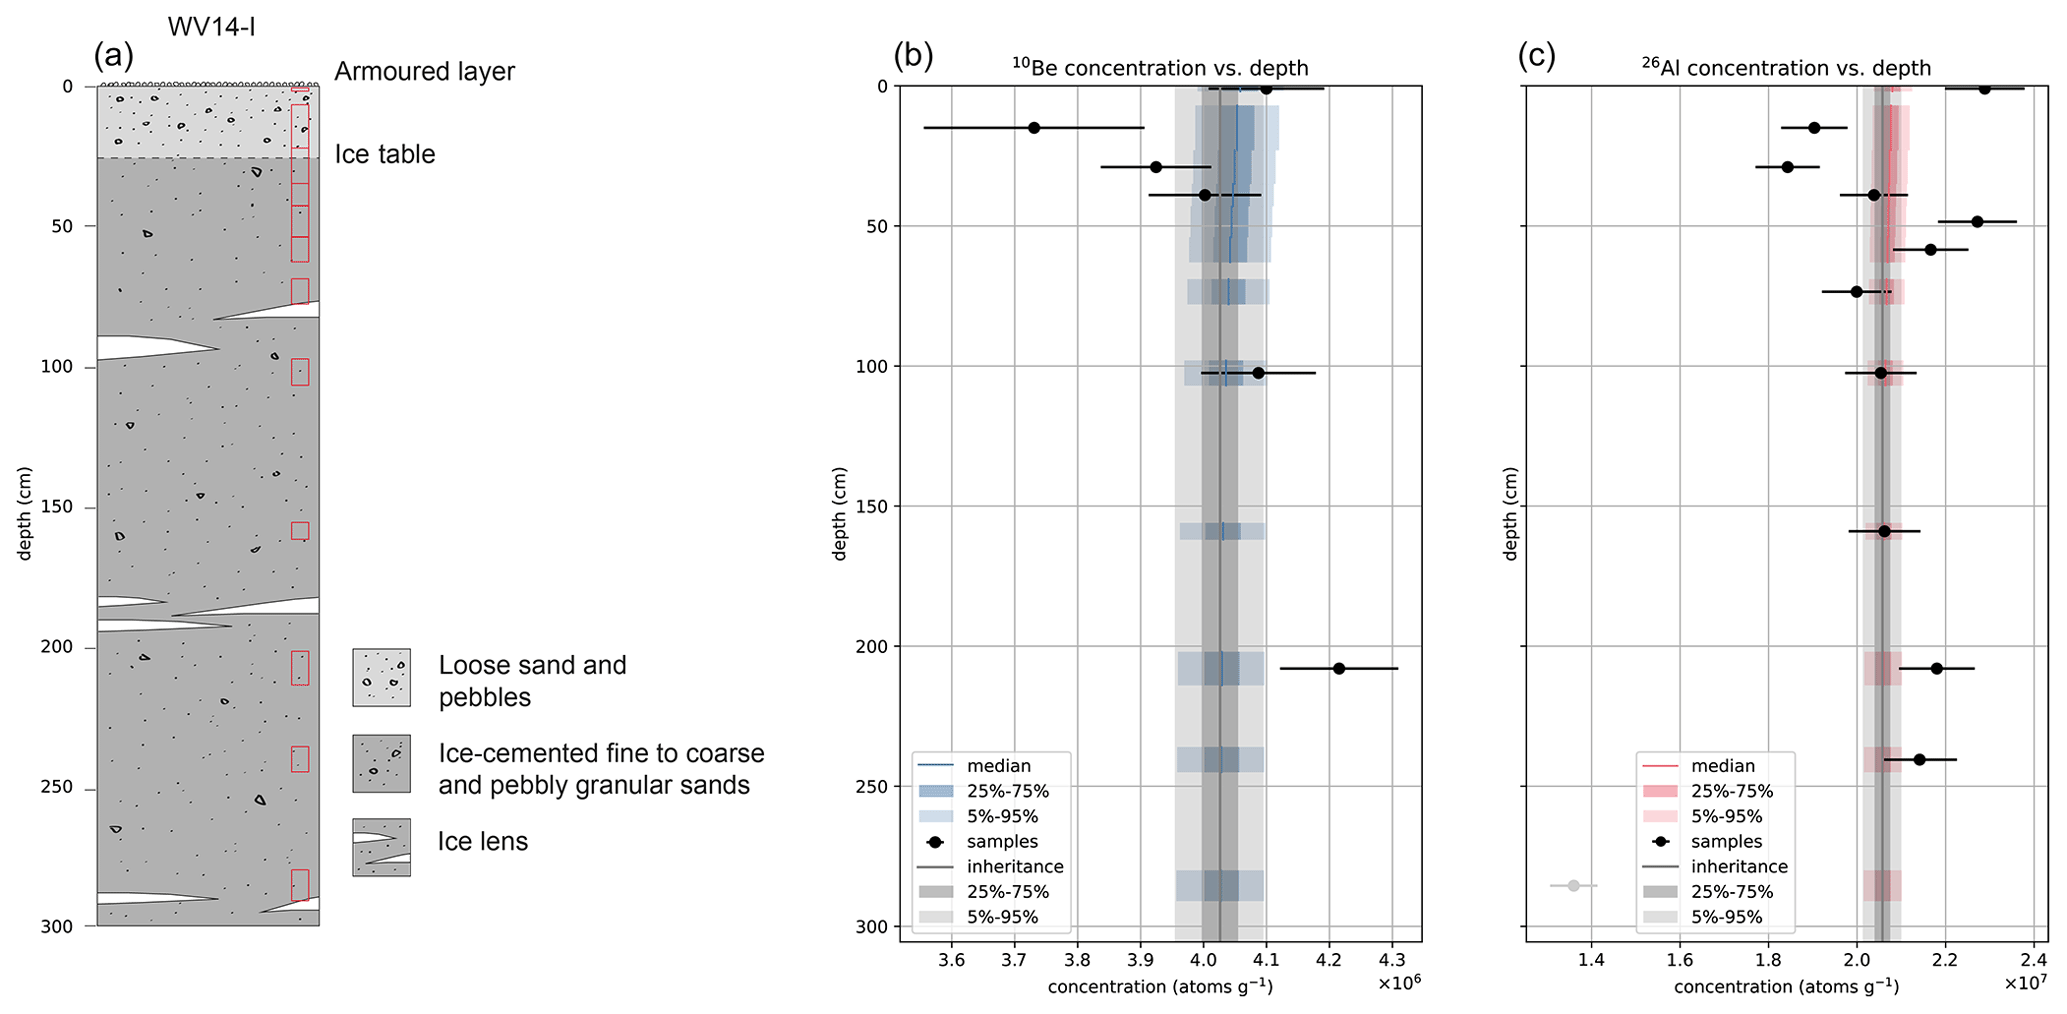
Figure 10Lower Wright Valley (WV14-I) permafrost core sedimentology (a). Locations of cosmogenic nuclide samples shown in red boxes. Lower Wright Valley (WV14-I) permafrost core depth profiles with measured 10Be and 26Al concentrations (black data points) with 1σ uncertainties (b, c). Blue (10Be) and red (26Al) boxes show simulated nuclide concentrations at each depth.
4.5 Surface exposure ages and erosion rates in Pearse Valley
Boulders and cobbles of granite, gneiss, Beacon sandstone, and dolerite pepper the Pearse Valley floor, forming a thin, patchy drift overlying an older, well-weathered relict drift surface. Some boulders lodged in the relict drift host smaller perched boulders, cobbles, and pebbles on their surfaces, indicating deposition of perched clasts occurred after the most recent retreat of Taylor Glacier (Fig. 6). Our surface exposure chronology is based on three granitic cobbles on the northern side of the central valley floor (Table 2; Fig. 2). Two samples (PV14-CS3-P2 and PV14-CS4-P1) yielded minimum zero-erosion 10Be exposure ages of 65 ± 4 ka and 74 ± 5 ka (1σ external errors), respectively, whereas the third sample (PV14-CS3-P1) yielded an older age of 158 ± 11 ka, presumably affected by inheritance (Table 2). The three concentration ratios range from 5.7 to 7.1 and, when plotted on a diagram, are consistent with a simple constant exposure within their 1σ error ellipses (Fig. 11). One sample (PV14-CS4-P1) suggests a burial age ranging from 0 up to ∼ 900 ka burial, the result of a large error in measured 26Al concentration. Given inheritance is stochastic, we infer the two lowest consistent ages represent the minimum inheritance, and we take them to be our best estimate to represent zero-erosion exposure ages for the cobbles. While this assumption of zero erosion makes a negligible difference for LGM and younger ages, we evaluate the influence of surface erosion on the exposure ages above using known erosion rates reported from Antarctica and geological evidence from the sites. Bedrock and regolith erosion rates in the McMurdo Dry Valleys range from 0.1–4 mm kyr−1 (Putkonen et al., 2008; Summerfield et al., 1999). A compiled study across Antarctica showed that granite populations have a mean erosion rate of 0.13 mm kyr−1 and in the McMurdo Dry Valleys a max erosion rate of 0.65 mm kyr−1 (Marrero et al., 2018). Applying the max erosion rate (0.65 mm kyr−1) from granite surfaces in the McMurdo Dry Valleys, erosion-corrected 10Be exposure ages of our granitic cobbles resulted in 174 ± 13 ka (PV14-CS3-P1), 68 ± 5 ka (PV14-CS3-P2), and 77 ± 5 ka (PV14-CS4-P1) (1σ external errors; Table 2). The cobble sample PV14-CS3-P2 displays minimal edge rounding, which suggests negligible erosion, and is unlikely to be much older than the zero-erosion age.
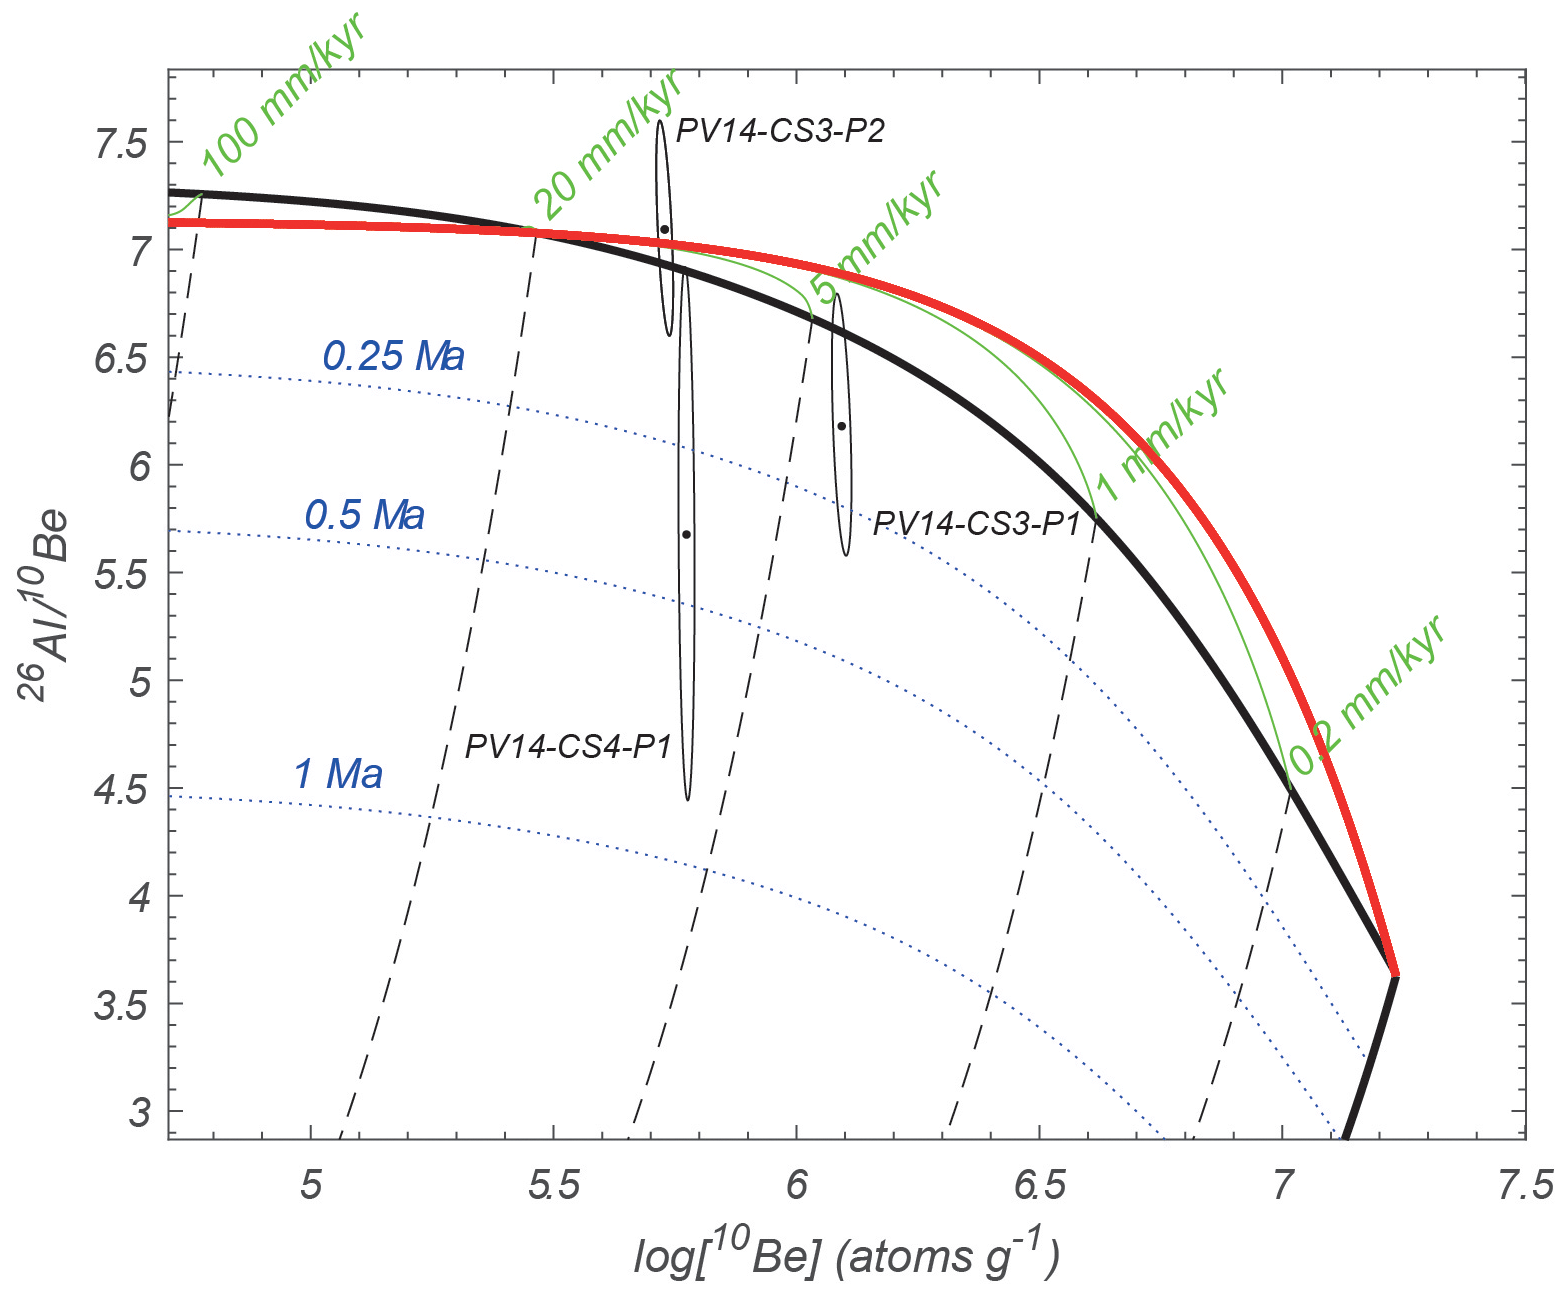
Figure 11Two-isotope plot of Pearse Valley cobbles using the time-dependent LSDn scaling scheme of Lifton et al. (2014) and the primary default calibration data set of Borchers et al. (2016). Measured nuclide concentrations are shown with 1σ uncertainties. Burial isochrons (dotted lines), decay trajectories (dashed), the exposure–erosion region (bounded by black and red lines), and steady-state erosion loci (green) are shown.
5.1 Depositional and permafrost processes in Pearse Valley
Depth profile modelling suggests that the permafrost sediments underlying Taylor 2 Drift, in Pearse Valley, predate MIS 5. At the PV14-A permafrost core site, the present-day active layer comprises a desert pavement surface and layer of loose vertically mixed sediments to a depth of ∼ 0.37 m, positioned above ice-cemented permafrost sediments. The interface between this active layer and the ice-cemented permafrost represents a sublimation unconformity. 10Be and 26Al concentrations are constant throughout the active layer and down to ∼ 0.65 m depth in the permafrost. However, there is a discernible decrease in 10Be and 26Al concentrations in the permafrost below ∼ 0.65 m depth alongside an ice horizon (Fig. 4). Such ice horizons are indicative of a paleosublimation unconformity and suggest the sediments experienced intervals that are warmer than the present day during or after deposition. This 10Be reduction cannot be explained by active layer cryoturbation, as the present-day active layer is only 0.37 m deep. Lapalme et al. (2017) suggested that in the upper ∼ 0.5 m of a soil profile, ice can accumulate and sublimate due to changing ground surface temperature and humidity conditions. Below ∼ 0.5 m depth, ice will progressively increase over time. Therefore, a paleosublimation unconformity can be inferred by the increase in ice content from 0.6 to 0.4 m depth, which records the maximum predicted ice table depth (Lapalme et al., 2017). Therefore, we suggest the 10Be reduction between the sediments above and below 0.65 m represents a paleosublimation unconformity which probably formed when the active layer was thicker than at present. However, we cannot rule out that the fluctuation of the present-day active layer depth through summer months could represent annual variability in the active layer, although the lack of active layer thickness exceeding > 50 cm depth in low-elevation McMurdo Dry Valleys locations (Bockheim et al., 2007) suggests this is unlikely in Pearse Valley, which is further inland and at higher elevation. Gravimetric water content is relatively high in near-surface permafrost in the McMurdo Dry Valleys (Lacelle et al., 2022), and water content in permafrost influences the susceptibility of cryoturbation. Our depth profile model indicates that the upper section of the Pearse Valley permafrost sediments (< 1.65 m) was likely deposited at 180 ka, which does not contradict the exposure ages of the thin, patchy drift (∼ 65–74 ka). Our measured nuclide concentrations at > 2.09 m depth largely differ from the upper section and do not fit the simulated depth profile constrained between 0.02 and 1.65 m depth (Fig. 8). The increase in nuclide concentrations at > 2.09 m depth relative to the samples between 1.09–1.65 m depth, alongside the presence of several small ice lenses between 1.57–1.87 m depth, suggests these sediments were deposited during an earlier depositional event before ∼ 180 ka. If the lower set of ice lenses (1.57–1.87 m depth) represents the bottom of a paleoactive layer, this would imply ∼ 0.5–0.8 m of erosion prior to the most recent episode of sediment deposition above 1.65 m. The sedimentology of the core lacks evidence to suggest if this scenario is plausible or not. The attenuating depth profile (> 0.65 m depth) shows that sediments in Pearse Valley have not been vertically mixed since MIS 5, but surface mixing has occurred to at least 0.65 m depth in the last ∼ 74 kyr.
There are several complications regarding modelling the permafrost depth profiles that limit the reliability in calculating deposition age and surface erosion rates. Firstly, Pearse Valley is episodically covered by ice from Taylor Glacier advances. During periods of ice cover, vertical mixing does not occur. Secondly, using a mean concentration for the measured samples in the surface mixed layer (0.02–0.65 m depth) is equivalent to assuming the mean value can represent a constant well-mixed layer. We acknowledge using a mixing model (e.g. Knudsen et al., 2019; Lal and Chen, 2005) for the depth profile data would allow an alternate approach and may provide an improved fit, among many possible scenarios. However, given the complexity of these data and uncertainty of ice cover by Taylor Glacier, which cannot be incorporated in other mixing models, simply using the mean concentration within the upper 0.65 m is a reasonable approximation.
5.2 Exposure–burial history of sediments in Pearse Valley and lower Wright Valley
While nuclide depth profiles indicate the most recent depositional history of the permafrost sediment, ratio data provide an additional insight regarding the total history of the sediment. When is plotted against 10Be concentration on a two-isotope diagram (Fig. 12), a minimum total exposure–burial period can be inferred on the assumption that the sample experienced only one cycle of continuous exposure followed by continuous deep burial. At the Pearse Valley site, the two-isotope plot indicates that all sediments, regardless of their depth, have ratios ranging from 3.97 to 4.53, resulting in a minimum ∼ 800 kyr simple exposure (at zero erosion) and minimum ∼ 400 kyr burial, with a total exposure–burial history of at least 1.2 Myr. At the lower Wright Valley site, ratios for all samples range from 4.70 to 5.58, resulting in a minimum ∼ 900 kyr simple exposure and minimum ∼ 300 kyr burial, with a total exposure–burial history of at least 1.2 Myr. These exposure–burial histories from the two-isotope plots for the depth profiles of Pearse and lower Wright valleys assume that the surface production rate at each of the core elevations represents a minimum value.
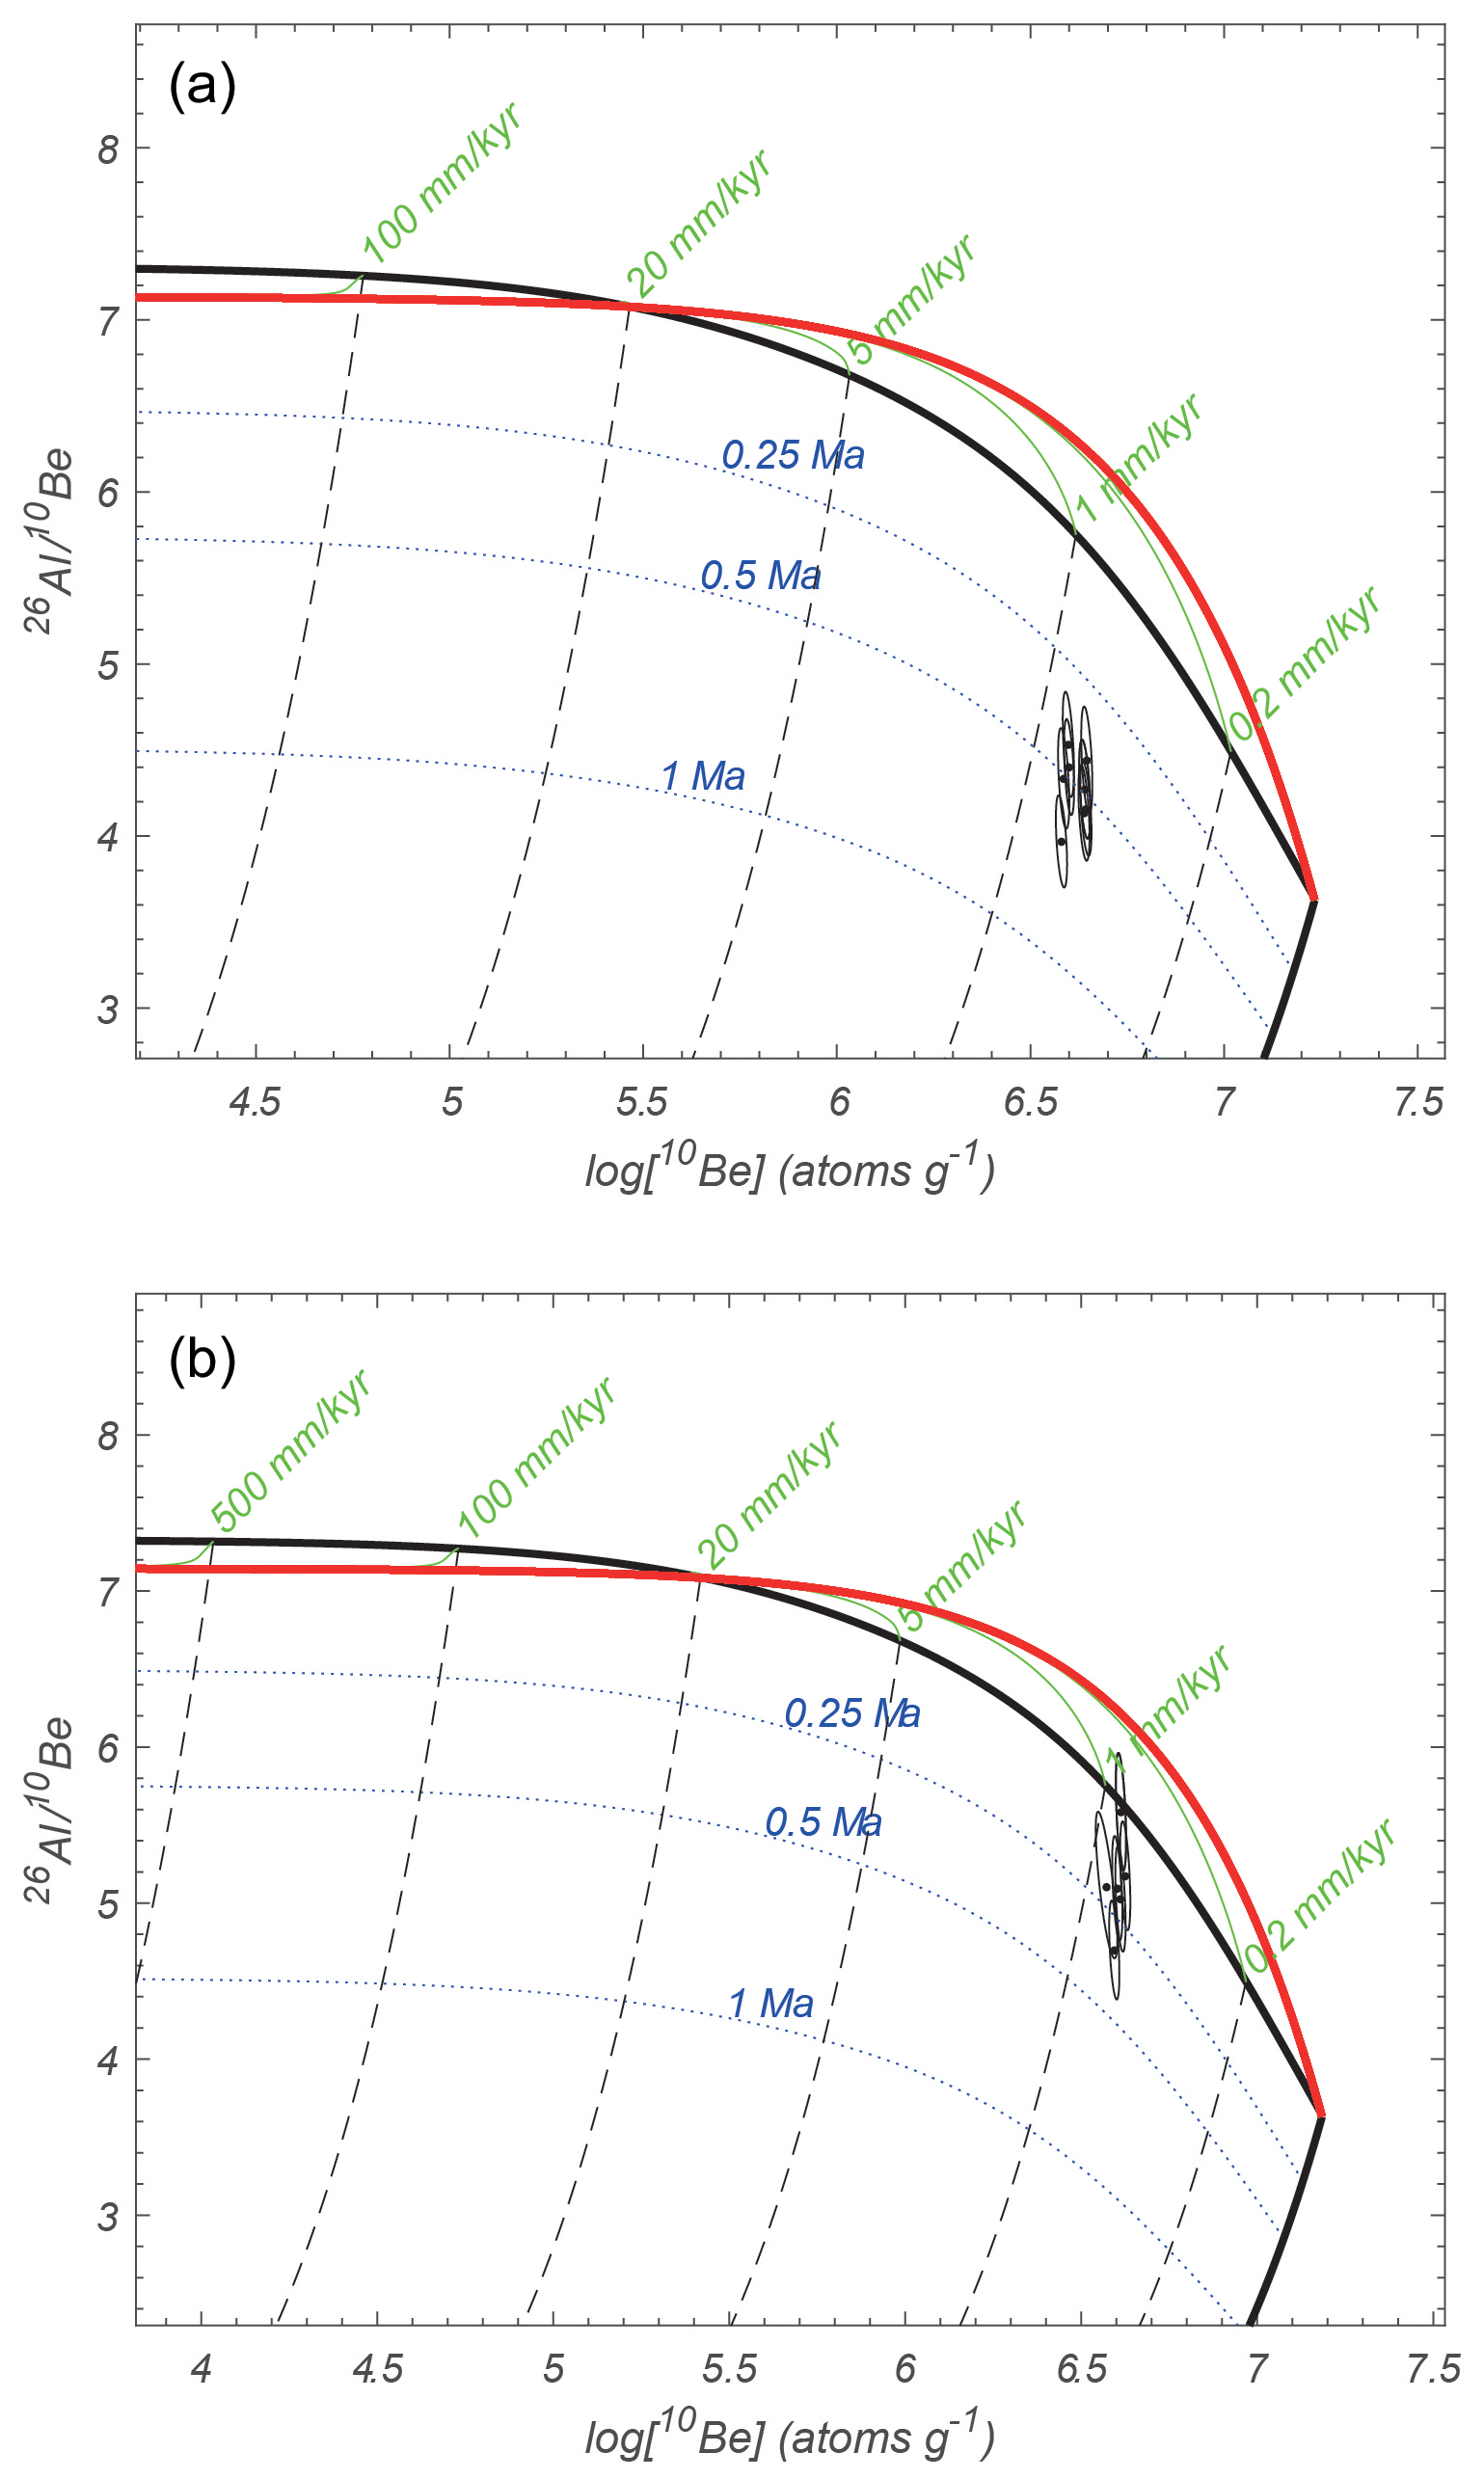
Figure 12Two-isotope plot of Pearse Valley (a) and lower Wright Valley (b) depth profiles using the time-dependent LSDn scaling scheme of Lifton et al. (2014) and the primary default calibration data set of Borchers et al. (2016). Measured nuclide concentrations are shown with 1σ uncertainties. Burial isochrons (dotted lines), decay trajectories (dashed), the exposure–erosion region (bounded by black and red lines), and steady-state erosion loci (green) are shown. The exposure–erosion regions are produced using the surface production rates of 8.40 atoms g−1 yr−1 for Pearse Valley and 7.47 atoms g−1 yr−1 for lower Wright Valley.
Depth profile modelling of near-surface sediments at both permafrost core sites represents the most recent phase of their depositional histories. Pearse Valley permafrost sediments were emplaced at ∼ 180 ka, using a best-fit surface erosion rate of 0.24 cm kyr−1. For lower Wright Valley, where 10Be and 26Al concentrations do not attenuate, depth profile modelling is not useful in determining age. Instead, we estimate a maximum deposition age of < 25 ka. This age represents the time required to change 10Be and 26Al above the initial inheritance level for near-surface samples by 5 % – a change outside AMS 10Be and 26Al measurement error. However, our ratios at both sites suggest that these sediments have much longer total exposure–burial histories of at least 1.2 Myr, which most likely involves multiple recycling episodes of exposure, deposition, burial, and deflation prior to deposition at their current locations. Million-year exposure–burial recycling periods of sediments in the McMurdo Dry Valleys was also observed in shallow (< 1 m) pits from the Packard Dune fields in Victoria Valley (Fink et al., 2015).
In summary, Pearse Valley sediments are old, have a complex exposure–burial history > 1.2 Myr, were recently deposited at ∼ 180 ka, and their shallow surface sediments (< 0.65 m depth) were subject to active layer mixing. Lower Wright Valley sediments are equally old, with a similar exposure–burial history, but were deposited and mixed after the LGM.
5.3 Fluctuations of Taylor Glacier in Pearse Valley during MIS 5
Thin, patchy drift in Pearse Valley is a discontinuous peppering of boulders and cobbles superimposed on older loose sandy sediments, reworked clasts, and underlying permafrost sediments (Fig. 6). Exposure ages of surface cobbles perched on large boulders confirm that this thin, patchy drift was deposited by a retreating cold-based Taylor Glacier during MIS 5a and the MIS 5–4 transition on the northern valley floor of central Pearse Valley, whereas the underlying permafrost sediments were deposited at ∼ 180 ka or earlier.
Our surface cobble geochronology is in agreement with the minimum ages for the extent of proglacial Lake Bonney, which suggests the retreat of Taylor Glacier following MIS 5c and 5a advance (Fig. 13; Higgins et al., 2000a), and the tentatively dated western section of the rock glacier derived from δ18O in buried ice in northern Pearse Valley (Swanger et al., 2019). These data suggest Pearse Valley was largely or partially glaciated throughout MIS 5c and 5a.
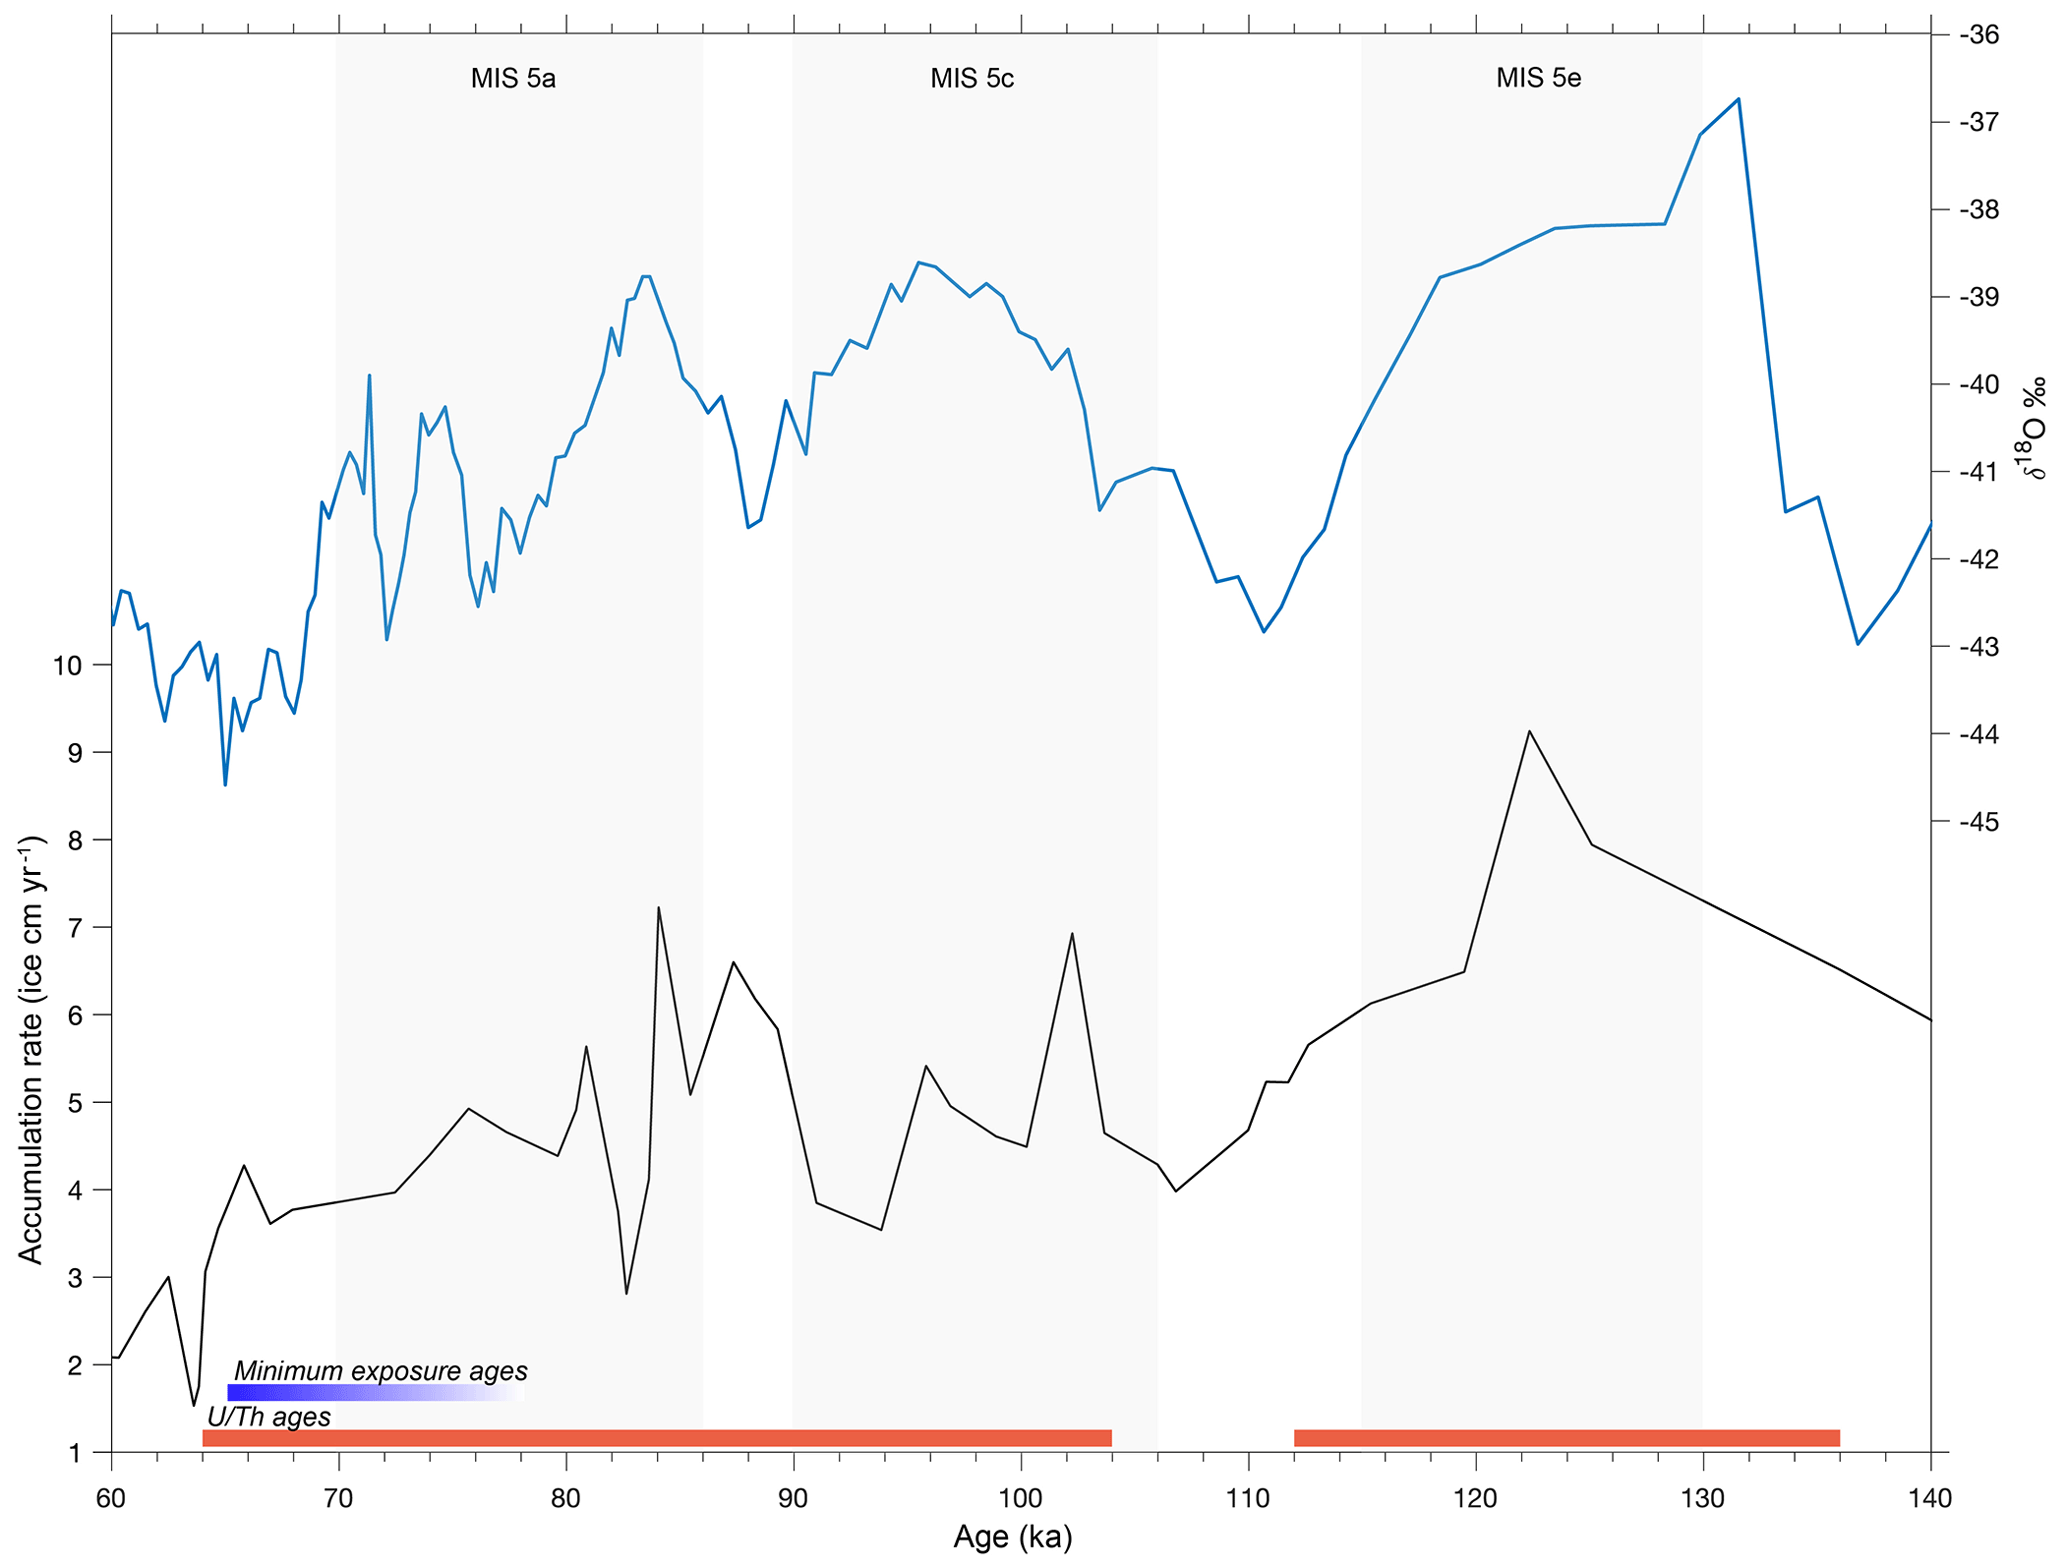
Figure 13Snow accumulation rate (ice cm yr−1) determined from 10Be and δ18O record from Taylor Dome during MIS 5 (Steig et al., 2000). ages from algal carbonates (red bands; Higgins et al., 2000a) coincide with warm MIS substages 5e, 5c, and 5a with increased accumulation rates at Taylor Dome. This is consistent with our minimum exposure ages (blue band) which show the retreat of Taylor Glacier in Pearse Valley during MIS 5a and the MIS 5–4 transition.
Retreat of the Taylor Glacier lobe in Pearse Valley possibly continued after 65 ka. The timing of retreat after 65 ka, until the Last Glacial Maximum when Taylor Glacier was at a minimum position, remains unknown. Advance and retreat cycles during MIS 5 and the final retreat of Taylor Glacier during MIS 5a and the period between the MIS 5–4 transition could be better constrained by exposure dating a larger suite of drift deposits from Pearse Valley.
5.4 Advance and retreat of outlet and alpine glaciers during interglacial periods
Our new data have implications regarding the relationship between outlet and alpine glacier behaviour, regional paleoclimate, and the extent of sea ice and open-ocean conditions in the Ross Sea. Snow accumulation rate, atmospheric temperature, and duration of precipitation appear to be the major controls governing the advance and retreat of Taylor Glacier during previous warm intervals (Fig. 13). In central Taylor Valley, substage 5a and 5c sediments bury 5e sediments, suggesting Taylor Glacier responds to regional changes over millennial timescales (Higgins et al., 2000a). The Taylor Glacier advances in central Taylor Valley during substages 5e, 5c, and 5a correspond with increased accumulation in Taylor Dome (Higgins et al., 2000a; Steig et al., 2000). Our exposure ages indicate that the retreat of Taylor Glacier in Pearse Valley occurred at ∼ 65–74 ka during the MIS 5–4 transition and is consistent with the retreat in central Taylor Valley. The presence of a lobe of Taylor Glacier in Pearse Valley throughout MIS 5 is likely linked to prolonged interglacial climate conditions. The interglacial-mode climate, where austral westerlies are in a poleward-shifted position for prolonged periods during MIS 5, is associated with periods where CO2 concentrations were above ∼ 230 ppm, the glacial–interglacial CO2 threshold proposed by Denton et al. (2021).
Yan et al. (2021) suggested that peak accumulation rates occurred at ∼ 128 ka in southern Victoria Land and are associated with reduced sea ice and possibly retreat of the Ross Ice Shelf. The study suggested that by ∼ 125 ka the Ross Ice Shelf had returned to a configuration comparable to the present day. However, a reduction in sea ice may have enabled increased moisture delivery over Taylor Dome during MIS 5c and 5a. As Higgins et al. (2000a) suggested, increased precipitation over Taylor Dome during MIS 5a and 5c appears to have caused a subsequent readvance of Taylor Glacier. We acknowledge that this hypothesis is speculative and requires further testing of temperature and atmospheric circulation in response to reduced sea ice extent and perhaps a reduction in the Ross Ice Shelf by climate models.
We applied cosmogenic nuclide analysis to ∼ 3 m permafrost depth profiles in the Pearse and lower Wright valleys of the McMurdo Dry Valleys to determine their age of deposition, permafrost processes, and landscape evolution. Additionally, cosmogenic surface exposure dating of surface cobbles perched on large boulders in Pearse Valley provides reliable ages for the Taylor 2 Drift. Paired 10Be and 26Al depth profiles in Pearse Valley show a mixed layer in the upper ∼ 0.65 m of sediment since ∼ 74 ka, and depth profile modelling for near-surface permafrost deposits to 1.65 m depth reveals a deposition age of 180 ka that predates MIS 5. The sharp reduction in 10Be concentrations at ∼ 0.65 m depth and the presence of increased ice content reveal a paleosublimation unconformity and suggest that these upper sediments have undergone active layer cryoturbation. The near-surface sediment (including the surface mixed layer at 0.02–0.65 m and permafrost at 0.65–1.65 m depth) in central Pearse Valley was deposited at ∼ 180 ka based on our depth profile model, whereas at > 2.09 m depth the depositional age of the sediment must be earlier than ∼ 180 ka. To compare processes of sediment evolution in Pearse Valley with a lower elevation and more coastal environment, we also applied 10Be and 26Al nuclide analysis to permafrost depth profiles in lower Wright Valley. While the current deposition at the latter site occurred more recently (< 25 ka), total exposure–burial histories from the two sites consistently show these sediment repositories have experienced multiple glacial–interglacial cycles achieved through the recycling of sediments for at least 1.2 Myr. Our 10Be- and 26Al-derived surface exposure ages from cobbles emplaced on large boulders embedded in the valley floor of Pearse Valley located ∼ 3 km from Taylor Glacier lobe give a minimum zero-erosion age of ∼ 65 to 74 ka for deposition of the thin, patchy drift, indicating that Taylor Glacier retreated from Pearse Valley during the MIS 5–4 transition. These data support antiphase behaviour between outlet and alpine glaciers in the McMurdo Dry Valleys region and ice extent in the Ross Sea and suggest a causal mechanism where cold-based glacier advance and retreat is controlled by moisture availability and drying, respectively, due to ice retreat and expansion in the Ross Sea. Our work is consistent with geochronology from central Taylor Valley, supporting advance and retreat cycles of Taylor Glacier during MIS substages 5c and 5a (Higgins et al., 2000a), corresponding with increased accumulation at Taylor Dome (Steig et al., 2000).
The code used for depth profile modelling is available by request from the corresponding author.
All data described in the paper are included in the Supplement.
The supplement related to this article is available online at: https://doi.org/10.5194/tc-17-4917-2023-supplement.
JTHA, GSW, AA, and ND conducted the fieldwork and sample collection. JTHA did the sample preparation. DF and TF conducted the AMS measurements and analysis with assistance from KW. AJH and JTHA developed the depth profile models. JTHA prepared the manuscript with contributions from all authors.
The contact author has declared that none of the authors has any competing interests.
Publisher’s note: Copernicus Publications remains neutral with regard to jurisdictional claims made in the text, published maps, institutional affiliations, or any other geographical representation in this paper. While Copernicus Publications makes every effort to include appropriate place names, the final responsibility lies with the authors.
We thank Craig Cary, Ian McDonald, Bob Dagg, and Steph Lambie for assistance in the field; Antarctica New Zealand and Southern Lakes Helicopters for logistical support; and Steve Kotevski for laboratory assistance. We thank Jane Andersen and Greg Balco for their valuable reviews which improved the quality of the paper.
This research was supported by NZARI (RFP 2014-1), ANSTO Portal grants 12215 and 12260, and an AINSE Postgraduate Research Award. Jacob T. H. Anderson was supported by a Sir Robin Irvine Scholarship and a University of Otago departmental award. Andrey Abramov and Nikita Demidov were partially supported by the Russian Antarctic Expedition. We acknowledge the financial support from the Australian Government for the Centre for Accelerator Science at ANSTO through the National Collaborative Research Infrastructure Strategy (NCRIS). This research was prepared in part by LLNL under contract DE-AC52-07NA27344 and LDRD grant 19-LW-036. This is LLNL-JRNL-842669.
This research has been supported by the New Zealand Antarctic Research Institute (grant no. RFP 2014-1), the Australian Nuclear Science and Technology Organisation (grant nos. 12215 and 12260), and the Lawrence Livermore National Laboratory (grant no. 19-LW-036).
This paper was edited by Florence Colleoni and reviewed by Jane Lund Andersen and Greg Balco.
Adriaenssens, E. M., Kramer, R., Goethem, M. W. Van, Makhalanyane, T. P., Hogg, I., and Cowan, D. A.: Environmental drivers of viral community composition in Antarctic soils identified by viromics, Microbiome, 5, 1–14, https://doi.org/10.1186/s40168-017-0301-7, 2017.,
Anderson, R. S., Repka, J. L., and Dick, G. S.: Explicit treatment of inhieritance in dating depositional surfaces using in situ 10Be and 26Al, Geology, 24, 47–51, https://doi.org/10.1130/0091-7613(1996)024<0047:ETOIID>2.3.CO;2, 1996.
Atkins, C.: Geomorphological evidence of cold-based glacier activity in South Victoria Land, Antarctica. Geological Society, London, Special Publications, https://doi.org/10.1144/SP381.18, 2013.
Balco, G, Stone, J. O., Lifton, N. A., and Dunai, T. J.: A complete and easily accessible means of calculating surface exposure ages or erosion rates from 10Be and 26Al measurements, Quaternary Geochronol., 3, 174–195, https://doi.org/10.1016/j.quageo.2007.12.001, 2008.
Balco, G.: Production rate calculations for cosmic-ray-muon-produced 10Be and 26Al benchmarked against geological calibration data, Quaternary Geochronol., 39, 150–173, https://doi.org/10.1016/j.quageo.2017.02.001, 2017.
Bergelin, M., Putkonen, J., Balco, G., Morgan, D., Corbett, L. B., and Bierman, P. R.: Cosmogenic nuclide dating of two stacked ice masses: Ong Valley, Antarctica, The Cryosphere, 16, 2793–2817, https://doi.org/10.5194/tc-16-2793-2022, 2022.
Bibby, T., Putkonen, J., Morgan, D., Balco, G., and Shuster, D. L.: Million year old ice found under meter thick debris layer in Antarctica, Geophys. Res. Lett., 43, 6995–7001, https://doi.org/10.1002/2016GL069889, 2016.
Blackburn, T., Edwards, G. H., Tulaczyk, S., Scudder, M., Piccione, G., Hallet, B., McLean, N., Zachos, J. C., Cheney, B., and Babbe, J. T.: Ice retreat in Wilkes Basin of East Antarctica during a warm interglacial, Nature, 583, 554–559, https://doi.org/10.1038/s41586-020-2484-5, 2020.
Bockheim, J. G., Campbell, I. B., and McCleod, M.: Permafrost Distribution and Active-Layer Depths in the McMurdo Dry Valleys, Antarctica, Permafrost Periglac. Process., 18, 217–227. https://doi.org/10.1002/ppp.588, 2007.
Bockheim, J. G., Prentice, M. L., and Mcleod, M.: Distribution of Glacial Deposits, Soils, and Permafrost in Taylor Valley, Antarctica, Arct. Antarct. Alpine Res., 40, 279–286, https://doi.org/10.1657/1523-0430(06-057), 2008.
Borchers, B., Marrero, S., Balco, G., Caffee, M., Goehring, B., Lifton, N., Nishiizumi, K., Phillips, F., Schaefer, J., and Stone, J.: Geological calibration of spallation production rates in the CRONUS-Earth project, Quaternary Geochronol., 31, 188–198, https://doi.org/10.1016/j.quageo.2015.01.009, 2016.
Brook, E. J., Kurz, M. D., Ackert, R. P., Denton, G. H., Brown, E. T., Raisbeck, G. M., and Yiou, F.: Chronology of Taylor Glacier advances in Arena Valley, Antarctica, using in situ cosmogenic 3He and 10Be, Quarternary Res., 39, 11–23, https://doi.org/10.1006/qres.1993.1002, 1993.
Child, D., Elliott, G., Mifsud, C., Smith, A. M., and Fink, D.: Sample processing for earth science studies at ANTARES, Nucl. Instrum. Meth. B, 172, 856–860, https://doi.org/10.1016/S0168-583X(00)00198-1, 2000.
Chorley, H., Levy, R., Naish, T., Lewis, A., Cox, S., Hemming, S., Ohneiser C, Gorman A, Harper M, Homes A, Hopkins J., Prebble, J., Verret, M., Dickinson, W., Florindo, F., Golledge, N., Halberstadt, A. R., Kowalewski, D., McKay, R., Meyers, S., Anderson, J., Dagg, B., and Lurcock, P.: East Antarctic Ice Sheet variability during the middle Miocene Climate Transition captured in drill cores from the Friis Hills, Transantarctic Mountains, GSA Bull., 135, 1503–1529, https://doi.org/10.1130/B36531.1, 2023.
Cook, C. P., van de Flierdt, T., Williams, T., Hemming, S. R., Iwai, M., Kobayashi, M., Jimenez-Espejo, F. J., Escutia, C., Gonzále, J. J., Khim, B.-K., McKay, R. M., Passchier, S., Bohaty, S. M., Riesselman, C. R., Tauxe, L., Sugisaki, S., Galindo, A. L., Patterson, M. O., Sangiorgi, F., Pierce, E. L., Brinkhuis, H., Klaus, A., Fehr, A., Bendle, J. A. P., Bijl, P. K., Carr, S. A., Dunbar, R. B., Flores, J. A., Hayden, T. G., Katsuki, K., Kong, G. S., Nakai, M., Olney, M. P., Pekar, S. F., Pross, J., Röhl, U., Sakai, T., Shrivastava, P. K., Stickley, C. E., Tuo, S., Welsh, K., and Yamane, M.: Dynamic behaviour of the East Antarctic ice sheet during Pliocene warmth, Nat. Geosci., 6, 765–769, https://doi.org/10.1038/ngeo1889, 2013.
Cox, S. C., Turnbull, I. M., Isaac, M. J., Townsend, D. B., and Smith Lyttle, B.: Geology of Southern Victoria Land, Antarctica. Institute of geological & Nuclear Sciences 1:25,000 geological map 22, 135 p., +1 folded map, Lower Hutt, New Zealand, GNS Science, ISBN 9780478198393, 2012.
Davis, T. N.: Permafrost: A Guide to Frozen Ground in Transition. Fairbanks, AK: University of Alaska Press. 351 pp. ISBN 1-889963-19-4, J. Glaciol., 48, 478–478, https://doi.org/10.3189/172756502781831223, 2001.
DeConto, R. M. and Pollard, D.: Contribution of Antarctica to past and future sea-level rise, Nature, 531, 591–597, https://doi.org/10.1038/nature17145, 2016.
Denton, G. H., Armstrong R. L., and Stuiver, M.: Late Cenozoic Glaciation in Antarctica: The Record in the McMurdo Sound Region, Antarct. J. United States, 5, 15–21, 1970.
Denton, G. H., Putnam, A. E., Russell, J. L., Barrell, D. J. A., Schaefer, J. M., Kaplan, M. R., and Strand, P. D.: The Zealandia Switch: Ice age climate shifts viewed from Southern Hemisphere moraines, Quaternary Sci. Rev., 257, 106771, https://doi.org/10.1016/j.quascirev.2020.106771, 2021.
Doran, P. T., McKay, C. P., Clow, G. D., Dana, G. L., Fountain, A. G., Nylen, T., and Lyons, W. B.: Valley floor climate observations from the McMurdo dry valleys, Antarctica, 1986-2000, J. Geophys. Res.-Atmos., 107, ACL 13-1–ACL 13-12, https://doi.org/10.1029/2001JD002045, 2002.
Dutton, A., Carlson, A. E., Long, A. J., Milne, G. A., Clark, P. U., DeConto, R., Horton, B., Rahmstorf, S., and Raymo, M. E.: Sea-level rise due to polar ice-sheet mass loss during past warm periods, Science, 349, 6244, https://doi.org/10.1126/science.aaa4019, 2015.
Dutton, A. and Lambeck, K.: Ice volume and sea level during the last interglacial, Science, 337, 216–219, https://doi.org/10.1126/science.1205749, 2012.
Fink, D., Augustinus, P., Rhodes, E., Bristow, C., and Balco, G.: 21Ne, 10Be and 26Al cosmogenic burial ages of near-surface eolian sand from the Packard Dune field, McMurdo Dry Valleys, Antarctica, EGU General Assembly Vol. 17. 2015EGUGA..17.2922F, 2015.
Fischer, H., Meissner, K. J., Mix, A. C., Abram, N. J., Austermann, J., Brovkin, V., Capron, E., Colombaroli, D., Daniau, A.-L., Dyez, K. A., Felis, T., Finkelstein, S. A., Jaccard, S. L., McClymont, E. L., Rovere, A., Sutter, J., Wolff, E. W., Affolter, S., Bakker, P., Ballesteros-Cánovas, J. A., Barbante, C., Caley, T., Carlson, A. E., Churakova, O., Cortese, G., Cumming, B. F., Davis, B. A. S., de Vernal, A., Emile-Geay, J., Fritz, S. C., Gierz, P., Gottschalk, J., Holloway, M. D., Joos, F., Kucera, M., Loutre, M.-F., Lunt, D. J., Marcisz, K., Marlon, J. R., Martinez, P., Masson-Delmotte, V., Nehrbass-Ahles, C., Otto-Bliesner, B. L., Raible, C. C., Risebrobakken, B., Sánchez Goñi, M. F., Arrigo, J. S., Sarnthein, M., Sjolte, J., Stocker, T. F., Velasquez Alvárez, P. A., Tinner, W., Valdes, P. J., Vogel, H., Wanner, H., Yan, Q., Yu, Z., Ziegler, M., and Zhou, L.: Palaeoclimate constraints on the impact of 2 ∘C anthropogenic warming and beyond, Nat. Geosci., 11, 474–485, https://doi.org/10.1038/s41561-018-0146-0, 2018.
Fountain, A. G., Nylen, T. H., Monaghan, A., Basagic, H. J., and Bromwich, D.: Snow in the McMurdo Dry Valleys, Antarctica, Int. J. Climatol., 30, 633–642. https://doi.org/10.1002/joc.1933, 2010.
Fountain, A. G., Fernandez-Diaz, J. C., Obryk, M., Levy, J., Gooseff, M., Van Horn, D. J., Morin, P., and Shrestha, R.: High-resolution elevation mapping of the McMurdo Dry Valleys, Antarctica, and surrounding regions, Earth Syst. Sci. Data, 9, 435–443, https://doi.org/10.5194/essd-9-435-2017, 2017.
French, H. M.: The periglacial environment. Wiley-Blackwell (4th Ed.), John Wiley & Sons, ISBN 978-1-119-13278-3, 544 pp., 2017.
Granger, D. E. and Riebe, C. S.: 7.12 – Cosmogenic Nuclides in Weathering and Erosion, Treatise on Geochemistry (Second Edition), edited by: Holland, H. D. and Turekian, K. K., Elsevier, 401–436, https://doi.org/10.1016/B978-0-08-095975-7.00514-3, 2014.
Gilichinsky, D. A., Wilson, G. S., Friedmann, E. I., McKay, C. P., Sletten, R. S., Rivkina, E. M., Vishnivetskaya, T. A., Erokhina, L. G., Ivanushkina, N. E., Kochkina, G. A., Shcherbakova, V. A., Soina, V. S., Spirina, E. V., Vorobyova, E. A., Fyodorov-Davydov, D. G., Hallet, B., Ozerskaya, S. M., Sorokovikov, V. A., Laurinavichyus, K. S., Shatilovich, A. V., Chanton, J. P., Ostroumov, V. E, and Tiedje, J. M.: Microbial populations in Antarctic permafrost: Biodiversity, stage, age, and implication for astrobiology, Astrobiology, 7, 275–311, https://doi.org/10.1089/ast.2006.0012, 2007.
Golledge, N. R., Clark, P. U., He, F., Dutton, A., Turney, C. S. M., Fogwill, C. J., Naish, T. R., Levy, R. H., McKay, R. M., Lowry, D. P., Bertler, N. A., Dunbar, G. B., and Carlson, A. E.: Retreat of the Antarctic Ice Sheet During the Last Interglaciation and Implications for Future Change, Geophys. Res. Lett., 48, 1–11, https://doi.org/10.1029/2021GL094513, 2021.
Gunn, B. M. and Warren, G.: Geology of Victoria Land between the Mawson and Mulock Glaciers, Antarctica, New Zealand Dept. of Scientific and Industrial Research, Geological Survey Bulletin, 71, 1962.
Hall, B. L., Denton, G. H., and Overturf, B.: Glacial Lake Wright, a high-level Antarctic lake during the LGM and early Holocene, Antarctic Sci., 13, 53–60, https://doi.org/10.1017/S0954102001000086, 2001.
Hall, B. L. and Denton, G. H.: Surficial geology and geomorphology of eastern and central Wright Valley, Antarctica, Geomorphology, 64, 25–65, https://doi.org/10.1016/j.geomorph.2004.05.002, 2005.
Heldmann, J. L., Marinova, M., Williams, K. E., Lacelle, D., McKay, C. P., Davila, A., Pollard, W., and Andersen, D. T.: Formation and evolution of buried snowpack deposits in Pearse Valley, Antarctica, and implications for Mars, Antarctic Sci., 24, 299–316, https://doi.org/10.1017/S0954102011000903, 2012.
Hidy, A. J., Gosse, J. C., Pederson, J. L., Mattern, J. P., and Finkel, R. C.: A geologically constrained Monte Carlo approach to modeling exposure ages from profiles of cosmogenic nuclides: An example from Lees Ferry, Arizona, Geochem. Geophys. Geosyst., 11, 9, https://doi.org/10.1029/2010GC003084, 2010.
Hidy, A. J., Gosse, J. C., Sanborn, P., and Froese, D. G.: Age-erosion constraints on an Early Pleistocene paleosol in Yukon, Canada, with profiles of 10Be and 26Al: Evidence for a significant loess cover effect on cosmogenic nuclide production rates, Catena, 165, 260–271, https://doi.org/10.1016/j.catena.2018.02.009, 2018.
Higgins, S. M., Denton, G. H., and Hendy, C. H.: Glacial Geomorphology of Bonney Drift, Taylor Valley, Antarctica, Geografiska Ann. A, 82A, 365–389, https://doi.org/10.1111/1468-0459.00129, 2000b.
Higgins, S. M., Hendy, C. H., and Denton, G. H.: Geochronology of Bonney Drift, Taylor Valley, Antarctica: Evidence for interglacial expansions of Taylor Glacier, Geografiska Ann. A, 82, 391–409, https://doi.org/10.1111/j.0435-3676.2000.00130.x, 2000a.
Hrbáèek, F., Oliva, M., Hansen, C., Balks, M., O'Neill, T. A., de Pablo, M. A., Ponti, S., Ramos, M., Vieira, G., Abramov, A., Pastíriková, L. K., Guglielmin, M., Goyanes, G., Francelino, M. R., Schaefer, C., and Lacelle, D.: Active layer and permafrost thermal regimes in the ice-free areas of Antarctica, Earth-Sci. Rev., 242, 104458, https://doi.org/10.1016/j.earscirev.2023.104458, 2023.
IPCC.: Climate Change 2021: The Physical Science Basis. Contribution of Working Group 1 to Sixth Assessment Report of the Intergovernmental Panel on Climate Change, Cambridge University Press, Cambridge, United Kingdom and New York, NY, USA, 2391 pp. https://doi.org/10.1017/9781009157896, 2021.
Jouzel, J., Masson-Delmotte, V., Cattani, O., Dreyfus, G., Falourd, S., Hoffmann, G., Minster, B., Nouet, J., Barnola, J. M., Chappellaz, J., Fischer, H., Gallet, J. C., Johnsen, S., Leuenberger, M., Loulergue, L., Luethi, D., Oerter, H., Parrenin, F., Raisbeck, G., Raynaud, D., Schilt, A., Schwander, J., Selmo, E., Souchez, R., Spahni, R., Stauffer, B., Steffensen, J. P., Stenni, B., Stocker, T. F., Tison, J. L., Werner, M., and Wolff, E. W.: Orbital and millennial Antarctic climate variability over the past 800,000 years, Science, 317, 793–796, https://doi.org/10.1126/science.1141038, 2007.
Joy, K., Fink, D., Storey, B., De Pascale, G. P., Quigley, M., and Fujioka, T.: Cosmogenic evidence for limited local LGM glacial expansion, Denton Hills, Antarctica, Quaternary Sci. Rev., 178, 89–101, https://doi.org/10.1016/j.quascirev.2017.11.002, 2017.
Knudsen, M. F., Egholm, D. L., and Jansen, J. D.: Quaternary Geochronology Time-integrating cosmogenic nuclide inventories under the influence of variable erosion , exposure , and sediment mixing, Quaternary Geochronol., 51, 110–119, https://doi.org/10.1016/j.quageo.2019.02.005, 2019.
Kopp, R. E., Simons, F. J., Mitrovica, J. X., Maloof, A. C., and Oppenheimer, M.: Probabilistic assessment of sea level during the last interglacial stage, Nature, 462, 863–867, https://doi.org/10.1038/nature08686, 2009.
Lacelle, D., Fisher, D. A., Verret, M., and Pollard, W.: Improved prediction of the vertical distribution of ground ice in Arctic-Antarctic permafrost sediments, Commun. Earth Environ., 3, p. 31, https://doi.org/10.1038/s43247-022-00367-z, 2022.
Lal, D. and Chen, J.: Cosmic ray labeling of erosion surfaces II: Special cases of exposure histories of boulders, soils and beach terraces, Earth Planet. Sci. Lett., 236, 797–813, https://doi.org/10.1016/j.epsl.2005.05.025, 2005.
Lapalme, C. M., Lacelle, D., Pollard, W., Fortier, D., Davila, A., and McKay, C. P.: Cryostratigraphy and the Sublimation Unconformity in Permafrost from an Ultraxerous Environment, University Valley, McMurdo Dry Valleys of Antarctica, Permafrost Periglacial Process., 28, 649–662, https://doi.org/10.1002/ppp.1948, 2017.
Lee, J. E., Brook, E. J., Bertler, N. A. N., Buizert, C., Baisden, T., Blunier, T., Ciobanu, V. G., Conway, H., Dahl-Jensen, D., Fudge, T. J., Hindmarsh, R., Keller, E. D., Parrenin, F., Severinghaus, J. P., Vallelonga, P., Waddington, E. D., and Winstrup, M.: An 83 000-year-old ice core from Roosevelt Island, Ross Sea, Antarctica, Clim. Past, 16, 1691–1713, https://doi.org/10.5194/cp-16-1691-2020, 2020.
Lewis, A. R. and Ashworth, A. C.: An early to middle Miocene record of ice-sheet and landscape evolution from the Friis Hills, Antarctica, Geol. Soc. Am. Bull., 128, 719–738, https://doi.org/10.1130/b31319.1, 2016.
Lifton, N., Sato, T., and Dunai, T. J.: Scaling in situ cosmogenic nuclide production rates using analytical approximations to atmospheric cosmic-ray fluxes, Earth Planet. Sci. Lett., 386, 149–160. https://doi.org/10.1016/j.epsl.2013.10.052, 2014.
Marchant, D. R., Denton, G. H., Bockheim, J. G., Wilson, S. C., and Kerr, A. R.: Quaternary changes in level of the upper Taylor Glacier, Antarctica: implications for paleoclimate and East Antarctic Ice Sheet dynamics, Boreas, 23, 29–43, https://doi.org/10.1111/j.1502-3885.1994.tb00583.x, 1994.
Marchant, D. R. and Denton, G. H.: Miocene and Pliocene paleoclimate of the Dry Valleys region, Southern Victoria land: A geomorphological approach, Mar. Micropaleontol., 27, 253–271, https://doi.org/10.1016/0377-8398(95)00065-8, 1996.
Marchant, D. R. and Head, J. W.: Antarctic dry valleys: Microclimate zonation, variable geomorphic processes, and implications for assessing climate change on Mars, Icarus, 192, 187–222, https://doi.org/10.1016/j.icarus.2007.06.018, 2007.
Marchant, D. R., Mackay, S. L., Lamp, J. L., Hayden, A. T., and Head, J. W.: A review of geomorphic processes and landforms in the Dry Valleys of southern Victoria Land: Implications for evaluating climate change and ice-sheet stability, Geol. Soc. Special Pub., 381, 319–352, https://doi.org/10.1144/SP381.10, 2013.
Marrero, S. M., Hein, A. S., Naylor, M., Attal, M., Shanks, R., Winter, K., Woodward, J., Dunning, S., Westoby, M., and Sugden, D.: Controls on subaerial erosion rates in Antarctica, Earth Planet. Sci. Lett., 501, 56–66, https://doi.org/10.1016/j.epsl.2018.08.018, 2018.
Mercader, J., Gosse, J. C., Bennett, T., Hidy, A. J., and Rood, D. H.: Cosmogenic nuclide age constraints on Middle Stone Age lithics from Niassa, Mozambique, Quaternary Sci. Rev., 47, 116–130, https://doi.org/10.1016/j.quascirev.2012.05.018, 2012.
Mifsud, C., Fujioka, T., and Fink, D.: Extraction and purification of quartz in rock using hot phosphoric acid for in situ cosmogenic exposure dating, Nucl. Instrum. Meth. B, 294, 203–207, https://doi.org/10.1016/j.nimb.2012.08.037, 2013.
Morgan, D. J., Putkonen, J., Balco, G., and Stone, J.: Degradation of glacial deposits quantified with cosmogenic nuclides, Quartermain Mountains, Antarctica, Earth Surf. Process. Landf., 36, 217–228, https://doi.org/10.1002/esp.2039, 2011.
Morgan, D., Putkonen, J., Balco, G., and Stone, J.: Quantifying regolith erosion rates with cosmogenic nuclides 10Be and 26Al in the McMurdo Dry Valleys, Antarctica, J. Geophys. Res.-Earth Surf., 115, 1–17, https://doi.org/10.1029/2009JF001443, 2010.
Naish, T., Powell, R., Levy, R., Wilson, G., Scherer, R., Talarico, F., Krissek, L., Niessen, F., Pompilio, M., Wilson, T., Carter, L., DeConto, R., Huybers, P., McKay, R., Pollard, D., Ross, J., Winter, D., Barrett, P., Browne, G., Cody, R., Cowan, E., Crampton, J., Dunbar, G., Dunbar, N., Florindo, F., Gebhardt, C., Graham, I., Hannah, M., Hansaraj, D., Harwood, D., Helling, D., Henrys, S., Hinnov, L., Kuhn, G., Kyle, P., Läufer, A., Maffioli P., Magens, D., Mandernack, K., McIntosh, W., Millan, C., Morin, R., Ohneiser, C., Paulsen, T., Persico, D., Raine, I., Reed, J., Riesselman, C., Sagnotti, L., Schmitt, D., Sjunneskog, C., Strong, P., Taviani, M., Vogel, S., Wilch, T., and Williams, T.: Obliquity-paced Pliocene West Antarctic ice sheet oscillations, Nature, 458, 322–328, https://doi.org/10.1038/nature0786, 2009.
Ng, F., Hallet, B., Sletten, R. S., and Stone, J. O.: Fast-growing till over ancient ice in Beacon Valley, Antarctica, Geology, 33, 121–124, https://doi.org/10.1130/G21064.1, 2005
Nishiizumi, K.: Preparation of 26Al AMS standards, Nucl. Instrum. Meth. B, 223–224, 388–392, https://doi.org/10.1016/j.nimb.2004.04.075, 2004.
Nishiizumi, K., Imamura, M., Caffee, M. W., Southon, J. R., Finkel, R. C., and McAninch, J.: Absolute calibration of 10Be AMS standards, Nucl. Instrum. Meth. B, 258, 403–413, https://doi.org/10.1016/j.nimb.2007.01.297, 2007.
Otto-Bliesner, B. L., Rosenbloom, N., Stone, E. J., Mckay, N. P., Lunt, D. J., Brady, E. C., and Overpeck, J. T.: How warm was the last interglacial? new model-data comparisons, Philos. T. R. Soc. A, 371, 20130097, https://doi.org/10.1098/rsta.2013.0097, 2013.
Patterson, M. O., McKay, R., Naish, T., Escutia, C., Jimenez-Espejo, F. J., Raymo, M. E., Meyers, S. R., Tauxe, L., Brinkhuis, H., and IODP Expedition 318 Scientists.: Orbital forcing of the East Antarctic ice sheet during the Pliocene and Early Pleistocene, Nat. Geosci., 7, 841–847, https://doi.org/10.1038/ngeo2273, 2014.
Pollard, D. and DeConto, R. M.: Modelling West Antarctic ice sheet growth and collapse through the past five million years, Nature, 458, 329–332, https://doi.org/10.1038/nature07809, 2009.
Putkonen, J., Balco, G., and Morgan, D.: Slow regolith degradation without creep determined by cosmogenic nuclide measurements in Arena Valley, Antarctica, Quaternary Res., 69, 242–249, https://doi.org/10.1016/j.yqres.2007.12.004, 2008.
Ruggiero, L., Sciarra, A., Mazzini, A., Florindo, F., Wilson, G., Tartarello, M. C., Mazzoli, C., Anderson, J. T. H., Romano, V., Worthington, R., Bigi, S., Sassi, R., and Ciotoli, G.: Antarctic permafrost degassing in Taylor Valley by extensive soil gas investigation, Sci. Total Environ., 866, 161345, https://doi.org/10.1016/j.scitotenv.2022.161345, 2023.
Salvatore, M. R. and Levy, J. S.: Chapter 11: The McMurdo Dry Valleys of Antarctica: a geological environment and ecological analog to the Martian surface and near surface, Mars Geological Enigmas, Elsevier Inc. 291–332, https://doi.org/10.1016/B978-0-12-820245-6/00011-2, 2021.
Schäfer, J. M., Baur, H., Denton, G. H., Ivy-Ochs, S., Marchant, D. R., Schlüchter, C., and Wieler, R.: The oldest ice on Earth in Beacon Valley, Antarctica: New evidence from surface exposure dating, Earth Planet. Sci. Lett., 179, 91–99, https://doi.org/10.1016/S0012-821X(00)00095-9, 2000.
Steig, E. J., Morse, D. L., Waddington, E. D., Stuiver, M., Pieter, M., Mayewski, P. A., Twickler, M. S., and Whitlow, S. I.: Wisconsinan and Holocene climate history from an ice core at Taylor Dome, western Ross Embayment , Antarctica, Geografis. Ann. A, 82, 213–235, https://doi.org/10.1111/j.0435-3676.2000.00122.x, 2000.
Sugden, D. E., Marchant, D. R., Potter, N., Souchez, R. A., Denton, G. H., Swisher, C. C., and Tison, J. L.: Preservation of Miocene glacier ice in East Antarctica, Nature, 376, 412–414, https://doi.org/10.1038/376412a0, 1995.
Summerfield, M. A., Sugden, D. E., Denton, G. H., Marchant, D. R., Cockburn, H. A. P., and Stuart, F. M.: Cosmogenic isotope data support previous evidence of extremely low rates of denudation in the Dry Valleys region, southern Victoria Land, Antarctica, Geol. Soc. Sp., 162, 255–267, https://doi.org/10.1144/GSL.SP.1999.162.01.20, 1999.
Sutter, J., Eisen, O., Werner, M., Grosfeld, K., Kleiner, T., and Fischer, H.: Limited Retreat of the Wilkes Basin Ice Sheet During the Last Interglacial, Geophys. Res. Lett., 47, 13, https://doi.org/10.1029/2020GL088131, 2020.
Swanger, K. M., Babcock, E., Winsor, K., and Valletta, R. D.: Rock glaciers in Pearse Valley, Antarctica record outlet and alpine glacier advance from MIS 5 through the Holocene, Geomorphology, 336, 40–51, https://doi.org/10.1016/j.geomorph.2019.03.019, 2019.
Swanger, K. M., Lamp, J. L., Winckler, G., Schaefer, J. M., and Marchant, D. R.: Glacier advance during Marine Isotope Stage 11 in the McMurdo Dry Valleys of Antarctica, Sci. Rep., 7, 1–9, https://doi.org/10.1038/srep41433, 2017.
Swanger, K. M., Marchant, D. R., Schaefer, J. M., Winckler, G., and Head, J. W.: Elevated East Antarctic outlet glaciers during warmer-than-present climates in southern Victoria Land, Global Planet. Change, 79, 61–72, https://doi.org/10.1016/j.gloplacha.2011.07.012, 2011.
Turney, C. S. M., Fogwill, C. J., Golledge, N. R., McKay, N. P., van Sebille, E., Jones, R. T., Etheridge, D., Rubino, M., Thornton, D. P., Davies, S. M. and Ramsey, C. B., Thomas, Z. A., Bird, M. I., Munksgaard, N. C., Kohno, M., Woodward, J., Winter, K., Weyrich, L. S., Rootes, C. M., Millman, H., Albert, P. G., Rivera, A., van Ommen, T., Curran, M., Moy, A., Rahmstorf, S., Kawamura, K., Hillenbrand, C.-D., Weber, M. E., Manning, C. J., Young, J., and Cooper, A.: Early Last Interglacial ocean warming drove substantial ice mass loss from Antarctica, P. Natl. Acad. Sci. USA, 117, 3996–4006, https://doi.org/10.1073/pnas.1902469117, 2020.
Wilcken, K. M., Fujioka, T., Fink, D., Fülöp, R. H., Codilean, A. T., Simon, K., Mifsud, C., and Kotevski, S.: SIRIUS Performance: 10Be, 26Al and 36Cl measurements at ANSTO, Nucl. Instrum. Meth. B, 455, 300–304, https://doi.org/10.1016/j.nimb.2019.02.009, 2019.
Wilson, D. J., Bertram, R. A., Needham, E. F., Flierdt, T. Van De, Welsh, K. J., Mckay, R. M., Mazumder, A., Riesselman, C. R., Jimenez-Espejo, F. J., and Escutia, C.: Ice loss from the East Antarctic Ice Sheet during late Pleistocene interglacials, Nature, 561, 383–386, https://doi.org/10.1038/s41586-018-0501-8, 2018.
Yan, Y., Spaulding, N. E., Bender, M. L., Brook, E. J., Higgins, J. A., Kurbatov, A. V., and Mayewski, P. A.: Enhanced moisture delivery into Victoria Land, East Antarctica, during the early Last Interglacial: implications for West Antarctic Ice Sheet stability, Clim. Past, 17, 1841–1855, https://doi.org/10.5194/cp-17-1841-2021, 2021.
Yershov, E. D.: General Geocryology. Studies in Polar Research, edited by: Williams, P. J., Cambridge: Cambridge University Press, https://doi.org/10.1017/CBO9780511564505, 1998.