the Creative Commons Attribution 4.0 License.
the Creative Commons Attribution 4.0 License.
 | 01 Feb 2023
Slowdown of Shirase Glacier, East Antarctica, caused by strengthening alongshore winds
Chris R. Stokes
Adrian Jenkins
Jim R. Jordan
Stewart S. R. Jamieson
G. Hilmar Gudmundsson
Around large parts of West Antarctica and in Wilkes Land, East Antarctica, increased wind-forced intrusions of modified Circumpolar Deep Water (mCDW) onto the continental shelf have been associated with mass loss over the last few decades. Despite considerable seasonal variability, observations in 2018 have also confirmed relatively high basal melt rates of up to 16 m a−1 underneath the Shirase ice tongue in Enderby Land, East Antarctica. These high basal melt rates are also caused by intrusions of mCDW onto the continental shelf, but the catchment of Shirase Glacier has been gaining mass, a trend often attributed to increased precipitation. Here, we document the dynamical ocean-driven slowdown, ice surface thickening and grounding line advance of Shirase Glacier in response to strengthening easterly winds that reduce mCDW inflow and decrease basal melt rates. Our findings are significant because they demonstrate that warm ice shelf cavity regimes are not universally associated with glacier acceleration and mass loss in Antarctica, and they highlight the overlooked role of the impact of easterly winds in the recent mass gain of the Shirase Glacier catchment.
- Article
(7485 KB) - Full-text XML
-
Supplement
(8361 KB) - BibTeX
- EndNote


Shirase Glacier is one of the fastest-flowing outlet glaciers in East Antarctica, reaching speeds in excess of 2200 m a−1 across its grounding line before flowing into Lützow-Holm Bay (Fig. 1). Its annual ice discharge approaches 15 Gt a−1 (Rignot et al., 2019) and it drains a catchment containing 1.2 m of sea level equivalent (Fig. 1, Morlighem et al., 2020). This rapid ice flow speed is associated with vigorous melt underneath its floating tongue, where basal melt rates were observed to vary over the course of the year between 7 and 16 m a−1 in 2018, 16 km downstream of the glacier's grounding line (Hirano et al., 2020). These high melt rates are caused by warm modified Circumpolar Deep Water (mCDW) intruding onto the continental shelf and being transported directly to the glacier via bathymetric troughs (Fig. 1; Moriwaki and Yoshida, 1983; Hirano et al., 2020), a process referred to as Mode 2 melting (Jacobs et al., 1992). Elsewhere in Antarctica, most regions that experience this mode of oceanic melt have been losing mass, e.g. the Amundsen Sea (Jenkins et al., 2018; Mouginot et al., 2014), the Western Antarctic Peninsula (Cook et al., 2016) and Wilkes Land (Rintoul et al., 2016; Greene et al., 2017; Stokes et al., 2022), and hinting that intrusions of mCDW have become more potent over recent decades in these locations. However, mass loss has not been observed in the Shirase Glacier catchment and, between 2003 and 2019, its drainage basin (sometimes referred to as drainage basin 7 in Antarctic-wide studies, e.g. Smith et al., 2020) gained mass at a rate of +25 ± 6 Gt a−1, which is the largest magnitude of imbalance of all drainage basins in East Antarctica (Smith et al., 2020), including the comparatively well-studied drainage basin 13 in Wilkes Land (−20 ± 14 Gt a−1).
The mass gain and thickening in the Shirase catchment over the past 2 decades (Schröder et al., 2019; Smith et al., 2020) have been hypothesized to have been caused by increased precipitation across the wider Dronning Maud Land and Enderby Land regions (Smith et al., 2020). Prior to this, however, earlier field-based estimates, using repeat triangulation surveys in 1969 and 1973, demonstrated ice surface lowering of around 0.7 m a−1 around 100–200 km inland of the Shirase Glacier grounding line (Mae and Naruse, 1978; Naruse, 1979; Nishio et al., 1989). Furthermore, repeat GPS surveys in 1980 and 1988 revealed a thinning rate of around 0.5 m a−1 around 100–150 km inland of the grounding line (Toh and Shibuya, 1992). These rates of surface lowering during that time are comparable with some of the fastest rates of thinning observed across Antarctica over the past decade and occurred at similar distances inland of the grounding line (Smith et al., 2020). Moreover, this surface lowering in the 1970s and 1980s may have been part of a much longer-term signal with ice core records estimating a surface lowering of 350 m over the past 2000 years of the Mizuho Plateau (Kameda et al., 1990), which is located around 200 km inland of the Shirase coastline. The surface lowering over the past 2000 years is also coincident with an increase in ice discharge from Lützow-Holm Bay, which has been estimated from subglacial erosion rates (Sproson et al., 2021).
Oceanographic observations in Lützow-Holm Bay in 2018 revealed a two-layered structure with a cool and relatively fresh layer of Winter Water overlying a warm and saline layer of mCDW, where temperatures near the ice front seasonally exceed the in situ melting point by 2.7 ∘C (Hirano et al., 2020). Observations and modelling demonstrate a strong seasonal variation in the basal melt rate of the Shirase ice tongue (Hirano et al., 2020; Kusahara et al., 2021a), which is caused by seasonal variations in the depth of the thermocline forced by the strength of the alongshore easterly winds near the continental shelf (Ohshima et al., 1996). To date, there is no evidence of large seasonal variations in ice flow speed at the grounding line, but observations show some seasonal variation in ice flow speed on the floating tongue that could be connected to external forcing (Nakamura et al., 2007, 2010).
There have been several studies analysing the ice flow dynamics of Shirase Glacier, largely covering short sub-decadal time periods (Pattyn and Derauw, 2002; Pattyn and Naruse, 2003; Nakamura et al., 2010; Aoyama et al., 2013). However, the longer-term geological signal of ice sheet thinning and increased ice discharge (Sproson et al., 2021) along with observations of thinning in the 1970s and 1980s (Mae and Naruse, 1978; Naruse, 1979; Nishio et al., 1989; Toh and Shibuya, 1992), followed by thickening from the 2000s (Schröder et al., 2019; Smith et al., 2020), raise some important questions into the processes causing this switch from mass loss to mass gain. In this study, we produce a time series of ice flow speed that spans 47 years and show that long-term ice speed trends coincide with alongshore wind speeds and their impact on intrusions of mCDW. We then discuss how these observations may relate to wider hemispheric trends in atmospheric circulation and what this may mean for the future mass balance of the Shirase catchment and the wider Dronning Maud Land and Enderby Land sectors.
2.1 Ice-front position, ice speed, grounding line and ice thickness
We create a time series of ice-front positions between 1963 and 2020 using a variety of different sources, including ARGON imagery from 1963, Landsat-1 imagery from 1973, Landsat-5 imagery from 1984, Landsat-4 imagery from 1988, the RADARSAT RAMP mosaic from 1997 (Jezek et al., 2013), and MODIS imagery from 2000 to 2020, with the spatial resolution of the satellite data ranging from 15 to 250 m. In each case, we map the outer limit of the collection of loosely bound icebergs that form the Shirase ice tongue that are typically surrounded by a smoother surface of fast ice (Figs. 1 and 2a). Errors associated with this mapping are insignificant in the context of the ice tongue typically advancing 2500 m a−1 or retreating in short-lived calving events typically greater than 10 km.
We calculate 18 ice speed estimates for Shirase Glacier between 1973 and 2020. For 1973 we use a pair of Landsat-1 (band 7) images from 25 January 1973 and 21 January 1974 that we manually co-register to each other before co-registering to a Landsat-8 image. The combination of the relatively coarse Landsat-1 imagery (60 m) and the development of surface melt ponding over the fast-flowing section of the glaciers between the two images prevented the automatic extraction of ice speed. Instead, we extract an ice speed estimate by manually tracking the displacement of a prominent rift ∼ 24 km downstream of the grounding line (Fig. 2d). Errors associated with the manual tracking of this rift stem from the co-registration between the two image pairs, which we estimate to be 1 pixel (60 m; Animation S1 in the Supplement). For 1988, we use a pair of Landsat-4 (band 3) images from 14 January and 15 February 1988 that we also co-register to a Landsat-8 image. The quality of the Landsat-5 images (30 m resolution) is superior to that of the Landsat-1 imagery and, in the absence of significant surface melt ponding, we use the COSI-CORR feature-tracking software (Leprince et al., 2007; Scherler et al., 2008) to extract ice speed. For these images, co-registration error is negligible (Animation S2), and error in the feature tracking is estimated at < 0.5 pixels (e.g. Heid and Kääb, 2012). Because of the close time separation of the image pairs, this results in a larger error of ±171 m a−1.
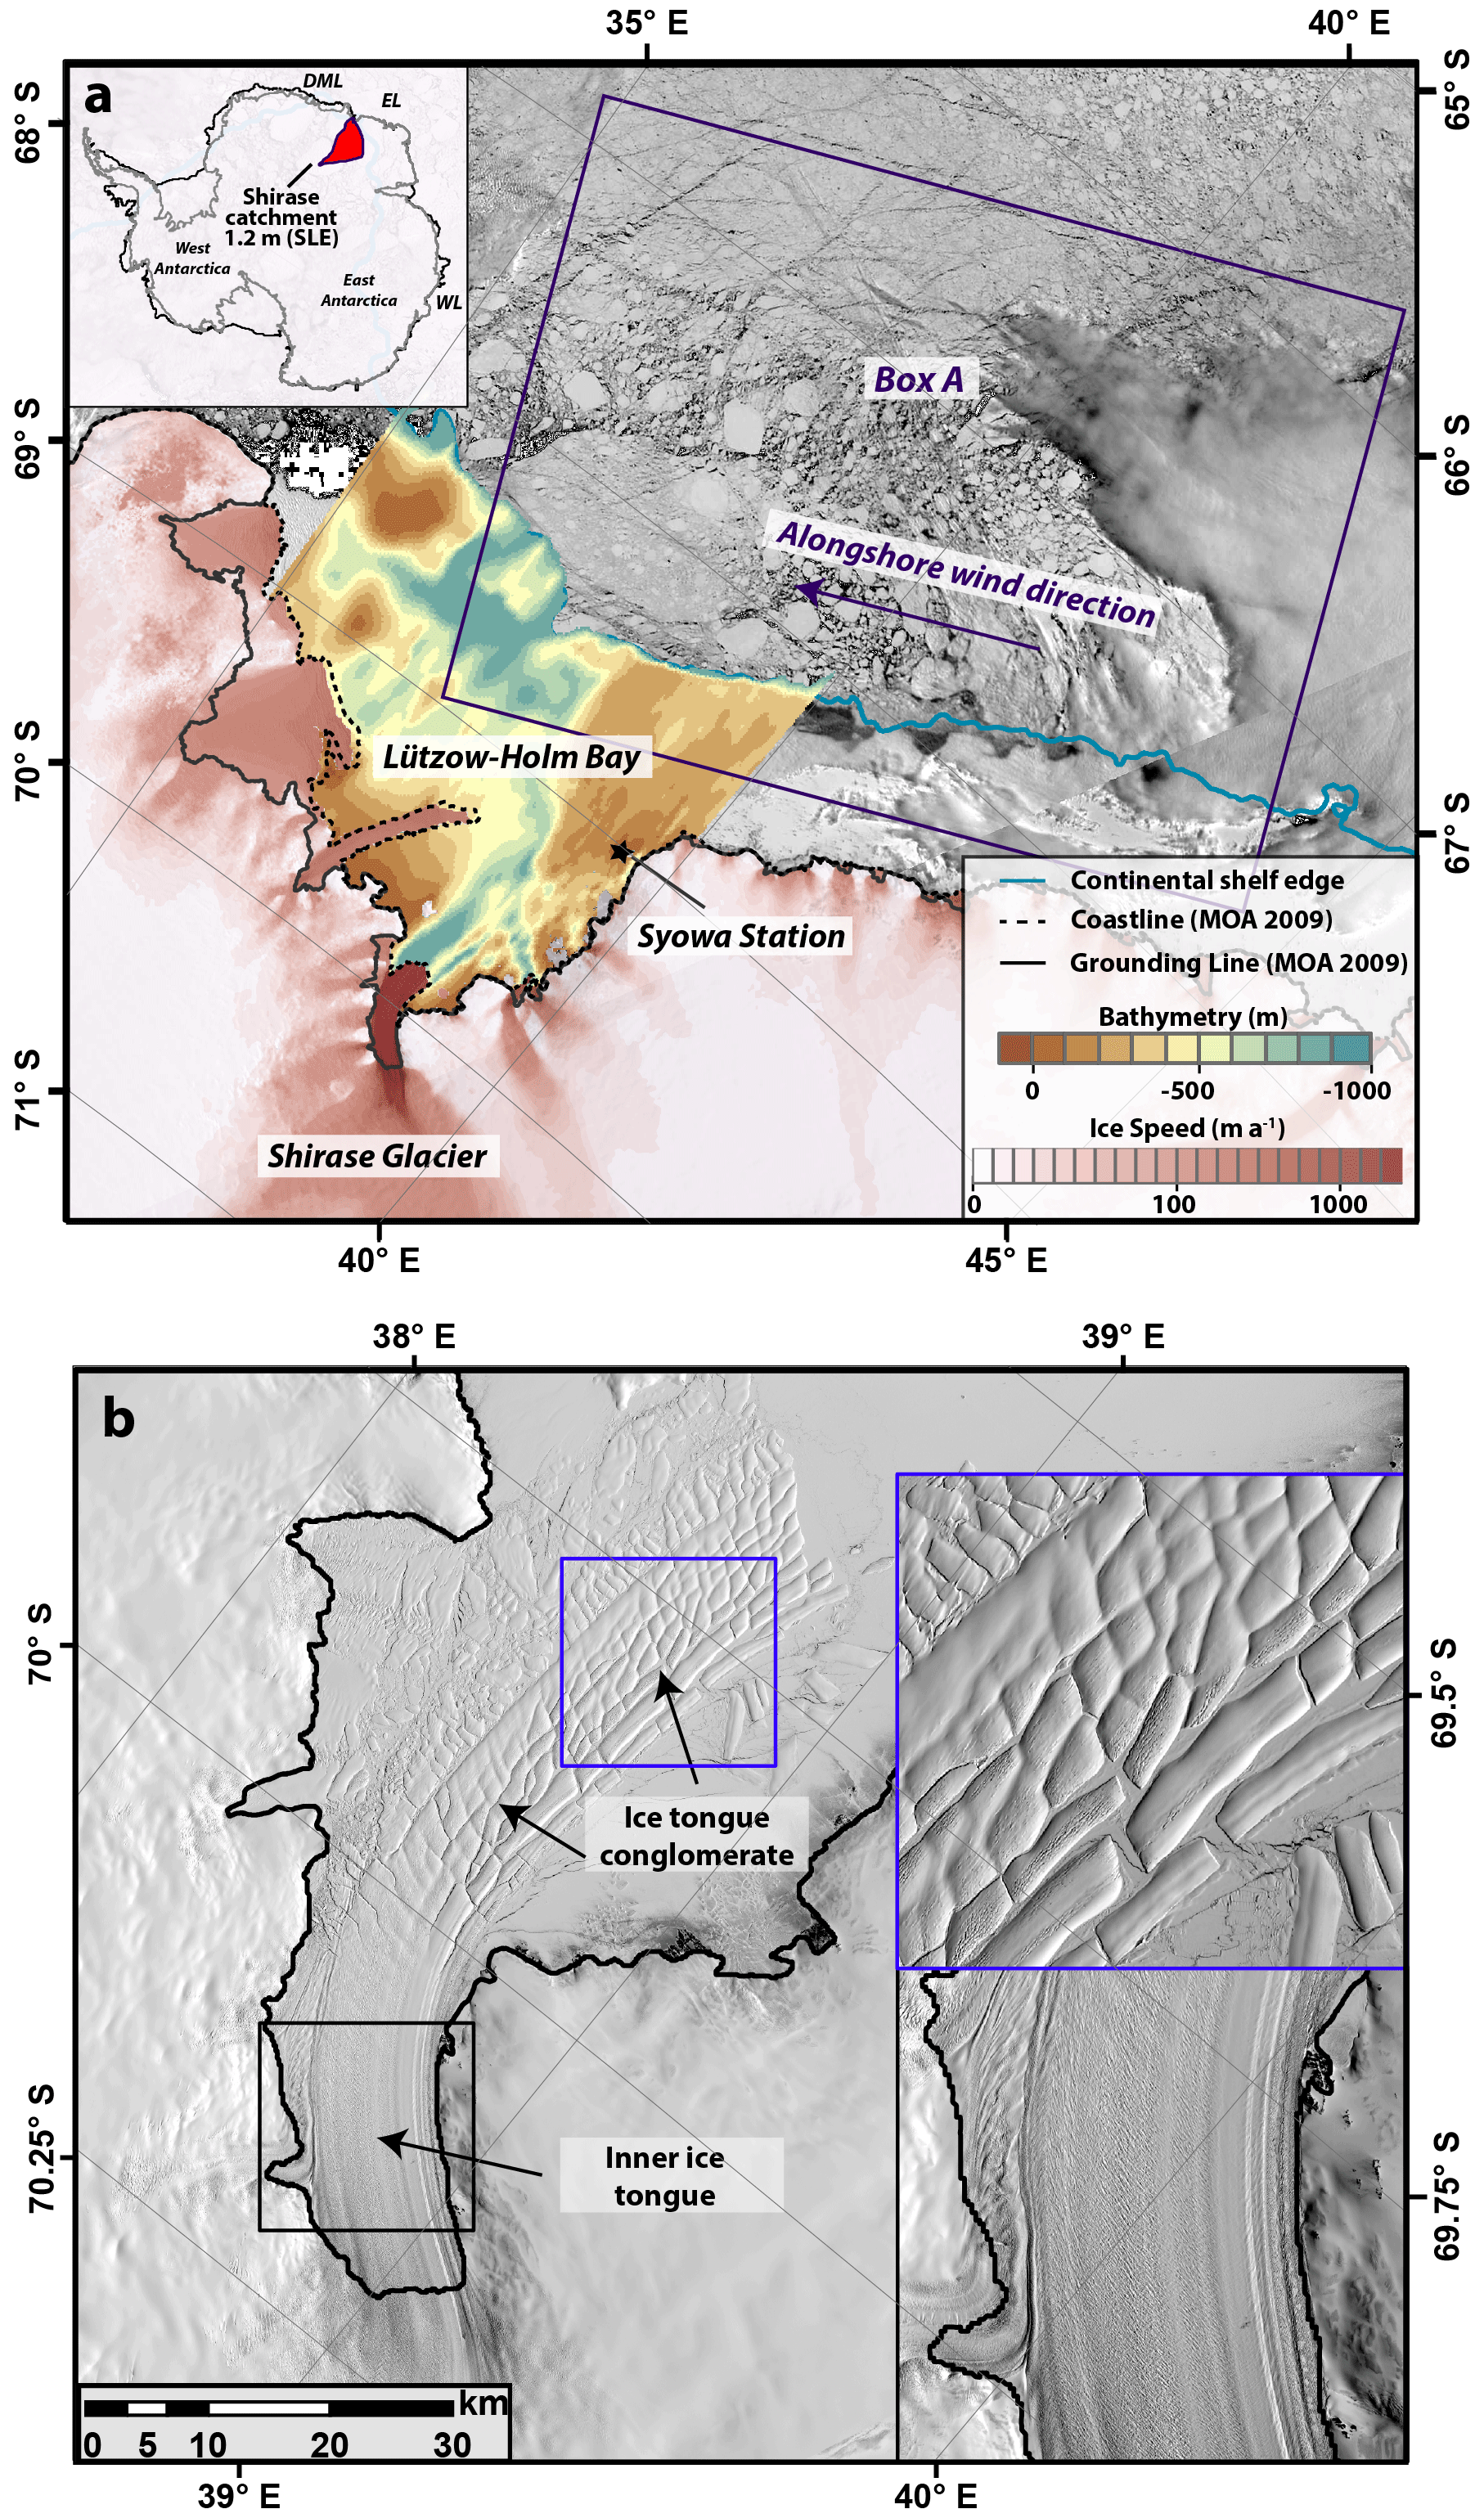
Figure 1(a) MODIS image of Lützow-Holm Bay and Shirase Glacier from 4 November 2019 obtained from NASA WorldView. Overlain is the ITS_LIVE composite velocity product in logarithmic scale (Gardner et al., 2018, 2020), a 1000 m bathymetric contour obtained from BedMachine (Morlighem et al., 2020) which is taken as the continental shelf boundary and bathymetry of Lützow-Holm Bay (Kusahara et al., 2021a). Note the deep trough connecting Shirase Glacier to the open ocean. The locations of the Syowa research station and Box A, the region where ERA5-derived winds were extracted, are also shown. The initials in the inset refer to the following: DML (Dronning Maud Land), EL (Enderby Land) and WL (Wilkes Land). (b) Landsat-8 image from November 2020 showing the structure of the Shirase ice tongue. The blue box is a zoomed-in section of the ice tongue conglomerate that is unconstrained. The black box is a zoomed-in section of the inner section of the ice tongue that is constrained by fjord walls on either side. The black line in both images is the MODIS 2009 grounding line and coastline (Scambos et al., 2007; Haran et al., 2019). Landsat images are courtesy of the U.S. Geological Survey.
For 2000–2018 we use 14 annual ice speed mosaics from the ITS_LIVE dataset which cover Shirase Glacier (Gardner et al., 2018) and use the corresponding error grids for error values, which range from ±1 to ±32 m a−1. For 2019 (n=27) and 2020 (n=19) we take an average of all GoLIVE-generated ice speed fields (Fahnestock et al., 2016; Scambos et al., 2016) with a time separation of 16–320 d from scene IDs 149_109 and 150_109. Taking an average of multiple ice speed grids reduces error and, as such, we prescribe a nominal error of 16 m a−1 based on the average value from the ITS_LIVE mosaics. We extract ice speed profiles from each time period across a transect, T1 (Fig. 2a), and also produce a time series of ice speed change where T1 crosses the grounding line. In 1973, the only possible observation of ice speed was extracted 24 km downstream of the grounding line (point x; Fig. 2a), and there are no observations directly at the grounding line. To account for this, we estimate ice speed at the grounding line in 1973 using the average difference between point x, 24 km downstream of the grounding line, and where T1 crosses the grounding line in each of the other 17 ice speed profiles (1988–2020). Across these profiles, ice speed was on average 2 % slower (ranging from 1 % to 4 %) at the grounding line compared to ice speed at point x. Therefore, to estimate ice speed at the grounding line in 1973, we reduce the ice speed observed 24 km downstream of the grounding line by 2 ± 1 %. We also include the measurements of ice speed from Nakamura et al. (2007) at the grounding line derived from the JERS-1 satellite in 1996, 1997 and 1998.
To estimate the direction and magnitude of any migration in the Shirase Glacier grounding line, we compare time-stamped digital elevation model (DEM) strips with a spatial resolution of 2 m from 6 January 2013 and 8 October 2015 from the REMA project (Howat et al., 2019). We select these strips because they cover the complete Shirase Glacier grounding line and represent the longest time gap in the record. This is in addition to a SPOT5-HRS DEM from the SPIRIT project (Korona et al., 2009) from 8 February 2008, with a spatial resolution of 40 m. Elevation uncertainty is estimated at around 4 m by comparing derived elevations from exposed bedrock between the two REMA DEMs and a larger uncertainty of around 7 m between the SPOT5-HRS and REMA DEMs. The tidal amplitude of the region is limited to 0.2 m (Aoki et al., 2000) and is deemed insignificant. We extract elevation profiles along transect T1 (Fig. 2a) from these dates. A comparison of elevation profiles cannot provide a location of the true grounding line position, but any horizontal migration of these elevation slopes can provide reasonable estimates in both the direction and rate of grounding line migration (Fricker et al., 2009; Brunt et al., 2010).
We also extract an ice thickness change time series from the dataset presented in Schröder et al. (2019) from point IT, which is around 20 km inland of the grounding line (Fig. 2a). This multi-mission dataset spans between 1978 and 2017 and contains data from a variety of satellites. We use the accompanying uncertainty estimates described in Schröder et al. (2019). We also utilize modelled basal melt rate anomalies of the Shirase ice tongue that are derived by an ocean model that is forced by ERA-Interim wind reanalysis between 2008 and 2018 by Kusahara et al. (2021a). The basal melt rate dataset contains melt anomalies that have been simulated with fast ice cover and a hypothetical no fast ice scenario (see Fig. 20; Kusahara et al., 2021a). We use the melt rates with fast ice cover because persistent fast ice cover remained throughout our observational period, aside from a few sporadic partial breakouts in the summer months.
2.2 Climatological data
We extract mean monthly ERA5 (Hersbach et al., 2020) 10 m zonal (U) and meridional (V) wind speeds with a gridded 30 km spatial resolution between 1979 and 2021 from a box approximately 340×250 km adjacent to the coastline (Box A; Fig. 1a). We do not extend the box all the way into Lützow-Holm Bay because it is semi-permanently covered with land-fast sea ice (Fig. S1 in the Supplement) that dampens the impact of winds on ocean circulation. We then calculate alongshore easterly wind speed using an alongshore angle of 80∘ from due north:
where W is wind speed and θ is wind direction. Using the ERA5 data, we also calculate the linear trend in zonal wind between 1979 and 2021 across a wider region of the Dronning Maud Land and Enderby Land coastlines. We also extract a precipitation time series across Shirase Glacier using the MAR regional climate model between 1979 and 2019 (Kittel et al., 2021).
We observe a total range of nearly 90 km in the ice-front position of the Shirase ice tongue between 1963 and 2020 (Fig. 2a, b). Its maximum length was in 1963 before retreating to its minimum extent in 1988 (Fig. 2a, b). Since 1988 there has been a general pattern of advance with a few sporadic calving events (Fig. 2a, b). Most of the variation in the extent of the Shirase ice tongue is in the heavily fractured and unconstrained ice tongue conglomerate (Figs. 1b, 2a). The only exception to this was in 1988, when the ice tongue retreated to the entrance of the narrow and more constrained section of its fjord, 24 km in advance of its 2009 grounding line (Fig. 2a).
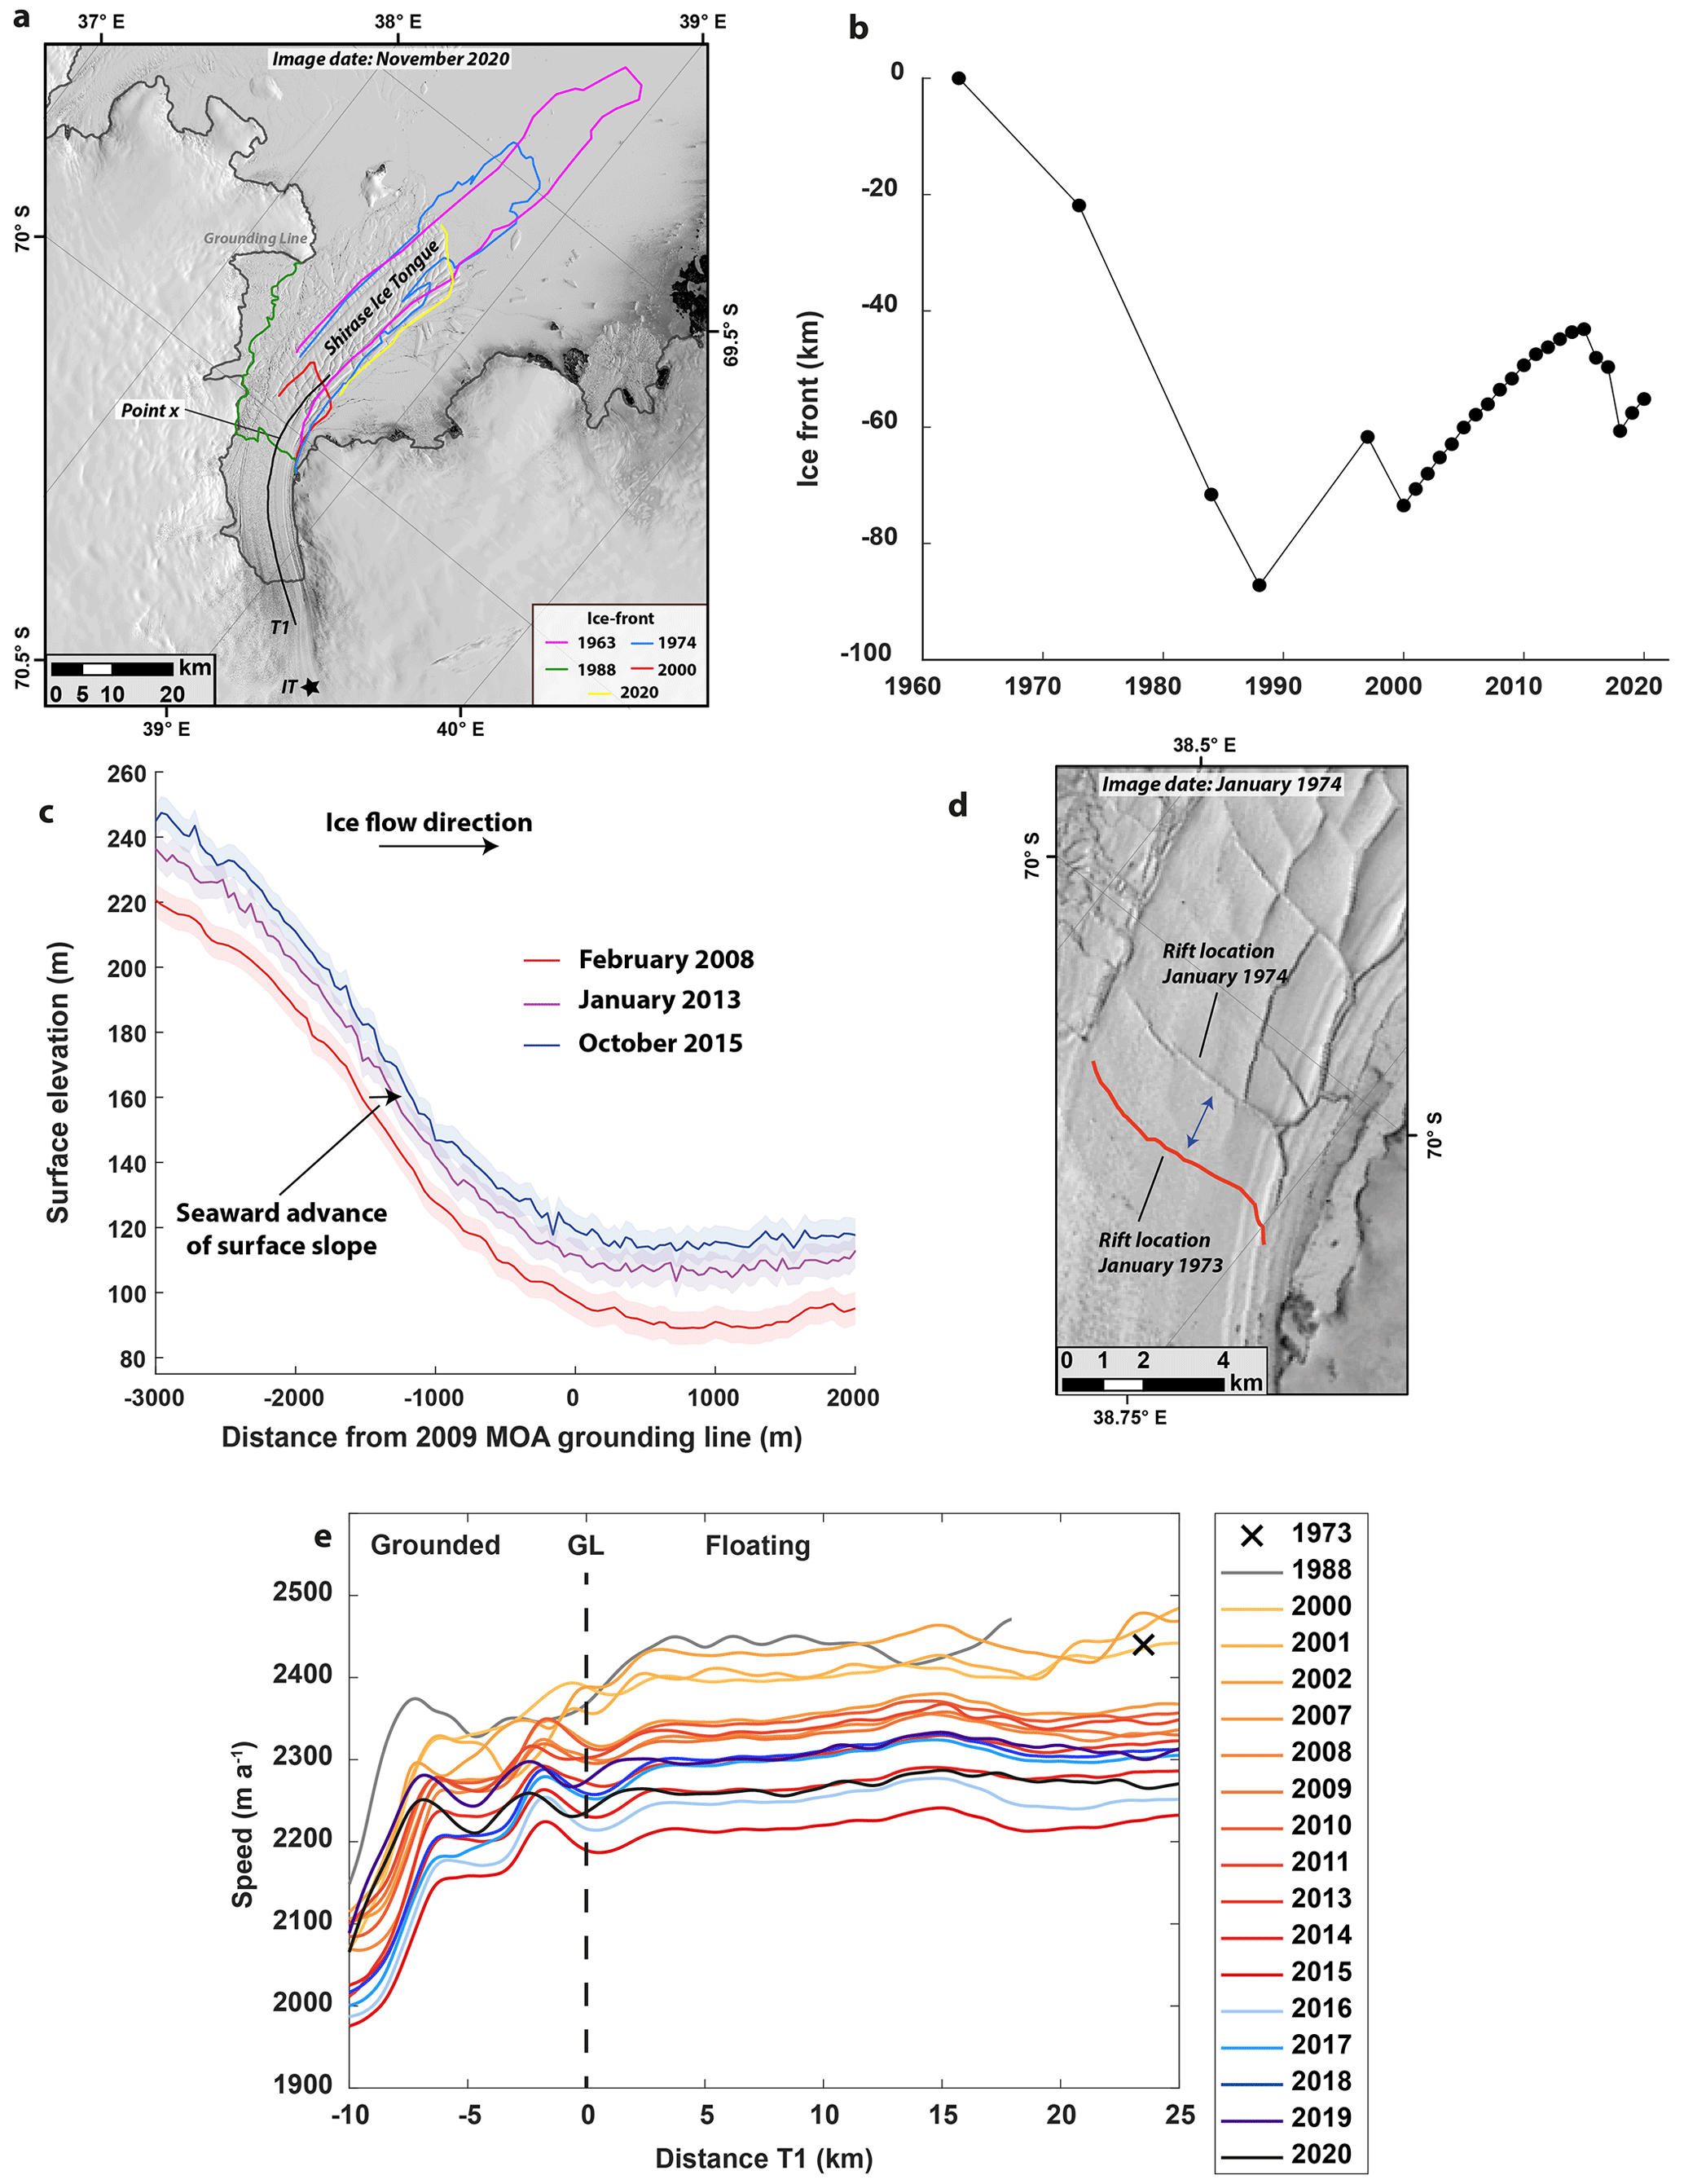
Figure 2(a) Landsat-8 image from November 2020 showing the Shirase ice tongue. Overlain are selected ice-front positions from 1963, 1974, 1988, 2000 and 2020 along with the transect, T1, used to extract ice speed profiles and point x, which is the location of the 1973/74 ice speed estimate on the floating tongue. Point IT is the location of the ice thickness time series. The grey line is the MODIS 2009 grounding line (Scambos et al., 2007; Haran et al., 2021). (b) Change in ice-front extent relative to 1963. (c) Surface elevation profiles along a small section of T1 as it intersects the grounding line from February 2008, January 2013 and October 2015 showing a seaward migration of the surface slope. (d) Landsat-1 image showing the rift used to estimate ice speed in 1973/74. The red line is the digitized rift from January 1973. (e) Ice speed profiles from transect T1 between 1973 and 2020. The black cross represents the ice speed measurement from 1973/74. Landsat images are courtesy of the U.S. Geological Survey.
Ice speed profiles along the transect (T1, Fig. 2a) show a uniform pattern of change across both the grounded and floating sections of Shirase Glacier (Fig. 2e). At the grounding line, we observe little change in ice speed between 1973 and 1988, although we note the larger uncertainty in the 1988 estimate of ±171 m a−1 (Fig. 3a), and we cannot rule out interannual variations in ice speed within this date range. Between 1988 and 1996 we observe a 2 ± 7 % slowdown and a 2 ± 1 % increase in ice speed between 1997 and 2000 (Fig. 3a). Post-2000 we observe a slowdown, with an 8 ± 1 % decrease in ice speed between 2000 and 2015 (Fig. 3a). Between 2015 and 2019 ice speed increased by 4 ± 1 % (Fig. 3a). Observations of ice thickness change 20 km inland of the grounding line show a thinning trend of 0.27 ± 0.33 m a−1 between 1987 and 1997 before reversing to a thickening trend of 0.19 ± 0.10 m a−1 between 1997 and 2017 (Fig. 3b). There is large interannual variability in precipitation over Shirase Glacier (Fig. 3c) and no obvious link to observations of ice speed or ice thickness. Elevation profiles along a section of T1 in 2008, 2013 and 2015 show a consistent seaward migration of the surface slope as it approaches the grounding line (Fig. 2c, Animation S3). The absence of any consistent increases in precipitation suggests that this is predominantly a horizontal offset caused by grounding line advance. Therefore, between February 2008 and October 2015 we estimate that the grounding line advanced around 400 m (∼ 50 m a−1) from measuring the seaward displacement of the surface slope, an estimate that is broadly consistent with CryoSat-based observations of seaward grounding line migration between 2010 and 2016 (∼ 30 m a−1; Konrad et al., 2018).
ERA5-derived estimates of alongshore easterly wind speed between 1979 and 2020 show limited variation between 1984 and the early 1990s (Fig. 3a). In the early 1990s there was a small increase in alongshore wind speed before a more marked increase from 2000 to 2010, when alongshore wind speed increased from around 4 to 4.8 m s−1 (Fig. 3a). This is before falling slightly to around 4.5 m s−1 between 2010 and 2018, which is coincident with an increase in basal melt rate anomalies (Fig. 3a). The multi-decadal trend in zonal wind shows a trend of strengthening of wind in an easterly direction at the continental shelf boundary over much of Enderby Land (Fig. 4). There is no trend in zonal wind speed over large parts of Dronning Maud Land, with the exception of near Jutulstraumen Glacier, where there is a trend of strengthening wind in the westerly direction (Fig. 4).
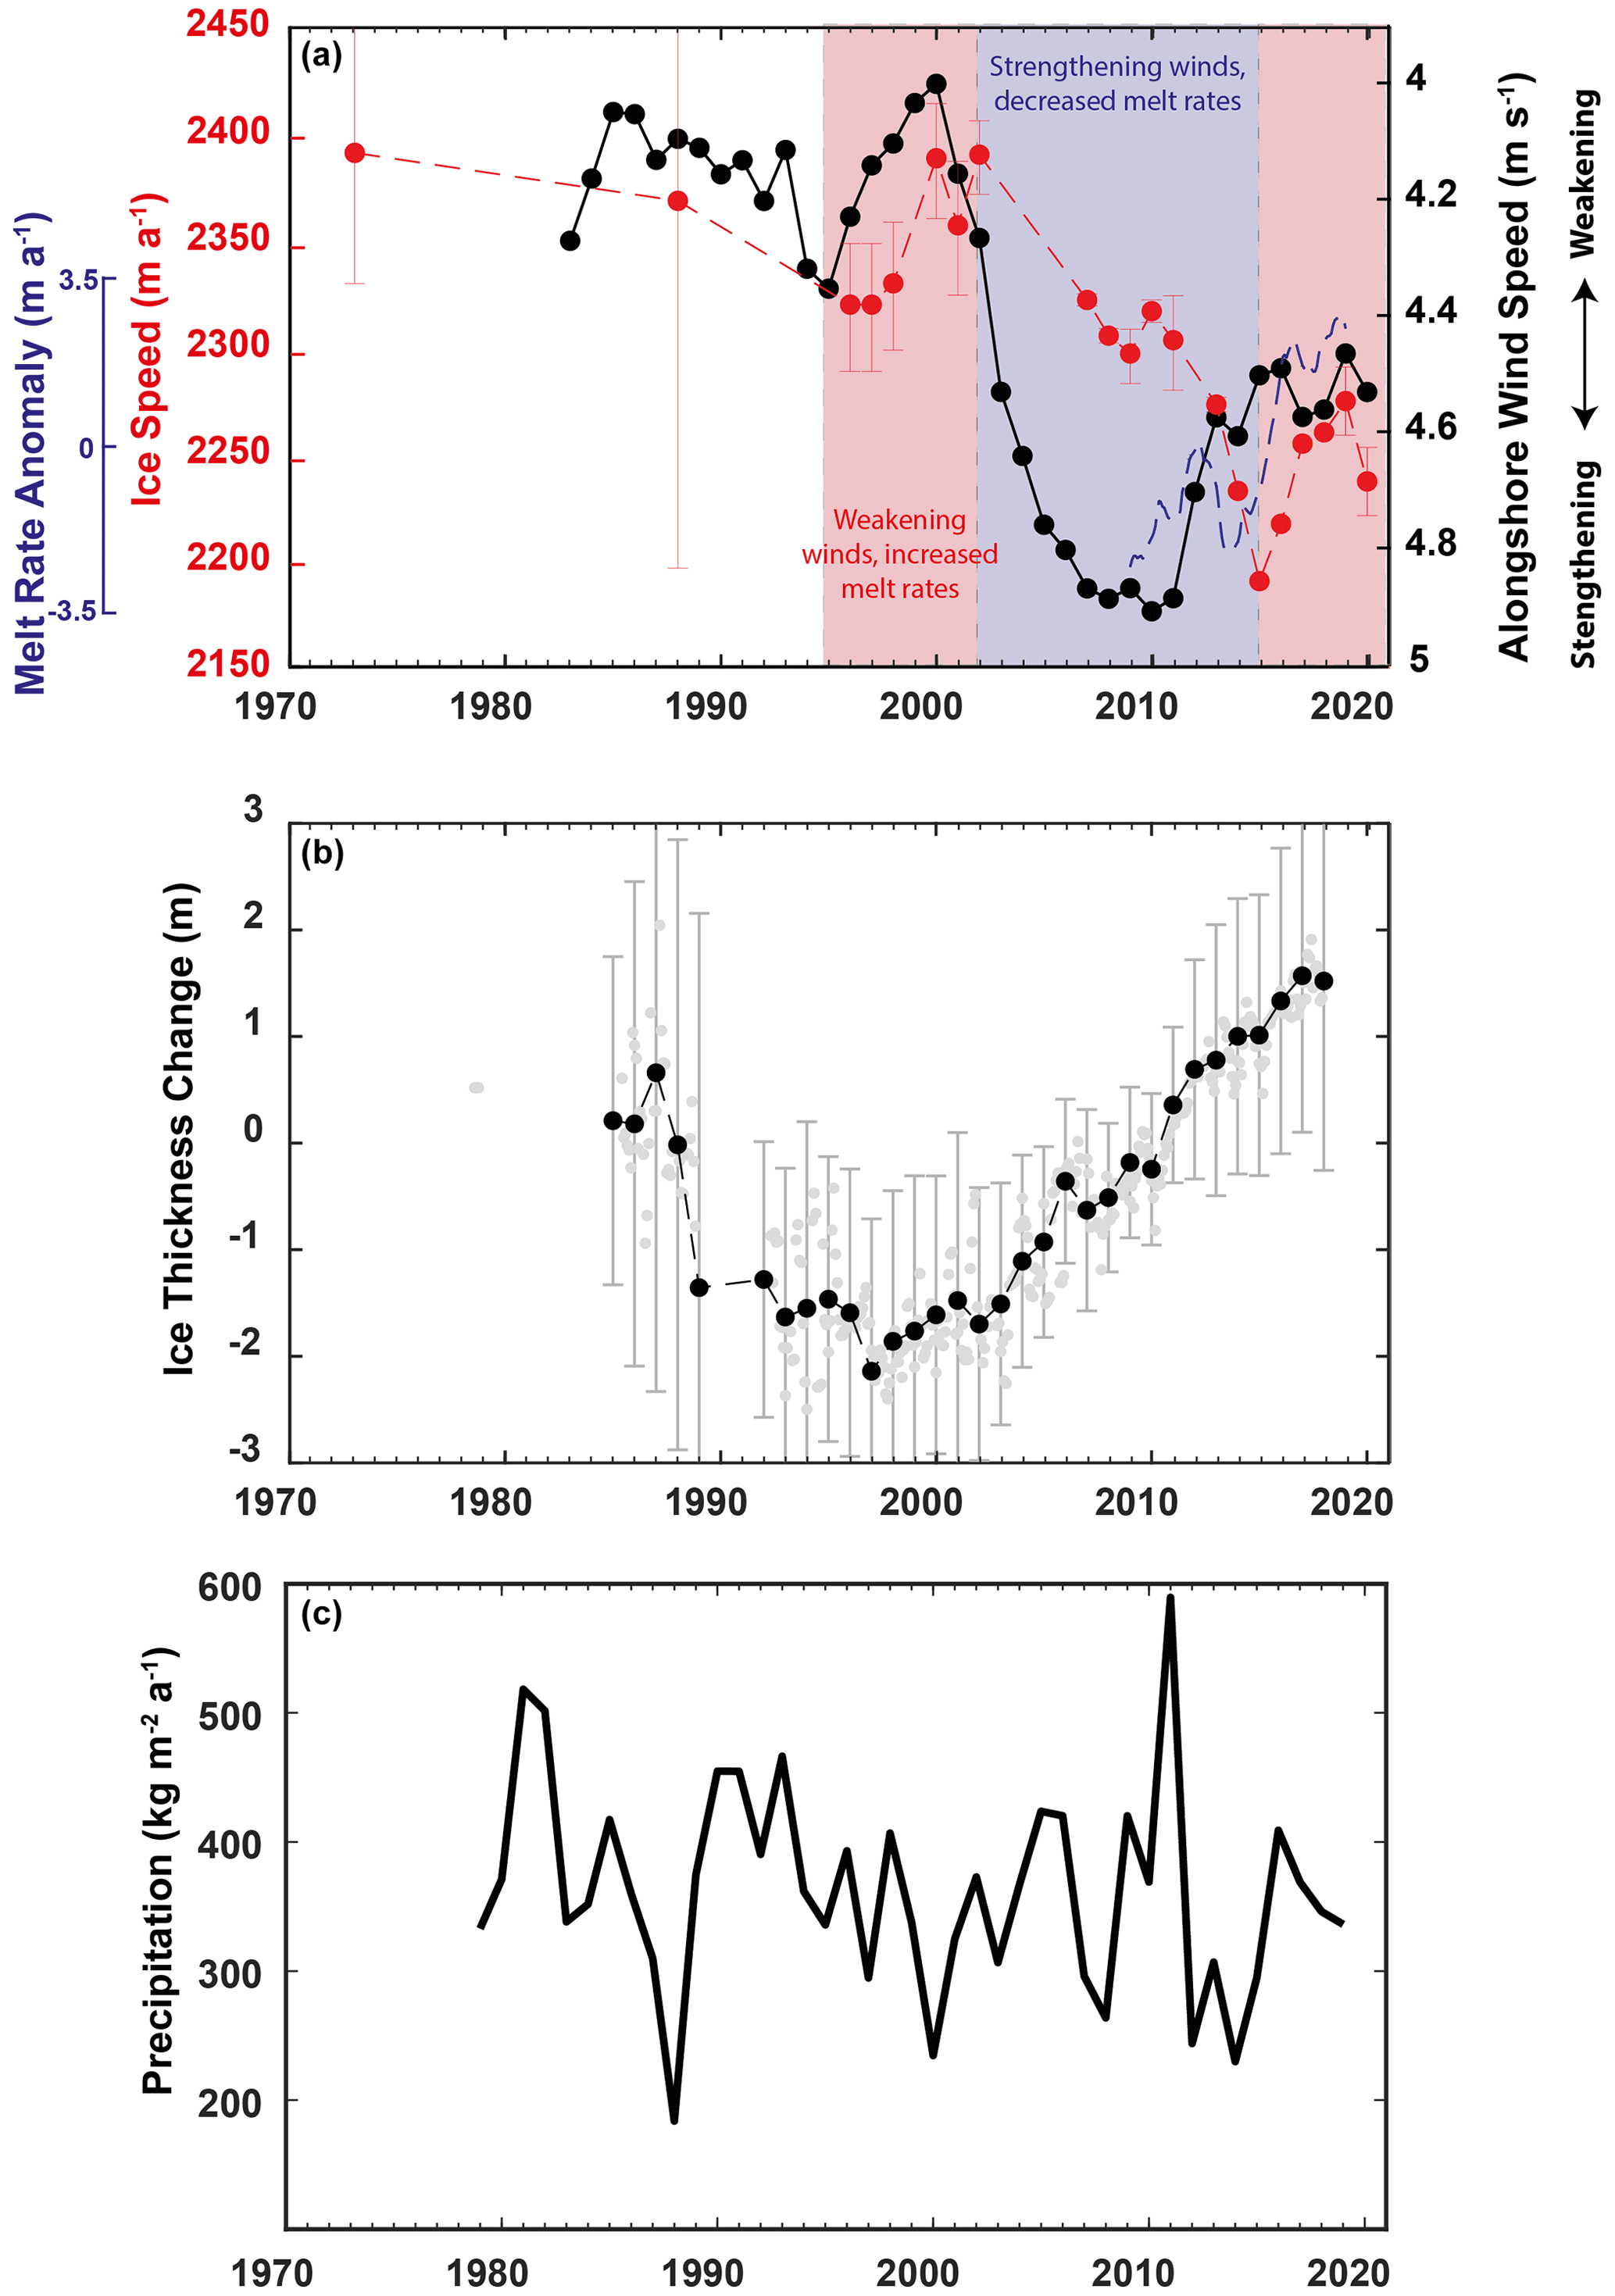
Figure 3(a) Annually averaged ERA5-derived alongshore wind speed from Box A (see Fig. 1) and plotted as a 5-year rolling mean (black), ice speed at the Shirase Glacier grounding line along T1 (red) and modelled melt rate anomaly of the Shirase ice tongue between 2008 and 2018 plotted as a 1-year rolling mean (blue; Kusahara et al., 2021a). Periods of weakening winds cause increased mCDW transport, increased basal melt and acceleration. Periods of strengthening winds result in relatively less mCDW transport, decreased basal melt rates and glacier slowdown. Note that alongshore wind speed is plotted with an inverted axis. (b) Annually averaged ice thickness change at point IT with respect to 2009/10 (see Fig. 2a) extracted from the Schröder et al. (2019) dataset, where there are at least six data points in the calendar year. The error bars are annually averaged errors. The background grey points are the raw monthly data points. (c) Annually averaged precipitation over Shirase Glacier from the MAR regional climate model (Kittel et al., 2021); uncertainties are not provided with these data.
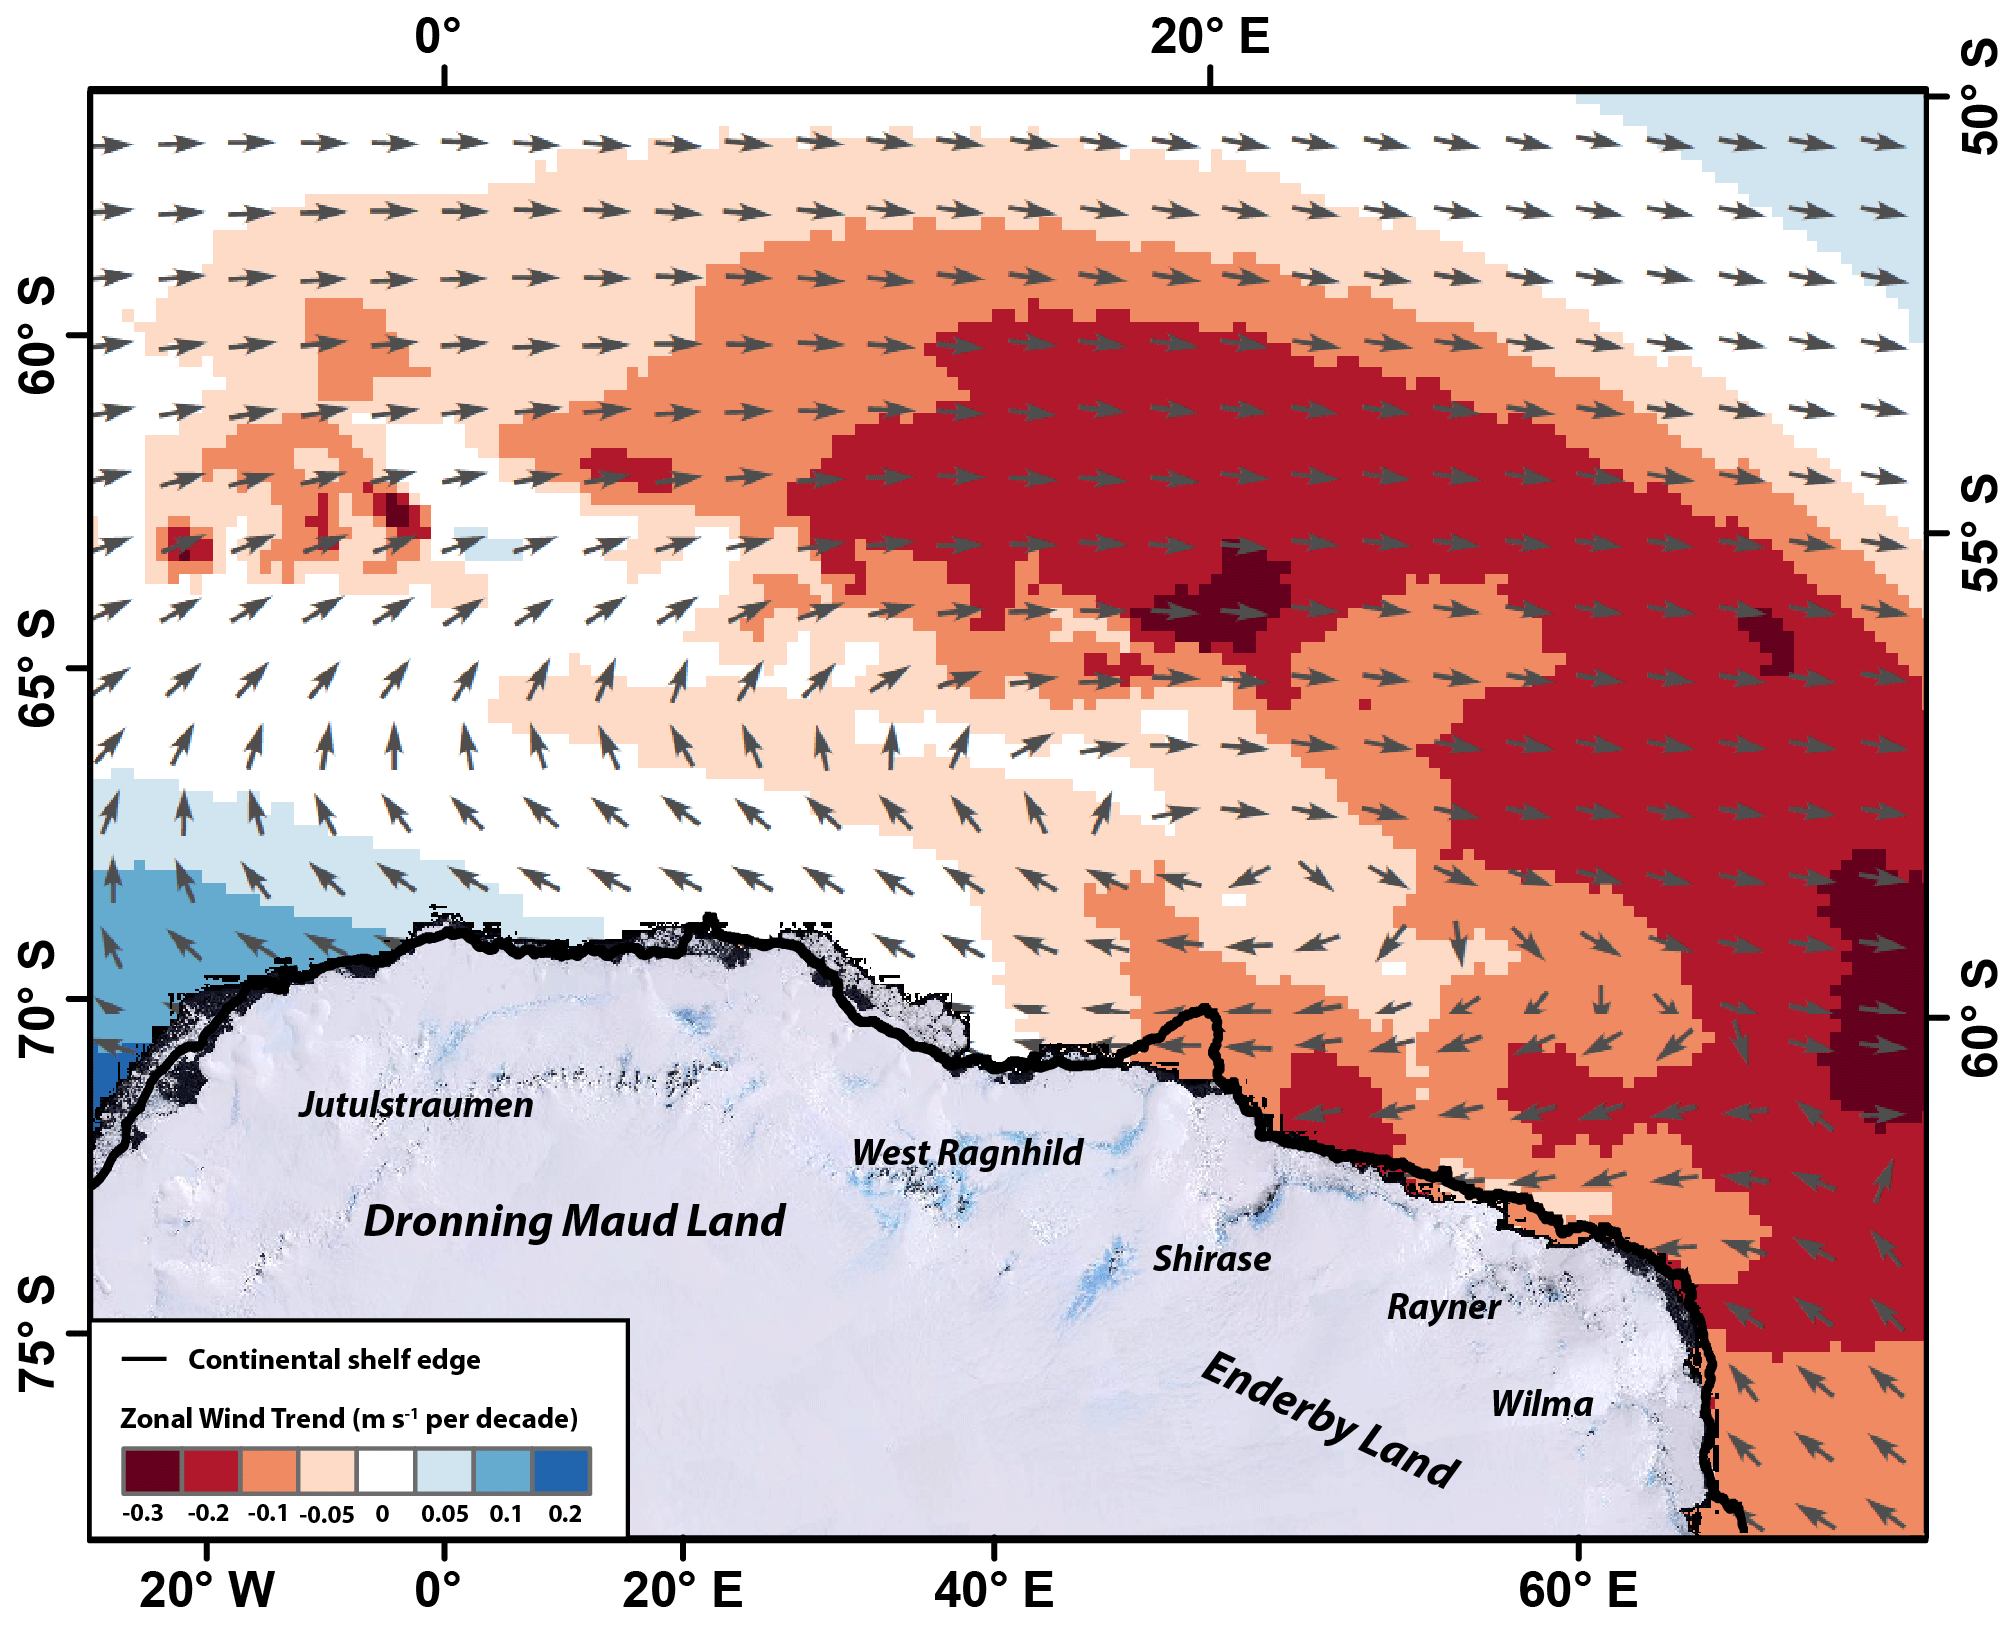
Figure 4Linear zonal wind trend for 1979–2021 with data smoothed with a 60-month moving average prior to extracting the trend. Negative values indicate a trend for zonal winds in a more easterly direction and positive values indicate a trend for winds in a more westerly direction. Mean wind direction (1979–2021) is represented by the grey arrows. Major outlet glaciers have been labelled.
4.1 Slowdown and thickening caused by strengthening alongshore winds
Calculations indicate that the heavily fractured and unconstrained section of the Shirase ice tongue conglomerate offers little buttressing force (Fig. 5a; Durand et al., 2016; Fürst et al., 2016). Therefore, it is unlikely that any variations in the extent of the Shirase ice tongue have had a direct effect on the ice speed trends we have observed. The only possible exception to this is in 1988, when the ice tongue briefly retreated to the edge of its more confined embayment (Fig. 2a), closer to where the extent of the ice tongue might be expected to exert buttressing and impact on inland flow speed were it to be removed (Fig. 5a).
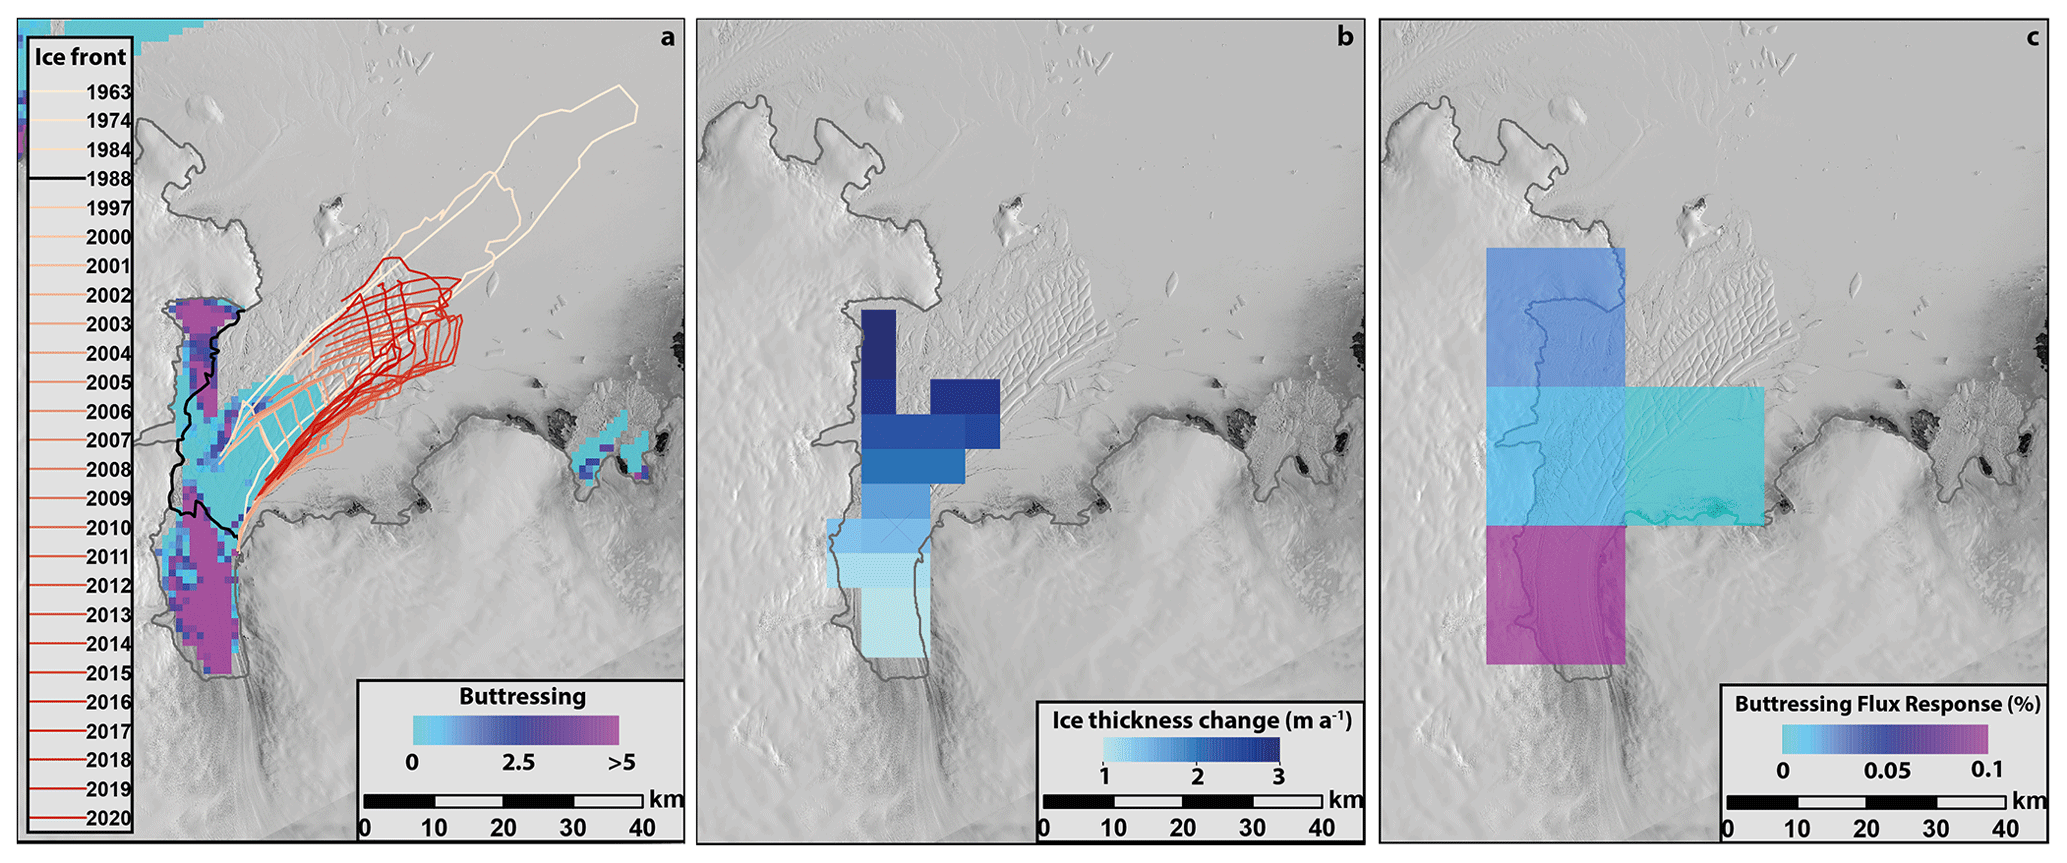
Figure 5(a) Simulated maximum buttressing potential of the Shirase ice tongue (Durand et al., 2016). Light blues mean the ice is passive, and purples mean the floating ice is dynamically important. Note how the ice tongue conglomerate is not important for buttressing, but parts of the inner shelf are important. No dynamically important ice has calved over the past 57 years. (b) Ice tongue thickness change between 2003 and 2019 showing thickening of the Shirase ice tongue (Smith et al., 2020). (c) Simulated response of ice flux to thinning of floating ice in each grid cell by 1 m (Reese et al., 2018); the constrained inner tongue near the grounding line is important for buttressing. Note that there is no change in ice tongue buttressing in response to observed changes in ice tongue extent, but increased buttressing is expected in response to observed ice tongue thickening. Landsat images are courtesy of the U.S. Geological Survey.
In agreement with previous work, we note that the observed fluctuations in ice tongue extent are correlated with land-fast sea-ice conditions in Lützow-Holm Bay (Aoki, 2017). Long periods of ice tongue advance are associated with persistent land-fast sea ice in Lützow-Holm Bay, while ice tongue retreat is associated with land-fast sea-ice break-out events removing parts of the ice tongue conglomerate (Aoki et al., 2017). These break-out events have occurred sporadically during the austral summer months (Fig. S1). It is important to note that fast ice only helps control the length of the ice tongue conglomerate (Fig. 1b), and there is no evidence that the fast ice has any major role in providing buttressing for Shirase Glacier. For example, we note that there was no obvious increase in ice speed at the grounding line or over the inner ice tongue in 1988, when the fast ice and ice tongue conglomerate were completely removed from the bay (Figs. 2a, S1), albeit there are large uncertainties in our 1988 ice speed estimate (±171 m a−1). In addition, Nakamura et al. (2010) recorded only a very modest 20 ± 30 m a−1 (0.8 ± 1.3 %) change in ice speed at the grounding line after a partial fast ice break-out event in 1998, and there was also an indistinguishable change in ice speed at the grounding line following a break-out in 2017 (Nakamura et al., 2022).
Point IT, 20 km inland of the Shirase Glacier grounding line, was thinning at a rate of −0.27 ± 0.33 m a−1 between 1987 and 1997 (Fig. 3b), a pattern consistent with field observations up to 200 km further inland in the 1960s, 1970s and 1980s (Mae and Naruse, 1978; Naruse, 1979; Nisho et al., 1989; Toh and Shibuya, 1992). However, in ∼ 2000 there was a slowdown in Shirase Glacier (Fig. 3a), and this thinning trend reversed to thickening (Fig. 3b). This slowdown and thickening coincide with an increase in alongshore easterly wind speed adjacent to the Shirase coastline (Fig. 3a). The seasonal strengthening in alongshore easterly winds offshore of the Shirase coastline has been observed to deepen the thermocline in Lützow-Holm Bay, limiting the inflow of mCDW onto the continental shelf and reducing basal melt rates (Hirano et al., 2020). We suggest that this same process over annual to decadal timescales has caused the slowdown of Shirase Glacier.
Increased alongshore wind speed from ∼ 2000 enhanced Ekman convergence at the coast, deepening the thermocline with a short lag and inhibiting the inflow of warm mCDW into Lützow-Holm Bay. The subsequent cooling of Lützow-Holm Bay reduced the basal melt rate of the Shirase ice tongue. This reduction in basal melt caused the ice tongue to thicken and is confirmed by ICESat and ICESat-2 observations of the Shirase ice tongue that show a mean thickening of 1.87 m a−1 from 2003 to 2019 (Fig. 5b; Smith et al., 2020). Instantaneous numerical modelling experiments show that ice discharge is sensitive to thickness changes in the inner ice tongue (Reese et al., 2018; Fig. 5c). Therefore, the dynamic thickening of the inner ice tongue would be expected to increase buttressing through time (Fig. 5c) and ultimately drive the overall slowdown in ice speed, grounding line advance and inland thickening that we observe. Importantly, our results show that wind-driven ocean forcing is also contributing to mass gain in Lützow-Holm Bay. This is likely in addition to surface mass balance processes, as indicated by the widespread inland thickening of the Shirase catchment between 2003 and 2019 (Smith et al., 2020). However, there is no evidence of a long-term increase in precipitation at the Shirase catchment (Fig. 3c). Instead, the inland thickening is likely a consequence of extreme anomalous snowfall events in 2009 and 2011 (e.g. Boening et al., 2012; Lenaerts et al., 2013).
Within the longer-term slowdown of Shirase Glacier between 1973 and 2020 we observe brief periods of acceleration in response to short-lived periods of weakening alongshore winds. For example, both of the accelerations in ice speed from 1997–2000 and 2015–2019 are preceded by brief periods of weakening alongshore winds (Fig. 3a). These periods of weakening alongshore winds cause relatively higher basal melt rates because they raise the thermocline closer to the ocean surface and enable a greater influx of mCDW into Lützow-Holm Bay (Hirano et al., 2020). This is supported by the close relationship between alongshore wind speed and modelled melt rate anomalies (Fig. 3a; Kusahara et al., 2021a). Although we do note some slight discrepancies in this relationship, for example between 2008 and 2011, changes in melt rates precede changes in winds. This could be related to the relative smoothing of both datasets, with alongshore wind plotted as a 5-year rolling mean and melt rates plotted as a 1-year rolling mean.
The interannual variability in ice flow speed at Shirase Glacier in response to wind-forced ocean variability is analogous to other regions of Antarctica where mCDW periodically floods the continental shelf, e.g. Pine Island (Christianson et al., 2016), Thwaites (Miles et al., 2020) and Totten glaciers (Greene et al., 2017). The pattern of change at Shirase Glacier is unique, however, in that it is the only outlet glacier in Antarctica with a warm water regime that has been observed to be slowing down and thickening during the 21st century, as opposed to accelerating and thinning (e.g. Mouginot et al., 2014; Greene et al., 2017). As such, our results highlight that this oceanic mode of ice melt is not universally associated with mass loss in Antarctica.
4.2 Wider links to climate forcing and future implications
In response to both increased greenhouse gas emissions and ozone depletion (Thompson et al., 2011; Wang et al., 2014; Perren et al., 2020), the band of mid-latitude westerly winds that encircle Antarctica have both strengthened and migrated southwards towards the ice sheet over recent decades (Thompson and Solomon, 2002; Marshall, 2003; Turner, 2005; Bracegirdle et al., 2018). In the Amundsen Sea sector of West Antarctica, this anthropogenically driven migration has been linked to westerly wind anomalies over the continental shelf (Holland et al., 2019), which have enabled a greater influx of warm mCDW onto the continental shelf and have driven enhanced localized ice sheet mass loss (Thoma et al., 2008). At Shirase Glacier, our observations of strengthening alongshore easterly winds suggest that any southward encroachment of the mid-latitude westerlies has yet to impact the Shirase coastline. This may also be the case for parts of the wider Enderby Land coastlines, where alongshore easterlies have strengthened along the continental shelf edge (Hazel and Stewart, 2019). However, it remains unknown what effect these strengthening easterly winds may have had on other nearby outlet glaciers (e.g. Rayner and Wilma; Fig. 4), which are yet to be studied in detail. The trend in strengthening alongshore easterlies might also be linked to enhanced katabatic winds as low-pressure systems track progressively further south and enhance the pole-to-coast pressure gradient (Hazel and Stewart, 2019). It is unclear whether the enhancement of the pole-to-coast pressure gradient has been influenced by the anthropogenically driven southerly migration of the mid-latitude westerlies or whether it has been caused by inherent natural decadal variability within the system.
Over the course of the 21st century, the southerly migration of the mid-latitude westerlies is projected to continue in a warming climate (Yin, 2005; Perren et al., 2020). Along the Shirase coastline, this continued southerly migration may ultimately result in a similar situation to the Amundsen Sea, such that westerly wind anomalies offshore would result in enhanced mCDW transport into Lützow-Holm Bay and cause mass loss. Alternatively, the westerly winds may never migrate close enough to the Shirase coastline to impact alongshore winds, and instead, alongshore winds may continue to strengthen as the pole-to-coast pressure gradient increases. This would result in further cooling of Lützow-Holm Bay and ice tongue thickening and further mass gain. In a wider context, an improved understanding of the potential changes in ocean forcing in response to broader atmospheric patterns expected over the coming decades is needed in the Enderby Land and Dronning Maud Land sectors.
Our observations of Shirase Glacier are a rare example of a glacier reversing a trend of mass loss from at least the 1970s–1990s to mass gain over the last 2 decades. As far as we are aware this is the only major fast-flowing Antarctic outlet glacier to display this pattern of behaviour. This reversal has been driven by a slowdown of the Shirase Glacier upstream of the grounding line in response to strengthening alongshore easterly winds that have limited the inflow of warm mCDW into Lützow-Holm Bay, reduced basal melt rates, and caused its ice tongue to dynamically thicken. Should this strengthening of alongshore easterly winds continue into the future, the Shirase catchment will continue to experience a positive mass balance due to both the slowdown in ice discharge and the predicted increase in precipitation in response to atmospheric warming (e.g. Ligtenberg et al., 2013; Kittel et al., 2021). Our results highlight the need for a greater consideration of the potential role of ocean forcing in both the current and future mass balances of the wider Enderby and Dronning Maud Land regions.
Landsat and ARGON imagery was provided free of charge by the U.S. Geological Survey Earth Resources Observation Science Center (https://earthexplorer.usgs.gov/, USGS, 2022). For the MODIS imagery we are also grateful for the use of imagery from the NASA Worldview application (https://worldview.earthdata.nasa.gov, NASA, 2022), part of the NASA Earth Observing System Data and Information System (EOSDIS). COSI-CORR is an ENVI plug-in and can be downloaded from http://www.tectonics.caltech.edu/slip_history/spot_coseis/download_software.html (Leprince et al., 2007). The ITS_LIVE velocity products are available from https://doi.org/10.5067/IMR9D3PEI28U (Gardner et al., 2022). GoLIVE velocity products are available from https://doi.org/10.7265/N5ZP442B (Scambos et al., 2016). ERA5 data are available from https://doi.org/10.24381/cds.adbb2d47 (Hersbach et al., 2018). The MOA grounding line product is available at https://doi.org/10.7265/N5KP8037 (Haran et al., 2021). BedMachine is available at https://doi.org/10.5067/E1QL9HFQ7A8M (Morlighem, 2020). The ice shelf thickness change dataset from Smith et al. (2020) is available at http://hdl.handle.net/1773/45388 (last access: April 2022). REMA DEM https://doi.org/10.7910/DVN/X7NDNY (Howat et al., 2022). Lützow-Holm Bay bathymetry is available at https://doi.org/10.17632/z6w4xd6s3s.1 (Kusahara et al., 2021b). The RAMP mosaic is available at https://doi.org/10.5067/8AF4ZRPULS4H (Jezek et al., 2013). The ice shelf extent buttressing dataset from Durand et al. (2016) is available at https://doi.org/10.5067/FWHORAYVZCE7. SPIRIT DEMs are available from https://theia.cnes.fr/atdistrib/rocket/#/search?collection=Spirit (Korona et al., 2009). MAR precipitation data are available from https://doi.org/10.5281/zenodo.4459259 (Kittel, 2021).
The supplement related to this article is available online at: https://doi.org/10.5194/tc-17-445-2023-supplement.
All the authors contributed to the design of the study. BWJM collected and analysed the remote sensing data and led the manuscript writing with input from all the authors.
At least one of the (co-)authors is a member of the editorial board of The Cryosphere. The peer-review process was guided by an independent editor, and the authors also have no other competing interests to declare.
Publisher's note: Copernicus Publications remains neutral with regard to jurisdictional claims in published maps and institutional affiliations.
Bertie W. J. Miles was also supported by a Leverhulme Early Career Fellowship (ECF-2021-484). The Hersbach et al. (2018) dataset was downloaded from the Copernicus Climate Change Service (C3S) Climate Data Store. We are grateful for the DEMs provided by the Byrd Polar and Climate Research Center and the Polar Geospatial Center under NSF-OPP awards 1543501, 1810976, 1542736, 1559691, 1043681, 1541332, 0753663, 1548562 and 1238993 and NASA award NNX10AN61G. Computer time was provided through a Blue Waters Innovation Initiative. DEMs were produced using data from Maxar. We thank Ronja Reese for providing the ice flux buttressing response dataset. We would like to thank two anonymous reviewers, along with the editor Etienne Berthier, for providing constructive comments which led to the improvement of this paper.
This research has been supported by the Natural Environment Research Council (grant no. NE/R000824/1) and the Leverhulme Trust (grant no. ECF-2021-484).
This paper was edited by Etienne Berthier and reviewed by Kazuya Kusahara and one anonymous referee.
Aoki, S.: Breakup of land-fast sea ice in Lützow-Holm Bay, East Antarctica, and its teleconnection to tropical Pacific sea surface temperatures, Geophys. Res. Lett., 44, 3219–3227, https://doi.org/10.1002/2017GL072835, 2017.
Aoki, S., Ozawa, T., and Doi, K.: GPS observation of the sea level variation in Lützow-Holm Bay, Antarctica, Geophys. Res. Lett., 27, 2285–2288, https://doi.org/10.1029/1999GL011304, 2000.
Aoyama, Y., Doi, K., Shibuya, K., Ohta, H., and Tsuwa, I.: Near real-time monitoring of flow velocity and direction in the floating ice tongue of the Shirase Glacier using low-cost GPS buoys, Earth Planet. Space, 65, 103–108, https://doi.org/10.5047/EPS.2012.06.011, 2013.
Boening, C., Lebsock, M., Landerer, F., and Stephens, G.: Snowfall-driven mass change on the East Antarctic ice sheet, Geophys. Res. Lett., 39, L21501, https://doi.org/10.1029/2012GL053316, 2012.
Bracegirdle, T. J., Hyder, P., and Holmes, C. R.: CMIP5 Diversity in Southern Westerly Jet Projections Related to Historical Sea Ice Area: Strong Link to Strengthening and Weak Link to Shift, J. Climate, 31, 195–211, https://doi.org/10.1175/JCLI-D-17-0320.1, 2018.
Brunt, K. M., Fricker, H. A., Padman, L., Scambos, T. A., and O'Neel, S.: Mapping the grounding zone of the Ross Ice Shelf, Antarctica, using ICESat laser altimetry, Ann. Glaciol., 51, 71–79, https://doi.org/10.3189/172756410791392790, 2010.
Christianson, K., Bushuk, M., Dutrieux, P., Parizek, B. R., Joughin, I. R., Alley, R. B., Shean, D. E., Abrahamsen, E. P., Anandakrishnan, S., Heywood, K. J., Kim, T. W., Lee, S. H., Nicholls, K., Stanton, T., Truffer, M., Webber, B. G. M., Jenkins, A., Jacobs, S., Bindschadler, R., and Holland, D. M.: Sensitivity of Pine Island Glacier to observed ocean forcing, Geophys. Res. Lett., 43, 10817–10825, https://doi.org/10.1002/2016gl070500, 2016.
Cook, A. J., Holland, P. R., Meredith, M. P., Murray, T., Luckman, A., and Vaughan, D. G.: Ocean forcing of glacier retreat in the western Antarctic Peninsula, Science, 353, 283–286, 2016.
Durand, G., Gillet-Chaulet, F., Gagliardini, O., and Fürst, J. J.: SUMER Antarctic Ice-shelf Buttressing, Version 1. Boulder, Colorado USA, NASA National Snow and Ice Data Center Distributed Active Archive Center [data set], https://doi.org/10.5067/FWHORAYVZCE7, 2016.
Fahnestock, M., Scambos, T., Moon, T., Gardner, A., Haran, T., and Klinger, M.: Rapid large-area mapping of ice flow using Landsat 8, Remote Sens. Environ., 185, 84–94, https://doi.org/10.1016/J.RSE.2015.11.023, 2016.
Fricker, H. A., Coleman, R., Padman, L., Scambos, T. A., Bohlander, J., and Brunt, K. M.: Mapping the grounding zone of the Amery Ice Shelf, East Antarctica using InSAR, MODIS and ICESat, Antarct. Sci., 21, 515–532, https://doi.org/10.1017/S095410200999023X, 2009.
Fürst, J. J., Durand, G., Gillet-Chaulet, F., Tavard, L., Rankl, M., Braun, M., and Gagliardini, O.: The safety band of Antarctic ice shelves, Nat. Clim. Change, 6, 479–482, https://doi.org/10.1038/nclimate2912, 2016.
Gardner, A., Fahnestock, M., and Scambos, T. A.: ITS_LIVE Regional Glacier and Ice Sheet Surface Velocities, NASA National Snow and Ice Data Center Distributed Active Archive Center [data set], https://doi.org/10.5067/6II6VW8LLWJ7, 2020.
Gardner, A., Fahnestock, M., and Scambos, T.: MEaSUREs ITS_LIVE Landsat Image-Pair Glacier and Ice Sheet Surface Velocities, Version 1, Boulder, Colorado USA, NASA National Snow and Ice Data Center Distributed Active Archive Center [data set], https://doi.org/10.5067/IMR9D3PEI28U, 2022.
Gardner, A. S., Moholdt, G., Scambos, T., Fahnstock, M., Ligtenberg, S., van den Broeke, M., and Nilsson, J.: Increased West Antarctic and unchanged East Antarctic ice discharge over the last 7 years, The Cryosphere, 12, 521–547, https://doi.org/10.5194/tc-12-521-2018, 2018.
Greene, C. A., Blankenship, D. D., Gwyther, D. E., Silvano, A., and van Wijk, E.: Wind causes Totten Ice Shelf melt and acceleration, Sci. Adv., 3, e1701681–e1701681, https://doi.org/10.1126/sciadv.1701681, 2017.
Haran, T., Bohlander, J., Scambos, T., Painter, T., and Fahnestock, M.: MODIS Mosaic of Antarctica 2008–2009 (MOA2009) Image Map, Version 2. Boulder, Colorado USA, NASA National Snow and Ice Data Center Distributed Active Archive Center [data set], https://doi.org/10.5067/4ZL43A4619AF, 2019.
Haran, T., Bohlander, J., Scambos, T., Painter, T., and Fahnestock, M.: MODIS Mosaic of Antarctica 2008–2009 (MOA2009) Image Map, Version 2, Boulder, Colorado USA, NASA National Snow and Ice Data Center Distributed Active Archive Center [data set], https://doi.org/10.5067/4ZL43A4619AF, 2021.
Hazel, J. E. and Stewart, A. L.: Are the Near-Antarctic Easterly Winds Weakening in Response to Enhancement of the Southern Annular Mode?, J. Climate, 32, 1895–1918, https://doi.org/10.1175/JCLI-D-18-0402.1, 2019.
Heid, T. and Kääb, A.: Evaluation of existing image matching methods for deriving glacier surface displacements globally from optical satellite imagery, Remote Sens. Environ., 118, 339–355, https://doi.org/10.1016/J.RSE.2011.11.024, 2012.
Hersbach, H., Bell, B., Berrisford, P., Biavati, G., Horányi, A., Muñoz Sabater, J., Nicolas, J., Peubey, C., Radu, R., Rozum, I., Schepers, D., Simmons, A., Soci, C., Dee, D., and Thépaut, J.-N.: ERA5 hourly data on single levels from 1959 to present, Copernicus Climate Change Service (C3S) Climate Data Store (CDS) [data set], https://doi.org/10.24381/cds.adbb2d47, 2018.
Hersbach, H., Bell, B., Berrisford, P., Hirahara, S., Horányi, A., Muñoz-Sabater, J., Nicolas, J., Peubey, C., Radu, R., Schepers, D., Simmons, A., Soci, C., Abdalla, S., Abellan, X., Balsamo, G., Bechtold, P., Biavati, G., Bidlot, J., Bonavita, M., De Chiara, G., Dahlgren, P., Dee, D., Diamantakis, M., Dragani, R., Flemming, J., Forbes, R., Fuentes, M., Geer, A., Haimberger, L., Healy, S., Hogan, R. J., Hólm, E., Janisková, M., Keeley, S., Laloyaux, P., Lopez, P., Lupu, C., Radnoti, G., de Rosnay, P., Rozum, I., Vamborg, F., Villaume, S., and Thépaut, J.-N.: The ERA5 global reanalysis, Q. J. Roy. Meteorol. Soc., 146, 1999–2049, https://doi.org/10.1002/qj.3803, 2020.
Hirano, D., Tamura, T., Kusahara, K., Ohshima, K. I., Nicholls, K. W., Ushio, S., Simizu, D., Ono, K., Fujii, M., Nogi, Y., and Aoki, S.: Strong ice-ocean interaction beneath Shirase Glacier Tongue in East Antarctica, Nat. Commun., 11, 4221, https://doi.org/10.1038/s41467-020-17527-4, 2020.
Holland, P. R., Bracegirdle, T. J., Dutrieux, P., Jenkins, A., and Steig, E. J.: West Antarctic ice loss influenced by internal climate variability and anthropogenic forcing, Nat. Geosci., 12, 718–724, https://doi.org/10.1038/s41561-019-0420-9, 2019.
Howat, I. M., Porter, C., Smith, B. E., Noh, M.-J., and Morin, P.: The Reference Elevation Model of Antarctica, The Cryosphere, 13, 665–674, https://doi.org/10.5194/tc-13-665-2019, 2019.
Howat, I., Porter, C., Noh, M.-J., Husby, E., Khuvis, S., Danish, E., Tomko, K., Gardiner, J., Negrete, A., Yadav, B., Klassen, J., Kelleher, C., Cloutier, M., Bakker, J., Enos, J., Arnold, G., Bauer, G., and Morin, P.: The Reference Elevation Model of Antarctica – Strips, Version 4.1, Harvard Dataverse, V1 [data set], https://doi.org/10.7910/DVN/X7NDNY, 2022.
Jacobs, S. S., Helmer, H. H., Doake, C. S. M., Jenkins, A., and Frolich, R. M.: Melting of ice shelves and the mass balance of Antarctica, J. Glaciol., 38, 375–387, https://doi.org/10.3189/S0022143000002252, 1992.
Jenkins, A., Shoosmith, D., Dutrieux, P., Jacobs, S., Kim, T. W., Lee, S. H., Ha, H. K., and Stammerjohn, S.: West Antarctic Ice Sheet retreat in the Amundsen Sea driven by decadal oceanic variability, Nat. Geosci., 11, 733–738, https://doi.org/10.1038/s41561-018-0207-4, 2018.
Jezek, K. C., Curlander, J. C., Carsey, F., Wales, C., and Barry, R. G.: RAMP AMM-1 SAR Image Mosaic of Antarctica, Version 2. Boulder, Colorado USA, NASA National Snow and Ice Data Center Distributed Active Archive Center [data set], https://doi.org/10.5067/8AF4ZRPULS4H, 2013.
Kameda, T., Nakawo, M., Mae, S., Watanabe, O., and Naruse, R.: Thinning of the Ice Sheet Estimated from Total Gas Content of Ice Cores in Mizuho Plateau, East Antarctica, Ann. Glaciol., 14, 131–135, https://doi.org/10.3189/S0260305500008429, 1990.
Kittel, C.: Kittel et al. (2021), The Cryosphere: MAR and ESMs data, Zenodo [data set], https://doi.org/10.5281/zenodo.4459259, 2021.
Kittel, C., Amory, C., Agosta, C., Jourdain, N. C., Hofer, S., Delhasse, A., Doutreloup, S., Huot, P.-V., Lang, C., Fichefet, T., and Fettweis, X.: Diverging future surface mass balance between the Antarctic ice shelves and grounded ice sheet, The Cryosphere, 15, 1215–1236, https://doi.org/10.5194/tc-15-1215-2021, 2021.
Konrad, H., Shepherd, A., Gilbert, L., Hogg, A. E., McMillan, M., Muir, A., and Slater, T.: Net retreat of Antarctic glacier grounding lines, Nat. Geosci., 11, 258–262, https://doi.org/10.1038/s41561-018-0082-z, 2018.
Korona, J., Berthier, E., Bernard, M., Rémy, F., and Thouvenot, E.: ISPRS Journal of Photogrammetry and Remote Sensing SPIRIT, SPOT 5 stereoscopic survey of Polar Ice: reference images and topographies during the fourth International Polar Year (2007–2009), ISPRS J. Photogramm., 64, 204–212, https://doi.org/10.1016/j.isprsjprs.2008.10.005, 2009 (data available at: https://theia.cnes.fr/atdistrib/rocket/#/search?collection=Spirit, last access: 1 July 2022).
Kusahara, K., Hirano, D., Fujii, M., Fraser, A. D., and Tamura, T.: Modeling intensive ocean–cryosphere interactions in Lützow-Holm Bay, East Antarctica, The Cryosphere, 15, 1697–1717, https://doi.org/10.5194/tc-15-1697-2021, 2021a.
Kusahara, K., Hirano, D., Fujii, M., Fraser, A., and Tamura, T.: “Data for 'Modeling intensive ocean-cyrosphere interactions in Lützow-Holm Bay, East Antarctica”', Mendeley Data V1, [data set], https://doi.org/10.17632/z6w4xd6s3s.1, 2021b.
Lenaerts, J. T. M., van Meijgaard, E., van den Broeke, M. R., Ligtenberg, S. R. M., Horwath, M., and Isaksson, E.: Recent snowfall anomalies in Dronning Maud Land, East Antarctica, in a historical and future climate perspective, Geophys. Res. Lett., 40, 2684–2688, https://doi.org/10.1002/GRL.50559, 2013.
Leprince, S., Ayoub, F., Klinger, Y., and Avouac, J.-P.: Co-Registration of Optically Sensed Images and Correlation (COSI-Corr): an Operational Methodology for Ground Deformation Measurements, Igarss: 2007 Ieee International Geoscience and Remote Sensing Symposium, 1–12, 1943–1946, https://doi.org/10.1109/Igarss.2007.4423207, 2007 (data available at: http://www.tectonics.caltech.edu/slip_history/spot_coseis/download_software.html, last access: 1 April 2022).
Ligtenberg, S. R. M., van de Berg, W. J., van den Broeke, M. R., Rae, J. G. L., and van Meijgaard, E.: Future surface mass balance of the Antarctic ice sheet and its influence on sea level change, simulated by a regional atmospheric climate model, Clim. Dynam., 41, 867–884, https://doi.org/10.1007/S00382-013-1749-1, 2013.
Mae, S. and Naruse, R.: Possible causes of ice sheet thinning in the Mizuho Plateau, Nature, 273, 291–292, https://doi.org/10.1038/273291a0, 1978.
Marshall, G.: Trends in the Southern Annular Mode from observations and reanalyses, J. Climate, 16, 4134–4143, 2003.
Miles, B. W. J. J., Stokes, C. R., Jenkins, A., Jordan, J. R., Jamieson, S. S. R. R., and Gudmundsson, G. H.: Intermittent structural weakening and acceleration of the Thwaites Glacier Tongue between 2000 and 2018, J. Glaciol., 66, 485–495, https://doi.org/10.1017/jog.2020.20, 2020.
Moriwaki, K. and Yoshida, Y.: Submarine topography of Lützow-Holm Bay, Antarctica, Mem. Natl. Inst. Polar Res., 28, 247–258, 1983.
Morlighem, M.: MEaSUREs BedMachine Antarctica, Version 2, Boulder, Colorado USA, NASA National Snow and Ice Data Center Distributed Active Archive Center [data set], https://doi.org/10.5067/E1QL9HFQ7A8M, 2020.
Morlighem, M., Rignot, E., Binder, T., Blankenship, D., Drews, R., Eagles, G., Eisen, O., Ferraccioli, F., Forsberg, R., Fretwell, P., Goel, V., Greenbaum, J. S., Gudmundsson, H., Guo, J., Helm, V., Hofstede, C., Howat, I., Humbert, A., Jokat, W., Karlsson, N. B., Lee, W. S., Matsuoka, K., Millan, R., Mouginot, J., Paden, J., Pattyn, F., Roberts, J., Rosier, S., Ruppel, A., Seroussi, H., Smith, E. C., Steinhage, D., Sun, B., van den Broeke, M. R., van Ommen, T. D., van Wessem, M., and Young, D. A.: Deep glacial troughs and stabilizing ridges unveiled beneath the margins of the Antarctic ice sheet, Nat. Geosci., 13, 132–137, https://doi.org/10.1038/s41561-019-0510-8, 2020.
Mouginot, J., Rignot, E., and Scheuchl, B.: Sustained increase in ice discharge from the Amundsen Sea Embayment, West Antarctica, from 1973 to 2013, Geophys. Res. Lett., 41, 1576–1584, https://doi.org/10.1002/2013GL059069, 2014.
Nakamura, K., Doi, K., and Shibuya, K.: Estimation of seasonal changes in the flow of Shirase Glacier using JERS-1/SAR image correlation, Polar Sci., 1, 73–83, https://doi.org/10.1016/J.POLAR.2007.09.002, 2007.
Nakamura, K., Doi, K., and Shibuya, K.: Fluctuations in the flow velocity of the Antarctic Shirase Glacier over an 11-year period, Polar Sci., 4, 443–455, https://doi.org/10.1016/J.POLAR.2010.04.010, 2010.
Nakamura, K., Aoki, S., Yamanokuchi, T., and Tamura, T.: Interactive movements of outlet glacier tongue and landfast sea ice in Lützow-Holm Bay, East Antarctica, detected by ALOS-2/PALSAR-2 imagery, Sci. Remote Sens., 6, 100064, https://doi.org/10.1016/j.srs.2022.100064, 2022.
Naruse, R.: Thinning of the Ice Sheet in Mizuho Plateau, East Antarctica, J. Glaciol., 24, 45–52, https://doi.org/10.3189/S0022143000014635, 1979.
NASA: Worldview, https://worldview.earthdata.nasa.gov, last access: 20 October 2022.
Nishio, F., Mae, S., Ohmae, H., Takahashi, S., Nakawo, M., and Kawada, K.: Dynamical behaviour of the ice sheet in Mizuho Plateau, East Antarctica, Proc. NIPR Symp. Polar Meteorol. Glaciol., 2, 97–104, 1989.
Ohshima, K. I., Takizawa, T., Ushio, S., and Kawamura, T.: Seasonal variations of the Antarctic coastal ocean in the vicinity of Lützow-Holm Bay, J. Geophys. Res.-Oceans, 101, 20617–20628, https://doi.org/10.1029/96JC01752, 1996.
Pattyn, F. and Derauw, D.: Ice-dynamic conditions of Shirase Glacier, Antarctica, inferred from ERS SAR interferometry, J. Glaciol., 48, 559–565, https://doi.org/10.3189/172756502781831115, 2002.
Pattyn, F. and Naruse, R.: The nature of complex ice flow in Shirase Glacier catchment, East Antarctica, J. Glaciol., 49, 429–436, https://doi.org/10.3189/172756503781830610, 2003.
Perren, B. B., Hodgson, D. A., Roberts, S. J., Sime, L., van Nieuwenhuyze, W., Verleyen, E., and Vyverman, W.: Southward migration of the Southern Hemisphere westerly winds corresponds with warming climate over centennial timescales, Commun. Earth Environ., 1, 1–8, https://doi.org/10.1038/s43247-020-00059-6, 2020.
Reese, R., Gudmundsson, G. H., Levermann, A., and Winkelmann, R.: The far reach of ice-shelf thinning in Antarctica, Nat. Clim. Change, 8, 53–57, https://doi.org/10.1038/s41558-017-0020-x, 2018.
Rignot, E., Mouginot, J., Scheuchl, B., van den Broeke, M., van Wessem, M. J., and Morlighem, M.: Four decades of Antarctic ice sheet mass balance from 1979–2017, P. Natl. Acad. Sci. USA, 16, 1095–1103, https://doi.org/10.1073/pnas.1812883116, 2019.
Rintoul, S. R., Silvano, A., Pena-Molino, B., van Wijk, E., Rosenberg, M., Greenbaum, J. S., and Blankenship, D. D.: Ocean heat drives rapid basal melt of the Totten ice shelf, Sci. Adv., 2, e1601610, https://doi.org/10.1126/sciadv.1601610, 2016.
Scambos, T., Fahnestock, M., Moon, T., Gardner, A., and Klinger, M.: Global Land Ice Velocity Extraction from Landsat 8 (GoLIVE), Version 1, Boulder, Colorado USA, National Snow and Ice Data Center [data set], https://doi.org/10.7265/N5ZP442B, 2016.
Scambos, T. A., Haran, T. M., Fahnestock, M. A., Painter, T. H., and Bohlander, J.: MODIS-based Mosaic of Antarctica (MOA) data sets: Continent-wide surface morphology and snow grain size, Remote Sens. Environ., 111, 242–257, https://doi.org/10.1016/J.RSE.2006.12.020, 2007.
Scherler, D., Leprince, S., and Strecker, M. R.: Glacier-surface velocities in alpine terrain from optical satellite imagery – Accuracy improvement and quality assessment, Remote Sens. Environ., 112, 3806–3819, https://doi.org/10.1016/J.RSE.2008.05.018, 2008.
Schröder, L., Horwath, M., Dietrich, R., Helm, V., van den Broeke, M. R., and Ligtenberg, S. R. M.: Four decades of Antarctic surface elevation changes from multi-mission satellite altimetry, The Cryosphere, 13, 427–449, https://doi.org/10.5194/tc-13-427-2019, 2019.
Smith, B., Fricker, H. A., Gardner, A. S., Medley, B., Nilsson, J., Paolo, F. S., Holschuh, N., Adusumilli, S., Brunt, K., Csatho, B., Harbeck, K., Markus, T., Neumann, T., Siegfried, M. R., and Zwally, H. J.: Pervasive ice sheet mass loss reflects competing ocean and atmosphere processes, Science, 368, 1239–1242, https://doi.org/10.1126/science.aaz5845, 2020 (data available at: http://hdl.handle.net/1773/45388, last access: April 2022).
Sproson, A. D., Takano, Y., Miyairi, Y., Aze, T., Matsuzaki, H., Ohkouchi, N., and Yokoyama, Y.: Beryllium isotopes in sediments from Lake Maruwan Oike and Lake Skallen, East Antarctica, reveal substantial glacial discharge during the late Holocene, Quaternary Sci. Rev., 256, 106841, https://doi.org/10.1016/J.QUASCIREV.2021.106841, 2021.
Stokes, C. R., Abram, N. J., Bentley, M. J., Edwards, T. L., England, M. H., Foppert, A., Jamieson, S. S. R., Jones, R. S., King, M. A., Lenaerts, J. T. M., Medley, B., Miles, B. W. J., Paxman, G. J. G., Ritz, C., van de Flierdt, T., and Whitehouse, P. L.: Response of the East Antarctic Ice Sheet to past and future climate change, Nature, 608, 275–286, https://doi.org/10.1038/s41586-022-04946-0, 2022.
Thoma, M., Jenkins, A., Holland, D., and Jacobs, S.: Modelling Circumpolar Deep Water intrusions on the Amundsen Sea continental shelf, Antarctica, Geophys. Res. Lett., 35, L18602, https://doi.org/10.1029/2008GL034939, 2008.
Thompson, D. W. J. and Solomon, S.: Interpretation of recent Southern Hemisphere climate change, Science, 296, 895–899, https://doi.org/10.1126/science.1069270, 2002.
Thompson, D. W. J., Solomon, S., Kushner, P. J., England, M. H., Grise, K. M., and Karoly, D. J.: Signatures of the Antarctic ozone hole in Southern Hemisphere surface climate change, Nat. Geosci., 4, 741–749, https://doi.org/10.1038/ngeo1296, 2011.
Toh, H. and Shibuya, K.: Thinning rate of ice sheet on Mizuho Plateau, East Antarctica, determined by GPS differential positioning, in: Recent progress in Antarctic earth sciences, edited by: Yoshida, Y., Kaminuma, K., and Shiraishi, K., Tokyo, Terra Scientific Publishing Co., 579–583, 1992.
Turner, J.: Antarctic climate change during the last 50 years, Int. J. Climatol., 25, 279–294, 2005.
USGS: EarthExplorer, https://earthexplorer.usgs.gov/, last access: 20 October 2022.
Wang, G., Cai, W., and Purich, A.: Trends in Southern Hemisphere wind-driven circulation in CMIP5 models over the 21st century: Ozone recovery versus greenhouse forcing, J. Geophys. Res.-Oceans, 119, 2974–2986, https://doi.org/10.1002/2013JC009589, 2014.
Yin, J. H.: A consistent poleward shift of the storm tracks in simulations of 21st century climate, Geophys. Res. Lett., 32, L18701, https://doi.org/10.1029/2005gl023684, 2005.