the Creative Commons Attribution 4.0 License.
the Creative Commons Attribution 4.0 License.
 | 01 Feb 2023
Megadunes in Antarctica: migration and characterization from remote and in situ observations
Giacomo Traversa
Davide Fugazza
Massimo Frezzotti
Megadunes are peculiar features formed by the interaction between the atmosphere and cryosphere and are known to be present only on the East Antarctic Plateau and other planets (Mars and Pluto). In this study, we have analysed the glaciological dynamic of megadunes, their spectral properties and morphology on two sample areas of the East Antarctic Plateau where in the past international field activities were carried out (EAIIST, East Antarctic International Ice Sheet Traverse; It-ITASE, Italian International Trans-Antarctic Scientific Expedition). Using satellite images spanning 7 years, we analysed the spatial and temporal variability in megadune surface characteristics, i.e. near-infrared (NIR) albedo, thermal brightness temperature (BT) and slope along the prevailing wind direction (SPWD), useful for mapping them. These parameters allowed us to characterize and perform an automated detection of the glazed surfaces, and we determined the influence of the SPWD by evaluating different combinations of these parameters. The inclusion of the SPWD significantly increased the accuracy of the method, doubling it in certain analysed scenes. Using remote and field observations, for the first time we surveyed all the components of upwind migration (absolute, sedimentological and ice flow), finding an absolute value of about 10 m a−1. The analysis shows that the migration is driven by the snow accumulation on the crest and trough prograding upwind on the previous windward flanks characterized by glazed surface. Our results present significant implications for the surface mass balance estimation, paleo-climate reconstruction using ice cores, and the measurements using optical and radar images/data in the megadune areas.
- Article
(6930 KB) - Full-text XML
- BibTeX
- EndNote


Antarctic climate and mass balance have been highlighted by the Special Report on the Ocean and Cryosphere in a Changing Climate (Meredith et al., 2019) by the Intergovernmental Panel on Climate Change (IPCC) among the main uncertainties for the climate system and sea level projections. Surface mass balance (SMB) is the net balance between the processes of snow precipitation and loss on a glacier surface and provides mass input to the surface of the Antarctic Ice Sheet. Therefore, it represents an important control on the ice sheet surface mass balance and resulting contribution to global sea level change. Ice sheet SMB varies greatly across multiple scales of time (hourly to decadal) and space (metres to hundreds of kilometres), and it is notoriously challenging to observe and represent in atmospheric models (e.g. Agosta et al., 2019; Lenaerts et al., 2019). Moreover, given the difficulties in accessing the interior of the ice sheet, only limited field observation on past and current conditions exists. The southern part of the East Antarctic ice divide, from Concordia and Vostok stations to the South Pole, is the coldest and driest area on Earth and presents unique features called megadunes, which extend for more than 500 000 km2 (Fahnestock et al., 2000). The drivers of megadune formation are uncommon snow accumulation and redistribution processes driven by wind scouring that remain relatively unexplained (Fahnestock et al., 2000; Frezzotti et al., 2002a, b; Courville et al., 2007; Scambos et al., 2012; Dadic et al., 2013; Ekaykin et al., 2015). Ground surveys of megadunes show that snow is removed from their leeward slopes where a specific erosional type of snow, “glazed surface” or “wind crust”, is formed as a result. In contrast, snow accumulation is increased on the windward slopes that are characterized by the depositional types of the snow microrelief termed “sastrugi”. Glazed surfaces form because wind and sublimation can ablate much more snow/firn than is accumulated by annual solid precipitation, causing a persistent SMB close to zero or which is negative. The stability of climatic conditions could play a key role in megadune formation, since snow precipitation is very low, while katabatic wind intensity and direction are stable; these conditions affect snow sintering and a high grade of snow metamorphism (Albert et al., 2004; Courville et al., 2007; Scambos et al., 2012; Dadic et al., 2013). Megadunes are oriented perpendicular to the slope along the prevailing wind direction (SPWD); wave amplitudes are small (up to 8 m); wavelengths range from 2 to over 5 km; and megadune crests are nearly parallel, extending from tens to hundreds of kilometres (Swithinbank et al., 1988; Fahnestock et al., 2000; Frezzotti et al., 2002a, b; Arcone et al., 2012a, b). The angle between the katabatic wind direction and the direction of general surface slope at a regional scale can differ up to 50∘ due to the interaction between the topographic slope driving gravity and the Coriolis force (Fahnestock et al., 2000; Frezzotti et al., 2002b).
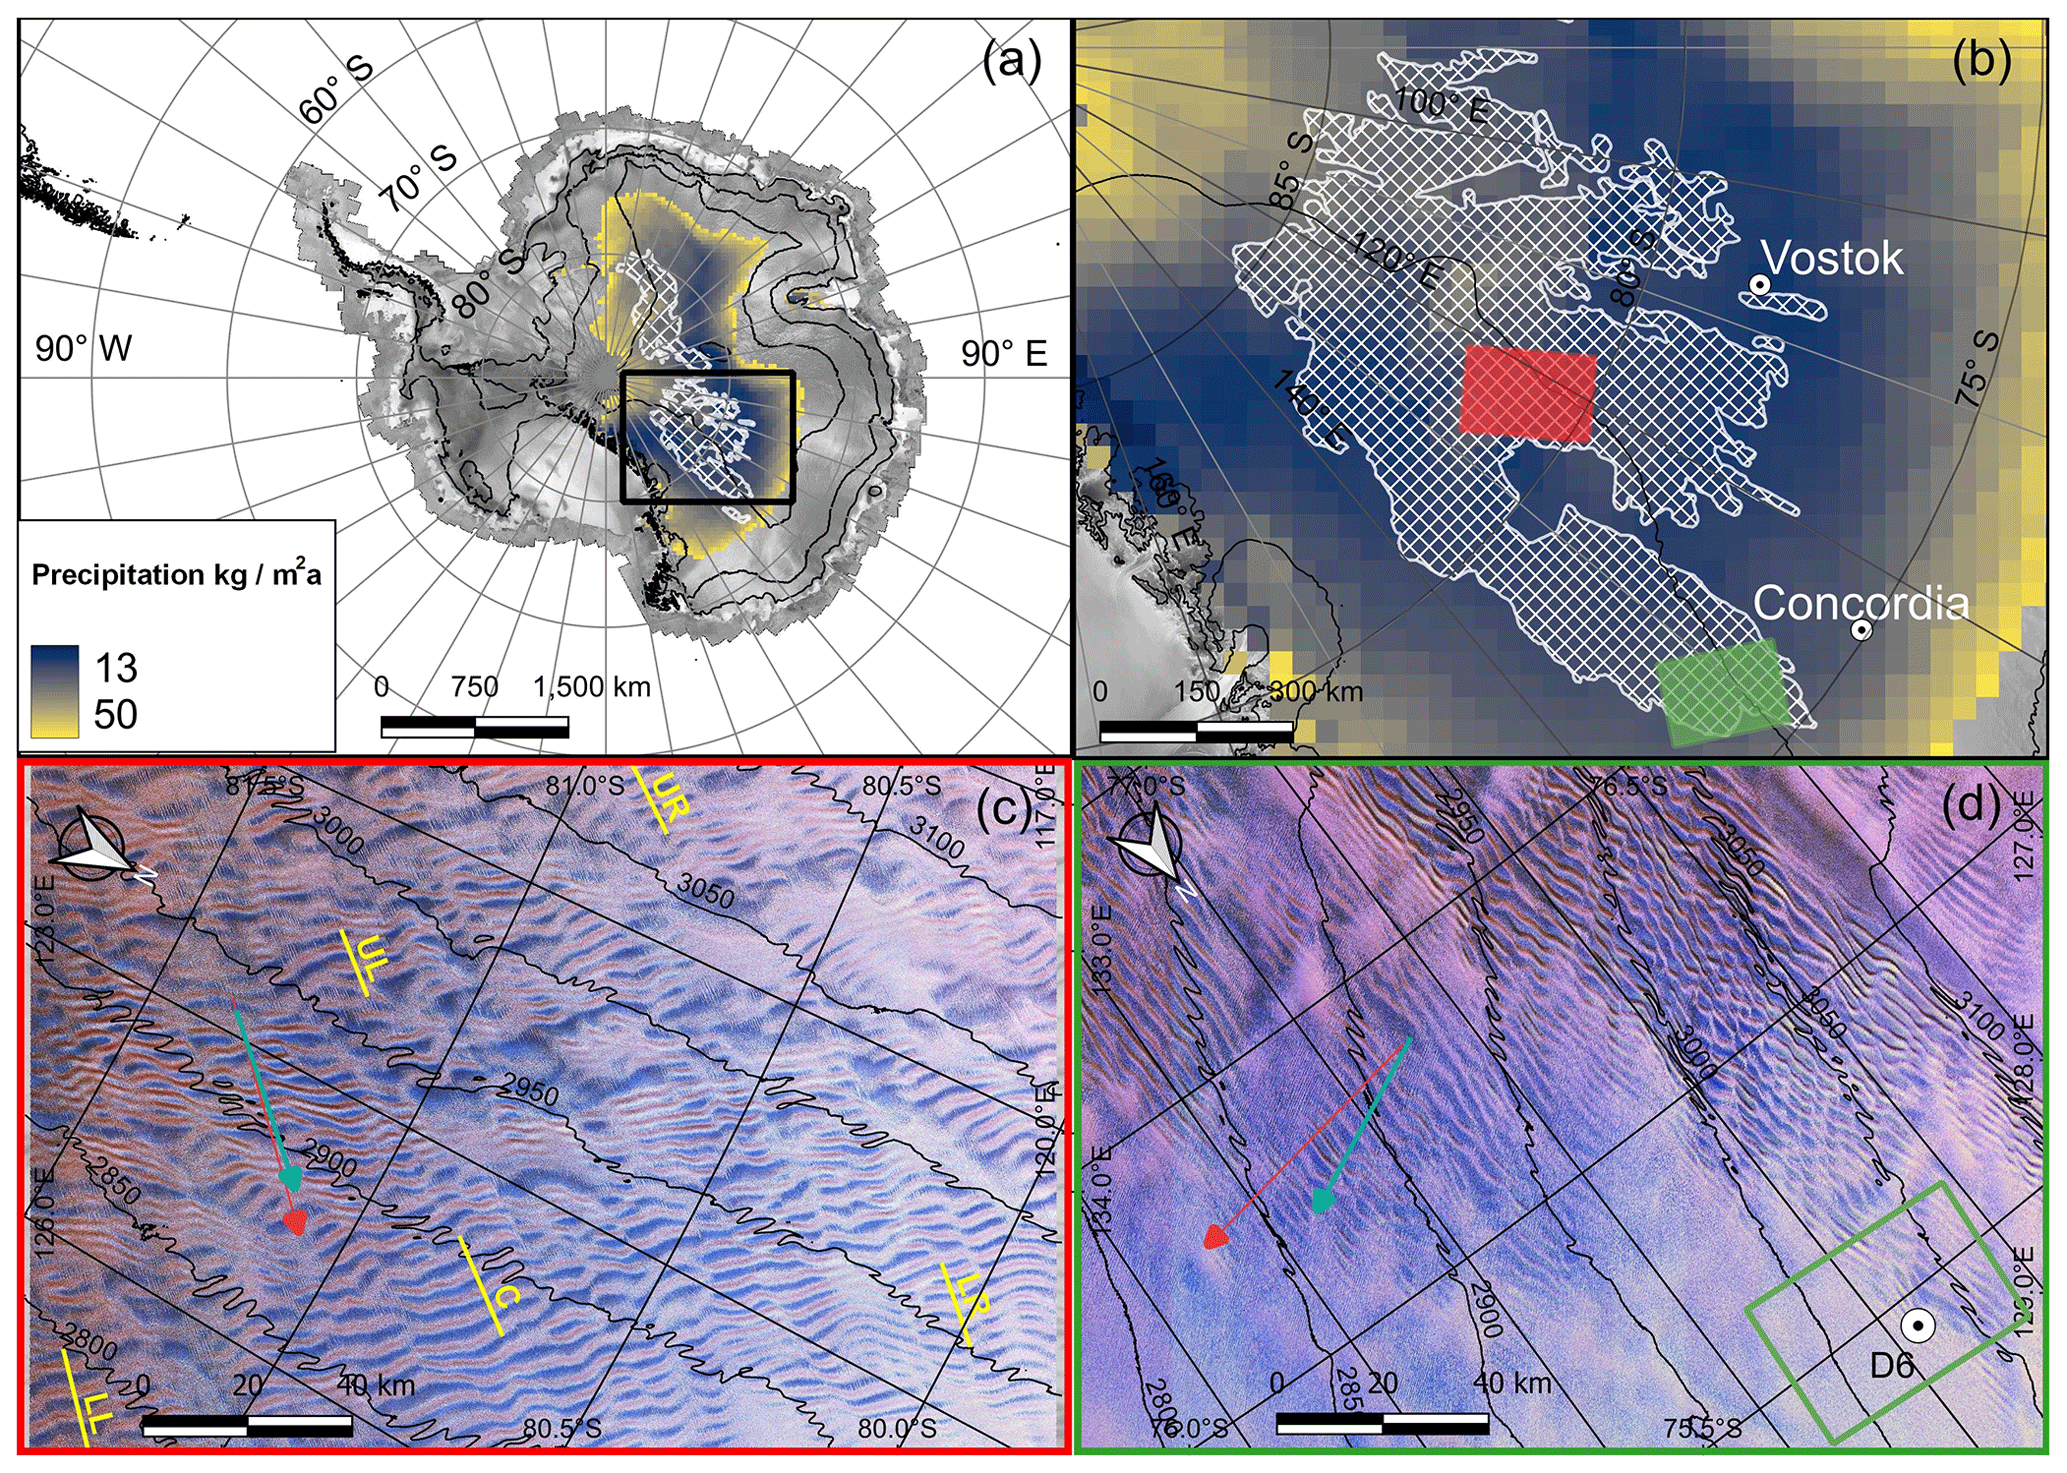
Figure 1Location map of megadune area. (a) Satellite image map of the Antarctic continent (Jezek, 1999) with elevation contour lines at 1000 m a.s.l. intervals; megadune regions are shown as cross-hatched white areas (Fahnestock et al., 2000), with snow precipitation by RACMO (Regional Atmospheric Climate Model) in colour for areas with precipitation < 50 kg m2 a−1 (Van Wessem et al., 2014) (black rectangle, b). (b) The megadune field with two study sites, EAIIST (red rectangle, c) and It-ITASE (green rectangle, d). (c) Landsat 8 OLI (Operational Land Imager) image in false colour (scene 069119 on 17 December 2015) of the EAIIST area. (d) Landsat 8 OLI image in false colour (scene 081114 on 18 December 2014) of the It-ITASE area and D6 core site; the green rectangle shows the location of Fig. 4. In panels (c) and (d), red arrows represent ERA5 wind direction and green arrows represent sastrugi-based wind direction, while the yellow lines show the location of the transects studied.
Based on previous studies, the SMB of megadunes ranges between 25 % (leeward faces, glazed surfaces) and 120 % (windward faces, covered by huge sastrugi up to 1.5 m in height) of accumulation in adjacent non-megadune areas (Frezzotti et al., 2002b). The sedimentary structure of buried megadunes examined via ground-penetrating radar (GPR) and the Global Positioning System (GPS) suggests that the sedimentary morphology of the windward face (sastrugi) migrates upwind with time, burying the glazed surface of the leeward face (Frezzotti et al., 2002b; Ekaykin et al., 2015), with typical “antidune” processes similar to those observed on fluvial and ocean bedforms (Prothero and Schwab, 2004). This uphill migration is caused by the difference in accumulation between windward (high-accumulation) and leeward (near-zero or negative-accumulation) sides, also leading to differences in snow features and surface roughness (Fahnestock et al., 2000; Frezzotti et al., 2002a; Albert et al., 2004; Courville et al., 2007). Megadunes appear to be formed by an oscillation in the katabatic airflow, leading to a wave-like variation in net accumulation; the wind waves are formed at the change in SPWD, in response to the buoyancy force, favouring the standing-wave mechanism (Fahnestock et al., 2000; Frezzotti et al., 2002b). Dadic et al. (2013) based their analysis on the surficial-flow theory for sediments in water (Núñez-González and Martín-Vide, 2011), and atmospheric-flow modelling, persistent katabatic winds, strong atmospheric stability and spatial variability in surface roughness are the primary controllers of upwind accumulation and migration of megadunes, where the latter represents the main factor that influences their velocity.
The surface waveforms of megadunes with regular bands of sastrugi and glazed surfaces allow for surveying the megadunes by satellite observations because of differences in albedo and microwave backscatter (Fahnestock et al., 2000; Frezzotti et al., 2002a; Scambos et al., 2012) between these features and surrounding snow. Spectral differences also lead to an effect on temperature, which is on average higher over glazed surfaces than on the snow surface (Fujii et al., 1987). In spite of the importance of the glazed surfaces of megadunes for the SMB of Antarctica, a remote sensing characterization of their physical properties and spatial distribution and a quantitative analysis of their migration are currently lacking. The aim of the study is to provide a detailed survey of the spatial and temporal variability in two megadune areas using remote sensing data (Landsat 8 and Sentinel-2), high-resolution elevation models (Reference Elevation Model of Antarctica, REMA; Howat et al., 2019) and climatic conditions using atmospheric reanalysis data (ERA5) in addition to past in situ measurement data (firn core, GPR and GPS) to explore spectral, thermal and windward slope relationships with a view towards generating an algorithm for their automatic detection. Moreover, we provide for the first time the first measurements of the absolute megadune movement and its different components: ice flow and sedimentological progradation. The analysis of absolute megadune movement has important implications on the remote sensing ice dynamic measurements, in particular on ice-flow measurements and elevation changes. Our work constitutes substantial progress towards the survey of ablation areas on SMB at small spatial scales over ice sheets using surface morphology (SPWD) and albedo detection by satellite. A clear understanding of these interactions is of primary importance for the climatic interpretation of ice records and for the assessment of processes and rates of wind scouring and its SMB implications.
Megadune fields on the Antarctic continent extend along 10∘ in latitude (75–85∘ S, about 1100 km) and 30∘ in longitude (110–140∘ E, about 300–600 km). The climatic conditions of the area are characterized by extremely low temperatures (mean annual temperatures from −45 to −60 ∘C), extremely low snow precipitation (< 30 mm w.e. a−1, water equivalent per year; Van Wessem et al., 2014; Agosta et al., 2019) and nearly constant katabatic wind direction and wind speed (6–12 m s−1; Courville et al., 2007). Analysis of data acquired by the Cloud-Aerosol Lidar and Infrared Pathfinder Satellite Observation (CALIPSO) satellite has enabled the construction of a 12-year climatology of blowing snow over Antarctica, showing that the greatest frequency of blowing-snow events, approaching 75 % of observations, is seen in the megadune region (Palm et al., 2019), which includes the study areas of the present work.
This research focuses on two megadune areas that were crossed and surveyed by two snow traverse expeditions: EAIIST (East Antarctic International Ice Sheet Traverse) in 2018–2019 and It-ITASE (Italian International Trans-Antarctic Scientific Expedition) in 1998–1999. The EAIIST area is situated 300 km east of Vostok Station (centred at S, E) and It-ITASE area 150 km east of Concordia Station (centred at S, E; Fig. 1). The survey data of the first area (EAIIST, https://www.ige-grenoble.fr/EAIIST-project-a-scientific-raid, last access: 15 January 2023) are being processing, whereas the in situ observations of the second traverse It-ITASE are available (Frezzotti et al., 2002a, b, 2004, 2005; Proposito et al., 2002; Vittuari et al., 2004). The EAIIST area is in the middle of the megadune area; thus, megadunes are well defined and continuous on satellite images in optical and microwave bands, whereas the It-ITASE area is at the north-eastern limit of the megadune field, where this morphology is discontinuous and disappears, thus representing the developing threshold of the environmental conditions (morphology, climatology, glaciology) determining megadune formation.
Topographically, the two study areas are in a relative sloping zone where the altitude decreases moving from SW to NE and the elevation ranges from 2700 to 3200 m a.s.l. Thus, the topographic aspect (the direction that a topographic slope faces) is generally east (∼ 80∘, It-ITASE; ∼ 70∘, EAIIST). The regional topographic slope (10 km scale) is on average 1.5 and 1.8 m km−1 for the It-ITASE and EAIIST areas, respectively. The katabatic wind direction is nearly constant with wind blowing from SW in both areas.
3.1 Data
In order to study the megadune areas, we combined three main datasets (satellite images; meteorological data from reanalysis products; digital elevation model, DEM) to create a method for the automatic detection of snow glazed surfaces. We tested two methods, one by creating five sample transects in the EAIIST area (Fig. 1c) and visually identifying thresholds of albedo, thermal brightness temperature (BT) and SPWD to discriminate between glazed surfaces and surrounding snow. The five transects were created in different areas of the megadune field, and they show relatively different wind directions and topographic aspect and slope, with the aim of representing the widest possible range of SPWD values. For the second method, i.e. a maximum likelihood supervised classification, we created 30 polygons in the glazed-snow area and 30 for firn, which were used to train the classification algorithm.
3.1.1 Satellite datasets
Two sources of satellite imagery were used: Landsat 8 OLI (EROS Center, 2013) satellite images (tile area: ∼ 38 000 km2) and Sentinel-2 (ESA, 2022) images (tile area: ∼ 12 000 km2), both downloaded from EarthExplorer portal (https://earthexplorer.usgs.gov/, last access: 24 December 2022). Landsat 8 OLI and Sentinel-2 provide data in several spectral bands, including panchromatic, visible, very near-infrared, short-wave infrared and thermal-infrared bands, with different spatial resolution from 10 to 100 m. Satellite images from Landsat 8 OLI (Table A1) were chosen at dates close to the first stripe acquisitions of the REMA DEM (2013, Table A2). The megadune area is subject to blowing-snow events (more than 75 % of the time; Palm et al., 2019) and cloud cover. Moreover, in the morning a strong atmospheric inversion layer develops 70 % of the time during summer on the Antarctic Plateau (Pietroni et al., 2014) with the formation of fog, which is not homogeneously distributed on the area surveyed by satellite images and is difficult to detect. Therefore, we excluded from our dataset all images with cloud cover > 10 % of land surface, visible blowing-snow and fog events and images with solar zenith angle (SZA) ≥ 75∘ (because of the effect on the albedo, as demonstrated by Picard et al., 2016) and obtained 17 images from Landsat 8 from 2013 to 2020 and 4 images from Sentinel-2 from 2018 to 2021 (Table A1), 11 for the EAIIST site and 6 for It-ITASE. To map glazed surfaces on megadunes, we used Landsat 8 OLI data as the method that rely on the calculation of the albedo, which have been thoroughly validated for Landsat 8 OLI (Traversa et al., 2021a). Additionally, Landsat 8 OLI is available for a longer period of time compared to Sentinel-2, allowing us to investigate temporal evolution of the megadune area. In the megadune area, the difference between snow glazed surfaces and snow is higher considering near-infrared (NIR) spectral albedo and BT (Traversa et al., 2021b). A “higher” amount of solar radiation absorbed by the glazed surface also corresponds to a different BT on snow glazed surfaces (Fujii et al., 1987; Scambos et al., 2012, and references therein). In fact, these zones show a higher BT compared to the upwind part of the dune characterized by the snow surface. In detail, we used the Landsat 8 OLI near-infrared band (NIR band 5, with a ground resolution of 30 m) to calculate NIR albedo and thermal-infrared (Thermal Infrared Sensor, TIRS 1) band 10 to calculate BT (with a ground resolution of 100 m, provided and resampled to 30 m). To perform the megadune migration analysis (Sect. 2.2.2), we used the panchromatic band of Landsat 8 OLI, as this band has a higher resolution (15 m) compared to the other spectral bands of Landsat. For comparison, Sentinel-2 images were also used, specifically NIR band 8 (10 m spatial resolution), which allows for better observing differences between snow and glazed surfaces compared to the other visible and infrared bands.
3.1.2 Atmospheric reanalysis dataset
We extracted wind direction from the ERA5 atmospheric reanalysis global climate dataset (Hersbach et al., 2020) and by identification of sastrugi based on Landsat (Sect. 2.2.1). In particular, we used ERA5 hourly data (https://doi.org/10.24381/cds.adbb2d47, Hersbach et al., 2018) of wind speed and direction at 10 m above the surface averaged over a 20-year temporal period, from 2000 to 2019. Beside using all wind speed observations, we further divided wind speed into five classes, only considering wind speed values above specific thresholds, i.e. wind speed > 3, > 5, > 7 and > 11 m s−1. These thresholds were chosen based on the interactions between wind and snow: snow transportation by saltation (within 0.3 m in elevation) at wind speeds between 2 and 5 m s−1, transportation by suspension (drift snow) at velocities > 5 m s−1 (within 2 m), and blowing snow (snow transportation higher than 2 m) at velocities between 7 and 11 m s−1 (see Frezzotti et al., 2004, and references therein). The threshold wind speed at which the sublimation of blowing snow starts to contribute substantially to katabatic flows in a feedback mechanism appears to be 11 m s−1 (Kodama et al., 1985; Wendler et al., 1993).
3.1.3 Topographic dataset (DEM)
In order to obtain the aspect and slope of the surface for the SPWD calculation and perform topographic correction for the calculation of albedo, we used a mosaic of REMA tiles (Howat et al., 2019, 2022). These are constructed from thousands of individual stereoscopic DEMs at high spatial resolution (8 m). Each individual DEM was vertically registered to satellite altimetry measurements from CryoSat-2 and ICESat (Ice, Cloud, and land Elevation Satellite), resulting in absolute uncertainties of less than 1 m and relative uncertainties of decimetres. REMA is based mainly on imagery acquired during the austral summer period (December–March), and at the two sites, the temporal period is from 2008 to 2017, although 87.5 % of stripes were acquired in 2013–2017 (Table A2).
3.2 Methods
The study includes four main processing steps: Landsat 8 OLI image processing for the calculation of NIR albedo, extraction of thermal BT from Landsat thermal band 10, SPWD calculation from ERA5 and satellite sastrugi-based wind direction, estimation of the surface velocity and migration of megadunes using feature tracking (2014–2021), and comparison of GPR–GPS measurements from 1999 with the REMA DEM from 2014 (specific strip on the area). The first three steps were the basis of the automatic detection of the glazed-snow areas.
3.2.1 Automatic detection of snow glazed surfaces
By using spectral datasets and topographic data, we consider for the automatic detection of the glazed areas the following parameters: NIR albedo, thermal BT and SPWD. NIR albedo (α) was here estimated using Landsat 8 OLI imagery, following the method first proposed by Klok et al. (2003) and recently tested and validated in Antarctica by Traversa et al. (2021a). We used NIR albedo as opposed to broadband albedo owing to the higher detection ability of NIR albedo, which stems from the fact that broadband albedo obtained by using the Liang conversion algorithm (Liang, 2001) considers the visible area of the spectrum and the short-wave infrared. In fact, in broadband albedo it is hardly possible to recognize the differences between glazed and unglazed areas, which in the visible wavelengths look very similar (Warren, 1982).
Following the methodology proposed by Traversa et al. (2021a) and Traversa and Fugazza (2021), the images were processed through three main steps: (1) conversion of radiance to top-of-atmosphere (TOA) reflectance by using per-pixel values of the SZA available through the Landsat solar zenith band. This conversion allows for applying a more accurate per-pixel correction for the SZA, useful in our study considering the average high SZA (always ≥ 59∘, Table A1) and its strong effect on albedo (Pirazzini, 2004; Picard et al., 2016; Traversa et al., 2019). Also included are (2) atmospheric correction and (3) topographic correction.
To retrieve the thermal BT, we employed band 10 of Landsat 8. To estimate the TOA thermal BT received at the satellite, spectral radiance in the thermal band was converted using the thermal constants in the Landsat metadata (Zanter, 2019).
For the SPWD, the wind directions were extracted at low spatial resolution (30 km) using ERA5 and validated by identifying sastrugi and deriving wind directions from them using Landsat 8 OLI at 30 m spatial resolution (Mather, 1962; Parish and Bromwich, 1991). The identification of sastrugi was performed on the Landsat 8 OLI NIR band (band 5) by applying the Canny edge detection algorithm (i.edge in GRASS GIS, Geographic Resources Analysis Support System geographic information system; Canny, 1986). Prior to edge detection, each image was pre-processed by using a high-pass filter with a length scale of 150 m implemented through a fast Fourier transform to highlight the sastrugi. This process was applied on seven Landsat scenes from the spring and summer months, i.e. November, December and January of the period 2013–2020.
To further estimate the SPWD based on the wind direction from ERA5 and Landsat-derived sastrugi, we used the approach of Scambos et al. (2012); i.e. we calculated the dot product between the slope derived from the REMA DEM and the wind direction. The algorithm was applied to ERA5 and sastrugi-based wind directions resampled at 120 m spatial resolution, and the REMA DEM was resampled to match ERA5 and sastrugi-based wind directions using bilinear interpolation. The resulting SPWD has units of metres per kilometre.
Due to the small difference in NIR albedo and BT of glazed surfaces (leeward) and sastrugi (windward) and the different illumination and meteorological conditions of the satellite images, the analysis of the variability in SPWD, NIR albedo and BT was conducted in detail on the five transects perpendicular to megadunes. The comparisons were conducted using the albedo and temperature values and normalized using mean and standard deviation for each transect. Moreover, we determined the strength of the relationship between SPWD and NIR albedo and between SPWD and thermal BT (applied on the moving averages of 11 pixels weighted based on the distance from the central point) using linear regression. The comparison analysis was conducted at seasonal scale for the 2013–2014 (4 images) and at multi-annual scale on 17 images distributed over 8 years.
With the aim of providing an automatic methodology for distinguishing the glazed snow from the surrounding firn surface and evaluating the role of SPWD in the classification, we applied and compared two different approaches: a supervised classification (maximum likelihood) and a self-defined-threshold approach. In both cases, we considered SPWD, NIR albedo and thermal BT. The analysed images were the one from 17 December 2015, which was one of the best available images in terms of cloud cover (∼ 0 %), presenting no blowing snow/fog and the lowest SZA (67∘) for the EAIIST site and the closest date to the REMA DEM in the area (January–October 2016), and the four scenes available for the 2013–2014 season (i.e. 25 November 2013, 11 December 2013, 27 December 2013 and 28 January 2014). For the self-defined-threshold method, we applied a conditional evaluation (i.e. output result for each pixel based on whether the pixel value is assessed as true or false in a set conditional statement) to automatically map glazed snow. The thresholds were visually identified and iteratively adjusted to obtain a best fit as follows: SPWD > 1 m km−1, with the aim of considering the leeward flanks only, NIR albedo < 0.82 and thermal BT > 246.5 K. In order to evaluate the role of each parameter, with particular attention to the SPWD, we repeated the two approaches by using individual parameters (NIR, SPWD, BT) and combinations of them (i.e. NIR–SPWD, NIR–BT, BT–SPWD and NIR–BT–SPWD). Finally, we calculated the accuracy for each case, by creating a set of random points (100 points, following the density used in Azzoni et al., 2016) as ground truth (visually assigned on the false-colour image) and comparing the results through a confusion matrix. The accuracy was calculated not only for methodologies in their entireness (identifying and distinguishing glazed snow and the surrounding firn surface) but also with respect to their specific ability in detecting glazed snow.
3.2.2 Megadune movement estimation
Frezzotti et al. (2002b) and Ekaykin et al. (2015), based on the sedimentary structure of buried megadunes (using GPR and GPS), pointed out that the megadune migration and ice sheet surface flow show a similar intensity but opposite directions and that megadunes migrate upwind with time, burying the glazed surface of the leeward face.
Here, by using different satellite images and field data, we are able to provide and quantify megadune migration components: ice-flow (If) direction, which is correlated mainly to topographic slope; sedimentological migration (Ms), caused by sedimentological processes linked to deposition (on the upstream dune flank); ablation (on the downstream dune flank) of snow; and the result of these processes, the absolute migration (Ma):
During the It-ITASE traverse at the D6 site, megadunes were surveyed by means of GPR–GPS to measure ice velocity, surface elevation, and internal layering of present and buried megadunes. We compared these measurements with the REMA DEM derived by satellite images acquired in 2014 to estimate the change in surface morphology due to sedimentological migration of the megadunes. With the aim of calculating the surface velocity and direction of megadune movement, the feature-tracking module IMCORR (Scambos et al., 1992) was run in the System for Automated Geoscientific Analyses (SAGA GIS). This algorithm performs image correlation based on two images providing the displacement of each pixel between the second and first image (Jawak et al., 2018). Prior to feature tracking, each image pair was pre-processed by using a low-pass filter with a length scale of 150 m implemented through a fast Fourier transform to smooth out the sastrugi and leave megadune features for tracking. Finally, by dividing the displacement values obtained through IMCORR by the corresponding time period, we obtained the absolute migration of the megadunes in metres per year. For comparison, we also employed another method to evaluate the megadune migration. By using Landsat 8 OLI imagery, similarly to what was already done for the detection of sastrugi and applying an edge detection on band 5 (NIR), it is possible to identify the megadune crest and trough at the edges between leeward (glazed snow) and windward (sastrugi) zones. The obtained direction raster was manually cleaned from errors and artefacts (angles: < 200 and > 240∘, intensity: < 5 m a−1) and then vectorized after thinning, i.e. reducing the number of cells used to represent the width of the features to 1 pixel. Comparing the obtained velocity fields in different years, we could observe the absolute migration of the megadunes.
We considered the widest temporal interval between two pairs of cloud-free images of Landsat 8 (four pairs) and Sentinel-2 (two pairs), which were in a similar period of the year, to avoid relevant differences in the SZA that could confound the feature-tracking algorithm (Table 1).
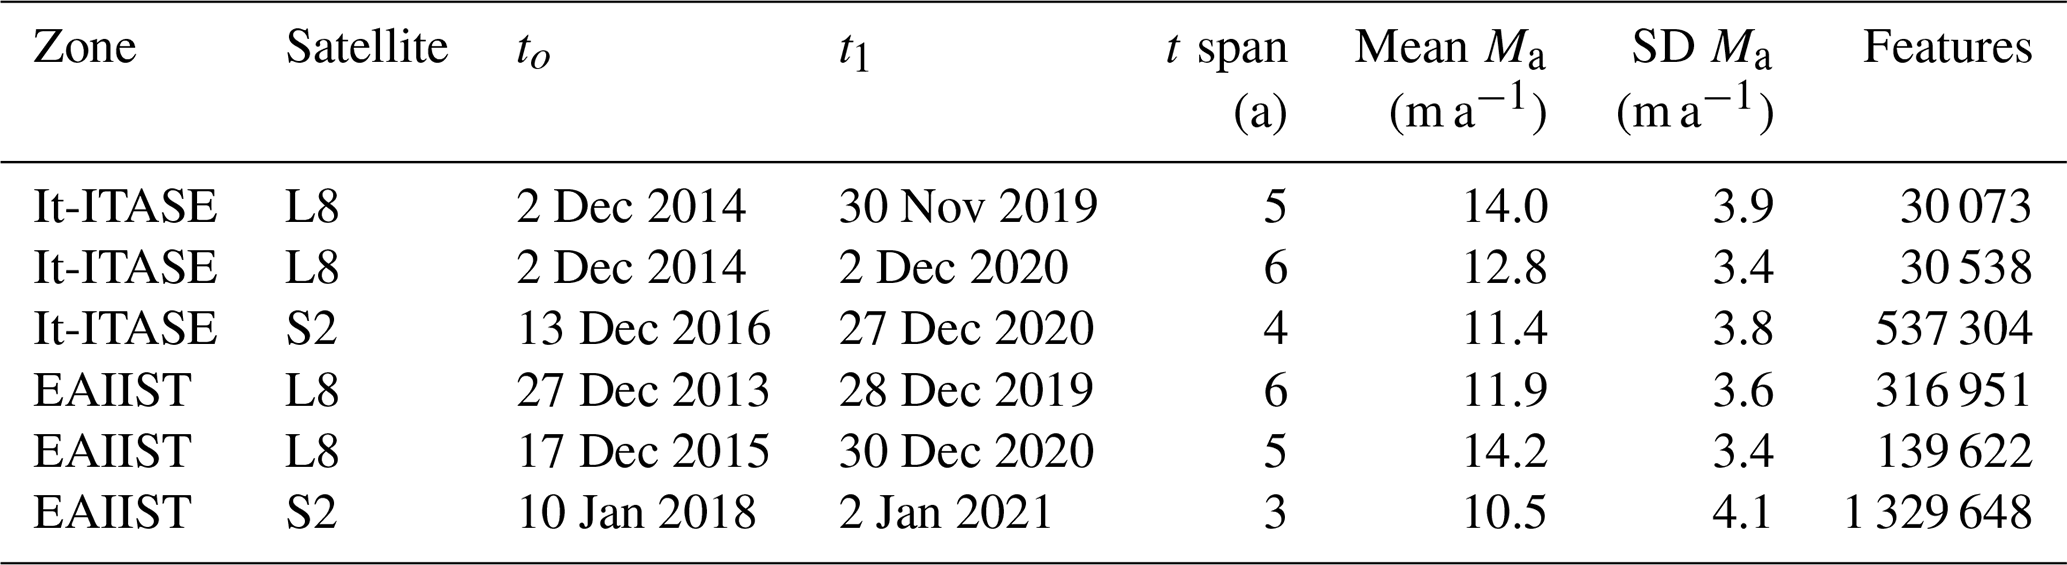
Table 1Results of the absolute migration of megadunes calculated from IMCORR based on Landsat 8 OLI (L8), with a tile area of ∼ 38 000 km2, and Sentinel-2 (S2), with a tile area of ∼ 12 000 km2. Imagery at the It-ITASE and EAIIST sites.
The results from IMCORR and GPS observations were compared with the MEaSUREs (Making Earth System Data Records for Use in Research Environments) ice-flow velocity product (Rignot et al., 2017), which provides the highest-resolution (450 m) digital mosaic of ice motion in Antarctica (assembled from multiple satellite interferometric synthetic-aperture radar (SAR) systems, mostly between 2007–2009 and 2013–2016), showing for each pixel the direction and the velocity of ice flow with a mean error of 3 %–4 %.
4.1 Megadune characterization and automatic detection
On average, in the five analysed transects NIR albedo ranges from 0.81 to 0.86 (α) in the upwind area (snow sastrugi) and from 0.73 to 0.81 (α) downwind (glazed surfaces), with differences inside the transects of about 0.07 (α) with a maximum value of 0.1 (α). The maximum contrast of NIR albedo between glazed surfaces and snow sastrugi usually occurs at springtime (October–November) and decreases during the summer season (Fig. 2). Our remote sensing observations agree with previous analysis that pointed out that in late summer, radiative cooling of the uppermost surface layer leads to formation of surface frost, by condensation of local atmospheric vapour onto the snow surface; this gives the glazed surface a more diffuse specular reflection than in spring and changes its appearance in albedo and BT (Scambos et al., 2012, and references therein). Along the transects, the correlation of NIR albedo from the different images is high (R2: up to 0.99) during the spring season (24 November 2013, 27 December 2013) and decreases by the end of the summer and in comparison with the following years, with an R2 of 0.7 only after 2 years (17 December 2015) and up to 0.6 after 6 years (December 2019). A similar decrease in correlation occurs from the comparison of the SPWD and NIR albedo from 2013 (R2: 0.66) to 2019 (R2: 0.39).
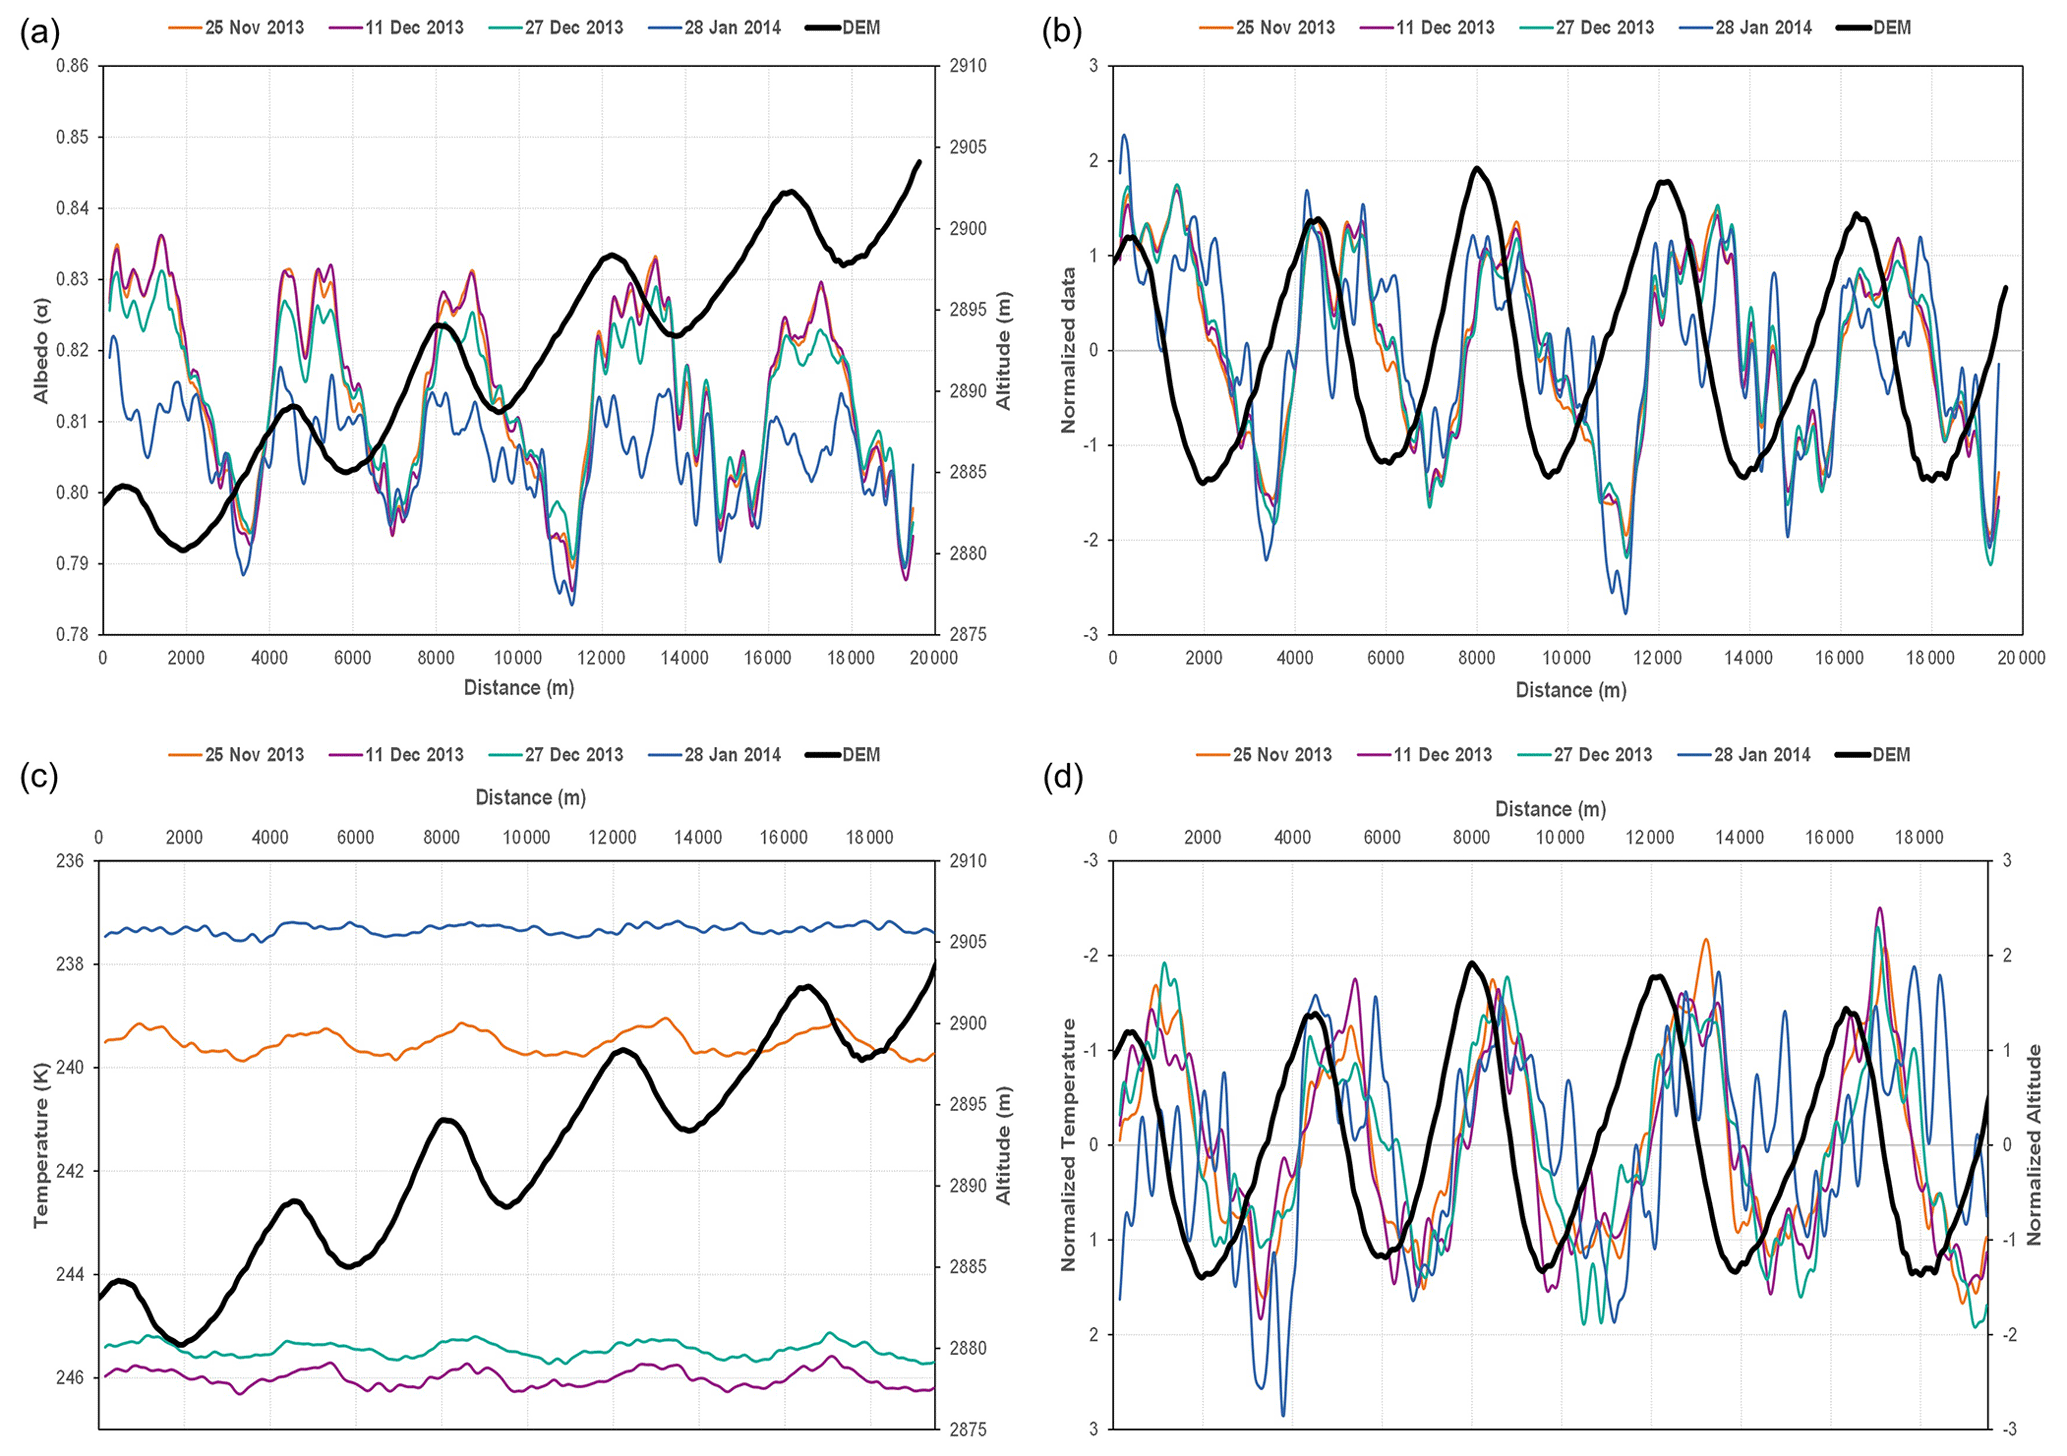
Figure 2Moving averages (based on 11 transect pixels) of (a) NIR albedo and (c) thermal BT TIRS1 between November 2013 and February 2014 for transect C at the EAIIST site (see Fig. 1c for location) and elevation from the REMA DEM. Corresponding normalized moving averages of (b) NIR albedo and (d) thermal BT TIRS1 during the austral summer season 2013–2014 for transect C and elevation from the REMA DEM (detrended topography).
For the thermal BT, we observed an intra-seasonal trend on all transects: in fact, while thermal BT remains ≥ 244 K during the middle of the summer (11 and 27 December 2013), it decreases moving away from the summer solstice. Temperatures range between 238 and 240.5 K on 25 November 2013, 26 d from the solstice. The difference increases on the date farthest from the solstice, 28 January 2014 (38 d from the solstice), with the lowest values ranging between 236 and 239 K. The BT varies up to 1.5 K for each transect but up to 3–4 K within individual images. Intra-annually, the difference between glazed surfaces and snow is higher during the spring (max 1 K in November) and tends to decrease over time, becoming lower than 0.5 K at the end of summer (January), where differences between the two surfaces are hardly detectable and the correlation between the two parameters frequently decreases drastically. These differences are directly correlated to the ones observed in NIR albedo, as a higher quantity of energy is absorbed on glazed surfaces.
High correlations are found between NIR albedo and thermal BT with an R2 of up to 0.67 (95 % confidence interval) and between SPWD vs. NIR albedo and thermal BT (R2=0.44 and 0.57 at 95 % confidence interval, respectively) calculated along all the transects (Fig. 3). The comparison between thermal BT and SPWD shows the same pattern observed for the NIR albedo but is proportionally inverse with respect to SPWD (Fig. 3), with higher temperatures corresponding to the glazed part of downwind areas of the dunes and conversely, lower values related to snow sastrugi in the upwind zones.
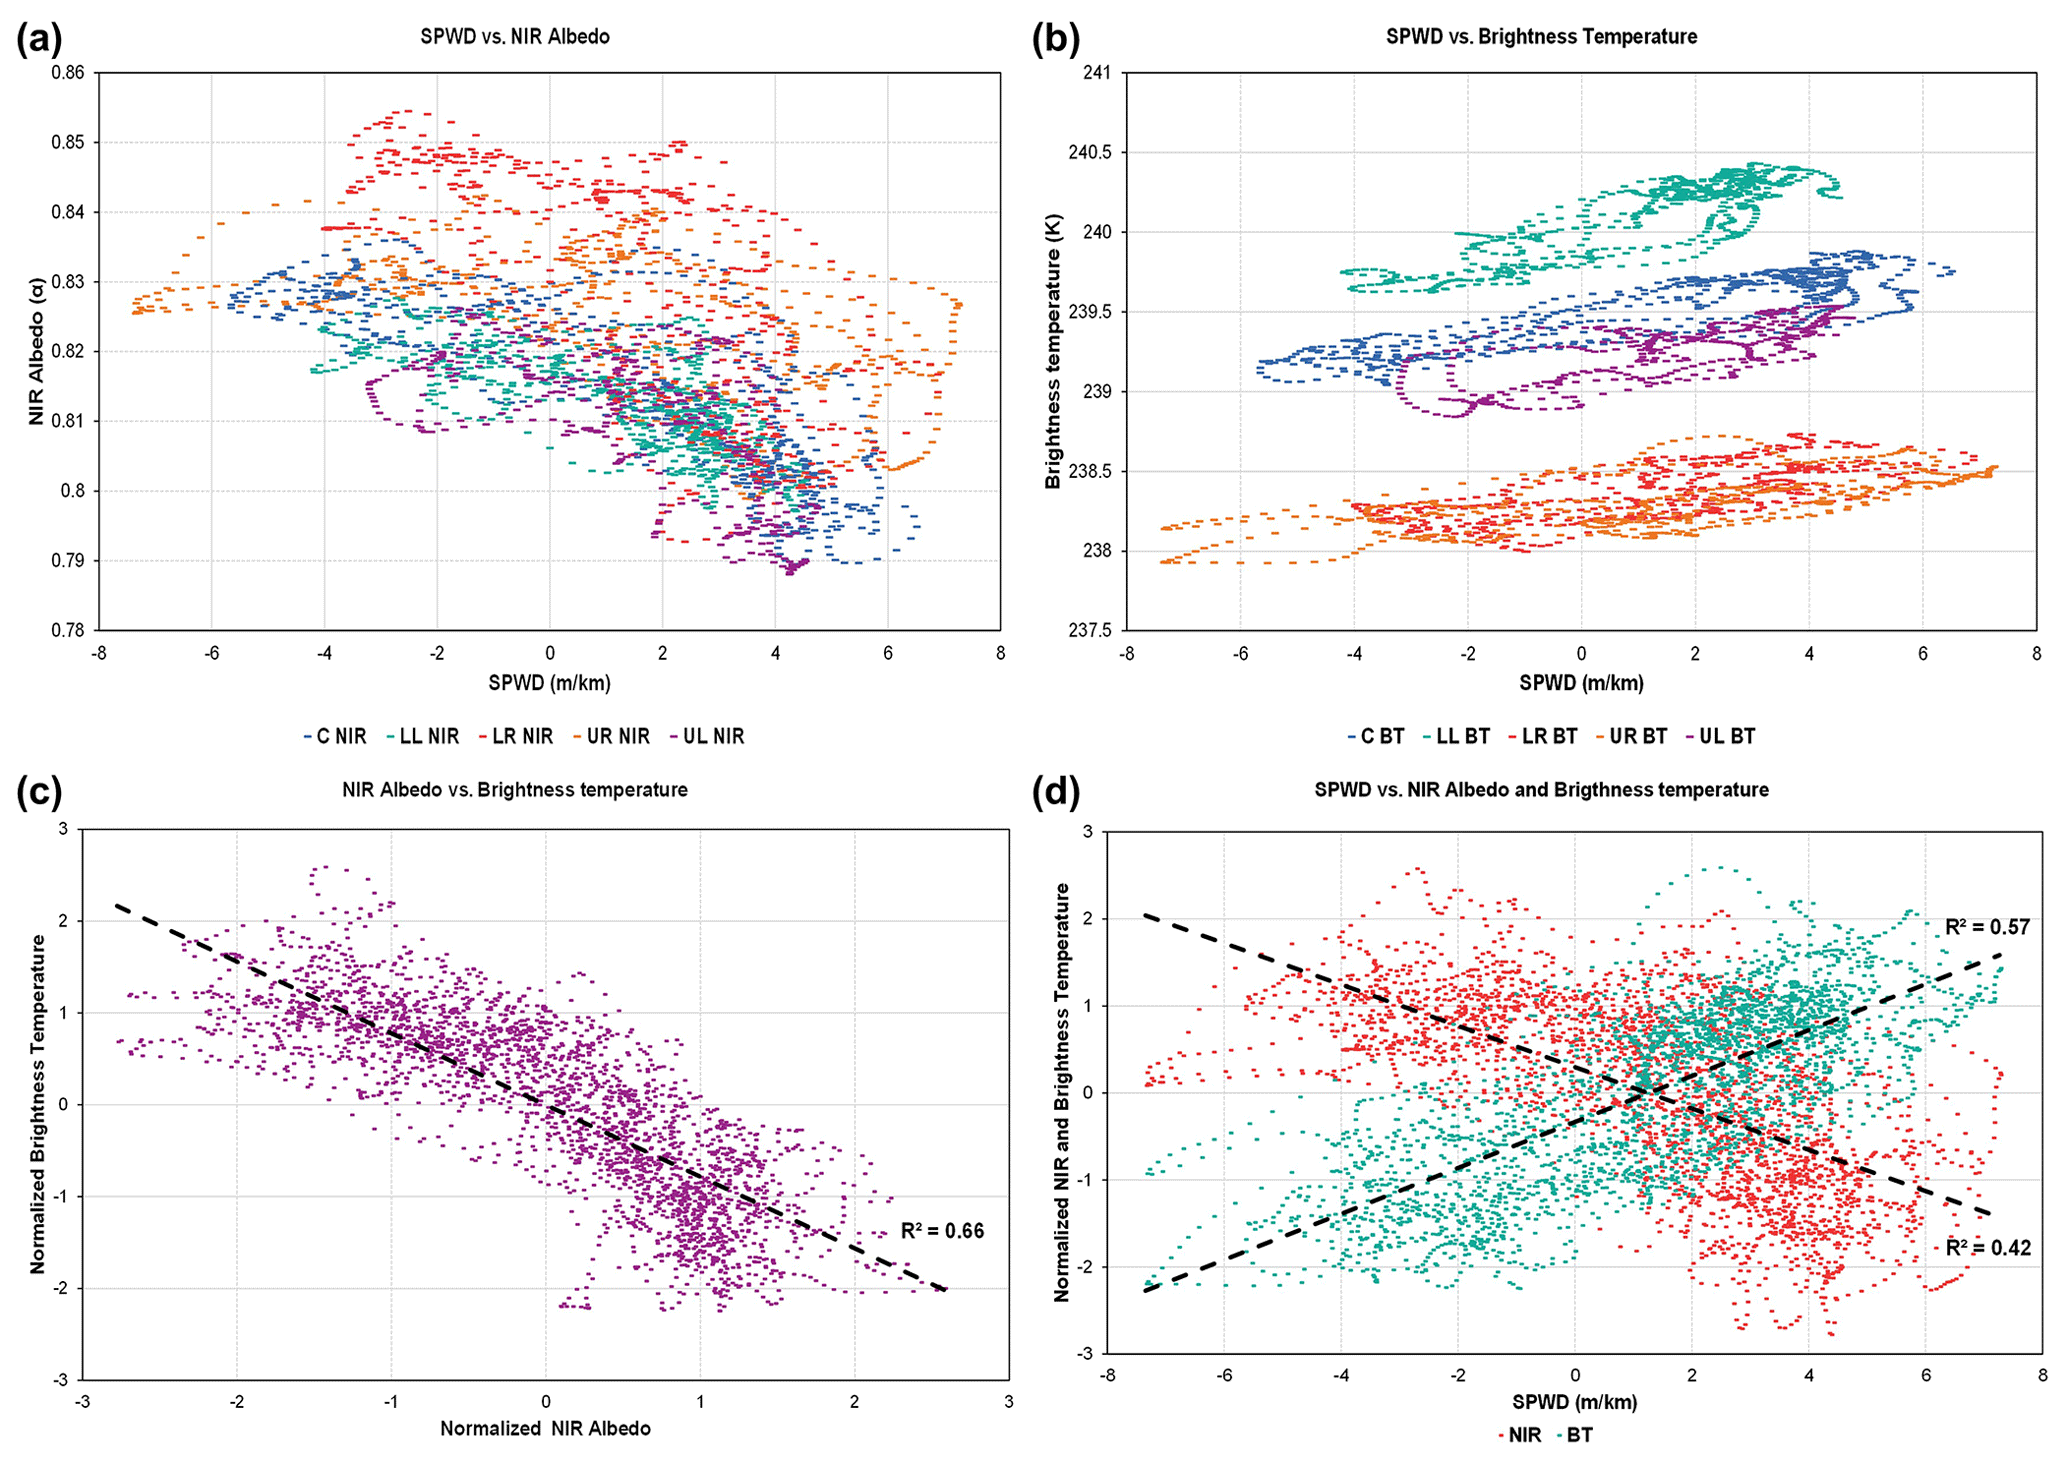
Figure 3Diagram plots of transects at the EAIIST site from a Landsat 8 image acquired on 25 November 2013: (a) SPWD (slope along the prevailing wind direction) compared within each transect (C, LL, LR, UL, UR; Fig. 1 for location) with NIR spectral albedo and (b) thermal BT; (c) normalized NIR albedo of all transects compared with BT with linear regression; and (d) SPWD compared with normalized NIR albedo and thermal BT for all transects with linear regression.
Based on the transects, the variability in NIR albedo at a seasonal (spring–summer) to pluriannual scale is observed to be twice as large in the snow accumulation area on the upwind flank and the bottom of the leeward flank (Fig. 2) compared to the glazed-surface NIR albedo (0.7 % compared to 0.3 % NIR albedo variability), which remains more stable and more highly correlated at a seasonal (spring–summer) and pluriannual scale.
The analysis of sastrugi direction using seven Landsat scenes from the spring and summer months during the period 2013–2020 show small differences in direction within each image and in repeated imagery (< 5∘), confirming the stability in direction of sastrugi landforms and thus the persistence of katabatic wind.
The comparison of the results of wind direction obtained using sastrugi direction by satellite (resampled using bilinear interpolation) and ERA5 present similar values for both areas, with a lower difference in the EAIIST area (differences of 1∘ in average values) compared to It-ITASE (9–14∘; see Table A3).
At the regional scale (30 km spatial resolution), the entire megadune field has an average SPWD of 1.2 m km−1, when calculated using sastrugi-based wind direction, and 1.1 m km1 when using ERA5, in agreement with previous studies (e.g. Frezzotti et al., 2002b). To distinguish between leeward (glazed surface) and windward flanks of the dunes for the two sites, the SPWD based on sastrugi was further resampled to 120 m using bilinear interpolation. For the SPWD on megadunes at a local scale (100 m), we found a mean value of 5.6 ± 1.0 m km−1 for the leeward side and negative SPWD values, with a mean of −4.2 ± 1.6 m km−1 on the windward flanks.
The application of the supervised classification and the self-defined-threshold methodology on the different combination of the analysed parameters for the 2013–2014 season and on the 17 December 2015 scene showed contrasting results (Table 2).
Table 2Accuracy assessment (%) in the detection of glazed snow using a supervised classification applied on NIR, BT and SPWD and their combination over the four scenes of the 2013–2014 summer season and on 17 December 2015. The results of BT and SPWD (alone) are not reported, as they present the same result in all cases (i.e. 0 % for BT and 30 % for SPWD).

In fact, even if the general accuracy in distinguishing firn and glazed surfaces was on average high (mostly > 80 %), with the highest values on the scene from 17 December 2015 (up to 94 % and 98 % in the combination of NIR–SPWD for supervised and self-defined thresholds, respectively), lower values and higher differences were found when comparing the accuracy in detecting only glazed snow. There, the inclusion of SPWD in the classification significantly improves the ability to detect these surfaces, with a doubling of the accuracy during the season 2013–2014 (between 0 % and 30 % for single parameters or combination without SPWD to around 50 % of season average in the other cases and up to 55 % for the NIR–BT–SPWD combination). The increase is also observed for the 17 December 2015 scene, from 78 % of NIR alone to 83 % for NIR–SPWD (which becomes 95 % in the case of NIR–SPWD for the self-defined-threshold methodology, the highest calculated value of accuracy in detecting glazed snow). Summarizing, the impact of the inclusion of the SPWD is evident, both applying the supervised classification and self-defined-threshold methodology, as the SPWD doubles the accuracy compared to the cases with no SPWD. We further observed issues in using BT in these approaches because of its high heterogeneity at a high scale (i.e. entire Landsat scene), as BT presents strong variations across the image; the strong improvement in using a scene (i.e. 17 December 2015) with no interferences (e.g. fog, clouds, “low” SZA) and close in time to the REMA DEM (stripes from January to October 2016), leading to a significant increase in accuracy of the method (from highest values of ∼ 50 % of scenes from season 2013–2014 to over 80 %); and the higher accuracy when applying a self-defined-threshold approach.
4.2 Megadune migration
The absolute megadune movement calculated using feature tracking on optical satellite image pairs spans from 3 to 6 years and presents small differences in the two study areas, ranging between 10.5 and 14.2 m a−1 overall, with no detected significant trends over time. The average values are similar when using different datasets (Landsat 8 OLI and Sentinel-2) but with Sentinel-2 velocities showing slightly lower average values compared to Landsat 8. Moreover, due to the slightly higher spatial resolution (10 m vs. 15 m), the number of features tracked using Sentinel-2 is an order of magnitude higher than that of Landsat 8 OLI (Table 1), even if the number of pixels is higher (with a ratio of 1.4) in Landsat scenes. The direction of the migration does not differ much across the different datasets, showing opposite values compared to wind direction. The second method used to calculate the migration velocity is the ridge vectorization and tracking for the same image pairs. This method shows slightly higher velocities (16.7 ± 3 m a−1) than IMCORR tracking of megadune features (11.9 ± 3.6 m a−1) at the EAIIST site for the period 2013–2019 but within the error.
At the D6 It-ITASE site, five GPR–GPS transects were surveyed on megadunes (Frezzotti et al., 2002b); the comparison between GPS elevations (3 January 1999) and the REMA DEM (2 February 2014) provides information about the relative change in elevation at high resolution (decametre level) of the megadunes during the past 15 years. On the five transects, we observe an almost stable elevation in correspondence with glazed surface/leeward flank, whereas the maximum difference in elevation (from +1.2 to +1.9 m, with an average maximum value of +1.4 m) occurs always in the snow accumulation/upwind flank on the correspondence of the trough (Fig. 4). By projecting the transects along the prevalent wind direction (239∘), based on the surrounding sastrugi orientation, we were able to evaluate the megadune migration using the relative change in elevation. Using the crest/trough position of each dune, we calculated an average displacement of 11 ± 5.2 m a−1 from all transects (Fig. 4). The migration of the dunes is evident in all transects with the upwind migration of the crest over the upstream flank and of the trough on the upstream flank of the previous megadune. In contrast, the glazed surfaces on the downwind flank remained generally stable in elevation over time (Fig. 4) but are clearly buried at the upstream flank foot and migrate at the crest. At the D6 site, Vittuari et al. (2004) measured an ice velocity of 1.46 ± 0.04 m a−1 with a direction of 97∘ using repeated GPS measurement between 1999 and 2001. The closer value of MEaSUREs ice flow at the D6 site is 2.2 ± 1.1 m a−1 with a direction of 89∘, in agreement with GPS measurements. At the EAIIST site, MEaSUREs data show an ice flow of 6.1 ± 3.4 m a−1 with a direction of ∼ 65∘. Both velocity directions agree with the topographic slope at the site. Applying Eq. (1) for the calculation of megadune migration components, we obtained a sedimentological migration of 18.4 ± 6.7 m a−1 (229∘) at EAIIST and 15.4 ± 4.7 m a−1 (246∘) at It-ITASE using Landsat 8 OLI data and 16.0 ± 7.3 m a−1 (230∘) at EAIIST and 13.6 ± 4.9 m a−1 (245∘) at It-ITASE with Sentinel-2.
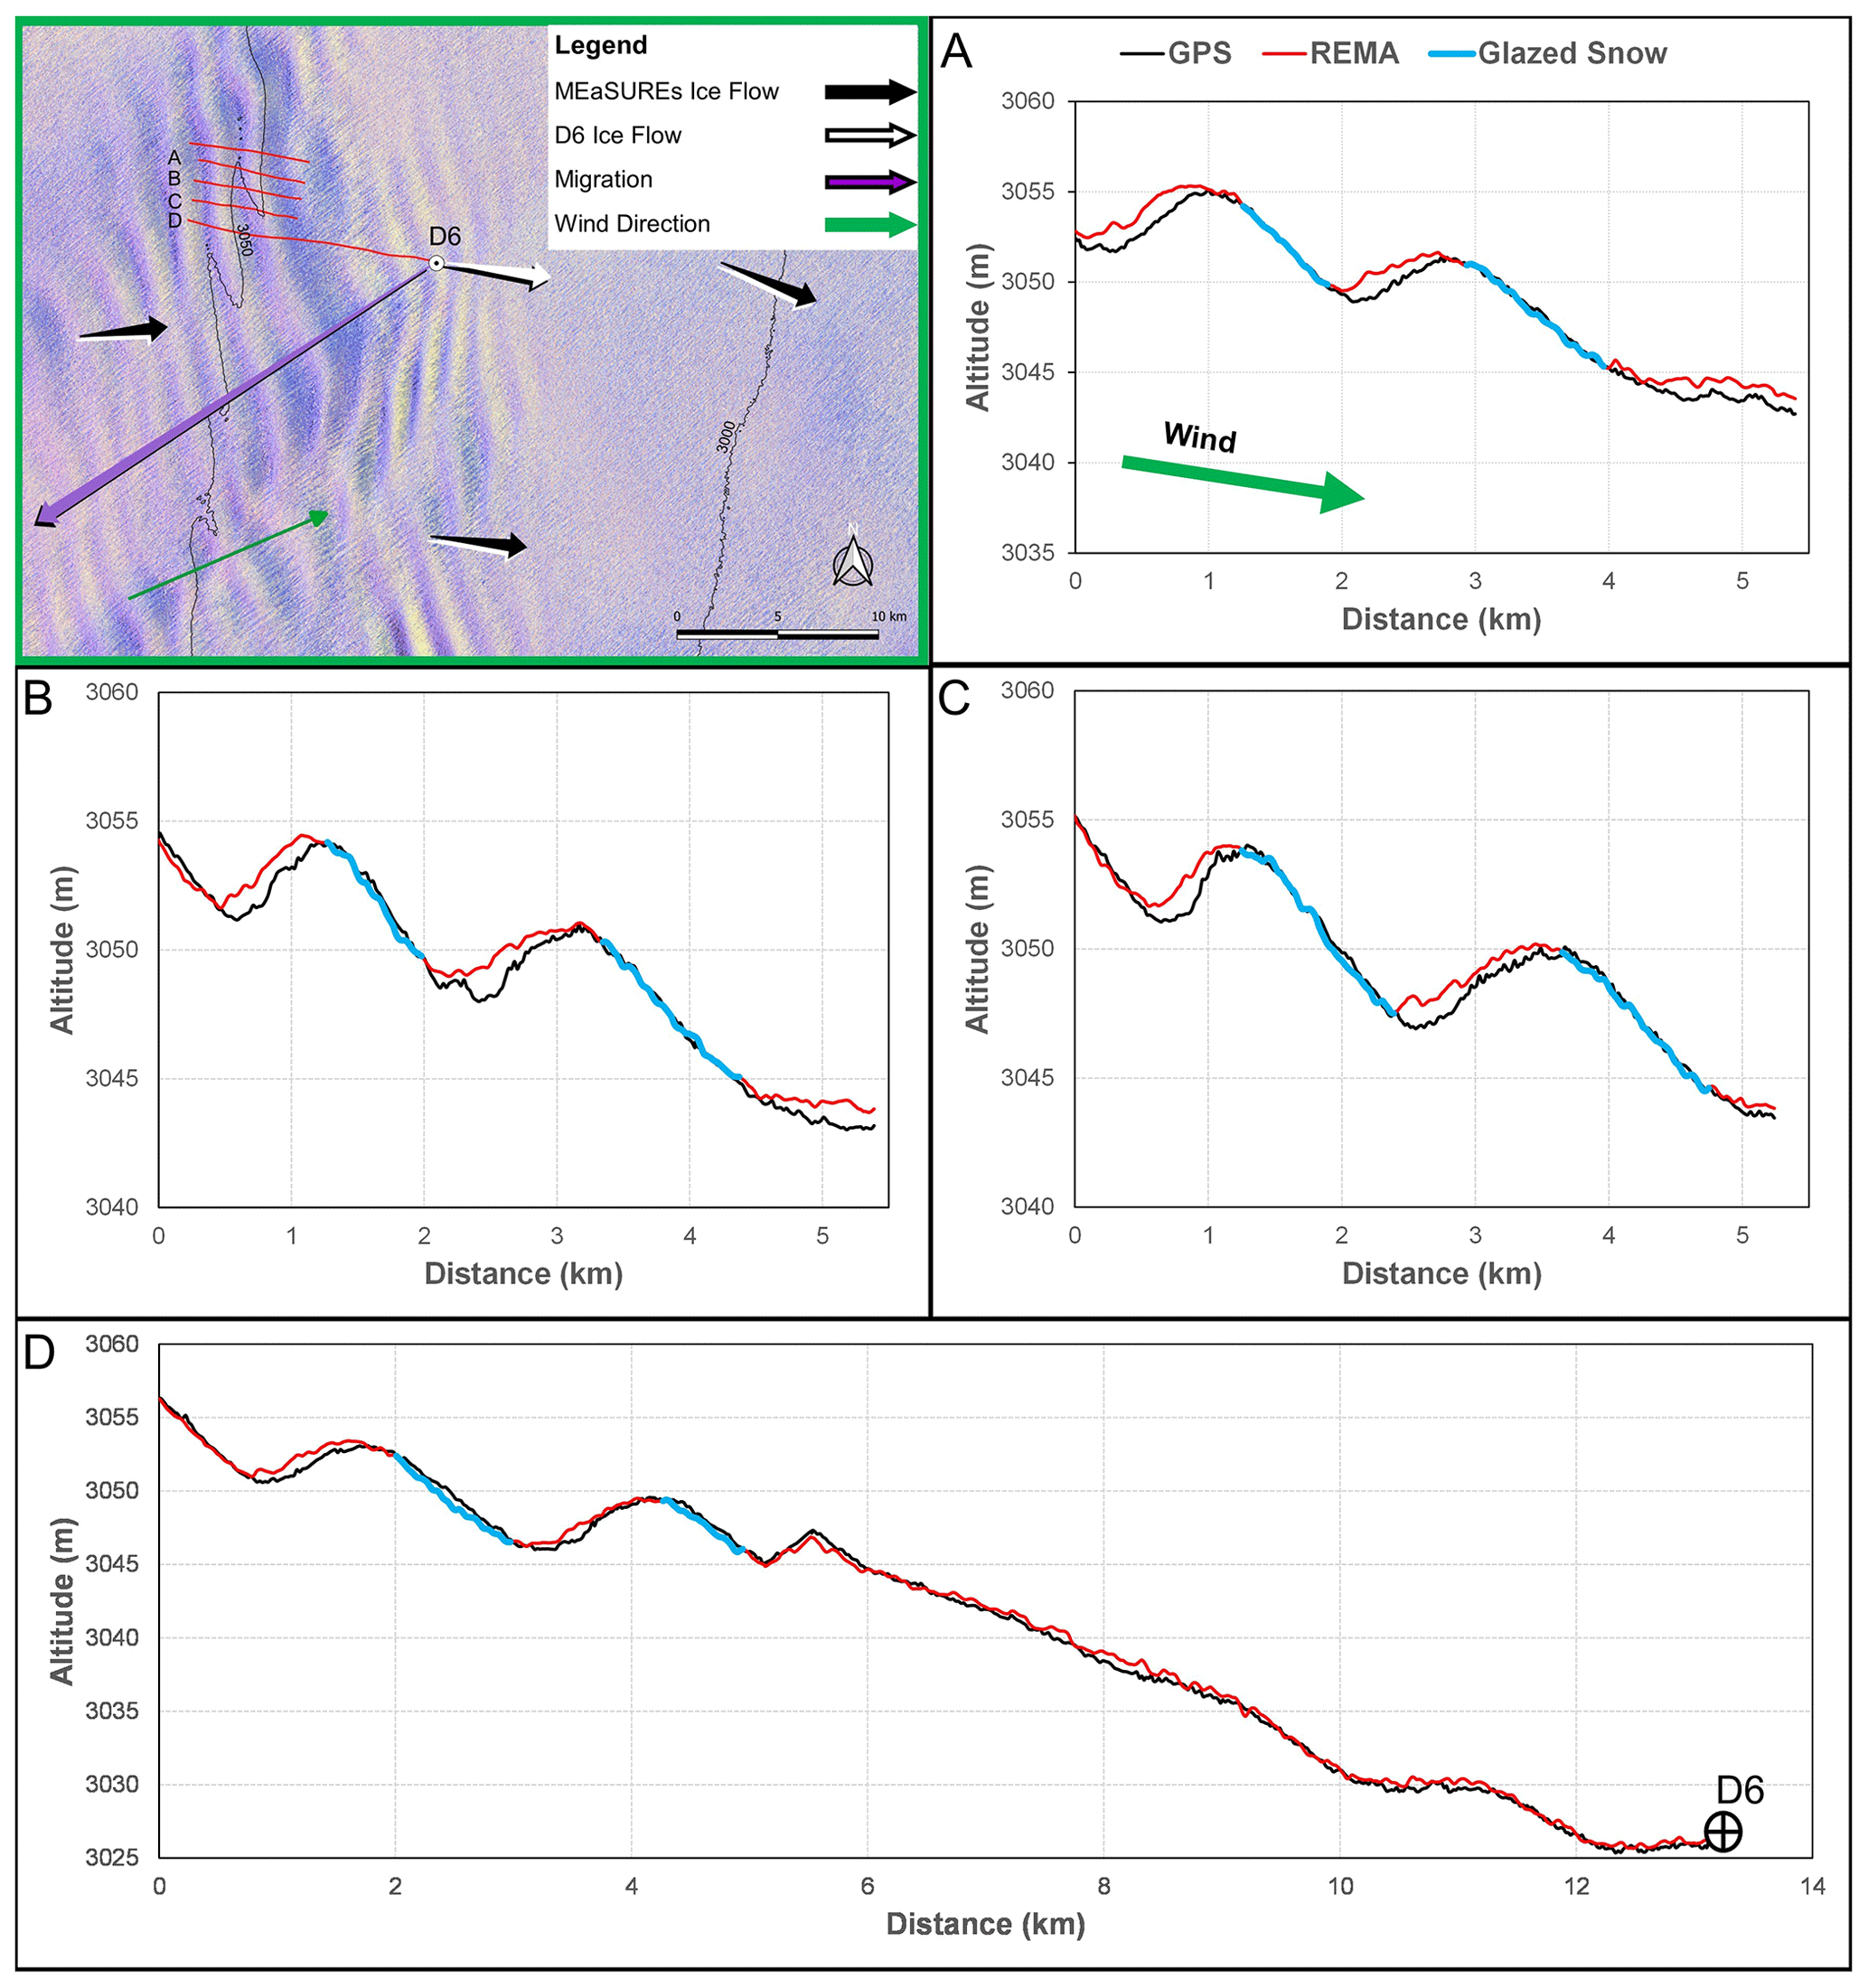
Figure 4Location of the GPS transects (red) at the It-ITASE site with a false-colour Landsat 8 OLI image in the background (18 December 2014). Universal Transverse Mercator (UTM) projection. Topographic section of four transects (A, B, C, D), with the black lines representing elevation from in situ GPS observations (1999), red lines from the REMA DEM (2014) and blue lines from glazed snow detected on the Landsat image from 18 December 2014.
5.1 Application of the automatic detection of glazed snow on megadune fields
In this study, we showed the possibility of calculating the SPWD based on wind direction from ERA5 and Landsat-derived sastrugi. At both investigated sites, the direction of the wind from ERA5 at a velocity higher than 11 m s−1 was found to be closer to the direction of sastrugi surveyed by satellite. The small difference between the two datasets could be correlated to the formation of sastrugi, as wind speed ≥ 11 m s−1 was previously reported by Kodama et al. (1985) and Wendler et al. (1993) to be required for the formation of sastrugi. While the EAIIST site shows similar average directions to ERA5, in the other study area (It-ITASE) a slightly higher difference was found between the two datasets for wind velocity slower than 11 m s−1. The direction retrieved from Landsat is strongly dependent on high-velocity prevailing winds (katabatic winds), which shape the sastrugi and direction, while ERA5 also takes into account wind directions other than the katabatic. In addition, this difference could be caused by the different spatial and temporal resolutions between the satellite and ERA5 (30 m vs. 30 km, scene-based vs. average of 20 years), as well as inaccuracies in the ERA5 wind direction. The larger difference in wind direction using the various datasets (ERA5, sastrugi detected by satellite, sastrugi measured on the field) at the It-ITASE site could also be attributed to the higher variability in the katabatic wind direction; in fact, this site is at the northern limit of megadune field (Fig. 1), and a relatively high variability in katabatic wind direction (> 10–15∘) could be among the threshold factors that does not allow for the formation of megadunes in the northern part. However, with the aim of applying this methodology at a large scale using ERA5 data, e.g. the whole continent, the differences between the two sources can be significant (e.g. at the It-ITASE site) and could produce errors in the SPWD calculation. Therefore, the use of sastrugi could be a more accurate way to interpret the prevalent wind direction with high wind speed (≥ 11 m s−1) compared to ERA5.
The SPWD is the only parameter that could be considered almost constant at a 10 km scale, in consideration of the stability of the direction of the katabatic wind, driven mainly by surface slope and the Coriolis force. In contrast, albedo and above all thermal BT change both temporally, annually and during seasons, and spatially across the satellite scene. In fact, NIR albedo significantly varies because of surface changes of up to 0.1 α and between the beginning, the middle and the end of the summer season in relation to the SZA by ±0.01–0.02 α. Frezzotti et al. (2002b) pointed out the presence of huge sastrugi (up to 1.5 m in height) located on the windward flank and alternation of sastrugi (up to 40 cm) and glazed surfaces located at the bottom of the interdune area. The observed change on NIR albedo and BT on the windward flank is correlated to the sastrugi formation and deterioration during the season and their relative change in shadow (Warren, 1982). In addition, thermal BT varies from a higher temperature near the summer solstice to lower values in late spring and summer, in the range ±5–10 K. In both cases, the differences between leeward flanks where glazed surfaces are located and windward flanks of megadunes are not high enough to overcome the seasonal variability and thus a constant range for albedo and temperature is impossible to determine. Spatially, the satellite-derived NIR and thermal BT show large variability inside the same satellite images, in particular for thermal BT, but strong correlation among the two parameters up to an R2 of 0.99 along each transect. The observed variabilities could be related to the different illumination condition and meteorological conditions with development of surface hoar crystal due to fog and under calm sunny weather with a downward as well as an upward vapour source to the near-surface layer. The growth of surface hoar crystals dramatically changes the snow structure, specific surface area and density, as well as surface roughness, leading to significant changes in albedo and therefore surface temperature (Gallet et al., 2014). For these reasons, different thresholds can not only be required when investigating an entire tile of Landsat in the case of self-defined-threshold methodology but also can explain the inability of supervised classification based only on BT to distinguish between glazed snow and firn. With BT, in fact, the difference in values across the images is higher than the mean spectral difference between these two surfaces at these wavelengths. For the same reasons, the classification approaches including BT present, in most cases, lower accuracy than the other cases, suggesting against using it to map glazed snow at a large scale. On the other hand, NIR albedo does not show this sort of problem and instead demonstrates good ability in distinguishing between the two surfaces, with a good accuracy even when used alone (especially in the 17 December 2015 case, Table 2). Additionally, it is evident how the implementation of SPWD is fundamental in aiding the detection of glazed snow, together with the NIR band, particularly by improving the detection even when the other parameters present more uncertainties (owing to e.g. SZA and fog). In fact, in all the combinations where SPWD is included, the accuracy in the distinction between glazed snow and firn shows more constant results and minimum and maximum accuracy across the analysed season is similar. Finally, our results point out the importance of using satellite images with no interferences (e.g. clouds, fog, high SZA), with the aim of automatically detecting glazed snow, as the accuracy of the method drastically increases (17 December 2015 compared to the other cases) and also that the self-defined-threshold approach provides better results in terms of accuracy than the supervised classification. Nevertheless, even if the self-defined-threshold model shows a higher accuracy, supervised classification allows for overcoming the issue of defining accurate thresholds across a certain season, providing good accuracy results especially on good quality images, as calculated on 17 December 2015.
By using the classifications with the highest accuracy in the EAIIST area achieved based on the scene from 17 December 2015 (NIR–SPWD combination), where approximately 75 % of the area is covered by megadunes, we could calculate that the glazed surfaces cover around 43 % of this specific dune area, i.e. ∼ 80 % of leeward flanks.
In conclusion, the detection of glazed surface/ablation area by satellite images is challenging because of differences in illumination and meteorological conditions (cloud cover, blowing snow, etc.) among different satellite images. Nevertheless, the high-resolution digital terrain model (REMA) allows for calculating an SPWD with unprecedented detail, similar to the resolution of optical satellites (Landsat 8–9, Sentinel), and significantly improves the detection of glazed/ablation surfaces at 10 m scale across the continent; therefore, it could significantly improve research on the SMB of the Antarctic Ice Sheet.
5.2 Megadune upwind migration
The absolute position of the megadune crest and trough are driven mainly by two processes: snow ablation/accumulation processes and ice sheet surface flow. GPS and GPR profiles along the It-ITASE traverse show the presence of paleo-megadunes buried up to the investigation depth of 20 m (Frezzotti et al., 2002b). Analysis of the D6 firn core allowed for detecting the Tambora eruption signal (1816 CE) at 15.36 m depth with an average snow accumulation of 36 ± 1.8 mm w.e. a−1, whereas an average value of 29 ± 7 mm w.e. a−1 of spatial variability in SMB at D6 site was evaluated by GPR calibrated using accumulation at three firn cores (Frezzotti et al., 2005). The elevation changes during 15 years observed using GPS and REMA show a relative increase in accumulation on the windward flank with the maximum value at the trough compared to the glazed-surface area from 29 to 46 mm w.e. a−1 with an average value of 34 mm w.e. a−1, using a density of 360 kg m3 in the first 2 m. This value is very close to the estimated change in accumulation in the megadune area from 7 to 35 mm w.e. a−1 provided by Frezzotti et al. (2002b) using the variability in GPR internal layering at the megadune site. The minimum value represents a decrease in accumulation of up to 75 % or more on glazed surfaces. The relative stability of glazed surfaces with respect to elevation change and NIR albedo confirms the extremely stable SMB low value of the glazed surfaces with respect to accumulation areas, due to the long-term hiatus in SMB forced by wind scouring processes.
Using the isochrone distance of 1.5–1.8 km between the 180-year-old paleo-crest detected by GPR and the recent crest from GPS observations (1998–1999 CE), we can evaluate the windward migration of the paleo-megadune crest at about 8–10 m a−1. This vector from field observations summed with an ice flow from GPS of 1.46 ± 0.04 m a−1 with a direction of 97∘ produced an absolute migration of 10.3 m a−1 with a direction of 214∘. This value is in very good agreement with absolute migration calculated using the elevation comparison between GPS and REMA (11 ± 5.2 m a−1) and with satellite tracking (from 11.4 to 14.0 m a−1), in particular with Sentinel-2 images (11.4 m a−1, Table 1). At the D6 site, the movement components show different intensity with an order of magnitude of difference: 1–2 m a−1 for ice flow vs. 13.6–15.4 m a−1 for sedimentological migration. The components present nearly opposite directions: 97∘ for ice flow and 245∘ for sedimentological migration. The results allowed us to calculate all the components of migration and to conclude that for a megadune with a wavelength of 3 km we could calculate an absolute migration of approximately 10 m a−1. This burying process of snow on glazed surfaces takes about 300 years, with a overlap of the crest to the trough and glazed to sastrugi surface as observed by GPR internal layering. These results are strongly in accordance with Courville (2007), who determined a burial rate of 330 years based on a firn core drilled in 2003/04 and migration rates of approx. 12 m a−1 (from AVHRR data; Advanced Very High Resolution Radiometer) at a field located at S, E in the megadune region of the EAIIST site.
The megadune migration on the upwind part observed by elevation change and tracking is also confirmed by the comparison of NIR and BT along the studied transects. These parameters remain relatively stable during the observed time on the glazed surface on the leeward flank, whereas the positive SMB upwind flank and bottom trough area change significantly not only at a pluriannual scale but also at a seasonal scale. Hence, we observe a general overestimation of sedimentological and absolute migration using remote sensing with a mean difference of +1.9 m a−1 for Sentinel-2 (uncertainties of 19 % for sedimentological migration and 10 % for absolute migration). Using Landsat 8 OLI images, larger differences were found, with an average overestimation of 3.8 m a−1. This difference could be caused by spatial variability in processes: with remote sensing we analysed a much wider area, as opposed to in situ observations which were acquired in transects on a limited section of the megadune field. Finally, the spatial resolution and geolocation (Mouginot et al., 2017) could affect the satellite data, as demonstrated by the worse results obtained using Landsat images at 15 m spatial resolution against 10 m resolution of Sentinel-2.
The ice velocity of MEaSUREs is based on SAR images and is in very good agreement with GPS measurement, and the tracking methods of IMCORR using optical images and crest displacement are in agreement with the migration of morphologies observed from the comparison between change in elevation by GPS and REMA. Based on our analysis, the sedimentological processes are analogous at the It-ITASE and EAIIST sites. At the second site, a faster ice-flow motion was observed by MEaSUREs, and the velocity of absolute migration is reduced by almost 35 %, compared to the initial sedimentological-migration velocity.
The ice velocity based on SAR images presents a phase centre that penetrates up to 10 m on dry and cold firn (Rignot et al., 2001) and provides information on ice flow and not surface features. In contrast, using feature tracking on optical images (Landsat and Sentinel-2), it is possible to estimate the absolute migration (migration + ice flow) of surface features that could be significantly different from ice flow as for the megadunes.
This study significantly improved the previous knowledge on the temporal/spatial variability in Antarctic megadunes and glazed surfaces, measurements of their sedimentation/migration, and their interaction with the atmosphere and ice sheet surface. The snow accumulation distribution/variability processes that allow megadune formation have important consequences concerning the choice of sites for ice coring and SMB evaluation, since orographic variations of a few metres per kilometre have a significant impact on the snow accumulation process. Furthermore, these new results represent a new ground truth and foundation of knowledge for ice sheet mass balance research, in particular for satellite altimeter and ice velocity derived by remote sensing measurements (e.g. radar vs. optical/lidar).
The new results confirm and quantify the previous hypotheses and provide new relevant information on different aspects of these peculiar landforms showing that the megadune is a dynamic feature at different spatial and temporal scales.
The glazed-surface/megadune survey has revealed previously unknown large spatial variability in ice sheet SMB, superimposed on the large-scale gradients in SMB from the coast to the interior. On smaller scales (< 1 km), SMB varies considerably as well, driven by surface topography undulations (SPWD) and consequent wind-driven snow ablation and redistribution, which challenges the spatial representativeness of stake and firn/ice core records. Moreover, this small-scale variability is not represented by regional climate model systems used for SMB evaluation (e.g. Agosta et al., 2019; Lenaerts et al., 2019), which currently operate at horizontal resolutions of typically 25 km for East Antarctica. Previous studies have pointed out that glazed areas are extensive enough to have a significant impact on current estimates of SMB and therefore overall mass balance using the mass budget method (Frezzotti et al., 2004; Das et al., 2013; Scambos et al., 2012). The scale of the overestimation is of the same order of magnitude as the total error reported for East Antarctica and a large fraction of the currently reported error bars for Antarctic-wide mass balance (Rignot et al., 2019).
Considering the characteristics of megadunes, the leeward glazed flanks show a lower NIR albedo (up to 0.1) and higher BT (up to 1.5 K) compared to windward snow-covered sides within each of the five transects analysed. NIR albedo and thermal BT, combined with the SPWD, allowed us to produce a method for automatically detecting glazed surfaces. High correlations were found between SPWD and NIR albedo and thermal BT with an R2 of up to 0.44 and 0.57, respectively, calculated along the whole transect examined in 2013–2014, with differences between spring and the end of summer. The correlations between SPWD and NIR albedo on the transects decrease to 0.39 in comparison with the image from December 2019. Moreover, the high correlation of NIR albedo between images decreases over time by up to 60 % between November 2013 and December 2019. Our results support the importance of SPWD (especially when sufficiently synchronous with spectral imagery, in consideration of the migration of megadunes) for megadune snow characterization. Together with NIR albedo, the SPWD was found to be more important than BT in the classification and to provide a higher accuracy than spectral data only, by allowing accuracy > 80 % in detecting glazed snow. Further research might consider other parameters to automatically detect snow glazed surfaces, including snow grain size or the normalized difference snow index.
Finally, we provided for the first time an estimation of megadune migration from field and remote observations at the It-ITASE site. The results obtained using field measurements and remote observations allow for calculating all the components of megadune migration, absolute (11–14 m a−1), sedimentological migration (13–15 m a−1) and the ice flow (1–2 m a−1), and to conclude that for megadunes with a wavelength of 3 km and migration of approximately 10 m a−1, the burying process of snow on glazed surfaces takes about 300 years, with an overlap of the crest to the trough and glazed to sastrugi surface.
The reconstruction of paleo-climate based on firn/ice cores drilled in the megadune or downstream area is very complex; the distortion of recordings is characterized by a snow accumulation/hiatus periodicity of about hundreds of years. The length of periodic variations due to mesoscale relief and/or megadunes depends on ice velocity, megadune migration and snow accumulation and can therefore vary in space and time within the 500 000 km2 of the megadune field and downstream area. In the end, our work points out the importance of antidune sedimentological processes in megadune fields with an almost opposite direction between the migration of surface features and ice flow derived, respectively, from feature tracking of optical images and SAR. These results present significant implication for surface measurements using radar/lidar altimetric satellite and measurements of ice flow using optical and SAR images in the megadune area. Moreover, our results point out the different elevation behaviour at a pluriannual scale of the stable elevation and NIR albedo of glazed surface, while the snow-covered surface changes elevation and NIR albedo, with a higher accumulation/elevation in correspondence with the previous trough, decreasing from the trough towards the windward crest. The wind-driven process greatly affects the SMB of the megadune area, which implies that all or most of the regional accumulation (as determined by RACMO and other models) is gathered in the accretionary faces, whereas in the downwind area the SMB is near zero with a long hiatus in snow accumulation.
Table A1Landsat (OLI) and Sentinel-2 (S2) images in the EAIIST (069119 and T51CWL tiles for L8OLI and S2, respectively) and It-ITASE (081114 and T52CEA tiles for L8OLI and S2, respectively) areas used in the study with corresponding solar zenith and azimuth angles from the Landsat/Sentinel metadata.

Table A2Frequency of the REMA DEM stripes at the EAIIST and It-ITASE sites from different years, based on the REMA strip index.
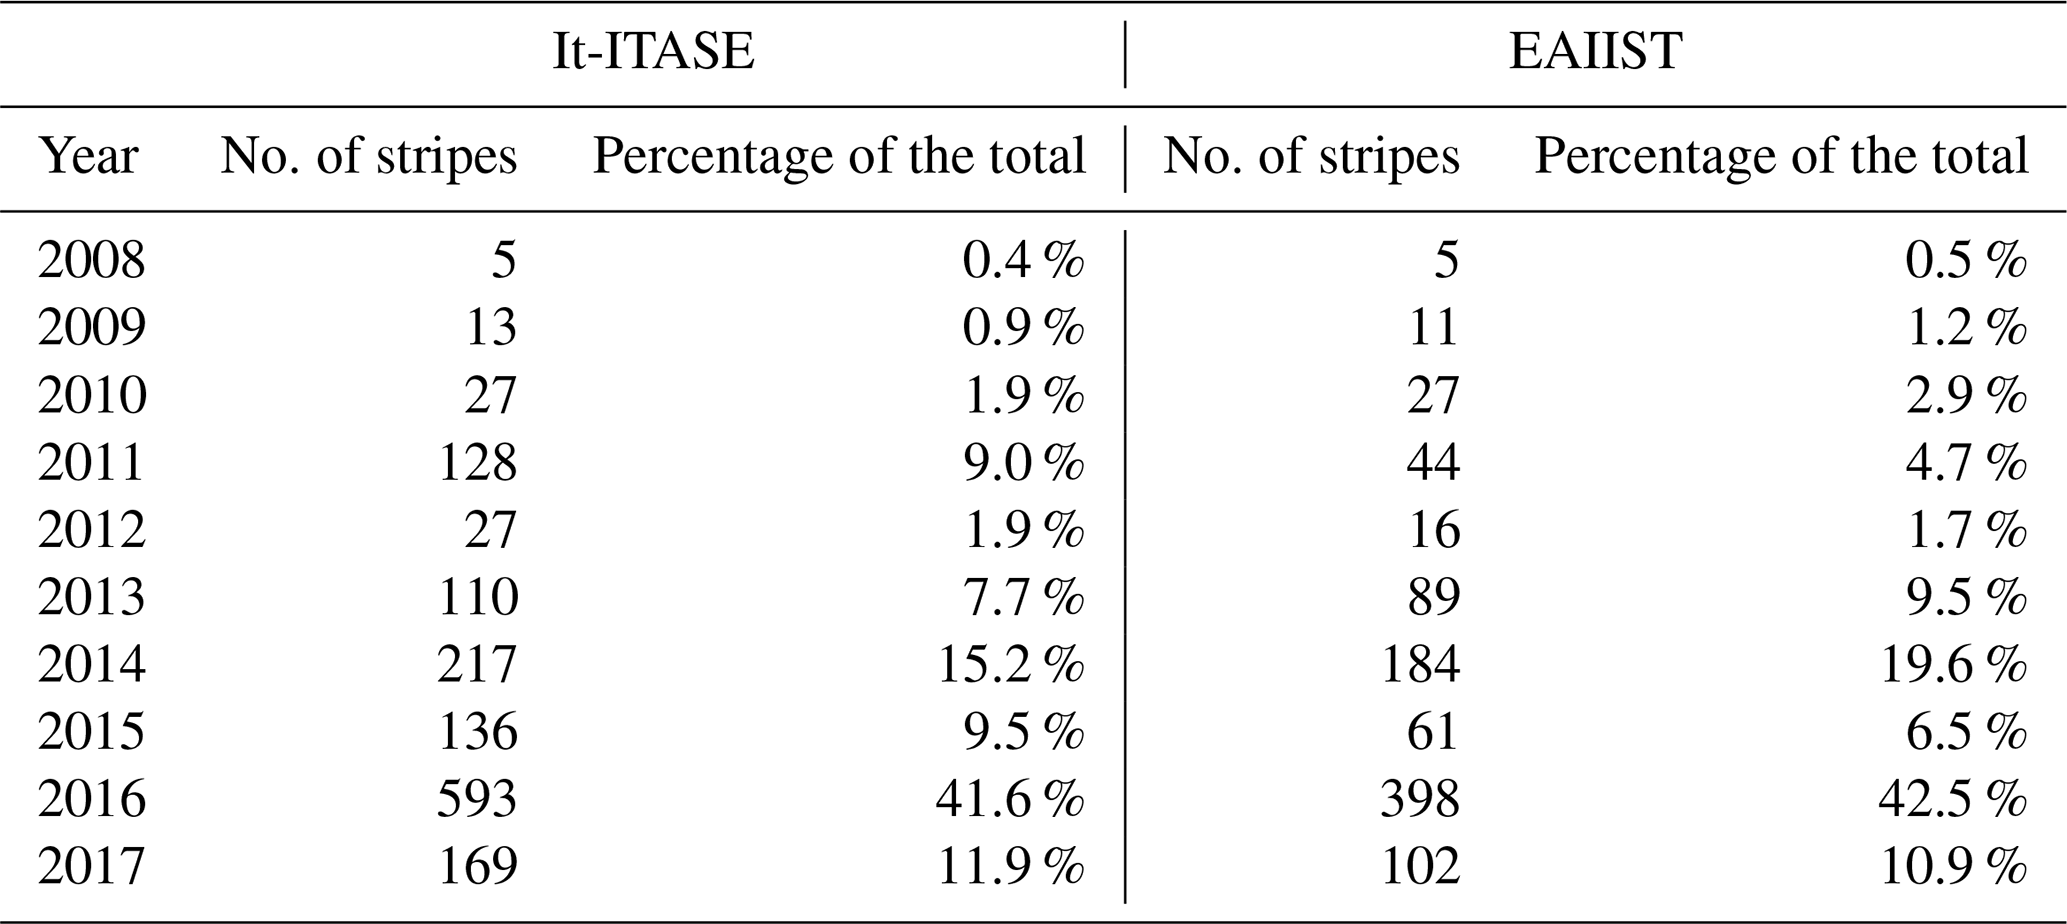
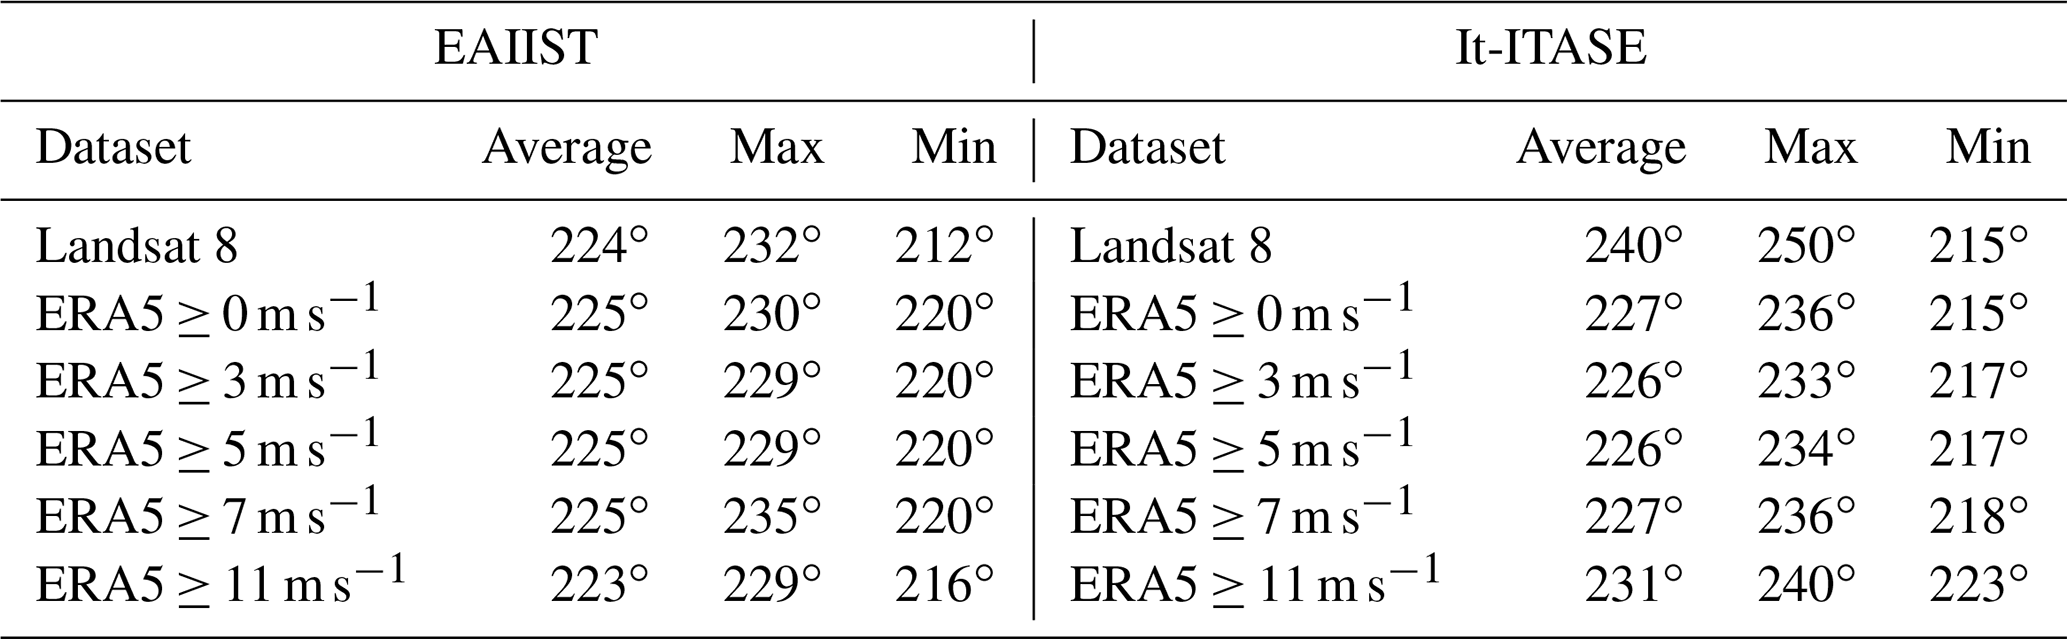
Table A3Wind direction statistics (average, maximum and minimum values) for the considered datasets: Landsat 8 at 30 m spatial resolution and ERA5 at 30 km spatial resolution (divided into five sub-datasets according to wind speed) at the EAIIST and It-ITASE sites.
Data used for the aims of the present study are available from different repositories. Landsat 8 and Sentinel-2 imagery are available at https://doi.org/10.5066/P9OGBGM6 (Earth Resources Observation And Science (EROS) Center, 2013) and https://doi.org/10.5270/S2_-znk9xsj (European Space Agency, 2022). ERA5 data are available at https://doi.org/10.24381/cds.adbb2d47 (Hersbach et al., 2018). The REMA DEM is available at https://doi.org/10.7910/DVN/X7NDNY (Howat et al., 2022). Field data were obtained from previously published papers, i.e. Frezzotti et al. (2002a, b) and Vitturari et al. (2004).
GT and MF conceived the idea of this work. GT and DF developed the procedure and processed the satellite image and data. All authors contributed to the writing of the final manuscript.
The contact author has declared that none of the authors has any competing interests.
Publisher's note: Copernicus Publications remains neutral with regard to jurisdictional claims in published maps and institutional affiliations.
The authors are thankful to the PNRA (National Antarctic Research Program) and MNA (National Antarctic Museum) of Italy (fellowship and PhD scholarship to Giacomo Traversa, respectively) and Levissima Sanpellegrino S.p.A. (post-doc fellowship to Davide Fugazza). This study was supported by the EAIIST project (no. ANR-16-CE01-0011), the Institut Polaire Français Paul-Émile Victor (IPEV), the National Antarctic Research Program (PNRA), the French National Research Agency, the Department of Science of the Università degli Studi Roma Tre (Minister of University and Research Italy, Dipartimenti Eccellenza 2023–2027) and the Department for Regional Affairs and Autonomies (DARA). The authors would like to warmly thank all the participants of the It-ITASE and EAIIST traverses for their tremendous field contributions allowing for the collection of the crucial in situ measurements used in this study. Finally, the authors thank the editor, Ted Scambos, Stef Lhermitte and an anonymous referee for having revised the paper; their suggestions have strongly improved the quality of the research.
The research has been supported by Levissima Sanpellegrino S.P.A. (grant no. LIB_VT17GDIOL, postdoc fellowship to Davide Fugazza).
This paper was edited by Olaf Eisen and reviewed by Ted Scambos, Stef Lhermitte, and one anonymous referee.
Agosta, C., Amory, C., Kittel, C., Orsi, A., Favier, V., Gallée, H., van den Broeke, M. R., Lenaerts, J. T. M., van Wessem, J. M., van de Berg, W. J., and Fettweis, X.: Estimation of the Antarctic surface mass balance using the regional climate model MAR (1979–2015) and identification of dominant processes, The Cryosphere, 13, 281–296, https://doi.org/10.5194/tc-13-281-2019, 2019.
Albert, M., Shuman, C., Courville, Z., Bauer, R., Fahnestock, M., and Scambos, T.: Extreme firn metamorphism: impact of decades of vapor transport on near-surface firn at a low-accumulation glazed site on the East Antarctic plateau, Ann. Glaciol., 39, 73–78, https://doi.org/10.3189/172756404781814041, 2004.
Arcone, S. A., Jacobel, R., and Hamilton, G.: Unconformable stratigraphy in East Antarctica: Part I. Large firn cosets, recrystallized growth, and model evidence for intensified accumulation, J. Glaciol., 58, 240–252, https://doi.org/10.3189/2012JoJ11J044, 2012a.
Arcone, S. A., Jacobel, R., and Hamilton, G.: Unconformable stratigraphy in East Antarctica: Part II. Englacial cosets and recrystallized layers, J. Glaciol., 58, 253–264, https://doi.org/10.3189/2012JoG11J045, 2012b.
Azzoni, R. S., Senese, A., Zerboni, A., Maugeri, M., Smiraglia, C., and Diolaiuti, G. A.: Estimating ice albedo from fine debris cover quantified by a semi-automatic method: the case study of Forni Glacier, Italian Alps, The Cryosphere, 10, 665–679, https://doi.org/10.5194/tc-10-665-2016, 2016.
Canny, J.: A computational approach to edge detection, IEEE T. Pattern Anal. Mach. Intell., PAMI-8, 679–698, 1986.
Courville, Z. R.: Gas diffusivity and air permeability of the firn from cold polar sites, PhD thesis, Dartmouth College, 3341626, https://www.proquest.com/openview/67a457ce9973e10b601ba324a525b3f0/1?cbl=18750&pq-origsite=gscholar&parentSessionId=UpZ4V8N6xSPAcKTOy9xE7le%2FzOB69XIB%2FSnUxdEWmwk%3D (last access: 15 January 2023), 2007.
Courville, Z. R., Albert, M. R., Fahnestock, M. A., Cathles, L. M., and Shuman, C. A.: Impacts of an accumulation hiatus on the physical properties of firn at a low-accumulation polar site, J. Geophys. Res., 112, F02030, https://doi.org/10.1029/2005JF000429, 2007.
Dadic, R., Mott, R., Horgan, H. J., and Lehning, M.: Observations, theory, and modeling of the differential accumulation of Antarctic megadunes: accumulation of Antarctic megadunes, J. Geophys. Res.-Earth, 118, 2343–2353, https://doi.org/10.1002/2013JF002844, 2013.
Das, I., Bell, R. E., Scambos, T. A., Wolovick, M., Creyts, T. T., Studinger, M., Frearson, N., Nicolas, J. P., Lenaerts, J. T. M., and van den Broeke, M. R.: Influence of persistent wind scour on the surface mass balance of Antarctica, Nat. Geosci., 6, 367–371, https://doi.org/10.1038/ngeo1766, 2013.
Earth Resources Observation And Science (EROS) Center: Collection-2 Landsat 8-9 OLI (Operational Land Imager) and TIRS (Thermal Infrared Sensor) Level-2 Science Products, Earth Resources Observation And Science (EROS) Center [data set], https://doi.org/10.5066/P9OGBGM6, 2013.
Ekaykin, A. A., Lipenkov, V. Ya., and Shibaev, Yu. A.: Spatial Distribution of the Snow Accumulation Rate Along the Ice Flow Lines Between Ridge B and Lake Vostok, Ice Snow, Journal of ice and snow, 52, 122, https://doi.org/10.15356/2076-6734-2012-4-122-128, 2015.
European Space Agency: Sentinel-2 MSI Level-2A BOA Reflectance, European Space Agency [data set], https://doi.org/10.5270/S2_-znk9xsj, 2022.
Fahnestock, M. A., Scambos, T. A., Shuman, C. A., Arthern, R. J., Winebrenner, D. P., and Kwok, R.: Snow megadune fields on the East Antarctic Plateau: Extreme atmosphere-ice interaction, Geophys. Res. Lett., 27, 3719–3722, https://doi.org/10.1029/1999GL011248, 2000.
Frezzotti, M., Gandolfi, S., Marca, F. L., and Urbini, S.: Snow dunes and glazed surfaces in Antarctica: new field and remote-sensing data, Ann. Glaciol., 34, 81–88, https://doi.org/10.3189/172756402781817851, 2002a.
Frezzotti, M., Gandolfi, S., and Urbini, S.: Snow megadunes in Antarctica: Sedimentary structure and genesis, J. Geophys. Res.-Atmos., 107, ACL 1-1–ACL 1-12, https://doi.org/10.1029/2001JD000673, 2002b.
Frezzotti, M., Pourchet, M., Flora, O., Gandolfi, S., Gay, M., Urbini, S., Vincent, C., Becagli, S., Gragnani, R., and Proposito, M.: New estimations of precipitation and surface sublimation in East Antarctica from snow accumulation measurements, Clim. Dynam., 23, 803–813, https://doi.org/10.1007/s00382-004-0462-5, 2004.
Frezzotti, M., Pourchet, M., Flora, O., Gandolfi, S., Gay, M., Urbini, S., Vincent, C., Becagli, S., Gragnani, R., and Proposito, M.: Spatial and temporal variability of snow accumulation in East Antarctica from traverse data, J. Glaciol., 51, 113–124, https://doi.org/10.3189/172756505781829502, 2005.
Fujii, Y., Yamanouchi, T., Suzuki, K., and Tanaka, S.: Comparison of the Surface Conditions of the Inland Ice Sheet, Dronning Maud Land. Antarctica. Derived from Noaa AVHRR Data with Ground Observation, Ann. Glaciol., 9, 72–75, https://doi.org/10.3189/S0260305500000410, 1987.
Gallet, J.-C., Domine, F., Savarino, J., Dumont, M., and Brun, E.: The growth of sublimation crystals and surface hoar on the Antarctic plateau, The Cryosphere, 8, 1205–1215, https://doi.org/10.5194/tc-8-1205-2014, 2014.
Hersbach, H., Bell, B., Berrisford, P., Biavati, G., Horányi, A., Muñoz Sabater, J., Nicolas, J., Peubey, C., Radu, R., Rozum, I., Schepers, D., Simmons, A., Soci, C., Dee, D., and Thépaut, J.-N.: ERA5 hourly data on single levels from 1959 to present, Copernicus Climate Change Service (C3S) Climate Data Store (CDS) [data set], https://doi.org/10.24381/cds.adbb2d47, 2018.
Hersbach, H., Bell, B., Berrisford, P., Hirahara, S., Horányi, A., Muñoz-Sabater, J., Nicolas, J., Peubey, C., Radu, R., Schepers, D., Simmons, A., Soci, C., Abdalla, S., Abellan, X., Balsamo, G., Bechtold, P., Biavati, G., Bidlot, J., Bonavita, M., Chiara, G., Dahlgren, P., Dee, D., Diamantakis, M., Dragani, R., Flemming, J., Forbes, R., Fuentes, M., Geer, A., Haimberger, L., Healy, S., Hogan, R. J., Hólm, E., Janisková, M., Keeley, S., Laloyaux, P., Lopez, P., Lupu, C., Radnoti, G., Rosnay, P., Rozum, I., Vamborg, F., Villaume, S., and Thépaut, J.: The ERA5 Global Reanalysis, Q. J. Roy. Meteor. Soc., 146, qj.3803, https://doi.org/10.1002/qj.3803, 2020.
Howat, I. M., Porter, C., Smith, B. E., Noh, M.-J., and Morin, P.: The Reference Elevation Model of Antarctica, The Cryosphere, 13, 665–674, https://doi.org/10.5194/tc-13-665-2019, 2019.
Howat, I., Porter, C., Noh, M.-J., Husby, E., Khuvis, S., Danish, E., Tomko, K., Gardiner, J., Negrete, A., Yadav, B., Klassen, J., Kelleher, C., Cloutier, M., Bakker, J., Enos, J., Arnold, G., Bauer, G., and Morin, P.: The Reference Elevation Model of Antarctica – Strips, Version 4.1, Harvard Dataverse, V1 [data set], https://doi.org/10.7910/DVN/X7NDNY, 2022.
Jawak, S. D., Kumar, S., Luis, A. J., Bartanwala, M., Tummala, S., and Pandey, A. C., Evaluation of Geospatial Tools for Generating Accurate Glacier Velocity Maps from Optical Remote Sensing Data, Proceedings, 2, 341, https://doi.org/10.3390/ecrs-2-05154, 2018.
Jezek, K. C.: Glaciological properties of the Antarctic ice sheet from RADARSAT-1 synthetic aperture radar imagery, Ann. Glaciol., 29, 286–290, https://doi.org/10.3189/172756499781820969, 1999.
Klok, E. L., Greuell, W., and Oerlemans, J.: Temporal and spatial variation of the surface albedo of Morteratschgletscher, Switzerland, as derived from 12 Landsat images, J. Glaciol., 49, 491–502, https://doi.org/10.3189/172756503781830395, 2003.
Kodama, Y., Wendler, G., and Gosink, J.: The effect of blowing snow on katabatic winds in Antarctica, Ann. Glaciol., 6, 59–62, https://doi.org/10.3189/1985AoG6-1-59-62, 1985.
Lenaerts, J. T., Medley, B., van den Broeke, M. R., and Wouters, B.: Observing and modeling ice sheet surface mass balance, Rev. Geophys., 57, 376–420, 2019.
Liang, S.: Narrowband to broadband conversions of land surface albedo I: Algorithms, Remote Sens. Environ., 76, 213–238, https://doi.org/10.1016/S0034-4257(00)00205-4, 2001.
Mather, K. B.: Further observations on sastrugi, snow dunes and the pattern of surface winds in Antarctica, Polar Rec., 11, 158–171, https://doi.org/10.1017/S0032247400052888, 1962.
Meredith, M., Sommerkorn, M., Cassotta, S., Derksen, C., Ekaykin, A., Hollowed, A., Kofinas, G., Mackintosh, A., Melbourne-Thomas, J., and Muelbert, M. M. C.: Polar Regions, chap. 3, IPCC Special Report on the Ocean and Cryosphere in a Changing Climate, https://doi.org/10.1017/9781009157964.005, 2019.
Mouginot, J., Rignot, E., Scheuchl, B., and Millan, R.: Comprehensive annual ice sheet velocity mapping using Landsat-8, Sentinel-1, and RADARSAT-2 data, Remote Sens., 9, 364, https://doi.org/10.3390/rs9040364, 2017.
Núñez-González, F. and Martín-Vide, J. P.: Analysis of antidune migration direction, J. Geophys. Res.-Earth, 116, F02004, https://doi.org/10.1029/2010JF001761, 2011.
Palm, S. P., Yang, Y., and Kayetha, V.: New Perspectives on Blowing Snow in Antarctica and Implications for Ice Sheet Mass Balance, in: Antarctica – A Key To Global Change, edited by: Kanao, M., Toyokuni, G., and Yamamoto, M., IntechOpen, https://doi.org/10.5772/intechopen.81319, 2019.
Parish, T. R. and Bromwich, D. H.: Continental-scale simulation of the Antarctic katabatic wind regime, J. Climate, 4, 135–146, https://doi.org/10.1175/1520-0442(1991)004<0135:CSSOTA>2.0.CO;2, 1991.
Picard, G., Libois, Q., Arnaud, L., Verin, G., and Dumont, M.: Development and calibration of an automatic spectral albedometer to estimate near-surface snow SSA time series, The Cryosphere, 10, 1297–1316, https://doi.org/10.5194/tc-10-1297-2016, 2016.
Pietroni, I., Argentini, S., and Petenko, I.: One year of surface-based temperature inversions at Dome C, Antarctica, Bound.-Lay. Meteorol., 150, 131–151, 2014.
Pirazzini, R.: Surface albedo measurements over Antarctic sites in summer, J. Geophys. Res., 109, D20118, https://doi.org/10.1029/2004JD004617, 2004.
Proposito, M., Becagli, S., Castellano, E., Flora, O., Genoni, L., Gragnani, R., Stenni, B., Traversi, R., Udisti, R., and Frezzotti, M.: Chemical and isotopic snow variability along the 1998 ITASE traverse from Terra Nova Bay to Dome C, East Antarctica, Ann. Glaciol., 35, 187–194, https://doi.org/10.3189/172756402781817167, 2002.
Prothero, D. R. and Schwab, F.: Sedimentary geology, Macmillan, ISBN 978-1-4292-3155-8, 2004.
Rignot, E., Echelmeyer, K., and Krabill, W.: Penetration depth of interferometric synthetic-aperture radar signals in snow and ice, Geophys. Res. Lett., 28, 3501–3504, https://doi.org/10.1029/2000GL012484, 2001.
Rignot, E., Mouginot, J., and Scheuchl, B.: MEaSUREs InSAR-based Antarctica ice velocity map, version 2, Boulder CO NASA DAAC Natl. Snow Ice Data Cent. [data set], https://doi.org/10.5067/D7GK8F5J8M8R. 2017.
Rignot, E., Mouginot, J., Scheuchl, B., van den Broeke, M., van Wessem, M. J., and Morlighem, M.: Four decades of Antarctic Ice Sheet mass balance from 1979–2017, P. Natl. Acad. Sci. USA, 116, 1095–1103, https://doi.org/10.1073/pnas.1812883116, 2019.
Scambos, T. A., Dutkiewicz, M. J., Wilson, J. C., and Bindschadler, R. A.: Application of image cross-correlation to the measurement of glacier velocity using satellite image data, Remote Sens. Environ., 42, 177–186, 1992.
Scambos, T. A., Frezzotti, M., Haran, T., Bohlander, J., Lenaerts, J. T. M., Van Den Broeke, M. R., Jezek, K., Long, D., Urbini, S., Farness, K., Neumann, T., Albert, M., and Winther, J.-G.: Extent of low-accumulation “wind glaze” areas on the East Antarctic plateau: implications for continental ice mass balance, J. Glaciol., 58, 633–647, https://doi.org/10.3189/2012JoG11J232, 2012.
Swithinbank, C., Ferrigno, J. G., Williams, R. S., and Chinn, T. J.: Antarctica, Geological Survey professional paper , 1386-B. U.S. G.P.O., Washington, DC, https://hdl.handle.net/2027/uc1.31210020769210 (last access: 13 January 2023), 1988.
Traversa, G. and Fugazza, D.: Evaluation of Anisotropic Correction Factors for the Calculation of Landsat 8 OLI Albedo on the Ice Sheets, Geogr. Fis. Din. Quar., 44, 91–95, https://doi.org/10.4461/GFDQ.2021.44.8, 2021.
Traversa, G., Fugazza, D., Senese, A., and Diolaiuti, G. A.: Preliminary results on Antarctic albedo from remote sensing observations, Geogr. Fis. Din. Quat., 42, 245–254, https://doi.org/10.4461/GFDQ.2019.42.14, 2019.
Traversa, G., Fugazza, D., Senese, A., and Frezzotti, M.: Landsat 8 OLI Broadband Albedo Validation in Antarctica and Greenland, Remote Sens., 13, 799, https://doi.org/10.3390/rs13040799, 2021a.
Traversa, G., Fugazza, D., and Frezzotti, M.: Analysis of Megadune Fields in Antarctica, in: 2021 IEEE International Geoscience and Remote Sensing Symposium IGARSS, 5513–5516, https://doi.org/10.1109/IGARSS47720.2021.9554827, 2021b.
Van Wessem, J. M., Reijmer, C. H., Morlighem, M., Mouginot, J., Rignot, E., Medley, B., Joughin, I., Wouters, B., Depoorter, M. A., Bamber, J. L., Lenaerts, J. T. M., Van De Berg, W. J., Van Den Broeke, M. R., and Van Meijgaard, E.: Improved representation of East Antarctic surface mass balance in a regional atmospheric climate model, J. Glaciol., 60, 761–770, https://doi.org/10.3189/2014JoG14J051, 2014.
Vittuari, L., Vincent, C., Frezzotti, M., Mancini, F., Gandolfi, S., Bitelli, G., and Capra, A.: Space geodesy as a tool for measuring ice surface velocity in the Dome C region and along the ITASE traverse, Ann. Glaciol., 39, 402–408, https://doi.org/10.3189/172756404781814627, 2004.
Warren, S. G.: Optical properties of snow, Rev. Geophys., 20, 67–89, https://doi.org/10.1029/RG020i001p00067, 1982.
Wendler, G., André, J. C., Pettré, P., Gosink, J., and Parish, T.: Katabatic winds in Adélie coast, in: Antarctic Meteorology and Climatology: Studies Based on Automatic Weather Stations, edited by: Bromwich, D. H. and Stearns, C. R., 61, 23–46, https://doi.org/10.1029/AR061p0023, 1993.
Zanter, K.: Landsat 8 (L8) data users handbook, Landsat Sci. Off. Website, https://d9-wret.s3.us-west-2.amazonaws.com/assets/palladium/production/s3fs-public/atoms/files/LSDS-1574_L8_Data_Users_Handbook-v5.0.pdf (last access:13 January 2023), 2019.