the Creative Commons Attribution 4.0 License.
the Creative Commons Attribution 4.0 License.
 | 26 Aug 2023
Extensive and anomalous grounding line retreat at Vanderford Glacier, Vincennes Bay, Wilkes Land, East Antarctica
Chris R. Stokes
Stewart S. R. Jamieson
Dana Floricioiu
Lukas Krieger
Wilkes Land, East Antarctica, has been losing mass at an accelerating rate over recent decades in response to enhanced oceanic forcing. Overlying the Aurora Subglacial Basin, it has been referred to as the “weak underbelly” of the East Antarctic Ice Sheet and is drained by several major outlet glaciers. Despite their potential importance, few of these glaciers have been studied in detail. This includes the six outlet glaciers which drain into Vincennes Bay, a region recently discovered to have the warmest intrusions of modified Circumpolar Deep Water (mCDW) ever recorded in East Antarctica. Here, we use satellite imagery; differential synthetic aperture radar interferometry (DInSAR); and remotely sensed datasets of ice-surface velocity, ice-surface elevation and grounding line position to investigate ice dynamics between 1963 and 2022. Our results support previous observations of extensive grounding line retreat at Vanderford Glacier, measured at 18.6 km between 1996 and 2020. The persistent grounding line retreat, averaging 0.8 km yr−1, places Vanderford Glacier as the fastest retreating glacier in East Antarctica, and the third fastest in Antarctica, across decadal timescales. Such rapid retreat is consistent with the hypothesis that warm mCDW is able to access deep cavities formed below the Vanderford Ice Shelf, driving high rates of basal melting close to the grounding line. With a retrograde slope observed inland along the Vanderford Trench, such oceanic forcing may have significant implications for the future stability of Vanderford Glacier.
- Article
(7158 KB) - Full-text XML
-
Supplement
(1445 KB) - BibTeX
- EndNote


Mass loss from the Antarctic Ice Sheet (AIS), estimated to hold a sea level equivalent (SLE) of 57.9 ± 0.9 m (Morlighem et al., 2020), has accelerated over recent decades (Schröder et al., 2019a). Whilst a range of AIS mass balance estimates have been made (Velicogna et al., 2014; Harig and Simons, 2015; McMillan et al., 2015; Martín-Español et al., 2016; Shepherd et al., 2019; Rignot et al., 2019; Schröder et al., 2019a; Smith et al., 2020a), a recent collation of 24 independent estimates indicates that the AIS lost a total of 2720 ± 1390 Gt of ice between 1992 and 2017 (The IMBIE Team, 2018). This negative mass balance was dominated by loss from the West Antarctic Ice Sheet (WAIS), averaged at a rate of −94 ± 27 Gt yr−1 over the same time period (The IMBIE Team, 2018).
Recent mass loss from the WAIS (2000s to 2010s) has largely been concentrated within the Amundsen Sea Embayment (Harig and Simons, 2015; McMillan et al., 2015; Gardner et al., 2018; Shepherd et al., 2019), dominated by increased discharge from the fast-flowing Pine Island and Thwaites glaciers (Mouginot et al., 2014; Medley et al., 2014; Christianson et al., 2016; Yu et al., 2018). The ice flow acceleration (Mouginot et al., 2014; Sutterley et al., 2014), dynamic thinning (Pritchard et al., 2009; Flament and Rémy, 2012) and rapid grounding line retreat (Rignot et al., 2014) of these major outlet glaciers have been attributed to ice shelf thinning (Pattyn and Morlighem, 2020). Such thinning reduces the buttressing force exerted by an ice shelf and has primarily been attributed to basal melting, a process forced by the wind-driven intrusion of warm modified Circumpolar Deep Water (mCDW) across the continental shelf to sub-ice shelf cavities (Feldmann and Levermann, 2015; Scambos et al., 2017; Rignot et al., 2019). Situated on retrograde bed slopes grounded well below sea level, there has been widespread concern that the Pine Island and Thwaites glaciers could be susceptible to marine ice sheet instability (MISI) (Joughin and Alley, 2011; Parizek et al., 2013; Nias et al., 2016; Lhermitte et al., 2020), whereby irreversible grounding line retreat is triggered (Schoof, 2007). Indeed, Favier et al. (2014), Rignot et al. (2014), and Joughin et al. (2014) argue that such unstable retreat may already be underway.
In contrast, the recent mass balance of the East Antarctic Ice Sheet (EAIS), containing a SLE of 52.2 ± 0.7 m (Morlighem et al., 2020), has typically been estimated to be either in equilibrium (Schröder et al., 2019a) or slightly positive (Martín- Español et al., 2016; Gardner et al., 2018; Shepherd et al., 2019; Smith et al., 2020a; Stokes et al., 2022). The IMBIE Team (2018) calculated a positive mass balance of +5 ± 46 Gt yr−1 between 1992 and 2017, with mass gain predominantly concentrated in the Dronning Maud Land region (Velicogna et al., 2014; Harig and Simons, 2015; Martín-Español et al., 2016; Gardner et al., 2018). However, Rignot et al. (2019) have instead suggested that the EAIS has been a significant contributor to recent sea level rise, with an estimated negative mass balance of −57.0 ± 2 Gt yr−1 between 1992 and 2017. Whilst the overall mass balance of the EAIS remains uncertain, numerous studies provide strong evidence of dynamic mass loss across the marine-based Wilkes Land sector (McMillan et al., 2015; Martín-Español et al., 2016; Smith et al., 2020a; Stokes et al., 2022). Wang et al. (2021) have suggested that such mass loss has accelerated rapidly over the past 2 decades, increasing from −6 ± 22 Gt yr−1 between 2003 and 2008 to −51 ± 80 Gt yr−1 between 2016 and 2020. In addition, Miles et al. (2013) have observed widespread terminus retreat across the region, with 74 % (n=39) of Wilkes Land outlet glaciers having undergone retreat at a median rate of −63.6 m yr−1 between 2000 and 2010.
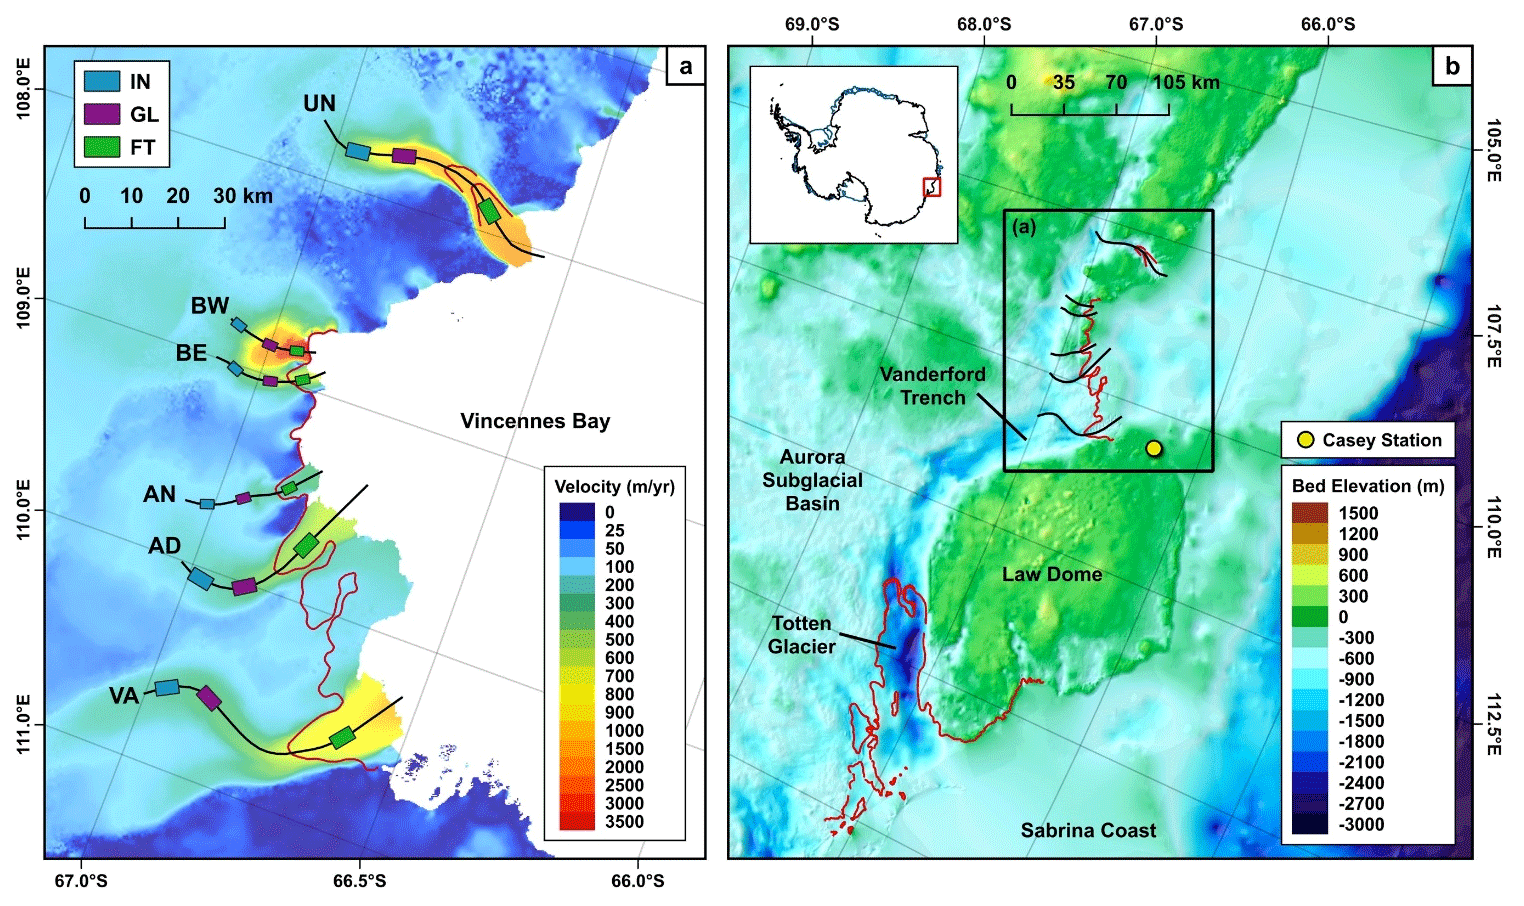
Figure 1(a) Ice velocity map of Vincennes Bay extracted from the 2018 ITS_LIVE ice velocity mosaic (Gardner et al., 2022). Central flowlines are digitised along each of the studied glaciers: Vanderford (VA), Adams (AD), Anzac (AN), Bond East (BE), Bond West (BW) and Underwood (UN). Sampling boxes digitised across the inland (IN), grounding line (GL) and floating tongue (FT) areas are shown. (b) Location map of Vincennes Bay and the Aurora Subglacial Basin. Background represents the bed elevation extracted from BedMachine (Morlighem, 2020), underlain by a hillshade. Inset map shows the location of the Aurora Subglacial Basin within Antarctica. Red lines in (a) and (b) display the 1996 MEaSUREs grounding line product (Rignot et al., 2016).
Wilkes Land is characterised by a “warm shelf” regime, whereby weak easterly winds and an absence of dense water formation facilitate the intrusion of warm CDW onto the continental shelf (Thompson et al., 2018; Stokes et al., 2022). The recent increase in mass loss across Wilkes Land has been linked to the enhanced intrusion of such CDW towards sub-ice shelf cavities, accessed through deep subglacial troughs (Miles et al., 2016; Shen et al., 2018). For example, increased ice discharge (Rignot et al., 2019) and dynamic thinning (Pritchard et al., 2009; Flament and Rémy, 2012; Li et al., 2016; Shepherd et al., 2019; Schröder et al., 2019a) across the primary outlet of Wilkes Land, Totten Glacier (Fig. 1b), have been attributed to enhanced basal melt rates below the Totten Ice Shelf (Roberts et al., 2018; Pelle et al., 2021). Driven by increased intrusion of mCDW (Khazender et al., 2013; Gwyther et al., 2014; Spence et al., 2014; Li et al., 2015; Greene et al., 2017; Rignot et al., 2019), access to the main sub-ice shelf cavity is provided by a deep inland subglacial trough (Greenbaum et al., 2015; Li et al., 2016). Such troughs are observed across the fjord landscape of the Aurora Subglacial Basin (ASB) over which Wilkes Land lies (Young et al., 2011; Miles et al., 2016).
The warmest intrusions of mCDW ever recorded within East Antarctica were observed within Vincennes Bay, defined as the shelf region situated on the Wilkes Land coast between 104 and 111∘ E (Ribeiro et al., 2021). Vincennes Bay overlies the ASB and is drained by several marine-terminating outlet glaciers: Vanderford, Adams, Anzac, Bond and Underwood (Fig. 1a). Despite Rignot et al. (2019) briefly highlighting a dramatic 17 km retreat of Vanderford's grounding line between 1996 and 2017, little attention has been afforded to these outlet glaciers. With area-averaged basal melt rates of 5.3 ± 2 m yr−1 estimated over the Vincennes Bay ice shelves (Rignot et al., 2013), Depoorter et al. (2013) had previously proposed that Vanderford may be vulnerable to oceanic forcing, potentially driven by the intrusion of mCDW. Indeed, recent analysis of data collected using instrumented seals revealed ocean temperatures higher than −0.5 ∘C are able to reach the Vanderford Ice Shelf, capable of driving basal melt (Ribeiro et al., 2021). Ribeiro et al. (2021) therefore suggested that a positive feedback may be initiated, whereby continued freshwater input from basal melt could hinder the formation of dense shelf water (DSW) in the Vanderford polynya, thereby strengthening water column stratification and enabling the enhanced intrusion of warm mCDW at depth. Analysis by Herraiz-Borreguero and Garabato (2022) also suggests that this potential feedback may already be underway, with an observed decline in DSW concurrent with consistent sea ice production indicative of increased penetration of mCDW within the Vincennes Bay region. Whilst Vanderford Glacier is currently grounded on a prograde bedrock slope (Rignot et al., 2019), it overlies the Vanderford Trench, a deep subglacial trench characterised by an inland retrograde slope (Fig. 1b) (Davis et al., 1986; Chen et al., 2011; Sun et al., 2016). Ice sheet modelling indicates that grounding line retreat beyond the present stabilising bedrock ridge could therefore facilitate MISI (Sun et al., 2016).
This paper seeks to improve our understanding of the largely unstudied Vincennes Bay outlet glaciers, providing an overview of recent ice dynamics observed between 1963 and 2022. We employ remotely sensed satellite imagery and a number of secondary datasets in order to analyse variation across four key glacier parameters: (1) terminus position, manually digitised from satellite imagery; (2) ice-surface velocity, extracted from ITS_LIVE (Gardner et al., 2022) and ENVEO mosaics (ENVEO, 2021); (3) ice-surface elevation, assessed using datasets produced by Schröder et al. (2019b), Smith et al. (2020b), and Nilsson et al. (2021); and (4) grounding line position, newly mapped using differential synthetic aperture radar interferometry (DInSAR) techniques and also extracted from datasets provided by Haran et al. (2005, 2014, 2018), Bindschadler and Choi (2011), and Rignot et al. (2016).
2.1 Image acquisition
A combination of Landsat 1, 4, 5, 7 and 8 images (1973–2020), as well as Sentinel-2A and Sentinel-2B images (2017–2022), were downloaded from the USGS EarthExplorer data repository, with the majority of images selected from the austral summer months of December–February (Table S1 in the Supplement). With each of the Vincennes Bay glaciers occupying a proportionally small area of each scene, cloud cover thresholds were not applied; instead, images were manually inspected to ensure cloud cover did not obscure the terminus. Each of the Landsat 1, 4 and 5 scenes were co-registered to a Sentinel-2B scene collected in 2021 in order to ensure consistent geolocation through time. Ground control points (GCPs) digitised across coastal rock outcrops, nunataks and visibly stable ice features (Glasser et al., 2011) were used in order to apply a first-order polynomial transformation with nearest-neighbour resampling (Miles, 2013). A mosaic of Antarctica composed of declassified ARGON satellite photographs collected in 1963 was also downloaded (Kim et al., 2007). This product has been orthorectified using GCPs (Kim et al., 2007). Nonetheless, the geolocation accuracy of the ARGON mosaic was manually checked before any subsequent analysis was conducted; the position of coastal rock outcrops, nunataks and visibly stable ice features was observed to be consistent with the Sentinel-2B scene collected in 2021. The spatial resolution of imagery used in this study therefore ranged between 10 and 140 m (Table S1).
2.2 Terminus position
Annual terminus positions were manually digitised within QGIS. It should be noted that Bond Glacier has two distinct outlets separated by an ice rise; these two outlets are hereafter referred to as Bond East and Bond West (Fig. 1). In May 2003, failure of the Scan Line Corrector on board the Landsat 7 satellite resulted in striped data loss (Paul et al., 2017), but the majority of these gaps were observed to be perpendicular to the studied glacier termini. Thus, we were able to digitise terminus positions across the data gaps, with temporally close images with alternative striping patterns used in order to inform each digitisation (Black and Joughin, 2022). Once digitised, changes in terminus position were quantified by applying the well-established box method outlined by Moon and Joughin (2008). This method accounts for asymmetrical changes across glacier termini, using an open-ended box digitised across the main region of ice flow. Errors associated with this method of analysis arise from the co-registration of satellite imagery, generally estimated at 1 pixel, and manual digitisation of the terminus position, typically calculated as 0.5 pixels (Miles et al., 2018, 2021; Black and Joughin, 2022). Estimated errors associated with each terminus digitisation therefore ranged between 15 and 210 m (Table S1).
2.3 Ice-surface velocity
With a lack of suitable data prior to 2000, the ITS_LIVE (Gardner et al., 2022) and ENVEO (ENVEO, 2021) datasets were used to extract ice-surface velocity between 2000 and 2021. ITS_LIVE velocity mosaics are available at an annual resolution between 2000 and 2018 and were derived from Landsat 4, 5, 7 and 8 imagery using the autoRIFT feature tracking algorithm (Gardner et al., 2018). Each annual velocity mosaic has a spatial resolution of 240 m and reflects the error-weighted average of all image pairs with a centre date that falls within that calendar year (Gardner et al., 2022). In contrast, ENVEO velocity mosaics are provided at a monthly resolution between 2014 and 2021 and were derived from repeat-pass Sentinel-1 synthetic aperture radar (SAR) data using feature tracking techniques (Nagler et al., 2015, 2021). Each of the monthly velocity mosaics has a spatial resolution of 200 m and was processed using the ENVEO software package (ENVEO, 2021). The monthly ENVEO velocity mosaics were used to extend our ice-surface velocity time series, being downloaded between 2019 and 2021. In order to allow for comparison to the ITS_LIVE annual velocity mosaics, mean velocity across each 12-month period was calculated.
Ice-surface velocity profiles were extracted along central flowlines manually digitised along each main glacier trunk (Fig. 1a). Each longitudinal profile was sampled at an interval spacing of 240 m, reflecting the coarsest spatial resolution of the two velocity datasets used. To analyse changes in ice-surface velocity over time, mean annual velocity was extracted from within defined boxes for each given year. In order to assess the spatial variability in ice velocity, three sampling boxes were defined across each glacier; the first box was positioned on the floating tongue (FT), the second located immediately up-glacier of the most landward observed grounding line (GL) position and the third placed inland a further 5 km upstream (inland: IN) (Fig. 1a). Sampling boxes placed over the larger Vanderford, Adams and Underwood glaciers each covered an area of 15 km2, whilst sampling boxes placed across the smaller Anzac, Bond East and Bond West glaciers each had a proportionally smaller area of 6 km2. Gardner et al. (2022) note that data scarcity is a significant limiting factor in the early ITS_LIVE product, with the autoRIFT processing chain being limited by the number of image pairs available across any given year. Such incomplete coverage was seen across the Vincennes Bay outlet glaciers, particularly prior to the launch of Landsat 8 in February 2013. Average annual velocity values were therefore only extracted from each respective FT, GL and IN box if greater than 25 % data coverage was observed (Table S2).
The errors associated with each velocity measurement were also provided at the pixel scale. The mean velocity error was thus extracted from within each FT, GL and IN box across each given year. The velocity errors provided for each ITS_LIVE velocity mosaic were calculated according to the technical details outlined by Gardner et al. (2022). The errors are updated following co-registration and represent the standard deviation of the difference between the image-pair component velocities and the annual mean component velocities (Gardner et al., 2022). The uncertainty associated with each ENVEO velocity mosaic also represents the standard deviation (ENVEO, 2021). Velocity measurements were not included within the analysis if the mean error extracted across each box was calculated to be more than 50 % of the mean velocity magnitude. However, this threshold resulted in the omission of just 5 % of velocity measurements, largely concentrated across Bond West Glacier (Table S2).
2.4 Ice-surface elevation
Variations in ice-surface elevation were analysed using the datasets provided by Schröder et al. (2019b), Smith et al. (2020b), and Nilsson et al. (2021). Schröder et al. (2019b) calculated the monthly surface elevation change (SEC) observed between 1978 and 2017, relative to the reference month September 2010. SEC measurements were provided at a horizontal resolution of 10 km and were obtained using combined altimetry data from each of the Seasat, Geosat, ERS-1, ERS-2, Envisat, ICESat and CryoSat-2 satellite missions (Schröder et al., 2019b). Similarly, Nilsson et al. (2021) calculated the monthly SEC seen between 1985 and 2020, relative to the reference month December 2013. Produced as part of NASA's ITS_LIVE project, SEC measurements were provided at a horizontal resolution of 1920 m and included additional altimetry data from the ICESat-2 mission, launched in October 2018, thus facilitating further coverage between 2018 and 2020 (Nilsson et al., 2021). Mean monthly SEC values provided by both Schröder et al. (2019b) and Nilsson et al. (2021) were extracted from each respective grounded GL and IN box. In order to allow comparison between the two datasets, all monthly SEC measurements were calculated relative to September 1992, representing the earliest shared month for which data coverage was seen across all of the Vincennes Bay glaciers. Elevation anomalies were then calculated relative to the long-term means derived from each respective dataset between 1992 and 2017.
The ice-surface elevation dataset provided by Smith et al. (2020b) represents the rate of SEC observed between 2003 and 2019, provided at a horizontal resolution of 5 km using altimetry data from the ICESat and ICESat-2 satellite missions. The mean rate of SEC observed over this period was extracted from each GL and IN box. In order to allow for comparison across all three elevation datasets, mean rates of SEC were also calculated from the monthly SEC data provided by Schröder et al. (2019b) and Nilsson et al. (2021), extracted between 2003 and 2017 and 2003 and 2019, respectively.
2.5 Grounding line position
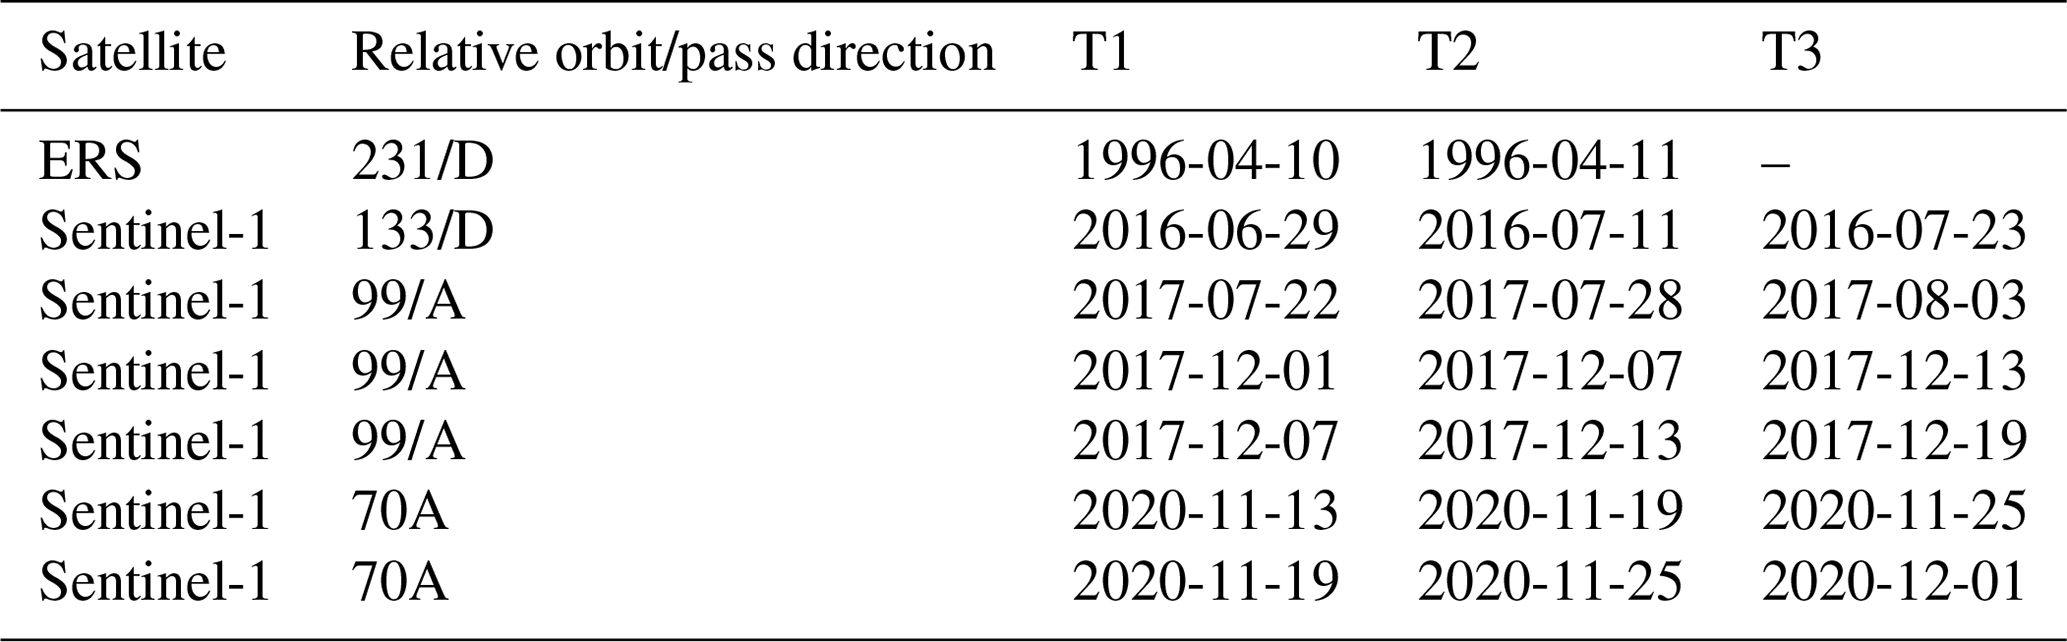
Grounding line positions were delineated using differential satellite synthetic aperture radar interferometry (DInSAR) from ERS-1, ERS-2 and Sentinel-1 imagery collected between 1996 and 2020, processed as part of the European Space Agency's Antarctic Ice Sheet Climate Change Initiative (AIS CCI). The acquisitions used to complete grounding line processing over the Vincennes Bay region are outlined in Table 1.
Table 1ERS and Sentinel-1 acquisitions used for interferogram generation in the Vincennes Bay region. Relative orbits and pass direction are stated, with A and D representing ascending and descending pass directions, respectively. T2 was chosen as the primary scene, with two interferograms T2–T1 and T2–T3 then formed. In the case of the ERS satellite, the grounding line was delineated directly on a 1 d repeat pass interferogram. Note that the date format is year, month and day.
The vertical motion of an ice shelf and hence the hinge line, representing the landward limit of ice flexure, can be observed from a single interferogram (Goldstein et al., 1993). The hinge line is often used as a proxy for the grounding line, the true position of which remains challenging to detect directly (Friedl et al., 2020). However, the exact location of the hinge line is often obscured by the phase contributions of horizontal ice displacement. Therefore, we typically selected three repeat pass acquisitions in order to form two interferograms. The difference of such interferograms eliminates the phase contributions from horizontal ice displacement, when assuming a constant ice velocity throughout the observed time period (Rignot, 1996), revealing a dense fringe belt at the grounding zone. The landward limit of this fringe belt was manually delineated as the interferometrically derived grounding line position, with an estimated error of ± 200 m. Within the AIS CCI programme, a processing workflow has been developed to systematically map the grounding line of the AIS using the Sentinel-1 SAR constellation. However, the repeat orbit of 6 and 12 d depends on the S1 observation plan. Wherever a 6 d repeat from a Sentinel-1 A and B combination was available, these acquisitions were favoured in order to limit temporal decorrelation due to changing surface conditions.
A number of secondary grounding line datasets were also employed to enable comparison between datasets and to generate a higher temporal resolution of grounding line positions (Table 2). The Making Earth Science Data Records for Use in Research Environments (MEaSUREs) grounding line product was generated using similar DInSAR techniques as previously described for the AIS CCI product, also applied to ERS-1 and ERS-2 imagery collected in 1996 (Rignot et al., 2016). Whilst localised variations in positional accuracy are observed (Rignot et al., 2011), the MEaSUREs grounding line product has an overall associated standard error of ± 100 m (Rignot et al., 2016) (Table 2).
Table 2Details of the different mapping methods employed to derive each of the grounding line datasets used in this study. Note that the MEaSUREs, ASAID and MOA products represent secondary datasets.
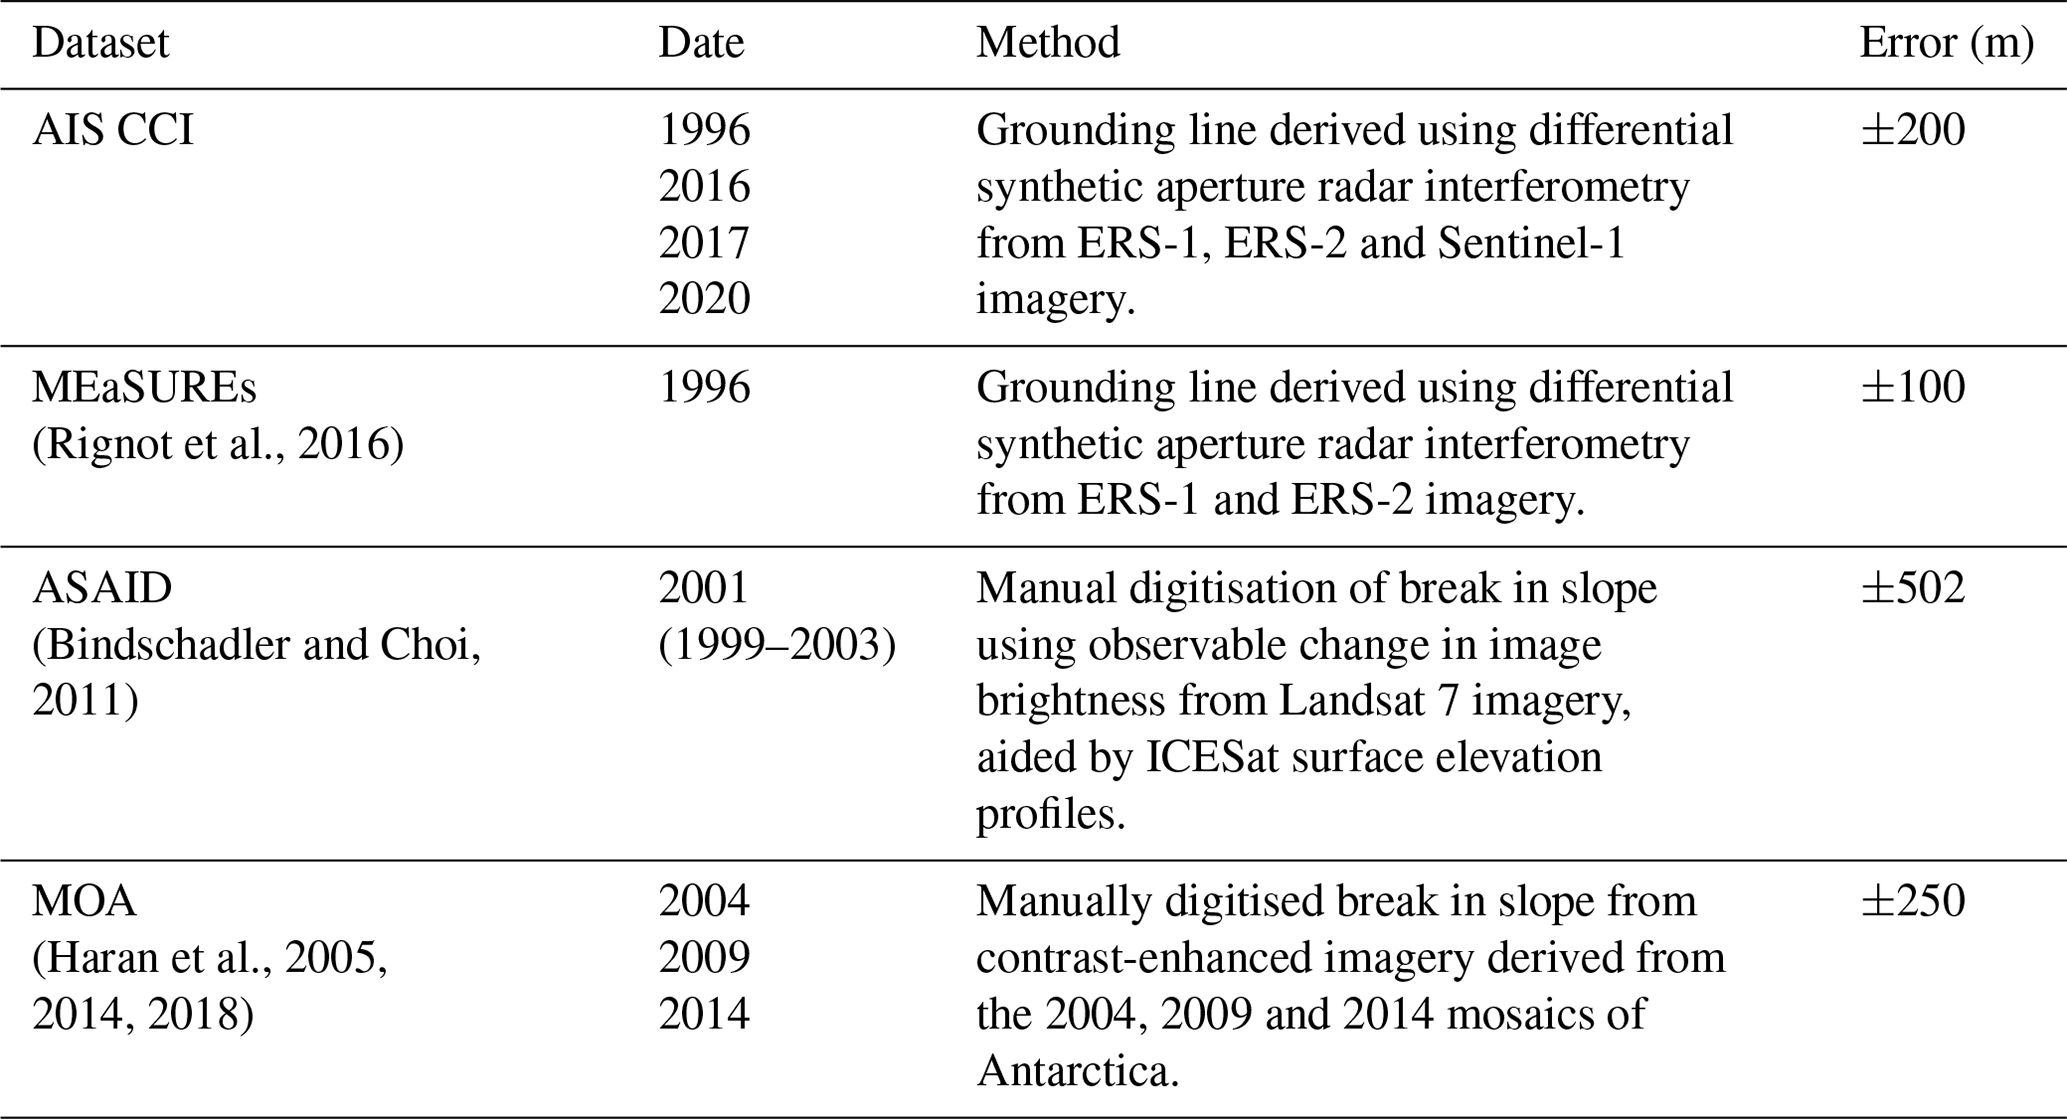
The Antarctic Surface Accumulation and Ice Discharge (ASAID) grounding line dataset was produced through the manual delineation of the most seaward, spatially continuous break in slope, observed using a combination of Landsat-7 images collected between 1999 and 2003 and surface elevation data obtained from the ICESat satellite mission (Bindschadler et al., 2011). At outlet glacier boundaries such as those studied within Vincennes Bay, the ASAID grounding line dataset had an estimated positional error of ±502 m (Bindschadler and Choi, 2011). The mosaic of Antarctica (MOA) grounding lines were also provided through the manual digitisation of the most seaward break in slope, observed from the 2004 (Haran et al., 2005), 2009 (Haran et al., 2014) and 2014 (Haran et al., 2018) mosaics, each composed using MODIS imagery (Scambos et al., 2007). Each MOA grounding line delineation therefore had an estimated associated error of ±250 m (Haran et al., 2005, 2014, 2018), representing the ground-equivalent nadir pixel size of the MODIS bands (Scambos et al., 2007). Whilst the AIS CCI and MEaSUREs products both represent the hinge line and thus approximate the actual grounding line position (Fricker et al., 2009; Rignot et al., 2016), the ASAID and MOA datasets instead reflect the break in slope. This narrow region is observed seaward of the grounding line and is typically inferred as the surface expression of the abrupt change in basal ice interface produced at the transition between grounded and floating ice (Scambos et al., 2007; Fricker et al., 2009; Bindschadler et al., 2011). The hinge line and break in slope represent fundamentally different components of the grounding zone and therefore cannot be directly compared. Any observed grounding line position change observed using the two different methods must thus be interpreted with caution, with further discussion restricted to pronounced signals and long-term trends that we can be confident are indicative of significant change.
In order to quantify changes in grounding line position, changes were measured from the earliest 1996 delineation along each central flowline (Fig. 1a). It should be highlighted that grounding line positions at Vanderford Glacier in 1996 were provided by both AIS CCI and the MEaSUREs datasets but were digitised in slightly different locations, approximately 640 m apart. Similarly, the MEaSUREs dataset also delineated two different 1996 grounding line positions at Underwood Glacier, separated more significantly by ∼7 km (Fig. 1a). Whilst tidal effects may account for short-term migrations in grounding line position (Rignot et al., 2016), both of the 1996 Underwood Glacier grounding line positions provided in the MEaSUREs dataset were mapped using ERS imagery acquired on 6/2/1996, 7/2/1996, 12/3/1996 and 13/3/1996. The explanation for such significant geolocation variation therefore remains unknown. Conservative grounding line retreat values were hence calculated for both Vanderford and Underwood glaciers, with retreat measured relative to the most landward observed 1996 position.
2.6 Bed and ice-surface topography
In order to assess the potential vulnerability to MISI, bedrock elevation profiles were derived from BedMachine (Morlighem, 2020) along each digitised flowline (Fig. 1a). Bed elevation values and their associated errors were sampled at an interval spacing of 500 m, reflecting the horizontal resolution of the dataset. Whilst BedMachine was mostly mapped using mass conservation methods across regions of fast-moving ice, a range of different methods were employed across Vincennes Bay (Fig. S1 in the Supplement); the sampled errors therefore ranged between 10 and 202 m. Surface topography profiles were also extracted along each central flowline, sampled from the Reference Elevation Model of Antarctica (REMA) version 1 mosaic (Howat et al., 2019). The REMA v1 mosaic has a high spatial resolution of 2–8 m (Howat et al., 2019) but was sampled at the same 500 m interval spacing as the bed elevation.
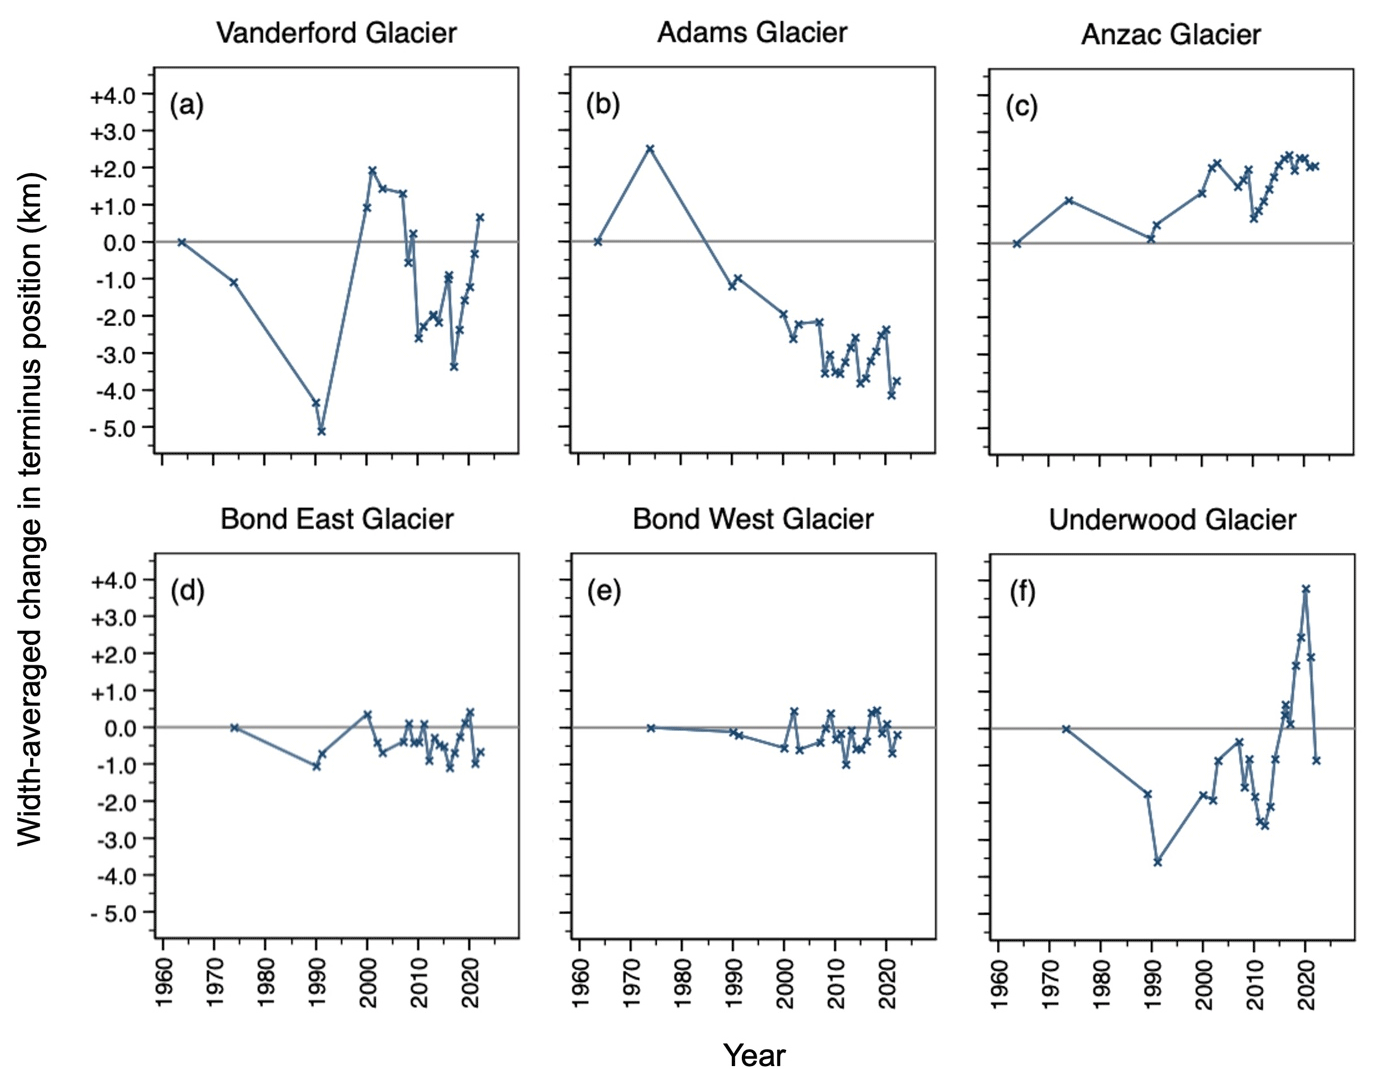
Figure 2Width-averaged terminus position change observed relative to the first measurement point at (a) Vanderford Glacier, (b) Adams Glacier, (c) Anzac Glacier, (d) Bond East Glacier, (e) Bond West Glacier and (f) Underwood Glacier. Note the raw time-series data of width-averaged terminus position change are provided in Table S3.
3.1 Terminus position
The terminus positions of the Vanderford, Adams and Underwood glaciers displayed the greatest variability across the Vincennes Bay outlet glaciers, fluctuating by ∼7 km over the study period (Fig. 2). Vanderford Glacier retreated ∼4 km between 2007 and 2010, with a large extension of ice seen to protrude from the central terminus region (Fig. 3a) being removed via calving. Following initial terminus advance, Adams Glacier showed a significant overall retreat, measured at ∼6.3 km between 1973 and 2022 (Fig. 2b). A spectacular disintegration of Underwood's floating tongue resulted in ∼4.6 km of retreat between 2020 and 2022 (Fig. 2f), with calved ice blocks clearly visible within the frontal sea ice mélange (Fig. 3f). The Bond East and Bond West termini were comparatively stable, fluctuating by a maximum of ∼1.5 km over the study period (Fig. 2). In clear contrast, Anzac Glacier exhibited an overall advance, measured at ∼2 km between 1963 and 2022 (Fig. 2c).
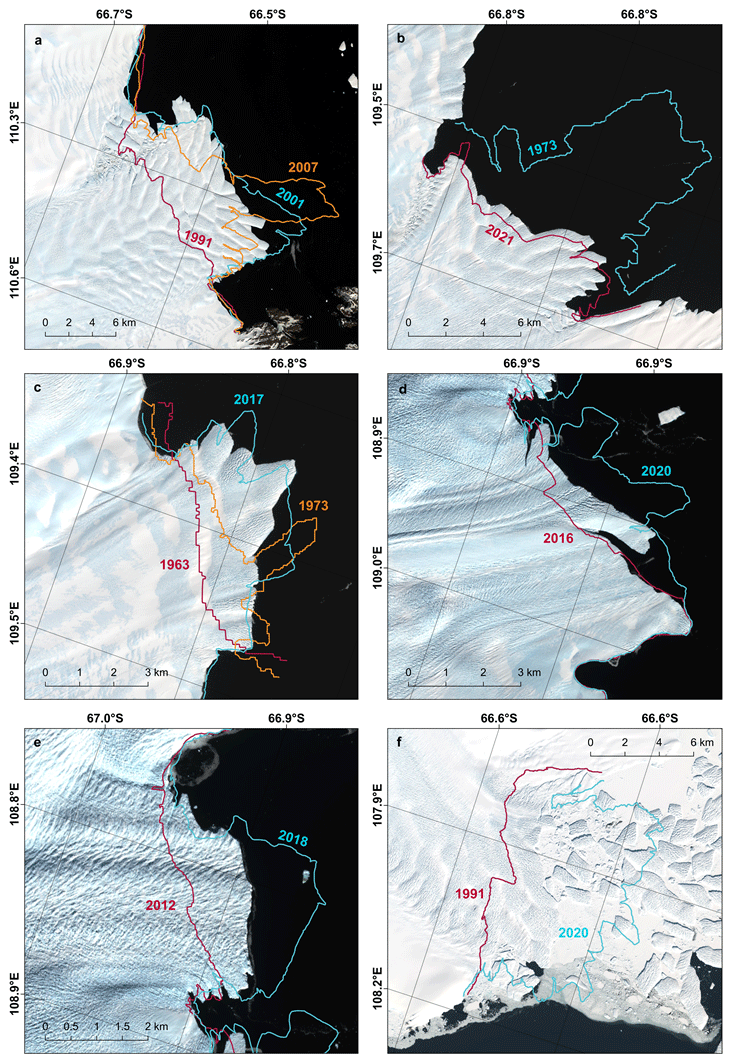
Figure 3Minimum (red), maximum (blue) and notably asymmetrical (orange) terminus positions manually digitised across (a) Vanderford Glacier, (b) Adams Glacier, (c) Anzac Glacier, (d) Bond East Glacier, (e) Bond West Glacier and (f) Underwood Glacier. All background satellite imagery displayed was collected from Sentinel-2B in February 2022 and downloaded from the USGS EarthExplorer data repository.
Table 3Rate of width-averaged terminus position change observed across the Vincennes Bay outlet glaciers. Note that the raw time-series data of width-averaged terminus position change are provided in Table S3.
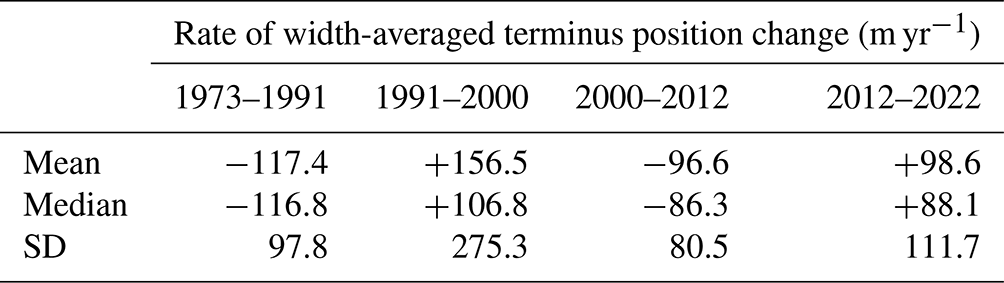
At the decadal scale, the Vincennes Bay outlet glaciers fluctuated between periods of largely synchronous terminus retreat and terminus advance. Between 1973 and 1991, each of the six glaciers showed an overall retreat, calculated at a median rate of −116.8 m yr−1 (Table 3). In contrast, between 1991 and 2000, four glaciers were observed to advance, with a positive median rate of terminus position change of +106.8 m yr−1 calculated across the six glaciers. Between 2000 and 2012, all six glaciers showed an overall retreat, calculated at a median rate of −86.3 m yr−1. Between 2012 and 2022, five glaciers were recorded to advance, with a median rate of +88.1 m yr−1 observed across the Vincennes Bay outlet glaciers.
3.2 Ice-surface velocity
Significant variability in ice-surface velocity was observed between the Vincennes Bay outlet glaciers (Fig. 1a), with spatial variations also seen along-flow at each glacier (Fig. 4). In 2018, Anzac Glacier was measured to be the slowest-flowing outlet glacier, with velocity increasing from 128 ± 1 m yr−1 inland at Anzac (AN; Fig. 1a) to a maximum of 331 ± 1 m yr−1 at the terminus (Fig. 4c). In contrast, Bond West was measured to be the fastest-flowing outlet glacier, accelerating rapidly from 241 ± 4 m yr−1 inland at Bond West (BW; Fig. 1a) to a maximum velocity of 3339 ± 2 m yr−1 (Fig. 4e), representing one of the highest recorded velocities within Antarctica. The maximum velocity measured across each of the Vanderford, Adams, Bond East and Underwood glaciers ranged from 598 ± 1 to 1625 ± 4 m yr−1 (Fig. 4).
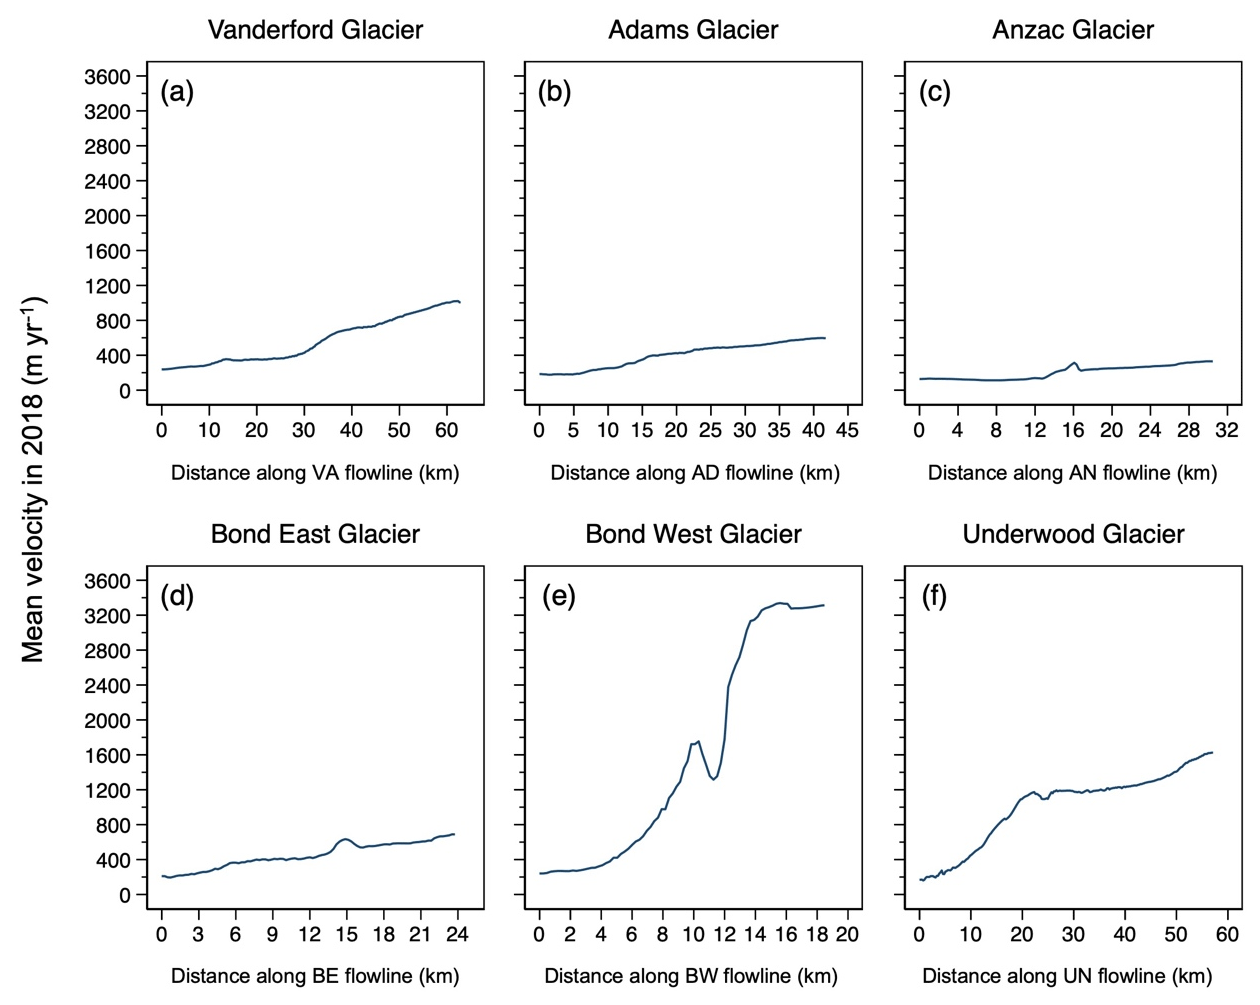
Figure 4Ice-surface velocity profiles extracted using the ITS_LIVE 2018 velocity mosaic (Gardner et al., 2022) along the central flowlines of (a) Vanderford Glacier, (b) Adams Glacier, (c) Anzac Glacier, (d) Bond East Glacier, (e) Bond West Glacier and (f) Underwood Glacier. Note that distance is measured in the along-flow direction, with 0 km representing the inland start point of each respective flowline.
Temporal variations in ice-surface velocity were limited over the observational period (Fig. 5) with ice-surface velocity showing no major changes across each of the Adams, Bond West and Underwood glaciers. Whilst ice-surface velocity was seen to increase by 12 % across the FT of Anzac Glacier between 2009 and 2021 (Fig. 5c), this velocity increase was not deemed notable, with the absolute value of acceleration (30 m yr−1) being smaller than the associated error (±82 m yr−1). However, a clear 31 % increase was observed at Vanderford Glacier, with ice-surface velocity at box IN accelerating from 201 ± 39 to 264 ± 6 m yr−1 between 2000 and 2013 (Fig. 5a). Significant variations were also seen at Bond East Glacier, with a period of deceleration measured between 2006 and 2009, followed by a subsequent acceleration between 2009 and 2021 (Fig. 5d). Such variation in ice-surface velocity was consistent across each of the IN, GL and FT boxes. At the GL box, ice-surface velocity slowed by 15 %, decreasing from 508 ± 42 m yr−1 in 2006 to 430 ± 66 m yr−1 in 2009 (Fig. 5d). Subsequent acceleration was also calculated at 15 %, with ice-surface velocity observed to increase to 496 m yr−1 in 2021 (Fig. 5d).
3.3 Ice-surface elevation
The ice-surface elevation data provided by both Schröder et al. (2019b) and Nilsson et al. (2021) were associated with high levels of uncertainty prior to 2003, particularly during the early 1990s (Fig. 6). However, with the exception of Anzac Glacier (Fig. 6c), there was a general agreement between each respective dataset regarding the overall pattern of ice-surface elevation change measured across each GL box. A clear and consistent thinning trend was measured at Vanderford Glacier throughout the observational period (Fig. 6a). Between 2003 and 2017, Schröder et al. (2019b) and Nilsson et al. (2021) observed thinning at an average rate of −0.12 and −0.07 m yr−1, respectively. However, Nilsson et al. (2021) observed an enhanced rate of thinning between 2017 and 2020, measured at −0.22 m yr−1. Despite their observed stability between 2003 and 2017, Nilsson et al. (2021) also measured enhanced thinning rates across the Adams, Anzac and Underwood glaciers between 2017 and 2020 (Fig. 6), calculated at an average rate of −0.32, −0.44 and −0.38 m yr−1, respectively. In contrast, ice-surface elevation was observed to be stable across both Bond East and Bond West between 2003 and 2020, with Nilsson et al. (2021) measuring minor thickening at an average rate of just +0.01 m yr−1. The patterns of surface elevation change were observed to be consistent across both the GL (Fig. 6) and IN (Fig. S2) boxes at each respective glacier.
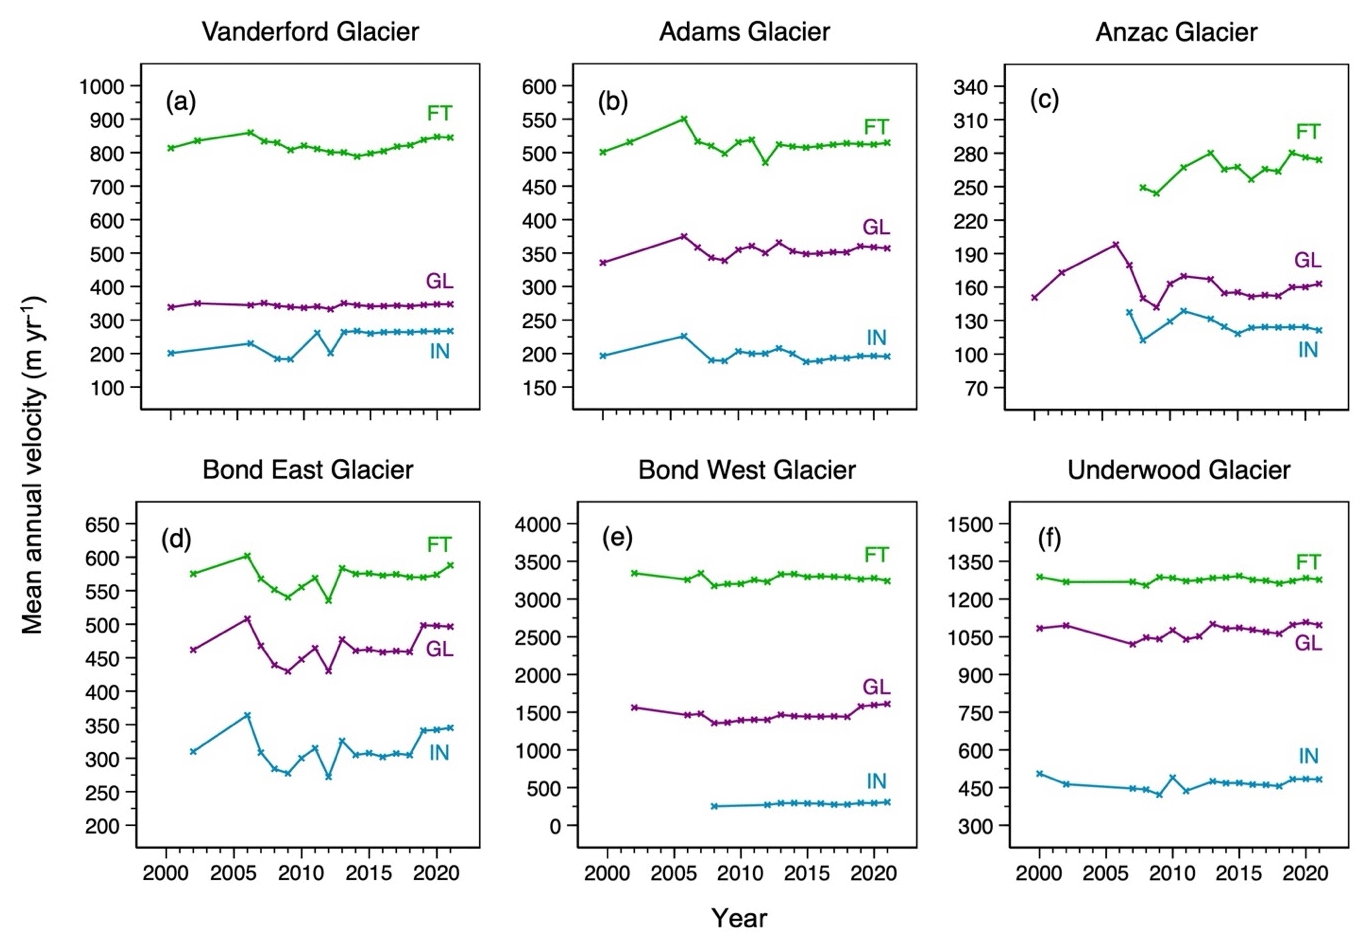
Figure 5Mean annual velocity extracted within the inland (IN), grounding line (GL) and floating tongue (FT) boxes across (a) Vanderford Glacier, (b) Adams Glacier, (c) Anzac Glacier, (d) Bond East Glacier, (e) Bond West Glacier and (f) Underwood Glacier. Velocity data extracted from the ITS_LIVE velocity mosaics between 2000 and 2018 (Gardner et al., 2022) and ENVEO datasets between 2019 and 2021 (ENVEO, 2021). Note the different scales on the y axes.
Mirroring the elevation patterns observed by Schröder et al. (2019b) and Nilsson et al. (2021), similar trends are found in the ICESat- and ICESat-2-derived data of Smith et al. (2020b) (Fig. 7). Whilst Vanderford, Adams, Anzac and Underwood glaciers showed an overall decrease in ice-surface elevation between 2003 and 2019, both the Bond East and Bond West glaciers exhibited minor thickening across the same time period. Such minor thickening was concentrated within ∼35 km of the coastline, with ice-surface elevation comparatively stable inland of the Bond East and Bond West flowlines (Fig. 7).
3.4 Grounding line position
Vanderford Glacier showed the greatest and most consistent grounding line retreat across the observational period, retreating ∼18.6 km between 1996 and 2020, at an average rate of −0.8 km yr−1 (Fig. 8a). This magnitude of retreat falls greatly outside the estimated error values provided with each dataset (Table 2) and likely exceeds any uncertainties associated with comparing the hinge line (AIS CCI and MEaSUREs) and break in slope (ASAID and MOA). The rapid grounding line retreat primarily occurred down a retrograde bedrock slope; however, the most recent observed grounding line position appears to be situated on a stabilising ridge (Fig. 9a). Between 2016 and 2020, the average rate of grounding line retreat increased to 1.0 km yr−1, with ∼4.1 km of grounding line retreat measured over this 4-year period (Fig. 8a).
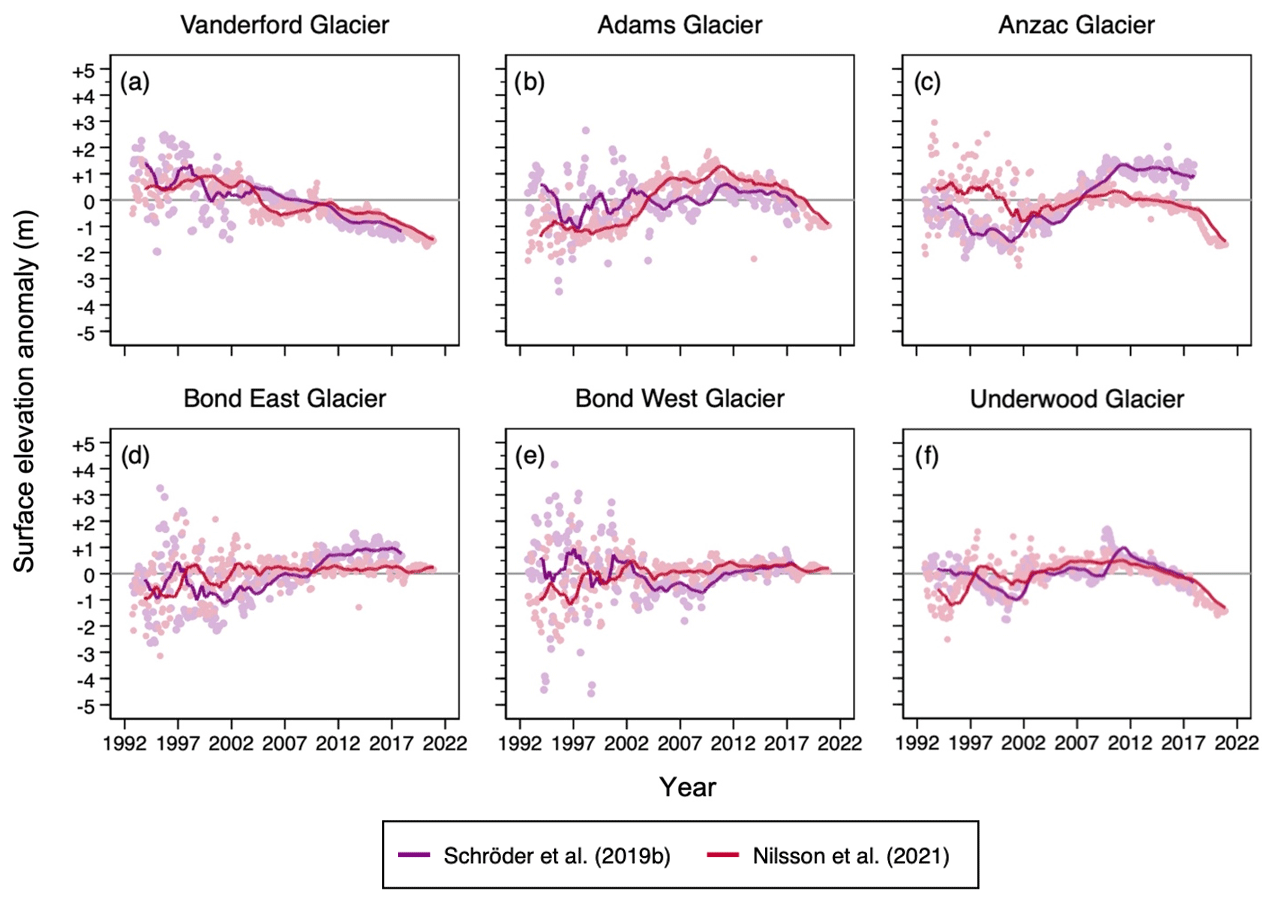
Figure 6Monthly surface elevation anomalies observed in each GL box at (a) Vanderford Glacier, (b) Adams Glacier, (c) Anzac Glacier, (d) Bond East Glacier, (e) Bond West Glacier and (f) Underwood Glacier between 1992 and 2020. Elevation anomalies are calculated relative to the long-term 1992–2017 mean. Bold lines represent 24-month rolling means.
In contrast, the grounding line positions of the Adams, Anzac, Bond East, Bond West and Underwood glaciers were observed to be stable between 2001 and 2014, with the ASAID and MOA grounding line products digitised in nearly identical locations (Fig. 8). Despite an initial grounding line advance of ∼5 km between 1996 and 2001, an overall retreat of ∼4.5 km was observed at Adams Glacier between 1996 and 2020 (Fig. 8b). A similar overall pattern of grounding line retreat was observed at Anzac Glacier, measured at ∼5.4 km over the same time period (Fig. 8c).
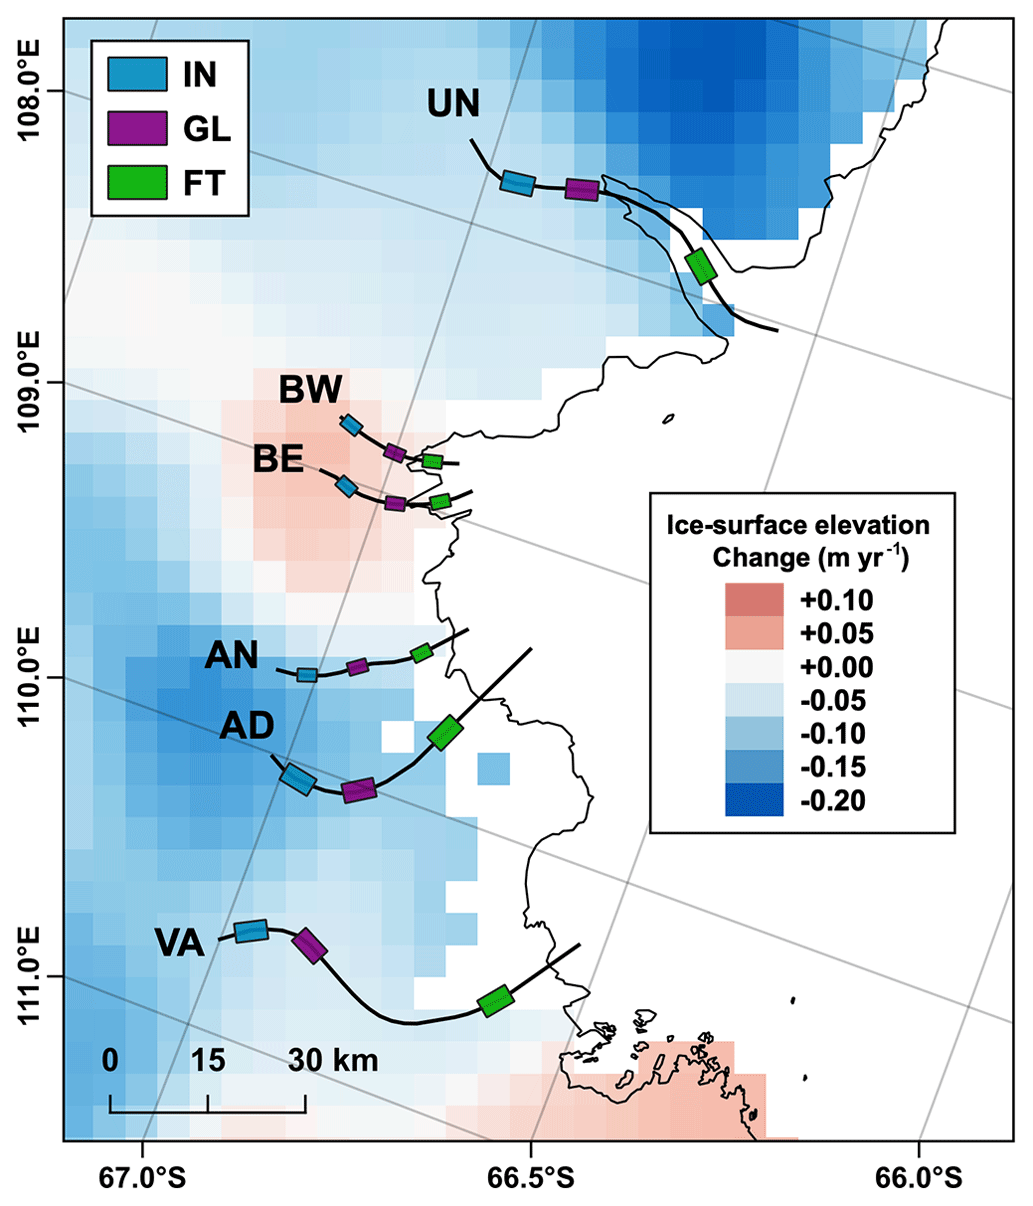
Figure 7Rate of ice-surface elevation change observed inland of Vincennes Bay between 2003 and 2019, as calculated by Smith et al. (2020b). Coastline, shown in black, downloaded from the SCAR Antarctic Digital Database, accessed using Quantarctica 3 (Matsuoka et al., 2021).
Between 1996 and 2014, Bond West and Underwood glaciers exhibited very similar patterns of grounding line retreat, retreating ∼4.9 and ∼4.7 km, respectively (Fig. 8). The majority of this retreat was observed between 1996 and 2001. Unlike the other outlet glaciers within Vincennes Bay, Bond East's grounding line was seen to be stable across the observational period (Fig. 8d). Between 1996 and 2001, the grounding line was estimated to have retreated ∼2 km. However, between 2004 and 2014, Bond East's grounding line remained within ∼600 m of the observed 1996 position. It should be noted that more recent grounding line positions were not available at the Bond East, Bond West and Underwood glaciers.
4.1 Recent dynamic change and future evolution of Vanderford Glacier
Our results show a continuation of notable grounding line retreat at Vanderford Glacier, measured at 18.6 km between 1996 and 2020 (Fig. 8a). This represents an average rate of retreat of 0.78 km yr−1, corresponding closely with the 17 km of grounding line retreat previously observed by Rignot et al. (2019) between 1996 and 2017 (0.81 km yr−1). This high rate of retreat places Vanderford Glacier as the fastest retreating glacier in East Antarctica over decadal timescales (Konrad et al., 2018; Stokes et al., 2022). Only Thwaites and Pine Island glaciers have sustained higher rates of grounding line retreat, measured at 0.8 km yr−1 (1992–2011) (Milillo et al., 2019) and 0.95 yr−1 (1992–2011) (Park et al., 2013), respectively, over the satellite era. Such high rates of retreat have widely been attributed to the enhanced intrusion of warm mCDW across the continental shelf towards sub-ice shelf cavities (Thoma et al., 2008; Steig et al., 2012; Paolo et al., 2015; Turner et al., 2017a; Scambos et al., 2017; Rignot et al., 2019). The marked grounding line retreat observed at Vanderford Glacier is therefore consistent with the notion that warm mCDW is able to access local ice shelf cavities below the Vanderford Ice Shelf, driving high rates of basal melting (Depoorter et al., 2013; Ribeiro et al., 2021).
The rapid rate of grounding line retreat measured at Vanderford Glacier is anomalous within Vincennes Bay, calculated to be nearly 4 times greater than the average rate of retreat (0.20 km yr−1) recorded across the Adams, Anzac, Bond East, Bond West and Underwood glaciers. With mCDW typically observed to access sub-ice shelf cavities via deep subglacial troughs (Jenkins et al., 2010; Scambos et al., 2017; Rignot et al., 2019), this significant difference may be indicative of a bathymetric pathway that favours preferential intrusion of mCDW towards the Vanderford Ice Shelf rather than the other studied glaciers. Bathymetric data remain limited across Vincennes Bay, but recent echo sounding carried out on board RSV Nuyina revealed an undiscovered canyon at the front of Vanderford Glacier, estimated to be more than 55 kilometres in length, reaching a maximum depth of 2200 m (Fig. 10) (Australian Antarctic Division, 2022). This canyon provides a potential pathway for the incursion of mCDW at depth towards the Vanderford Ice Shelf, thereby facilitating enhanced rates of grounding line retreat relative to the other Vincennes Bay outlet glaciers.
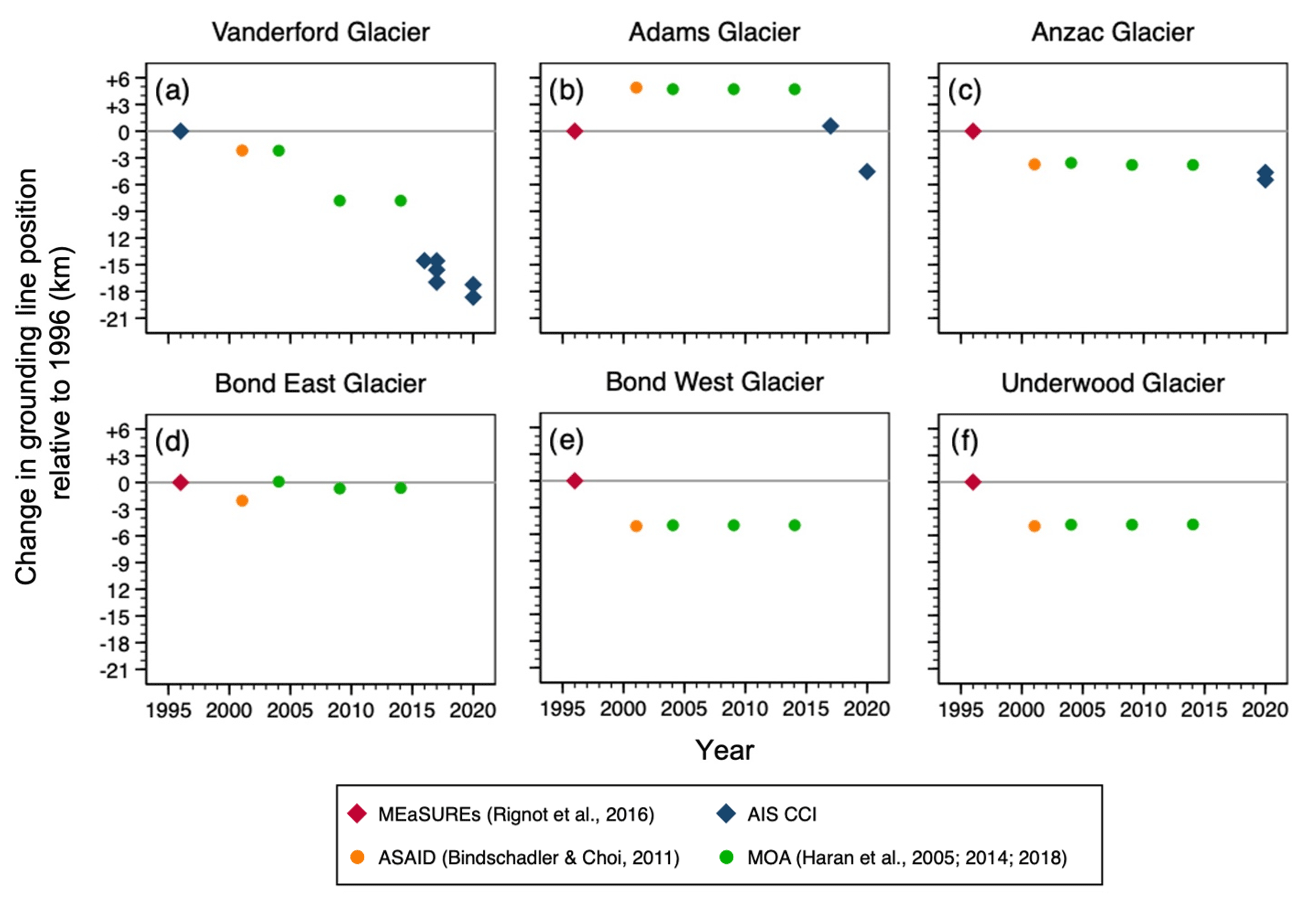
Figure 8Change in grounding line position measured relative to the minimum 1996 position observed at (a) Vanderford Glacier, (b) Adams Glacier, (c) Anzac Glacier, (d) Bond East Glacier, (e) Bond West Glacier and (f) Underwood Glacier. Note that circles represent grounding line positions derived from optical imagery, whilst diamonds represent grounding line products derived using DInSAR.
In addition, the anomalously high rate of grounding line retreat observed at Vanderford Glacier may be attributed to the underlying bedrock geometry. Figure 9a indicates that between 1996 and 2020, the majority of Vanderford's grounding line retreat occurred down a retrograde slope. In contrast, with the exception of Bond West Glacier (Fig. 9e), the grounding line retreat observed at other glaciers within Vincennes Bay generally occurred along prograde slopes. As retrograde bedrock slopes favour more extensive grounding line retreat for a given basal melt rate (Milillo et al., 2019; Millan et al., 2022), the high rate of grounding line retreat seen at Vanderford Glacier may hence also be the product of the underlying bedrock geometry.
The intrusion of warm mCDW to sub-ice shelf cavities facilitates enhanced oceanic thinning of floating ice shelves (Paolo et al., 2015). Such ice shelves transmit a critical buttressing force upstream, restraining the outflow of grounded ice (Fürst et al., 2016). The thinning of ice shelves reduces this buttressing potential, often triggering dynamic thinning and acceleration across upstream glaciers (Reese et al., 2018). For example, Thwaites Glacier accelerated by 33 % between 2006 and 2013 (Mouginot et al., 2014), with dynamic thinning of at least 1.5 m yr−1 measured between 2012 and 2020 (Bevan et al., 2021). Whilst our results reveal a 31 % increase in inland velocity at Vanderford Glacier between 2000 and 2013, velocity was seen to be stable across the grounding line throughout the observational period (2000–2021), with no significant acceleration recorded (Fig. 5a). In addition, although a consistent decrease in surface elevation was measured across Vanderford Glacier (Fig. 6a), the average rate of ice thinning, calculated to range between −0.07 and −0.12 m yr−1 (2003–2017), was an order of magnitude lower than recorded at other glaciers undergoing similar rapid grounding line retreat within the Amundsen Sea Embayment, such as Thwaites Glacier (Pritchard et al., 2009; Flament and Rémy, 2012; Konrad et al., 2017).
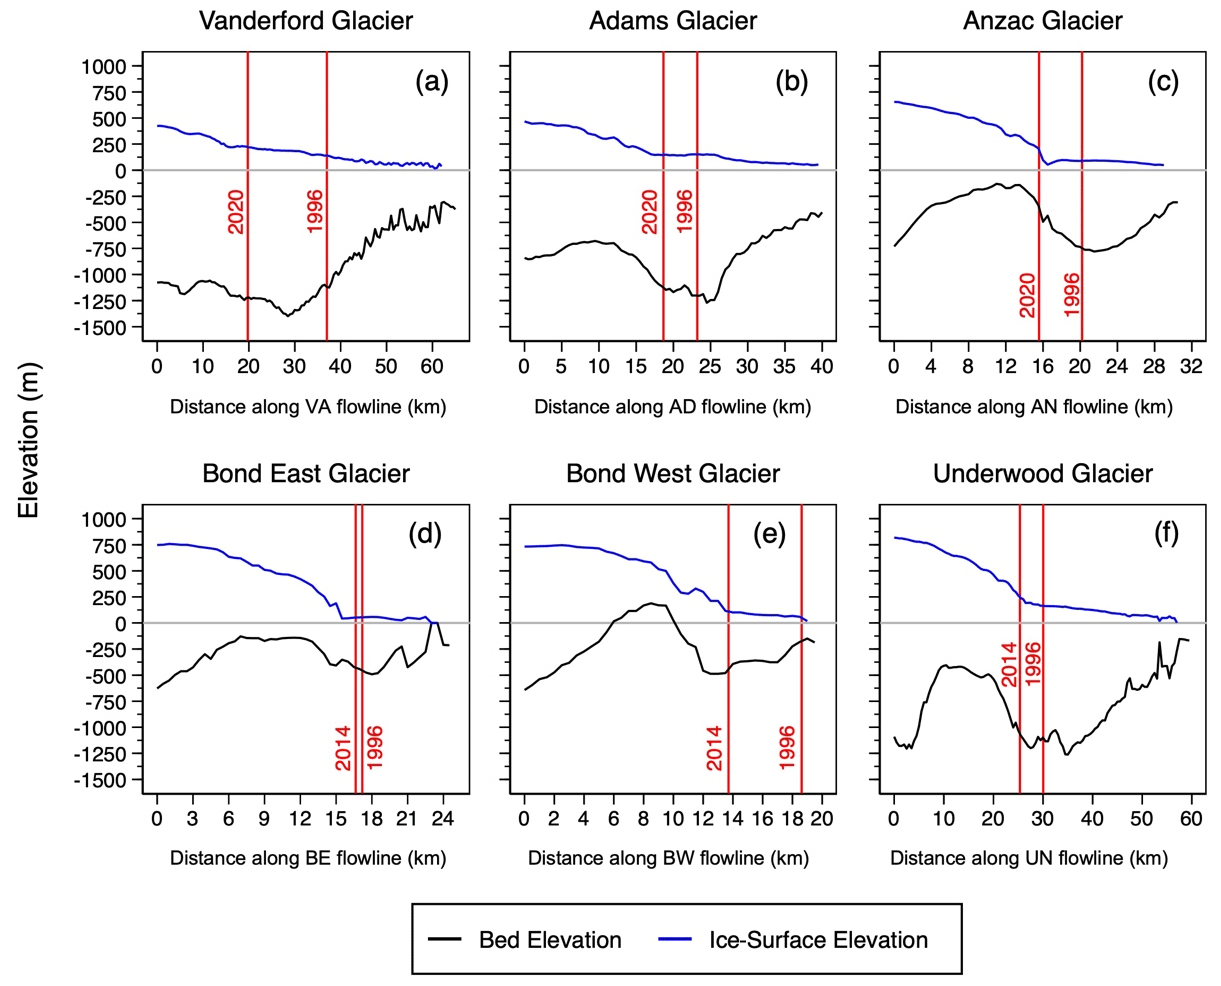
Figure 9Ice surface (Howat et al., 2019) and bedrock elevation (Morlighem, 2020) profiles extracted along the central flowlines of (a) Vanderford Glacier, (b) Adams Glacier, (c) Anzac Glacier, (d) Bond East Glacier, (e) Bond West Glacier and (f) Underwood Glacier. Dated vertical red lines represent the oldest and most recent grounding line positions observed. Note that distance is measured in the along-flow direction, with 0 km representing the inland start point of each respective flowline.
The lack of significant ice-surface elevation change across Vanderford Glacier could be attributed to variations in surface mass balance, with a comparatively high rate of snowfall within the Aurora Subglacial Basin potentially obscuring a dynamic thinning signal. However, the rate of surface lowering measured across the neighbouring Totten Glacier (Fig. 1b) was also significantly higher than at Vanderford Glacier, estimated up to −1.7 m yr−1 between 2003 and 2008 (Khazendar et al., 2013). This suggests that the comparatively moderate rate of thinning seen across Vanderford Glacier is not the product of dynamic thinning being mitigated by high regional snowfall. Rather, the rate of dynamic thinning observed across Vanderford Glacier appears to have been significantly lower, indicating that the ocean-driven reduction in buttressing force exerted by the Vanderford Ice Shelf has presently been limited. This likely reflects that in Antarctica, the majority of basal melting is confined to the grounding zone, owing to both water column stratification and the role of pressure in determining the freezing point of seawater (Rignot et al., 2013). The relative lack of a dynamic response supports this notion, indicating that high basal melt rates have been concentrated at the grounding line (Rignot et al., 2013) rather than across the Vanderford Ice Shelf.
Using remotely sensed data and calculation of the volume flux divergence, Rignot et al. (2013) estimated area-averaged basal melt rates of 5.3 ± 2 m yr−1 under the Vincennes Bay ice shelves. This is significantly lower than the area-averaged basal melt rates of the Thwaites and Pine Island ice shelves, estimated at 17.7 ± 1 and 16.2 ± 1 m yr−1, respectively (Rignot et al., 2013).
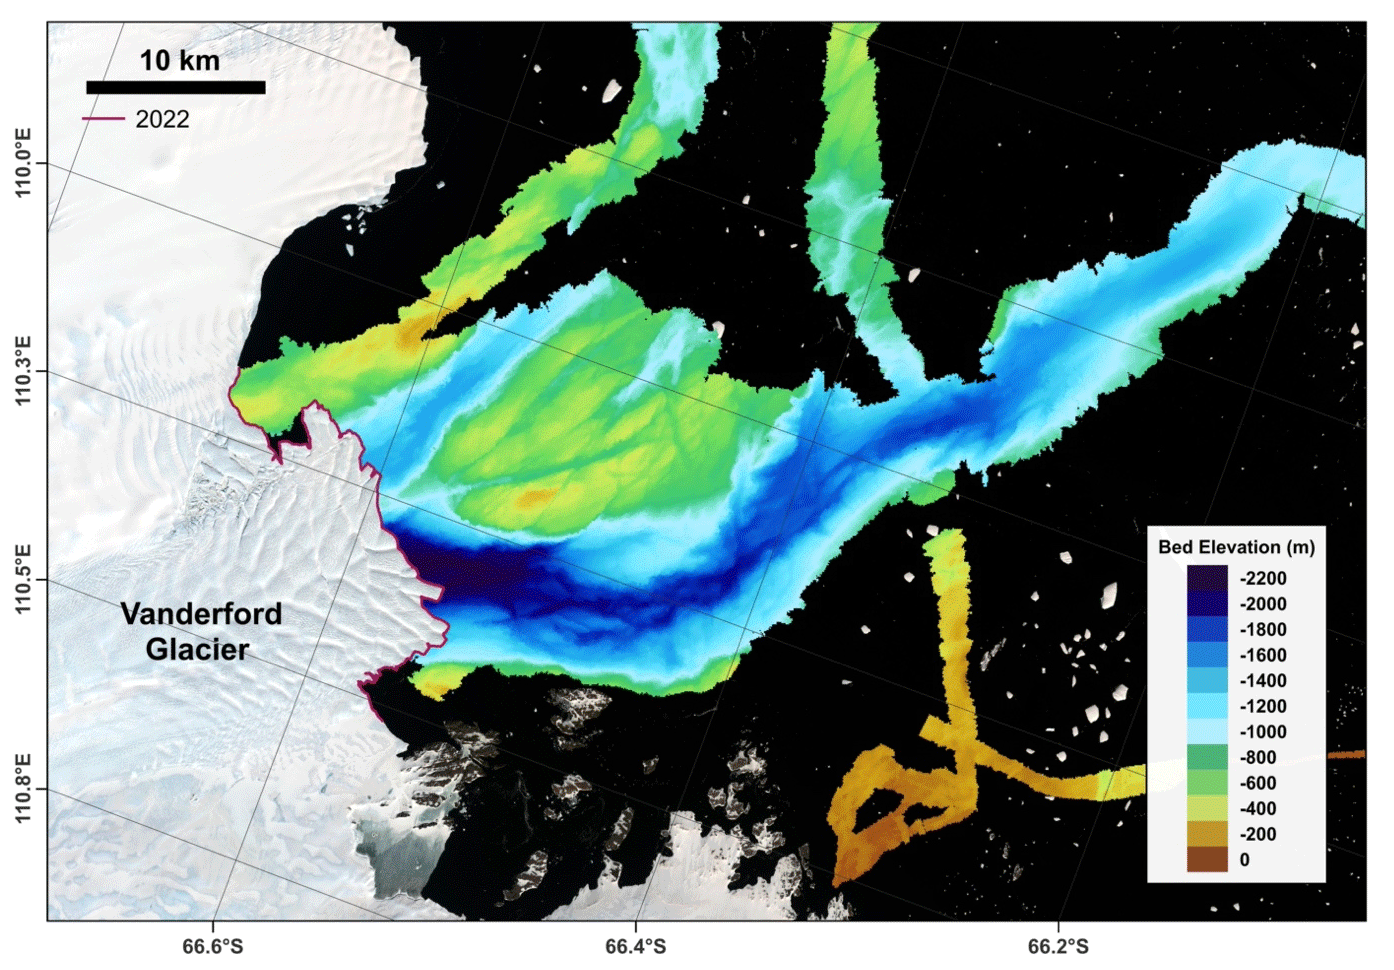
Figure 10Bathymetry mapped at the front of Vanderford Glacier, collected during RSV Nuyina's maidan voyage to Antarctica (Commonwealth of Australia, 2022). Background satellite imagery was collected in February 2022, with red line showing the associated digitised terminus position.
However, accurate quantification of such basal melt rates remains challenging, particularly at the grounding line. Direct point measurements can be obtained using radar instrumentation, such as the autonomous phase-sensitive radio-echo sounder (ApRES) (Nicholls et al., 2015), but this requires in situ deployment and remains uncertain across areas characterised by thick ice or by a high density of basal crevasses (Vaňková et al., 2021). Recent work has therefore favoured high-resolution remote-sensing methods in order to assess spatial variations in basal melt under individual ice shelves (Berger et al., 2017; Shean et al., 2019). Future application of such methods could provide more accurate estimates of basal melt rates under the Vanderford Ice Shelf, thereby allowing an assessment as to whether basal melt is largely confined to the grounding line, as hypothesised.
Whilst Vanderford Glacier is currently grounded on a stabilising bedrock ridge (Fig. 9a), the extension of the central flowline shows that retrograde slopes are observed inland along the Vanderford Trench, with a significant decrease in bedrock elevation seen approximately 70 km inland of the present grounding line position (Fig. 11c). If the current rate of grounding line retreat (0.78 km yr−1) were to continue, this steep bedrock slope would be reached within 100 years, potentially triggering MISI. Indeed, using the BISICLES adaptive-mesh ice sheet model, Sun et al. (2016) simulated Vanderford's grounding line to retreat rapidly along the Vanderford Trench, separating Law Dome (Fig. 1b) from the continental ice sheet within 1000 years. However, Sun et al. (2016) also emphasised that such extensive grounding line retreat is dependent on the future oceanic forcing, requiring basal melt rates elevated above those observed at present.
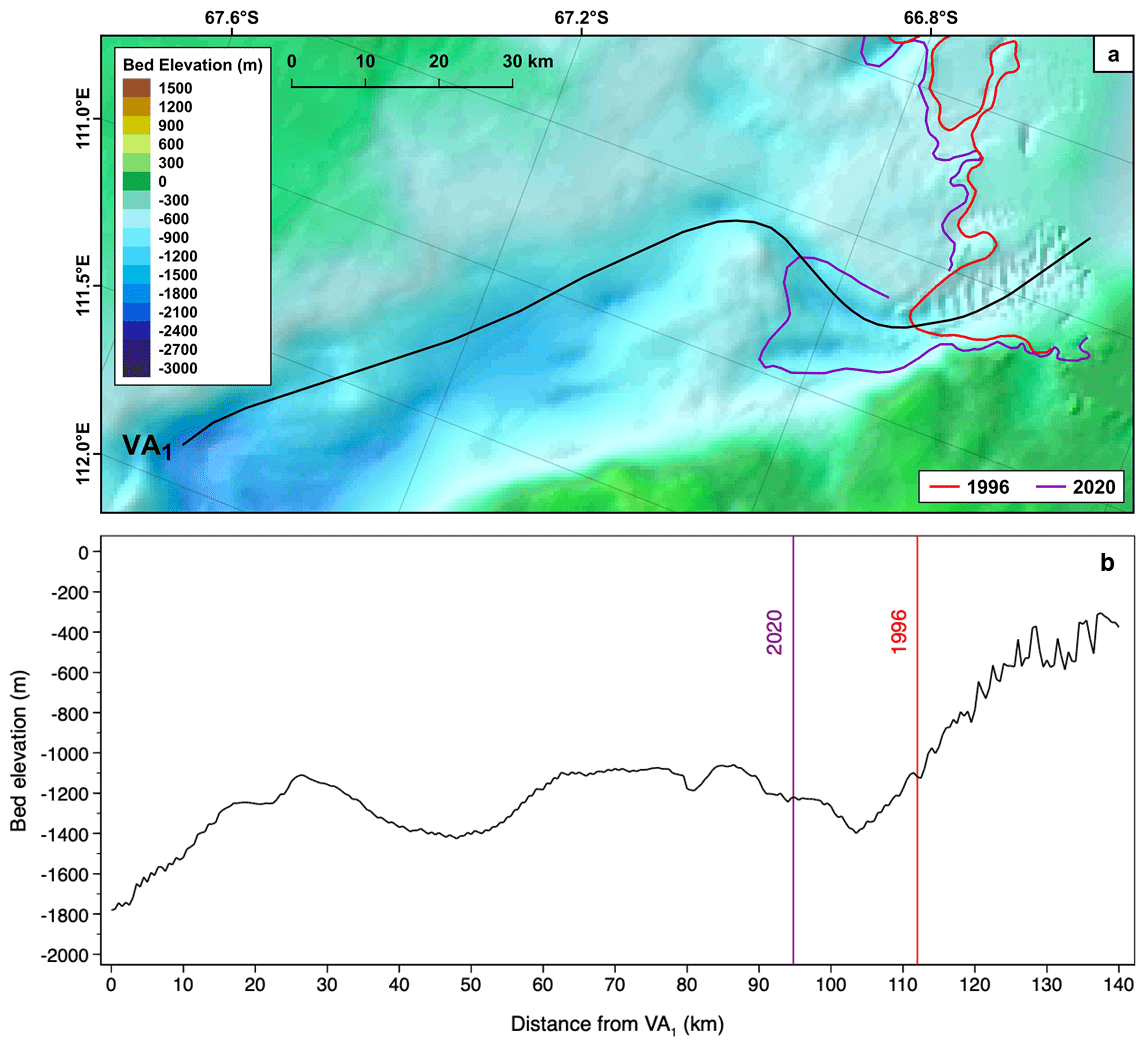
Figure 11(a) Location of an extended flowline digitised along the main flow of Vanderford Glacier. Background shows BedMachine bed elevation, underlain by a hillshade (Morlighem, 2020). (b) Bed elevation sampled from BedMachine (Morlighem, 2020) along the extended flowline. The 1996 MEaSUREs (Rignot et al., 2016) and 2020 AIS CCI grounding line positions are displayed in red and purple, respectively.
Recent oceanographic observations suggest that the oceanic heat supply to East Antarctica is increasing (Herraiz-Borreguero and Garabato, 2022), potentially facilitating increased basal melt rates. The mid-depth CDW found along the continental slope off East Antarctica has warmed significantly since the 1990s, with an increase of 0.29 ∘C per decade estimated near Vincennes Bay (105–111∘ E). This warming has been attributed to the southward shift in the Antarctic Circumpolar Current (ACC) (Yamazaki et al., 2021), understood to have been driven by a poleward shift in the westerlies over the Southern Ocean associated with summertime positive trends in the southern annular mode (Herraiz-Borreguero and Garabato, 2022). With climatic models predicting that the southern annular mode will continue trending towards its positive phase under high-emission scenarios (Zheng et al., 2013; Lim et al., 2016; Lee et al., 2021), further CDW warming may be expected off East Antarctica, enabling enhanced basal melt rates (Herraiz-Borreguero and Garabato, 2022). Subsequent increased outflow of glacial meltwater will likely further hinder the formation of DSW in the Vanderford polynya, thereby facilitating the enhanced incursion of warm mCDW at depth (Ribeiro et al., 2021). This positive feedback could drive rapid grounding line retreat at Vanderford Glacier, potentially providing the oceanic forcing required to initiate MISI (Sun et al., 2016). Such a mechanism may support recent modelling conducted by Jordan et al. (2023), contributing to the negative mass balance predicted across the EAIS in response to enhanced mCDW intrusion onto the continental shelf.
4.2 The role of sea ice in controlling outlet glacier ice dynamics
Taken together, the decadal variations in terminus position observed across Vincennes Bay (Table 3) are seen to correspond closely with the wider decadal-scale patterns reported along the Wilkes Land coast (Miles et al., 2016) (Fig. 12). The majority of Wilkes Land outlet glaciers were seen to retreat between 1974–1990 and switch to a period of sustained advance between 1990–2000, before retreating again between 2000–2012 (Miles et al., 2016). Miles et al. (2016) suggest that such decadal fluctuations between terminus retreat and terminus advance are strongly correlated to rates of sea ice production around East Antarctica, emphasising the role of sea ice formation in modulating the intrusion of warm mCDW towards glacier termini. Miles et al. (2016) explain that increased sea ice production enhances brine rejection and can lead to destratification of the water column (Petty et al., 2014), thereby facilitating the formation of DSW and production of Antarctic Bottom Water (AABW) (Kusahara et al., 2011). Such AABW represents the densest water mass in the ocean (Ribeiro et al., 2021) and therefore inhibits the intrusion of mCDW at depth, suppressing rates of basal melt and facilitating terminus advance (Miles et al., 2016). In contrast, decreased sea ice production is understood to reduce the formation of DSW and the associated production of AABW, thereby allowing enhanced intrusion of mCDW at depth. Miles et al. (2016) conclude that such enhanced intrusion increases rates of basal melt, with negative sea ice anomalies therefore attributed to the periods of synchronous terminus retreat observed along the Wilkes Land coast (1974–1990, 2000–2012; Fig. 12) (Miles et al., 2016).
However, as discussed previously, the majority of basal melting is confined to the grounding zone in Antarctica (Rignot et al., 2013). It is perhaps therefore more likely that variations in sea ice coverage influenced outlet glacier terminus positions within Vincennes Bay by modulating the buttressing provided. Landfast sea ice and mélange exert a resistive backstress at the ice front, reducing the frequency of calving events and increasing terminus stability (Amundson et al., 2010; Gomez-Fell et al., 2022). Previous calving and ice shelf disaggregation events observed in Wilkes Land have therefore been linked to the break-up of multi-year landfast sea ice (Miles et al., 2017) and removal of mélange from the ice front (Arthur et al., 2021). Recent work has also emphasised the important role that sea ice appears to play in protecting coastal regions from storm-generated ocean swells, with reduced sea ice concentrations associated with steep sea-surface slopes observed to initiate calving (Massom et al., 2018; Francis et al., 2021; Christie et al., 2022). Whilst the relative importance of each mechanism remains unclear within Vincennes Bay, it is apparent that sea ice may play a critical role in determining the frontal position of the studied outlet glaciers.
A detailed analysis of decadal trends in sea ice production is yet to be carried out within Vincennes Bay; however, Miles et al. (2016) have previously noted a negative correlation between sea ice production and average air temperatures over the sea ice production season (April to October) along the Wilkes Land coast. To consider this potential correlation, monthly surface air temperature data collected at Casey Station (Fig. 1b) were downloaded and analysed (Met-READER, 2022). The results indicate that such a negative correlation was also observed within Vincennes Bay, with higher temperatures, and thus reduced sea ice concentrations by proxy, observed to be coincident with periods of terminus retreat (Fig. 12). The decrease in mean surface air temperature and overall pattern of terminus advance observed between 2012–2022 (Fig. 12) may therefore be indicative of increased sea ice production within Vincennes Bay over this most recent decade.
Table 4The average rate of thinning observed within the GL box of the Vanderford, Adams, Anzac and Underwood glaciers between both 2003–2017 and 2017–2020. Note that these rates of thinning were extracted from the ice-surface elevation dataset provided by Nilsson et al. (2021).
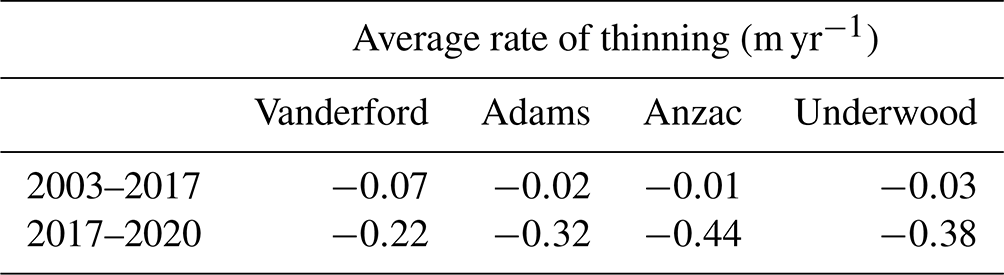
Nonetheless, analysis of ice-surface elevation shows a pattern of accelerated thinning across each of the Vanderford, Adams, Anzac and Underwood glaciers between 2017 and 2020 (Fig. 6). The most significant acceleration was measured at Anzac Glacier, with the average rate of thinning increasing from −0.01 m yr−1 between 2003 and 2017 to −0.44 m yr−1 between 2017 and 2020 (Table 4) (Nilsson et al., 2021). Whilst the observational period is relatively short, this synchronous dynamic response is potentially indicative of a common external forcing and a minimal lag-time. One such forcing may have been the significant decline in Antarctic sea ice extent seen during the austral spring of 2016 (Turner et al., 2017b). Although negative sea ice anomalies were observed to be transient across the western Pacific Ocean (90–160∘ E) (Turner et al., 2017b), the decreased production of sea ice may have driven increased rates of basal melt (Miles et al., 2016) and reduced the resistive backstress exerted at the ice front (Amundson et al., 2010; Gomez-Fell et al., 2022). With each of the Vanderford, Adams and Underwood glaciers undergoing a period of sustained terminus advance between 2017 and 2020 (Fig. 2), such reduced buttressing appears to have facilitated longitudinal thinning across the grounding line. The reduced stability of the glacier termini (Admundson et al., 2010) may have also contributed to the spectacular disintegration of Underwood's floating tongue observed between 2020 and 2022 (Fig. 2f). With a satellite-era record minimum Antarctic sea ice extent observed in February 2022 (Turner et al., 2022), Vanderford Glacier could be expected to experience a similar significant calving event in the immediate future. However, more detailed analysis of sea ice variability within Vincennes Bay is required in order to better understand these potentially important ice–ocean interactions.
4.3 High velocity at Bond West Glacier
Ice discharge across the grounding line is dependent on ice velocity (Moon et al., 2015); the accurate assessment of ice velocity is hence crucial for determining sea level contributions. In comparison to the other outlet glaciers within Vincennes Bay, Bond West Glacier flows at a significantly higher velocity (Fig. 4). The fastest-flowing outlet glacier in East Antarctica, Shirase Glacier, is measured to reach speeds in excess of 2200 m yr−1 across the grounding line (Miles et al., 2023), with a maximum speed of 2700 m yr−1 measured at the calving front (Pattyn and Derauw, 2002). Whilst Bond West flows more slowly across its grounding line, at an average velocity of 1463 m yr−1 (2002–2021), a more extreme acceleration is observed across Bond West's floating tongue, with a maximum flow speed of 3344 m yr−1 measured in 2002 (Fig. 5e). The floating tongue is thus heavily fractured (Fig. 3e), showing a crevasse pattern more typically observed across fast-moving Greenlandic glaciers, such as Jakobshavn Isbræ (Mayer and Herzfeld, 2000). The high ice-surface velocity measured across Bond West's floating tongue may be a product of the underlying bedrock topography, with a steep slope of 9.6∘ measured immediately upstream of the grounding line (Fig. 9e). In addition, fast-flowing upstream ice is observed to converge through a comparatively narrow ice shelf, constrained to the east by a stable ice rise and to the west by elevated bedrock topography (Fig. 1b). Enhanced ice velocity must thus occur in order to maintain constant ice discharge through a smaller cross-sectional area (Winsborrow et al., 2010).
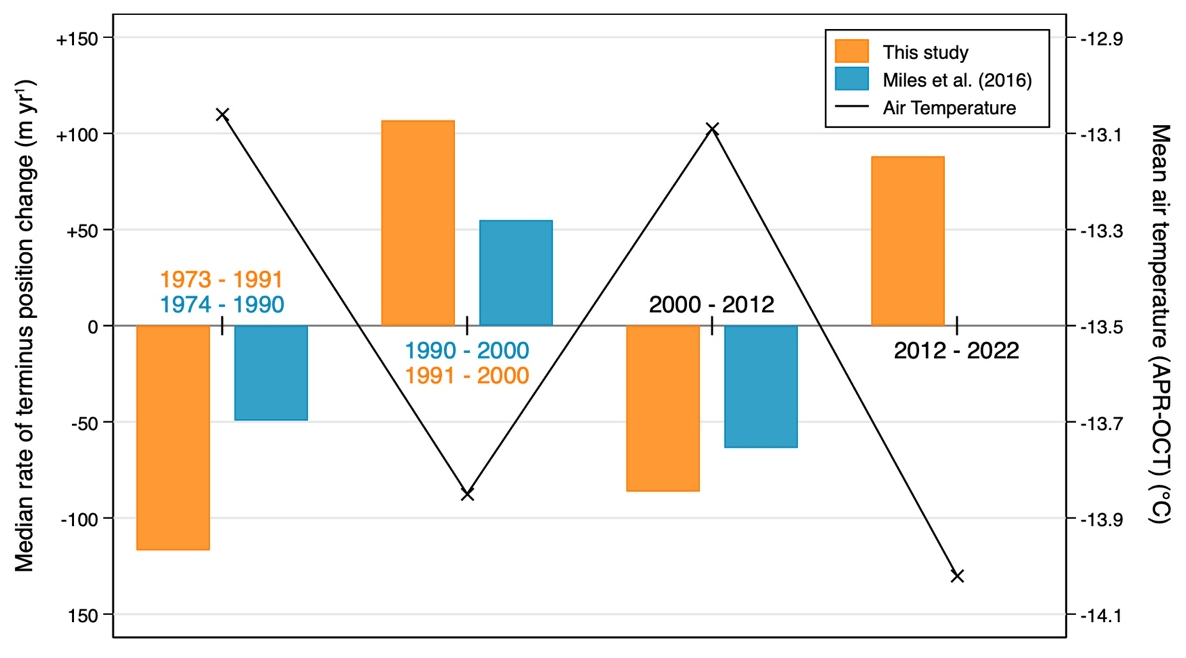
Figure 12Median decadal terminus position change reported in this study within Vincennes Bay, shown in orange, in comparison to that observed along the Wilkes Land coastline by Miles et al. (2016), shown in blue. This study: n=6; Miles et al. (2016): n=15 (1974–1990), 37 (1990–2000) and 39 (2000–2012). Mean surface air temperatures measured at Casey Station (66.3∘ S, 110.5∘ E) over the sea ice production season (April to October), extracted from Met-READER (2022), displayed in black.
4.4 Importance of accurate DInSAR grounding line mapping
The accurate mapping of grounding line positions is fundamental for understanding ice sheet mass balance and assessing potential future contributions to sea level rise (Rignot et al., 2014; Mohajerani et al., 2021). However, Antarctic grounding line positions have been mapped using a variety of different methods, with the term “grounding line” often being used to refer to different distinct features across the grounding zone (Bindschadler et al., 2011). The most accurate mapping technique is typically considered to be DInSAR, with the hinge line being used as a proxy for the grounding line, derived precisely through the analysis of tidally induced vertical motion (Rignot et al., 2014; Li et al., 2021; Mohajerani et al., 2021). In contrast, the manual digitisation of grounding line positions from optical imagery, delineated using the most seaward observed break in slope, can be associated with high levels of uncertainty (Fricker et al., 2009; Rignot et al., 2011), particularly at fast-flowing outlet glaciers such as those found within Vincennes Bay (Bindschadler et al., 2011; Christie et al., 2016). This has been attributed to the notion that fast-flowing ice streams are typically moving via basal sliding, meaning the transition to zero basal resistance across the ice shelf therefore produces a less marked break in slope (Rignot et al., 2011). With the exception of Vanderford Glacier, the results presented in this study show that the grounding line positions mapped from optical imagery (ASAID and MOA datasets) are located in near-identical locations at each of the Vincennes Bay outlet glaciers between 2001 and 2014 (Fig. 8). Whilst this may be indicative of grounding line stability, the lack of precise DInSAR grounding line mapping over this time period precludes such inferences being made with certainty. We therefore propose that such DInSAR techniques should be prioritised in order to facilitate accurate grounding line mapping across such potentially dynamic regions of East Antarctica.
This study provides the first detailed investigation of ice dynamics observed across the outlet glaciers of Vincennes Bay, a region recently recorded to have the warmest intrusions of mCDW within East Antarctica (Ribeiro et al., 2021). We observe a continuation of extensive grounding line retreat at Vanderford Glacier (cf. Rignot et al., 2019), measured at 18.6 km between 1996 and 2020. This represents an average rate of retreat of 0.78 km yr−1 and corresponds closely with the 17 km of grounding line retreat previously observed by Rignot et al. (2019) between 1996 and 2017 (0.81 km yr−1). It also places Vanderford Glacier as the fastest retreating glacier in East Antarctica (Konrad et al., 2018; Stokes et al., 2022) and the third fastest retreating glacier across the Antarctic Ice Sheet at the decadal scale. Such rapid retreat is consistent with the notion that warm mCDW is able to intrude at depth, accessing cavities formed below the Vanderford Ice Shelf (Depoorter et al., 2013; Ribeiro et al., 2021). With the long-term rate of ice-surface elevation change observed to be relatively minimal across Vanderford Glacier, such mCDW appears to be intruding to the grounding zone, driving high rates of basal melting at the grounding line (Rignot et al., 2013) rather than across the Vanderford Ice Shelf. Whilst currently grounded on a stabilising bedrock ridge, retrograde slopes are observed inland along the Vanderford Trench. If grounding line retreat continues at the present rate, this retrograde slope will be reached within 100 years, raising the potential for MISI. With basal melt predicted to further inhibit the formation of DSW within the Vanderford polynya (Ribeiro et al., 2021; Herraiz-Borreguero and Garabato, 2022), mCDW intrusion may be enhanced, thereby providing the oceanic forcing required to drive further grounding line retreat.
In comparison to Vanderford Glacier, the extent of grounding line retreat observed across the Adams, Anzac, Bond East, Bond West and Underwood glaciers was significantly lower, averaged at a rate of 0.2 km yr−1. With a recently discovered canyon providing a potential bathymetric pathway for mCDW intrusion towards Vanderford Glacier, the comparatively lower rates of grounding line retreat observed across the remaining Vincennes Bay outlet glaciers may be indicative of a relative lack of bathymetric pathways towards these termini. Indeed, the grounding line positions of the Adams, Anzac, Bond East, Bond West and Underwood glaciers were seen to be stable between 2001 and 2014. However, such stability was inferred from datasets derived through the manual digitisation of the most seaward observed break in slope and hence associated with higher levels of uncertainty. The results of this study thus emphasise the need to prioritise the precise mapping of grounding line positions using DInSAR techniques, particularly across dynamic regions, such as Wilkes Land.
This study also reveals that decadal changes in frontal position measured across the Vincennes Bay outlet glaciers correspond closely with wider patterns reported along the Wilkes Land coastline (Miles et al., 2016). An analysis of air surface temperature data collected at Casey Station supports the notion that such trends may be related to variations in sea ice production. Negative sea ice anomalies are thought to drive terminus retreat through three primary mechanisms: (i) limiting the formation of DSW and thus facilitating enhanced intrusion of mCDW at depth (Miles et al., 2016); (ii) reducing the backstress exerted on the ice front, thereby decreasing terminus stability (Amundson et al., 2010); and (iii) increasing the vulnerability of the ice front to storm-generated ocean swells (Massom et al., 2018; Francis et al., 2021; Christie et al., 2022). The role of sea ice debuttressing and enhanced mCDW intrusion is also attributed to the accelerated thinning observed across each of the Vanderford, Adams, Anzac and Underwood glaciers between 2017 and 2020, facilitating longitudinal thinning across the grounding line. Further analysis of sea ice variability and such potentially important ice–ocean interactions is therefore required in order to better understand outlet glacier ice dynamics within Vincennes Bay.
The manually digitised terminus positions, central flowlines and sampling boxes are available to download from the UK Polar Data Centre (https://doi.org/10.5285/4D4BD383-F6BB-4476-9058-D883B7706B26; last access: June 2023, Picton et al., 2023). The ITS_LIVE annual velocity mosaics (2000–2018) are available from NASA’s National Snow and Ice Data Center (NSIDC) (https://doi.org/10.5067/6II6VW8LLWJ7; last access: April 2022, Gardner et al., 2022), whilst the ENVEO monthly velocity mosaics (2018–2020) are available from the NERC EDS Centre for Environmental Data Analysis (https://doi.org/10.5285/00fe090efc58446e8980992a617f632f; last access: May 2022, ENVEO, 2021). The monthly surface elevation change datasets produced by Schröder et al. (2019b) (1978–2017) and Nilsson et al. (2021) (1985–2020) are available from https://doi.org/10.1594/PANGAEA.897390 (last access: May 2022) and https://doi.org/10.5067/L3LSVDZS15ZV (last access: May 2022). The ice-column thickness-change-rate estimates (2003–2019) made by Smith et al. (2020b) are available from the ResearchWorks Archive (https://digital.lib.washington.edu/researchworks/handle/1773/45388, last access: May 2022). The AIS CCI grounding line positions derived in this study are available from the ENVEO cryoportal (cryoportal.enveo.at), entitled “GLL, Vincennes Bay, Antarctica, 1996–2020”. The MEaSUREs (Rignot et al., 2016) 1996 grounding line positions are available from NASA’s NSIDC (https://doi.org/10.5067/IKBWW4RYHF1Q, last access: April 2022). The MOA grounding line positions from 2004 (Haran et al., 2005), 2009 (Haran et al., 2014) and 2014 (Haran et al., 2018) are also available from the NSIDC at https://doi.org/10.5067/68TBT0CGJSOJ (last access: February 2022), https://doi.org/10.5067/4ZL43A4619AF (last access: February 2022) and https://doi.org/10.5067/RNF17BP824UM (last access: February 2022), respectively. The ASAID grounding line dataset (1999–2003) is available from the U.S. Antarctic Program Data Center (https://doi.org/10.7265/N56T0JK2, last access: June 2022, Bindschadler and Choi, 2011). The monthly surface air temperature collected from Casey Station is available from https://legacy.bas.ac.uk/met/READER/surface/Casey.All.temperature.html (last access: July 2022, Met-READER, 2022).
The supplement related to this article is available online at: https://doi.org/10.5194/tc-17-3593-2023-supplement.
HJP, CRS and SSRJ designed the initial study. HJP undertook the data collection and conducted the analysis, with guidance from CRS and SSRJ. DF and LK completed the DInSAR grounding line mapping within Vincennes Bay, with LK writing the associated methods section. HJP led the remaining manuscript writing, with input and edits from all authors.
At least one of the (co-)authors is a member of the editorial board of The Cryosphere. The peer-review process was guided by an independent editor, and the authors also have no other competing interests to declare.
Publisher’s note: Copernicus Publications remains neutral with regard to jurisdictional claims in published maps and institutional affiliations.
Chris R. Stokes and Stewart S. R. Jamieson acknowledge funding from the Natural Environment Research Council (NE/R000824/1). The authors would also like to thank the editor (Huw Horgan), Wei Ji Leong and an anonymous reviewer for their constructive comments on this paper.
This research has been supported by the Natural Environment Research Council (grant no. NE/R000824/1).
This paper was edited by Huw Horgan and reviewed by Wei Ji Leong and one anonymous referee.
Amundson, J., Fahnestock, M., Truffer, M., Brown, J., Lüthi, M., and Motyka, R.: Ice mélange dynamics and implications for terminus stability, Jakobshavn Isbræ, Greenland, J. Geophys. Res., 115, F01005, https://doi.org/10.1029/2009JF001405, 2010.
Arthur, J., Stokes, C., Jamieson, S., Miles, B., Carr, R., and Leeson, A.: The triggers of the disaggregation of Voyeykov Ice Shelf (2007), Wilkes Land, East Antarctica, and its subsequent evolution, J. Glaciol., 67, 265, 933–951, https:// doi.org/10.1017/jog.2021.45, 2021.
Australian Antarctic Division: https://www.antarctica.gov.au/nuyina/stories/2022/rsv-nuyina-discovers-deep-glacial-canyon/, last access: 21 January 2022.
Berger, S., Drews, R., Helm, V., Sun, S., and Pattyn, F.: Detecting high spatial variability of ice shelf basal mass balance, Roi Baudouin Ice Shelf, Antarctica, The Cryosphere, 11, 2675–2690, https://doi.org/10.5194/tc-11-2675-2017, 2017.
Bevan, S. L., Luckman, A. J., Benn, D. I., Adusumilli, S., and Crawford, A.: Brief communication: Thwaites Glacier cavity evolution, The Cryosphere, 15, 3317–3328, https://doi.org/10.5194/tc-15-3317-2021, 2021.
Bindschadler, R., Choi, H., Wichlacz, A., Bingham, R., Bohlander, J., Brunt, K., Corr, H., Drews, R., Fricker, H., Hall, M., Hindmarsh, R., Kohler, J., Padman, L., Rack, W., Rotschky, G., Urbini, S., Vornberger, P., and Young, N.: Getting around Antarctica: new high-resolution mappings of the grounded and freely-floating boundaries of the Antarctic ice sheet created for the International Polar Year, The Cryosphere, 5, 569–588, https://doi.org/10.5194/tc-5-569-2011, 2011.
Bindschadler, R. and Choi, H.: High-resolution Image-derived Grounding and Hydrostatic Lines for the Antarctic Ice Sheet. U.S. Antarctic Program (USAP) Data Center [data set] https://doi.org/10.7265/N56T0JK2, 2011.
Black, T. E. and Joughin, I.: Multi-decadal retreat of marine-terminating outlet glaciers in northwest and central-west Greenland, The Cryosphere, 16, 807–824, https://doi.org/10.5194/tc-16-807-2022, 2022.
Chen, X., Shearer, P. M., Walter, F., and Fricker, H. A.: Seventeen Antarctic seismic events detected by global surface waves and a possible link to calving events from satellite images, J. Geophys. Res.-Sol. Ea., 116, 1–16, https://doi.org/10.1029/2011JB008262, 2011.
Christianson, K., Bushuk, M., Dutrieux, P., Parizek, B. R., Joughin, I. R., Alley, R. B., Shean, D. E., Abrahamsen, E. P., Anandakrishnan, S., Heywood, K. J., Kim, T.-W., Lee, S. H., Nicholls, K., Stanton, T., Truffer, M., Webber, B. G. M., Jenkins, A., Jacobs, S., Bindschadler, R., and Holland, D. M.: Sensitivity of Pine Island Glacier to observed ocean forcing: PIG response to ocean forcing, Geophys. Res. Lett., 43, 10817–10825, https://doi.org/10.1002/2016GL070500, 2016.
Christie, F. D. W., Bingham, R. G., Gourmelen, N., Tett, S. F. B., and Muto, A.: Four-decade record of pervasive grounding line retreat along the Bellingshausen margin of West Antarctica, Geophys. Res. Lett., 43, 5741–5749, https://doi.org/10.1002/2016GL068972, 2016.
Christie, F. D. W., Benham, T., Batchelor, C., Rack, W., Montelli, A., and Dowdeswell, J.: Antarctic ice-shelf advance driven by anomalous atmospheric and sea-ice circulation, Nat. Geosci., 15, 356–362, https://doi.org/10.1038/s41561-022-00938-x, 2022.
Commonwealth of Australia: RSV Nuyina Voyage 2 2021-22 Voyage Data, Southern Ocean, Antarctica, Version 1. Australian Antarctic Data Centre [data set], https://doi.org/10.26179/zz6j-e834, 2022.
Davis, E. R., Jones, D. J., Morgan, V. I., and Young, N. W.: A Survey of the Vanderford and Adams Glaciers in East Antarctica (Abstract), Ann. Glaciol., 8, 197–197, https://doi.org/10.3189/S0260305500001476, 1986.
Depoorter, M. A., Bamber, J. L., Griggs, J. A., Lenaerts, J. T. M., Ligtenberg, S. R. M., van den Broeke, M. R., and Moholdt, G.: Calving fluxes and basal melt rates of Antarctic ice shelves, Nature, 502, 89–92, https://doi.org/10.1038/nature12567, 2013.
EarthExplorer: United States Geological Survey, available at: https://earthexplorer.usgs.gov/, last access: April 2022.
ENVEO.: ESA Antarctic Ice Sheet Climate Change Initiative 60 (Antarctic_Ice_Sheet_cci): Antarctic Ice Sheet monthly velocity from 2017 to 2020, derived from Sentinel-1, v1. NERC EDS Centre for Environmental Data Analysis [data set], https://doi.org/10.5285/00fe090efc58446e8980992a617f632f, 2021.
Favier, L., Durand, G., Cornford, S. L., Gudmundsson, G. H., Gagliardini, O., Gillet-Chaulet, F., Zwinger, T., Payne, A. J., and Le Brocq, A. M.: Retreat of Pine Island Glacier controlled by marine ice-sheet instability, Nat. Clim. Change, 4, 117–121, https://doi.org/10.1038/nclimate2094, 2014.
Feldmann, J. and Levermann, A.: Collapse of the West Antarctic Ice Sheet after local destabilization of the Amundsen Basin, P. Natl. Acad. Sci. USA, 112, 14191–14196, https://doi.org/10.1073/pnas.1512482112, 2015.
Flament, T. and Rémy, F.: Dynamic thinning of Antarctic glaciers from along-track repeat radar altimetry, J. Glaciol., 58, 830–840, https://doi.org/10.3189/2012JoG11J118, 2012.
Francis, D., Mattingly, K. S., Lhermitte, S., Temimi, M., and Heil, P.: Atmospheric extremes caused high oceanward sea surface slope triggering the biggest calving event in more than 50 years at the Amery Ice Shelf, The Cryosphere, 15, 2147–2165, https://doi.org/10.5194/tc-15-2147-2021, 2021.
Fricker, H. A., Coleman, R., Padman, L., Scambos, T. A., Bohlander, J., and Brunt, K. M.: Mapping the grounding zone of the Amery Ice Shelf, East Antarctica using InSAR, MODIS and ICESat, Antarc. Sci., 21, 515–532, https://doi.org/10.1017/S095410200999023X, 2009.
Friedl, P., Weiser, F., Fluhrer, A., and Braun, M.: Remote sensing of glacier and ice sheet grounding lines: A review, Earth-Sci. Rev., 201, 102948, https://doi.org/10.1016/j.earscirev.2019.102948, 2020.
Fürst, J. J., Durand, G., Gillet-Chaulet, F., Tavard, L., Rankl, M., Braun, M., and Gagliardini, O.: The safety band of Antarctic ice shelves, Nat. Clim. Change, 6, 479–482, https://doi.org/10.1038/nclimate2912, 2016.
Gardner, A. S., Moholdt, G., Scambos, T., Fahnstock, M., Ligtenberg, S., van den Broeke, M., and Nilsson, J.: Increased West Antarctic and unchanged East Antarctic ice discharge over the last 7 years, The Cryosphere, 12, 521–547, https://doi.org/10.5194/tc-12-521-2018, 2018.
Gardner, A., Fahnestock, M., and Scambos, T.: ITS_LIVE Regional Glacier and Ice Sheet Surface Velocities: Version 1. National Snow and Ice Data Center [data set], https://doi.org/10.5067/6II6VW8LLWJ7, 2022.
Glasser, N. F., Scambos, T. A., Bohlander, J., Truffer, M., Pettit, E., and Davies, B. J.: From ice-shelf tributary to tidewater glacier: continued rapid recession, acceleration and thinning of Röhss Glacier following the 1995 collapse of the Prince Gustav Ice Shelf, Antarctic Peninsula, J. Glaciol., 57, 397–406, https://doi.org/10.3189/002214311796905578, 2011.
Goldstein, R. M., Engelhardt, H., Kamb, B., and Frolich, R. M.: Satellite Radar Interferometry for Monitoring Ice Sheet Motion: Application to an Antarctic Ice Stream, Science, 262, 1525–1530, https://doi.org/10.1126/science.262.5139.1525, 1993.
Gomez-Fell, R., Rack, W., Purdie, H., and Marsh, O.: Parker Ice Tongue collapse, Antarctica, triggered by loss of stabilizing land-fast sea ice, Geophys. Res. Lett., 49, e2021GL096156, https://doi.org/10.1029/2021GL096156, 2022.
Greenbaum, J. S., Blankenship, D. D., Young, D. A., Richter, T. G., Roberts, J. L., Aitken, A. R. A., Legresy, B., Schroeder, D. M., Warner, R. C., van Ommen, T. D., and Siegert, M. J.: Ocean access to a cavity beneath Totten Glacier in East Antarctica, Nat. Geosci., 8, 294–298, https://doi.org/10.1038/ngeo2388, 2015.
Greene, C. A., Blankenship, D. D., Gwyther, D. E., Silvano, A., and van Wijk, E.: Wind causes Totten Ice Shelf melt and acceleration, Sci. Adv., 3, e1701681, https://doi.org/10.1126/sciadv.1701681, 2017.
Gwyther, D. E., Galton-Fenzi, B. K., Hunter, J. R., and Roberts, J. L.: Simulated melt rates for the Totten and Dalton ice shelves, Ocean Sci., 10, 267–279, https://doi.org/10.5194/os-10-267-2014, 2014.
Haran, T., Bohlander, J., Scambos, T., Painter, T., and Fahnestock, M.: MODIS Mosaic of Antarctica 2003–2004 (MOA2004) Image Map, Version 1. NASA National Snow and Ice Data Center Distributed Active Archive Center [data set], https://doi.org/10.5067/68TBT0CGJSOJ, 2005.
Haran, T., Bohlander, J., Scambos, T., Painter, T., and Fahnestock, M.: MODIS Mosaic of Antarctica 2008–2009 (MOA2009) Image Map, Version 1. NASA National Snow and Ice Data Center Distributed Active Archive Center [data set], https://doi.org/10.5067/4ZL43A4619AF, 2014.
Haran, T., Linger, M., Bohlander, J., Fahnestock, M., Painter, T., and Scambos, T.: MEaSUREs MODIS Mosaic of Antarctica 2013–2014 (MOA2014) Image Map, Version 1. NASA National Snow and Ice Data Center Distributed Active Archive Center [data set], https://doi.org/10.5067/RNF17BP824UM, 2018.
Harig, C. and Simons, F. J.: Accelerated West Antarctic ice mass loss continues to outpace East Antarctic gains, Earth Planet. Sc. Lett., 415, 134–141, https://doi.org/10.1016/j.epsl.2015.01.029, 2015.
Herraiz-Borreguero, L. and Garabato, A. C. N.: Poleward shift of Circumpolar Deep Water threatens the East Antarctic Ice Sheet, Nat. Clim. Change, 12, 728–734, https://doi.org/10.1038/s41558-022-01424-3, 2022.
Howat, I. M., Porter, C., Smith, B. E., Noh, M.-J., and Morin, P.: The Reference Elevation Model of Antarctica, The Cryosphere, 13, 665–674, https://doi.org/10.5194/tc-13-665-2019, 2019.
Jenkins, A., Dutrieux, P., Jacobs, S. S., McPhail, S. D., Perrett, J. R., Webb, A. T., and White, D.: Observations beneath Pine Island Glacier in West Antarctica and implications for its retreat, Nat. Geosci., 3, 468–472, https://doi.org/10.1038/ngeo890, 2010.
Jordan, J., Miles, B., Gudmundsson, G., Jamieson, S., Jenkins, A., and Stokes, C.: Increased warm water intrusions could cause mass loss in East Antarctica during the next 200 years, Nat. Commun., 14, 1825, https://doi.org/10.1038/s41467-023-37553-2, 2023.
Joughin, I. and Alley, R. B.: Stability of the West Antarctic ice sheet in a warming world, Nat. Geosci., 4, 506–513, https://doi.org/10.1038/ngeo1194, 2011.
Joughin, I., Smith, B. E., and Medley, B.: Marine Ice Sheet Collapse Potentially Under Way for the Thwaites Glacier Basin, West Antarctica, Science, 344, 735–738, https://doi.org/10.1126/science.1249055, 2014.
Khazendar, A., Schodlok, M. P., Fenty, I., Ligtenberg, S. R. M., Rignot, E., and van den Broeke, M. R.: Observed thinning of Totten Glacier is linked to coastal polynya variability, Nat. Commun., 4, 1–9, 2013.
Kim, K., Jezek, K. C., and Liu, H.: Orthorectified image mosaic of Antarctica from 1963 Argon satellite photography: image processing and glaciological applications, Int. J. Remote Sens., 28, 5357–5373, https://doi.org/10.1080/01431160601105850, 2007.
Konrad, H., Gilbert, L., Cornford, S. L., Payne, A., Hogg, A., Muir, A., and Shepherd, A.: Uneven onset and pace of ice-dynamical imbalance in the Amundsen Sea Embayment, West Antarctica, Geophys. Res. Lett., 44, 910–918, https://doi.org/10.1002/2016GL070733, 2017.
Konrad, H., Shepherd, A., Gilbert, L., Hogg, A., McMillan, M., Muir, A., and Slater, T.: Net retreat of Antarctic glacier grounding lines, Nat. Geosci., 11, 258–262, https://doi.org/10.1038/s41561-018-0082-z, 2018.
Kusahara, K., Hasumi, H., and Williams, G. D.: Impact of the Mertz Glacier Tongue calving on dense water formation and export, Nat. Commun., 2, 159, https://doi.org/10.1038/ncomms1156, 2011.
Lhermitte, S., Sun, S., Shuman, C., Wouters, B., Pattyn, F., Wuite, J., Berthier, E., and Nagler, T.: Damage accelerates ice shelf instability and mass loss in Amundsen Sea Embayment, P. Natl. Acad. Sci. USA, 117, 24735–24741, https://doi.org/10.1073/pnas.1912890117, 2020.
Lee, J., Marotzke, J., Bala, G., Cao, L., Corti, S., Dunne, J., Engelbrecht, F., Fischer, E., Fyfe, J., Jones, C., Maycock, A., Mutemi, J., Ndiaye, O., Panickal, S., and Zhou, T.: Chapter 4 – Future Global Climate: Scenario-based Projections and Near-term Information, in: Climate Change 2021: The Physical Science Basis. Contribution of Working Group I to the Sixth Assessment Report of the Intergovernmental Panel on Climate Change, edited by: Masson-Delmotte, V., Zhai, P., Pirani, A., Connors, S., Péan, C., Berger, S., Caud, N., Chen, Y., Goldfarb, L., Gomis, M., Huang, M., Leitzell, K., Lonnoy, E., Matthews, J., Maycock, T., Waterfield, T., Yelekci, O., Yu, R., and Zhou, B., Cambridge University Press, Cambridge, 553–672, https://doi.org/10.1017/9781009157896.006, 2021.
Li, X., Rignot, E., Mouginot, J., and Scheuchl, B.: Ice flow dynamics and mass loss of Totten Glacier, East Antarctica, from 1989 to 2015, Geophys. Res. Lett., 43, 12, 6366–6373, 2016.
Li, R., Lv, D., Xie, H., Tian, Y., Xu, Y., Lu, S., Tong, X., and Weng, H.: A comprehensive assessment and analysis of Antarctic satellite grounding line products from 1992 to 2009, Sci. China Earth Sci., 64, 1332–1345, https://doi.org/10.1007/s11430-020-9729-6, 2021.
Li, X., Rignot, E., Morlighem, M., Mouginot, J., and Scheuchl, B.: Grounding line retreat of Totten Glacier, East Antarctica, 1996 to 2013, Geophys. Res. Lett., 42, 8049–8056, https://doi.org/10.1002/2015GL065701, 2015.
Lim, E.-P., Hendon, H. H., Arblaster, J. M., Delage, F., Nguyen, H., Min, S.-K., and Wheeler, M. C.: The impact of the Southern Annular Mode on future changes in Southern Hemisphere rainfall, Geophys. Res. Lett., 43, 7160–7167, https://doi.org/10.1002/2016GL069453, 2016.
Martín-Español, A., Zammit-Mangion, A., Clarke, P. J., Flament, T., Helm, V., King, M. A., Luthcke, S. B., Petrie, E., Rémy, F., Schön, N., Wouters, B., and Bamber, J. L.: Spatial and temporal Antarctic Ice Sheet mass trends, glacio-isostatic adjustment, and surface processes from a joint inversion of satellite altimeter, gravity, and GPS data, J. Geophys. Res.-Earth, 121, 182–200, https://doi.org/10.1002/2015JF003550, 2016.
Massom, R., Scambos, T., Bennetts, L., Reid, P., Squire, V., and Stammerjohn, S.: Antarctic ice shelf disintegration triggered by sea ice loss and ocean swell, Nature, 558, 383–389, https://doi.org/10.1038/s41586-018-0212-1, 2018.
Matsuoka, K., Skoglund, A., Roth, G., de Pomereu, J., Griffiths, H., Headland, R., Herried, B., Katsumata, K., Le Brocq, A., Licht, K., Morgan, F., Neff, P. D., Ritz, C., Scheinert, M., Tamura, T., Van de Putte, A., van den Broeke, M., von Deschwanden, A., Deschamps-Berger, C., Van Liefferinge, B., Tronstad, S., and Melvær, Y.: Quantarctica, an integrated mapping environment for Antarctica, the Southern Ocean, and sub-Antarctic islands, Environ. Modell. Softw., 140, 105015, https://doi.org/10.1016/j.envsoft.2021.105015, 2021.
Mayer, H. and Herzfeld, U. C.: Structural glaciology of the fast-moving Jakobshavn Isbræ, Greenland, compared to the surging Bering Glacier, Alaska, U.S.A., Ann. Glaciol., 30, 243–249, https://doi.org/10.3189/172756400781820543, 2000.
McMillan, M., Shepherd, A., Sundal, A., Briggs, K., Muir, A., Ridout, A., Hogg, A., and Wingham, D.: Increased ice losses from Antarctica detected by CryoSat-2, Geophys. Res. Lett., 41, 3899–3905, https://doi.org/10.1002/2014GL060111, 2015.
Medley, B., Joughin, I., Smith, B. E., Das, S. B., Steig, E. J., Conway, H., Gogineni, S., Lewis, C., Criscitiello, A. S., McConnell, J. R., van den Broeke, M. R., Lenaerts, J. T. M., Bromwich, D. H., Nicolas, J. P., and Leuschen, C.: Constraining the recent mass balance of Pine Island and Thwaites glaciers, West Antarctica, with airborne observations of snow accumulation, The Cryosphere, 8, 1375–1392, https://doi.org/10.5194/tc-8-1375-2014, 2014.
Met-READER.: Casey Temperature. British Antarctic Survey [data set] https://legacy.bas.ac.uk/met/READER/surface/Casey.All.temperature.html (last access: 13 July 2022), 2022.
Miles, B. W. J.: Synchronous terminus change of East Antarctic outlet glaciers linked to climatic forcing, Masters Thesis, Durham University, http://etheses.dur.ac.uk/7333/ (last access: August 2022), 2013.
Miles, B. W. J., Stokes, C. R., Vieli, A., and Cox, N.: Rapid, climate-driven changes in outlet glaciers on the Pacific coast of East Antarctica, Nature, 500, 563–566, https://doi.org/10.1038/nature12382, 2013.
Miles, B. W. J., Stokes, C. R., and Jamieson, S. S. R.: Pan–ice-sheet glacier terminus change in East Antarctica reveals sensitivity of Wilkes Land to sea-ice changes, Sci. Adv., 2, 1–7, https://doi.org/10.1126/sciadv.1501350, 2016.
Miles, B. W. J., Stokes, C. R., and Jamieson, S. S. R.: Simultaneous disintegration of outlet glaciers in Porpoise Bay (Wilkes Land), East Antarctica, driven by sea ice break-up, The Cryosphere, 11, 427–442, https://doi.org/10.5194/tc-11-427-2017, 2017.
Miles, B. W. J., Stokes, C. R., and Jamieson, S. S. R.: Velocity increases at Cook Glacier, East Antarctica, linked to ice shelf loss and a subglacial flood event, The Cryosphere, 12, 3123–3136, https://doi.org/10.5194/tc-12-3123-2018, 2018.
Miles, B. W. J., Jordan, J. R., Stokes, C. R., Jamieson, S. S. R., Gudmundsson, G. H., and Jenkins, A.: Recent acceleration of Denman Glacier (1972–2017), East Antarctica, driven by grounding line retreat and changes in ice tongue configuration, The Cryosphere, 15, 663–676, https://doi.org/10.5194/tc-15-663-2021, 2021.
Miles, B. W. J., Stokes, C. R., Jenkins, A., Jordan, J. R., Jamieson, S. S. R., and Gudmundsson, G. H.: Slowdown of Shirase Glacier, East Antarctica, caused by strengthening alongshore winds, The Cryosphere, 17, 445–456, https://doi.org/10.5194/tc-17-445-2023, 2023.
Milillo, P., Rignot, E., Rizzoli, P., Scheuchl, B., Mouginot, J., Bueso-Bello, J., and Prats-Iraola, P.: Heterogeneous retreat and ice melt of Thwaites Glacier, West Antarctica, Sci. Adv., 5, eaau3433, https://doi.org/10.1126/sciadv.aau3433, 2019.
Millan, R., Mouginot, J., Derkacheva, A., Rignot, E., Milillo, P., Ciraci, E., Dini, L., and Bjørk, A.: Ongoing grounding line retreat and fracturing initiated at the Petermann Glacier ice shelf, Greenland, after 2016, The Cryosphere, 16, 3021–3031, https://doi.org/10.5194/tc-16-3021-2022, 2022.
Mohajerani, Y., Jeong, S., Scheuchl, B., Velicogna, I., Rignot, E., and Milillo, P.: Automatic delineation of glacier grounding lines in differential interferometric synthetic-aperture radar data using deep learning, Sci. Rep., 11, 4992, https://doi.org/10.1038/s41598-021-84309-3, 2021.
Moon, T. and Joughin, I.: Changes in ice front position on Greenland's outlet glaciers from 1992 to 2007, J. Geophys. Res.-Earth, 113, 1–10, https://doi.org/10.1029/2007JF000927, 2008.
Moon, T., Joughin, I., and Smith, B.: Seasonal to multiyear variability of glacier surface velocity, terminus position, and sea ice/ice mélange in northwest Greenland, J. Geophys. Res.-Earth, 120, 818–833, https://doi.org/10.1002/2015JF003494, 2015.
Morlighem, M.: MEaSUREs BedMachine Antarctica, Version 2. NASA National Snow and Ice Data Center Distributed Active Archive Center [data set], https://doi.org/10.5067/E1QL9HFQ7A8M, 2020.
Morlighem, M., Rignot, E., Binder, T., Blankenship, D., Drews, R., Eagles, G., Eisen, O., Ferraccioli, F., Forsberg, R., Fretwell, P., Goel, V., Greenbaum, J. S., Gudmundsson, H., Guo, J., Helm, V., Hofstede, C., Howat, I., Humbert, A., Jokat, W., Karlsson, N. B., Lee, W. S., Matsuoka, K., Millan, R., Mouginot, J., Paden, J., Pattyn, F., Roberts, J., Rosier, S., Ruppel, A., Seroussi, H., Smith, E. C., Steinhage, D., Sun, B., Broeke, M. R. van den, Ommen, T. D., van Wessem, M., and Young, D. A.: Deep glacial troughs and stabilizing ridges unveiled beneath the margins of the Antarctic ice sheet, Nat. Geosci., 13, 132–137, https://doi.org/10.1038/s41561-019-0510-8, 2020.
Mouginot, J., Rignot, E., and Scheuchl, B.: Sustained increase in ice discharge from the Amundsen Sea Embayment, West Antarctica, from 1973 to 2013, Geophys. Res. Lett., 41, 1576–1584, https://doi.org/10.1002/2013GL059069, 2014.
Nagler, T., Rott, H., Hetzenecker, M., Wuite, J., and Potin, P.: The Sentinel-1 Mission: New Opportunities for Ice Sheet Observations, Remote Sens., 7, 9371–9389, https://doi.org/10.3390/rs70709371, 2015.
Nagler, T., Wuite, J., Libert, L., Hetzenecker, M., Keuris, L., and Rott, H.: Continuous Monitoring of Ice Motion and Discharge of Antarctic and Greenland Ice Sheets and Outlet Glaciers by Sentinel-1 A and B, IEEE Int. Geosci. Remote Sens., 1061–1064, https://doi.org/10.1109/IGARSS47720.2021.9553514, 2021.
Nias, I. J., Cornford, S. L., and Payne, A. J.: Contrasting the modelled sensitivity of the Amundsen Sea Embayment ice streams, J. Glaciol., 62, 552–562, https://doi.org/10.1017/jog.2016.40, 2016.
Nicholls, K., Corr, H., Stewart, C., Lok, L., Brennan, P., and Vaughan, D.: Instruments and Methods: A ground-based radar for measuring vertical strain rates and time-varying basal melt rates in ice sheets and shelves, J. Glaciol., 61, 1079–1087, https://doi.org/10.3189/2015JoG15J073, 2015.
Nilsson, J., Gardner, A. S., and Paolo, F. S.: MEaSUREs ITS_LIVE Antarctic Grounded Ice Sheet Elevation Change, Version 1, Boulder, Colorado USA. NASA National Snow and Ice Data Center Distributed Active Archive Center [data set], https://doi.org/10.5067/L3LSVDZS15ZV, 2021.
Nilsson, J., Gardner, A. S., and Paolo, F. S.: Elevation change of the Antarctic Ice Sheet: 1985 to 2020, Earth Syst. Sci. Data, 14, 3573–3598, https://doi.org/10.5194/essd-14-3573-2022, 2022.
Paolo, F. S., Fricker, H. A., and Padman, L.: Volume loss from Antarctic ice shelves is accelerating, Science, 348, 327–331, https://doi.org/10.1126/science.aaa0940, 2015.
Parizek, B. R., Christianson, K., Anandakrishnan, S., Alley, R. B., Walker, R. T., Edwards, R. A., Wolfe, D. S., Bertini, G. T., Rinehart, S. K., Bindschadler, R. A., and Nowicki, S. M. J.: Dynamic (in)stability of Thwaites Glacier, West Antarctica, J. Geophys. Res.-Earth, 118, 638–655, https://doi.org/10.1002/jgrf.20044, 2013.
Park, J., Gourmelen, N., Shepherd, A., Kim, S., Vaughan, D., and Wingham, D.: Sustained retreat of the Pine Island Glacier, Geophys. Res. Lett., 40, 2137–2142, https://doi.org/10.1002/grl.50379, 2013.
Pattyn, F. and Derauw, D.: Ice-dynamic conditions of Shirase Glacier, Antarctica, inferred from ERS SAR interferometry, J. Glaciol., 48, 559–565, https://doi.org/10.3189/172756502781831115, 2002.
Pattyn, F. and Morlighem, M.: The uncertain future of the Antarctic Ice Sheet, Science, 367, 1331-1335, https://doi.org/10.1126/science.aaz5487, 2020.
Paul, F., Bolch, T., Briggs, K., Kääb, A., McMillan, M., McNabb, R., Nagler, T., Nuth, C., Rastner, P., Strozzi, T., and Wuite, J.: Error sources and guidelines for quality assessment of glacier area, elevation change, and velocity products derived from satellite data in the Glaciers_cci project, Remote Sens. Environ., 203, 256–275, https://doi.org/10.1016/j.rse.2017.08.038, 2017.
Pelle, T., Morlighem, M., Nakayama, Y., and Seroussi, H.: Widespread Grounding Line Retreat of Totten Glacier, East Antarctica, Over the 21st Century, Geophys. Res. Lett., 48, e2021GL093213, https://doi.org/10.1029/2021GL093213, 2021.
Petty, A. A., Holland, P. R., and Feltham, D. L.: Sea ice and the ocean mixed layer over the Antarctic shelf seas, The Cryosphere, 8, 761–783, https://doi.org/10.5194/tc-8-761-2014, 2014.
Picton, H., Stokes, C., and Jamieson, S.: Terminus Positions and Flowlines of Vincennes Bay Outlet Glaciers, East Antarctica, 1963–2022 (Version 1.0), NERC EDS UK Polar Data Centre [data set], https://doi.org/10.5285/4d4bd383-f6bb-4476-9058-d883b7706b26, 2023.
Pritchard, H. D., Arthern, R. J., Vaughan, D. G., and Edwards, L. A.: Extensive dynamic thinning on the margins of the Greenland and Antarctic ice sheets, Nature, 461, 971–975, https://doi.org/10.1038/nature08471, 2009.
Reese, R., Gudmundsson, G. H., Levermann, A., and Winkelmann, R.: The far reach of ice-shelf thinning in Antarctica, Nat. Clim. Change, 8, 53–57, https://doi.org/10.1038/s41558-017-0020-x, 2018.
Ribeiro, N., Herraiz-Borreguero, L., Rintoul, S. R., McMahon, C. R., Hindell, M., Harcourt, R., and Williams, G.: Warm Modified Circumpolar Deep Water Intrusions Drive Ice Shelf Melt and Inhibit Dense Shelf Water Formation in Vincennes Bay, East Antarctica, J. Geophys. Res.-Oceans, 126, 1–17, https://doi.org/10.1029/2020JC016998, 2021.
Rignot, E.: Tidal motion, ice velocity and melt rate of Petermann Gletscher, Greenland, measured from radar interferometry, J. Glaciol., 42, 476–485, https://doi.org/10.3189/S0022143000003464, 1996.
Rignot, E., Mouginot, J., and Scheuchl, B.: Antarctic grounding line mapping from differential satellite radar interferometry, Geophys. Res. Lett., 38, 10, 1–6, https://doi.org/10.1029/2011GL047109, 2011.
Rignot, E., Jacobs, S., Mouginot, J., and Scheuchl, B.: Ice-Shelf Melting Around Antarctica, Science, 341, 266–270, https://doi.org/10.1126/science.1235798, 2013.
Rignot, E., Mouginot, J., Morlighem, M., Seroussi, H., and Scheuchl, B.: Widespread, rapid grounding line retreat of Pine Island, Thwaites, Smith, and Kohler glaciers, West Antarctica, from 1992 to 2011, Geophys. Res. Lett., 41, 3502–3509, https://doi.org/10.1002/2014GL060140, 2014.
Rignot, E., Mouginot, J., and Scheuchl, B.: MEaSUREs Antarctic Grounding Line from Differential Satellite Radar Interferometry, Version 2. NASA National Snow and Ice Data Center Distributed Active Archive Center [data set], https://doi.org/10.5067/IKBWW4RYHF1Q, 2016.
Rignot, E., Mouginot, J., Scheuchl, B., van den Broeke, M., van Wessem, M. J., and Morlighem, M.: Four decades of Antarctic Ice Sheet mass balance from 1979–2017, P. Natl. Acad. Sci. USA, 116, 1095–1103, https://doi.org/10.1073/pnas.1812883116, 2019.
Roberts, J., Galton-Fenzi, B. K., Paolo, F. S., Donnelly, C., Gwyther, D. E., Padman, L., Young, D., Warner, R., Greenbaum, J., Fricker, H. A., Payne, A. J., Cornford, S., Le Brocq, A., van Ommen, T., Blankenship, D., and Siegert, M. J.: Ocean forced variability of Totten Glacier mass loss, Geological Society, London, Special Publications, 461, 175–186, https://doi.org/10.1144/SP461.6, 2018.
Scambos, T. A., Haran, T. M., Fahnestock, M. A., Painter, T. H., and Bohlander, J.: MODIS-based Mosaic of Antarctica (MOA) data sets: Continent-wide surface morphology and snow grain size, Remote Sens. Environ., 111, 242–257, https://doi.org/10.1016/j.rse.2006.12.020, 2007.
Scambos, T. A., Bell, R. E., Alley, R. B., Anandakrishnan, S., Bromwich, D. H., Brunt, K., Christianson, K., Creyts, T., Das, S. B., DeConto, R., Dutrieux, P., Fricker, H. A., Holland, D., MacGregor, J., Medley, B., Nicolas, J. P., Pollard, D., Siegfried, M. R., Smith, A. M., Steig, E. J., Trusel, L. D., Vaughan, D. G., and Yager, P. L.: How much, how fast?: A science review and outlook for research on the instability of Antarctica's Thwaites Glacier in the 21st century, Global Planet. Change, 153, 16–34, https://doi.org/10.1016/j.gloplacha.2017.04.008, 2017.
Schoof, C.: Ice sheet grounding line dynamics: Steady states, stability, and hysteresis, J. Geophys. Res.-Earth, 112, 1-19, https://doi.org/10.1029/2006JF000664, 2007.
Schröder, L., Horwath, M., Dietrich, R., Helm, V., van den Broeke, M. R., and Ligtenberg, S. R. M.: Four decades of Antarctic surface elevation changes from multi-mission satellite altimetry, The Cryosphere, 13, 427–449, https://doi.org/10.5194/tc-13-427-2019, 2019a.
Schröder, L., Horwath, M., Dietrich, R., Helm, V., van den Broeke, M. R., and Ligtenberg, S. R. M.: Gridded surface elevation changes from multi-mission satellite altimetry 1978-2017. PANGEA [data set] https://doi.org/10.1594/PANGAEA.897390, 2019b.
Shean, D. E., Joughin, I. R., Dutrieux, P., Smith, B. E., and Berthier, E.: Ice shelf basal melt rates from a high-resolution digital elevation model (DEM) record for Pine Island Glacier, Antarctica, The Cryosphere, 13, 2633–2656, https://doi.org/10.5194/tc-13-2633-2019, 2019.
Shen, Q., Wang, H., Shum, C. K., Jiang, L., Hsu, H. T., and Dong, J.: Recent high-resolution Antarctic ice velocity maps reveal increased mass loss in Wilkes Land, East Antarctica, Sci. Rep., 8, 1–8, https://doi.org/10.1038/s41598-018-22765-0, 2018.
Shepherd, A., Gilbert, L., Muir, A. S., Konrad, H., McMillan, M., Slater, T., Briggs, K. H., Sundal, A. V., Hogg, A. E., and Engdahl, M. E.: Trends in Antarctic Ice Sheet Elevation and Mass, Geophys. Res. Lett., 46, 8174–8183, https://doi.org/10.1029/2019GL082182, 2019.
Smith, B., Fricker, H. A., Gardner, A. S., Medley, B., Nilsson, J., Paolo, F. S., Holschuh, N., Adusumilli, S., Brunt, K., Csatho, B., Harbeck, K., Markus, T., Neumann, T., Siegfried, M. R., and Zwally, H. J.: Pervasive ice sheet mass loss reflects competing ocean and atmosphere processes, Science, 368, 1239–1242, https://doi.org/10.1126/science.aaz5845, 2020a.
Smith, B., Fricker, H. A., Gardner, A. S., Medley, B., Nilsson, J., Paolo, F. S., Holschuh, N., Adusumilli, S., Brunt, K., Csatho, B., Harbeck, K., Markus, T., Neumann, T., Siegfried, M. R.,and Zwally, H. J.: Ice-sheet height and thickness changes from ICESat to ICESat-2. ResearchWorks Archive [data set] http://hdl.handle.net/1773/45388, 2020b.
Spence, P., Griffies, S. M., England, M. H., Hogg, A. McC., Saenko, O. A., and Jourdain, N. C.: Rapid subsurface warming and circulation changes of Antarctic coastal waters by poleward shifting winds, Geophys. Res. Lett., 41, 4601–4610, https://doi.org/10.1002/2014GL060613, 2014.
Steig, E. J., Ding, Q., Battisti, D. S., and Jenkins, A.: Tropical forcing of Circumpolar Deep Water Inflow and outlet glacier thinning in the Amundsen Sea Embayment, West Antarctica, Ann. Glaciol., 53, 19–28, https://doi.org/10.3189/2012AoG60A110, 2012.
Stokes, C. R., Abram, N. J., Bentley, M. J., Edwards, T. L., England, M. H., Foppert, A., Jamieson, S. S. R., Jones, R. S., King, M. A., Lenaerts, J. T. M., Medley, B., Miles, B. W. J., Paxman, G. J. G., Ritz, C., van de Flierdt, T., and Whitehouse, P. L.: Response of the East Antarctic Ice Sheet to past and future climate change, Nature, 608, 275–286, https://doi.org/10.1038/s41586-022-04946-0, 2022.
Sun, S., Cornford, S. L., Gwyther, D. E., Gladstone, R. M., Galton-Fenzi, B. K., Zhao, L., and Moore, J. C.: Impact of ocean forcing on the Aurora Basin in the 21st and 22nd centuries, Ann. Glaciol., 57, 79–86, https://doi.org/10.1017/aog.2016.27, 2016.
Sutterley, T. C., Velicogna, I., Rignot, E., Mouginot, J., Flament, T., van den Broeke, M. R., van Wessem, J. M., and Reijmer, C. H.: Mass loss of the Amundsen Sea Embayment of West Antarctica from four independent techniques, Geophys. Res. Lett., 41, 8421–8428, https://doi.org/10.1002/2014GL061940, 2014.
The IMBIE Team.: Mass balance of the Antarctic Ice Sheet from 1992 to 2017, Nature, 558, 219-222, https://doi.org/10.1038/s41586-018-0179-y, 2018.
Thoma, M., Jenkins, A., Holland, D., and Jacobs, S.: Modelling Circumpolar Deep Water intrusions on the Amundsen Sea continental shelf, Antarctica, Geophys. Res. Lett., 35, L18602, https://doi.org/10.1029/2008GL034939, 2008.
Thompson, A. F., Stewart, A. L., Spence, P., and Heywood, K. J.: The Antarctic Slope Current in a Changing Climate, Rev. Geophys., 56, 741–770, https://doi.org/10.1029/2018RG000624, 2018.
Turner, J., Orr, A., Gudmundsson, G. H., Jenkins, A., Bingham, R. G., Hillenbrand, C.-D., and Bracegirdle, T. J.: Atmosphere-ocean-ice interactions in the Amundsen Sea Embayment, West Antarctica, Rev. Geophys., 55, 235–276, https://doi.org/10.1002/2016RG000532, 2017a.
Turner, J., Phillips, T., Marshall, G. J., Hosking, J. S., Pope, J. O., Bracegirdle, T. J., and Deb, P.: Unprecedented springtime retreat of Antarctic sea ice in 2016, Geophys. Res. Lett., 44, 6868–6875, https://doi.org/10.1002/2017GL073656, 2017b.
Turner, J., Holmes, C., Caton Harrison, T., Phillips, T., Jena, B., Reeves-Francois, T., Fogt, R., Thomas, E. R., and Bajish, C. C.: Record Low Antarctic Sea Ice Cover in February 2022, Geophys. Res. Lett., 49, e2022GL098904, https://doi.org/10.1029/2022GL098904, 2022.
Vaňková, I., Cook, S., Winberry, P., Nicholls, K., and Galton-Fenzi, B.: Deriving Melt Rates at a Complex Ice Shelf Base Using In Situ Radar: Application to Totten Ice Shelf, Geophys. Res. Lett., 48, e2021GL092692, https://doi.org/10.1029/2021GL092692, 2021.
Wang, L., Davis, J. L., and Howat, I. M.: Complex Patterns of Antarctic Ice Sheet Mass Change Resolved by Time-Dependent Rate Modeling of GRACE and GRACE Follow-On Observations, Geophys. Res. Lett., 48, e2020GL090961, https://doi.org/10.1029/2020GL090961, 2021.
Winsborrow, M. C. M., Clark, C. D., and Stokes, C. R.: What controls the location of ice streams?, Earth-Sci. Rev., 103, 45–59, https://doi.org/10.1016/j.earscirev.2010.07.003, 2010.
Yamazaki, K., Aoki, S., Katsumata, K., Hirano, D., and Nakayama, Y.: Multidecadal poleward shift of the southern boundary of the Antarctic Circumpolar Current off East Antarctica, Sci. Adv., 7, eabf8755, https://doi.org/10.1126/sciadv.abf8755, 2021.
Young, D. A., Wright, A. P., Roberts, J. L., Warner, R. C., Young, N. W., Greenbaum, J. S., Schroeder, D. M., Holt, J. W., Sugden, D. E., Blankenship, D. D., van Ommen, T. D., and Siegert, M. J.: A dynamic early East Antarctic Ice Sheet suggested by ice-covered fjord landscapes, Nature, 474, 72–75, https://doi.org/10.1038/nature10114, 2011.
Yu, H., Rignot, E., Seroussi, H., and Morlighem, M.: Retreat of Thwaites Glacier, West Antarctica, over the next 100 years using various ice flow models, ice shelf melt scenarios and basal friction laws, The Cryosphere, 12, 3861–3876, https://doi.org/10.5194/tc-12-3861-2018, 2018.
Zheng, F., Li, J., Clark, R. T., and Nnamchi, H. C.: Simulation and Projection of the Southern Hemisphere Annular Mode in CMIP5 Models, J. Climate, 26, 9860–9879, https://doi.org/10.1175/JCLI-D-13-00204.1, 2013.