the Creative Commons Attribution 4.0 License.
the Creative Commons Attribution 4.0 License.
 | 23 Aug 2023
Grain growth of natural and synthetic ice at 0 °C
Sheng Fan
David J. Prior
Brent Pooley
Hamish Bowman
Lucy Davidson
David Wallis
Sandra Piazolo
David L. Goldsby
Travis F. Hager
Grain growth can modify the microstructure of natural ice, including the grain size and crystallographic preferred orientation (CPO). To better understand grain-growth processes and kinetics, we compared microstructural data from synthetic and natural ice samples of similar starting grain sizes that were annealed at the solidus temperature (0 ∘C) for durations of a few hours to 33 d. The synthetic ice has a homogeneous initial microstructure characterized by polygonal grains, little intragranular distortion, few bubbles, and a near-random CPO. The natural ice samples were subsampled from ice cores acquired from the Priestley Glacier, Antarctica. This natural ice has a heterogeneous microstructure characterized by a considerable number of air bubbles, widespread intragranular distortion, and a CPO. During annealing, the average grain size of the natural ice barely changes, whereas the average grain size of the synthetic ice gradually increases. These observations demonstrate that grain growth in natural ice can be much slower than in synthetic ice and therefore that the grain-growth law derived from synthetic ice cannot be directly applied to estimate the grain-size evolution in natural ice with a different microstructure. The microstructure of natural ice is characterized by many bubbles that pin grain boundaries. Previous studies suggest that bubble pinning provides a resisting force that reduces the effective driving force of grain-boundary migration and is therefore linked to the inhibition of grain growth observed in natural ice. As annealing progresses, the number density (number per unit area) of bubbles on grain boundaries in the natural ice decreases, whilst the number density of bubbles in the grain interiors increases. This observation indicates that some grain boundaries sweep through bubbles, which should weaken the pinning effect and thus reduce the resisting force for grain-boundary migration. Some of the Priestley ice grains become abnormally large during annealing. We speculate that the contrast of dislocation density amongst neighbouring grains, which favours the selected growth of grains with low dislocation densities, and bubble pinning, which inhibits grain growth, are tightly associated with abnormal grain growth. The upper 10 m of the Priestley ice core has a weaker CPO and better-developed second maximum than deeper samples. The similarity of this difference to the changes observed in annealing experiments suggests that abnormal grain growth may have occurred in the upper 10 m of the Priestley Glacier during summer warming.
- Article
(11150 KB) - Full-text XML
-
Supplement
(565 KB) - BibTeX
- EndNote


Ice microstructures help us understand deformation processes and histories in natural ice (Montagnat et al., 2014; Weikusat et al., 2017b; Thomas et al., 2021; Gerbi et al., 2021). Grain size and crystallographic preferred orientation (CPO) are quantifiable microstructural elements that can be linked empirically to deformation conditions and kinematics (Azuma, 1994; Goldsby and Kohlstedt, 2001) and affect the ice creep behaviour: creep rate is dependent on these parameters, and efforts are underway to incorporate these effects into ice sheet models (Kuiper et al., 2020; Ranganathan et al., 2021). Grain growth, which has been inferred from an increasing grain size with the elapsed time and/or depth of burial in the shallow parts of polar ice cores, is an important process in natural ice (Duval, 1985; Alley et al., 1986; Thorsteinsson et al., 1997; Gow and Williamson, 1976; Duval and Lorius, 1980). Normal grain growth, where boundary energy drives the movement (migration) of grain boundaries to reduce the total boundary surface area, is important for grain growth within a single-phase system (Atkinson, 1988). Laboratory experiments show, for synthetic starting materials, normal grain growth will “continuously” increase the average grain size (Karato, 1989; Evans et al., 2001; Faul and Scott, 2006; Azuma et al., 2012). However, the microstructure of natural ice is significantly different from synthetic ice in two key respects. First, synthetic ice, which is usually made from ultra-pure water, contains few impurities (Cole, 1979), whereas natural ice is comparably impurity-rich, usually containing insoluble (e.g. dust particles) and soluble (e.g. dissolved salts) impurities, as well as air bubbles (Gow, 1968; Gow and Williamson, 1971; Svensson et al., 2005; Faria et al., 2010; Thomas et al., 2021; Baker et al., 2003; Weikusat et al., 2017b; Stoll et al., 2021; Faria et al., 2014). Second, synthetic ice usually has a uniform microstructure characterized by straight or slightly curved grain boundaries, polygonal grain shapes, and minimized intragranular distortions, and it lacks a CPO (Cole, 1979; Fan et al., 2020). In contrast, natural ice contains a more complex microstructure that can include irregular grain boundaries, considerable intragranular distortions, and a CPO (Weikusat et al., 2017a; Thomas et al., 2021).
Microstructural features have a strong impact on grain growth. For example, bubbles and particles will introduce a dragging force that can pin grain boundaries, reducing the effective driving force for boundary migration and the rate of grain growth (Azuma et al., 2012; Roessiger et al., 2014; Herwegh et al., 2011). Strain energy stored within crystal lattices will promote nucleation, which produces small grains at the cost of original grains and thus slows down grain growth (Wilson, 1982; Piazolo et al., 2006). Consequently, the rate of grain growth in natural ice, where secondary phases and anisotropic microstructures are the norms, should be different from the growth rate predicted from experiments conducted on synthetic ice. However, our understanding of grain growth in natural ice is limited because nearly all the experimental or modelling-based grain-growth data are from synthetic ice (e.g. Azuma et al., 2012; Roessiger et al., 2014).
During sampling, transportation, and storage of natural ice cores, temperature changes might modify ice microstructure. For example, sampling with a hot-water drill requires that the temperature at the outside of the cores is raised to 0 ∘C (Humphrey and Echelmeyer, 1990; Kamb, 2001; Jackson, 1999; Jackson and Kamb, 1997; Taylor, 1984). Moreover, the back-flowing of subglacial water into the borehole, which might happen during the drilling of deep ice cores (Oerter et al., 2009), might also increase the temperature of ice cores.
In this contribution, we present detailed microscopic analyses of synthetic pure water-ice and natural ice samples that were annealed at the solidus temperature (0 ∘C). Experiments at the melting point are likely to provide the most extreme growth rates of ice and are of particular significance to temperate ice that occurs in many high-latitude mountain glaciers (Cuffey and Paterson, 2010), at the base of many polar glaciers and ice sheets (Schmidt et al., 2023; Davis et al., 2023), and ice shelves (Schodlok et al., 2016; Pritchard et al., 2012), and it is predicted to develop in shear margins (Schoof, 2004). In this study, the annealing time, which ranges from a few hours to 33 d, is consistent with previous studies (Wilson et al., 2014; Azuma et al., 2012). The goal of this study is to assess the effects of initial microstructures on grain-growth processes and kinetics to better understand grain growth in natural ice.
2.1 Sample fabrication
We used two types of samples with a similar starting grain size of ∼ 900 µm for annealing experiments: (1) medium-grained synthetic ice and (2) natural ice collected from a fast-shearing margin of the Priestley Glacier, Antarctica.
Polycrystalline synthetic ice was fabricated using a “flood–freeze” method (Cole, 1979; Stern et al., 1997). Firstly, ice seeds made from frozen, ultra-pure, deionized water were sieved between mesh sizes of 1 and 2 mm. A “wet sieve” method (Fan et al., 2021a) that involves pouring liquid nitrogen over ice seeds while sieving was applied to reduce the number of finer grains that electrostatically clump on the surfaces of coarser grains. The sieved ice seeds were packed into greased cylindrical moulds with inner diameters of 25.4 mm or 40.0 mm. The packed moulds were evacuated to remove air from void space and thermally equilibrated within a water-ice bath at 0 ∘C for 30 min before they were flooded with 0 ∘C, ultra-pure, deionized water. The flooded moulds were placed vertically within a chest freezer at −30 ∘C with the bases of moulds directly contacting a metal plate and with the walls of moulds insulated by a polystyrene block. This process ensures that the frozen front migrates slowly upwards from the bottom of the moulds so that the gas bubbles are removed. After ∼ 24 h, ice cores were gently pushed out from the moulds using an arbor press. Each synthetic ice sample was cut perpendicular to the cylindrical axis into several slabs using a bandsaw (Fig. 1a). These slabs were used for annealing experiments. The thickness of ice slabs with a diameter of 25.4 mm was 15 mm and the thickness of ice slabs with a diameter of 40 mm was 20 mm (Fig. 1a).
Natural ice samples were subsampled with a bandsaw from an Antarctic ice core (core no. 30) collected at a depth of ∼ 26 m from a fast-shearing margin of the Priestley Glacier (Thomas et al., 2021). We first cut the ice core (diameter of ∼ 105 mm) in half along its cylindrical axis. Ice discs, with a thickness of ∼ 20 mm, were produced by sectioning perpendicular to the long axis of one of the half-cylindrical ice cores (Fig. 1a). From each disc, we produced two cuboid ice slabs with dimensions of ∼ 35 (length) × 30 (width) × 20 (height) mm (Fig. 1a). The top and bottom surfaces of the cuboid ice slabs correspond to the macroscopic profile plane (i.e. the plane parallel to the shear direction and perpendicular to the shear plane) of the ice flow (Fig. 1a).
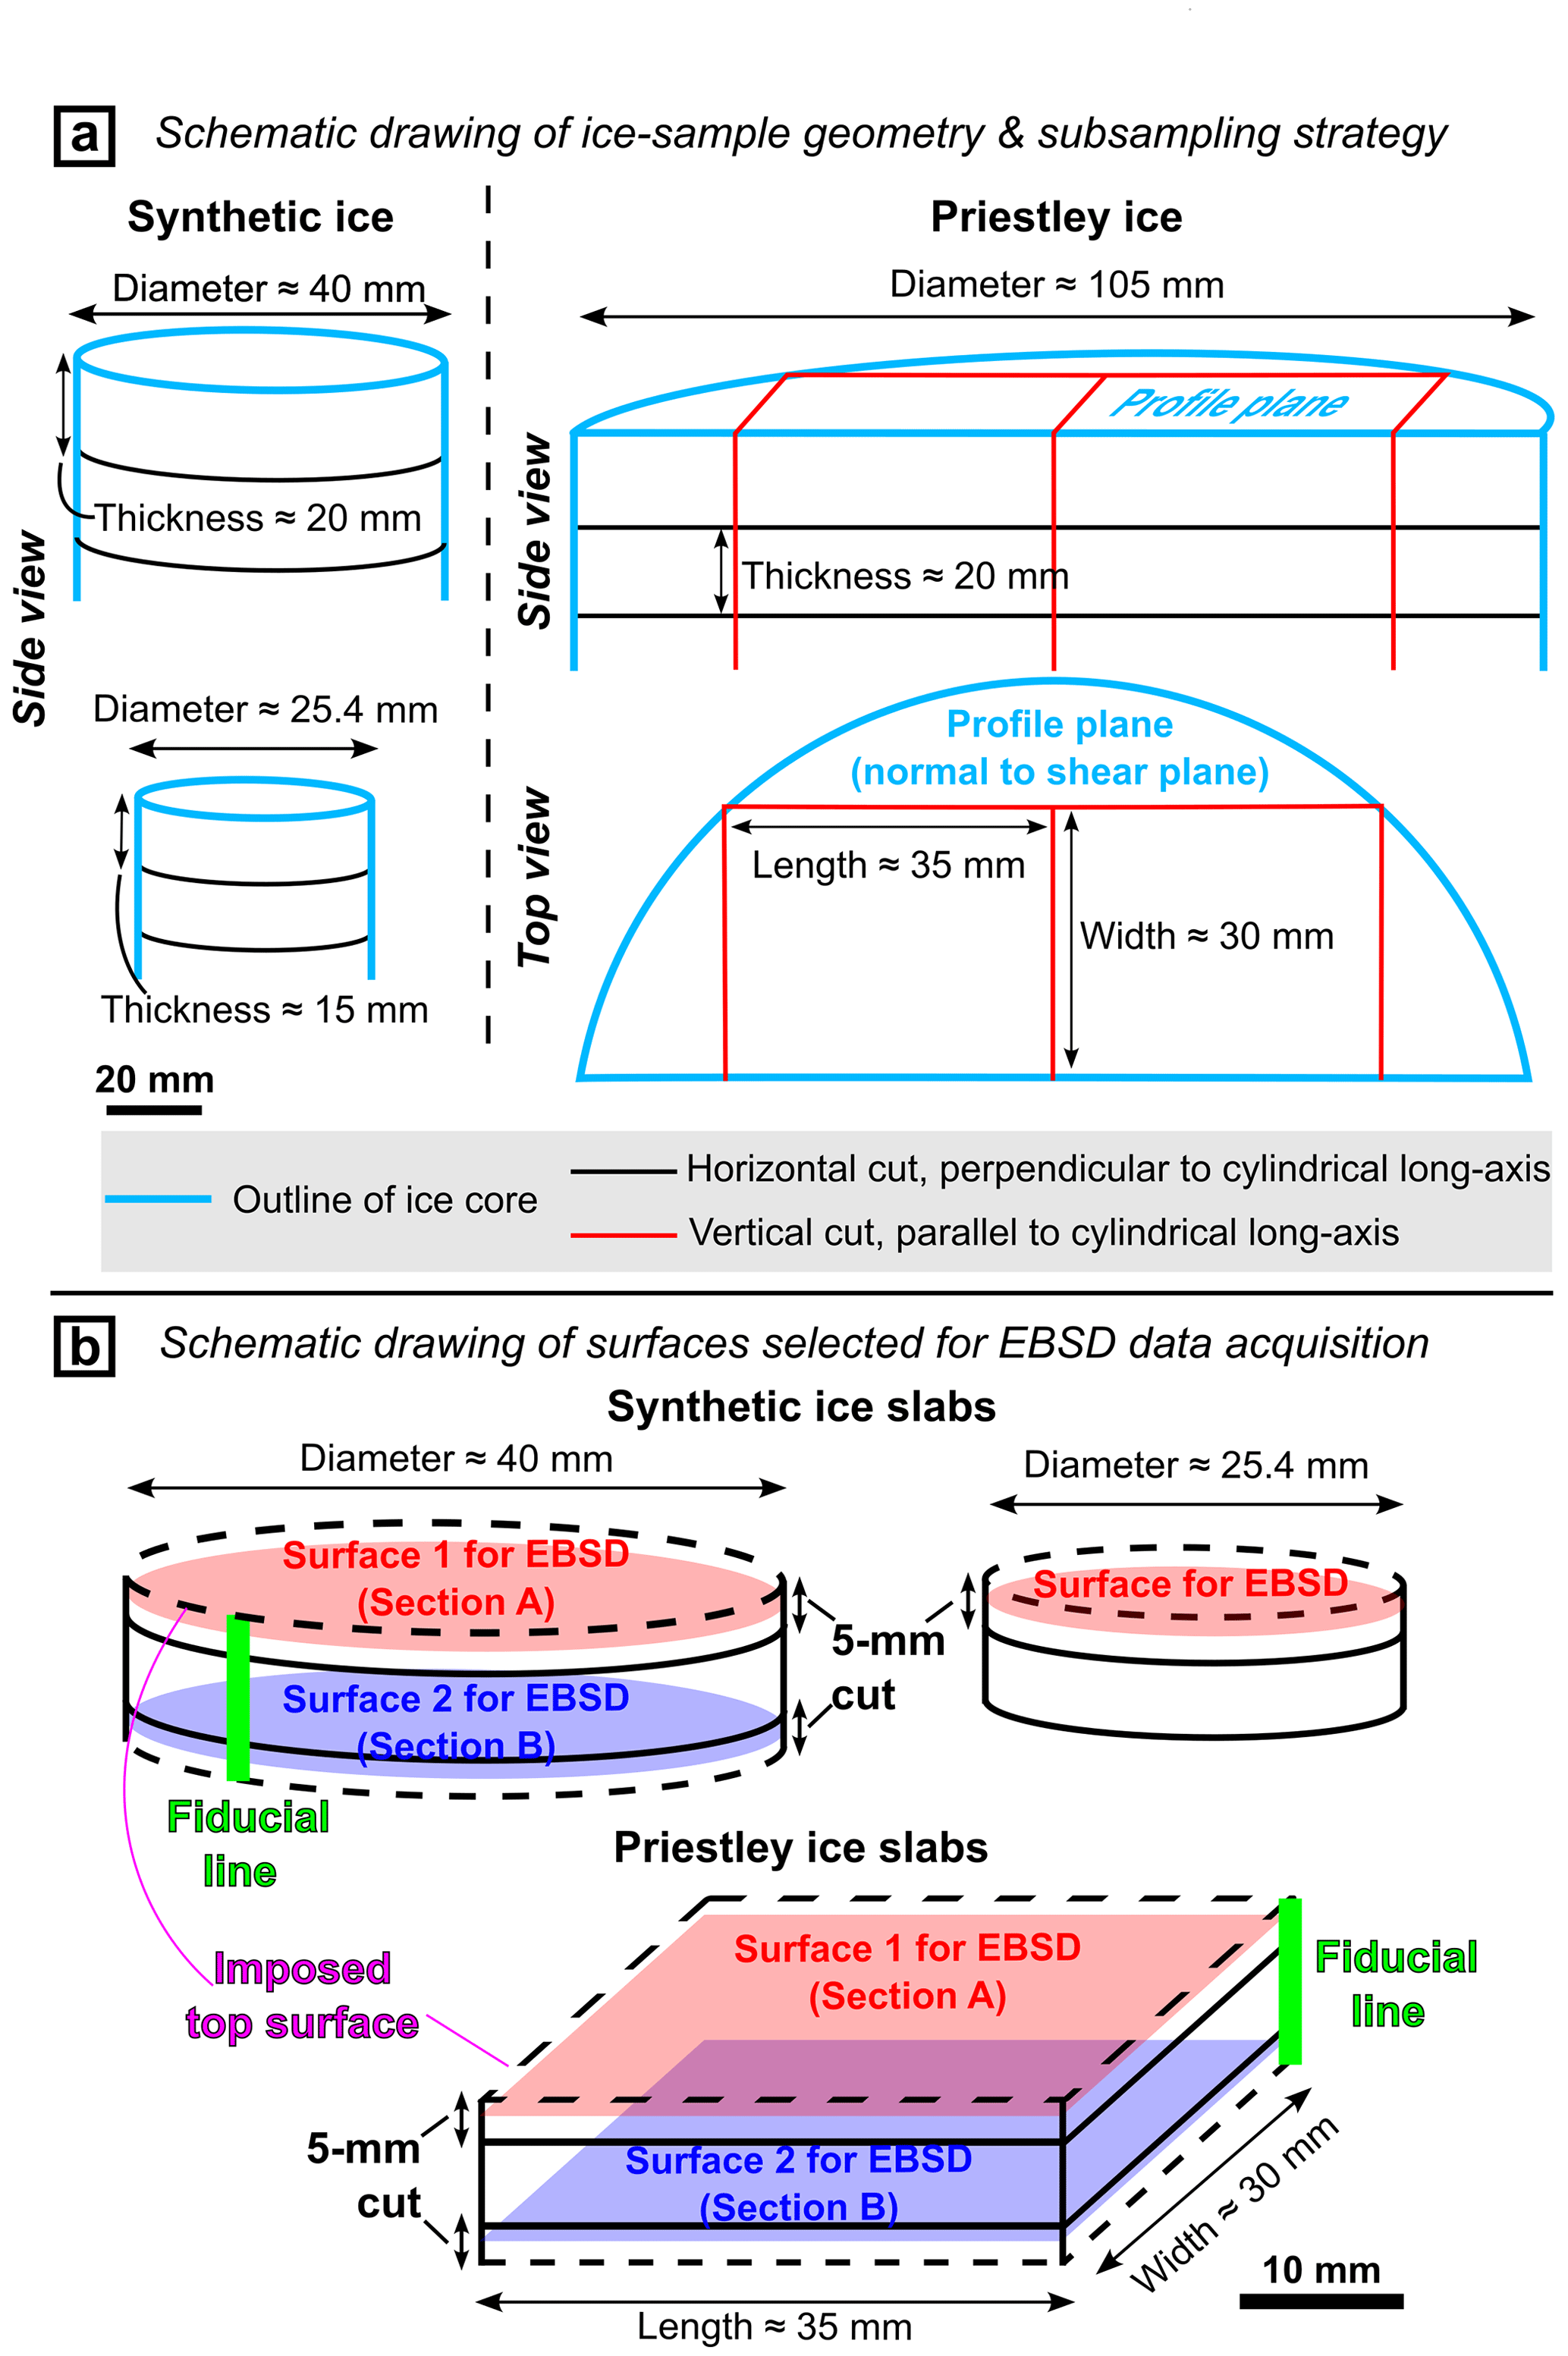
Figure 1(a) Schematic drawing of the subsampling strategy for ice slabs from synthetic and natural ice cores. (b) Schematic drawing of surfaces selected and prepared from ice slabs with different dimensions for EBSD data collection.
2.2 Annealing experiments
Annealing experiments at ∼ 0 ∘C were carried out at the Ice Lab, University of Otago. Two types of rigs (Rig01, Rig02; Fig. 2a and b) were used for the experiments with minimized temperature fluctuation.
Figure 2a illustrates the design of Rig01, which was used for long-term annealing experiments (up to 33 d). Rig01 has two aluminium sample bins submerged in the water-ice mixture in an insulated box (chilly bin). The chilly bin sits in a fridge maintained at −2 to 4 ∘C. The sample bins are filled with silicone oil and fixed beneath two PVC bars using cable ties. The PVC bars are tightly mounted on the walls of the chilly bin by friction to overcome the water buoyancy that pushes the bins upwards.
Before experiments, ice slabs were vacuum-sealed in plastic bags using a food vacuum sealer at ∼ −30 ∘C in a chest freezer. This process was conducted to physically isolate ice samples from silicone oil as the contamination of silicone oil on the sample surface would hamper the collection of electron backscatter diffraction (EBSD) data. When starting the experiments, bags of ice slabs were quickly transferred to sample bins and submerged within silicone oil at 0 ∘C, within 30 s. For each sample bin, a bag of gravel (weights of ∼ 300 g; kept at ∼ −30 ∘C) was then gently placed on the top of ice slabs to prevent them from floating. After that, the openings of the sample bins and the PVC chilly bin were insulated with layers of wool pads sealed in plastic bags. The temperatures of the silicone oil bath within each of the sample bins and the temperature of the water-ice bath were recorded once every 2 s throughout the experiments (Fig. 2c). During experiments, we stabilized the temperature of silicone oil at ∼ 0 ∘C by refilling the water-ice bath every 7 d. We did this by simultaneously removing extra water via a drain valve at the base of the chilly bin and refilling ice cubes (at 0 ∘C) through the opening of the chilly bin; this process took 5 min. The upper level of the water-ice bath (within the chilly bin) was kept similar to or higher than the upper level of silicone oil (within the sample bins) throughout experiments. These processes ensured an insignificant temperature change (between −1 and 0 ∘C) within the silicone oil even during a maximum experimental time of 33 d (Fig. 2c).
Figure 2b illustrates the design of Rig02, which was used for short-term annealing experiments (up to 5 d). Rig02 is composed of a thick-walled polystyrene box insulated by layers of sealed wool pads. The box sits in a room at ∼ 20 ∘C. Before each experiment, the polystyrene box was filled with a water-ice mixture. Ice slabs were sealed within cylindrical aluminium vessels with an inner diameter of ∼ 26 mm, and the assemblies were kept in a freezer at ∼ −30 ∘C. One of the ice-vessel assemblies had a thermometer directly frozen into the ice slab and the thermometer was used to measure a reference ice temperature during experiments. When starting the experiments, ice-vessel assemblies, including the reference sample, were transferred into the polystyrene box and submerged in the water-ice bath within 30 s. Aluminium vessels were in direct contact with a metal plate placed at the bottom of the polystyrene box. After that, we insulated the opening of the polystyrene box with a polystyrene cap and wool pads. Temperatures of the reference ice sample and water-ice bath were recorded once every 2 s throughout the experiments (Fig. 2d). During experiments, we stabilized the temperature of the ice sample at 0±0.25 ∘C by refilling the water-ice bath once every 8 h (Fig. 2d).
After annealing, bags or vessels containing ice slabs were removed from rigs (marked with arrows in Fig. 2c–d; details in Table 1). Ice slabs were immediately removed from bags or vessels within a chest freezer at ∼ −30 ∘C. These samples were then progressively cooled to ∼ −30, −100, and −196 ∘C within 15 min and thereafter stored in a liquid nitrogen dewar.
Table 1Details of ice annealing experiments.
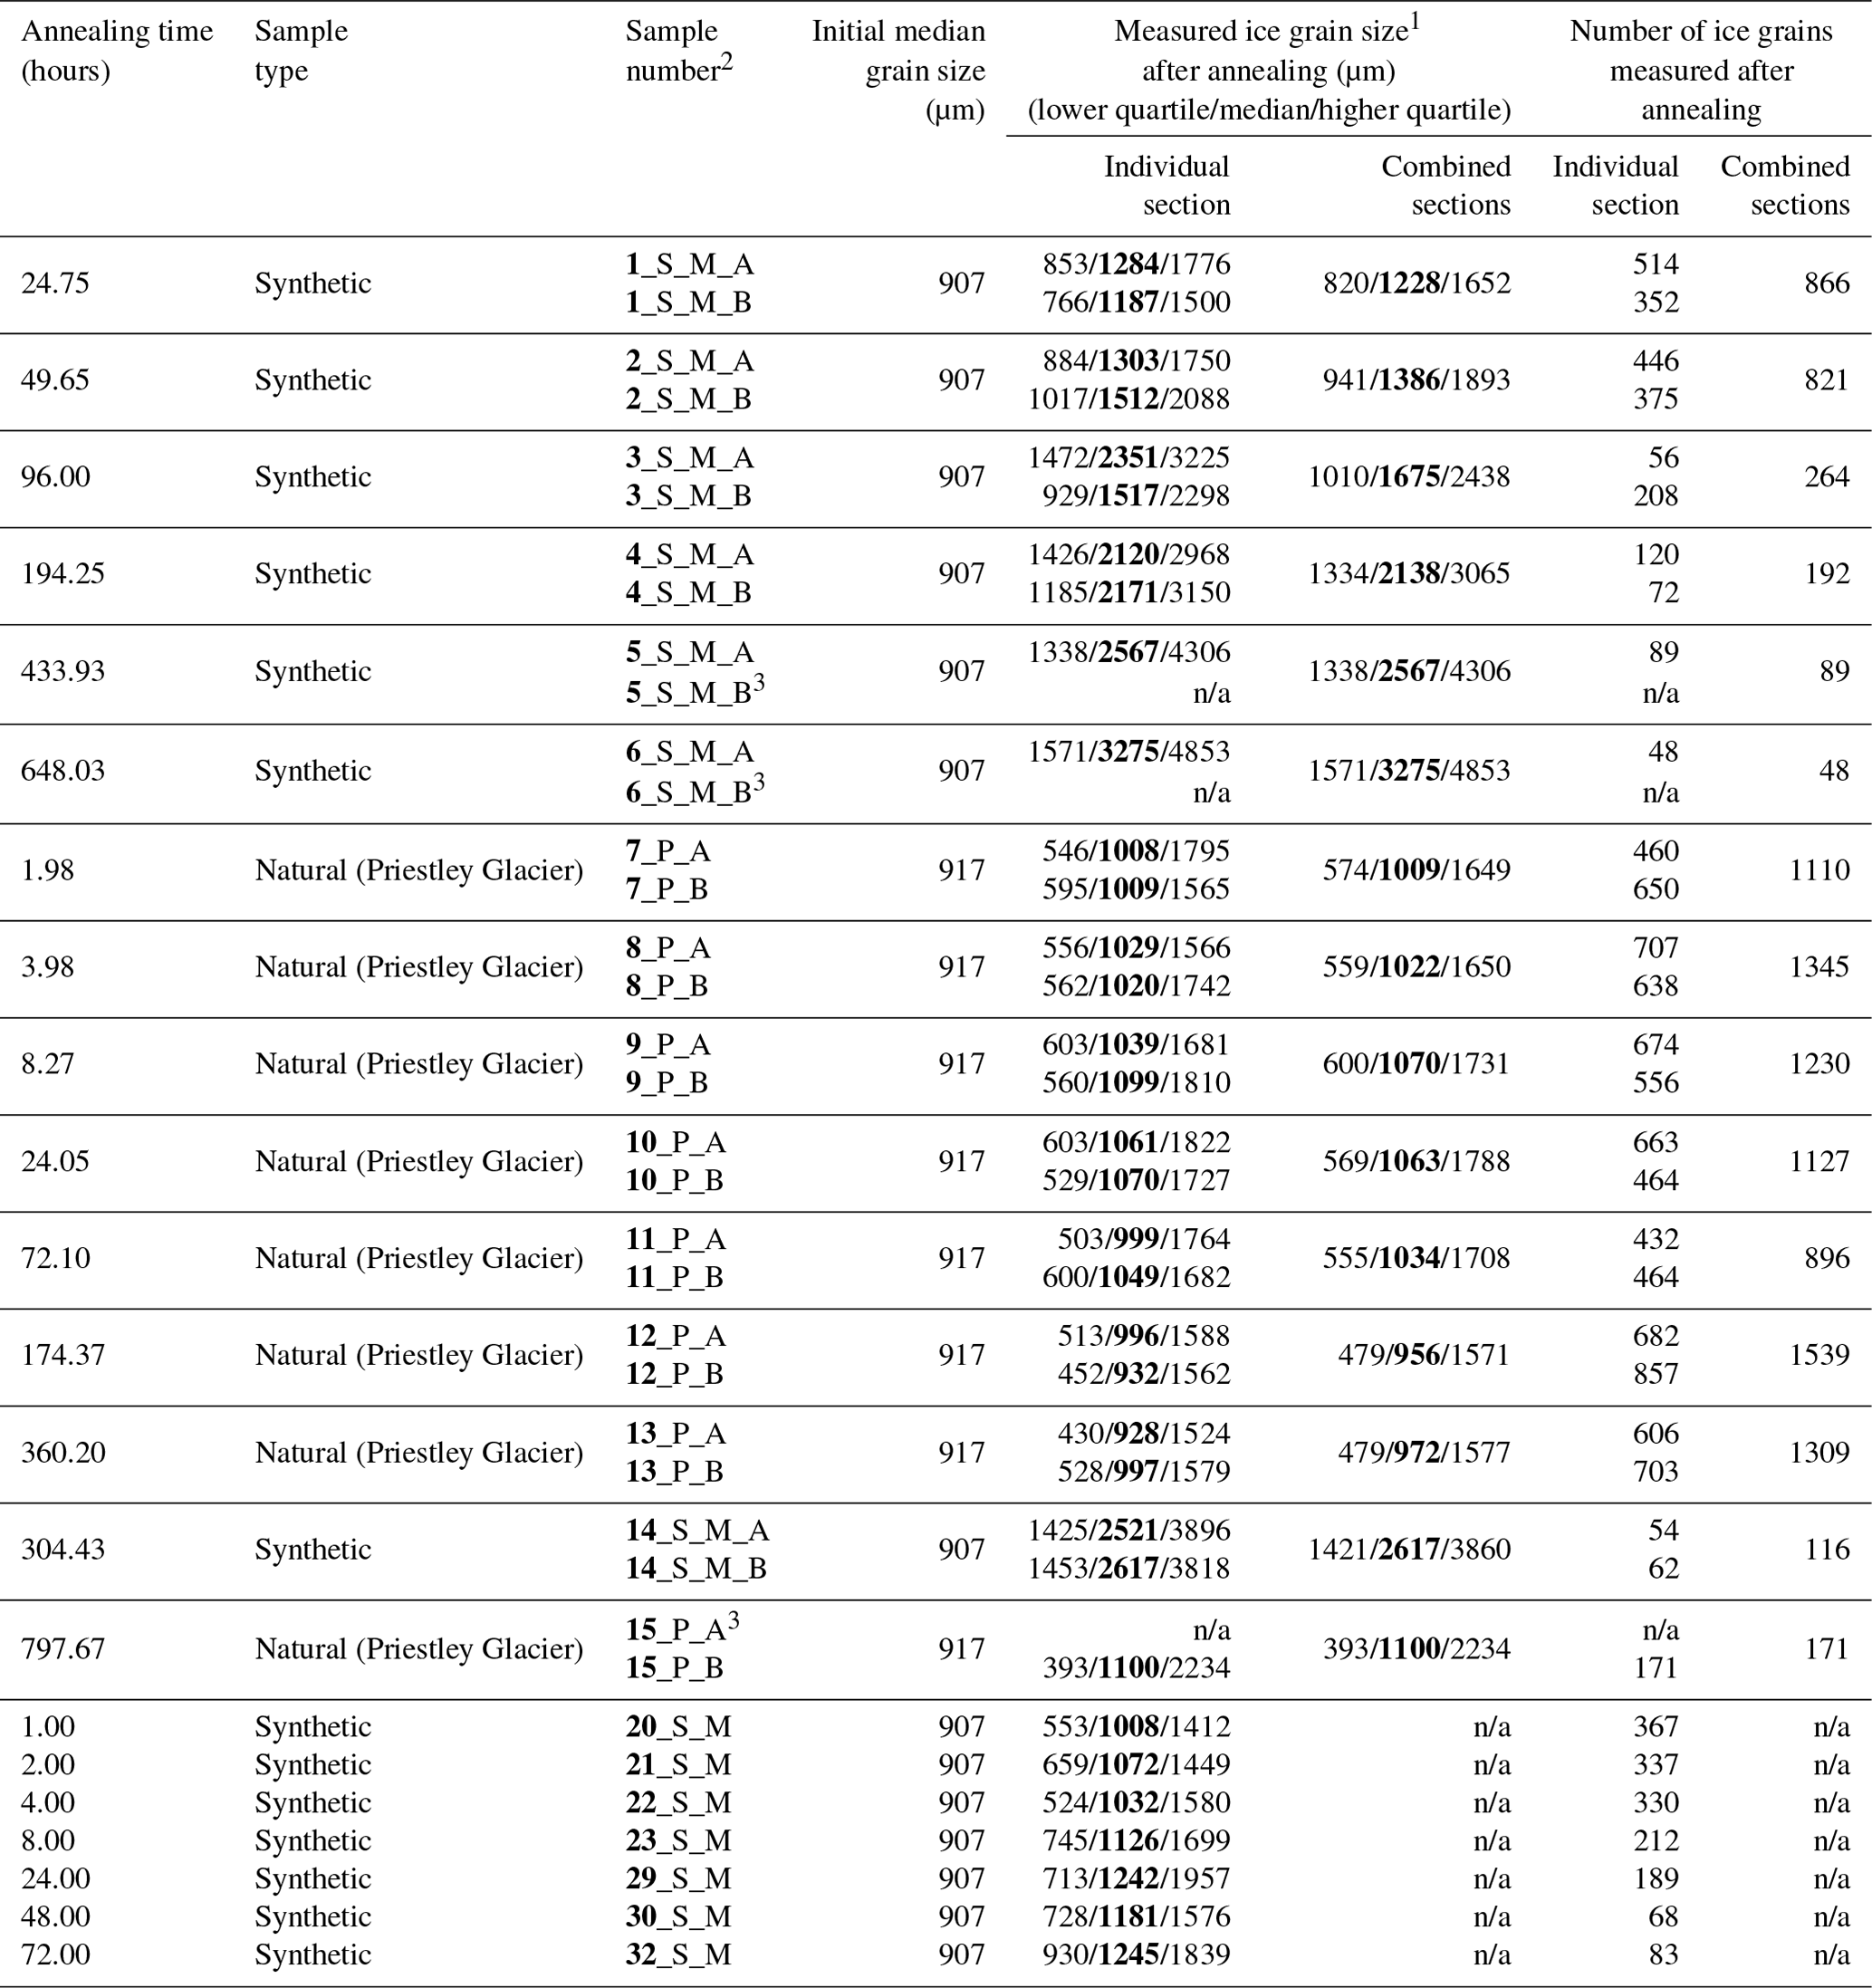
1 Grain size refers to area-equivalent diameter. The numbers in bold format indicate median grain size. 2The first number in bold format refers to the number of the ice slab cut from ice cores. The “S” refers to synthetic ice; “M” refers to the medium grain size of synthetic ice; “P” refers to Priestley ice; and “A” and “B” refer to thin slices subsampled from each ice slab. 3 Without EBSD data due to a broken thin slice during sample cutting. n/a – not applicable.
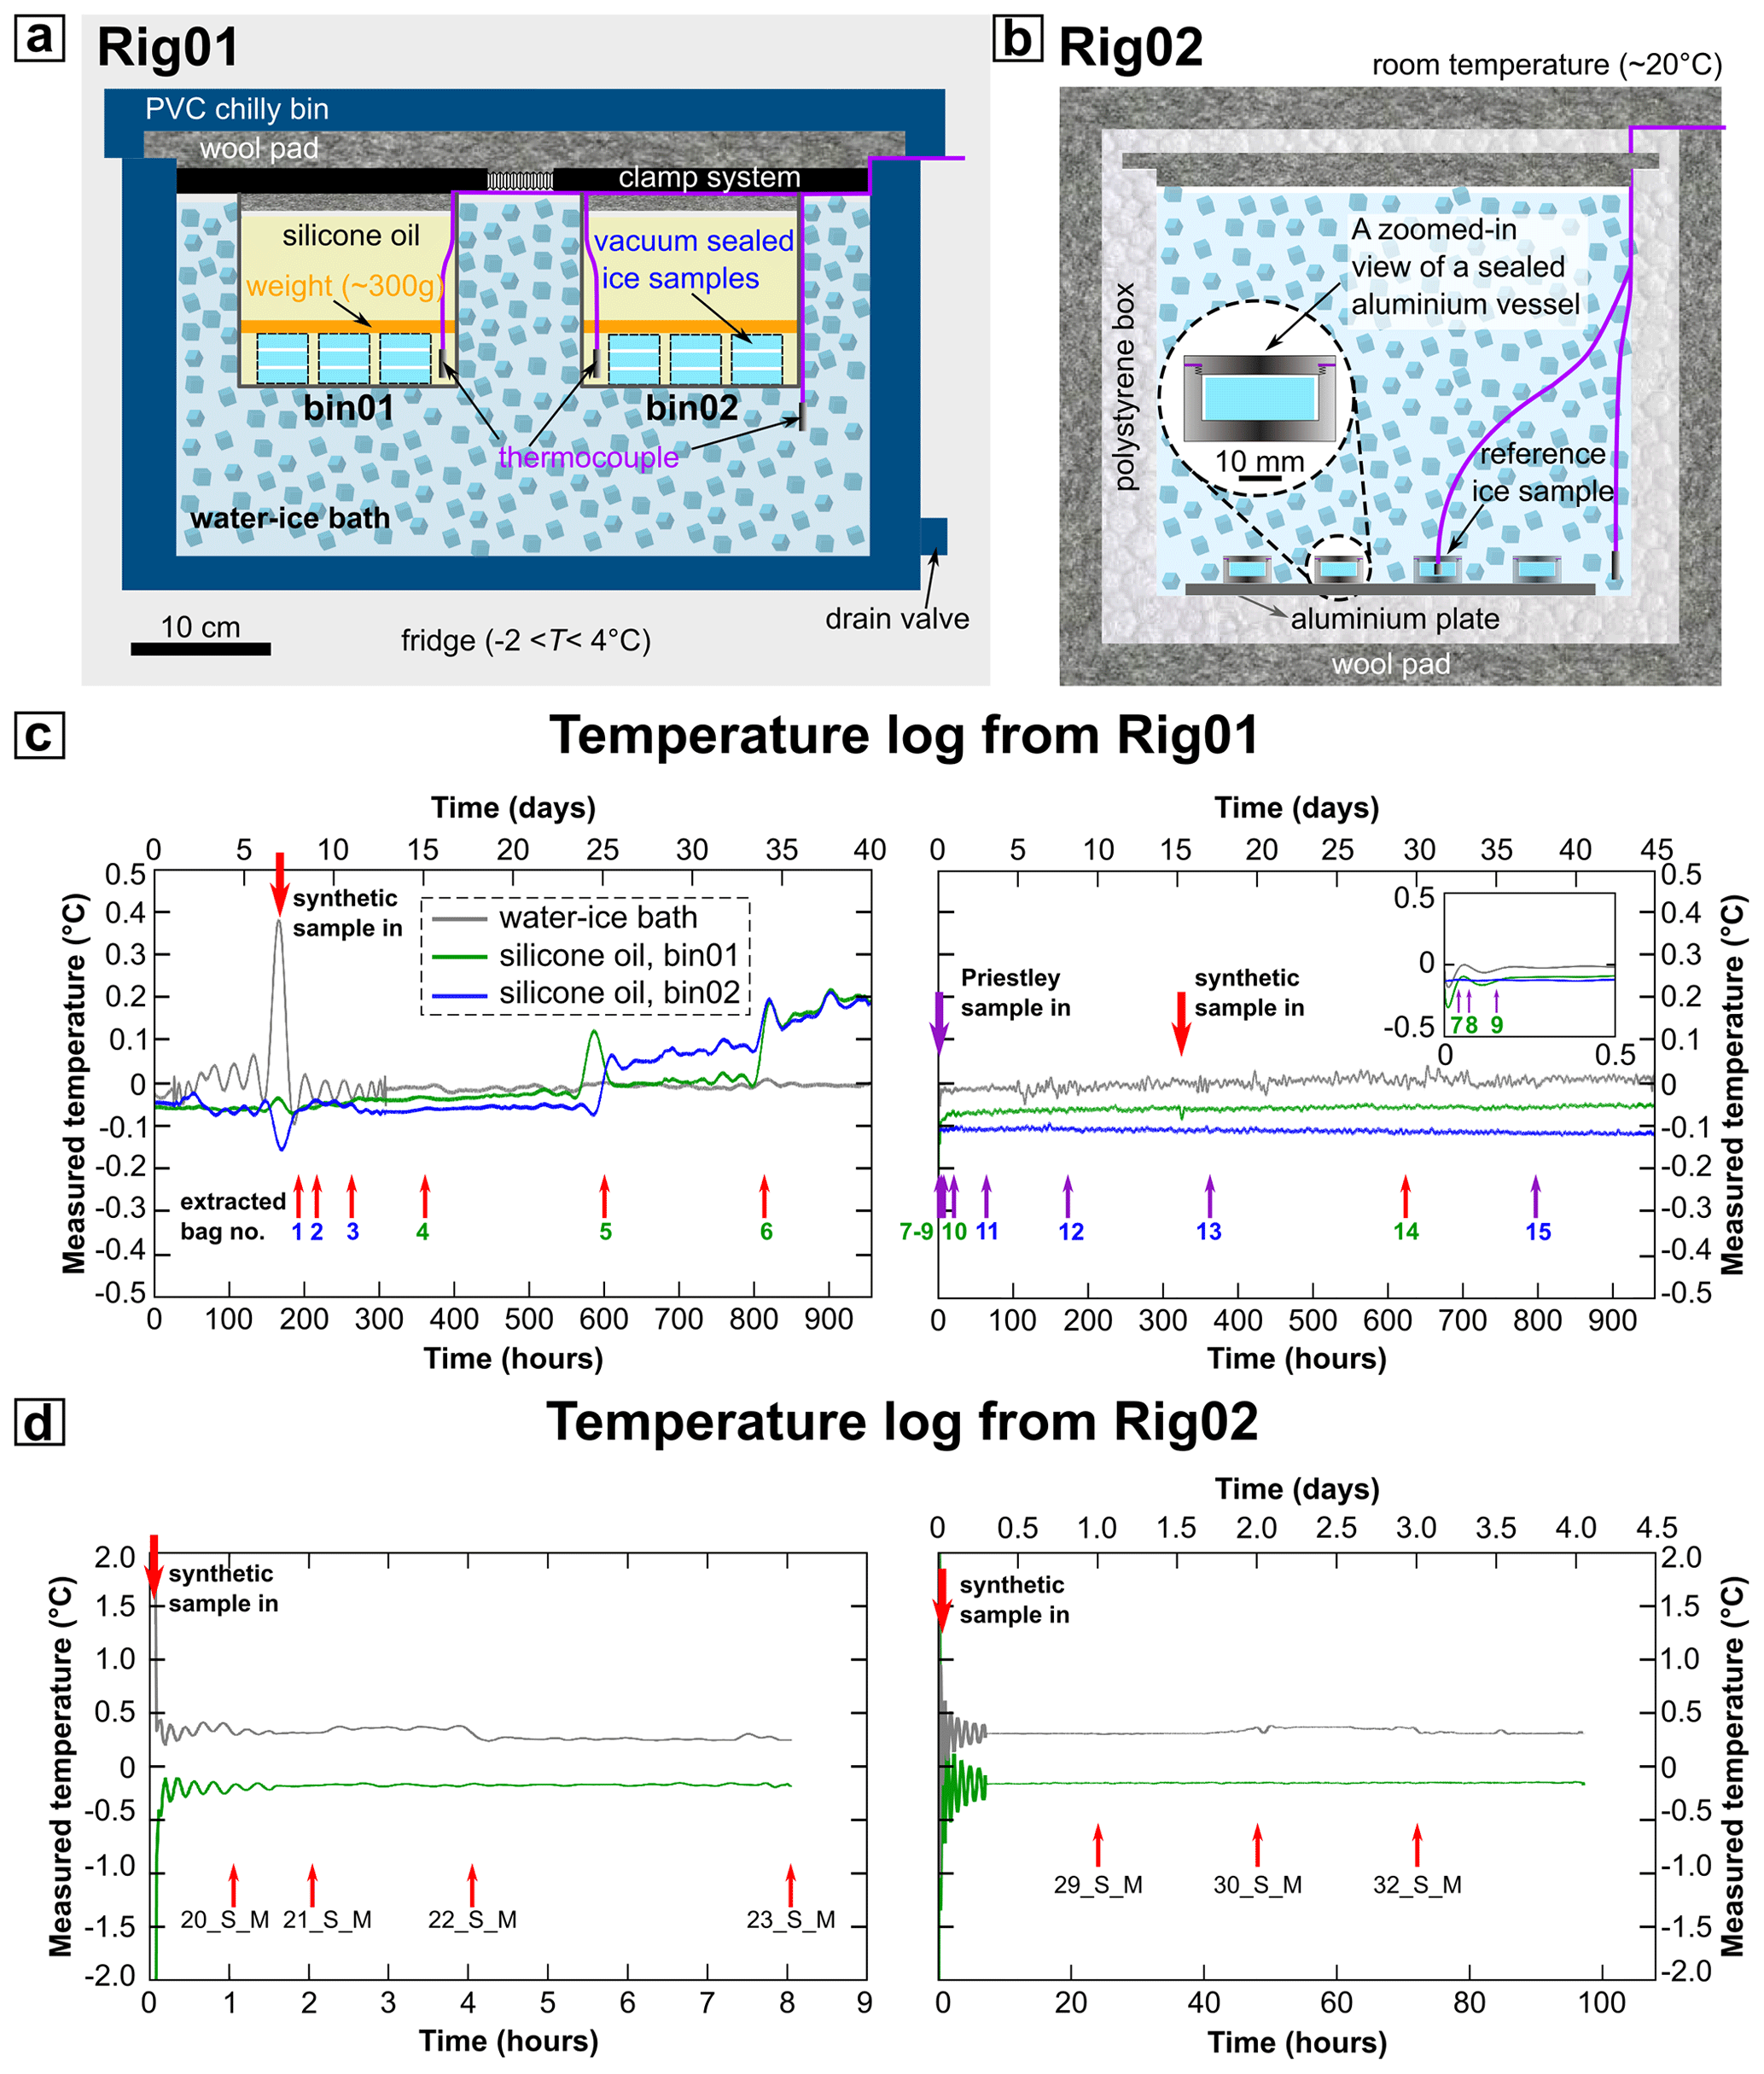
Figure 2(a, b) Schematic drawings of Rig01 and Rig02 used for ice grain-growth experiments. (c) Temperature log for grain-growth experiments conducted within Rig01. The red and purple arrows correspond to the termination of annealing experiments for synthetic ice samples and natural ice samples, respectively. The number beneath each arrow marks the first number in the sample number, which is inherited in the sample number (Table 1). The colours of bag numbers correspond to different sample bins: blue represents bin01; green represents bin02. (d) Temperature logs for synthetic ice grain-growth experiments conducted within Rig01. The arrow marks the end of the annealing experiments. Sample numbers are marked beneath arrows.
2.3 Electron backscatter diffraction (EBSD) data collection
Initial and annealed ice slabs were sectioned into slices of ∼ 5 mm using a band saw in a cold room at ∼ −20 ∘C for microstructural analyses. One thin slice was sectioned for each synthetic ice slab with a thickness of ∼ 15 mm and a diameter of 25.4 mm. For each ice slab with a thickness of ∼ 20 mm (i.e. synthetic ice with a diameter of 40 mm and natural ice) two thin slices (named “A” and “B”; Table 1) were produced by sectioning at ∼ 5 mm from the top surface and at ∼ 5 mm from the bottom surface of the ice slab (Fig. 1b). We employed this sampling strategy to (1) maximize the number of 2D sections through grains that can be captured for statistical analyses and (2) minimize repeat counting of the same 3D grain in different 2D sections in the following microstructural analyses. We used fiducial markers so that subsampled child thin slices could be easily reoriented to the original reference frame of their parent slabs. This orientation tracking is important so that microstructural data collected from slices subsampled from the same ice slab could be combined for grain shape and CPO statistics. The fiducial marker system involves
-
a fiducial line marked on the wall of ice slabs before sectioning (Fig. 1b)
-
fiducial marks on one of the surfaces of each child ice slice corresponding to the imposed top surface of the parent ice slab (Fig. 1b).
We prepared the surface of ice slices and collected cryo-EBSD data from ice surfaces following the procedures described by Prior et al. (2015). We polished the sample surface by hand lapping on grit papers with grit sizes of 80, 240, 600, 1200, and 2400 at −40 ∘C. The EBSD data were collected using a Zeiss Sigma VP-FESEM combined with a Symmetry EBSD camera from Oxford Instruments. EBSD data were acquired at a stage temperature of 95 ∘C, with 2–5 Pa nitrogen gas pressure, 30 kV accelerating voltage, a beam current of ∼ 60 nA, and a step size of 30 µm. For Priestley ice samples, secondary electron images were collected simultaneously with EBSD data. We utilized the fiducial lines and marks to reorient ice slices subsampled from the same ice slab so that their sample reference frames remained consistent during EBSD data collection.
During sample transportation and preparation for cryo-EBSD, microstructural modifications, such as grain growth, and changes in intragranular structure are likely negligible over the short timescales (within 30 min at ∘C) involved (Fan et al., 2022, and references therein).
2.4 EBSD data processing
2.4.1 Phase segregation
For synthetic and Priestley (natural) ice samples, the EBSD map has each pixel attributed as “ice 1 h” or “not indexed” during data collection. However, Priestley ice is bubble-rich (Thomas et al., 2021). Consequently, ice and air bubbles should be segregated for a more complete microstructural analysis.
Ice and air bubbles were segregated via thresholding on secondary electron (SE) images using MATLAB® (Fig. 3a, b). SE images show surface topography (e.g. Fig. 3a). The polished surface of the ice is medium to dark grey. Bubbles are light grey to white (e.g. Fig. 3a). The contrast between the flat surface and bubbles was used to segregate ice and air bubbles.
Figure 3b and c illustrate the integration of the phase map from the SE image and EBSD pixel map for each Priestley ice sample. For each EBSD map, “not indexed” pixels that match “bubble” pixels (from the phase map) are attributed with a phase of “bubble”. This process ensures that scratches (example highlighted by dashed green ellipses in Fig. 3a–b), which were identified (wrongly) as bubbles due to similar greyscales during SE image thresholding, would not be mistakenly attributed as bubbles in EBSD maps.
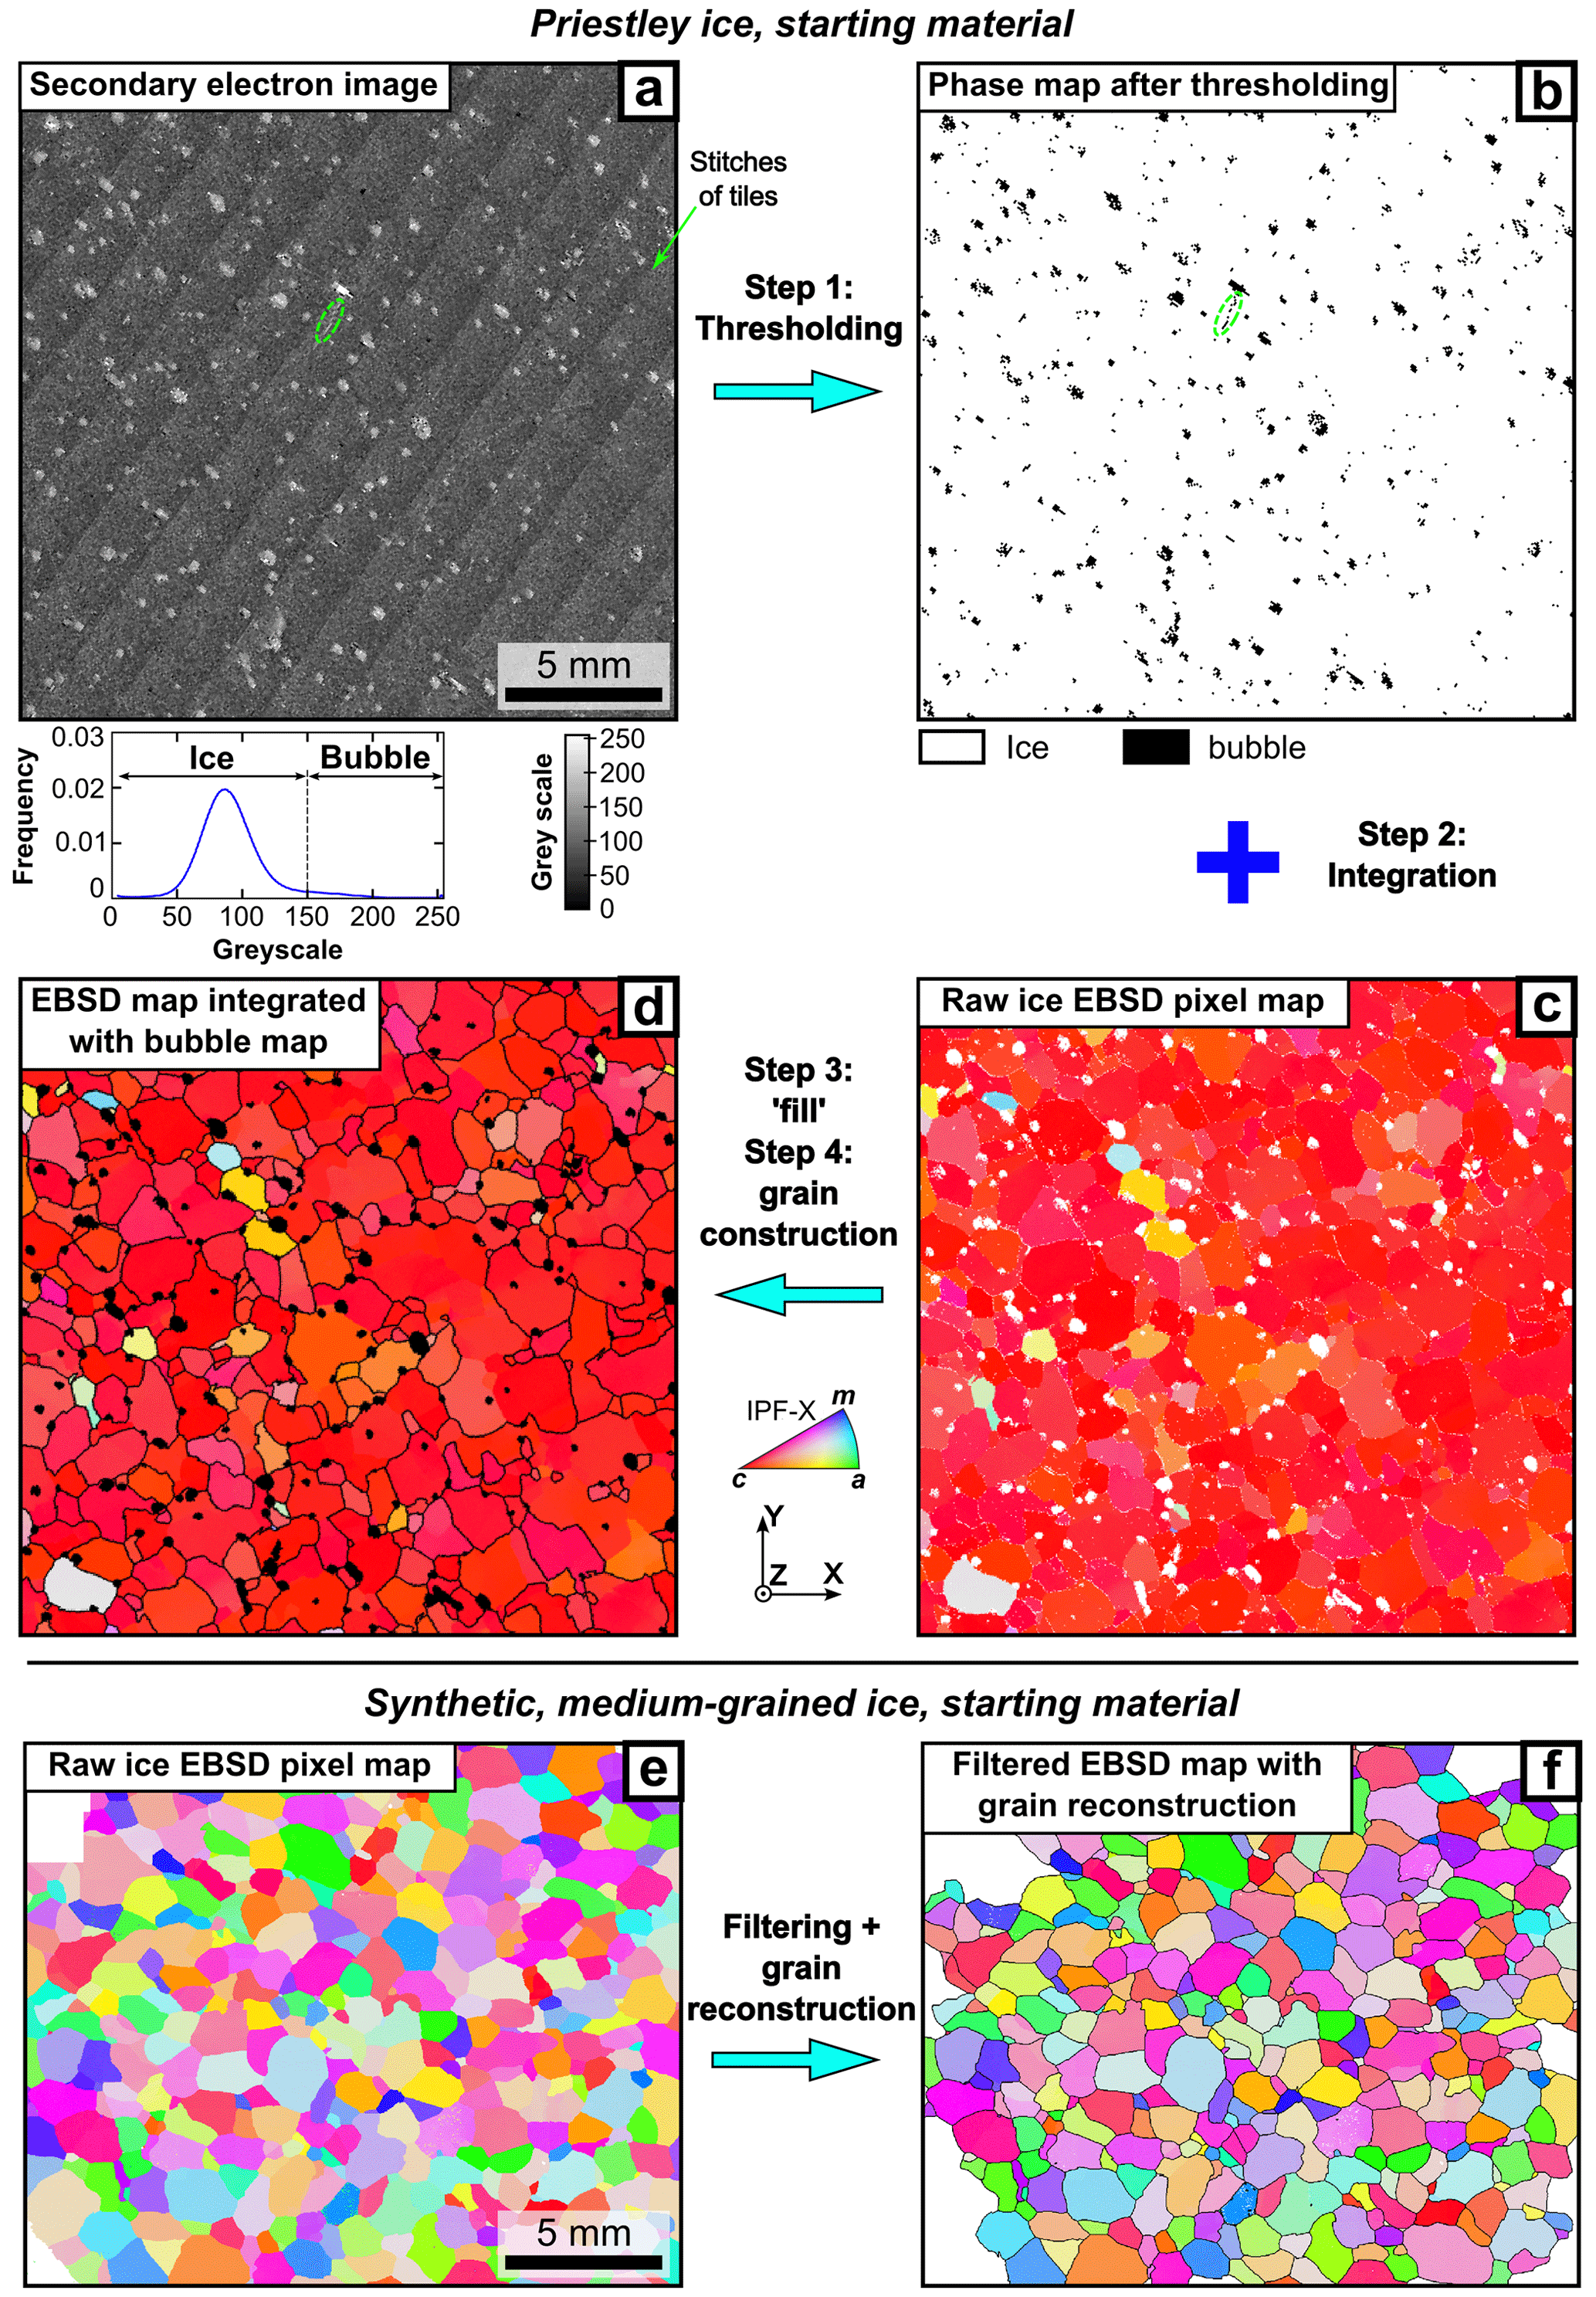
Figure 3Workflow for processing the microstructural data of ice samples. Panels (a)–(d) represent the starting material of Priestley ice. (a) Secondary electron image with the corresponding greyscale distribution. (b) Phase map after thresholding the SE image. The dashed green ellipse in (a) and (b) highlights a scratch that may be mistakenly identified as “bubbles” during thresholding. The green arrow in (a) indicates examples of stitches of tiles that make up the SE image. (c) Raw orientation map coloured by the inverse pole figure for the x direction (IPF-X), using the colour to indicate the crystallographic axes that are parallel to the x axis. White pixels are not indexed. (d) Grain map after grain reconstruction with the input of integrated EBSD pixel data from (b) and (c). The bubbles are black. Pixels indexed as “ice 1 h” are coloured by IPF-X. Panels (e)–(f) represent the starting material of synthetic, medium-grained ice. (e) Raw orientation map coloured by IPF-X. (f) Grain map after grain reconstruction with pixels of “ice 1 h” coloured by IPF-X. Ice grain boundaries are thin black lines.
2.4.2 Grain reconstruction
We used the Voronoi decomposition algorithm in the MTEX toolbox (Bachmann et al., 2011) for grain reconstruction from raw EBSD data for synthetic ice and the integrated EBSD data (Sect. 2.4.1) for natural ice. Ice grains and bubbles were reconstructed from pixels identified as “ice 1 h” and “air bubbles” separately, with a boundary misorientation threshold of 10∘. Firstly, we applied data filtering. Ice grains or bubbles containing fewer than four pixels were removed as they may result from misindexing. We also removed poorly constrained ice grains and bubbles with < 50 % indexed pixel coverage, as well as ice grains and bubbles at the edge of EBSD maps. For synthetic ice, the filtered data were used directly for microstructural statistics (Fig. 3e and f). For natural ice, we applied interpolation on filtered EBSD data using the “fill” function in MTEX to optimize the geometry of ice grains and air bubbles (e.g. Fig. 3d). The “fill” function populates less than 3 % of the map area with interpolated pixels. After that, we reconstructed ice grains and bubbles using the interpolated data (e.g. Fig. 3d).
2.4.3 Microstructural parameters
We quantified the microstructure of ice with statistics of grain size and CPO. For each ice grain, grain size is defined as the diameter of a circle with its area equivalent to the grain area (i.e. area-equivalent diameter). EBSD maps were used to generate ice CPO data with one point per pixel or one point per grain. To show CPO patterns more clearly, we contoured CPO data with a half-width of 7.5∘ based on multiples of a uniform distribution (MUD) of points. The CPO intensity was quantified by the M index (Skemer et al., 2005). The calculation of the M index is based on the distribution of misorientation angles calculated from random pairs of pixels indexed as ice from a given EBSD map (Skemer et al., 2005).
We quantified the microstructure of bubbles within Priestley ice using statistics of bubbles size, aspect ratio, and shape-preferred orientation (SPO). Bubble sizes were calculated from area-equivalent diameters of bubbles. We measured the aspect ratio, which is the ratio of the lengths of the long axis and short axis of an ellipse fitted to each bubble. Bubble SPO comprises the angles between a given vector (+x direction in this study; Fig. 3) and the bubble long axes estimated from the fitted ellipse. We use bubbles with aspect ratios greater than 1.5 for SPO analyses.
3.1 Synthetic ice
The starting material of synthetic ice exhibits a homogeneous microstructure with slightly irregular grain boundaries and very few (almost none) intragranular boundaries (Figs. 3f, 4a and b). The distribution of grain sizes is skewed, with a peak at ∼ 1000 µm and a tail extending down to ∼ 300 µm (Fig. 4c). The median and maximum grain sizes are 907 µm and 2409 µm, respectively (Table 1, Fig. 4c).
After annealing, the distributions of grain sizes remain skewed on the logarithmic scale, grain boundaries remain slightly irregular, and the number of intragranular boundaries remains small and similar to the starting material (Fig. 4a–c). With increasing annealing time, the number of grains within a given area decreases (Fig. 4a and b), consistent with increasing median grain size (Fig. 4c). The maximum grain size also increases with increasing annealing time, and it is generally 3 to 5 times the median grain size (Fig. 4c).
The starting material and samples annealed up to 194 h exhibit near-random c-axis orientations (Fig. 4d). Samples annealed to > 200 h contain a small number of grains (< 100; Table 1) and have CPOs characterized by multiple randomly distributed clusters (e.g. 5_S_M, 6_S_M; Fig. 4d) that are possibly a result of a small number of data points (Monz et al., 2021).
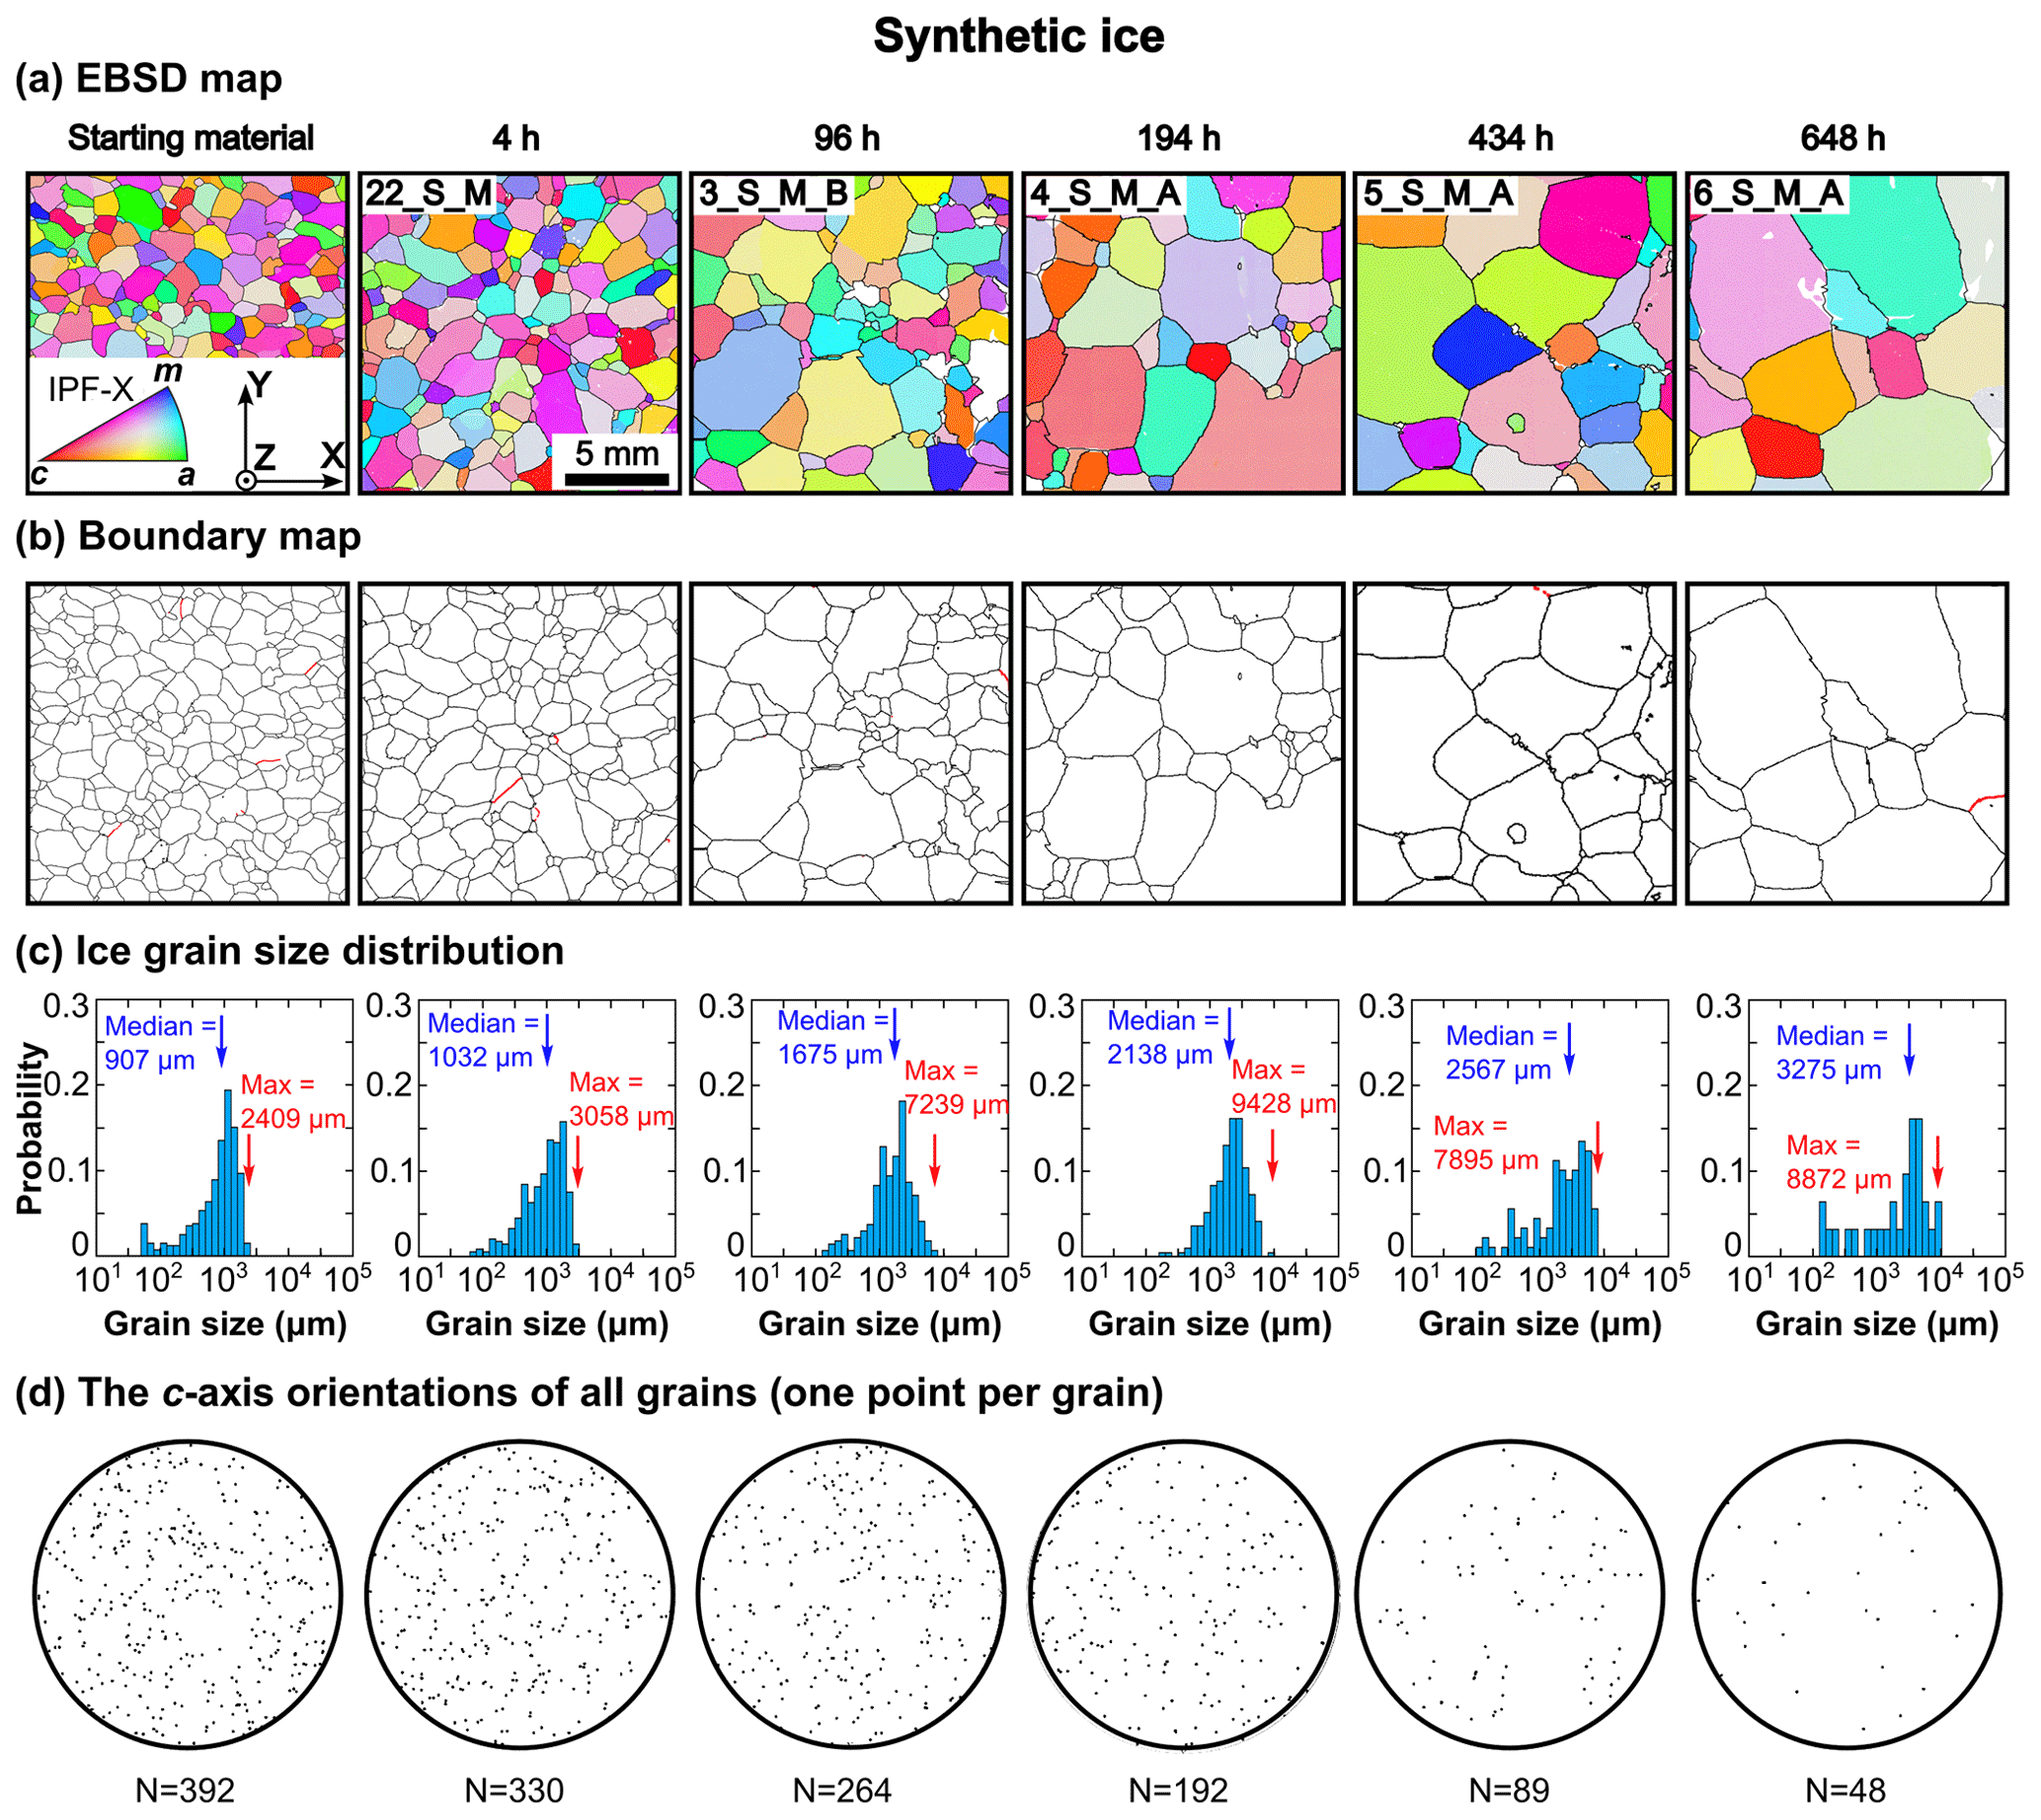
Figure 4Microstructural and CPO analyses of synthetic ice samples. Columns from left to right represent samples with increasing annealing time. (a) Subareas of the orientation maps coloured by IPF-X. (b) Boundary maps. Black lines indicate ice grain boundaries. Red lines indicate intragranular boundaries with misorientation angles in the range of 4–10∘. (c) Distribution of grain size presented on a logarithmic grain-size scale. The blue arrow and red arrow indicate the median and maximum ice grain sizes, respectively. (d) Orientations of ice c axes, which are displayed as point pole figures. The number of grains is given for each sample.
3.2 Natural, Priestley ice
3.2.1 Ice
The starting material of Priestley ice is characterized by small grains with less irregular grain boundaries interlocking with large grains with more irregular grain boundaries (Figs. 3d and 5a). Many ice grains are internally distorted and have intragranular boundaries (Figs. 3d, 5a and b). Grain sizes on the logarithmic scale are close to a normal distribution, with a peak at ∼ 1000 µm (Fig. 5c). The median and maximum grain sizes are 917 and 6088 µm, respectively (Table 1, Fig. 5c).
Ice microstructure does not change during annealing except for samples with ∼ 72 h (11_P_A) and ∼ 800 h (15_P_A) of annealing time, in which there are individual grains that are much larger than their neighbouring grains (Fig. 5a). For these two samples (i.e. 11_P, 15_P), the maximum grain size is ∼ 12–18 times the value of the median grain size (Fig. 5c).
The c-axis orientations are generally characterized by two clusters forming a CPO (Fig. 6a). The primary c-axis cluster is sub-perpendicular to the shear direction (Thomas et al., 2021). The secondary c-axis cluster is at 40–50∘ to the primary cluster. Grains with abnormally large sizes (> 8000 µm) have c axes within the secondary c-axis cluster (star marks in Fig. 6a).
Figure 6b summarizes the M index as a function of annealing time. The M indices of samples with an annealing time of up to 380 h fall within the range of M indices of non-annealed Priestley ice samples that were collected from > 10 m depth (Thomas et al., 2021). The M index of the sample that underwent 780 h of annealing is less than those of the other annealed samples, approaching the M index observed in the upper 10 m of the Priestley ice core (Thomas et al., 2021).
3.2.2 Bubbles
For all samples, bubbles occur both on grain boundaries and within grains (Figs. 3d, 5a and b). For the starting material, the bubble-size distribution is skewed in the linear scale, with a peak at ∼ 200 µm and a tail extending up to ∼ 1000 µm (Fig. 5d). The median bubble size and bubble-size distribution remain similar for samples annealed for up to ∼ 360 h (Fig. 5d). For samples annealed to ∼ 360 and ∼ 800 h (i.e. 13_P, 15_P), there is a slight increase in the median bubble size resulting from a subtle decrease in the proportion of small bubbles (< 500 µm) and a subtle increase in the proportion of large bubbles (> 500 µm) (Fig. 5d). The maximum bubble size is 4–5 times the median bubble size for all the samples (Fig. 5a, b, and d). For the starting material, the SPO of bubbles is characterized by a primary maximum at ∼ 30∘ to the shear direction (x axis) and a secondary maximum at ∼ 120∘ to the shear direction (Fig. 5e–f). For samples annealed to < 100 h, the number of bubbles in the primary SPO maximum decreases and the number of bubbles in the secondary SPO maximum increases with time (Fig. 5e, f). After ∼ 100 h, the bubble SPO is close to isotropic (Fig. 5e, f).
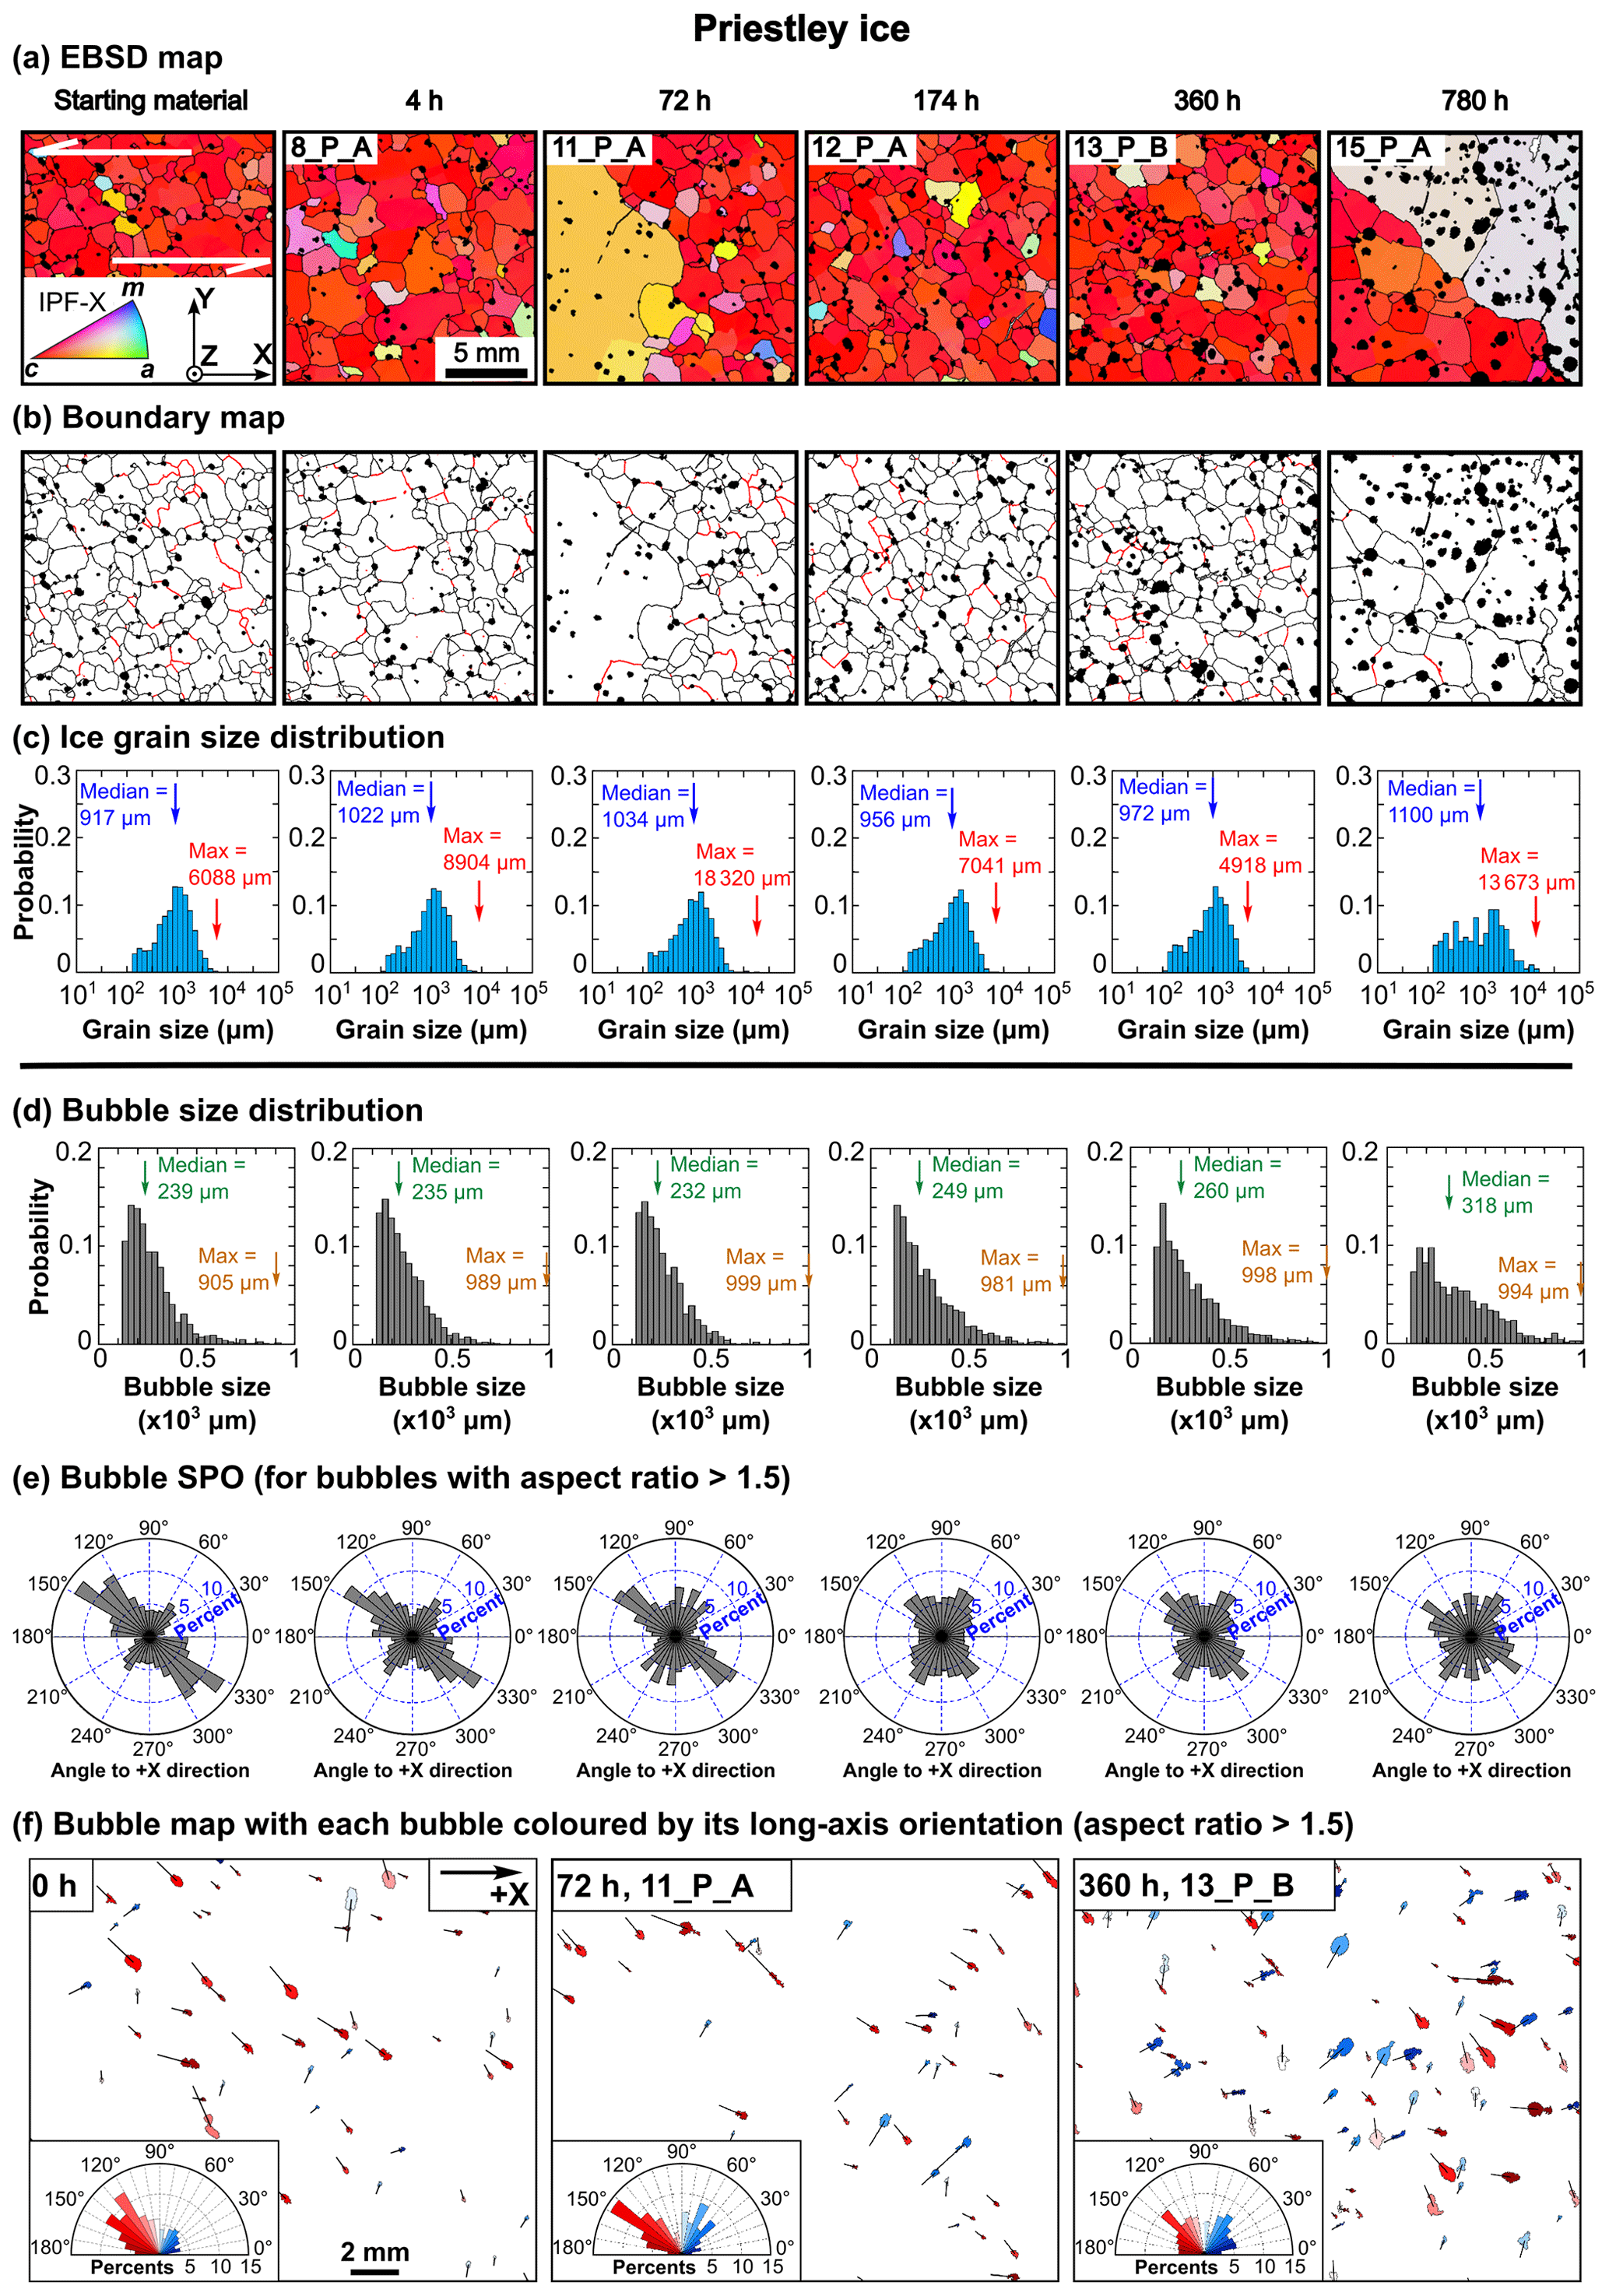
Figure 5Microstructural analyses of Priestley ice samples. For (a)–(d), columns from left to right represent samples with an increasing annealing time. (a) Subareas of the orientation maps, which are coloured by the crystal direction aligned with the x axis of the map (IPF-X). (b) Boundary maps. Black lines indicate grain boundaries. Red lines indicate intragranular boundaries with misorientation angles of 4–10∘. Black blobs indicate bubbles. (c) Distribution of grain size presented on a logarithmic scale. The blue arrow and red arrow indicate the median and maximum grain size, respectively. (d) Distribution of bubble size. The green and gold arrows indicate the median and maximum bubble size, respectively. (e) Shape preferred orientation (SPO) of bubbles with aspect ratios larger than 1.5. (f) Three examples illustrate the long-axis orientation of individual bubbles. Each bubble is coloured by the angle between the bubble's long axis and the +x axis. The black line within each bubble represents the orientation of the bubble's long axis. For each sample, the SPO of bubbles with aspect ratios higher than 1.5 is presented at the bottom left.
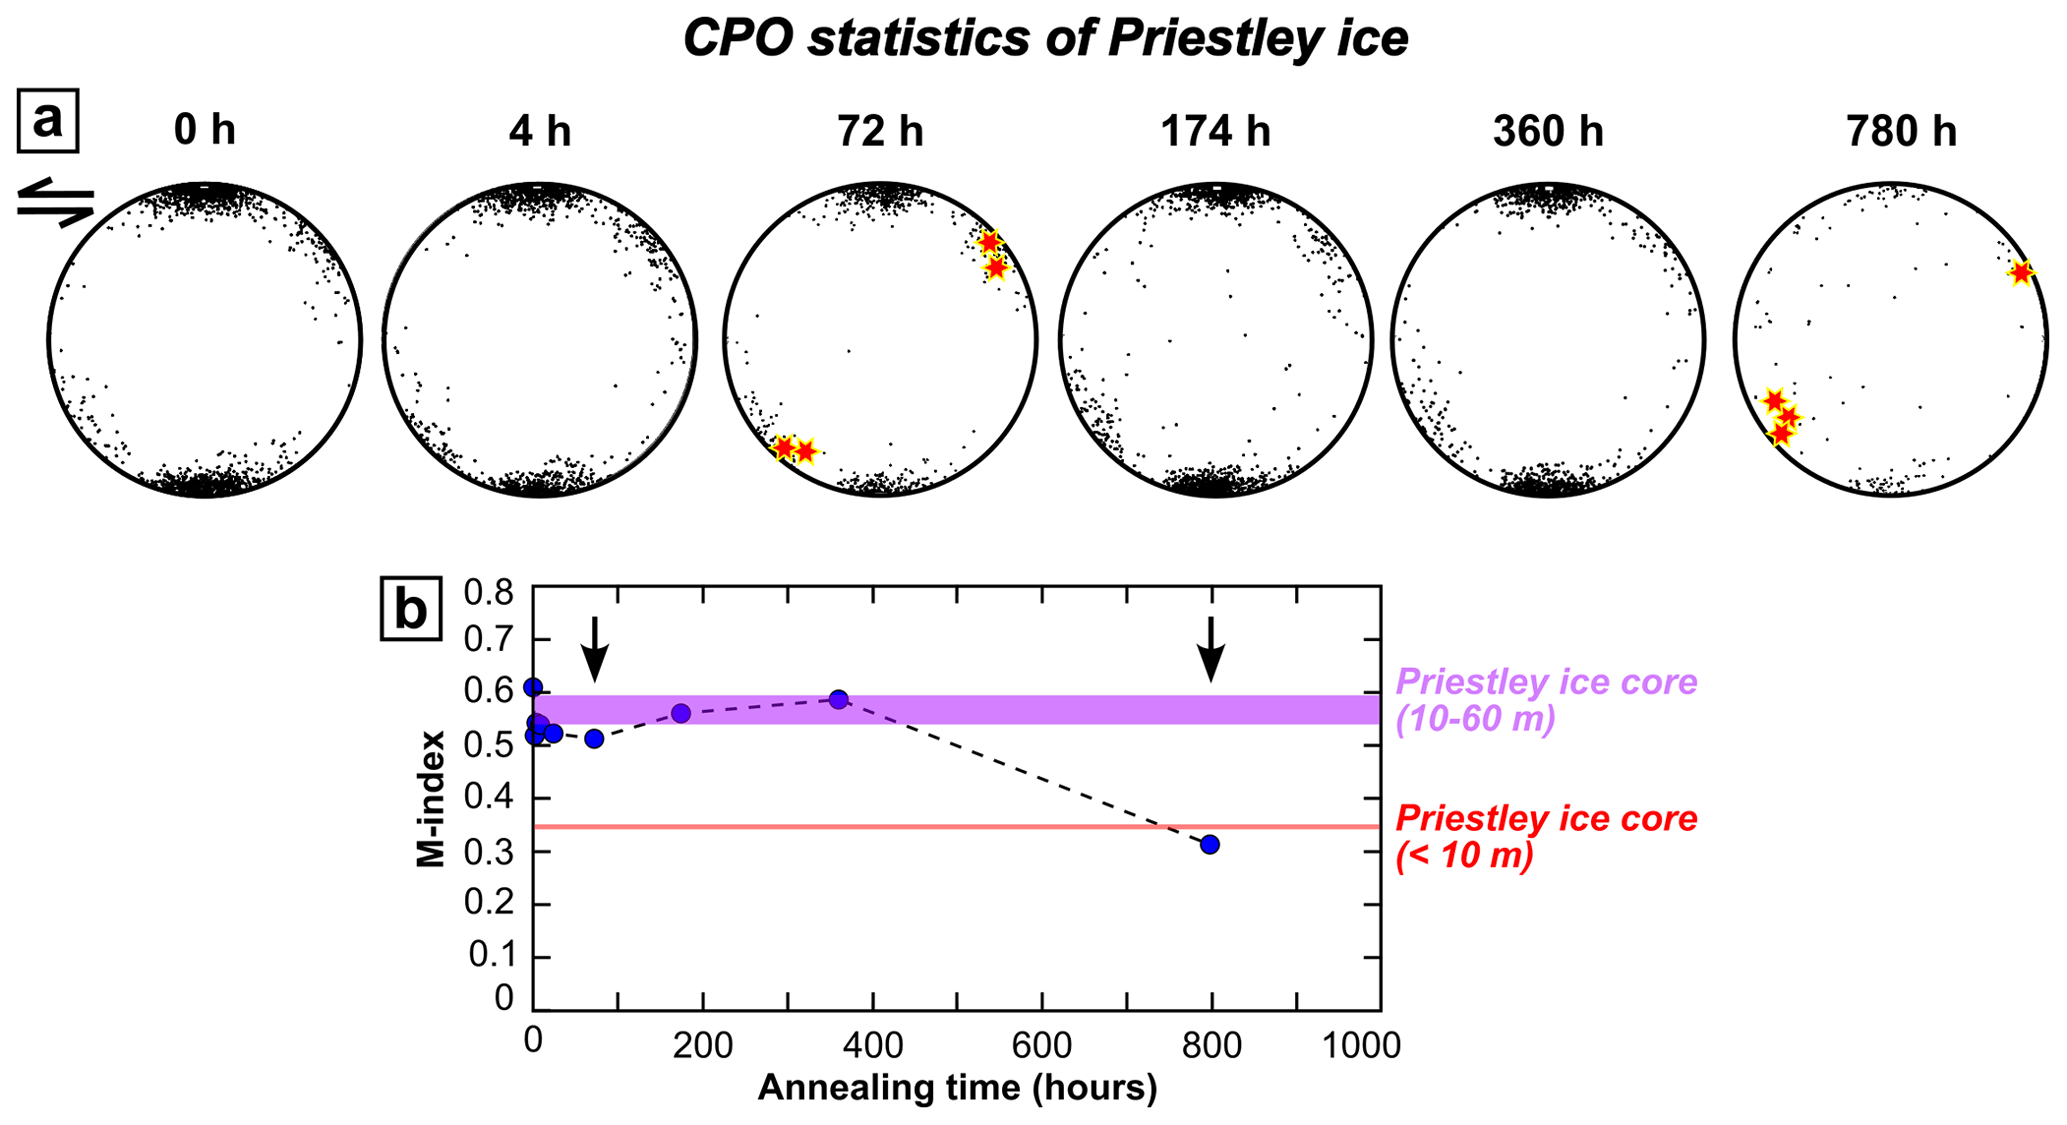
Figure 6CPO analyses of Priestley ice samples. (a) Orientations of ice c axes, which are displayed as pole figures with one point per grain. The c-axis orientations of abnormally large grains (grain size > 8000 µm) are highlighted by star marks (columns 3 and 6). (b) M index, which was calculated from one point per grain, as a function of annealing time. Vertical black arrows indicate samples with abnormal grain growth. Horizontal lines mark the M indices (with one point per grain) of ice samples at different depths of the Priestley ice cores (pink: 10–60 m; red: < 10 m) reported by Thomas et al. (2021).
The microstructural evolution during the annealing of synthetic and Priestley ice is fundamentally different (Sect. 3.1, 3.2). To explore grain-growth mechanisms, we start by comparing the evolution of grain size in synthetic and Priestley ice (Sect. 4.1). After that, we focus on interpreting the microstructural evolution of Priestley ice to understand (1) the role of bubbles in the inhibition of grain growth (Sect. 4.2), and (2) mechanisms that control the activation of abnormal grain growth and how abnormal grain growth modifies the grain size and CPO in natural ice (Sect. 4.3).
4.1 Inferences from ice grain-size evolution
4.1.1 Synthetic ice
The median grain size of the synthetic ice increases with time and the rate of growth decreases as grain size increases (Fig. 7). Furthermore, the shape of the grain-size distribution does not change significantly during annealing (Fig. 5c). These observations are characteristics associated with “normal grain growth”. During normal grain growth, the average grain size of single-phase polycrystalline materials, such as olivine, quartz, and ice, can be described in a power-law form as
where D is the average grain size at time t, D0 is the average grain size at the start of annealing, n is the grain-size exponent, and k is a thermally activated rate constant (Evans et al., 2001; Alley et al., 1986; Karato, 1989; Covey-Crump, 1997).
We applied the method from Bons et al. (2001) and Azuma et al. (2012) to quantify grain-growth parameters. The average grain size at the start of annealing, D0, is given by
where t0 is an unknown hypothetical incubation time needed to reach the average grain size at the start of grain growth. Combining Eqs. (1) and (2), the change in grain size during the normal grain growth of polycrystals can be expressed as
By taking the logarithm of Eq. (3),
Eq. (4) can be transformed to
Equation (5) contains three unknown parameters, i.e. n, k, and t0. We applied numerical iteration to Eq. (5) using median grain size and annealing time as inputs. Figure 7a shows that a growth exponent, n, of 2–3 is required to achieve a relatively robust fit to the measured grain-size evolution with the value of R2 (a measure of the goodness of fit) greater than 0.95.
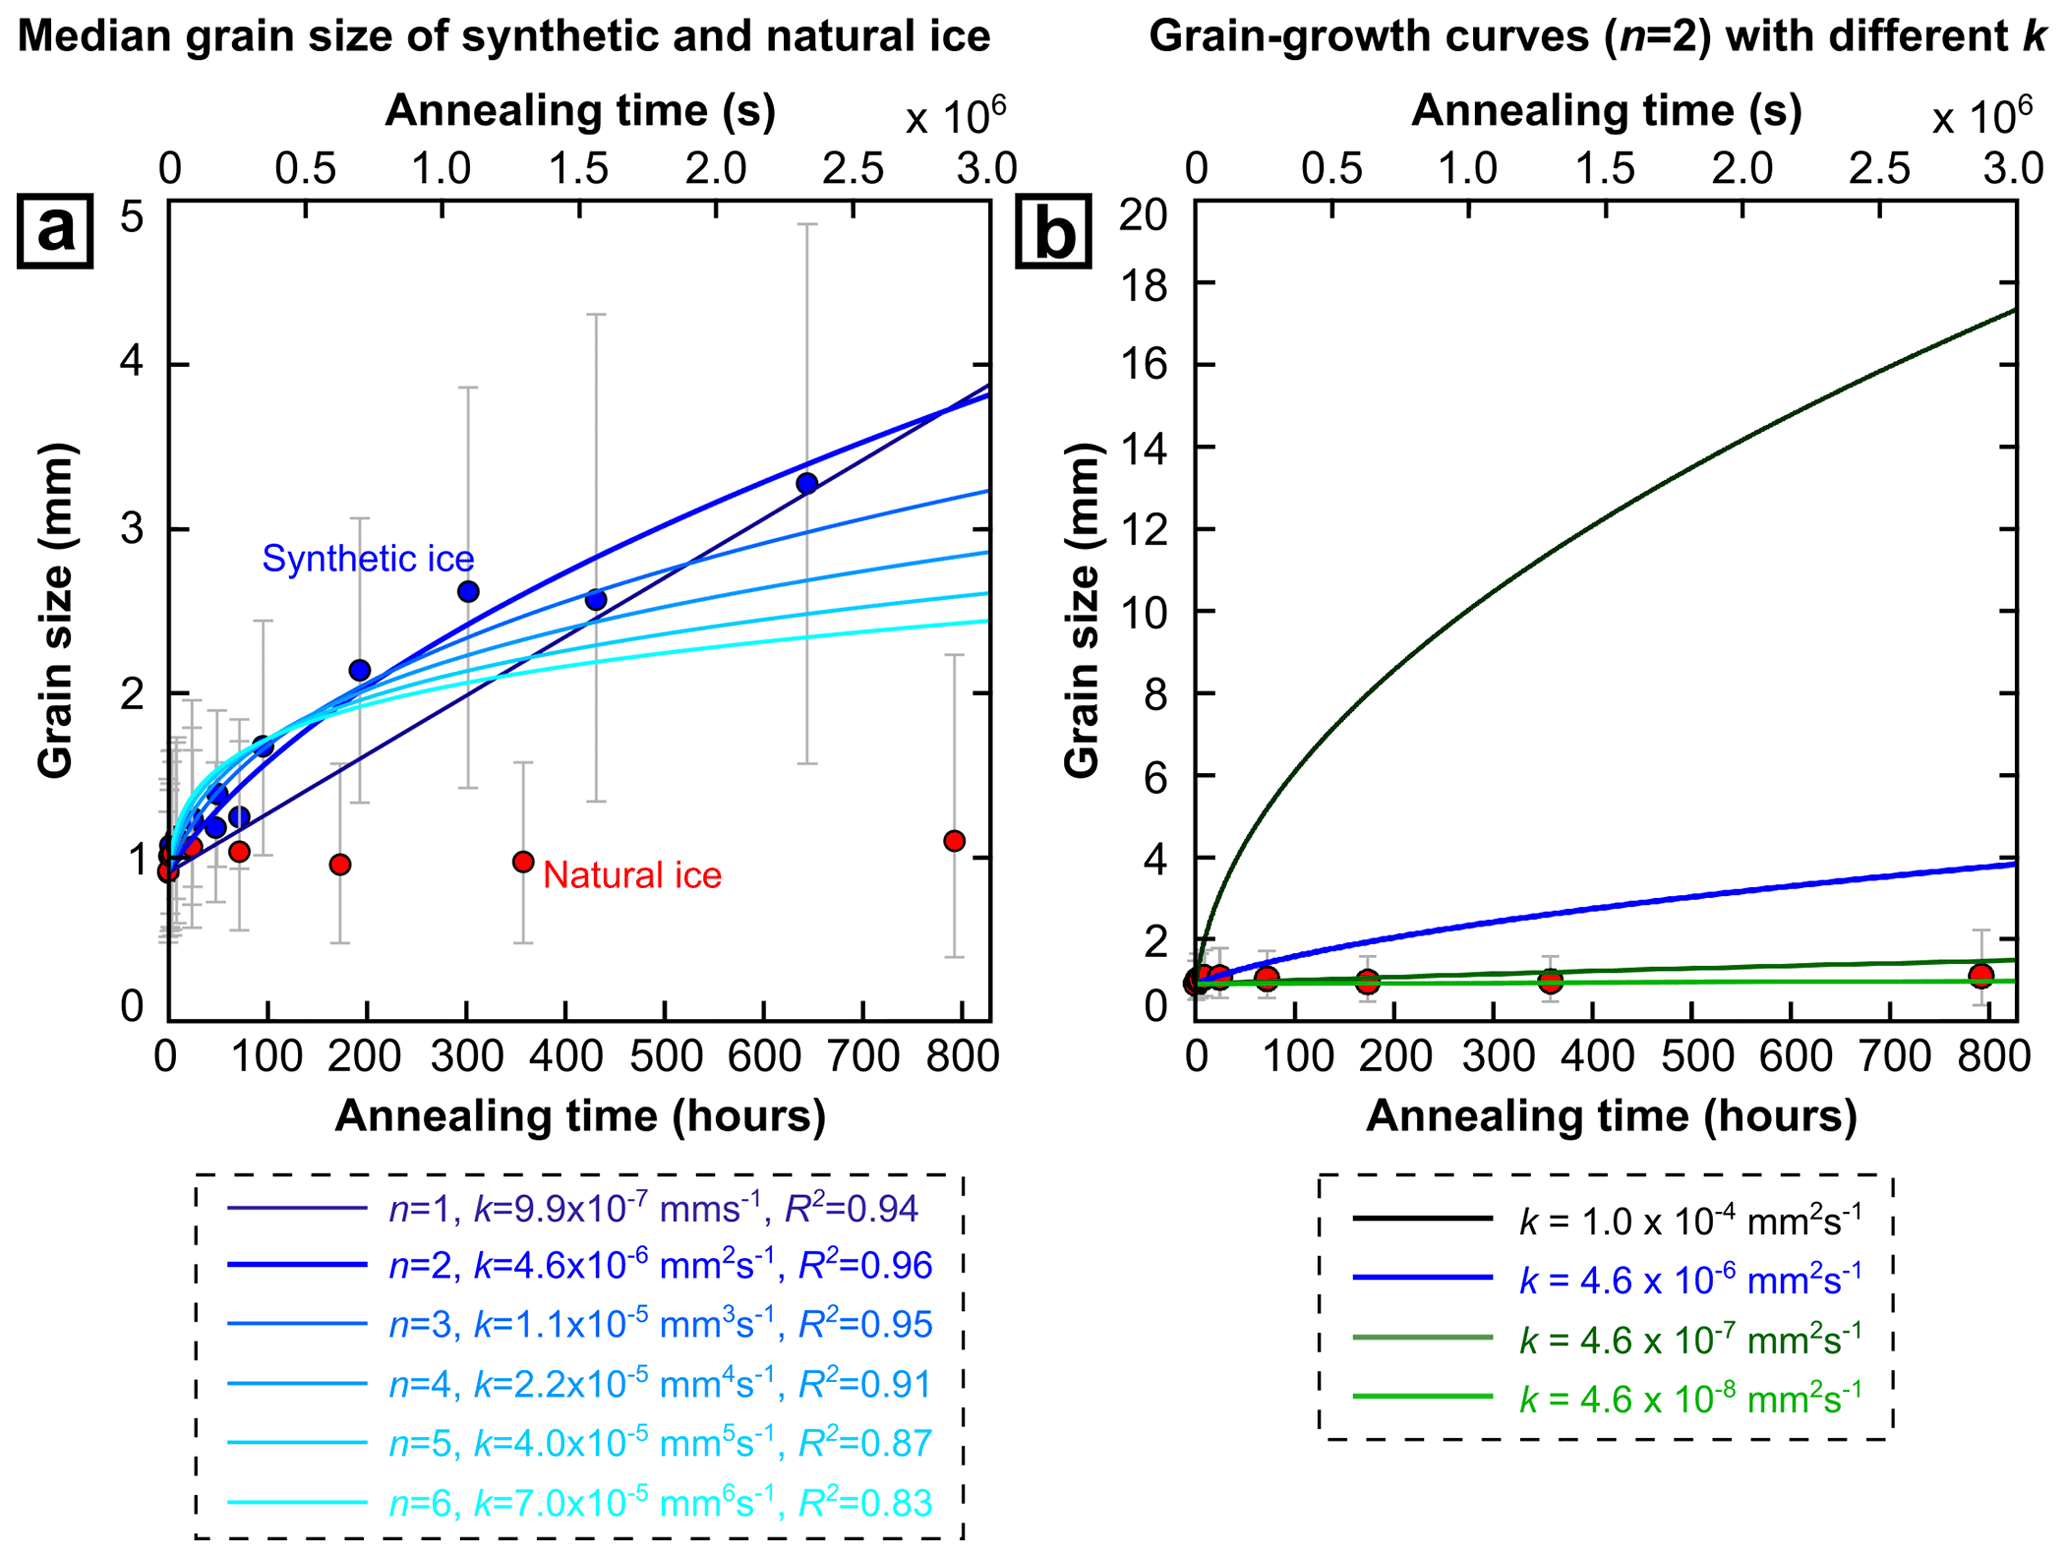
Figure 7(a) The evolution of median grain size with increasing annealing time for synthetic ice and Priestley ice. (b) Comparison of grain-growth curves with n=2 and different values of k. The measured grain size is shown with the interquartile range (IQR). The solid circle is the median grain size.
4.1.2 Priestley ice
For Priestley ice samples, the median grain size stays within the range of values reported for different subsamples of the Priestley ice core (Thomas et al., 2021), suggesting that insignificant normal grain growth has occurred during annealing (∼ 33 d in this case). Grain-size changes are too small to evaluate the grain-growth parameters (i.e. grain-growth exponent n, rate constant, k) of natural ice. To quantify maximum rates of grain growth in natural ice, we calculated what parameters (n and k) would give grain growth that is too limited for us to measure. First, we fixed n to a value of 2, a value for perfect normal grain growth (Covey-Crump, 1997) that is constrained by bubble-free synthetic ice (Azuma et al., 2012) and gives a good fit to data from our synthetic ice. This constraint allows us to calculate a limiting value for k, representing the grain-boundary mobility during normal grain growth. Figure 7b displays a comparison between the modelling results and measurements, and it shows that to reproduce the grain-size change in natural ice, the k value needs to be at least 2 orders of magnitude less than that for synthetic ice (compare red dots with blue and green curves). This observation suggests that, if the grain-growth process in natural ice and synthetic ice is the same (i.e. dominated by normal grain growth), then reduced grain-boundary mobility and effective driving force (as indicated by the estimated low value of k) governs grain-size change in natural ice. Second, we fixed the value of k ( mm2 s−1) measured from synthetic ice (Sect. 4.1.1) while varying the value of n. To reproduce the grain-size change in natural ice, the n value needs to be ∼ 50. This observation suggests that if the grain-boundary mobility and effective driving force are the same between synthetic and natural ice, then processes that are different from normal grain growth (as indicated by the high estimated value of n) govern grain-size change in natural ice. We suggest that inhibition of grain growth in natural ice is controlled by both reductions in grain-boundary mobility and effective driving force (as discussed in the following Sect. 4.2) and processes that are different from normal grain growth (as discussed in the following Sect. 4.3).
4.2 Evaluating the role of bubbles in grain-growth inhibition in Priestley ice
The grain-growth rate of Priestley ice is much slower than synthetic ice during annealing experiments (Fig. 7; Sect. 4.1). The migration rate of a grain boundary is a function of grain-boundary mobility and driving force (Humphreys et al., 2017). Previous studies on metal, rock-forming minerals, and ice show that the driving force and kinetics of grain-boundary migration are influenced by the microstructure (Humphreys et al., 2017; Herwegh et al., 2011; Fan et al., 2021b; Azuma et al., 2012; Kilian et al., 2011; Piazolo et al., 2006; Bestmann et al., 2005). For example, neighbouring grains with different orientations may exhibit a contrast of dislocation densities during deformation (Vaughan et al., 2017; Fan et al., 2021b; Boneh et al., 2017). The dislocation-density contrast can drive the migration of grain boundaries from grains containing low dislocation densities towards grains with high dislocation densities (Hirth and Tullis, 1992; Jessell and Lister, 1990). At the same time, secondary phases can introduce a dragging force (i.e. the Zener effect) and thus reduce the effective driving force for grain-boundary migration (Herwegh et al., 2011; Humphreys et al., 2017; Kilian et al., 2011; Schmatz, 2010). A key microstructural difference between synthetic ice and Priestley ice is the bubble content. The Priestley ice is bubble-rich as revealed by the secondary electron image (Fig. 5a). In contrast, the synthetic ice does not contain visible bubbles (Fig. 4a). The Priestley ice does contain fine (micrometre-scale and larger) particles (micas mostly), but calculations suggest that there are only a few mica particles per ice grain (Rilee E. Thomas and David J. Prior, unpublished data). However, we currently have no constraints on how particles are distributed, and we are unable to constrain how particles contribute to the grain-growth process of ice. Evaluating the impact of impurities, CPO, and strain energy on grain growth would require additional data input and extensive modelling that are beyond the scope of this paper. In the following paragraphs, we will focus on evaluating the impact of bubbles on the inhibition of grain growth.
During ∼ 400 h of annealing, the average bubble size remains unchanged. However, after ∼ 800 h of annealing, the number of small bubbles (< 500 µm) decreases whilst the number of large bubbles (> 500 µm) increases (Fig. 5d; Sect. 3.2.2). These observations suggest a slow growth of air bubbles (Alley et al., 1986; Shewmon, 1964). The SPO of bubbles was also modified during annealing. The primary SPO maximum weakens with increasing time in the first ∼ 100 h, and after ∼ 100 h, the SPO becomes isotropic (Fig. 5e, f; Sect. 3.2.2). This observation is consistent with previous studies suggesting that bubbles tend to return to a spherical shape via vapour diffusion driven by curvature and surface tension (Hudleston, 1977; Alley and Fitzpatrick, 1999).
Bubble density, i.e. bubble number per unit area, is one of the key parameters that can help us to understand how bubbles interact with grain boundaries (Duval, 1985; Durand et al., 2006; Azuma et al., 2012). We calculated separately the number density (i.e. number per unit area) of bubbles at grain boundaries and bubbles in the interior of grains (Fig. 8a). We also calculated the density of bubbles with different size ranges. We use the measured bubble density relative to the starting material to better visualize the relative change in bubble density during annealing. Up to ∼ 400 h, the overall bubble density averaged across those on grain boundaries and within grain interiors remains similar (black circles, Fig. 8b), suggesting an insignificant sample-to-sample variation and no significant changes in bubble number.
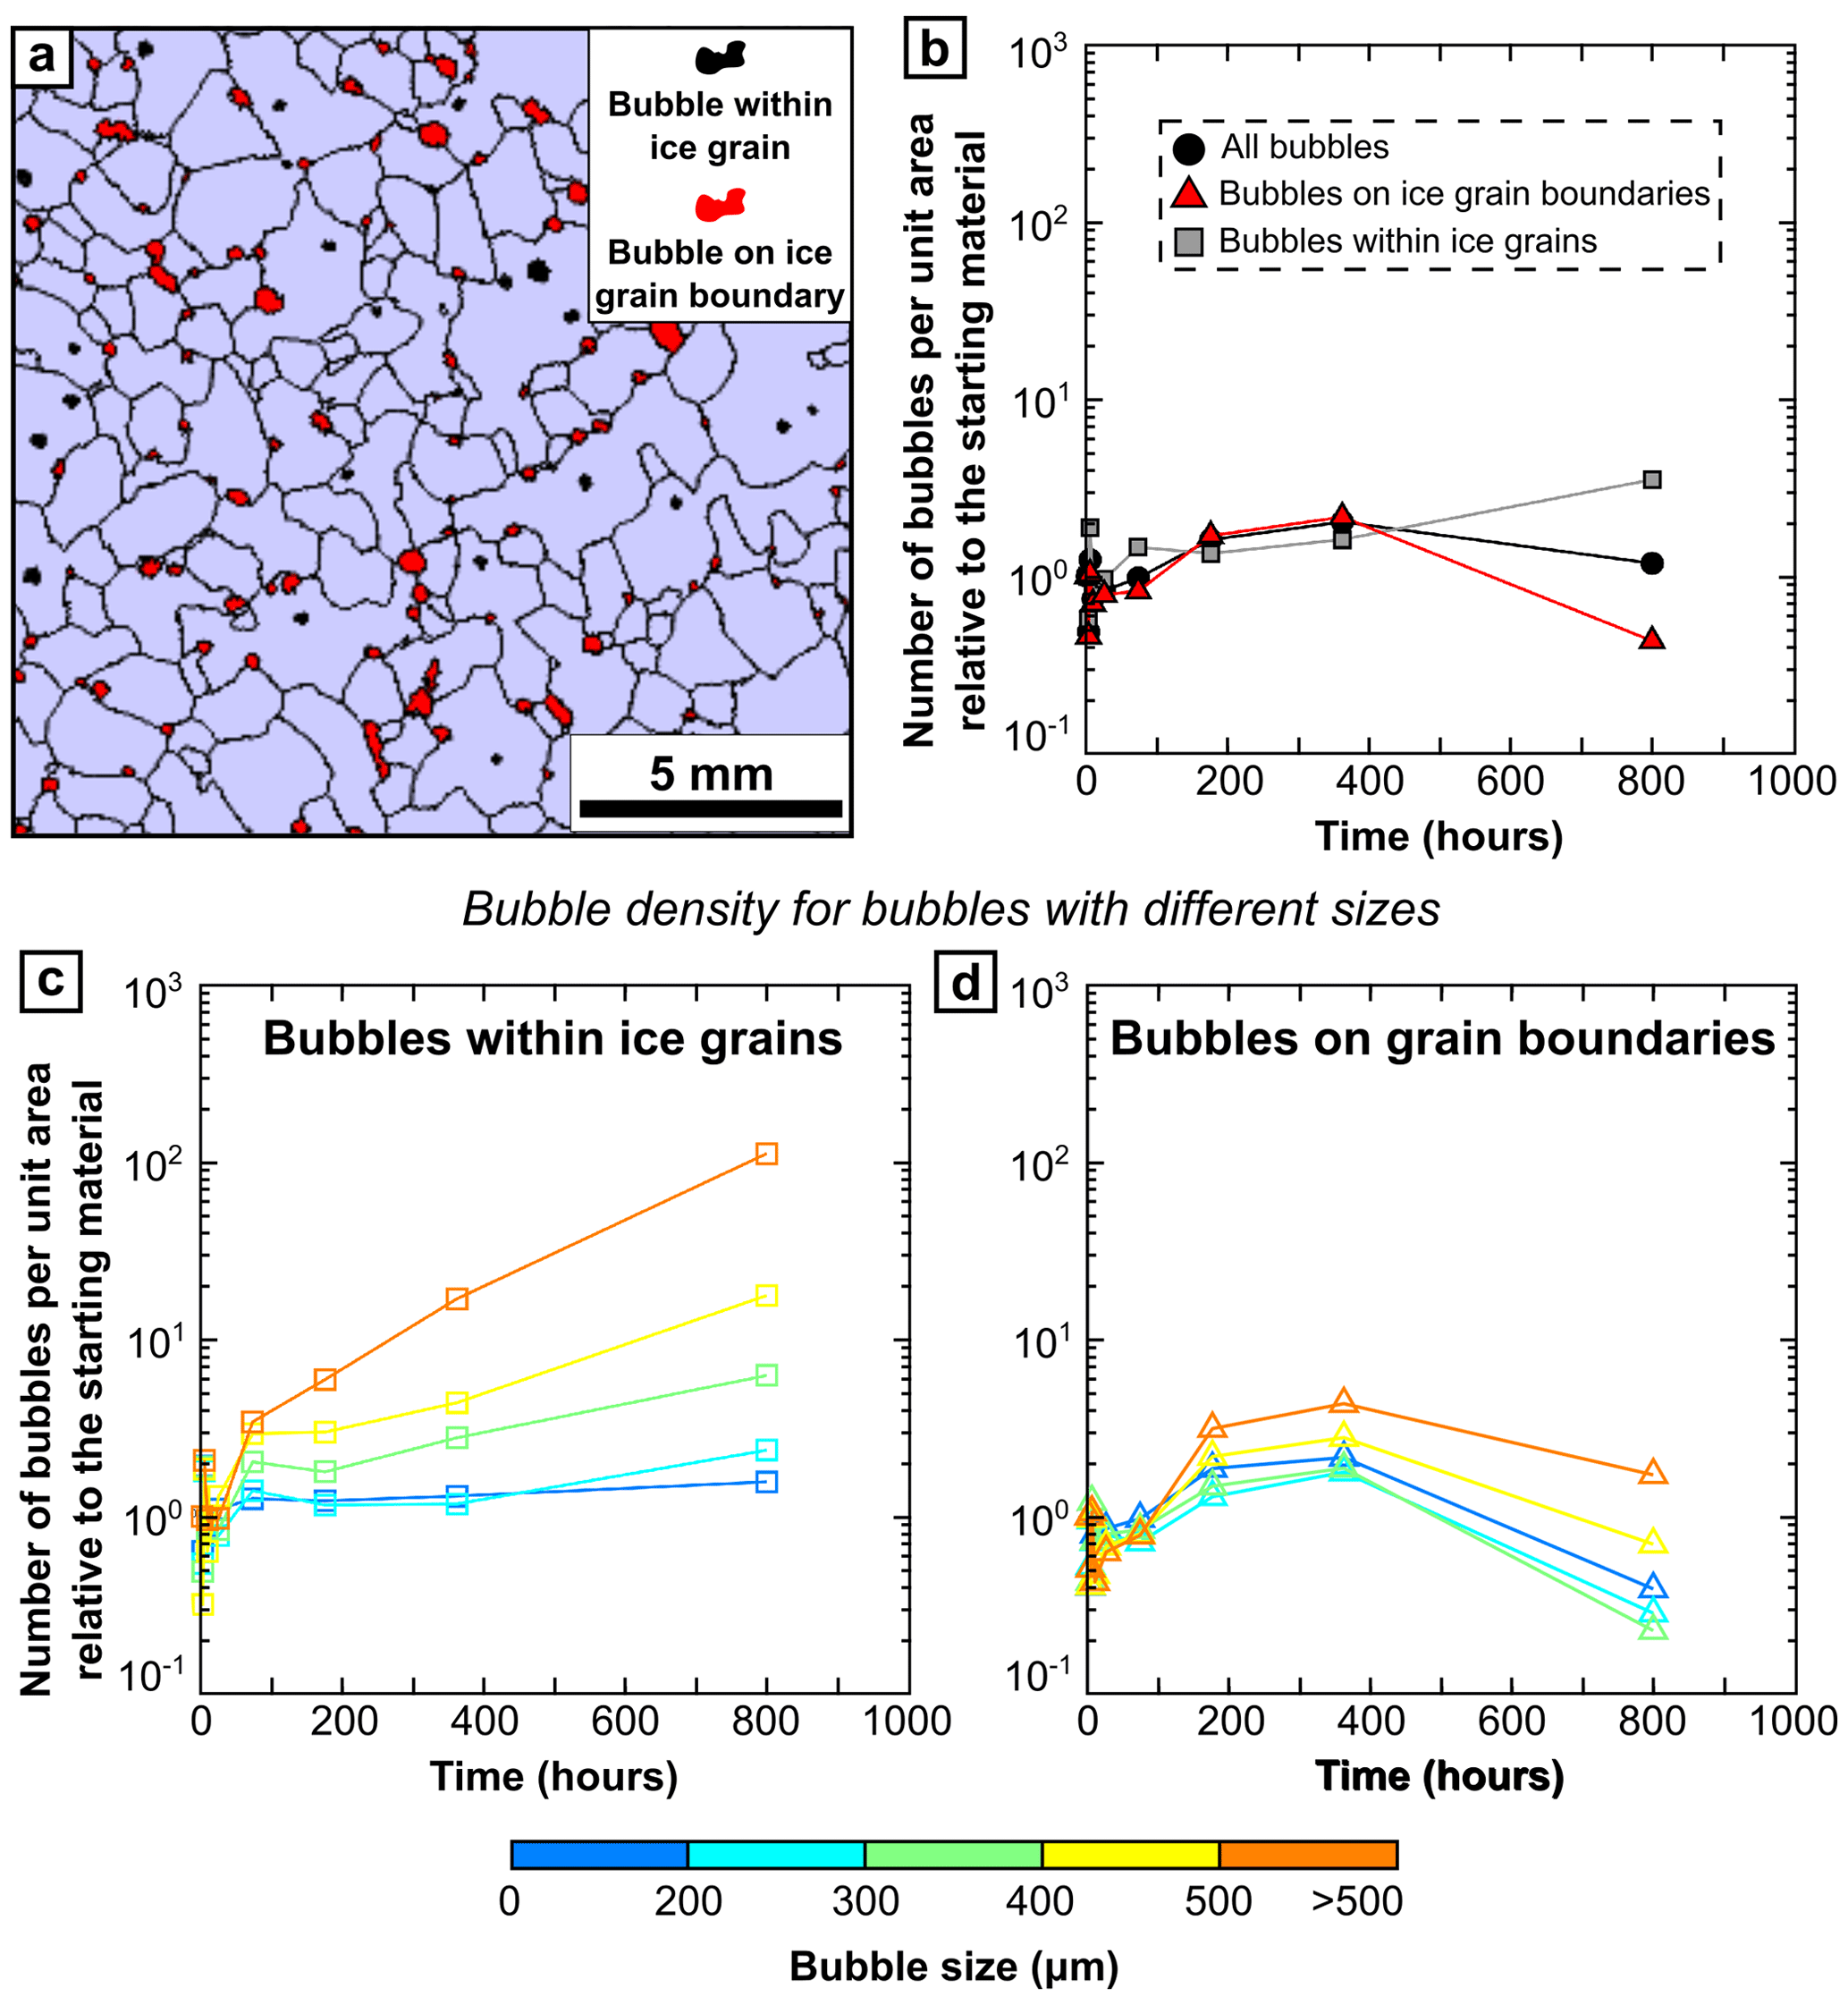
Figure 8(a) An example that illustrates the discrimination of bubbles on grain boundaries from bubbles in grain interiors. (b) The evolution of normalized density with increasing annealing time for all bubbles, bubbles on grain boundaries, and bubbles in grain interiors. (c) The evolution of normalized density with increasing annealing time for bubbles with different sizes that are within ice grains. (d) The evolution of normalized density with increasing annealing time for bubbles with different sizes that are on ice grain boundaries.
For bubbles within ice grains, the density of relatively bigger bubbles (bubble size ≥ 300 µm) increases with time, whilst the density of relatively smaller bubbles (bubble size < 300 µm) remains fairly stable during ∼ 800 h of annealing (square marks, Fig. 8c). This observation indicates the growth of some of the bubbles, probably driven by surface energy. Before ∼ 400 h of annealing, the density of bubbles on grain boundaries gradually increases (triangle marks, Fig. 8d). This observation suggests that more bubbles pin at grain boundaries probably during the migration of grain boundaries. By ∼ 800 h of annealing, the density of bubbles on grain boundaries has decreased (triangle marks, Fig. 8d). This observation suggests that some grain boundaries have swept through bubbles. Consequently, for these grain boundaries, the pinning force exerted by bubbles decreases, and the rate of grain-boundary migration is enhanced. Previous modelling results show that during grain growth the value of the rate constant, k, which is a function of grain-boundary mobility and driving force (Evans et al., 2001), varies before the aggregate of ice and bubble reaches an equilibrated state, i.e. before the contrast between the length scales of bubble spacing and grain size becomes relatively constant (Roessiger et al., 2014). Consequently, the grain-growth rates of natural ice at different stages (i.e. before and after reaching an equilibrated microstructure) might be different (Roessiger et al., 2014). We speculate that the aggregate of ice and bubble in Priestley ice was far from reaching an equilibrated microstructure within a relatively short amount of time (∼ 33 d in this study). Thus, for the Priestley ice, values of the rate constant, k, between short (e.g. several months) and long (e.g. thousands of years) annealing times might be different.
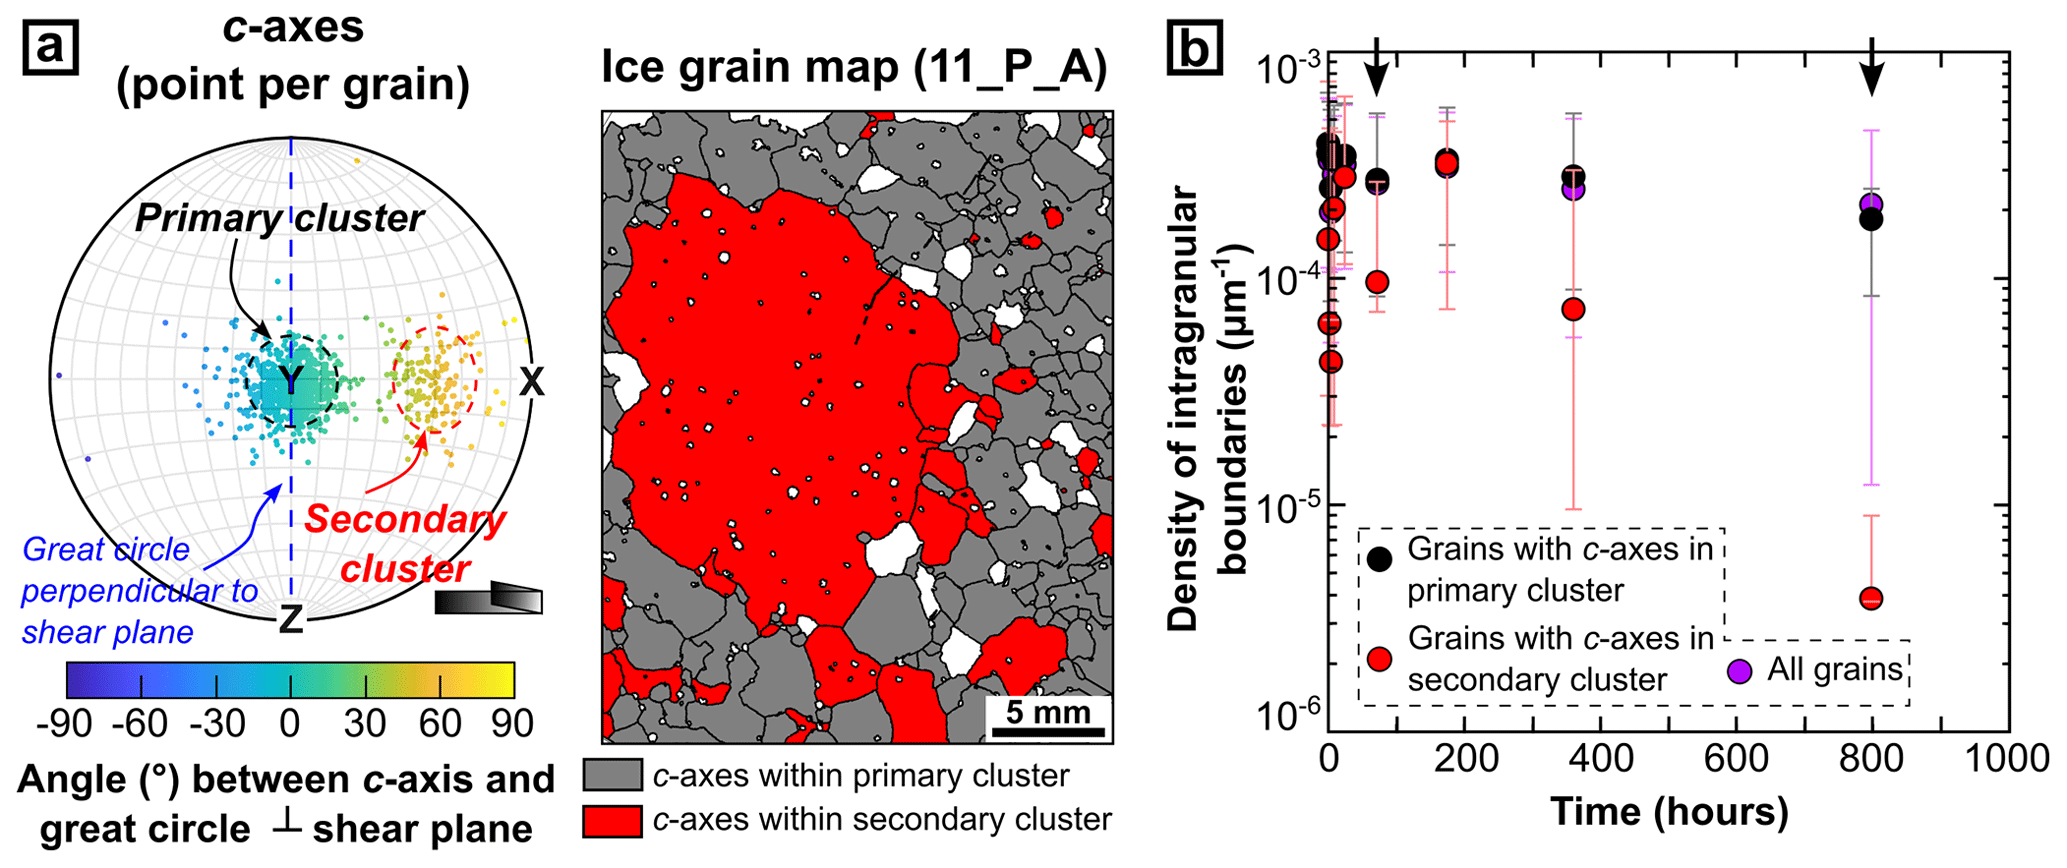
Figure 9Microstructural statistics for grains with different orientations. (a) Pole figure illustrating the segregation between grains with c axes within the primary c-axis cluster and grains with c axes within the secondary c-axis cluster. (b) Comparison of the length per unit area of intragranular boundaries (misorientation angle > 4∘) amongst grains with different orientations.
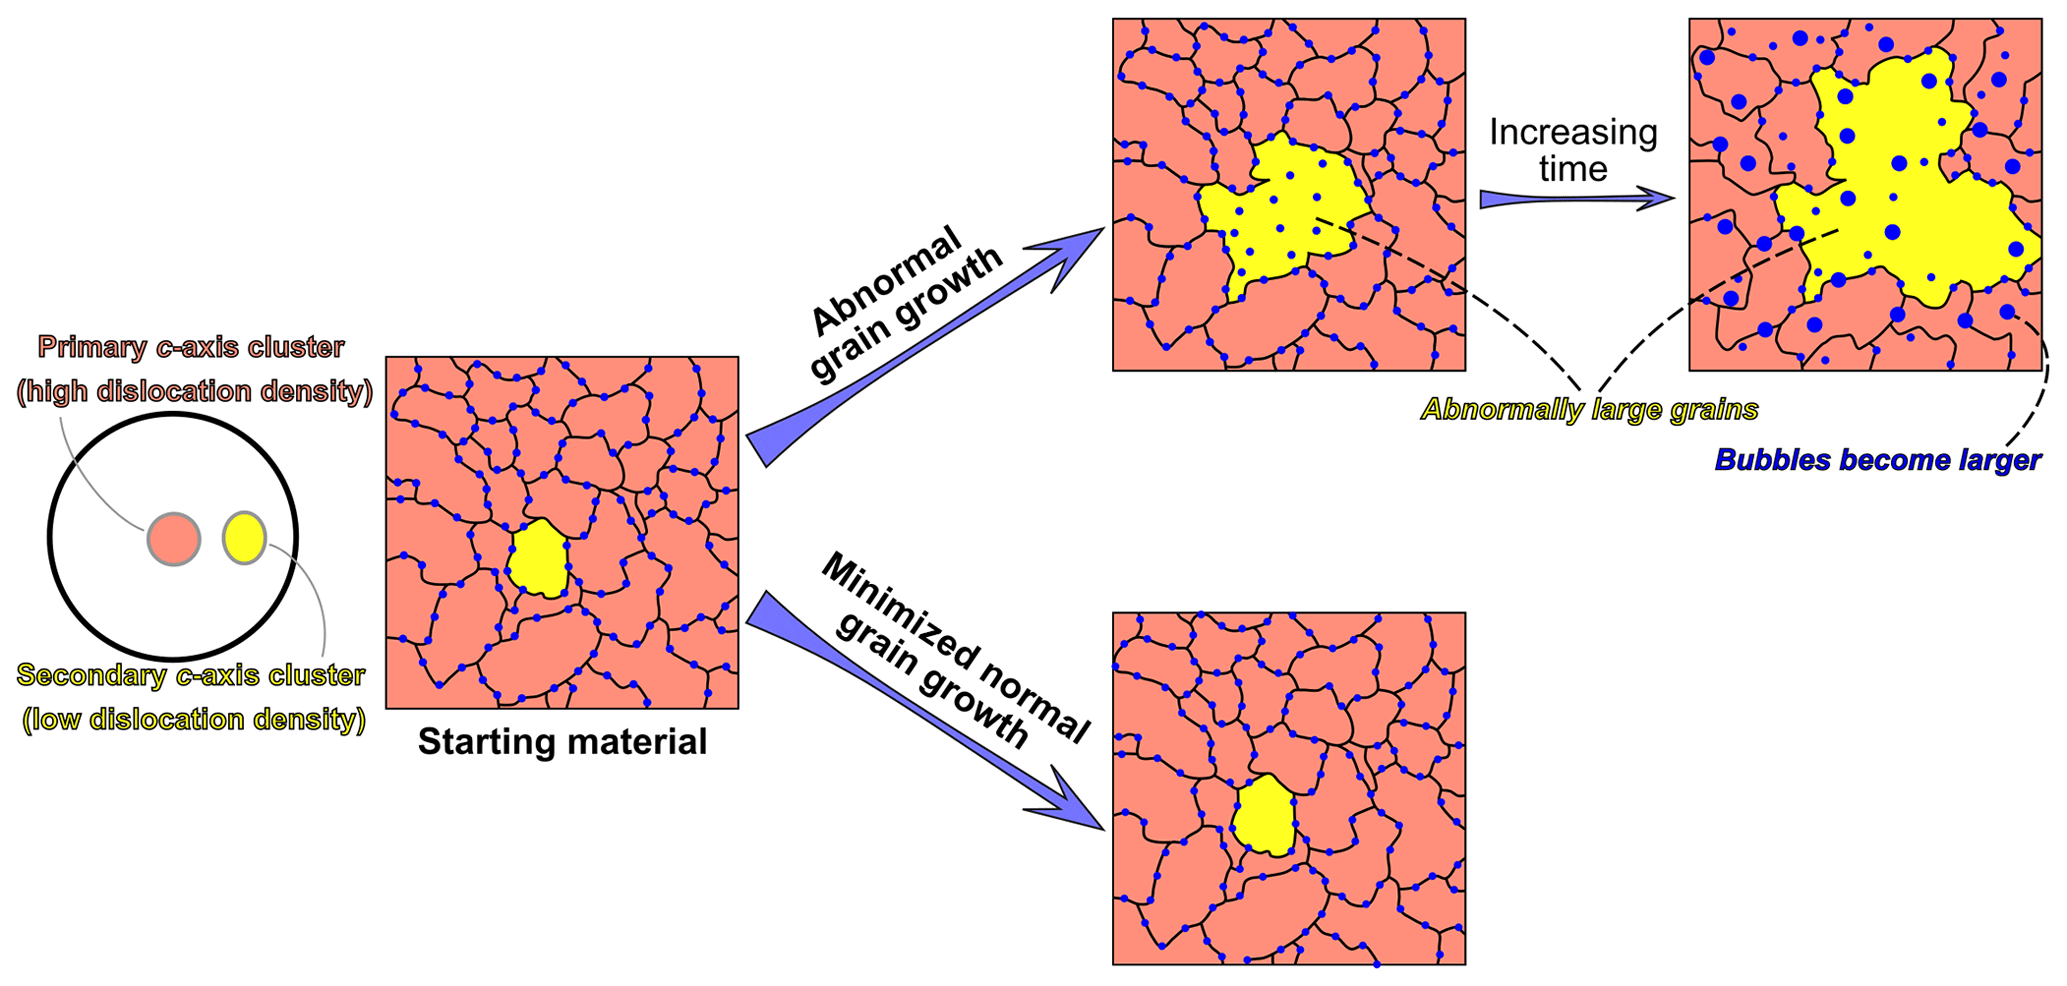
Figure 10Schematic drawing of microstructural development of Priestley ice during annealing.
4.3 Abnormal grain growth in Priestley ice
Some of the annealed Priestley ice samples (11_P, 15_P) have grains that are ∼ 12–18 times larger than the average grain size (Fig. 5a, c; Sect. 3.2.1). Abnormally large grains are not observed in the Priestley ice cores (Thomas et al., 2021), and we suggest that these abnormally large grains were produced during annealing. The Priestley ice samples were initially bubble-rich, and we infer that the grain growth was strongly inhibited by bubble pinning before the annealing experiments started (Sect. 4.3).
For annealed Priestley ice samples, most grains that are not abnormally large have c axes within the primary c-axis cluster (Fig. 6a, b; Sect. 3.2.1). On the contrary, all the abnormally large grains have c axes within the secondary c-axis cluster (Fig. 6a, b; Sect. 3.2.1). We segregated grains with c axes at 0–15∘ to the centre of the primary maximum from grains with c axes at 0–15∘ to the centre of the secondary maximum to assess the dislocation-density contrast between grains with different orientations (Fig. 9a). For each selected grain, we calculated the length per unit grain area of intragranular boundaries with misorientation angles higher than 4∘. The boundary-length density in grains within the primary c-axis cluster is generally higher than that in grains within the secondary c-axis cluster, and this contrast is especially obvious within samples that develop abnormally large grains (11_P, 15_P; indicated by vertical arrows) (Fig. 9b). The dislocation-density contrast is considered an important driving force for grain-boundary migration from areas with lower dislocation densities towards areas with higher dislocation densities (Hirth and Tullis, 1992; Humphreys et al., 2017; Jessell and Lister, 1990). Consequently, we infer that the migration rate for boundaries between grains with c axes in the primary and secondary clusters is faster than the migration rate for grain boundaries between grains with c axes within a single cluster.
The analysis in the last two paragraphs suggests that the abnormal grain growth observed in some of the annealed Priestley ice samples is probably related to (1) bubble pinning, which inhibited the movement of the boundary network, and (2) dislocation-density contrast, which favours the selected growth of grains with low dislocation densities at the cost of neighbouring grains with high dislocation densities (Fig. 10). These interpretations are consistent with previous theoretical predictions (Hillert, 1965; Gladman, 1966; Rollett and Mullins, 1997; Humphreys et al., 2017), experimental observations (Boneh et al., 2017; Cooper and Kohlstedt, 1984; Bae and Baik, 2005), and numerical modelling results (Doherty et al., 1997; Srolovitz et al., 1985).
Samples (12_P, 15_P) that exhibit abnormal grain growth have M indices that are generally lower than the other samples, and they are close to the M indices of the upper 10 m of the Priestley ice core (Sect. 3.2.1). Temperature profiles of the borehole of the Priestley Glacier show that in the summer, ice temperature is 0 ∘C at the surface and decreases to ∼ −19 ∘C at the depth of 10 m (Thomas et al., 2021). Temperature records that span from January 2020 to November 2022 show that the top 10 m warms in summer and cools in winter (David J. Prior, unpublished data). Consequently, annual thermal annealing should occur in the shallow part of the Priestley Glacier. A similar M index between annealed samples with abnormal grain growth and the shallow (< 10 m depth) Priestley ice core suggests that abnormal grain growth might be active at the shallow part of Priestley Glacier. An annealing experiment of an ice sample deformed by direct shear also shows a strengthening of the secondary c-axis cluster (Journaux et al., 2019), although there is no evidence of the grains within the secondary c-axis cluster being substantially larger than other grains after annealing.
-
Annealing experiments at 0 ∘C were conducted on synthetic, ultra-pure water-ice samples and natural, Priestley ice samples. The grain size of synthetic samples increases with annealing time, with a grain-growth exponent, n, of 2–3, consistent with the results of Azuma et al. (2012). The grain-size evolution of synthetic ice can be explained by normal grain growth. In contrast, the grain size of the natural ice barely changes within 33 d. The grain-growth rate in natural ice samples is much slower than predictions using grain-growth parameters derived from synthetic ice (e.g. this study; Azuma et al., 2012). Thus, the grain-size evolution of natural ice cannot be simply explained by normal grain growth. This observation also indicates that a relatively short period of abrupt temperature change during sampling (including drilling and handling) of natural ice cores should have an insignificant impact on average grain size.
-
The inhibition of grain growth in natural ice is correlated with the observation of (1) many bubbles at ice grain boundaries and (2) the development of abnormally large grains that do not exist in the starting material. Bubble pinning provides a resisting force and thus reduces the effective driving force for grain-boundary migration. Abnormal grain growth introduces an additional grain-growth process to normal grain growth. Together, bubble pinning and abnormal grain growth govern the grain-size change in natural ice samples.
-
The number density of bubbles at grain boundaries in natural ice changes during annealing. This observation suggests that the effective driving force and kinetics of grain growth in natural ice, which is influenced by bubble pinning, should also vary during annealing. Consequently, we speculate that grain growth in natural ice might comprise more than one stage and it should correspond to more than one set of grain-growth parameters.
-
Abnormal grain growth is observed in annealed natural ice samples. Abnormally large grains have fewer intragranular distortions indicating low dislocation density, whilst their neighbouring grains have more significant intragranular distortions indicating high dislocation density. We speculate that dislocation-density contrast drives abnormal grain growth. We also observed a widespread bubble pinning that inhibits the grain-boundary migration of ice grains. We suggest bubble pinning might also contribute to abnormal grain growth in natural ice.
-
Annealed natural ice samples that contain abnormally large grains exhibit a weaker CPO intensity compared with other annealed samples without abnormal grain growth. This observation is consistent with the CPO of the shallow part of the Priestley ice core, which experienced thermal annealing due to annual heating, being weaker than the deeper part of the Priestley ice core. These observations suggest abnormal grain growth might be the norm in the shallow part of Priestley Glacier.
Data can be obtained via https://doi.org/10.17632/862dcnvzg7.1 (Fan and Prior, 2023).
The supplement related to this article is available online at: https://doi.org/10.5194/tc-17-3443-2023-supplement.
Conceptualization: SF and DJP. Methodology: SF and DJP. Resources: SF, DJP, BP, HB, and LD. Investigation: SF. Data curation: SF. Software: SF. Formal analysis: SF. Validation: SF, DJP, and CQ. Writing (original draft): SF. Writing (review and editing): SF, DJP, DW, SP, QC, DLG, and TFH.
The contact author has declared that none of the authors has any competing interests.
Publisher's note: Copernicus Publications remains neutral with regard to jurisdictional claims in published maps and institutional affiliations.
We are thankful to Julie Clark for providing the cold room facility at the University of Otago. Sheng Fan was supported by a research grant from the New Zealand Ministry of Business, Innovation and Employment through the Antarctic Science Platform (ANTA1801) (grant number ASP-023-03) and a New Zealand Antarctic Research Institute (NZARI) Early Career Researcher Seed Grant (grant number NZARI 2020-1-5). David J. Prior was supported by two Marsden Funds of the Royal Society of New Zealand (grant number UOO1116, grant number UOO052). David Wallis was supported by a UK Research and Innovation Future Leaders Fellowship (grant number MR/V021788/1). Chao Qi was supported by an NSFC grant (grant number 41972232). David L. Goldsby was supported by a NASA fund (grant number NNX15AM69G). We thank the journal reviewers Christopher J. L. Wilson and Nicolas Stoll and editors Kaitlin Keegan and Nanna Bjørnholt Karlsson for their insightful reviews and editorial handling that helped to improve the manuscript.
This research has been supported by the New Zealand Antarctic Research Institute (grant no. NZARI 2020-1-5), the New Zealand Ministry of Business, Innovation and Employment through the Antarctic Science Platform (ANTA 1801) (grant no. ASP-023-03), the UK Research and Innovation Future Leaders Fellowship (grant no. MR/V021788/1), the Marsden Fund (grant nos. UOO1116 and UOO052), the National Aeronautics and Space Administration (grant no. NNX15AM69G), and the National Natural Science Foundation of China (NSFC) (grant no. 41972232).
This paper was edited by Kaitlin Keegan and reviewed by Nicolas Stoll and Chris Wilson.
Alley, R. B. and Fitzpatrick, J. J.: Conditions for bubble elongation in cold ice-sheet ice, J. Glaciol., 45, 147–153, https://doi.org/10.3189/s0022143000003129, 1999.
Alley, R. B., Perepezko, J. H., and Bentley, C. R.: Grain Growth in Polar Ice: I. Theory, J. Glaciol., 32, 415–424, https://doi.org/10.3189/s0022143000012120, 1986.
Atkinson, H. V.: Overview no. 65: Theories of normal grain growth in pure single phase systems, Acta Metall., 36, 469–491, https://doi.org/10.1016/0001-6160(88)90079-X, 1988.
Azuma, N.: A flow law for anisotropic ice and its application to ice sheets, Earth Planet. Sc. Lett., 128, 601–614, https://doi.org/10.1016/0012-821X(94)90173-2, 1994.
Azuma, N., Miyakoshi, T., Yokoyama, S., and Takata, M.: Impeding effect of air bubbles on normal grain growth of ice, J. Struct. Geol., 42, 184–193, https://doi.org/10.1016/j.jsg.2012.05.005, 2012.
Bachmann, F., Hielscher, R., and Schaeben, H.: Grain detection from 2d and 3d EBSD data – Specification of the MTEX algorithm, Ultramicroscopy, 111, 1720–1733, https://doi.org/10.1016/j.ultramic.2011.08.002, 2011.
Bae, I.-J. and Baik, S.: Abnormal Grain Growth of Alumina, J. Am. Ceram. Soc., 80, 1149–1156, https://doi.org/10.1111/j.1151-2916.1997.tb02957.x, 2005.
Baker, I., Cullen, D., and Iliescu, D.: The microstructural location of impurities in ice, Can. J. Phys., 81, 1–9, https://doi.org/10.1139/p03-030, January 2003.
Bestmann, M., Piazolo, S., Spiers, C. J., and Prior, D. J.: Microstructural evolution during initial stages of static recovery and recrystallization: New insights from in-situ heating experiments combined with electron backscatter diffraction analysis, J. Struct. Geol., 27, 447–457, https://doi.org/10.1016/j.jsg.2004.10.006, 2005.
Boneh, Y., Wallis, D., Hansen, L. N., Krawczynski, M. J., and Skemer, P.: Oriented grain growth and modification of “frozen anisotropy” in the lithospheric mantle, Earth Planet. Sc. Lett., 474, 368–374, https://doi.org/10.1016/j.epsl.2017.06.050, 2017.
Bons, P. D., Jessell, M. W., Evans, L., Barr, T., and Stüwe, K.: Modeling of anisotropic grain growth in minerals, Memoir of the Geological Society of America, 193, 39–49, https://doi.org/10.1130/0-8137-1193-2.39, 2001.
Cole, D. M.: Preparation of polycrystalline ice specimens for laboratory experiments, Cold Reg. Sci. Technol., 1, 153–159, https://doi.org/10.1016/0165-232X(79)90007-7, 1979.
Cooper, R. F. and Kohlstedt, D. L.: Sintering of olivine and olivine-basalt aggregates, Phys. Chem. Miner., 11, 5–16, https://doi.org/10.1007/BF00309372, 1984.
Covey-Crump, S. J.: The normal grain growth behaviour of nominally pure calcitic aggregates, Contrib. Mineral. Petr., 129, 239–254, https://doi.org/10.1007/s004100050335, 1997.
Cuffey, K. M. and Paterson, W. S. B.: The Physics of Glaciers, 4th Edn., Butterworth-Heinemann, 1–693, ISBN 9780123694614, 2010.
Davis, P. E. D., Nicholls, K. W., Holland, D. M., Schmidt, B. E., Washam, P., Riverman, K. L., Arthern, R. J., Vaňková, I., Eayrs, C., Smith, J. A., Anker, P. G. D., Mullen, A. D., Dichek, D., Lawrence, J. D., Meister, M. M., Clyne, E., Basinski-Ferris, A., Rignot, E., Queste, B. Y., Boehme, L., Heywood, K. J., Anandakrishnan, S., and Makinson, K.: Suppressed basal melting in the eastern Thwaites Glacier grounding zone, Nature, 614, 479–485, https://doi.org/10.1038/s41586-022-05586-0, 2023.
Doherty, R. D., Hughes, D. A., Humphreys, F. J., Jonas, J. J., Jensen, D. J., Kassner, M. E., King, W. E., McNelley, T. R., McQueen, H. J., and Rollett, A. D.: Current issues in recrystallization: a review, Mater. Sci. Eng. A, 238, 219–274, https://doi.org/10.1016/S0921-5093(97)00424-3, 1997.
Durand, G., Weiss, J., Lipenkov, V., Barnola, J. M., Krinner, G., Parrenin, F., Delmonte, B., Ritz, C., Duval, P., Röthlisberger, R., and Bigler, M.: Effect of impurities on grain growth in cold ice sheets, J. Geophys. Res.-Earth, 111, 1–18, https://doi.org/10.1029/2005JF000320, 2006.
Duval, P.: Grain Growth and Mechanical Behaviour of Polar Ice, Ann. Glaciol., 6, 79–82, https://doi.org/10.3189/1985aog6-1-79-82, 1985.
Duval, P. and Lorius, C.: Crystal size and climatic record down to the last ice age from Antarctic ice, Earth Planet. Sc. Lett., 48, 59–64, https://doi.org/10.1016/0012-821X(80)90170-3, 1980.
Evans, B., Renner, J., and Hirth, G.: A few remarks on the kinetics of static grain growth in rocks, Int. J. Earth Sci., 90, 88–103, https://doi.org/10.1007/s005310000150, 2001.
Fan, S. and Prior, D. J.: “Data for: Grain growth of natural and synthetic ice at 0 ºC”, Mendeley Data [data set], https://doi.org/10.17632/862dcnvzg7.1, 2023.
Fan, S., Hager, T. F., Prior, D. J., Cross, A. J., Goldsby, D. L., Qi, C., Negrini, M., and Wheeler, J.: Temperature and strain controls on ice deformation mechanisms: insights from the microstructures of samples deformed to progressively higher strains at −10, −20 and −30 °C, The Cryosphere, 14, 3875–3905, https://doi.org/10.5194/tc-14-3875-2020, 2020.
Fan, S., Prior, D. J., Hager, T. F., Cross, A. J., Goldsby, D. L., and Negrini, M.: Kinking facilitates grain nucleation and modifies crystallographic preferred orientations during high-stress ice deformation, Earth Planet. Sc. Lett., 572, 117136, https://doi.org/10.1016/j.epsl.2021.117136, 2021a.
Fan, S., Prior, D. J., Cross, A. J., Goldsby, D. L., Hager, T. F., Negrini, M., and Qi, C.: Using grain boundary irregularity to quantify dynamic recrystallization in ice, Acta Mater., 209, 116810, https://doi.org/10.1016/j.actamat.2021.116810, 2021b.
Fan, S., Wheeler, J., Prior, D. J., Negrini, M., Cross, A. J., Hager, T. F., Goldsby, D. L., and Wallis, D.: Using Misorientation and Weighted Burgers Vector Statistics to Understand Intragranular Boundary Development and Grain Boundary Formation at High Temperatures, J. Geophys. Res.-Sol. Ea., 127, e2022JB024497, https://doi.org/10.1029/2022JB024497, 2022.
Faria, S. H., Freitag, J., and Kipfstuhl, S.: Polar ice structure and the integrity of ice-core paleoclimate records, Quaternary Sci. Rev., 29, 338–351, https://doi.org/10.1016/j.quascirev.2009.10.016, 2010.
Faria, S. H., Weikusat, I., and Azuma, N.: The microstructure of polar ice. Part I: Highlights from ice core research, J. Struct. Geol., 61, 2–20, https://doi.org/10.1016/j.jsg.2013.09.010, 2014.
Faul, U. H. and Scott, D.: Grain growth in partially molten olivine aggregates, Contrib. Mineral. Petr., 151, 101–111, https://doi.org/10.1007/s00410-005-0048-1, 2006.
Gerbi, C., Mills, S., Clavette, R., Campbell, S., Bernsen, S., Clemens-Sewall, D., Lee, I., Hawley, R., Kreutz, K., and Hruby, K.: Microstructures in a shear margin: Jarvis Glacier, Alaska, J. Glaciol., 67, 1163–1176, https://doi.org/10.1017/jog.2021.62, 2021.
Gladman, T.: On the theory of the effect of precipitate particles on grain growth in metals, Proc. R. Soc. Lond. A., 294, 298–309, https://doi.org/10.1098/rspa.1966.0208, 1966.
Goldsby, D. L. and Kohlstedt, D. L.: Superplastic deformation of ice: Experimental observations, J. Geophys. Res.-Sol. Ea., 106, 11017–11030, https://doi.org/10.1029/2000jb900336, 2001.
Gow, A. J.: Bubbles and Bubble Pressures in Antarctic Glacier Ice, J. Glaciol., 7, 167–182, https://doi.org/10.3189/s0022143000030975, 1968.
Gow, A. J. and Williamson, T.: Volcanic ash in the Antarctic ice sheet and its possible climatic implications, Earth Planet. Sc. Lett., 13, 210–218, https://doi.org/10.1016/0012-821X(71)90126-9, 1971.
Gow, A. J. and Williamson, T.: Rheological implications of the internal structure and crystal fabrics of the West Antarctic ice sheet as revealed by deep core drilling at Byrd Station, Geol. Soc. Am. Bull., 87, 1665, https://doi.org/10.1130/0016-7606(1976)87<1665:RIOTIS>2.0.CO;2, 1976.
Herwegh, M., Linckens, J., Ebert, A., Berger, A., and Brodhag, S. H.: The role of second phases for controlling microstructural evolution in polymineralic rocks: A review, J. Struct. Geol., 33, 1728–1750, https://doi.org/10.1016/j.jsg.2011.08.011, 2011.
Hillert, M.: On the theory of normal and abnormal grain growth, Acta Metall., 13, 227–238, https://doi.org/10.1016/0001-6160(65)90200-2, 1965.
Hirth, G. and Tullis, J.: Dislocation creep regimes in quartz aggregates, J. Struct. Geol., 14, 145–159, https://doi.org/10.1016/0191-8141(92)90053-Y, 1992.
Hudleston, P. J.: Progressive Deformation and Development of Fabric Across Zones of Shear in Glacial Ice, in: Energetics of Geological Processes, Springer Berlin Heidelberg, Berlin, Heidelberg, 121–150, https://doi.org/10.1007/978-3-642-86574-9_7, 1977.
Humphrey, N. and Echelmeyer, K.: Hot-water drilling and bore-hole closure in cold ice, J. Glaciol., 36, 287–298, https://doi.org/10.3189/002214390793701354, 1990.
Humphreys, F. J., Hatherly, M., and Rollett, A.: Recrystallization and Related Annealing Phenomena, Third Edn., Elsevier Ltd., ISBN: 978-0-08-098235-9, 2017.
Jackson, M.: Dynamics of the Shear Margin of Ice Stream B, West Antarctica, PhD thesis, California Institute of Technology, United States of America, 118 pp., 1999.
Jackson, M. and Kamb, B.: The marginal shear stress of Ice Stream B, West Antarctica, J. Glaciol., 43, 415–426, https://doi.org/10.1017/S0022143000035000, 1997.
Jessell, M. W. and Lister, G. S.: A simulation of the temperature dependence of quartz fabrics, Geol. Soc. Spec. Publ., 54, 353–362, https://doi.org/10.1144/GSL.SP.1990.054.01.31, 1990.
Journaux, B., Chauve, T., Montagnat, M., Tommasi, A., Barou, F., Mainprice, D., and Gest, L.: Recrystallization processes, microstructure and crystallographic preferred orientation evolution in polycrystalline ice during high-temperature simple shear, The Cryosphere, 13, 1495–1511, https://doi.org/10.5194/tc-13-1495-2019, 2019.
Kamb, B.: Basal Zone of the West Antarctic Ice Streams and its Role in Lubrication of Their Rapid Motion, in: Antarctic Research Series, vol. 77, edited by: Alley, R. B. and Bindschadle, R. A., American Geophysical Union, Washington, DC, 157–199, https://doi.org/10.1029/AR077p0157, 2001.
Karato, S.: Grain growth kinetics in olivine aggregates, 255–273 pp., https://doi.org/10.1016/0040-1951(89)90221-7, 1989.
Kilian, R., Heilbronner, R., and Stünitz, H.: Quartz grain size reduction in a granitoid rock and the transition from dislocation to diffusion creep, J. Struct. Geol., 33, 1265–1284, 2011.
Kuiper, E.-J. N., Weikusat, I., de Bresser, J. H. P., Jansen, D., Pennock, G. M., and Drury, M. R.: Using a composite flow law to model deformation in the NEEM deep ice core, Greenland – Part 1: The role of grain size and grain size distribution on deformation of the upper 2207 m, The Cryosphere, 14, 2429–2448, https://doi.org/10.5194/tc-14-2429-2020, 2020.
Montagnat, M., Azuma, N., Dahl-Jensen, D., Eichler, J., Fujita, S., Gillet-Chaulet, F., Kipfstuhl, S., Samyn, D., Svensson, A., and Weikusat, I.: Fabric along the NEEM ice core, Greenland, and its comparison with GRIP and NGRIP ice cores, The Cryosphere, 8, 1129–1138, https://doi.org/10.5194/tc-8-1129-2014, 2014.
Monz, M. E., Hudleston, P. J., Prior, D. J., Michels, Z., Fan, S., Negrini, M., Langhorne, P. J., and Qi, C.: Full crystallographic orientation (c and a axes) of warm, coarse-grained ice in a shear-dominated setting: a case study, Storglaciären, Sweden, The Cryosphere, 15, 303–324, https://doi.org/10.5194/tc-15-303-2021, 2021.
Oerter, H., Drücker, C., Kipfstuhl, S., and Wilhelms, F.: Kohnen station – the drilling camp for the EPICA deep ice core in Dronning Maud Land, Polarforschung, 89, 1–23, 2009.
Piazolo, S., Bestmann, M., Prior, D. J., and Spiers, C. J.: Temperature dependent grain boundary migration in deformed-then-annealed material: Observations from experimentally deformed synthetic rocksalt, Tectonophysics, 427, 55–71, https://doi.org/10.1016/j.tecto.2006.06.007, 2006.
Prior, D. J., Lilly, K., Seidemann, M., Vaughan, M., Becroft, L., Easingwood, R., Diebold, S., Obbard, R., Daghlian, C., Baker, I., Caswell, T., Golding, N., Goldsby, D., Durham, W. B., Piazolo, S., and Wilson, C. J. L.: Making EBSD on water ice routine, J. Microsc., 259, 237–256, https://doi.org/10.1111/jmi.12258, 2015.
Pritchard, H. D., Ligtenberg, S. R. M., Fricker, H. A., Vaughan, D. G., Van Den Broeke, M. R., and Padman, L.: Antarctic ice-sheet loss driven by basal melting of ice shelves, Nature, 484, 502–505, https://doi.org/10.1038/nature10968, 2012.
Ranganathan, M., Minchew, B., Meyer, C. R., and Peč, M.: Recrystallization of ice enhances the creep and vulnerability to fracture of ice shelves, Earth Planet. Sc. Lett., 576, 117219, https://doi.org/10.1016/j.epsl.2021.117219, 2021.
Roessiger, J., Bons, P. D., and Faria, S. H.: Influence of bubbles on grain growth in ice, J. Struct. Geol., 61, 123–132, https://doi.org/10.1016/j.jsg.2012.11.003, 2014.
Rollett, A. D. and Mullins, W. W.: On the growth of abnormal grains, Scr. Mater., 36, 975–980, https://doi.org/10.1016/S1359-6462(96)00501-5, 1997.
Schmatz, J.: Grain-Boundary – Fluid Inclusion Interaction in Rocks and Analogues, PhD thesis, Westfälischen Technischen Hochschule Aachen, Germany, 130 pp., 2010.
Schmidt, B. E., Washam, P., Davis, P. E. D., Nicholls, K. W., Holland, D. M., Lawrence, J. D., Riverman, K. L., Smith, J. A., Spears, A., Dichek, D. J. G., Mullen, A. D., Clyne, E., Yeager, B., Anker, P., Meister, M. R., Hurwitz, B. C., Quartini, E. S., Bryson, F. E., Basinski-Ferris, A., Thomas, C., Wake, J., Vaughan, D. G., Anandakrishnan, S., Rignot, E., Paden, J., and Makinson, K.: Heterogeneous melting near the Thwaites Glacier grounding line, Nature, 614, 471–478, https://doi.org/10.1038/s41586-022-05691-0, 2023.
Schodlok, M. P., Menemenlis, D., and Rignot, E. J.: Ice shelf basal melt rates around Antarctica from simulations and observations, J. Geophys. Res.-Oceans, 121, 1085–1109, https://doi.org/10.1002/2015JC011117, 2016.
Schoof, C.: On the mechanics of ice-stream shear margins, J. Glaciol., 50, 208–218, https://doi.org/10.3189/172756504781830024, 2004.
Shewmon, P. G.: The movement of small inclusions in solids by a temperature gradient, T. Metall. Soc. AIME, 230, 1134–1137, 1964.
Skemer, P., Katayama, I., Jiang, Z., and Karato, S. I.: The misorientation index: Development of a new method for calculating the strength of lattice-preferred orientation, Tectonophysics, 411, 157–167, https://doi.org/10.1016/j.tecto.2005.08.023, 2005.
Srolovitz, D. J., Grest, G. S., and Anderson, M. P.: Computer simulation of grain growth – V. Abnormal grain growth, Acta Metall., 33, 2233–2247, https://doi.org/10.1016/0001-6160(85)90185-3, 1985.
Stern, L. A., Durham, W. B., and Kirby, S. H.: Grain-size-induced weakening of H2O ices I and II and associated anisotropic recrystallization, J. Geophys. Res.-Sol. Ea., 102, 5313–5325, https://doi.org/10.1029/96JB03894, 1997.
Stoll, N., Eichler, J., Hörhold, M., Erhardt, T., Jensen, C., and Weikusat, I.: Microstructure, micro-inclusions, and mineralogy along the EGRIP ice core – Part 1: Localisation of inclusions and deformation patterns, The Cryosphere, 15, 5717–5737, https://doi.org/10.5194/tc-15-5717-2021, 2021.
Svensson, A., Nielsen, S. W., Kipfstuhl, S., Johnsen, S. J., Steffensen, J. P., Bigler, M., Ruth, U., and Röthlisberger, R.: Visual stratigraphy of the North Greenland Ice Core Project (NorthGRIP) ice core during the last glacial period, J. Geophys. Res.-Atmos., 110, 1–11, https://doi.org/10.1029/2004JD005134, 2005.
Taylor, P. L.: A hot water drill for temperate ice, in: CRREL Special Report 84–34, 105–117, 1984.
Thomas, R. E., Negrini, M., Prior, D. J., Mulvaney, R., Still, H., Bowman, H., Craw, L., Fan, S., Hubbard, B., Hulbe, C. L., Kim, D., and Lutz, F.: Microstructure and crystallographic preferred orientations of an azimuthally oriented ice core from a lateral shear margin: Priestley Glacier, Antarctica, Front. Earth Sci., 9, 1–22, https://doi.org/10.3389/feart.2021.702213, 2021.
Thorsteinsson, T., Kipfstuhl, J., and Miller, H.: Textures and fabrics in the GRIP ice core, J. Geophys. Res., 102, 26583–26599, 1997.
Vaughan, M. J., Prior, D. J., Jefferd, M., Brantut, N., Mitchell, T. M., and Seidemann, M.: Insights into anisotropy development and weakening of ice from in situ P wave velocity monitoring during laboratory creep, J. Geophys. Res. -Sol. Ea., 122, 7076–7089, https://doi.org/10.1002/2017JB013964, 2017.
Weikusat, I., Kuiper, E.-J. N., Pennock, G. M., Kipfstuhl, S., and Drury, M. R.: EBSD analysis of subgrain boundaries and dislocation slip systems in Antarctic and Greenland ice, Solid Earth, 8, 883–898, https://doi.org/10.5194/se-8-883-2017, 2017a.
Weikusat, I., Jansen, D., Binder, T., Eichler, J., Faria, S. H., Wilhelms, F., Kipfstuhl, S., Sheldon, S., Miller, H., Dahl-Jensen, D., and Kleiner, T.: Physical analysis of an Antarctic ice core-towards an integration of micro-and macrodynamics of polar ice, Philos. T. Roy. Soc. A, 375, 20150347, https://doi.org/10.1098/rsta.2015.0347, 2017b.
Wilson, C. J. L.: Texture and Grain Growth During the Annealing of Ice, Textures Microstruct, 5, 19–31, https://doi.org/10.1155/tsm.5.19, 1982.
Wilson, C. J. L., Peternell, M., Piazolo, S., and Luzin, V.: Microstructure and fabric development in ice: Lessons learned from in situ experiments and implications for understanding rock evolution, J. Struct. Geol., 61, 50–77, https://doi.org/10.1016/j.jsg.2013.05.006, 2014.