the Creative Commons Attribution 4.0 License.
the Creative Commons Attribution 4.0 License.
 | 08 Aug 2023
Environmental spaces for palsas and peat plateaus are disappearing at a circumpolar scale
Olli Karjalainen
Juha Aalto
Miska Luoto
Jan Hjort
Anthropogenic climate change threatens northern permafrost environments. This compromises the existence of permafrost landforms, such as palsas and peat plateaus, which have been assessed to be critically endangered habitats. In this study, we integrated geospatial datasets and statistical methods to model the suitable environments for palsas and peat plateaus across the Northern Hemisphere permafrost region. The models were calibrated using data from years 1950–2000. The effects of climate change on the suitable environments for the landforms were assessed by using low-, moderate-, and high-emissions scenarios (Representative Concentration Pathway climate scenarios: RCP2.6, RCP4.5, and RCP8.5, respectively) for two periods (2041–2060 and 2061–2080). Hotspots for palsa and peat plateau environments occurred in northern Europe, western Siberia, and subarctic Canada. Climate change was predicted to cause an almost complete loss (decrease of 98.2 %) of suitable environmental spaces under the high-emissions scenario by 2061–2080, while under low- and moderate-emissions scenarios the predicted loss was 76.3 % and 89.3 % respectively. Our modeling results are in line with previously published thermokarst data pointing out areas of recent degradation of palsa and peat plateau environments. Our results provide new insights into the distribution of the permafrost landforms in less studied areas such as central and eastern Siberia. In addition, the predictions provide new understanding of the changing geoecological conditions of the circumpolar region with important implications for greenhouse gas emissions.
- Article
(9007 KB) - Full-text XML
-
Supplement
(1617 KB) - BibTeX
- EndNote


Northern environments are heavily affected by climate change (IPCC, 2021). Because of Arctic amplification these environments are warming 2 to 3 times as fast as the global average (You et al., 2021). As climate changes, permafrost (defined as ground with a temperature of 0 ∘C or below, for at least 2 consecutive years; Muller, 1943) is projected to thaw from extensive areas (Wang et al., 2022), and distinctive permafrost processes and related landforms are threatened (e.g., Liljedahl et al., 2016; Aalto et al., 2017; Borge et al., 2017; Karjalainen et al., 2020). Palsas and peat plateaus are peat hummocks with permafrost cores, which can be primarily found in regions of sporadic and discontinuous permafrost (Seppälä, 1988). They mainly differ in their extent and height (Zoltai and Tarnocai, 1971). The height of palsas varies between 0.5–10 m, and their diameter exceeds 2 m (Washburn, 1983; Pissart, 2002). Peat plateaus have a greater extent, even over 1 km2, but are usually elevated from their surroundings by about 1 m (Kershaw and Gill, 1979; Zoltai, 1972). Palsas and peat plateaus are not clearly distinguishable from each other, and many transitional types between these landforms are found. Peat plateaus can be considered as a morphological class of palsas, so-called palsa plateaus (e.g., Åhman, 1977; Seppälä, 1988).
According to Hugelius et al. (2020) nearly half of the peatlands of the Northern Hemisphere, including palsa mires and peat plateaus, contain permafrost. Previous studies have shown that most palsas were formed in a considerably colder climate than present (Halsey et al., 1995; Treat et al., 2016a; Vorren, 2017; Fewster et al., 2020). Thus, these landforms are highly sensitive to further changes in climate, and many studies have reported rapid degradation of them (e.g., Borge et al., 2017; Mamet et al., 2017; Olvmo et al., 2020). As permafrost thaws from peatlands, changes in greenhouse gas fluxes are expected (Turetsky et al., 2020; Miner et al., 2022). Increasing CO2, CH4, and N2O emissions further accelerate climate change (Marushchak et al., 2011; Schuur et al., 2015; Hugelius et al., 2020).
Palsas and peat plateaus have an important role in the bio- and geodiversity of northern environments. Peat-controlled permafrost hummocks create topographical and hydrological variability (Seppälä, 1988; Beilman, 2001), resulting different microhabitats for many animal and plant species (Luoto et al., 2004a). For example, palsa mires are well known for their rich bird life (Järvinen and Sammalisto, 1976; CAFF, 2001). Permafrost thaw leads to the collapse of palsas and peat plateaus (Seppälä, 1982, 2006), changes in vegetation (e.g., Malmer et al., 2005; Johansson et al., 2006; Normand et al., 2017), and overall homogenization of peatlands (Swindles et al., 2016). This can lead to changes in bird and invertebrate species composition and affect the functioning of the peatland ecosystem (Luoto et al., 2004a; Markkula, 2014). The European Union classified palsas as critically endangered habitats in 2016, mainly because of the degradation of permafrost (Janssen et al., 2016).
Palsas and peat plateaus in northern Europe are relatively well mapped and studied (e.g., Backe, 2014; Ottósson et al., 2016; Ruuhijärvi et al., 2022). There are mapping and monitoring studies conducted also in Canada (e.g., Zoltai et al., 2000; Tam et al., 2014; Mamet et al., 2017) and in the western parts of Russian (e.g., Barcan, 2010; Kirpotin et al., 2011; Terentieva et al., 2016). However, only a few studies of palsas and peat plateaus are available for central and eastern Siberia (Vasil'chuk et al., 2013a, b, 2014). The distribution of these landforms has been previously modeled mainly at local and regional scales in northern Fennoscandia (e.g., Luoto et al., 2004b; Fronzek et al., 2006, 2011; Aalto et al., 2017) but recently also in western Siberia (Fewster et al., 2022), as well as at a continental scale in North America (Fewster et al., 2020). Previous studies have shown that palsas and peat plateaus require specific climatic conditions (e.g., Luoto et al., 2004b; Parviainen and Luoto, 2007; Aalto et al., 2017; Fewster et al., 2020, 2022). Besides air temperature and precipitation, wind patterns, vegetation, snow depth, topography, and soil properties also affect their distribution (Seppälä, 2011). Especially, the role of sufficient peat cover is crucial in marginal permafrost regions, as the thermal properties of peat protect frozen cores against thawing (Kujala et al., 2008).
In this study, we provide the first predictions of suitable environmental spaces for palsas and peat plateaus over the entire northern circumpolar region. As the explored landforms are not found in the Southern Hemisphere (Seppälä, 2011), this study covers a major part of global palsas and peat plateau environments. Our aim is to predict the suitable environmental spaces for these landforms in a recent (1950–2000) and in two future periods (2041–2060 and 2061–2080), using three Representative Concentration Pathway climate scenarios (RCP2.6, RCP4.5 and RCP8.5). Moreover, we compare our predictions with the thermokarst model produced by Olefeldt et al. (2016a). The purpose of the comparison is to assess the consistency of our future predictions as palsas and peat plateaus form thermokarst ponds when ice-rich permafrost thaws (e.g., Seppälä, 2011). Consequently, regions with high thermokarst coverage can be assumed to indicate degradation of palsas and peat plateaus. We aim to answer the following research questions.
-
What are the suitable environmental spaces for palsas and peat plateaus in the northern circumpolar permafrost region?
-
How are the suitable environmental spaces for palsas and peat plateaus changing in the future?
-
Are the changes in suitable environmental spaces for palsas and peat plateaus spatially consistent with observed and predicted thermokarst landscapes?
To address these questions, we used extensive observational data on landform occurrences and high-resolution geospatial data on environmental conditions to predict the suitable environmental spaces with four different statistical modeling methods and their ensemble. Because of the uneven distribution of the landform observations, our results for central and eastern Siberia are extrapolations of models fitted to other parts of the Northern Hemisphere. By extrapolating the models to central and eastern Siberia, our results offer new insights into the circumpolar distribution of suitable environments for palsas and peat plateaus, especially in these poorly mapped regions. Moreover, changes in the studied landforms can be used as an indicator of the state of sporadic and discontinuous permafrost (Lagarec, 1982; Sollid and Sørbel, 1998). The thermal state of permafrost is an important factor affecting the integrity of arctic transportation and industrial infrastructure (Hjort et al., 2022), release of greenhouse gases (Miner et al., 2022), and ecosystem stability (Goetz et al., 2007; Sim et al., 2021; Magnan et al., 2022). Moreover, future predictions of endangered landforms and habitats can be helpful in conservation actions for different plant and animal species.
2.1 Palsa and peat plateau observations
Observations of palsas and peat plateaus (Fig. 1a) were mainly collected from available inventories and published studies. In the Scopus and Google Scholar literature search we used search terms “palsa”, “peat plateau”, and “permafrost peatland” combined with state, province, or region names (e.g., “Sweden”, “Yukon”, and “western Siberia”) (see Fewster et al., 2022). Additional observations from less studied areas were compiled from published reports, web pages, and Google Earth Pro (version 7.3) and Esri's ArcGIS Pro (version 2.9.32739) satellite images (the list of used references is provided in the Supplement).
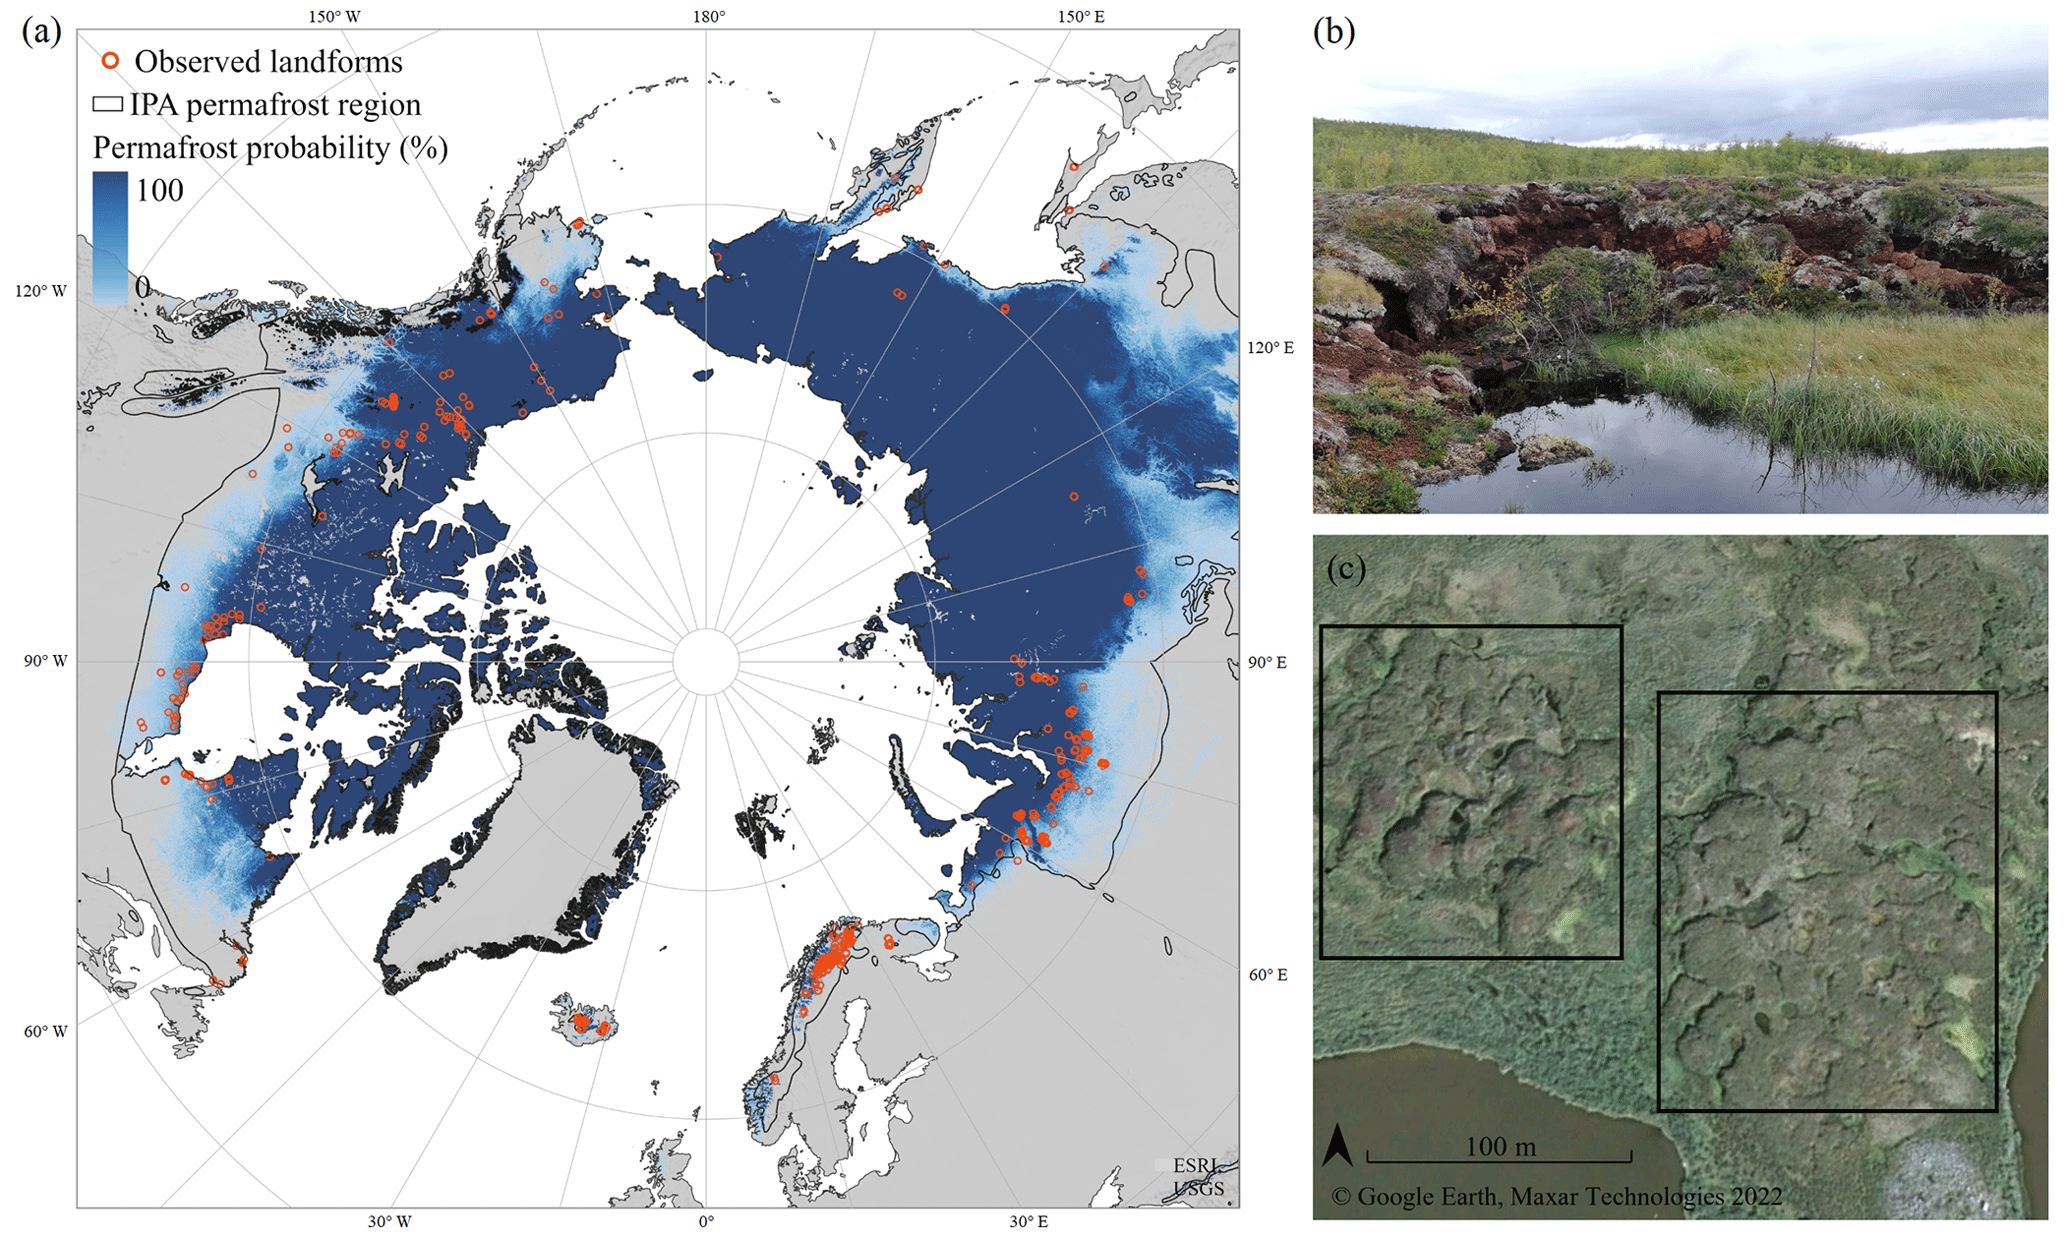
Figure 1(a) Distribution of the observed palsas and peat plateaus (N=961) across the Northern Hemisphere, the probability of the permafrost occurrence (%, Ran et al., 2022), and International Permafrost Association (IPA) permafrost region (Brown et al., 1997). (b) A thawing palsa in Kilpisjärvi, Finland, and (c) satellite image of a palsa mire northeast of Kiruna, Sweden (68∘28′36.0′′ N, 20∘55′06.0′′ E); groups of palsas are delimited by black rectangles.
Palsa observations were limited to true palsas (Fig. 1b) based on the overall description of the landform provided in the used literature or a comprehensive interpretation of the satellite images (based on the size, form, and location of the landform and its surroundings for example). Palsa-like formations and “lithalsas” (so-called mineral palsas) were excluded, because of the lack of substantial peat cover on these landforms (Pissart, 2002). Pingos were also considered genetically distinctive from palsas and thus were not included (see, e.g., Grosse and Jones, 2011; French, 2017). Additional exclusions were made in cases where a landform was called palsa, but the source clearly stated that no peat was present at the study site. In this study, peat plateaus were considered as palsa plateaus, instead of distinguishing these two landforms from each other (Zoltai and Tarnocai, 1975; Kershaw and Gill, 1979; Seppälä, 1988; see also Fewster et al., 2020, 2022). All compiled observations were verified by using satellite imagery in Google Earth Pro and Esri's ArcGIS Pro (Fig. 1c). The final modeling data consisted of 961 grid cells (30 arcsec resolution, ∼1 km) occupied by palsas or peat plateaus.
Statistical distribution modeling often requires absence observations (i.e., presence–absence data) (Brotons et al., 2004; Elith et al., 2006; Zhao et al., 2020). A random sample of 2000 grid cells from areas north of latitude 40∘ N was taken to compile an absence dataset. All the grid cells were checked using satellite images to ensure that there were no palsas or peat plateaus in the absence grid cells (“true absence”). In total 1496 absence observations were compiled as 504 grid cells were excluded owing to the coarse resolution of satellite images, cloud cover obscuring the view, or the cell occurring in a water body. The same person (Ooona Leppiniemi) collected and validated both presence and absence datasets.
Compiled data were further split into model calibration (N=2057) and evaluation (N=400) sets. These sample sizes are expected to be large enough to give robust predictions in geomorphological distribution modeling (see Hjort and Marmion, 2008). The separate evaluation dataset was formed by drawing a random sample from the whole data. The random sample was taken separately from presence and absence observations to retain the same relative portion (i.e., prevalence) with the original dataset (ca. 40 % presence and 60 % absence observations) (Hjort and Luoto, 2013). In order to avoid oversampling observations from data-rich regions and underrepresenting data-poor regions, the random sample for evaluation data was taken so that observations were located at least 50 km from each other. Because of this criterion, two absence observations had to be removed from the evaluation data (final N=398).
2.2 Environmental data
In this study, we used various geospatial datasets at a 30 arcsec (ca. 1 km) spatial resolution to describe the climate, soil properties, and topographical variation relevant to palsa mires and peat plateaus. Freezing and thawing degree days (FDD and TDD, ∘C days) were computed to describe seasonal air temperature conditions. Moreover, we used a bioclimatic variable (Bio7 in WorldClim v1.4), which describes the range of annual air temperature (Temp.range, ∘C, i.e., continentality) by subtracting the minimum temperature of coldest month from the maximum temperature of the warmest month, using the global circulation models (GCMs) available in WorldClim v1.4. Precipitation conditions were considered by calculating sums of liquid (rainfall, mm) and solid (snowfall, mm) precipitation. Snowfall was defined as the sum of precipitation for months with average air temperature below 0 ∘C and rainfall for months with average air temperature over 0 ∘C (Aalto et al., 2018).
All the environmental variables (hereafter variables) were computed separately for different time periods and RCP scenarios, using the WorldClim v1.4 data at 30 arcsec resolution (Hijmans et al., 2005). For these data, the baseline period is 1950–2000, which aligns well with the observations in our presence data. The use of a recent climate period instead of the current one better acknowledges the possibility that the compiled landform observations are representing the conditions of past climate. For the climate change scenarios, we used the low-emissions scenario (RCP2.6), the moderate-emissions scenario (RCP4.5), and the high-emissions scenario (RCP8.5), as well as two future periods (2041–2060 and 2061–2080). Climate change projections included in the WorldClim v1.4 database (Hijmans et al., 2005) were derived from an ensemble of 18 global climate models (Taylor et al., 2012).
Variables to describe the surficial soil conditions (≤2 m depth) were obtained from the SoilGrids250m 2.0 database (Poggio et al., 2021). It is noteworthy that the SoilGrids data layers have been produced using a relatively small amount of data from some permafrost regions, especially central Siberia and high-Arctic Canada, which may affect the accuracy of data in these regions, especially at finer resolution. SoilGrids were used as alternative soil data were not available in the used (30 arcsec) resolution, and we considered it necessary to account for soil properties, especially soil organic carbon (SOC), which are essential to palsa and peat plateau formation. Here, the SoilGrids variables at the spatial resolution of 7.5 arcsec (∼250 m) were aggregated to the 30 arcsec resolution using bilinear interpolation in ArcGIS Pro. Owing to the lack of high-resolution peat thickness data we used SOC (g kg−1) as a proxy for the thickness of the peat layer. In addition to SOC, we used silt content (Silt, g kg−1) and the probability of bedrock within 2 m from the ground surface (Bedrock, %, Shangguan et al., 2017) to describe the texture and thickness of the soil layer. The topographic wetness index (TWI) (Böhner and Selige, 2006) was calculated using the Global Multi-resolution Terrain Elevation Data 2010 (GMTED2010) (Danielson and Gesch, 2011) dataset to characterize the accumulation potential of ground moisture. The grid-cell-wise values from each variable were extracted for the presence–absence observations. If no value from an environmental variable was available at the presence or absence location (109 cases), the value was extracted from the neighboring grid cell. If none of the neighboring grid cells had the missing value, the observation was removed from the dataset. Bivariate correlations between variables were also calculated by using Spearman's correlation (see Fig. S1).
We compared our predictions to a circumpolar thermokarst dataset by Olefeldt et al. (2016a). Their prediction of thermokarst coverage is based on six environmental variables including the permafrost zonation, ground ice content, thickness of the sedimentary overburden, ecoregion, and ruggedness of the topography. These variables were not utilized in our study, and thus our analyses can be considered independent. The dataset includes different types of thermokarst landscapes and their areal coverage likelihoods classified into five classes, ranging from none (0 %–1 %) to very high (60 %–100 %). We utilized wetland and lake thermokarst likelihoods as these types can be assumed to be present in degrading palsa mires (Luoto and Seppälä, 2003; Olefeldt et al., 2016a). Regions predicted to become unsuitable for palsas and peat plateaus in future scenarios should have higher thermokarst coverage than persisting suitable environments.
In addition, we spatially compared our predictions to four peatland datasets (Treat et al., 2016b; Xu et al., 2018; Hugelius et al., 2020; Olefeldt et al., 2021a) and two suitable climate spaces to further assess our results. Comparison with the peatland datasets was conducted to examine how well our predictions coincide with the distribution of peatlands, whereas the suitable climate spaces were estimated to recognize the suitable peatlands (i.e., in less studied parts of Siberia). The suitable climate spaces, based on FDD and TDD values, were estimated by a literature review (see, e.g., Seppälä and Hassinen, 1997; Luoto et al., 2004b; Aalto and Luoto, 2014; Fewster et al., 2020) and by interpreting results from regional palsa analyses (results not shown). The first classification (FDD: 1500–4500; TDD: 500–1500) is the stricter interpretation of the suitable climate space, and the second (FDD <5000, and TDD <2000) is a more liberal one.
2.3 Statistical modeling
Statistical modeling was conducted using the biomod2 (version 3.5.1; Thuiller et al., 2021) package in R (version 4.1.3; R Core Team, 2022). We used four methods which have been previously used in distribution modeling of periglacial landforms and processes (e.g., Aalto et al., 2014, 2017; Rudy et al., 2016; Karjalainen et al., 2020) and other permafrost characteristics, such as soil organic carbon content (Siewert, 2018; Mishra et al., 2021). The used methods were the generalized linear model (GLM, Nelder and Wedderburn, 1972), generalized additive model (GAM, Hastie and Tibshirani, 1986), generalized boosted model (GBM, Elith et al., 2008), and random forest (RF, Elith et al., 2005). Multiple modeling techniques were utilized in order to acknowledge the uncertainties associated with individual modeling methods (see Thuiller et al., 2009) and to select the one with the highest model performance. In addition, we built an ensemble based on the former methods to find out whether it outperforms the individual modeling techniques in the distribution modeling of suitable environments for palsas and peat plateaus. The ensemble approach has been utilized previously, for example, to predict ground temperature (Aalto et al., 2018), soil hydrology (Cisty et al., 2014), distribution of plants species (Rissanen et al., 2021), and other periglacial landforms (Karjalainen et al., 2020).
GLMs and their semiparametric extensions GAMs are popular in statistical modeling because they are relatively easy to use and can be utilized for different types of datasets (Hjort and Luoto, 2013). In the calibration of a GLM, each explanatory variable including its quadratic terms were inserted into the model to take possible curvilinear relationships into account. Variables for the final GLM were selected in a stepwise fashion using the Bayesian information criteria (BIC, Schwarz, 1978) to find the balance between model complexity and performance. In GAMs we used the generalized cross-validation to optimize limit the degrees of freedom with initial values set to 3 to avoid overfitting. Interaction terms between environmental variables were not included in the GLM or GAM.
The GBM and RF are machine learning methods which build regression and/or classification trees to obtain robust estimates of the response (Thuiller et al., 2010). These methods include interactions between environmental variables and address potential overfitting (Elith et al., 2005). Here, we used the following parameters for the GBM models: number of trees = 8150, bag fraction = 0.5, interaction depth = 5, and shrinkage = 0.0038. For RF models we fitted 500 trees at maximum with a node size of 5. Three randomly selected variables were used at each split of a classification tree to assign observations to the nodes.
We performed 100 iterations with random sampling of calibration data for each modeling method and built an ensemble of the produced models at each round by averaging the four modeling algorithms. Moreover, the performed 100-fold random sampling of modeling data allowed us to provide uncertainty measures (standard deviation) for the predicted probability values. Because of the uneven distribution of the landform observations, our results for central and eastern Siberia should be interpreted as an extrapolation of the model fitted for other parts of the Northern Hemisphere.
Future predictions were performed by using the BIOMOD_Projection function in biomod2 (Thuiller et al., 2021; see Karjalainen et al., 2020). Here, the models calibrated for the recent period (1950–2000) were used to predict future suitable conditions by substituting the climate variables with future climatologies (Hijmans et al., 2005). Predictions were performed for each RCP scenario (2.6, 4.5 and 8.5) and future period (2041–2060 and 2061–2080). Predictions were extracted to the current extent of the suitable environments because we did not consider it temporally plausible for new palsas and peat plateaus to develop in the region of continuous permafrost during the 21st century.
Finally, the predicted probability surfaces for suitable environments were classified to binary distribution maps, which were then used to calculate the areas of the suitable environmental spaces. The classification was performed by the true skill statistic (TSS) cut-off values that were estimated during each model run. From these cut-off values (100 model runs per method) the average cut-off value was computed and used for classification. Used cut-off values are presented in the Supplement (Table S1). Average variable importance (VI) values (Breiman, 2001; Fisher et al., 2019) were calculated from the results of 100 modeling runs in order to analyze the contribution of each variable to the models. In VI computation, the values of one variable in its turn are shuffled (i.e., a random sample is drawn from the values recorded at the modeling data grid cells), while the other variables are fixed to their mean values. Then, model predictions are produced by using these variables. Finally, VI is derived from the Pearson correlation between the predictions from the initial models (with all variables having their recorded values) and from the models including the shuffled variable with the following Eq. (1) (Thuiller et al., 2009):
The closer a VI is to 1, the larger the influence of a given variable (Thuiller et al., 2021).
Calibrated models were evaluated in two ways (Araújo et al., 2005). First, 100-fold cross-validation was performed with the calibration data. At each validation run a random sample of 70 % (N=1440) of observations was used to calibrate models and the remaining 30 % (N=617) was used to validate them. Secondly, semi-independent evaluation was conducted by using the separate evaluation data (N=398), which was set aside before model calibration (as described in the Sect. 2.1). Performance of the models was evaluated with two prevalence-independent statistical measures of classification accuracy, area under the receiving operating characteristic curve (AUC), and TSS (Allouche et al., 2006). The AUC and TSS take into account both sensitivity and specificity the of the model (Allouche et al., 2006). AUC values range between 0–1, and models with AUC values >0.5 are considered to predict the distribution better than at random. AUC values of 0.7–0.8 are usually interpreted as acceptable, values of 0.8–0.9 as excellent, and values >0.9 as outstanding (Hosmer and Lemeshow, 2000; Mandrekar, 2010). TSS values range from −1 to 1, where value 1 indicates perfect agreement. If a TSS value is ≤0, model performance is no better than at random (Allouche et al., 2006). The TSS is interpreted in the same manner as Cohen's kappa, and, for example, 0.6–0.79 can be considered as moderate model performance, 0.8–0.9 as a strong model, and >0.9 as almost perfect model performance (Landis and Koch, 1977; Allouche et al., 2006). Model reliability was also evaluated spatially by exploring the modeling agreement between four independent modeling methods (Luoto et al., 2010) and by the comparison of our predictions and the four peatland datasets (Treat et al., 2016b; Xu et al., 2018; Hugelius et al., 2020; Olefeldt et al., 2021a).
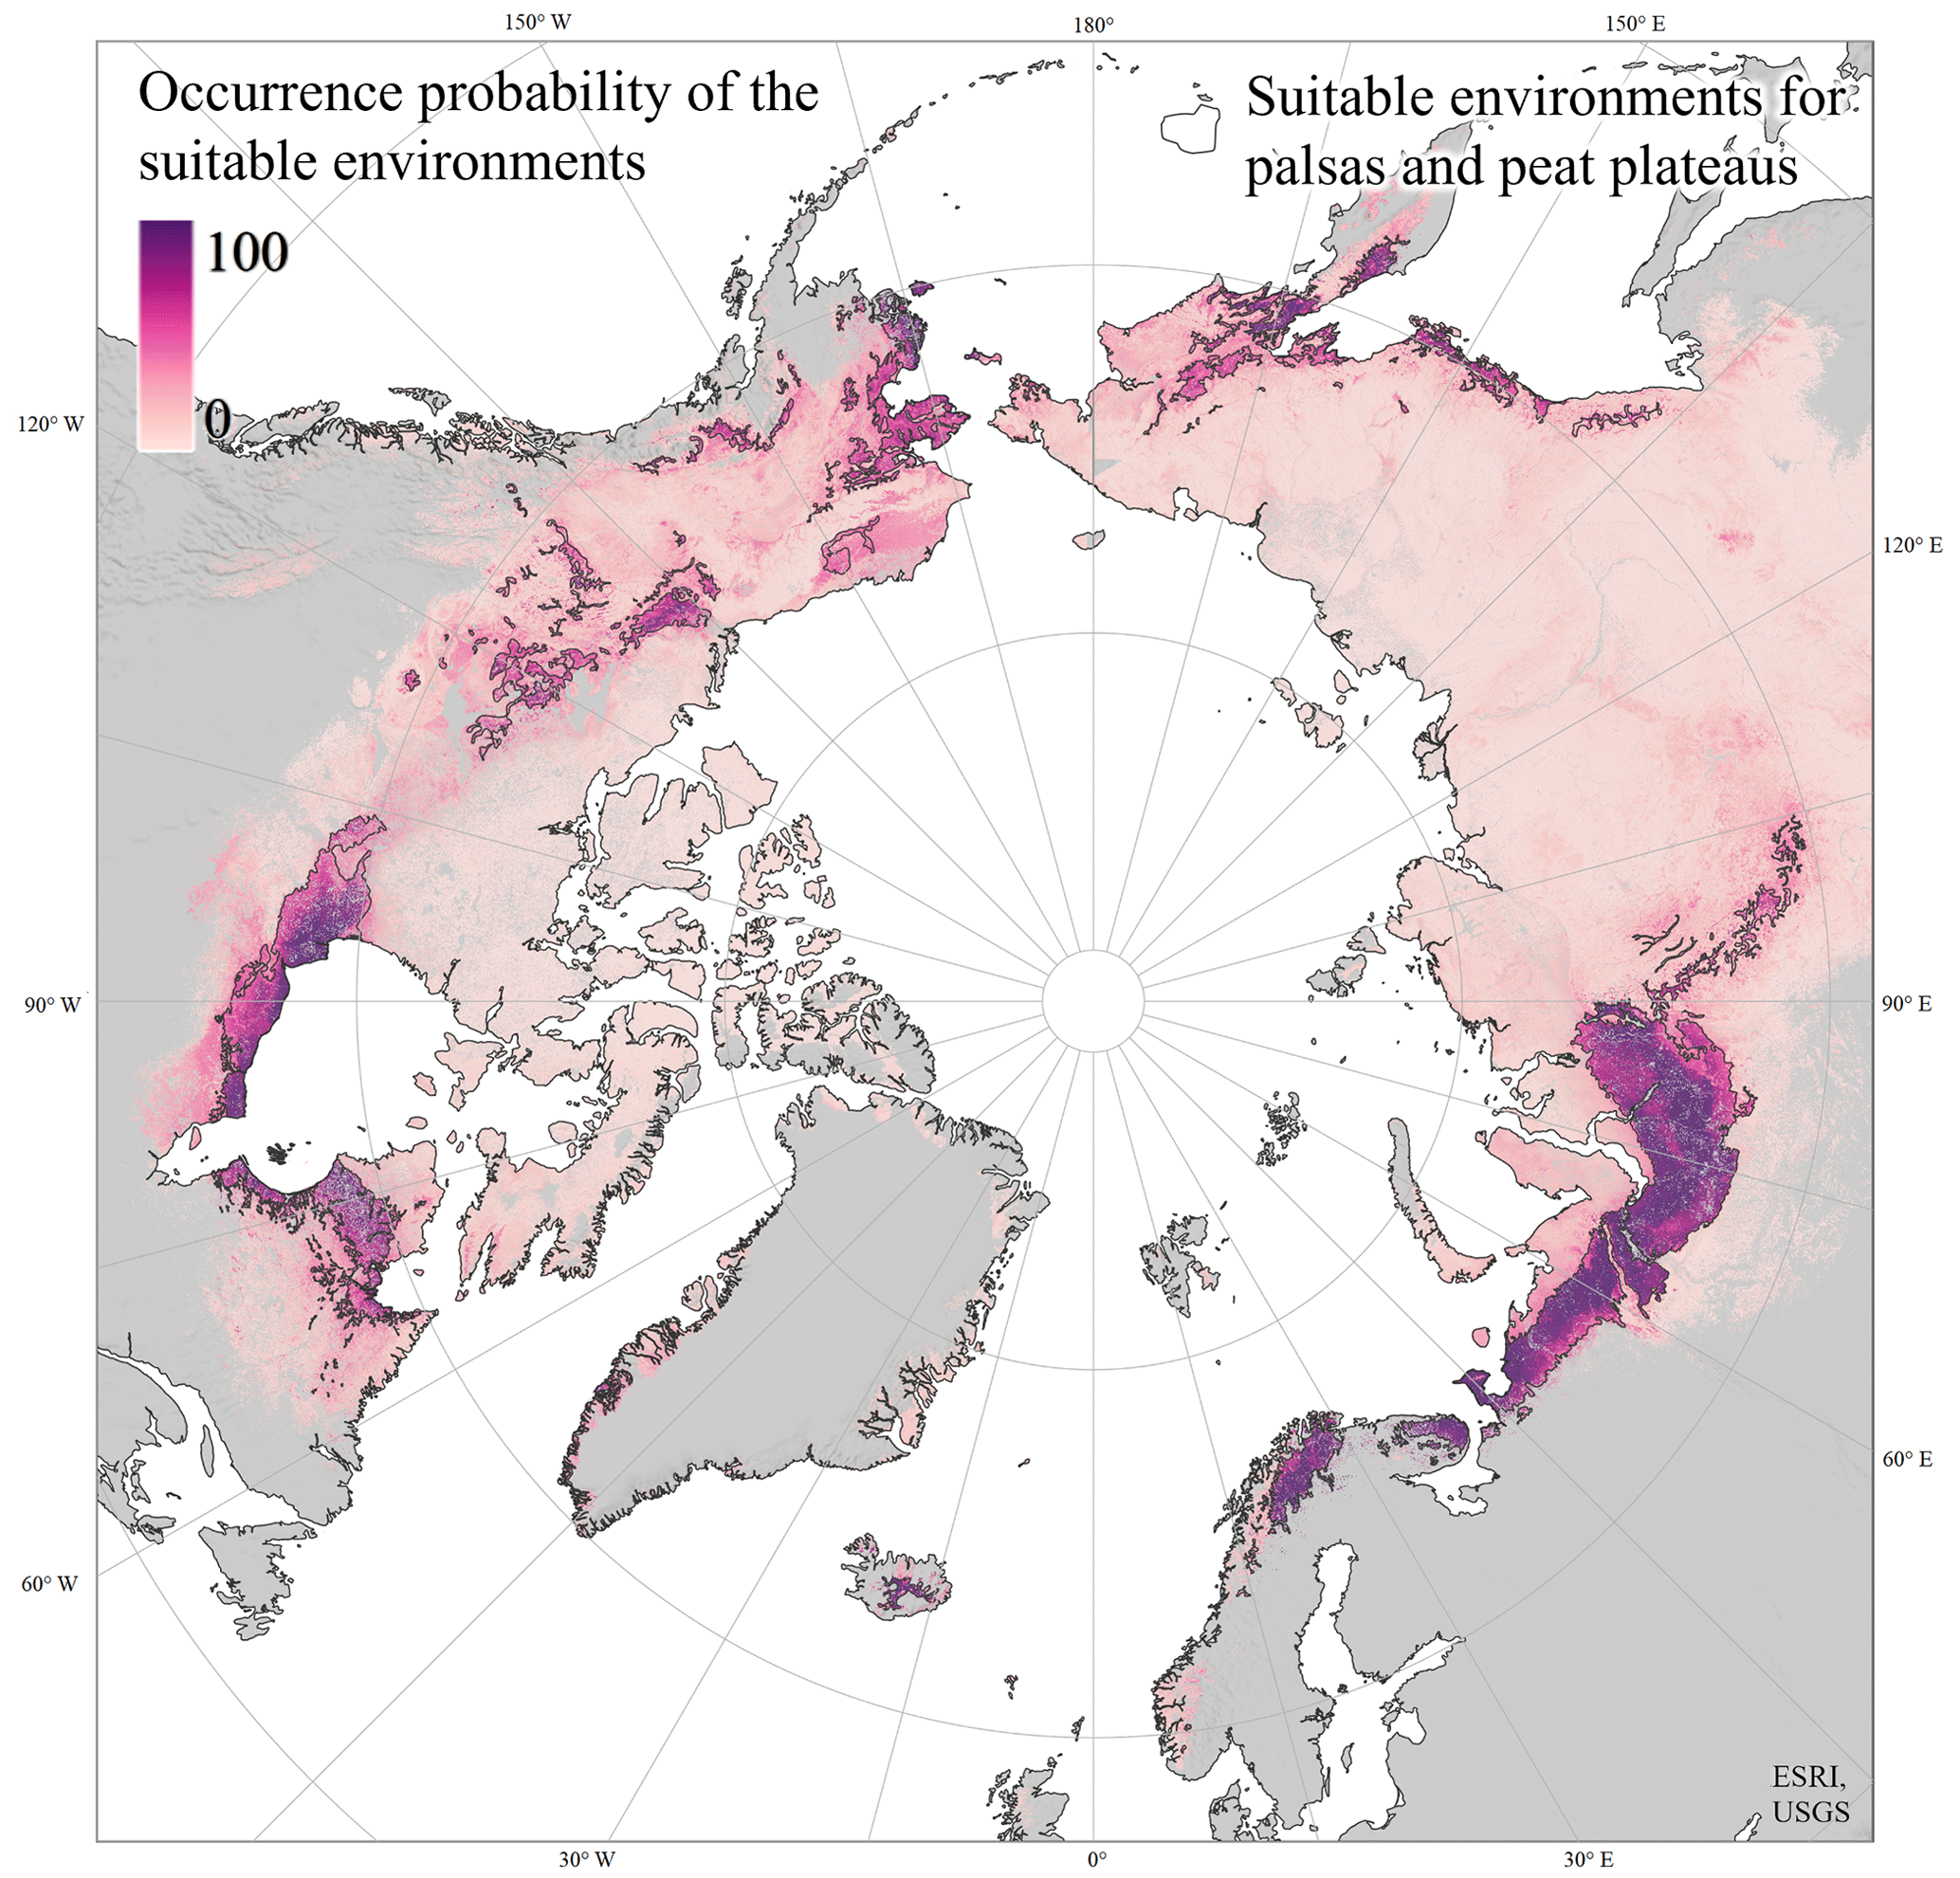
Figure 2The probability (%) of the suitable environments for palsas and peat plateaus illustrated with a color gradient from light pink to dark purple based on random forest results and provided for the permafrost region (Ran et al., 2022). Black outlines delineate the palsa and peat plateau domain, and gray color illustrates areas outside the permafrost region and glaciers.
3.1 Suitable environments in recent conditions
The presented results are based on the random forest (RF) models, which yielded the highest evaluation statistics among the used methods (see Sect. 3.4). The RF model for the recent period of 1950–2000 predicted suitable environmental conditions for an area of 1.58 ×10⁶ km2. The largest continuous suitable environments were located in western Siberia, in Canada around the Hudson Bay and Quebec, and in northern Fennoscandia (Figs. 2, S2, S3). These regions and Iceland had the highest landform occurrence probabilities with only little spatial variation. Other environments with high landform occurrence probabilities were found in the Northwest Territories of Canada, the west coast of Alaska, and the Russian Far East. The probability of palsa and peat plateau occurrence decreased relatively sharply outside the most suitable environments (Fig. 2).
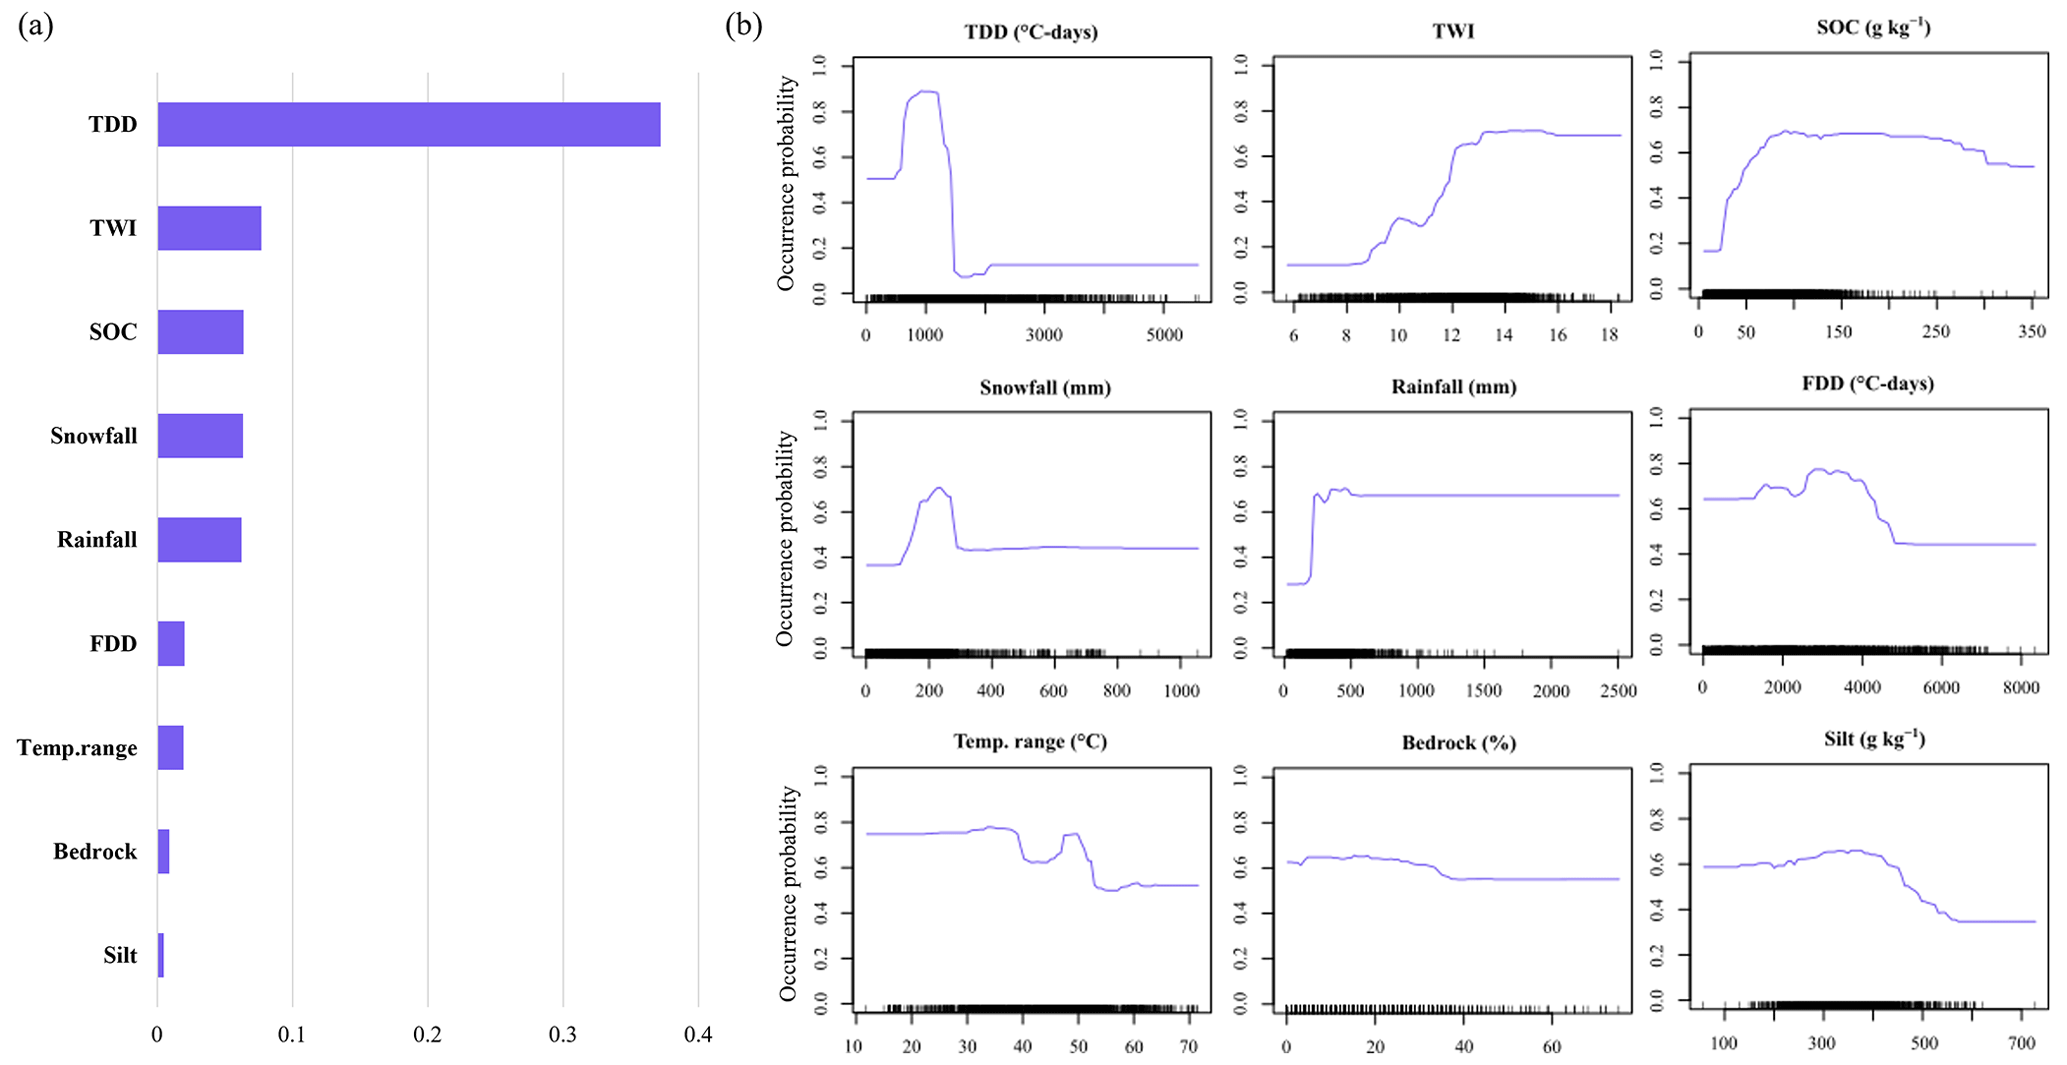
Figure 3(a) Variable importance values and (b) response curves for the environmental variables based on the random forest model. Abbreviated variables are thawing and freezing degree days (TDD and FDD, ∘C days), annual air temperature range (Temp.range, ∘C), topographic wetness index (TWI), soil organic carbon content (SOC, g kg−1), silt content (silt, g kg−1), and bedrock probability within 2 m from the ground surface (bedrock, %).
Based on the variable importance (VI) values, TDD was the most important variable (VI = 0.37) to characterize the suitable environments for palsas and peat plateaus in RF models (Fig. 3a., other modeling methods in Fig. S4). After TDD, four variables (TWI, SOC, snowfall, and rainfall) had moderately equal VI values (ranging from 0.062 to 0.077). FDD, temperature range, bedrock, and silt were only of minor importance (VI <0.021) in the RF models.
The response curve of TDD shows the optimal summer air temperatures to be around 1000 ∘C days, with a steep drop in the probability of occurrence beyond ∼1250 ∘C days (Fig. 3b). The occurrence probability increases with higher TWI values, indicating that palsas and peat plateaus are most likely found in flat or gently sloping basin environments with abundant soil moisture. The RF model shows the highest probabilities for regions with a SOC content of over 70 g kg−1. The snowfall variable also shows a clear optimal environmental space for the landforms around 200 mm, whereas the pattern is not equally clear for the rainfall (Fig. 3b). Response curves for all used modeling methods are provided in the Supplement (Fig. S5).
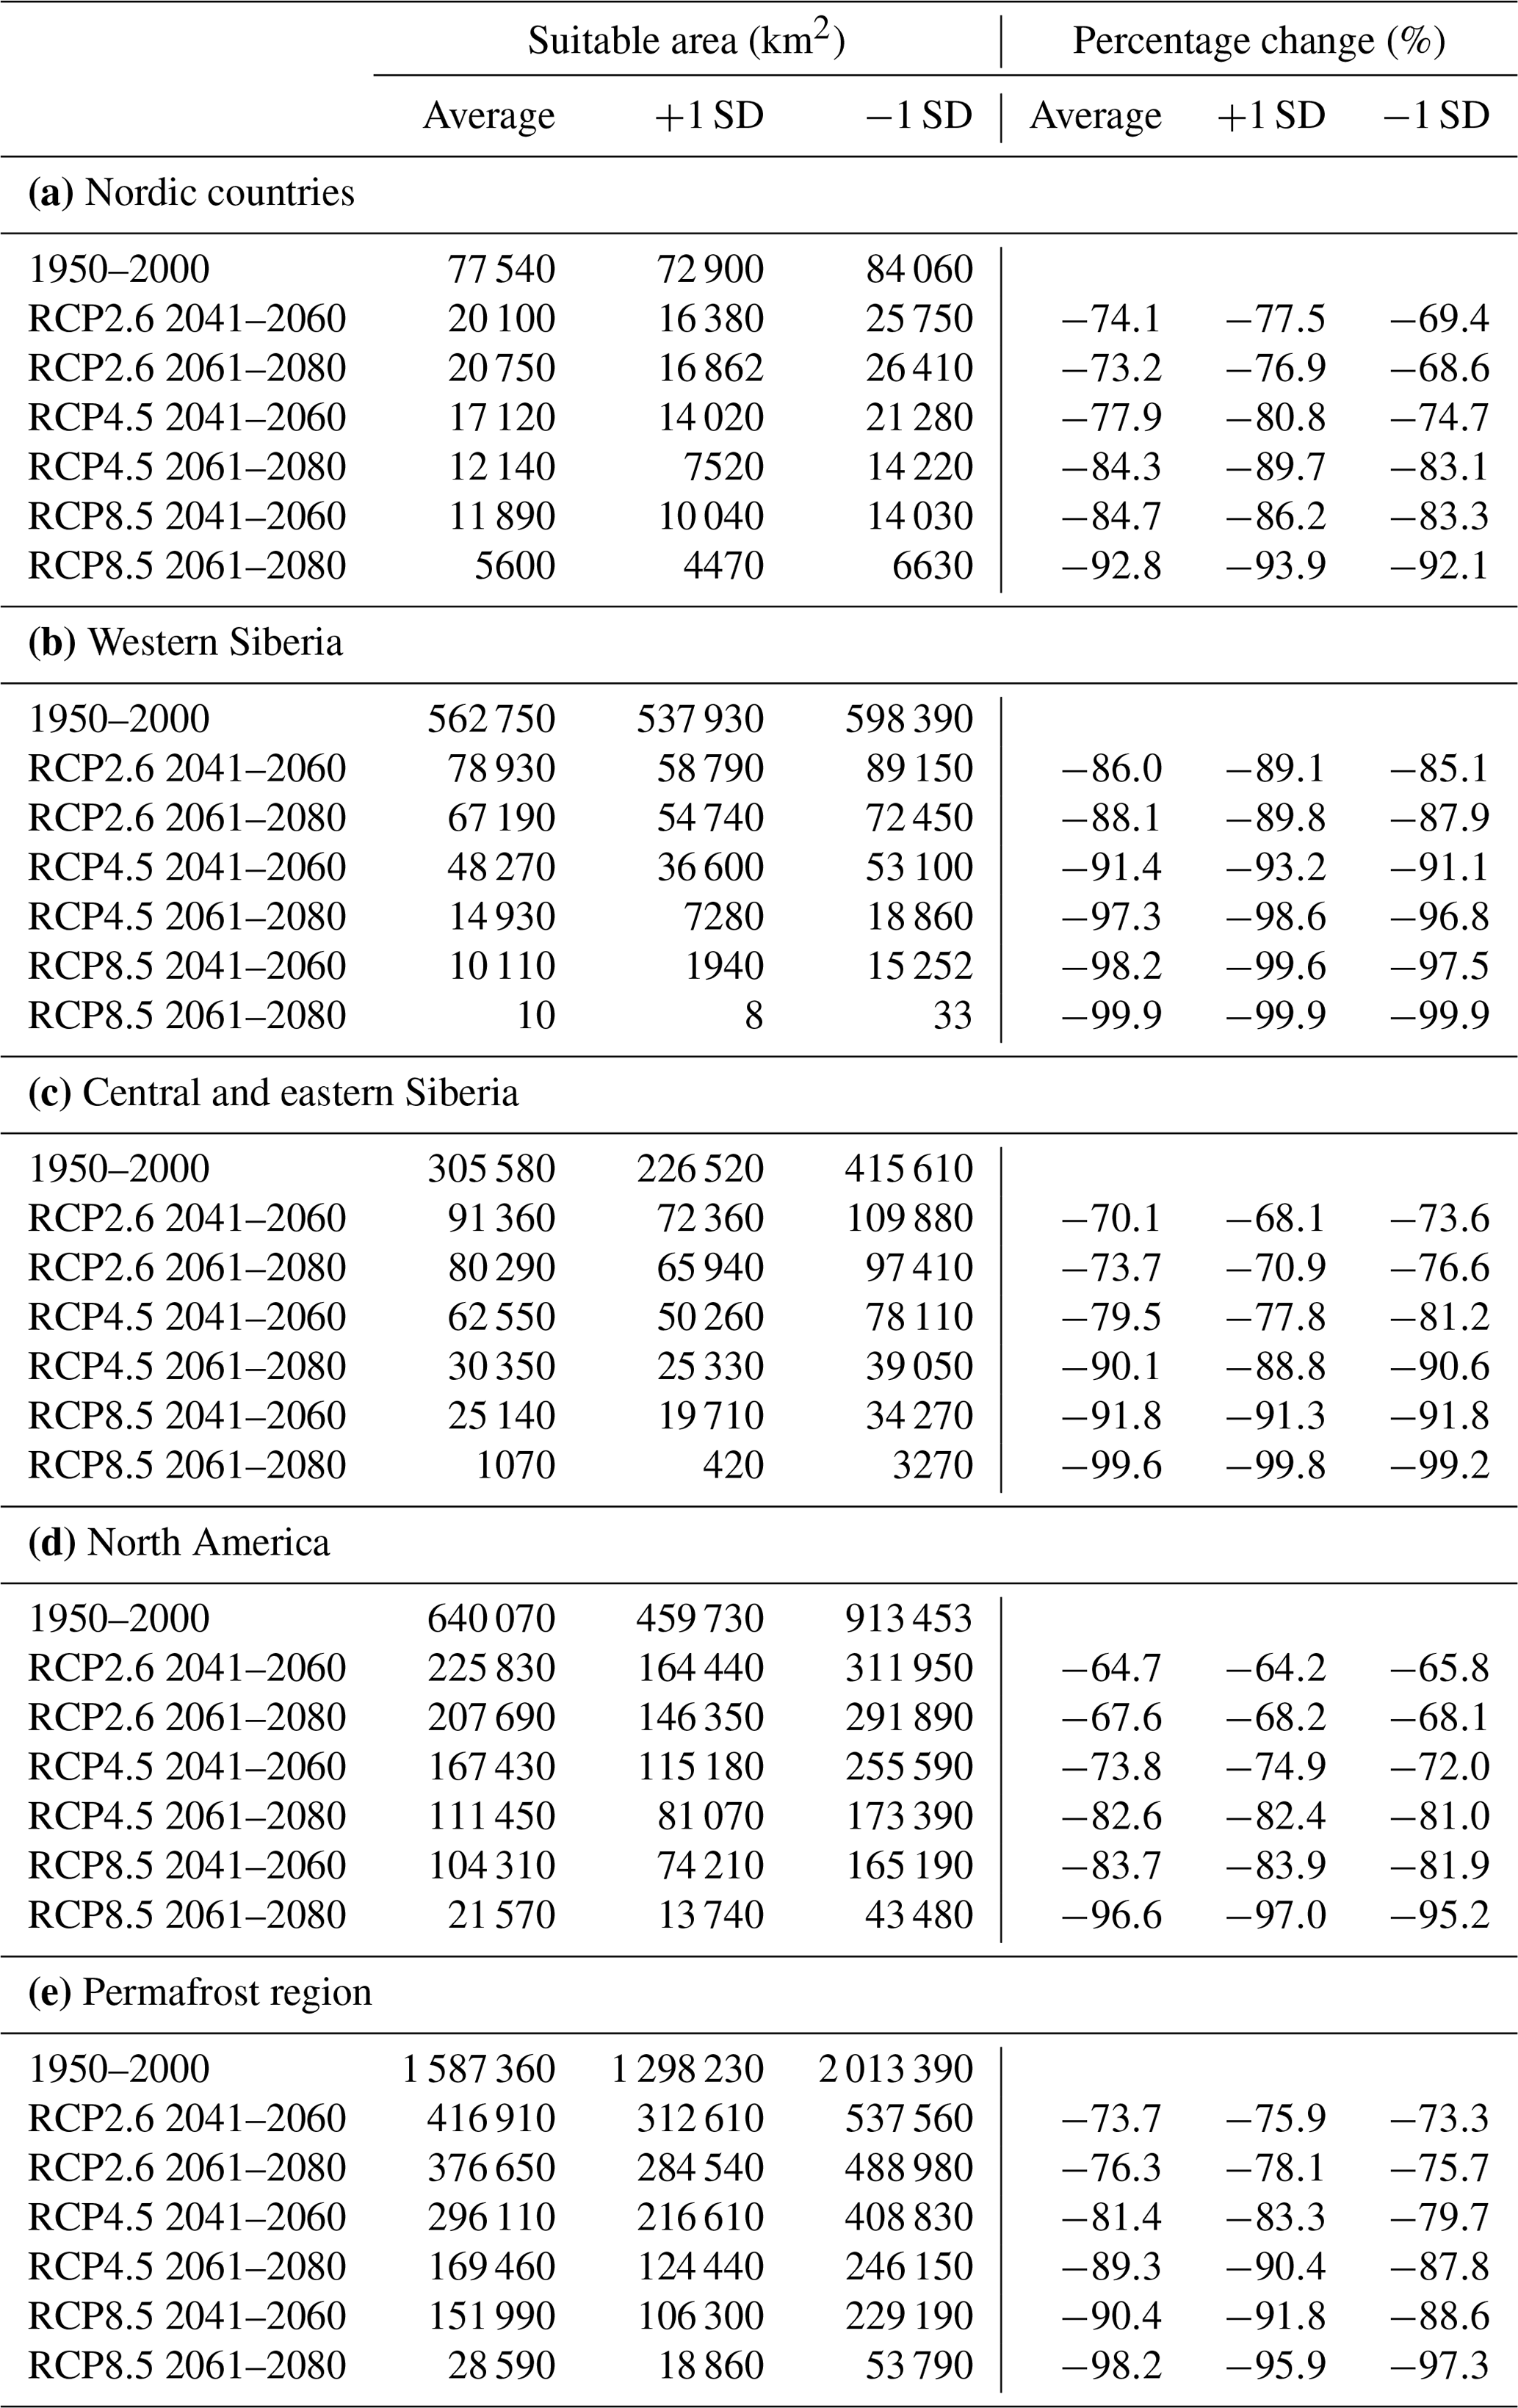
Table 1Predicted suitable environmental spaces (in km2) for palsas and peat plateaus at different time periods and RCP climate change scenarios in (a) Nordic countries, (b) western Siberia, (c) central and eastern Siberia, (d) North America, and (e) the entire circumpolar permafrost region. Areal percentage changes are given in relation to the modeled area for the period of 1950–2000. Results are based on random forest modeling. Three true skill statistic cut-off values of occurrence probability were used (an average cut-off based on 100 model iterations and average cut-off ±1 standard deviation) to classify continuous occurrence probabilities into binary maps.
3.2 Future changes in the circumpolar suitable environments
Our results suggest a dramatic loss of suitable environments for palsas and peat plateaus already by the middle of the 21st century (Tables 1 and S2). The high-emissions scenario RCP8.5 predicted even larger losses by the period of 2041–2060 than low- and moderate-emissions scenarios (RCP2.6 and RCP4.5) predicted by the second period of 2061–2080. The RCP8.5 scenario for 2061–2080 showed an almost complete loss (−98.2 %) of recently suitable environments (Table 1e).
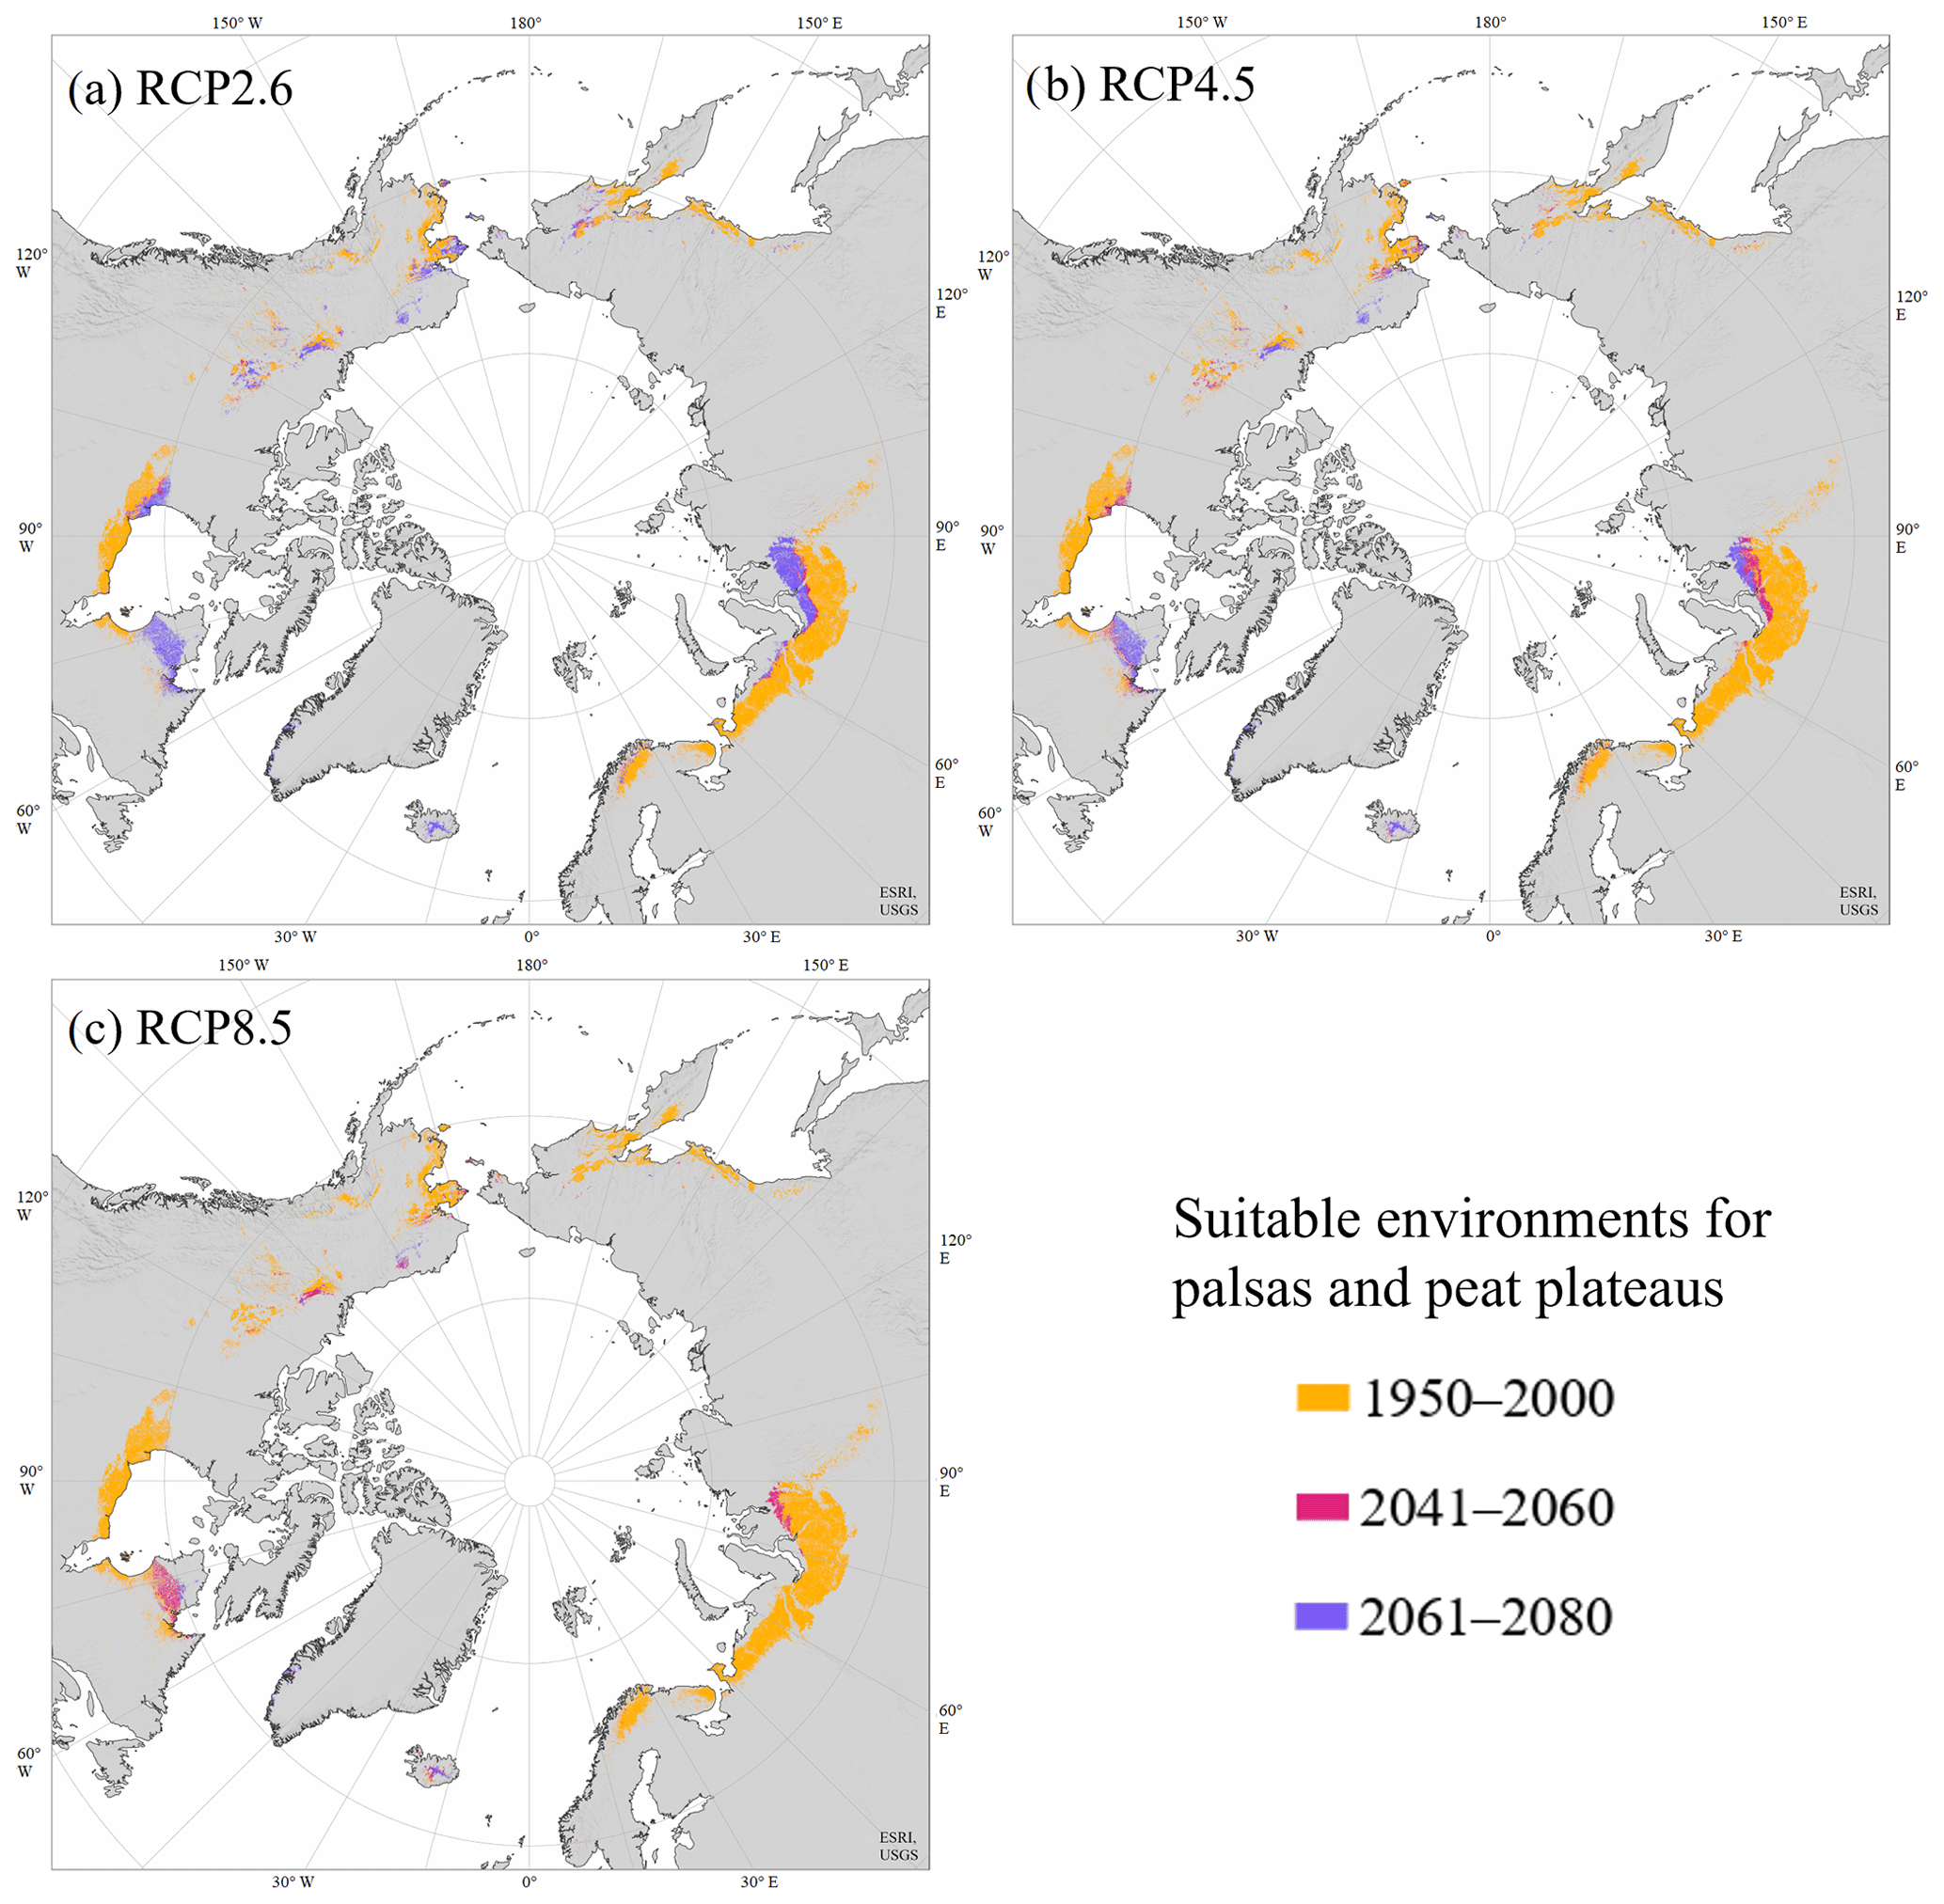
Figure 4Predicted distributions of suitable environmental spaces for palsas and peat plateaus for different time periods under (a) low-, (b) moderate-, and (c) high-emissions Representative Concentration Pathway climate change scenarios (RCP2.6, RCP4.5, and RCP8.5). Modeling results are presented for the periods of 1950–2000, 2041–2060, and 2061–2080. The random forest model results are provided for the permafrost region (Ran et al., 2022) and for the future periods for the extent of the period of 1950–2000.
Remarkable reductions in suitable environments were predicted even under the low-emissions scenario (RCP2.6) (Tables 1 and S2; Figs. 4a and S6). Reductions in suitable areas between the future periods in this scenario were minimal; the difference in the average changes was 2.6 % for the whole permafrost region and varied from 0.9 % to 3.6 % between regions. The predictions based on the RCP2.6 scenario for 2061–2080 were more extensive than the RCP4.5 predictions for the period of 2041–2060. The suitable environments for palsas and peat plateaus would disappear almost all around the Northern Hemisphere under the moderate-emissions climate change scenario (Table 1; Figs. 4b and S6). The suitable environments would disappear almost completely from northern Fennoscandia, west Siberia, the coasts of the Hudson Bay, western Alaska, and eastern Siberia already by the period of 2041–2060. Only in Iceland and Greenland did the modeled palsa and peat plateau environments seem to persist without major distributional changes. In addition to these regions, the suitable environments could persist in North America in the Northwest Territories, northern Quebec, and Alaska during the period of 2061–2080. In Russia, palsas and peat plateaus could persist mainly in the Yamalo-Nenets Autonomous Okrug and Turukhansky District (Table 1b and c; Fig. 4b). The predictions based on the RCP8.5 scenario for period of 2041–2060 present a similar distribution of suitable environmental spaces, compared with the RCP4.5 scenario for 2061–2080 (Figs. 4b and c, S6). Only 1.8 % of the recently suitable environments would persist under the RCP8.5 scenario in the period of 2061–2080 (Table 1). However, predicted areas for the suitable environments are sensitive to the used occurrence probability cut-off values (Table 1).
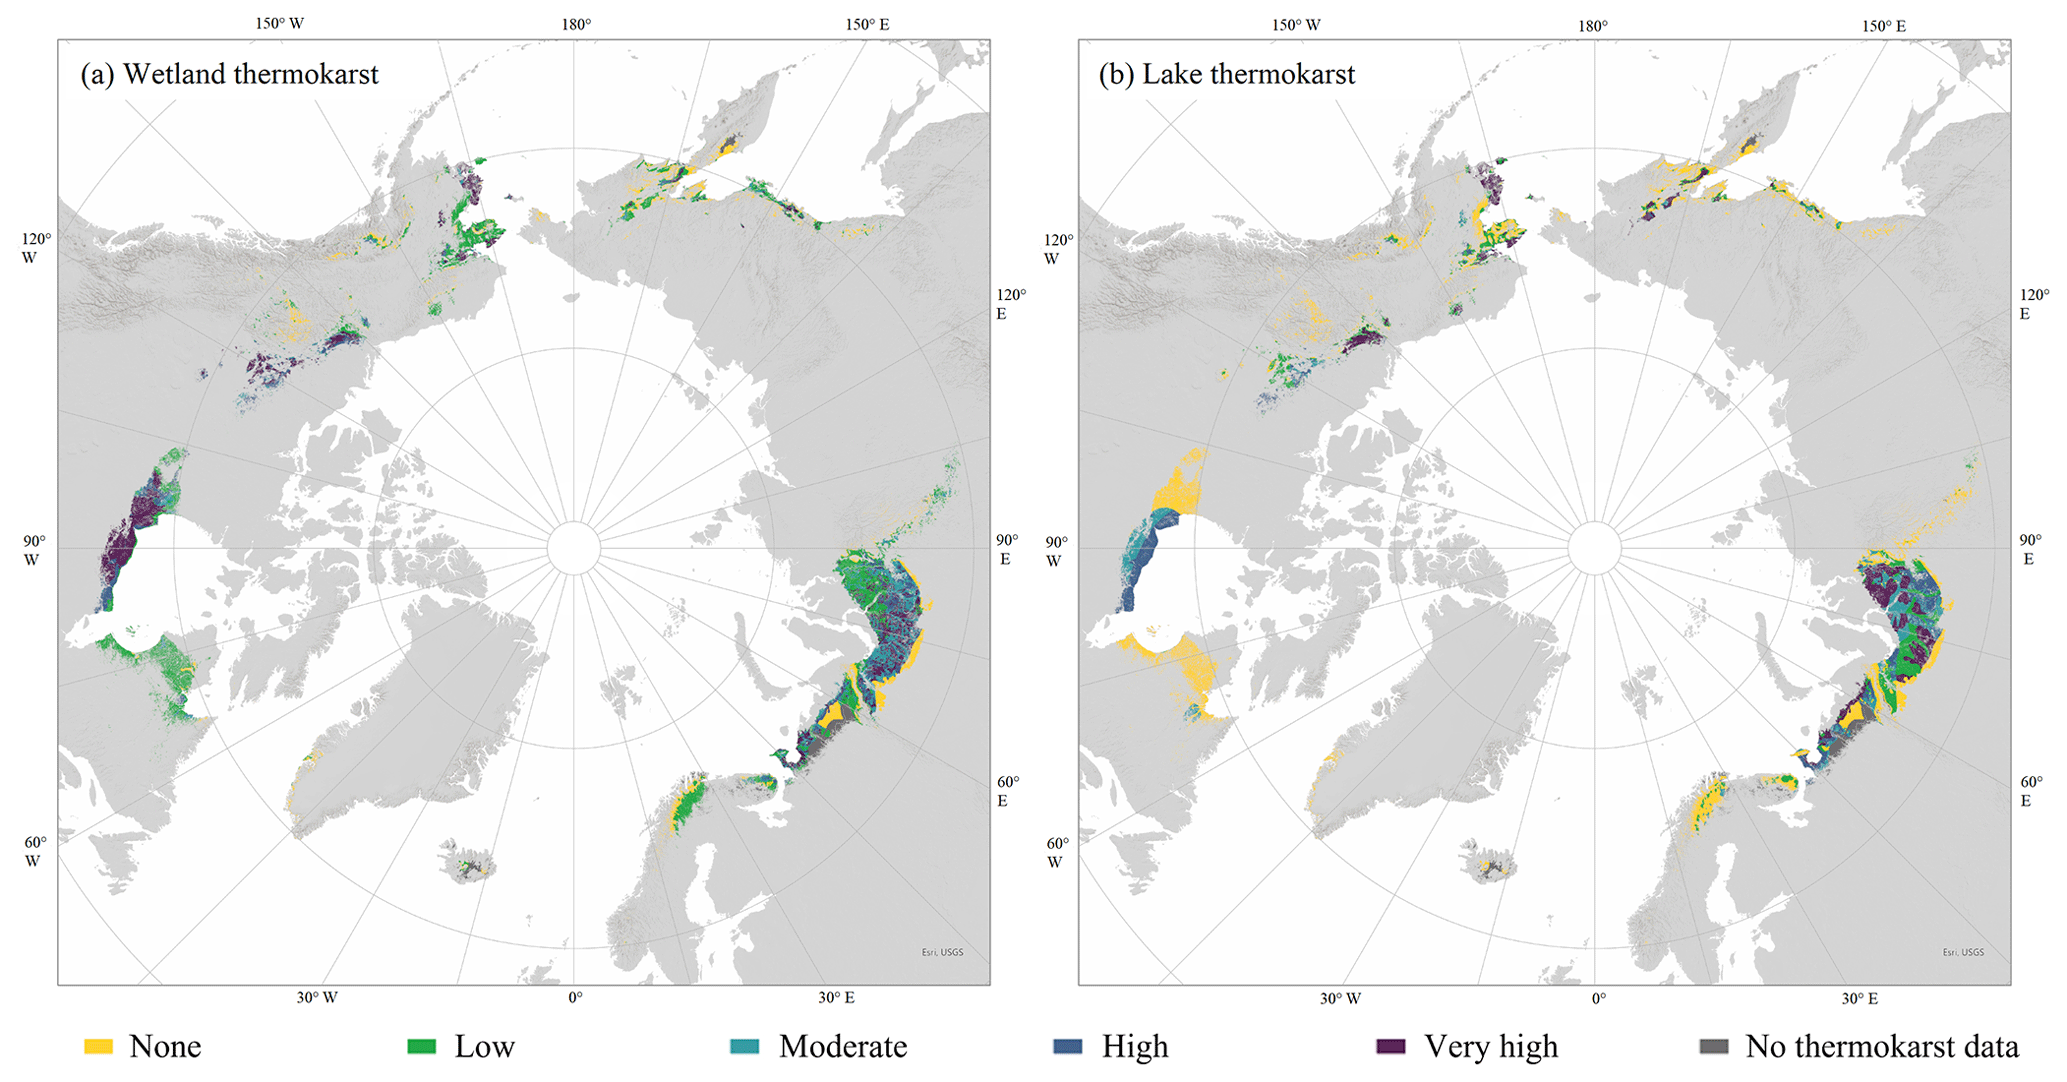
Figure 5Suitable environmental spaces for palsas and peat plateaus (for the period of 1950–2000) against thermokarst classification by Olefeldt et al. (2016a). (a) Wetland and (b) lake thermokarst likelihoods range from none (yellow) to very high (dark violet). Dark gray illustrates regions for which the thermokarst data are not available. Thermokarst likelihoods are classified by Olefeldt et al. (2016a) as follows: none (0 %–1.0 %), low (1.1 %–10.0 %), moderate (10.1 %–30.0 %), high (30.1 %–60.0 %), and very high (60.1 %–100.0 %). Results are provided for the permafrost region (Ran et al., 2022).
3.3 Thermokarst coverage of the suitable environments
When our modeling results were compared against the thermokarst map (Olefeldt et al., 2016a), areas with high or very high wetland thermokarst likelihoods were the first ones to become unsuitable based on our models (Fig. 4a and b and Fig. 5a). These regions were located mainly at the coasts of the Hudson Bay, the Northwest Territories, the west coast of Alaska, and parts of western Siberia. In turn, wide areas with none to low wetland thermokarst likelihood were found in northern Quebec and the Turukhansky District in Russia (Fig. 5a). These coincided well with the regions persisting as suitable environments in our climate change projections (Fig. 4a and b). The comparison with lake thermokarst presented comparable results for most of the regions, with some exceptions in western Siberia (Fig. 5a and b).
Conflicting results between our predictions and the thermokarst map were found in northern Fennoscandia. We predicted major losses in suitable environmental spaces for permafrost peatlands in the region, but, in contrast, Olefeldt et al. (2016a) predicted low likelihoods of both wetland and lake thermokarst in northern Fennoscandia (Fig. 5a and b). In particular, lake thermokarst likelihoods were low in the area. Besides northern Fennoscandia, consistency between the predicted suitable environments and the thermokarst landscapes was not so clear in the eastern parts of Siberia.
Overall, the wetland thermokarst had a closer spatial match to the projected lost and remaining suitable environmental spaces for palsas and peat plateaus in the circumpolar permafrost region. From the regions that our models predicted to become unsuitable for the landforms first (by 2040–2061 in RCP2.6 scenario), 40.7 % presented high or very high wetland thermokarst coverage, whereas 43.1 % had none or low coverage. This indicated slightly conflicting spatial relationship. However, when compared to the regions that were predicted to remain suitable during the period of 2040–2061 in the RCP2.6, RCP4.5, and RCP8.5 scenarios, a clear relationship was observed. These persisting palsa and peat plateau environments represented lower wetland thermokarst coverage than the degrading regions (Fig. S7).
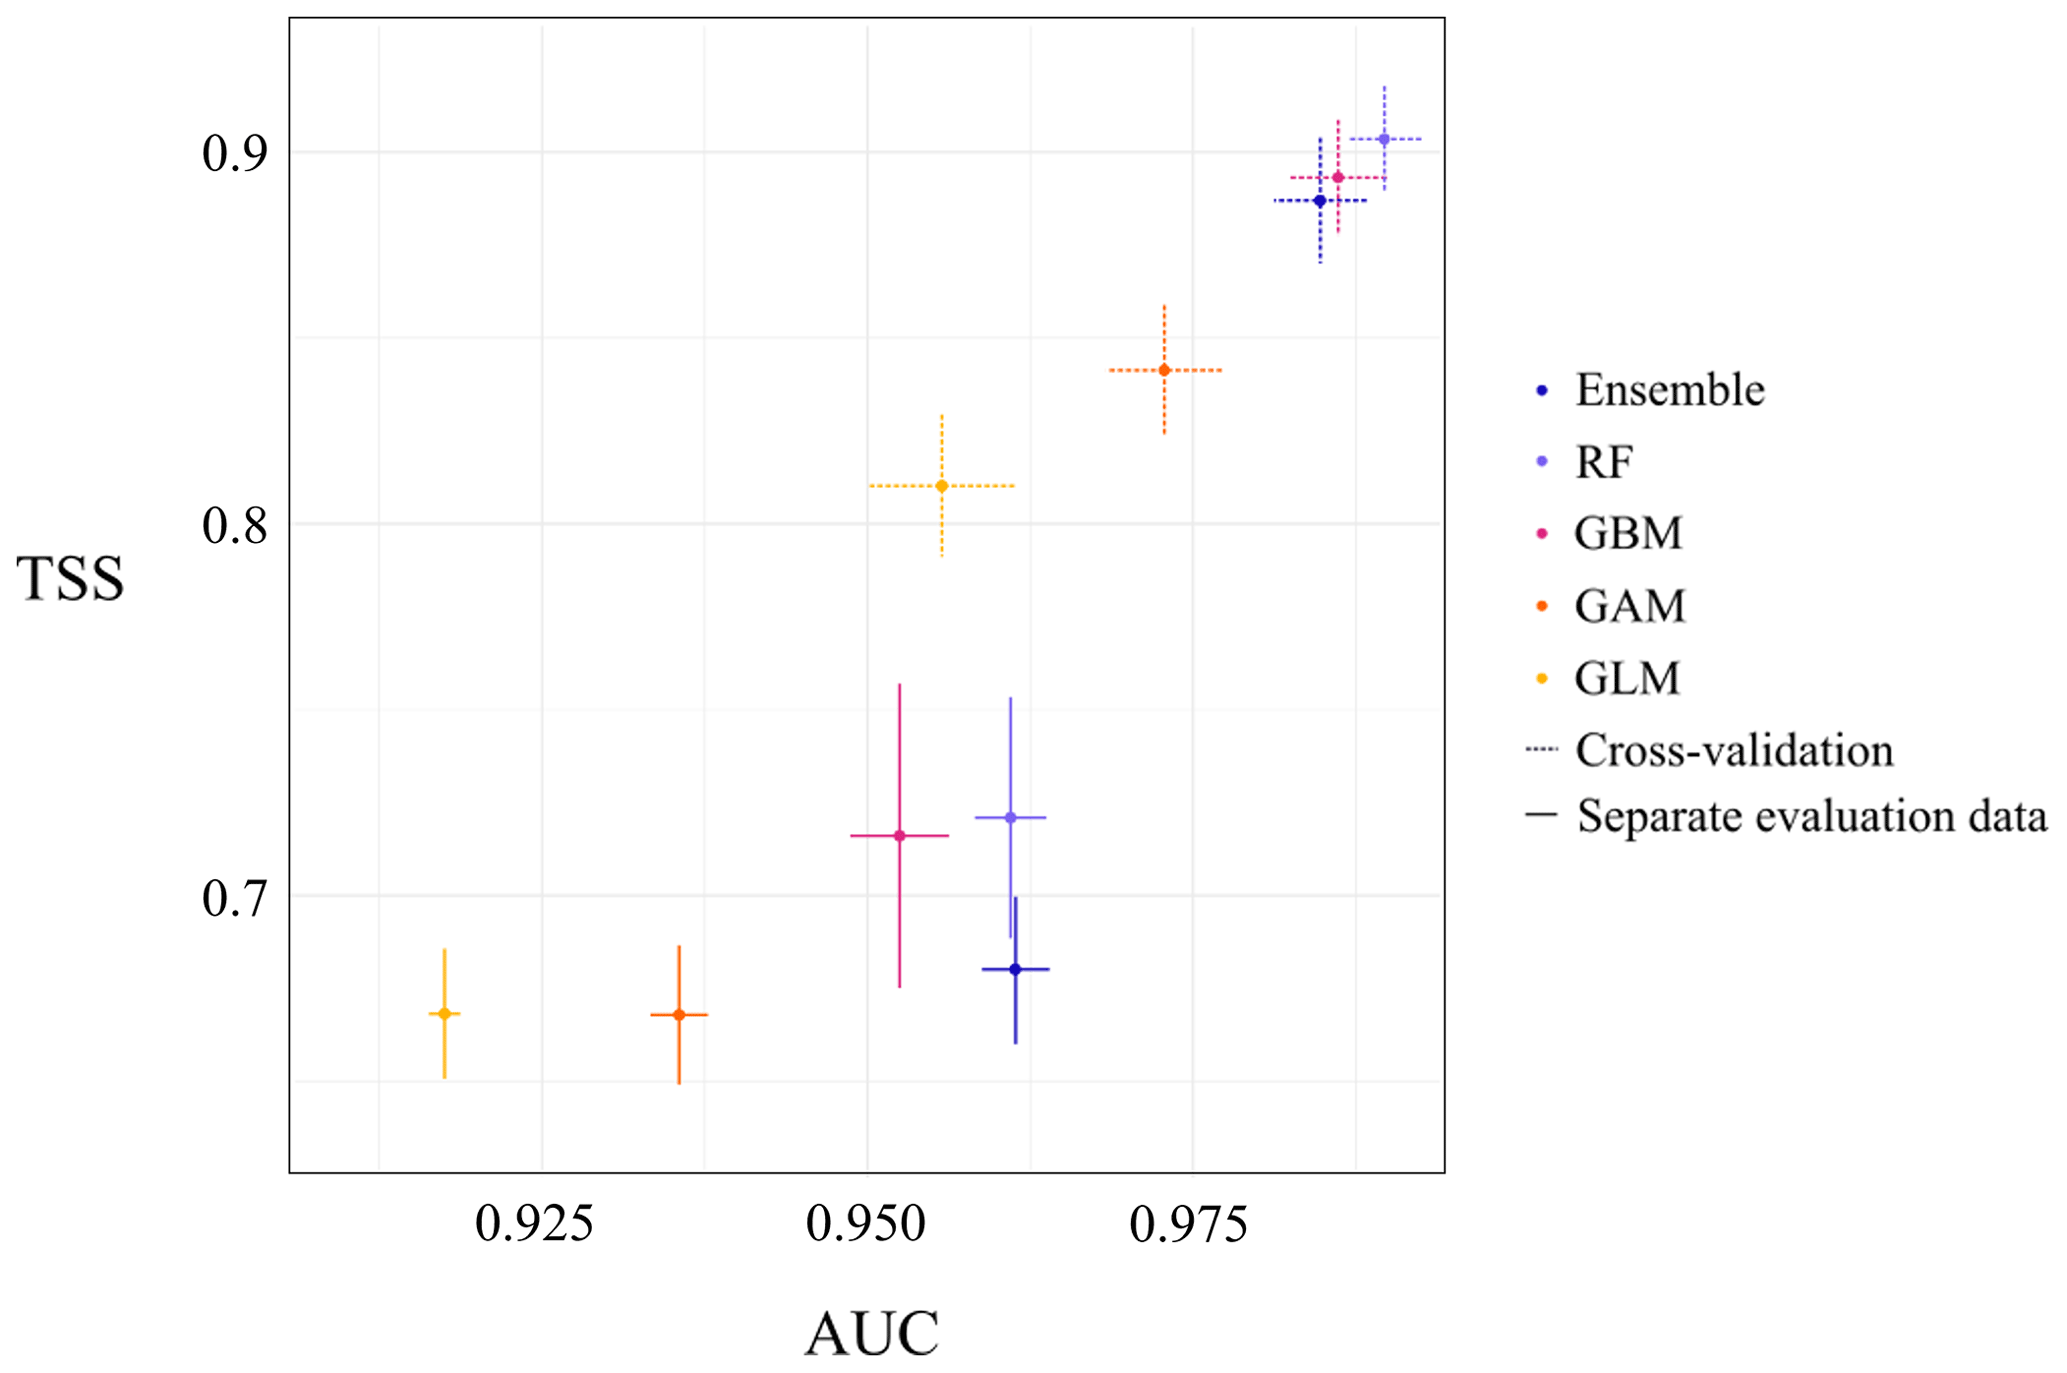
Figure 6Statistical evaluation metrics for different modeling techniques. Abbreviated techniques are random forest (RF), generalized boosted model (GBM), generalized additive model (GAM), and generalized linear model (GLM). The averages of the area under the receiving operating characteristic curve (AUC) and true skill statistic (TSS) values with 1 standard deviation (whiskers) are based on 100 runs of the models. Evaluation results for the 100-fold cross-validation with the calibration data are presented with a dashed line, and for the separate evaluation data, results are presented with a solid line.
3.4 Statistical and spatial evaluation of the models
The 100-fold cross-validation based on the split-sample approach yielded high AUC and TSS values (Fig. 6), indicating very good predictive performance of the models. The RF model and GBM best predicted the distribution of suitable environments, and the ensemble model performed slightly weaker. Between-model variability within the 100 modeling runs was estimated by the standard deviations. For the AUC, the standard deviation range was 0.003–0.006, and for the TSS it was 0.014–0.019, indicating that the performance of the generated 100 models varied only a little. Evaluation with the separate dataset resulted in lower AUC and TSS values than the cross-validation but still indicated outstanding predictive performance based on AUC values (AUC >0.9) and moderate predictive performance based on TSS values (TSS around 0.7; Fig. 6). With the separate evaluation data, the RF model and GBM had the highest TSS values, whereas the ensemble and RF models had the best AUC score. Compared to the cross-validation, larger between-model variability was observed in TSS values (SD 0.017–0.04), whereas variability in AUC values (SD 0.001–0.004) was smaller. The GLM and GAM were the weakest models in both evaluations. Based on the evaluation metrics, response curves, and predictive maps RF was considered the best method for predicting suitable environments for palsas and peat plateaus.
The total area for which all four models predicted the occurrence of palsas and peat plateaus was 0.8 ×10⁶ km2. This represents approximately 28 % of the area for which at least one model predicted the occurrence of the landforms (3.1 ×10⁶ km2), indicating relatively low model agreement. The highest model agreement (Fig. S8) was found in northern Fennoscandia, western Siberia, and northern Canada around the Hudson Bay and Quebec. Also, the west coast of Alaska, regions around Kamchatka Peninsula, and Iceland had a high model agreement.
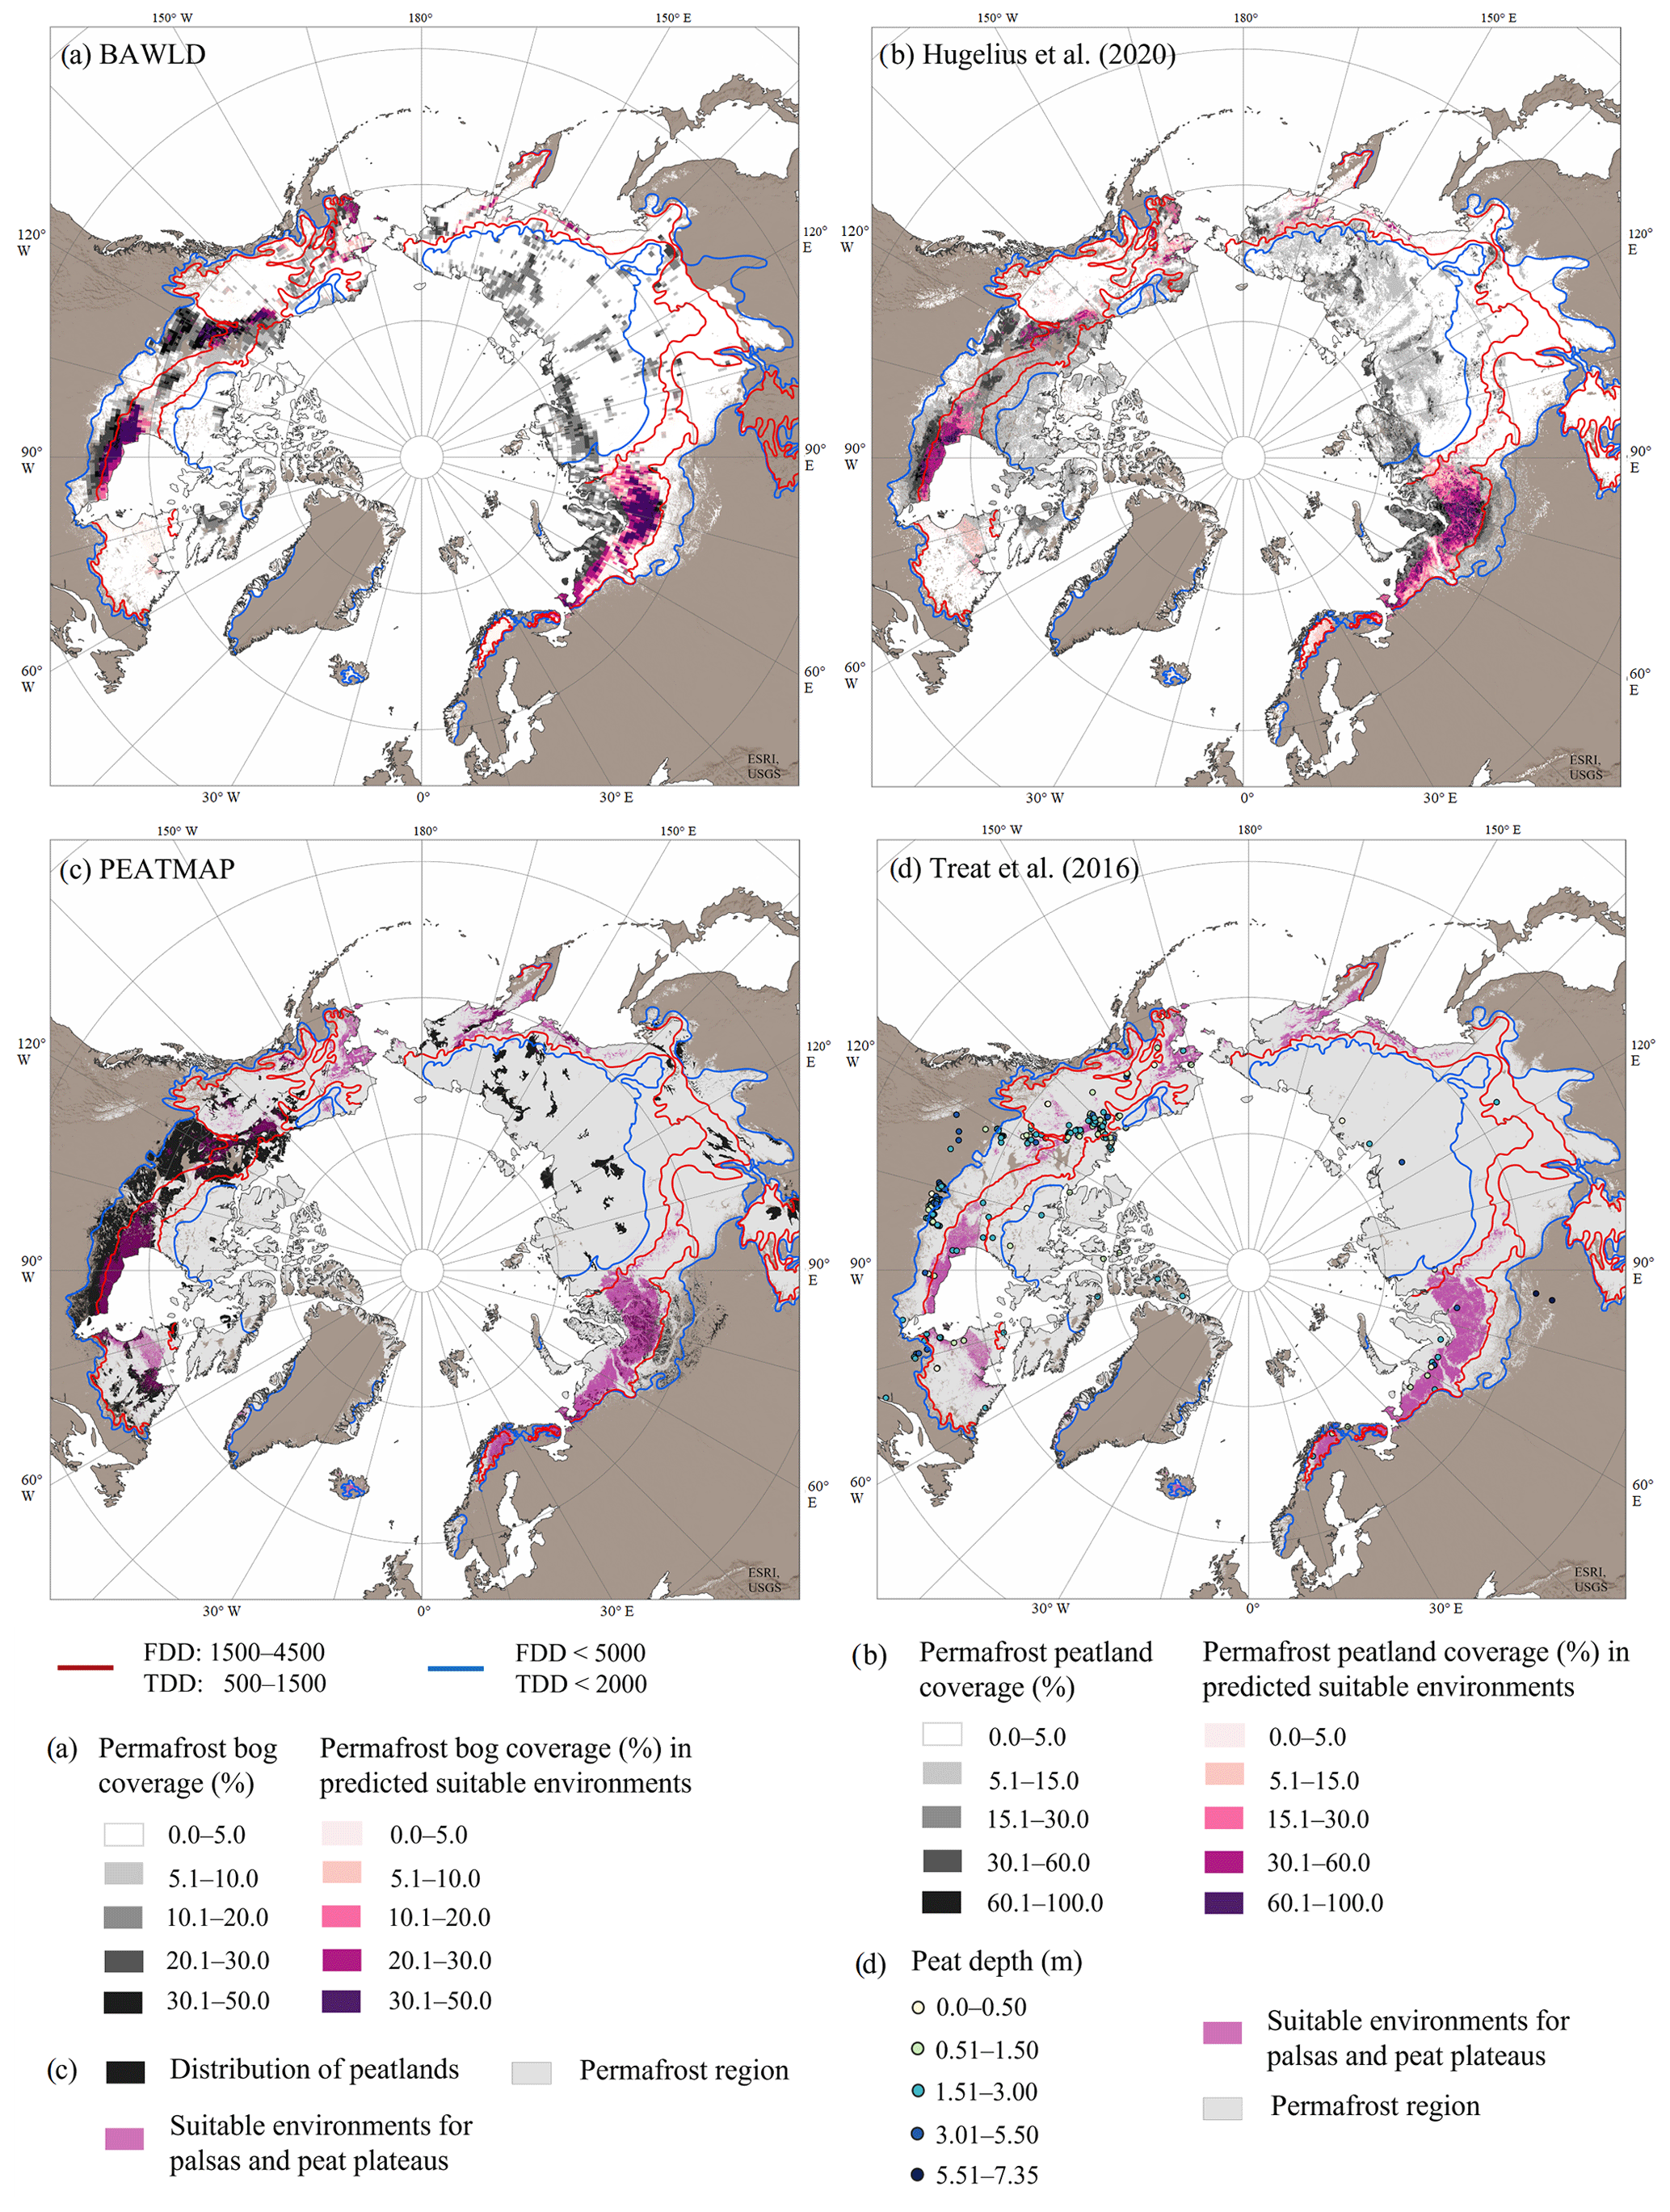
Figure 7Comparison between the predicted suitable environmental spaces (for the period of 1950–2000), suitable climate spaces, and peatland datasets; (a) permafrost bog coverage percent (0 %–50 %), in each grid cell according to the Boreal–Arctic Wetland and Lake Dataset (BAWLD; Olefeldt et al., 2021a), (b) permafrost peatland coverage percent (0 %–100 %) (Hugelius et al., 2020), (c) distribution of peatlands according to PEATMAP (Xu et al., 2018), and (d) peat depth according to Treat et al. (2016b) in point symbols (yellow to blue scale). Permafrost regions are illustrated in light gray (Ran et al., 2022) and regions outside the permafrost region in brown. The suitable environmental spaces are illustrated with pinkish colors, whereas areas outside our binary predictions are illustrated in grayscale. Two classifications of suitable climate spaces, based on freezing and thawing degree days (FDD and TDD respectively, ∘C days), are illustrated in red (a strict interpretation) and blue (a liberal interpretation) lines.
The comparison between our predictions and different peatland datasets show that the predicted suitable environments are more extensive than previously assessed permafrost peatland extent in northern Fennoscandia, Iceland, the Labrador Peninsula, and the Seward Peninsula (Fig. 7). Comparison with the PEATMAP also indicates overestimations in western Siberia and in eastern Siberia (Fig. 7c). Possible underestimations are found across the Canadian Shield also, where the underestimations mostly occurred beyond the strict climate space (Fig. 7). According to the suitable climate spaces and used peatland datasets, the suitable peatlands for palsas and peat plateaus are limited in central Siberia (Fig. 7). Most of the region's permafrost peatlands are located north of the suitable climate space.
Our models predicted a drastic loss of suitable environments for palsas and peat plateaus, indicating an almost complete loss of the landforms by 2080 according to the moderate- and high-emissions scenarios (RCP4.5 and RCP8.5). Previous modeling studies have shown similar trends for restricted study areas (e.g., Aalto et al., 2017; Fewster et al., 2022), and many monitoring studies have documented palsas and peat plateaus already degrading around the Northern Hemisphere (Payette et al., 2004; Borge et al., 2017; Mamet et al., 2017; Olvmo et al., 2020). Here, we predicted the disappearance of suitable environments for the whole northern circumpolar permafrost region for the first time. The shrinkage of suitable environments continued in all used emissions scenarios (Table 1). This might indicate that even the strong climate change mitigation is not enough to slow the degradation of suitable palsa and peat plateau environments down. Such major changes in the permafrost peatlands as projected here may have an influence on the future carbon cycling and potential to further accelerate the climate change (Turetsky et al., 2020; Miner et al., 2022). Moreover, the predicted permafrost degradation may have a major impact on both the geodiversity and the biodiversity of the current Northern Hemisphere permafrost region. Thus, comprehensive understanding of the current distribution of studied landforms is needed.
Based on the recent period, the suitable environments were predicted to occur around the Northern Hemisphere permafrost region, with hotspots at the most studied regions (i.e., northern Fennoscandia, western Siberia, and subarctic Canada). Our results from northern Fennoscandia and western Siberia coincide well with the results of Fewster et al. (2022). In particular, suitable environments of northern Finland, Norway, and Sweden agreed well with the previous mappings and modelings (Fronzek et al., 2006; Backe, 2014; Metsähallitus, 2019; Fewster et al., 2022). In contrast, our models predicted more extensive palsa and peat plateau occurrences in European Russia (e.g., Kola Peninsula and Komi Republic) than expected, and RF did not predict landforms occurring as far north in Yamalo-Nenets as Fewster et al. (2022). The comparison with the peatland datasets (Fig. 7) indicated more extensive suitable environments especially in northern Fennoscandia, but this might have been caused by the coarse resolution of some of the peatland datasets (Fig. 7a and b), which did not allow for reproducing small-scale variation in sporadic permafrost in the region.
Our model extrapolations predicted suitable environments in the east coast of Russia and inside a zone stretching southeast from western Siberia. Our RF models did not predict palsas or peat plateaus in the central parts of Siberia (Fig. 2). This might indicate a too dry and continental climate; conditions favoring other periglacial landforms, such as pingos and polygon mires (French, 2017); or too thin peat layers (Seppälä, 1988; Hugelius et al., 2020). Indeed, the comparison between peatland datasets and suitable climate spaces showed that most of the peatlands of central and eastern Siberia are located north of the estimated suitable climate spaces (Fig. 7). Our models likely failed to recognize the suitability of some of the relatively few peatlands inside the suitable climate space. It is possible that the limited distribution of suitable environments is caused by an insufficient number of presence observations to characterize the possibly suitable environmental conditions for palsas and peat plateaus in the region (Fig. 1). However, based on the stricter suitable climate space, the region for these landforms is narrow, indicating that our extrapolations likely did not underestimate the distribution of suitable environmental spaces as much as one could expect based on the limited number of landform observations in the region.
For North America our results aligned well with Fewster et al. (2020) around the Hudson Bay, Quebec, the Northwest Territories, and Yukon. However, our results were more spatially resolved in landform occurrence especially in the Northwest Territories and Yukon, showing, e.g., a gap in suitable environments east of the Great Slave Lake and clear differences in suitable environments of Alaska. For Alaska, our models predicted suitable environments in the coastal regions, whereas Fewster et al. (2020) predicted them in more central parts. The contrasting results may be partly explained by the inclusion of non-climatic variables in our models and the substantially finer spatial resolution of our study, which can both facilitate the differentiation of environmental suitability at an improved accuracy. Comparison with peatland datasets show possible overprediction of suitable environments in the North Slope and Seward Peninsula, for example. In Canada the most striking overprediction occurred in the Labrador Peninsula. However, a recent study from the region showed that previous studies have underestimated the distribution of peatland permafrost along the coast of the peninsula (Wang et al., 2023).
The optimal climatological conditions coincide quite well with the climate envelopes determined by previous studies for Fennoscandia (e.g., Luoto et al., 2004b; Aalto and Luoto, 2014) and North America (Fewster et al., 2020). For central and eastern Siberia no optimal climatic ranges for palsas and peat plateaus have been determined before. TDD was the most important variable, while FDD was only of minor importance in our models (see Fig. 3), indicating that the thawing-season conditions have a greater effect on the distribution of suitable environments for palsas and peat plateaus. Recent studies have similarly highlighted the importance of thawing-season conditions for the occurrence of permafrost (Mekonnen et al., 2021), other periglacial landforms (Karjalainen et al., 2020), and active layer (Peng et al., 2018; Karjalainen et al., 2019). According to these results, warmer and wetter summers might be most influential in accelerating the degradation of palsas and peat plateaus and decreasing the extent of the suitable environments in our future scenarios. In addition, thicker snowpack can also lead to permafrost thaw in the discontinuous permafrost region (Biskaborn et al., 2019), as the thick snowpack acts as an insulator preventing the frost from penetrating deep into the soil (Seppälä, 1990, 1994; Ge and Gong, 2010; Sannel, 2020). Increasing snowpack also leads to moister conditions during late spring due to abundant meltwaters (Sannel, 2020) and thus alters the thermal properties of peat (Kujala et al., 2008). Indeed, the thin snow cover has been tested in the field to be a key factor in the formation of palsas (Seppälä, 1982), and the negative effect of increasing snowfall (Johansson et al., 2013) can be recognized from our results (Fig. 3a). However, there might be a delay before the increasing snow depth will affect the thaw depth (Sannel et al., 2016).
Other environmental conditions besides the climate also affect the distribution of peat-dominated permafrost mounds and other periglacial landforms (Seppälä, 2011; Karjalainen et al., 2020). Our models indicate that palsas and peat plateaus require sufficient SOC content, which is logical, as the sufficient peat cover is considered crucial for the formation and occurrence of these landforms at the marginal permafrost regions (Kujala et al., 2008; Seppälä, 2011). Most of the previous modeling studies of palsas and peat plateaus (e.g., Fronzek et al., 2006; Parviainen and Luoto, 2007; Fewster et al., 2020, 2022) have used only climate envelope models. Our results show that incorporating other environmental variables may enhance the predictive performance of the models as SOC and TWI had the highest VI values after TDD (Fig. 3). In addition, compared to previous broad-scale studies (Fewster et al., 2022, 2020) the used high spatial resolution allows for identifying unsuitable areas within the climatically suitable envelopes and thereby reduces the risk of overestimating suitable environments.
Even though our models predicted major losses in the suitable environments, the peat cover of the landforms may cause time delay in the degradation process, as dry peat acts as an effective insulator for permafrost cores of the mounds (Kujala et al., 2008). Thus, the actual degradation of palsas and peat plateaus might happen later than our statistical models predict. Moreover, not all palsas and peat plateaus are equal when comparing the rate of degradation. Landforms which are already imbalanced with the current climate (e.g., Olvmo et al., 2020) will degrade faster than landforms in equilibrium with climate (e.g., Tam et al., 2014). For these reasons we preferred to discuss about the distribution of suitable environments rather than claiming that our results would represent the actual distribution and degradation of the studied landforms. Despite the possible delayed or varying degradation rate between regions, our predictions can be used to estimate the forthcoming spatial changes in the distribution of the suitable environments.
It is important to note that most of palsas and peat plateaus were formed during the Little Ice Age (the 16th to mid-19th century period) in colder climates than we are currently facing (Halsey et al., 1995; Treat et al., 2016a; Vorren, 2017; Fewster et al., 2020). Because of this, not all palsas and peat plateaus are in equilibrium with the current climate anymore. We did not model the historical distribution of suitable environments by using climate data from the landform initiation period, because it would have required historical data describing the other environmental factors also. However, we acknowledged the role of past climates by choosing the 1950–2000 to be our baseline period as it was considered to better resemble the conditions of the period of palsa and peat plateau formation than the current climatology (e.g., 1991–2020; Seppälä, 2003; Saemundsson et al., 2012).
Previous studies have suggested that the development of thermokarst can be used as an indicator of the former distribution of palsas (Matthews et al., 1997; Luoto and Seppälä, 2003). Thermokarst ponds are relatively common in Fennoscandian palsa mires (e.g., Luoto and Seppälä, 2003), although Olefeldt et al. (2016a) classified this region to have a low likelihood for thermokarst. This mismatch was noticed also here, as we predicted extensive degradation of the landforms in the region. Overall, our results showed that regions with higher thermokarst likelihood are at a higher risk of becoming unsuitable environments for palsas and peat plateaus, compared to the regions with lower thermokarst likelihood. This indicated clear spatial relationship with our results and the thermokarst likelihood. It is important to note that the thermokarst data by Olefeldt et al. (2016a) are based on modeling rather than observations. The modeling approach involves some uncertainties, which have to be considered when interpreting the results. However, the recognition of the regions with a high degradation risk is useful in the estimation of future greenhouse gas fluxes from permafrost wetlands (Swindles et al., 2016; Miner et al., 2022) and establishing conservation actions for these endangered ecosystems and habitats (Janssen et al., 2016).
Owing to the extensive study area with heterogeneous environmental conditions, our aim was to compile as representative a landform observation dataset as possible for model calibration. Due to this, no fully independent landform datasets were available for the evaluation of our models. This was, however, compensated for in multiple ways. First, we divided the compiled landform observations into semi-independent calibration and evaluation datasets and performed an evaluation using the 100-fold cross-validation (with calibration dataset) and with the separate evaluation dataset (Fig. 6). Second, our predictions were compared with four peatland datasets (Treat et al., 2016b; Xu et al., 2018; Hugelius et al., 2020; Olefeldt et al., 2021a) and suitable climate spaces to assess our predictions for the recent period (1950–2000) (Fig. 7). Third, our future predictions were compared to the independent thermokarst data (Olefeldt et al., 2016a) to examine whether the degrading regions coincide with high thermokarst likelihood. All these evaluations supported our predictions even in the regions with a low number of landform observations. We recognize that our results for central and eastern Siberia are extrapolations of models fitted elsewhere as the landform observations from the region are scarce, and this must be considered when interpreting the results. In addition, it is important to acknowledge the uncertainties related to statistical modeling itself (see, e.g., Heikkinen et al., 2006; Hjort and Luoto, 2013). To overcome these methodological caveats, we used multiple modeling methods and quantified the prediction uncertainty.
To further develop the statistical models for the prediction of suitable environmental spaces for palsas and peat plateaus, we would need more spatially resolved datasets describing the thickness of the snowpack and peat layer instead of the indirect snowfall and SOC variables. Incorporating variables describing, e.g., average wind conditions and vegetation structure could improve the performance of the models, but their applicability is hampered by the lack of suitable high-resolution data depicting future conditions. Although our study gave new insights into the distribution of suitable environments for palsas and peat plateaus in central and eastern Siberia, future research should focus on acquiring better knowledge of the current distribution of the landforms in these regions.
From the results of this study, we conclude the following.
-
Suitable environments for palsas and peat plateaus can be found across the Northern Hemisphere, with occurrence hotspots in northern Europe; western Siberia; and around the Hudson Bay, Quebec, and the Northwest Territories of Canada.
-
A dramatic loss of the suitable environments for palsas and peat plateaus is predicted to occur already by 2041–2060 and an almost complete loss by 2061–2080.
-
Under low- and moderate-emissions scenarios (RCP2.6 and RCP4.5), landforms can persist in the coldest parts of the recent distribution area, but if the climate change mitigation fails (RCP8.5), suitable environments are predicted to be lost from almost the entire Northern Hemisphere.
-
Further research on the distribution of the landforms is needed especially in central and eastern Siberia, for more reliably assessing their current state and potential future development.
-
The pronounced importance of thawing-season climate conditions for circumpolar palsa and peat plateau occurrence is congruent with the earlier findings that the projected increases in summer temperatures and rainfall may affect the stability of permafrost peatland landforms.
-
In addition to the climatic variables, soil organic carbon and moisture accumulation potential of the soil affect the landform occurrence at a circumpolar scale, and they need to be considered in order to draw a detailed picture of the landforms' distribution.
-
Projected loss of the suitable palsa and peat plateau environments overlapped with the regions having a high thermokarst likelihood. In the future, it will be likely to find an increasing amount of thermokarst from recent palsa and peat plateau environments.
The degradation of permafrost peatlands will potentially have an influence on the diversity of subarctic nature and the carbon balance of Earth. Thus, the predicted changes in the suitable environmental spaces for palsas and peat plateaus should be taken into consideration when the estimating the pace and impacts of the climate change over northern regions.
Used climate data were obtained from WorldClim – Global Climatic Data, available at https://www.worldclim.org/data/v1.4/worldclim14.html and https://www.worldclim.org/data/v1.4/cmip5_30s.htm (WorldClim; Hijmans et al., 2005, 2022a, b). Variables describing the soil properties were calculated from data in SoilGrids – global gridded soil information database (https://files.isric.org/soilgrids; Poggio et al., 2021). Global Multi-resolution Terrain Elevation Data 2010 (GMTED2010; Danielson and Gesch, 2011; https://doi.org/10.5066/F7J38R2N) was used to calculate TWI. Thermokarst dataset (Olefeldt et al., 2016a) can be obtained from https://doi.org/10.3334/ORNLDAAC/1332 (Olefeldt et al., 2016b). The BAWLD database (Olefeldt et al., 2021a) is available at https://doi.org/10.18739/A2C824F9X (Olefeldt et al., 2021b). Hugelius et al. (2020) data are at the Bolin Centre for Climate Research (https://doi.org/10.17043/hugelius-2020-peatland-2; Hugelius et al., 2021). PEATMAP (Xu et al., 2018) data are available at https://doi.org/10.5518/252 (Xu et al., 2017). Treat et al. (2016b) data are available at https://doi.org/10.1594/PANGAEA.863689 (Treat et al., 2016c). The coordinates of the landform observations compiled in this study are available in the Supplement. A list of references used in the compilation is provided in the Supplement. Our predictions of the suitable environments for palsas and peat plateaus are publicly available in raster format in Zenodo: https://doi.org/10.5281/zenodo.7745085 (Könönen et al., 2023).
The supplement related to this article is available online at: https://doi.org/10.5194/tc-17-3157-2023-supplement.
OL, OK, and JH conceptualized the research idea. OL collected the observational data. OK led the compilation of the environmental datasets and their geospatial processing with OL and JA. OL performed the statistical analysis with contributions from OK and JH. OL wrote the paper with contributions from all the authors.
The contact author has declared that none of the authors has any competing interests.
Publisher's note: Copernicus Publications remains neutral with regard to jurisdictional claims in published maps and institutional affiliations.
We thank Claire Treat, an anonymous referee, Paul J. Morris, and the editor Arjen Stroeven for their helpful and critical comments, which helped us to improve this paper remarkably.
This research has been supported by the Academy of Finland (grant nos. 315519, 337552, and 342890).
This paper was edited by Arjen Stroeven and reviewed by Claire C. Treat and one anonymous referee.
Aalto, J. and Luoto, M.: Integrating climate and local factors for geomorphological distribution models, Earth Surf. Proc. Land., 39, 1729–1740, https://doi.org/10.1002/esp.3554, 2014.
Aalto, J., Venäläinen, A., Heikkinen, R. K., and Luoto, M.: Potential for extreme loss in high-latitude Earth surface processes due to climate change, Geophys. Res. Lett., 41, 3914–3924, https://doi.org/10.1002/2014GL060095, 2014.
Aalto, J., Harrison, S., and Luoto, M.: Statistical modelling predicts almost complete loss of major periglacial processes in Northern Europe by 2100, Nat. Commun., 8, 1–8, https://doi.org/10.1038/s41467-017-00669-3, 2017.
Aalto, J., Karjalainen, O., Hjort, J., and Luoto, M.: Statistical forecasting of current and future circum-Arctic ground temperatures and active layer thickness, Geophys. Res. Lett., 45, 4889–4898, https://doi.org/10.1029/2018GL078007, 2018.
Åhman, R.: Palsar i Nordnorge: En studie av palsars morfologi, utbredning och klimatiska förutsättningar i Finnmarks och Troms fylke, Royal University of Lund, Department of Geography, 165 pp., 1977.
Allouche, O., Tsoar, A., and Kadmon, R.: Assessing the accuracy of species distribution models: prevalence, kappa and true skill statistic (TSS), J. Appl. Ecol., 43, 1223–1232, https://doi.org/10.1111/j.1365-2664.2006.01214.x, 2006.
Araújo, M. B., Pearson, R. G., Thuiller, W., and Erhard, M.: Validation of species–climate impact models under climate change, Glob. Change Biol., 11, 1504–1513, https://doi.org/10.1111/J.1365-2486.2005.01000.X, 2005.
Backe, S.: Kartering av Sveriges palsmyrar, Länsstyrelsen, Luleå, 72 pp., urn:nbn:se:naturvardsverket:diva-2318, 2014.
Barcan, V.: Stability of palsa at the southern margin of its distribution on the Kola Peninsula, Polar Sci., 4, 489–495, https://doi.org/10.1016/j.polar.2010.07.002, 2010.
Beilman, D. W.: Plant community and diversity change due to localized permafrost dynamics in bogs of western Canada, Can. J. Bot., 79, 983–993, https://doi.org/10.1139/cjb-79-8-983, 2001.
Biskaborn, B. K., Smith, S. L., Noetzli, J., Matthes, H., Vieira, G., Streletskiy, D. A., Schoeneich, P., Romanovsky, V. E., Lewkowicz A. G., Abramov, A. Allard, M., Boike, J., Cable, W. L., Christiansen, H. H., Delaloye, R., Diekmann, B., Drozdov, D., Etzelmüller, B., Grosse, G., Guglielmin, M., Ingeman-Nielsen, T., Isaksen, K., Ishikawa, M., Johansson, M., Johansson, H., Joo, A., Kaverin, D., Kholodov, A., Konstantinov, P., Kröger, T., Lambiel, C., Lanckman, J. -P., Luo, D., Malkova, G., Meiklejohn, I., Moskalenko, N., Oliva, M., Phillips, M., Ramos, M., Sannel, B. A. K., Sergeev, D., Seybold, C., Skryabin, P., Vasiliev, A., Wu, Q., Yoshikawa, K., Zhelenznyak, M., and Lantuit, H.: Permafrost is warming at a global scale, Nat. Commun., 10, 264, https://doi.org/10.1038/s41467-018-08240-4, 2019.
Böhner, J. and Selige, T.: Spatial prediction of soil attributes using terrain analysis and climate regionalization, SAGA – Analyses and Modelling Applications, Göttinger Geographische Abhandlungen 115, edited by: McCloy K., and Strobl, J., Goltze, 13–28, ISSN 0341-3780, 2006.
Borge, A. F., Westermann, S., Solheim, I., and Etzelmüller, B.: Strong degradation of palsas and peat plateaus in northern Norway during the last 60 years, The Cryosphere, 11, 1–16, https://doi.org/10.5194/tc-11-1-2017, 2017.
Breiman, L.: Random forests, Mach. Learn., 45, 5–32, https://doi.org/10.1023/A:1010933404324, 2001.
Brotons, L., Thuiller, W., Araújo, M. B., Brotons, A. H. H., Jo, A., Hirzel, M. B., and Thuiller, W.: Presence-absence versus presence-only modelling methods for predicting bird habitat suitability, Ecography, 27, 437–448, https://doi.org/10.1111/J.0906-7590.2004.03764.X, 2004.
Brown, J., Ferrians Jr., O. J., Heginbottom, J. A., and Melnikov, E. S. (Eds.): Circum-Arctic map of permafrost and ground-ice conditions,, U.S. Geological Survey in Cooperation with the Circum-Pacific Council for Energy and Mineral Resources Washington, DC, Circum-Pacific Map Series CP-45, scale 1:10 000 000, 1 sheet, 1997.
CAFF: Arctic Flora and Fauna: Status and Conservation, Edita, Helsinki, Finland, 266 pp., ISBN 9979-9476-5-9, 2001.
Cisty, M., Celar, L., and Minaric, P.: Ensemble modelling in soil hydrology, Proceedings of the International Multidisciplinary Scientific GeoConference SGEM, 17–26 June 2014, Albena, Bulgaria, 239–245, 2014.
Danielson, J. J. and Gesch, D. B.: Global Multi-resolution Terrain Elevation Data 2010 (GMTED2010), U.S. Geological Survey Open-File Report 2011–1073, USGS [data set], https://doi.org/10.5066/F7J38R2N, 2011.
Elith, Jane, Ferrier, S., Huettmann, F., and Leathwick, J.: The evaluation strip: A new and robust method for plotting predicted responses from species distribution models, Ecol. Model., 186, 280–289. https://doi.org/10.1016/J.ECOLMODEL.2004.12.007, 2005.
Elith, J., Graham, C. H., Anderson, R. P., Dudík, M., Ferrier, S., Guisan, A., Hijmans, R. J., Huettmann, F., Leathwick, J. R., Lehmann, A., Li, J., Lohmann, L. G., Loiselle, B. A., Manion, G., Moritz, C., Nakamura, M., Nakazawa, Y., Overton, J. McC. M., Townsend Peterson, A., Phillips, Richardson, S. J. K., Scachetti-Pereira, R., Schapire, R. E., Soberón, J., Williams, S., Wisz, M. S., and Zimmermann, N. E.: Novel methods improve prediction of species' distributions from occurrence data, Ecography, 29, 129–151, https://doi.org/10.1111/J.2006.0906-7590.04596.X, 2006.
Elith, J., Leathwick, J. R., and Hastie, T.: A working guide to boosted regression trees, J. Anim. Ecol., 77, 802–813, https://doi.org/10.1111/j.1365-2656.2008.01390.x, 2008.
Fewster, R. E., Morris, P. J., Swindles, G. T., Gregoire, L. J., Ivanovic, R. F., Valdes, P. J., and Mullan, D.: Drivers of Holocene palsa distribution in North America, Quaternary Sci. Rev., 240, 106337, https://doi.org/10.1016/j.quascirev.2020.106337, 2020.
Fewster, R. E., Morris, P. J., Ivanovic, R. F., Swindles, G. T., Peregon, A. M., and Smith, C. J.: Imminent loss of climate space for permafrost peatlands in Europe and Western Siberia, Nat. Clim. Change, 10, 1–7, https://doi.org/10.1038/s41558-022-01296-7, 2022.
French, H. M.: The periglacial Environment, 4th edition, Wiley-Blackwell, Hoboken, 515 pp., LCCN 2017027903, 2017.
Fisher, A., Rudin, C., and Dominici, F.: All models are wrong, but many are useful: Learning a variable's importance by studying an entire class of prediction models simultaneously, J. Mach. Learn. Res., 20, 177, https://doi.org/10.48550/arXiv.1801.01489, 2019.
French, H. M.: The Periglacial Environment, 4th edn., Wiley-Blackwell, Hoboken, ISBN 978-1-119-13278-3, 2017.
Fronzek, S., Luoto, M., and Carter, T.: Potential effect of climate change on the distribution of palsa mires in subarctic Fennoscandia, Clim. Res., 32, 1–12, https://doi.org/10.3354/cr032001, 2006.
Fronzek, S., Carter, T. R., and Luoto, M.: Evaluating sources of uncertainty in modelling the impact of probabilistic climate change on sub-arctic palsa mires, Nat. Hazards Earth Syst. Sci., 11, 2981–2995, https://doi.org/10.5194/nhess-11-2981-2011, 2011.
Ge, Y. and Gong, G.: Land surface insulation response to snow depth variability, J. Geophys. Res.-Atmos., 115, D8, https://doi.org/10.1029/2009JD012798, 2010.
Goetz, S. J., MacK, M. C., Gurney, K. R., Randerson, J. T., and Houghton, R. A.: Ecosystem responses to recent climate change and fire disturbance at northern high latitudes: observations and model results contrasting northern Eurasia and North America, Environ, Res. Lett., 2, 045031, https://doi.org/10.1088/1748-9326/2/4/045031, 2007.
Grosse, G. and Jones, B. M.: Spatial distribution of pingos in northern Asia, The Cryosphere, 5, 13–33, https://doi.org/10.5194/tc-5-13-2011, 2011.
Halsey, L. A., Vitt, D. H., and Zoltai, S. C.: Disequilibrium response of permafrost in boreal continental western Canada to climate-change, Clim. Change, 30, 57–73, https://doi.org/10.1007/BF01093225, 1995.
Hastie, T. and Tibshirani, R.: Generalized Additive Models, Stat. Sci., 1, 297–318, 1986.
Heikkinen, R. K., Luoto, M., Araújo, M. B., Virkkala, R., Thuiller, W., and Sykes, M. T.: Methods and uncertainties in bioclimatic envelope modelling under climate change, Proc. Phys. Geogr., 6, 751–777, https://doi.org/10.1177/0309133306071957, 2006.
Hijmans, R. J., Cameron, S. E., Parra, J. L., Jones, P. G., and Jarvis, A.: Very high-resolution interpolated climate surfaces for global land areas, Int. J. Climatol., 25, 1965–1978, https://doi.org/10.1002/joc.1276, 2005.
Hijmans, R. J., Cameron, S. E., Parra, J. L., Jones, P. G., and Jarvis, A.: WorldClim 1.4 (historical conditions), WorldClim [data set], https://www.worldclim.org/data/v1.4/worldclim14.html, last access: 20 May 2022a.
Hijmans, R. J., Cameron, S. E., Parra, J. L., Jones, P. G., and Jarvis, A.: WorldClim 1.4. Downscaled CMIP5 data, 30 second spatial resolution, WorldClim [data set], https://www.worldclim.org/data/v1.4/cmip5_30s.html, last access: 20 May 2022b.
Hjort, J. and Luoto, M.: Statistical Methods for Geomorphic Distribution Modeling, Treatise on Geomorphology Vol. 2, edited by: Shroder, J. F. and Baas A. C. W., Academic Press, 59–73, https://doi.org/10.1016/B978-0-12-374739-6.00028-2, 2013.
Hjort, J. and Marmion, M.: Effects of sample size on the accuracy of geomorphological models, Geomorphology, 102, 341–350, https://doi.org/10.1016/J.GEOMORPH.2008.04.006, 2008.
Hjort, J., Streletskiy, D., Doré, G., Wu, Q., Bjella, K., and Luoto, M.: Impacts of permafrost degradation on infrastructure, Nat. Rev. Earth Environ., 3, 24–38, https://doi.org/10.1038/s43017-021-00247-8, 2022.
Hosmer, D. W. and Lemeshow, S.: Applied Logistic Regression, 2nd edn., John Wiley and Sons, New York, NY, 160–164, 2000.
Hugelius, G., Loisel, J., Chadburn, S., Jackson, R. B., Jones, M., MacDonald, G., Marushchak, M., Olefeldt, D., Packalen, M., Siewert, M. B., Treat, C., Turetsky, M., Voight, C., and Yu, Z.: Large stocks of peatland carbon and nitrogen are vulnerable to permafrost thaw, P. Natl. Acad. Sci. USA, 117, 20438–20446, https://doi.org/10.1073/pnas.1916387117, 2020.
Hugelius, G., Loisel, J., Chadburn, S., Jackson, R. B., Jones, M., MacDonald, G., Marushchak, M., Olefeldt, D., Packalen, M., Siewert, M. B., Treat, C., Turetsky, M., Voigt, C., and Yu, Z.: Maps of northern peatland extent, depth, carbon storage and nitrogen storage, Dataset version 2, Bolin Centre Database [data set], https://doi.org/10.17043/hugelius-2020-peatland-2, 2021.
IPCC: Climate Change 2021: The Physical Science Basis, the Working Group I contribution to the Sixth Assessment Report of the Intergovernmental Panel on Climate Change, edited by: Masson-Delmotte, V., Zhai, P., Pirani, A., Connors, S. L., Péan, C., Berger, S., Caud, N., Chen, Y., Goldfarb, L., Gomis, M. I., Huang, M., Leitzell, K., Lonnoy, E., Matthews, J. B. R., Maycock, T. K., Waterfield, T., Yelekçi, O., Yu, R., and Zhou, B., Cambridge Press, Cambridge, United Kingdom and New York, USA, https://doi.org/10.1017/9781009157896, 2021.
Janssen, J. A. M., Rodwell, J. S., García Criado, M., Gubbay, S., Haynes, T., Nieto, A., Sanders, N., Landucci, F., Loidi, J., Ssymank, A., Tahvanainen, T., Valderrabano, M., Acosta, A., Aronsson, M., Arts, G., Attorre, F., Bergmeier, E., Bijlsma, R.-J., Bioret, F., Bita-Nicolae, C., Biurrun, I., Calix, M., Capelo, J., Carni, A., Dengler, J., Dimopoulus, P., Essl, F., Gardfjell, H., Gigante, D., Giusso del Galdo, G., Hájek, M., Jansen, J., Kapfer, J., Mickolajczak, A., Molina, J. A., Molnár, Z., Paternoster, D., Piernik, A., Poulin, B., Renaux, B., Schaminée, J. H. J., Sumberová, K., Toivonen, H., Tonteri, T., Tsiripidis, I., Tzonev, R., and Valachovic, M.: European Red List of Habitats. Part 2. Terrestrial and freshwater habitats European Red List of Habitats Environment, Europen Union, 38 pp., https://doi.org/10.2779/091372, 2016.
Järvinen, O. and Sammalisto, L.: Regional trends in the avifauna of Finnish peatland bogs, Ann. Zool. Fenn., 13, 31–43, 1976.
Johansson, M., Callaghan, T. V., Bosiö, J., Åkerman, J. H., Jackowicz-Korczynski, M., and Christensen, T. R.: Rapid responses of permafrost and vegetation to experimentally increased snow cover in sub-arctic Sweden, Environ. Res. Lett., 8, 035025, https://doi.org/10.1088/1748-9326/8/3/035025, 2013.
Johansson, T., Malmer, N., Crill, P. M., Friborg, T., Åkerman, J. H., Mastepanov, M., and Christiansen, T. R.: Decadal vegetation changes in a northern peatland, greenhouse gas fluxes and net radiative forcing, Global Change Biol., 12, 2352–2369, https://doi.org/10.1111/j.1365-2486.2006.01267.x, 2006.
Karjalainen, O., Luoto, M., Aalto, J., and Hjort, J.: New insights into the environmental factors controlling the ground thermal regime across the Northern Hemisphere: a comparison between permafrost and non-permafrost areas, The Cryosphere, 13, 693–707, https://doi.org/10.5194/tc-13-693-2019, 2019.
Karjalainen, O., Luoto, M., Aalto, J., Etzelmüller, B., Grosse, G., Jones, B. M., Lilleøren, K., S., and Hjort, J.: High potential for loss of permafrost landforms in a changing climate, Environ. Res. Lett., 15, 104065, https://doi.org/10.1088/1748-9326/abafd5, 2020.
Kershaw, G. P. and Gill, D.: Growth and decay of palsas and peat plateaus in the Macmillan Pass – Tsichu River area, Northwest Territories, Canada, Can. J. Earth Sci., 16, 1362–1374, https://doi.org/10.1139/e79-122, 1979.
Kirpotin, S., Polishchuk, Y., Bryksina, N., Sugaipova, A., Kouraev, A., Zakharova, E., Pokrovsky, O. S., Shirokova, L., Kolmakova, M., Manassypov, R., and Dupre, B.: West Siberian palsa peatlands: distribution, typology, cyclic development, present day climate-driven changes, seasonal hydrology, and impact on CO2 cycle, Int. J. Environ. Stud., 68, 603–623, https://doi.org/10.1080/00207233.2011.593901, 2011.
Könönen, O. H., Karjalainen, O., Aalto, J., Luoto, M., and Hjort, J.: Spatial predictions of suitable environments for palsas and peat plateaus in the Northern Hemisphere for recent and future periods, Zenodo [data set], https://doi.org/10.5281/zenodo.7745085, 2023.
Kujala, K., Seppälä, M., and Holappa, T.: Physical properties of peat and palsa formation, Cold Reg. Sci. Technol., 52, 408–414, https://doi.org/10.1016/j.coldregions.2007.08.002, 2008.
Lagarec, D.: Cryogenetic mounds as indicators of permafrost conditions, northern Québec, in: Proceedings in Fourth Canadian Permafrost Conference, 2-6 March 1981, Calgary, Alberta, 43–48, 1982.
Landis, J. R. and Koch G. G.: The measurement of observer agreement for categorial data, Biometrics, 33, 159–174, https://doi.org/10.2307/2529310, 1977.
Liljedahl, A. K., Boike, J., Daanen, R. P., Fedorov, A. N., Frost, G. v., Grosse, G., Hinzman, L. D., Iijma, Y., Jorgenson, J. C., Matveyeva, N., Necsoiu, M., Raynolds, M. K., Romanovsky, V. E., Schulla, J., Tape, K. D., Walker, D. A., Wilson, C. J., Yabuki, H., and Zona, D.: Pan-Arctic ice-wedge degradation in warming permafrost and its influence on tundra hydrology, Nat. Geosci., 9, 312–318, https://doi.org/10.1038/ngeo2674, 2016.
Luoto, M. and Seppälä, M.: Thermokarst ponds as indicators of the former distribution of palsas in Finnish Lapland, Permafrost Periglac., 14, 19–27, https://doi.org/10.1002/PPP.441, 2003.
Luoto, M., Heikkinen, R., and Carter, T. R.: Loss of palsa mires in Europe and biological consequences, Environ. Conserv., 31, 30–37, https://doi.org/10.1017/S0376892904001018, 2004a.
Luoto, M., Fronzek, S., and Zuidhoff, F. S.: Spatial modelling of palsa mires in relation to climate in Northern Europe, Earth Surf. Proc. Land., 29, 1373–1387, https://doi.org/10.1002/esp.1099, 2004b.
Luoto, M., Marmion, M., and Hjort, J.: Assessing spatial uncertainty in predictive geomorphological mapping: A multi-modelling approach, Comput. Geosci., 36, 355–361, https://doi.org/10.1016/J.CAGEO.2009.07.008, 2010.
Magnan, G., Sanderson, N. K., Piilo, S., Pratte, S., Väliranta, M., van Bellen, S., Zhang, H., and Garneau, M.: Widespread recent ecosystem state shifts in high-latitude peatlands of northeastern Canada and implications for carbon sequestration, Glob. Change Biol., 28, 1919–1934, https://doi.org/10.1111/GCB.16032, 2022.
Malmer, N., Johansson, T., Olsrud, M., and Christensen, T. R.: Vegetation, climatic changes, and net carbon sequestration in a North-Scandinavian subarctic mire over 30 years, Glob. Change Biol., 11, 1895–1909, https://doi.org/10.1111/j.1365-2486.2005.01042.x, 2005.
Mamet, S. D., Chun, K. P., Kershaw, G. G. L., Loranty, M. M., and Kershaw, P. G.: Recent Increases in Permafrost Thaw Rates and Areal Loss of Palsas in the Western Northwest Territories, Canada, Permafrost Periglac., 28, 619–633, https://doi.org/10.1002/ppp.1951, 2017.
Mandrekar, J. N.: Receiver Operating Characteristic Curve in diagnostic test assessment, J. Thorac. Oncol. 5 1315–1316, https://doi.org/10.1097/JTO.0b013e3181ec173d, 2010.
Markkula, I.: Permafrost dynamics structure species compositions of oribatid mite (Acari: Oribatida) communities in sub-Arctic palsa mires, Polar Res., 33, 22926, https://doi.org/10.3402/polar.v33.22926, 2014.
Marushchak, M., Pitkämäki, A., Koponen, H., Biasi, C., Seppälä, M., and Martikainen P. J.: Hot spots for nitrous oxide emissions found in different types of permafrost peatlands, Global Change Biol., 17, 2601–12614, https://doi.org/10.1111/j.1365-2486.2011.02442.x, 2011.
Matthews, J. A., Dahl, S.-O. O., Berrisford, M. S., and Nesje, A.: Cyclic development and thermokarstic degradation of palsas in the mid-alpine zone at Leirpullan, Dovrefjell, Southern Norway, Permafrost Periglac., 8, 107–122, https://doi.org/10.1002/(sici)1099-1530(199701)8:1<107::aid-ppp237>3.0.co;2-z, 1997.
Mekonnen, Z. A., Riley, W. J., Grant, R. F., and Romanovsky, V. E.: Changes in precipitation and air temperature contribute comparably to permafrost degradation in a warmer climate, Environ. Res. Lett., 16, 024008, https://doi.org/10.1088/1748-9326/ABC444, 2021.
Metsähallitus: Valtion suojelualueiden biotooppikuviot (Finnish dataset of biotopes), Metsähallitus, luontopalvelut, e3aa7b2a-e6e2-45dc-a29a-b64bcf2aba9f, 2019.
Miner, K. R., Turetsky, M. R., Malina, E., Bartsch, A., Tamminen, J., McGuire, A. D., Fix, A., Sweeney, C., Elder, C. D., and Miller, C. E.: Permafrost carbon emissions in a changing Arctic, Nat. Rev. Earth Environ., 3, 55–67, https://doi.org/10.1038/S43017-021-00230-3, 2022.
Mishra, U., Hugelius, G., Shelef, E., Yang, Y., Strauss, J., Lupachev, A., Harden, J. W., Jastrow, J. D., Ping, C. L., Riley, W. J., Schuur, E. A. G., Matamala, R., Siewert, M., Nave, L. E., Koven, C. D., Fuchs, M., Palmtag, J., Kuhry, P., Treat, C. C., Zubrzycki, S., Hoffman, F. M., Elberling, B., Camill, P., Veremeeva, A., and Orr, A.: Spatial heterogeneity and environmental predictors of permafrost region soil organic carbon stocks, Sci. Adv., 7, 5236–5260, https://doi.org/10.1126/sciadv.aaz5236, 2021.
Muller, S. W.: Permafrost or Permanently Frozen Ground and Related Engineering Problems, Special report, Strategic Engineering Study, 62, 136 pp., 1943.
Nelder, J. A. and Wedderburn, R. W. M.: Generalized Linear Models, J. R. Stat. Soc. Ser. A–G., 135, 370–384, https://doi.org/10.2307/2344614, 1972.
Normand, A. E., Smith, A. N., Clark, M. W., Long, J. R., and Reddy, K. R.: Chemical Composition of Soil Organic Matter in a Subarctic Peatland: Influence of Shifting Vegetation Communities Soil Chemistry, Soil Sci. Soc. Am. J., 81, 41–49, https://doi.org/10.2136/sssaj2016.05.0148, 2017.
Olefeldt, D., Goswami, S., Grosse, G., Hayes, D., Hugelius, G., Kuhry, P., Mcguire, A. D., Romanovsky, V. E., Sannel, A. B. K., Schuur, E. A. G., and Turetsky, M. R.: Circumpolar distribution and carbon storage of thermokarst landscapes, Nat. Commun., 7, 1–11, https://doi.org/10.1038/ncomms13043, 2016a.
Olefeldt, D., Goswami, S., Grosse, G., Hayes, D. J., Hugelius, G., Kuhry, P., Sannel, B., Schuur, E. A. G., and Turetsky, M. R.: Arctic Circumpolar Distribution and Soil Carbon of Thermokarst Landscapes, 2015, ORNL DAAC, Oak Ridge, Tennessee, USA [data set], https://doi.org/10.3334/ORNLDAAC/1332, 2016b.
Olefeldt, D., Hovemyr, M., Kuhn, M. A., Bastviken, D., Bohn, T. J., Connolly, J., Crill, P., Euskirchen, E. S., Finkelstein, S. A., Genet, H., Grosse, G., Harris, L. I., Heffernan, L., Helbig, M., Hugelius, G., Hutchins, R., Juutinen, S., Lara, M. J., Malhotra, A., Manies, K., McGuire, A. D., Natali, S. M., O'Donnell, J. A., Parmentier, F.-J. W., Räsänen, A., Schädel, C., Sonnentag, O., Strack, M., Tank, S. E., Treat, C., Varner, R. K., Virtanen, T., Warren, R. K., and Watts, J. D.: The Boreal–Arctic Wetland and Lake Dataset (BAWLD), Earth Syst. Sci. Data, 13, 5127–5149, https://doi.org/10.5194/essd-13-5127-2021, 2021a.
Olefeldt, D., Hovemyr, M., Kuhn, M., Bastviken, D., Bohn, T., Connolly, J., Crill, P., Euskirchen, E., Finkelstein, S., Genet, H., Grosse, G., Harris, L., Heffernan, L., Helbig, M., Hugelius, G., Hutchins, R., Juutinen, S., Lara, M., Malhotra, A., Manies, K., McGuire, D., Natali, S., O'Donnell, J., Parmentier, F.-J., Räsänen, A., Schädel, C., Sonnentag, O., Strack, M., Tank, S., Treat, C., Varner, R., Virtanen, T., Warren, R., and Watts, J.: The fractional land cover estimates from the Boreal-Arctic Wetland and Lake Dataset (BAWLD), 2021, Arctic Data Center [data set], https://doi.org/10.18739/A2C824F9X, 2021b.
Olvmo, M., Holmer, B., Thorsson, S., Reese, H., and Lindberg, F.: Sub-arctic palsa degradation and the role of climatic drivers in the largest coherent palsa mire complex in Sweden (Vissátvuopmi), 1955–2016, Sci. Rep.-UK, 10, 8937, https://doi.org/10.1038/s41598-020-65719-1, 2020.
Ottósson, J. G., Sveinsdóttir, A., and Harðardóttir, M.: Vistgerðirá Íslandi, Fjölrit Náttúrufræðistofnunar 54, Garðabær: NáttúrufræðistofnunÍslands (Habitat types in Iceland, Icelandic Institute of Natural History), ISBN 978-9979-9335-8-8, 2016.
Parviainen, M., and Luoto, M.: Climate envelopes of mire complex types in Fennoscandia, Geogr. Ann. A., 89, 137–151, https://doi.org/10.1111/J.1468-0459.2007.00314.X, 2007.
Payette, S., Delwaide, A., Caccianiga, M., and Beauchemin, M.: Accelerated thawing of subarctic peatland permafrost over the last 50 years, Geophys. Res. Lett., 31, L18208, https://doi.org/10.1029/2004GL020358, 2004.
Peng, X., Zhang, T., Frauenfeld, O. W., Wang, K., Luo, D., Cao, B., Su, H., Jin, H., and Wu, Q.: Spatiotemporal Changes in Active Layer Thickness under Contemporary and Projected Climate in the Northern Hemisphere, J. Climate, 31, 251–266, https://doi.org/10.1175/JCLI-D-16-0721.1, 2018.
Pissart, A.: Palsas, lithalsas and remnants of these periglacial mounds. A progress report, Prog. Phys. Geog., 26, 605–621, https://doi.org/10.1191/0309133302pp354ra, 2002.
Poggio, L., de Sousa, L. M., Batjes, N. H., Heuvelink, G. B. M., Kempen, B., Ribeiro, E., and Rossiter, D.: SoilGrids 2.0: producing soil information for the globe with quantified spatial uncertainty, SOIL, 7, 217–240, https://doi.org/10.5194/soil-7-217-2021, 2021.
R Core Team: R: A language and environment for statistical computing. R Foundation for Statistical Computing, Vienna, Austria, https://www.R-project.org/ (last access: 13 January 2023), 2022.
Ran, Y., Li, X., Cheng, G., Che, J., Aalto, J., Karjalainen, O., Hjort, J., Luoto, M., Jin, H., Obu, J., Hori, M., Yu, Q., and Chang, X.: New high-resolution estimates of the permafrost thermal state and hydrothermal conditions over the Northern Hemisphere, Earth Syst. Sci. Data, 14, 865–884, https://doi.org/10.5194/essd-14-865-2022, 2022.
Rissanen, T., Niittynen, P., Soininen, J., and Luoto, M.: Snow information is required in subcontinental scale predictions of mountain plant distributions, Global Ecol. Biogeogr., 30, 1502–1513, https://doi.org/10.1111/GEB.13315, 2021.
Rudy, A. C. A., Lamoureux, S. F., Treitz, P., and van Ewijk, K. Y.: Transferability of regional permafrost disturbance susceptibility modelling using generalized linear and generalized additive models, Geomorphology, 264, 95–108, https://doi.org/10.1016/J.GEOMORPH.2016.04.011, 2016.
Ruuhijärvi, R., Salminen, P., and Tuominen, S.: Distribution range, morphological types, and state of palsa mires in Finland in the 2010s, Suo, 73, 1–32, ISSN 0039-5471, 2022.
Saemundsson, T., Arnalds, O., Kneisel, C., Jonsson, H. P., and Decaulne, A.: The Orravatnsrustir palsa site in Central Iceland-Palsas in an aeolian sedimentation environment, Geomorphology, 167–168, 13–20, https://doi.org/10.1016/j.geomorph.2012.03.014, 2012.
Sannel, A. B. K.: Ground temperature and snow depth variability within a subarctic peat plateau landscape, Permafrost Periglac., 31, 255–263, https://doi.org/10.1002/ppp.2045, 2020.
Sannel, A. B. K., Hugelius, G., Jansson, P., and Kuhry, P.: Permafrost Warming in a Subarctic Peatland – Which Meteorological Controls are Most Important?, Permafrost Periglac., 27, 177–188, https://doi.org/10.1002/PPP.1862, 2016.
Schuur, E. A. G., McGuire, A. D., Schädel, C., Grosse, G., Harden, J. W., Hayes, D. J., Hugelius, G., Koven, C. D., Kuhry, P., Lawrence, D. M., Natali, S. M., Olefeldt, D., Romanovsky, V. E., Schaefer, K., Turetsky, M. R., Treat, C. C., and Vonk, J. E.: Climate change and the permafrost carbon feedback, Nature, 520, 171–179, https://doi.org/10.1038/nature14338, 2015.
Schwarz, G.: Estimating the Dimension of a Model, Ann. Stat., 6, 461–464, https://doi.org/10.1214/aos/1176344136, 1978.
Seppälä, M.: An experimental study of the formation of palsas, in: Proceedings of the Fourth Canadian Permafrost Conference, Calgary, Canada, 2–6 March 1981, 36–42, 1982.
Seppälä, M.: Palsas and Related Forms, in: Advances in periglacial geomorphology, edited by: Clark, M. J., John Wiley & Sons, Ltd, Chichester, 247–278, IBSN 0 471 90981 5, 1988.
Seppälä, M.: Depth of Snow and Frost on a Palsa Mire, Finnish Lapland, Geogr. Ann. A., 72, 191–201, https://doi.org/10.2307/521114, 1990.
Seppälä, M.: Snow depth controls palsa growth, Permafrost Periglac., 5, 283–288, https://doi.org/10.1002/PPP.3430050407, 1994.
Seppälä, M.: Surface abrasion of palsas by wind action in Finnish Lapland, Geomorphology, 52, 141–148, https://doi.org/10.1016/S0169-555X(02)00254-4, 2003.
Seppälä, M.: Palsa mires in Finland, The Finnish Environment, 23, 155–162, 2006.
Seppälä, M.: Synthesis of studies of palsa formation underlining the importance of local environmental and physical characteristics, Quaternary Res., 75, 366–370, https://doi.org/10.1016/j.yqres.2010.09.007, 2011.
Seppälä, M. and Hassinen, S.: Freeze-thaw indices in northernmost Fennoscandia according to meteorological observations, 1980–1991, in: Ground Freezing 97: Frost action in soils, edited by: Knutsson, S., A. A. Balkema, Rotterdam, 153–160, ISBN 9789054108726, 1997.
Shangguan, W., Hengl, T., Mendes de Jesus, J., Yuan, H., and Dai, Y. Mapping the global depth to bedrock for land surface modeling, J. Adv. Model. Earth Sy., 9, 65–88, https://doi.org/10.1002/2016MS000686, 2017.
Siewert, M. B.: High-resolution digital mapping of soil organic carbon in permafrost terrain using machine learning: a case study in a sub-Arctic peatland environment, Biogeosciences, 15, 1663–1682, https://doi.org/10.5194/bg-15-1663-2018, 2018.
Sim, T. G., Swindles, G. T., Morris, P. J., Baird, A. J., Cooper, C. L., Gallego-Sala, A. v., Charman, D. J., Roland, T. P., Borken, W., Mullan, D. J., Aquino-López, M. A., and Gałka, M.: Divergent responses of permafrost peatlands to recent climate change, Environ. Res. Lett., 16, 034001, https://doi.org/10.1088/1748-9326/ABE00B, 2021.
Sollid, J. L. and Sørbel, L.: Palsa bogs as a climate indicator – Examples from Dovrefjell, southern Norway, Ambio, 27, 287–291, 1998.
Swindles, G. T., Morris, P. J., Mullan, D., Watson, E. J., Turner, T. E., Roland, T. P., Amesbury, M. J., Kokfelt, U., Schoning, K., Pratte, S., Gallego-Sala, A., Charman, D. J., Sanderson, N., Garneau, M., Carrivick, J. L., Woulds, C., Holden, J., Parry, L., and Galloway, J. M.: The long-term fate of permafrost peatlands under rapid climate warming, Sci. Rep.-UK, 5, 17951, https://doi.org/10.1038/srep17951, 2016.
Tam, A., Gough, W. A., Kowal, S., and Xie, C.: The Fate of Hudson Bay Lowlands Palsas in a Changing Climate, Arct., Antarct. Alp. Res., 46, 114–120, https://doi.org/10.1657/1938-4246-46.1.114, 2014.
Taylor, K. E., Stouffer, R. J., and Meehl, G. A.: An Overview of CMIP5 and the Experiment Design, B. Am. Meteorol. Soc., 93, 485–498, https://doi.org/10.1175/BAMS-D-11-00094.1, 2012.
Terentieva, I. E., Glagolev, M. V., Lapshina, E. D., Sabrekov, A. F., and Maksyutov, S.: Mapping of West Siberian taiga wetland complexes using Landsat imagery: implications for methane emissions, Biogeosciences, 13, 4615–4626, https://doi.org/10.5194/bg-13-4615-2016, 2016.
Thuiller, W., Lafourcade, B., and Araujo, M.: Presentation Manual for BIOMOD, University of Joseph Fourier, Grenoble, 35 pp., 2010.
Thuiller, W., Lafourcade, B., Engler, R., and Araújo, M. B.: BIOMOD – a platform for ensemble forecasting of species distributions, Ecography, 32, 369–373, https://doi.org/10.1111/j.1600-0587.2008.05742.x, 2009.
Thuiller, W., Georges, D., Gueguen,M., Engler, R., and Breiner, F.: Biomod2: Ensemble Platform for Species Distribution Modelling, CRAN, https://cran.r-project.org/web/packages/biomod2/biomod2.pdf (last access: 13 January 2023), 2021.
Treat, C. C., Jones, M. C., Camill, A., Gallego-Sala, A., Garneau, M., Harden, J. W., Hugelius, G., Klein, E. S., Kokfelt, U., Kuhry, P., Loisel, J., Mathijissen, P. J. H., O'Donnell, J. A., Oksanen, P. O., Ronkainen, T. M., Sannel, A. B. K., Talbot, J., Tarnocai, C., and Väliranta, M.: Effects of permafrost aggradation on peat properties as determined from a pan-Arctic synthesis of plant macrofossils, J. Geophys. Res.-Biogeo., 121, 78–94, https://doi.org/10.1002/2015JG003061, 2016a.
Treat, C. C., Jones, M. C., Camill, A., Gallego-Sala, A., Garneau, M., Harden, J. W., Hugelius, G., Klein, E. S., Kokfelt, U., Kuhry, P., Loisel, J., Mathijissen, P. J. H., O'Donnell, J. A., Oksanen, P. O., Ronkainen, T. M., Sannel, A. B. K., Talbot, J., Tarnocai, C., and Väliranta, M.: Synthesis dataset of physical ad ecosystem properties from pan-arctic wetland sitesusing peat core analysis, PANGEA [data set], https://doi.org/10.1594/PANGAEA.863697, 2016b.
Treat, C. C., Jones, M. C., Camill, P., Gallego-Sala, A. V., Garneau, M., Harden, J. W., Hugelius, G., Klein, E. S., Kokfelt, U., Kuhry, P., Loisel, J., Mathijssen, P. J. H., O'Donnell, J. A., Oksanen, P. O., Ronkainen, T. M., Sannel, A., Britta, K., Talbot, J., Tarnocai, C., and Väliranta, M.: (Table S1) Site locations of cores and descriptions, PANGAEA [data set], https://doi.org/10.1594/PANGAEA.863689, 2016c.
Turetsky, M. R., Abbott, B. W., Jones, M. C., Anthony, K. W., Olefeldt, D., Schuur, E. A. G., Grosse, G., Kuhry, P., Hugelius, G., Koven, C., Lawrence, D. M., Gibson, C., Sannel, A. B. K., and McGuire, A. D.: Carbon release through abrupt permafrost thaw, Nature Geosci., 13, 138–143, https://doi.org/10.1038/s41561-019-0526-0, 2020.
Vasil'chuk, Y. K., Vasil'chuk, A. C., Budantseva, N. A., Yoshikawa, K., Chizhova, J. N., and Stanilovskaya, J. V.: Palsas in the southern part of the Middle Siberia permafrost zone, Eng. Geol. 3, 13–34, 2013a.
Vasil'chuk, Y. K., Vasil'chuk, A. C., and Repkina, T. Y.: Palsas in the polar part of the Middle Siberia permafrost zone, Eng. Geol. 2, 28–45, 2013b.
Vasil'chuk, Y. K., Budantseva, N. A., Vasil'chuk, A. C., and Chizhova, J. N.: Palsas in the Eastern Siberia and Far East permafrost zone, Eng. Geol., 1, 40–64, 2014.
Vorren, K.-D.: The first permafrost cycle in Faerdesmyra, Norsk. Geogr. Tidsskr, 71, 114–121, https://doi.org/10.1080/00291951.2017.1316309, 2017.
Wang, X., Ran, Y., Pang, G., Chen, D., Su, B., Chen, R., Li, X., Chen, H. W., Yang, M., Gou, X., Jorgenson, M. T., Aalto, J., Li, R., Peng, X., Wu, T., Clow, G. D., Wan, G., Wu, X., and Luo, D.: Contrasting characteristics, changes, and linkages of permafrost between the Arctic and the Third Pole, Earth-Sci. Rev., 230, 104042, https://doi.org/10.1016/J.EARSCIREV.2022.104042, 2022.
Wang, Y., Way, R. G., Beer, J., Forget, A., Tutton, R., and Purcell, M. C.: Significant underestimation of peatland permafrost along the Labrador Sea coastline in northern Canada, The Cryosphere, 17, 63–78, https://doi.org/10.5194/tc-17-63-2023, 2023.
Washburn, A. L.: What is a palsa?, in: Matematisch-Physikalische Klasse, Dritte folge, Mesoformen des reliefs im heutigen Periglazialraum, Berich über ein Symposium, 35, edited by: Poser, H. and Schunke, E., Vandenhoeck & Ruprecht, Göttingen, 34–47, 1983.
Xu, J., Morris, P. J., Liu, J., and Holden, J.: PEATMAP: Refining estimates of global peatland distribution based on a meta-analysis, University of Leeds [data set], https://doi.org/10.5518/252, 2017.
Xu, J., Morris, P. J., Liu, J., and Holden, J.: PEATMAP: Refining estimates of global peatland distribution based on meta-analysis, CATENA, 160, 134–140, https://doi.org/10.1016/j.catena.2017.09.010, 2018.
You, Q., Cai, Z., Pepin, N., Chen, D., Ahrens, B., Jiang, Z., Wu, F., Kang, S., Zhang, R., Wu, T., Wang, P., Li, M., Zuo, Z., Gao, Y., Zhai, P., and Zhang, Y.: Warming amplification over the Arctic Pole and Third Pole: Trends, mechanisms, and consequences, Earth-Sci. Rev., 217, 103625, https://doi.org/10.1016/j.earscirev.2021.103625, 2021.
Zhao, D.-M., Jiao, Y.-M., Wang, J.-L., Liu, Z.-L., Qiu, Y.-M., and Zhang, J.: Comparative performance assessment of landslide susceptibility models with presence-only, presence-absence, and pseudo-absence data, J. Mi Sci., 17, 2961–2981, https://doi.org/10.1007/s11629-020-6277-y, 2020.
Zoltai, S. C.: Palsas and Peat Plateaus in Central Manitoba and Saskatchewan, Can. J. Forest Res., 2, 291–301, https://doi.org/10.1139/x72-046, 1972.
Zoltai, S. C. and Tarnocai, C.: Properties of A Wooded Palsa in Northern Manitoba, Arct. Alp. Res., 3, 115–129, 1971.
Zoltai, S. C. and Tarnocai, C.: Perennially Frozen Peatlands in the Western Arctic and Subarctic of Canada, Can. J. Earth Sci., 12, 28–43, https://doi.org/10.1139/e75-004, 1975.
Zoltai, S. C., Siltanen, R. M., and Johnson, J. D.: A wetland data base for the western boreal, subarctic, and arctic regions of Canada, Northern Forestry Centre, Canadian Forest Service, Edmonton, 30 pp., ISBN 0662285395, 2000.