the Creative Commons Attribution 4.0 License.
the Creative Commons Attribution 4.0 License.
 | 04 Aug 2023
Monitoring snow water equivalent using the phase of RFID signals
Mathieu Le Breton
Éric Larose
Laurent Baillet
Yves Lejeune
Alec van Herwijnen
The amount of water contained in a snowpack, known as snow water equivalent (SWE), is used to anticipate the amount of snowmelt that could supply hydroelectric power plants, fill water reservoirs, or sometimes cause flooding. This work introduces a wireless, non-destructive method for monitoring the SWE of a dry snowpack. The system is based on an array of low-cost passive radiofrequency identification (RFID) tags, placed under the snow and read at 865–868 MHz by a reader located above the snow. The SWE was deduced from the phase delay of the tag's backscattered response, which increases with the amount of snow traversed by the radiofrequency wave. Measurements taken in the laboratory, during snowfall events and over 4.5 months at the Col de Porte test field, were consistent with reference measurements of cosmic rays, precipitation and snow pits. SWE accuracy was ±18 kg m−2 throughout the season (averaged over three tags) and ±3 kg m−2 during dry snowfall events (averaged over data from two antennas and four or five tags). The overall uncertainty compared to snow weighing was ±10 % for snow density in the range 61–390 kg m−3. The main limitations observed were measurement bias caused by wet snow (biased data were discarded) and the need for phase unwrapping. The method has a number of advantages: it allows for continuous measurement (1 min sampling rate in dry snow), it can provide complementary measurement of tag temperature, it does not require the reception of external data, and it opens the way towards spatialized measurements. The results presented also demonstrate that RFID propagation-based sensing can remotely monitor the permittivity of a low-loss dielectric material with scientific-level accuracy.
- Article
(7639 KB) - Full-text XML
- BibTeX
- EndNote


The snow water equivalent (SWE) of a snowpack represents the amount of water it contains (Fierz et al., 2009). SWE is used to anticipate the snowmelt that will feed hydropower plants, fill water reservoirs and potentially cause floods. It is also used to anticipate the risk of avalanches, to monitor the weight of snow on building, and to advance snow research. Many methods exist to monitor SWE, but all have drawbacks (for review, see Kinar and Pomeroy, 2015; Pirazzini et al., 2018; Royer et al., 2021). The methods based on sampling the snowpack (Denoth et al., 1984; Techel and Pielmeier, 2011) are destructive, require significant human resources and do not provide continuous measurements. Their automation, such as through the use of snow pillows (Beaumont, 1965), is technically complex. Snow models and satellite observations (Essery et al., 2013; Helbig et al., 2021; Tedesco et al., 2014) have a limited spatiotemporal resolution or suffer from limited accuracy. Radiation-based field methods (review: Royer et al., 2021) can conveniently and non-destructively monitor the SWE of a volume of snow. Among them, cosmic ray neutron probe (CRNP) (Kodama et al., 1979; Schattan et al., 2017) and gamma ray monitoring (GMON) (Choquette et al., 2013) are proven and mature methods, but they require specific instruments that are not only expensive but also complex to operate and calibrate (Royer et al., 2021). The dielectric permittivity of snow depends on its density and wetness, resulting in a direct relation between SWE and the delay of microwave transmission in the snow (Mätzler, 1987). Ground-penetrating radars can measure SWE from this delay (Bradford et al., 2009; Schmid et al., 2014, 2015), but they are expensive, and their data are complex to process. The GNSS (Global Navigation Satellite System; Koch et al., 2019, 2014) is a more convenient, lightweight, compact and low-cost method (Royer et al., 2021). Nevertheless, the GNSS estimates the SWE with a daily sampling rate (Koch et al., 2019), needs GNSS satellite reception (Royer et al., 2021) and has a spatial resolution limited by the number of receivers.
Radiofrequency identification (RFID) technology also uses microwaves to identify goods equipped with passive tags. Passive RFID tags are produced in numbers up to several billion units every year, allowing for low-cost tags (typically EUR 0.01–EUR 20) and reading devices (typically EUR 2000) to be viable. A passive tag is basically an antenna and an ultra-low-power microchip. It is powered by a continuous wave (typically around 865 MHz) emitted by the reader, which it modulates and backscatters to communicate to the reader. Recently, tags were developed with the capacity to sense their environment (reviewed by Costa et al., 2021), resulting in various applications in earth science (for review, see Le Breton et al., 2022). For example, tags were used to measure the temperature of the soil with an embedded sensor (Luvisi et al., 2016) and the presence of frost on the tag antenna through its change of impedance (Wagih and Shi, 2021). Tags can also be located by measuring the variations of phase delay over time, between the reader and the tag (review by Xu et al., 2023). This technique was used to measure landslide displacements (Le Breton et al., 2019; Charléty et al., 2022, 2023). Finally, Le Breton (2019) measured variations in the phase when the RFID signal transmits through snow and related this variation to snow density and thickness.
Therefore, we expect that an array of passive RFID tags placed under the snow may monitor SWE, using phase delay measurements. This may have a higher spatiotemporal resolution and lower cost than existing methods. We tested this hypothesis in the laboratory, during short snowfall events and throughout an entire season outdoors.
2.1 Theory: from phase delay to SWE
The velocity of an electromagnetic wave in snow depends on the real part of its relative permittivity (Tedesco, 2015) that we call simply “permittivity”. At the second order, the permittivity εs′ of dry snow at 10–1000 MHz depends on its density ρ (in kg m−3) as follows:
with m3 kg−1 and m6 kg−2 being the empirical constants from Tiuri et al. (1984). Each snow layer is considered a linear, isotropic, homogeneous and nonmagnetic medium, with a negligible scattering at 865 MHz. The dry snow has a very low conductivity (Mellor, 1977) and can be considered a low-loss dielectric medium (Bradford et al., 2009). The wave velocity v can then be expressed as a function of the snow permittivity ε′ and the velocity in a vacuum c ( m s−1) (Balanis, 2012):
Roughly speaking, dry snow with a density within the range 100–600 kg m−3 would have a permittivity within the range 1.1–2.3 (i.e., a relative velocity of 0.65–0.95). With the ray approximation, the phase ϕ (in radians) of a wave of frequency f (in Hz), propagating two ways through a medium over a distance d (in meters), equals
We represent the phase with the same sign as the time delay, for simplicity. Combining Eqs. (1), (2) and (3), the phase variation when a homogeneous layer of dry snow replaces a layer of air can be approximated as
A first-order Taylor expansion of the density gives
The expansion has an error of <0.5 % for 0–500 kg m−3 density, which is negligible compared to SWE measurement uncertainty in general. Knowing that SWE=ρz, with z the snow depth, the variation, ΔSWE, due to the presence of multiple layers of snow relates to the cumulative phase variation Δϕ:
At 865.7 MHz, a phase shift of π represents a SWE of 102 kg m−2. In practice, the RFID reader measures the phase , with an offset ϕ0 and an unknown integer k causing an ambiguity of kπ in our setup (which can reach 2kπ with modern readers) (Miesen et al., 2013). Appropriate instrumentation and processing workflows, presented in Sect. 2.2 and 2.3, reduce the unwanted variations of ϕ0(t) and solve the phase ambiguity.
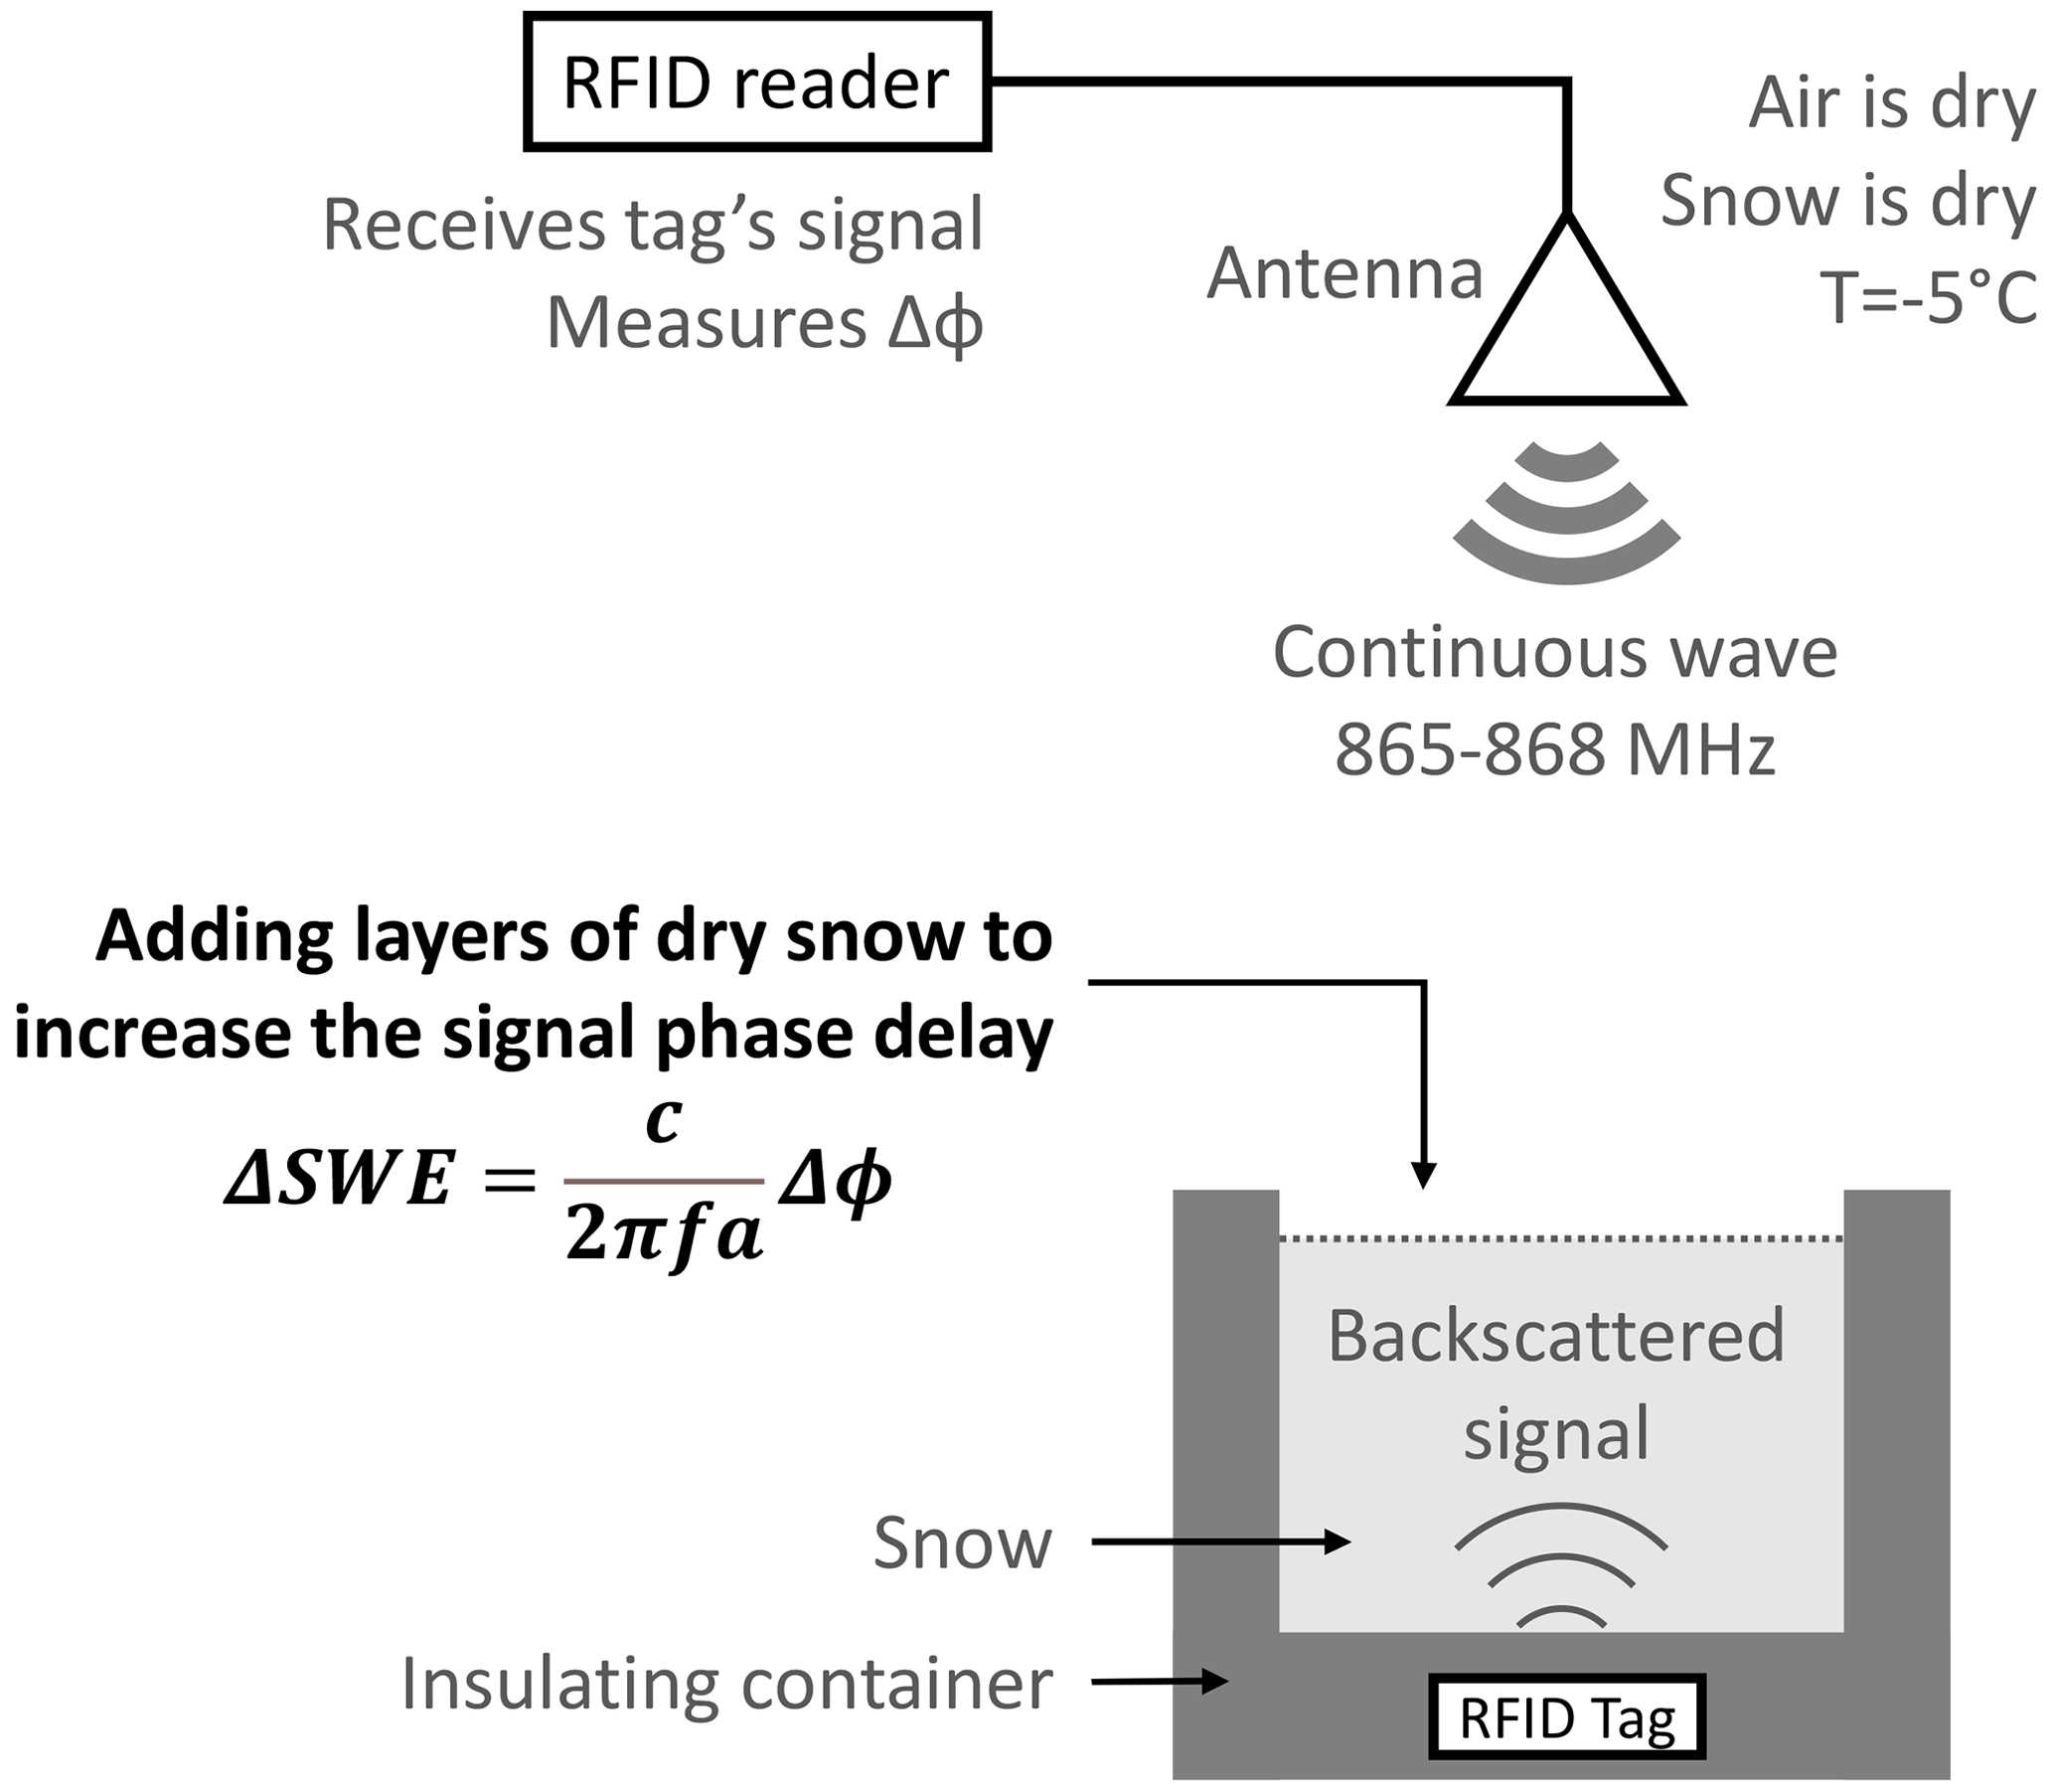
Figure 1Laboratory setup to simulate new layers of snow, and validate the SWE estimation from the change of phase delay between the tag and the reader antenna.
2.2 Instrumentation in the laboratory and outdoors
The experimental setup was designed to measure the increase in phase delay caused by the layers of dry snow formed between a reader antenna above the snow and a tag below the snow. The SR420 reader (Impinj) emits and receives a radiofrequency signal at selected frequencies (865.7, 866.3, 866.9 and 867.5 MHz) through an antenna. A slot antenna was used in the laboratory (model IPJ-A0311-EU1, 5 dBi gain, linear polarization, 50∘ / 100∘ beamwidth at −3 dB), and two patch antennas were used outdoors (model Kathrein 52020251, 12.5 dBi gain, linear polarization, 42∘ / 42∘ beamwidth at −3 dB, IP65). The tags (Survivor B, from Confidex, 2019) measure mm and weigh 32 g each (see Fig. B3). These tags are essentially passive, but the models used in this study were assisted by a tiny battery (with a lifetime of several years) to increase sensitivity and read range. These devices are termed “battery-assisted” or “semi-passive” tags. The method is suitable for use with any passive backscattering tag (either battery-assisted or batteryless) but not with active tags. Each tag includes an antenna which converts the RF wave into a current, waking up the microcircuit contained in the tag. The microcircuit (EM4325, from EM Microelectronic, Marin) has ultra-low power requirements (<10 µW when interrogated) and embeds an integrated temperature sensor with ±2.0 ∘C initial accuracy over −40 to 60 ∘C (Confidex, 2019) and ±0.25 ∘C resolution and accuracy over −7 to 0 ∘C after calibration (see Appendix B). The material was chosen to reduce thermal influence on the phase (Le Breton et al., 2017). During acquisition, the reader interrogates each tag sequentially for 30 ms, following a standard RFID protocol (EPC-Gen2, 2015). When requested by the reader, a tag communicates its unique identifier and any other data from its memory by backscattering the signal and modulating its amplitude. For each tag, the reader measures the “phase difference of arrival” between the two modulated states of the incoming signal compared to the continuous wave emitted (Nikitin et al., 2010). Here, this is termed the “phase”. The reflection from the tag being interrogated, which changes between the two modulation states, is thus distinguishable from the static reflections originating from the environment and other tags. Phase measurement is possible with backscattering communication, because, unlike with classical wireless communications, the reader can easily synchronize the emitted and received waves.
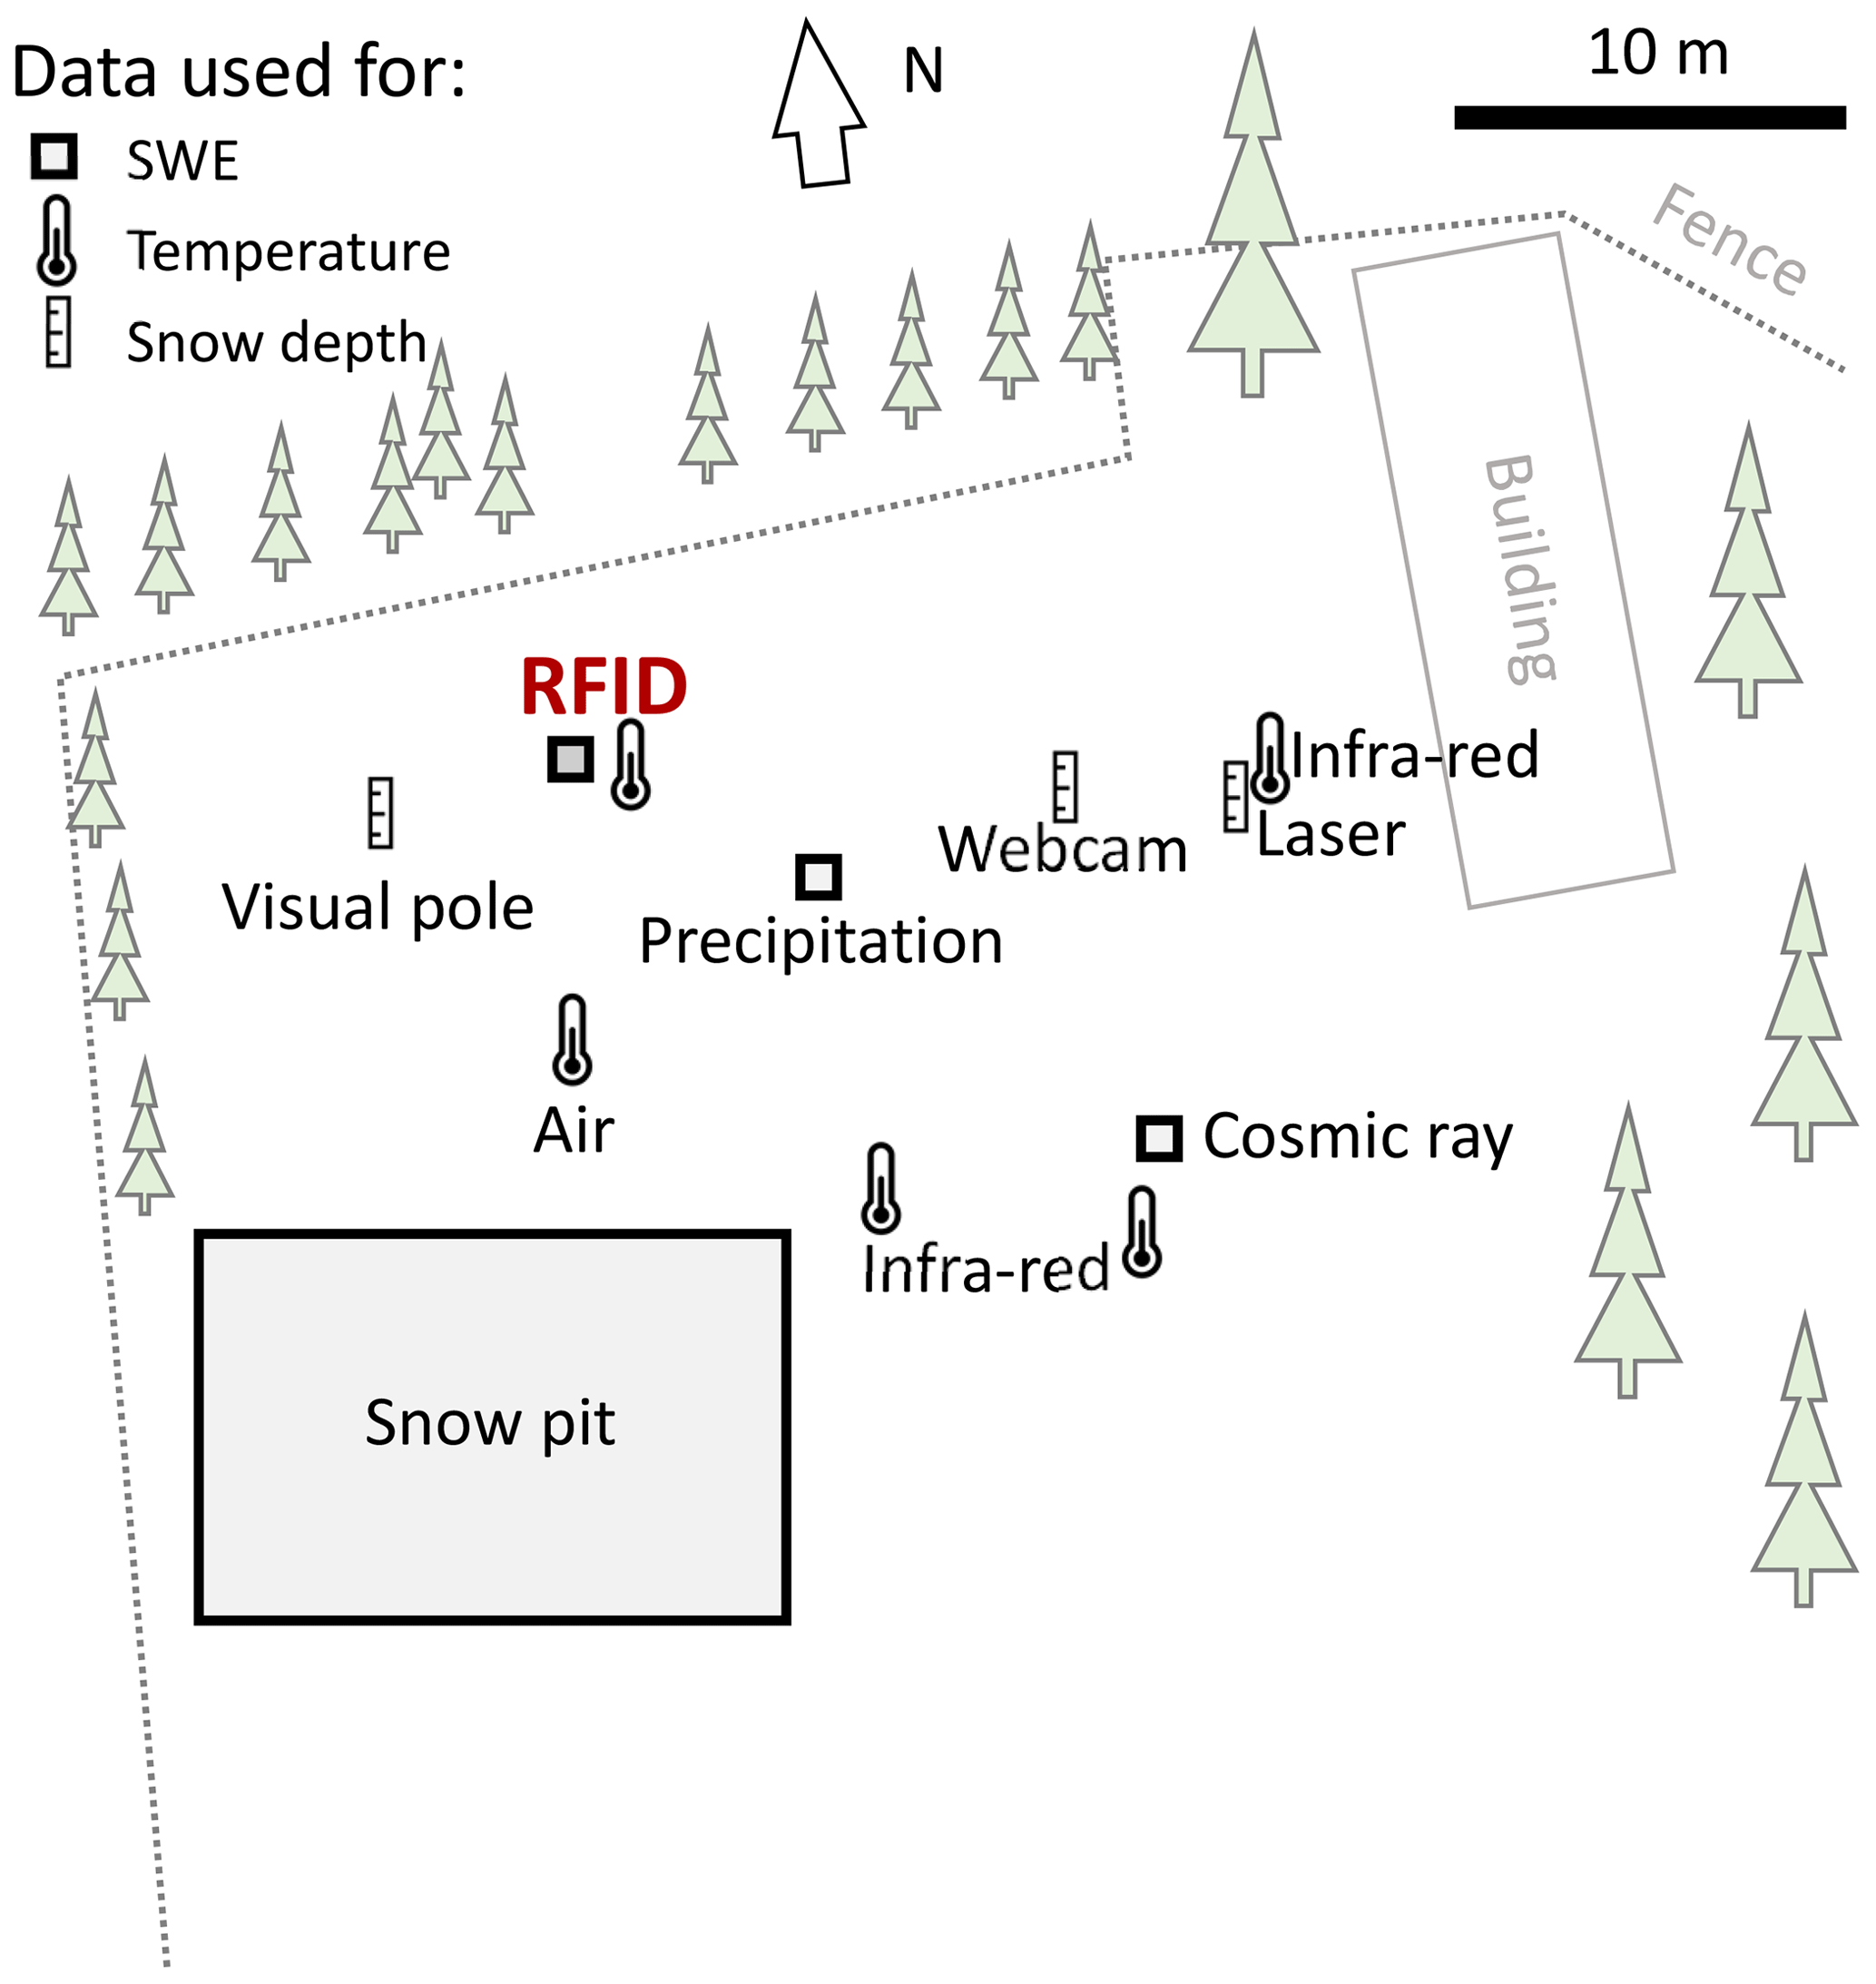
Figure 2Site of Col de Porte, highlighting the positions of the reference instruments. Modified from Lejeune et al. (2019).
In the laboratory experiment, one reader antenna and one tag were placed 1 m above and 0.05 m below a 0.4×0.4 m polystyrene box, respectively (Fig. 1). Step by step, layers of dry snow were added to the box to form an increasingly thick snow block, from no snow to approximately 0.24 m deep snow. The whole experiment was performed in a cold room (−5 ∘C). The snow, collected outdoors, was kept dry. It was sieved to add each new layer to the box. After adding each layer, the snow surface was smoothed before measuring its thickness and the weight of the entire snow block to estimate its density. The experiment was repeated with snow densities of 230, 275 and 330 kg m−3 and maximum snow depths of 0.24, 0.237 and 0.245 m, respectively. The snow density was increased by repeatedly sieving the same snow but changing the mesh size.
The continuous-field-monitoring setup was installed during winter 2019–2020 at Col de Porte, France (altitude 1325 m). Col de Porte is the French reference site for snow measurements and instrument testing (Lejeune et al., 2019), and it is operated by Météo-France's center for snow study (CEN). The numerous instruments present and manual surveys conducted on this site provided an exhaustive dataset describing the snowpack and its environment throughout the experiment (Fig. 2). Precipitation was measured by an automatic weighing gauge, and used to estimate the variation in SWE caused by snowfall events. The snow height was measured by a number of methods: automatic laser instruments, manual surveys in snow pits, and manual inspection of a pole near the RFID tags. The SWE was estimated automatically every day with a CRNP. The air temperature was measured by a meteorologic station, and the snow surface temperature was monitored by infrared sensors. A webcam collected images of the measurement sites every hour, which were used to monitor the melt surrounding individual tags.
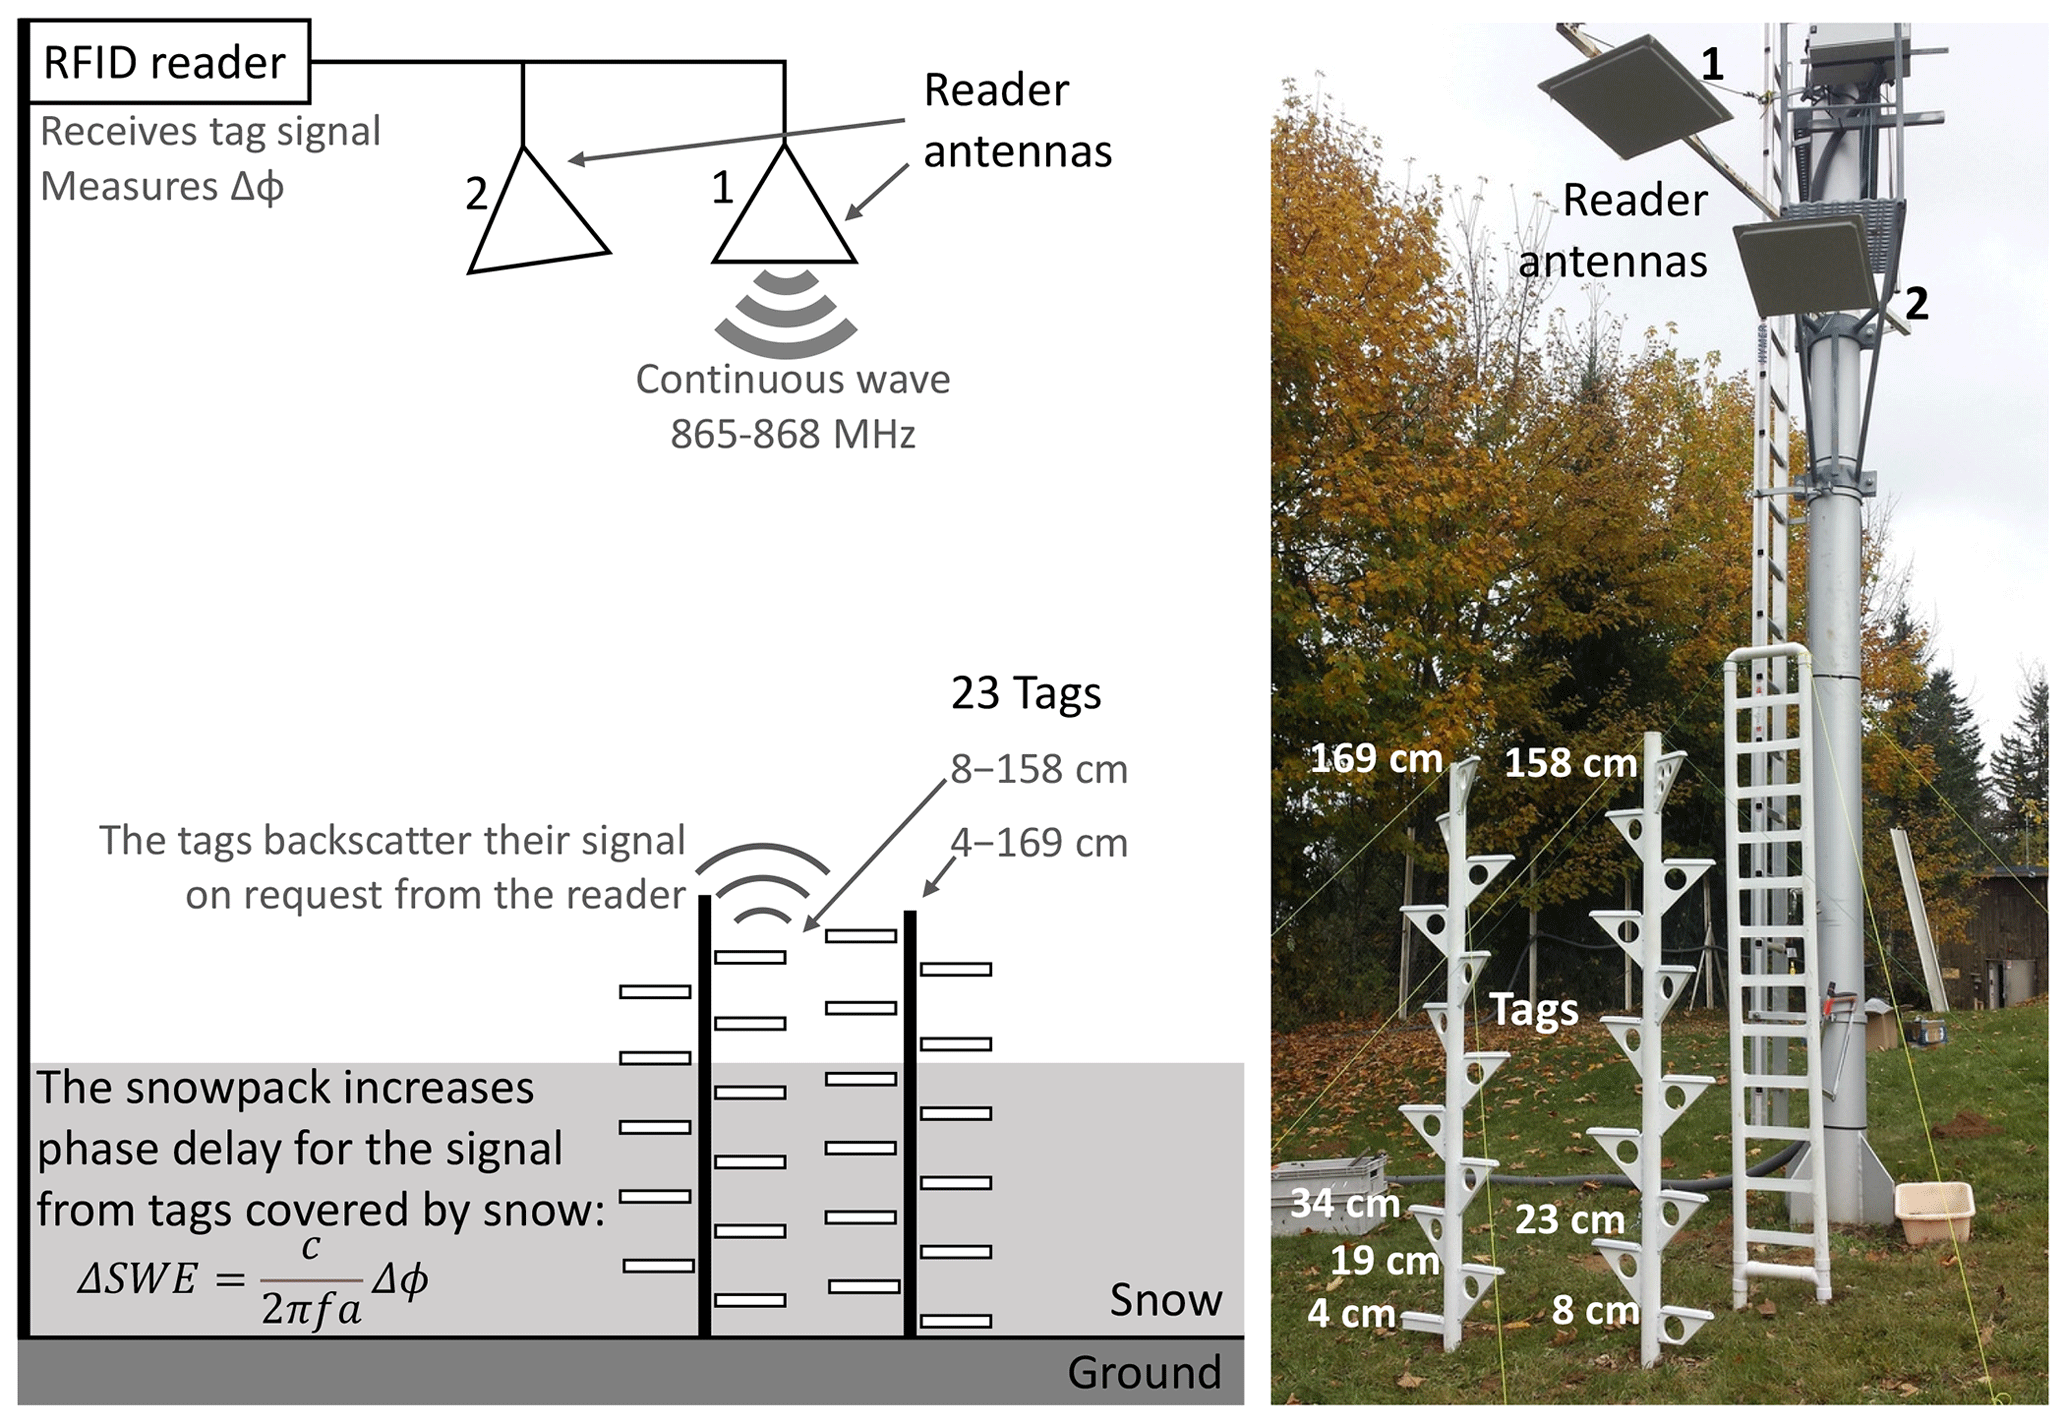
In the field installation, two vertical arrays of tags – comprising 12 and 11 tags each – were planted on the ground. The tags were placed 4–169 and 8–158 cm above ground, respectively, with 0.15 cm spacing (see Fig. 3). The tags were supported by a 0.05 m diameter and 1.70 m high PVC (polyvinyl chloride) tube, equipped with multiple 0.15 m long and 0.02 m thick horizontal plastic arms. The arms were supported from below, and the PVC tubes were maintained by rigging strings to avoid movement. The two reader antennas were placed above the tags, 4 m from the ground. The reader antennas were supported by a metallic arm attached to a large vertical metallic pole, 3 m from the tag support. The acquisition lasted from 22 October 2019 to 27 March 2020. Experiments initially focused on four snowfall events, during which the top layers of snow remained entirely dry; then the SWE was computed over the whole winter, using the workflow described below.
2.3 Workflow to compute SWE outdoors
The SWE was computed over the season using the following steps. The choices and adaptations specific to this study are marked in italics.
-
Data selection. Phase data were separated for each combination of tag, reader antenna and available frequency to select the data to be processed. The tags covered by the snow are selected by their daily temperature variation that is smaller compared to tags in the air (Reusser and Zehe, 2011) (see temperature data in Fig. B2).
We selected for individual events of dry snowfall based on dry snow criteria (step 3) on (1) 11 December 2019, (2) 12/13 December 2019, (3) 10 January 2020 and (4) 27 February 2020. We used only the tags covered by snow at heights of 4–23 cm for events 1 and 3 and at heights of 4–34 cm for events 2 and 4 (Sect. 3.2).
We split the season into three periods, starting on (1) 23 October 2019, (2) 19 December 2019 and (3) 3 February 2020. We used tags at a height of 4 cm for period 1 and at heights of 4–19 cm for periods 2–3 (Sect. 3.3).
-
Phase unwrapping. The phase was unwrapped to cumulate phase variations over time to solve its kπ ambiguity (equivalent to k×102 kg m−2 of SWE for dry snow), with the hypothesis of data continuity.
We combined the phases of the four frequencies available. We also removed the fast variations of phase using a complex domain averaging over 3 min, unwrapped the smoothed phase and then reintroduced these variations (see Charléty et al., 2023).
-
Dry snow selection. The periods of dry snow were selected to ensure that the snow permittivity was influenced only by its density (needed for Eq. 6) and not by its liquid water content (Tiuri et al., 1984).
For most of the season, we identified and removed wet-snow periods from their phase delay, which displayed rapid and non-monotonic fluctuations over the day, typically from 08:00 to 24:00 LT. It was also validated from the temperature of the snow surface <0 ∘C measured by infrared sensors and by tags close to the surface, as well as from air temperature <0 ∘C when precipitation occurred. After 3 March 2020, the snowpack rarely refroze completely during the night, so we picked only the period of driest snowpack (with a local phase maximum), typically 06:30–07:00 LT. We also identified the four individual events of dry snowfall.
-
SWE conversion. The variation of phase was converted into a variation of dry snow SWE using Eq. (6).
-
Recalibration in case of technical issues. Sometimes, recalibration may be required to compensate for a technical issue (Charléty et al., 2023). The alteration of the snowpack just above the tags can cause a local SWE offset and would need to be compensated. In addition, after a long data gap due to technical issues, the phase ambiguity might need to be resolved. In this case, the variation of k occurring during the gap could be estimated with an independent method whose accuracy is below half the ambiguity.
However, we recalibrated the SWE twice to compensate for accelerated melting around the tag supports during warm periods with rainfall (see Appendix C). This recalibration resulted in three distinct periods in Fig. 6, with two periods recalibrated based on snow pit measurements (marked as “ref”). We encountered no data gap causing ambiguity issues here.
-
Spatial averaging. The error caused by multipathing interference can be reduced by computing the mean data between the different tags and antennas.
We used the tags selected in step 1, measured from two antennas during the snowfall events, and from one antenna, with the highest signal strength, during the season.
-
Time averaging. Data were averaged at the desired sampling duration.
We kept the 1 min time sampling for the snowfall events (Fig. 5). We averaged over 12 h for the entire season to account for the discarded periods of wet snow (Fig. 6).
The tag temperature sensors were also calibrated at 0 ∘C when surrounded by wet snow (see Appendix B).
3.1 Laboratory experiments
Laboratory results confirmed that the variation in SWE estimated from the RFID phase (Fig. 4, solid line) was consistent with the SWE estimated from snow weights, over the complete cumulated layers (Fig. 4, dotted lines). This result was verified for snow densities of 230, 275 and 335 kg m−3, corresponding to snow permittivities of 1.43, 1.51 and 1.64, respectively (Eq. 1). The estimated SWE oscillated depending on the snow depth, within ±10 kg m−2 of the value obtained by weighing the snow. The spatial period corresponded to half a wavelength in the snowpack (0.135–0.145 m for the highest to lowest density, respectively), which strongly suggests that it results from fringes of multipath interference caused by reflection of waves at the air–snow interface (Le Breton, 2019). In conclusion, the method worked well under controlled conditions, with ±10 kg m−2 accuracy for a single tag–antenna combination and an error that could mostly be attributed to multipathing.
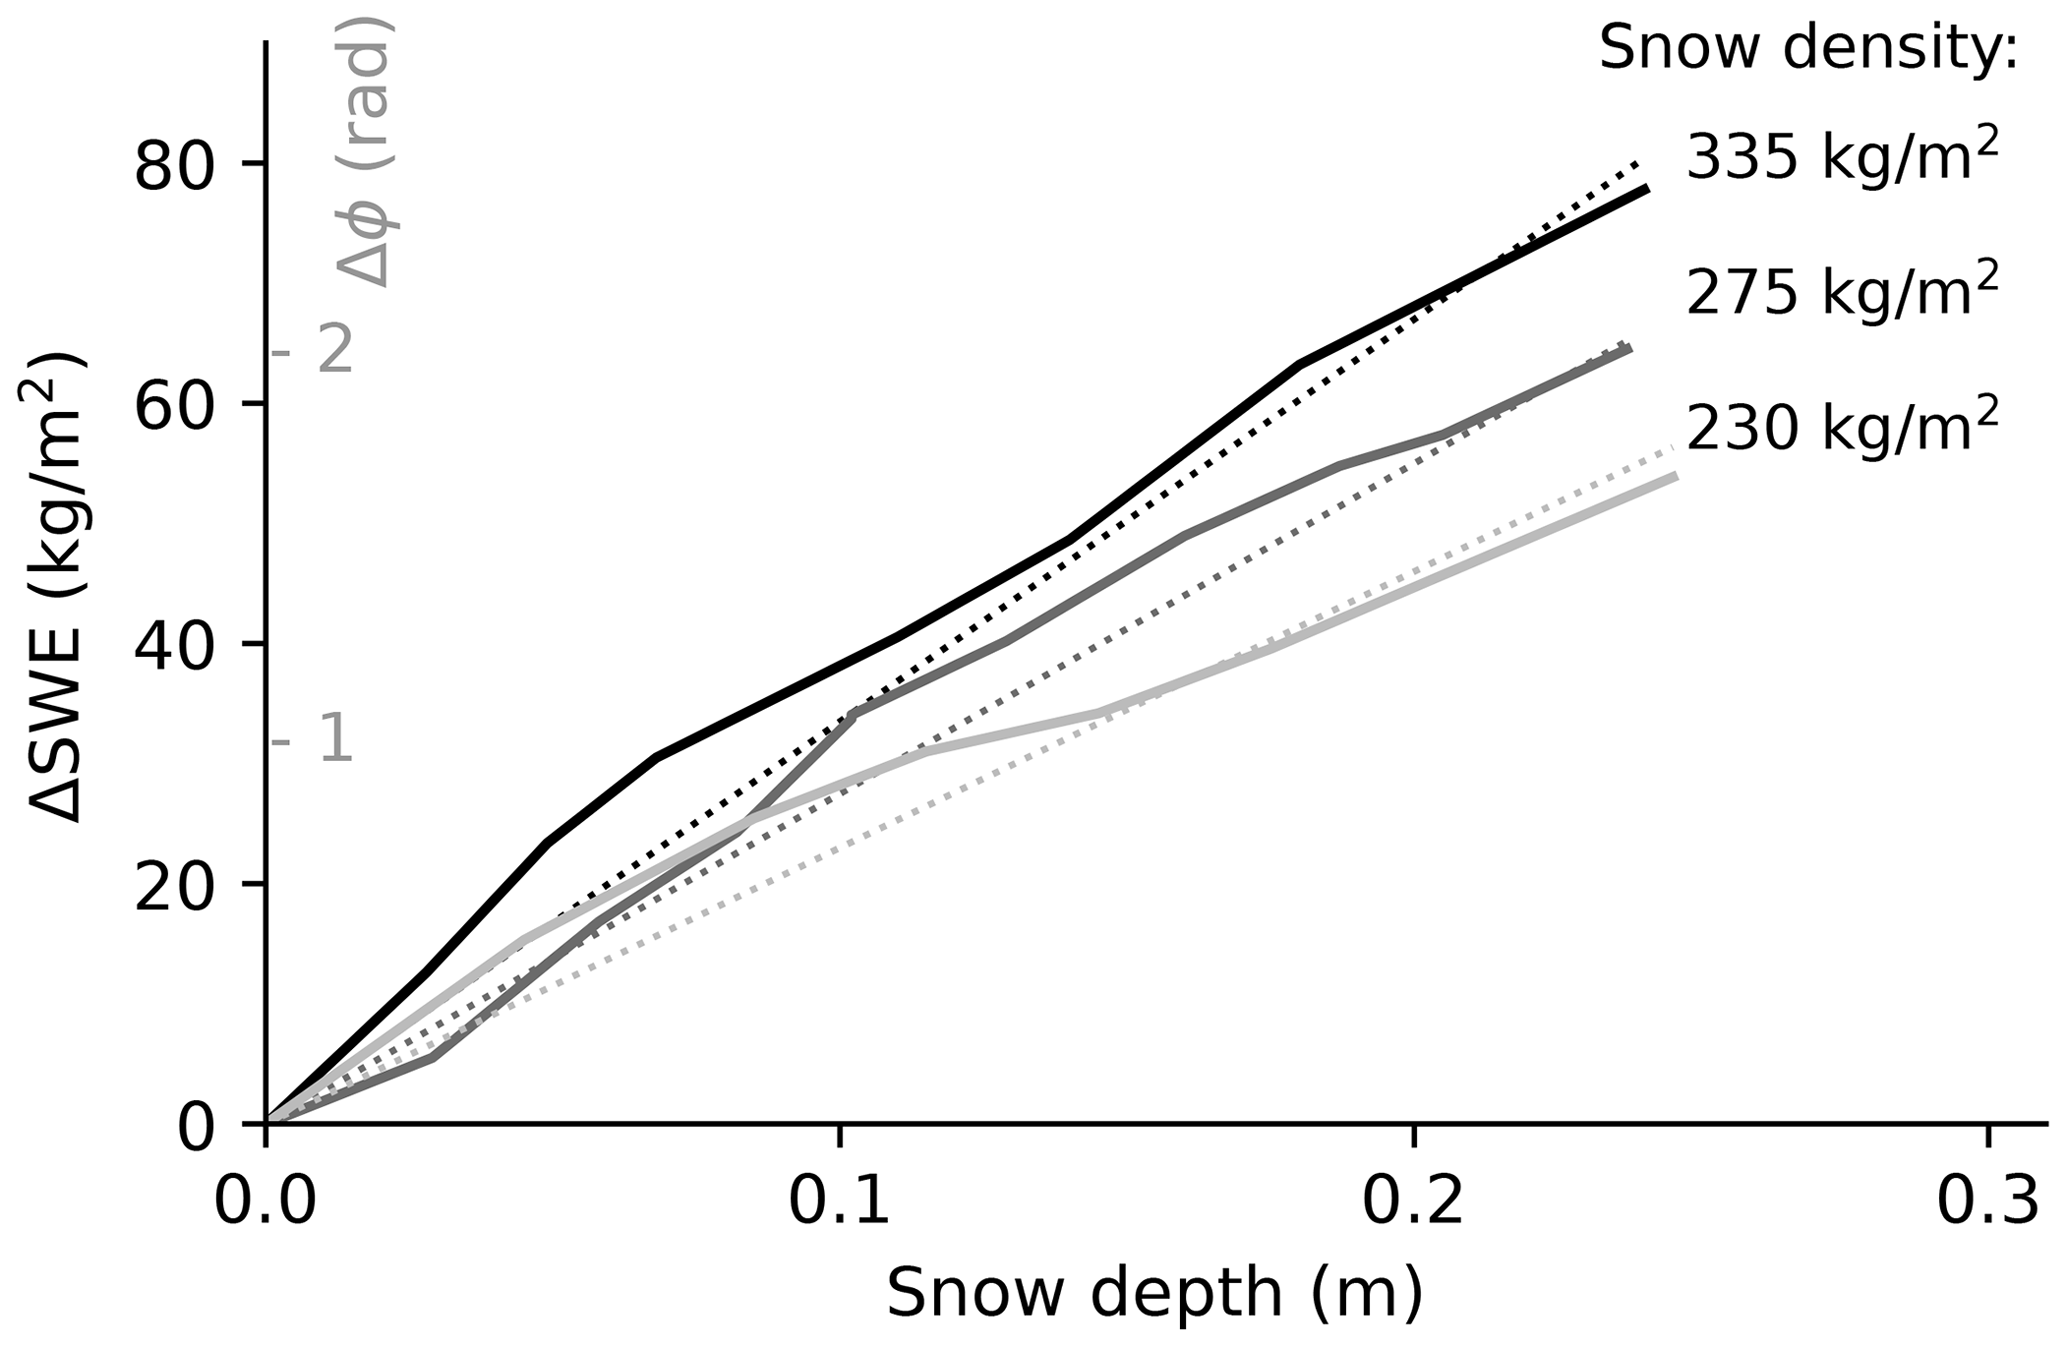
Figure 4Cumulated variations of SWE obtained from RFID phase measurement (solid lines) and weighing (dotted lines), as a function of the thickness of the snow block, for three densities.
3.2 Snowfall events
For each dry snowfall event selected, the depth of snow and the cumulated precipitation – which equals the SWE when no melting occurs – were compared to the RFID measurements made every minute (Fig. 5). The SWE estimated from a single tag–antenna combination exhibited dispersion up to ±30 kg m−2. The dispersion was different for each event, each tag and each antenna, suggesting that the method is sensitive to tag position, antenna position and the snowpack's geometry. For example, on 11 December 2019, the 18 and 23 cm high tags provided biased SWE only from antenna 1. The dispersion is consistent with the expected influence of multipathing (see the Discussion and Appendix D). The average SWE estimated from all the tags and antennas (Fig. 5, black line) was very close to the cumulated precipitation (black squares), with a full-amplitude error up to ±3 kg m−2 (details in Appendix A). In conclusion, the RFID array proved efficient at measuring SWE accurately with 1 min resolution during short periods.
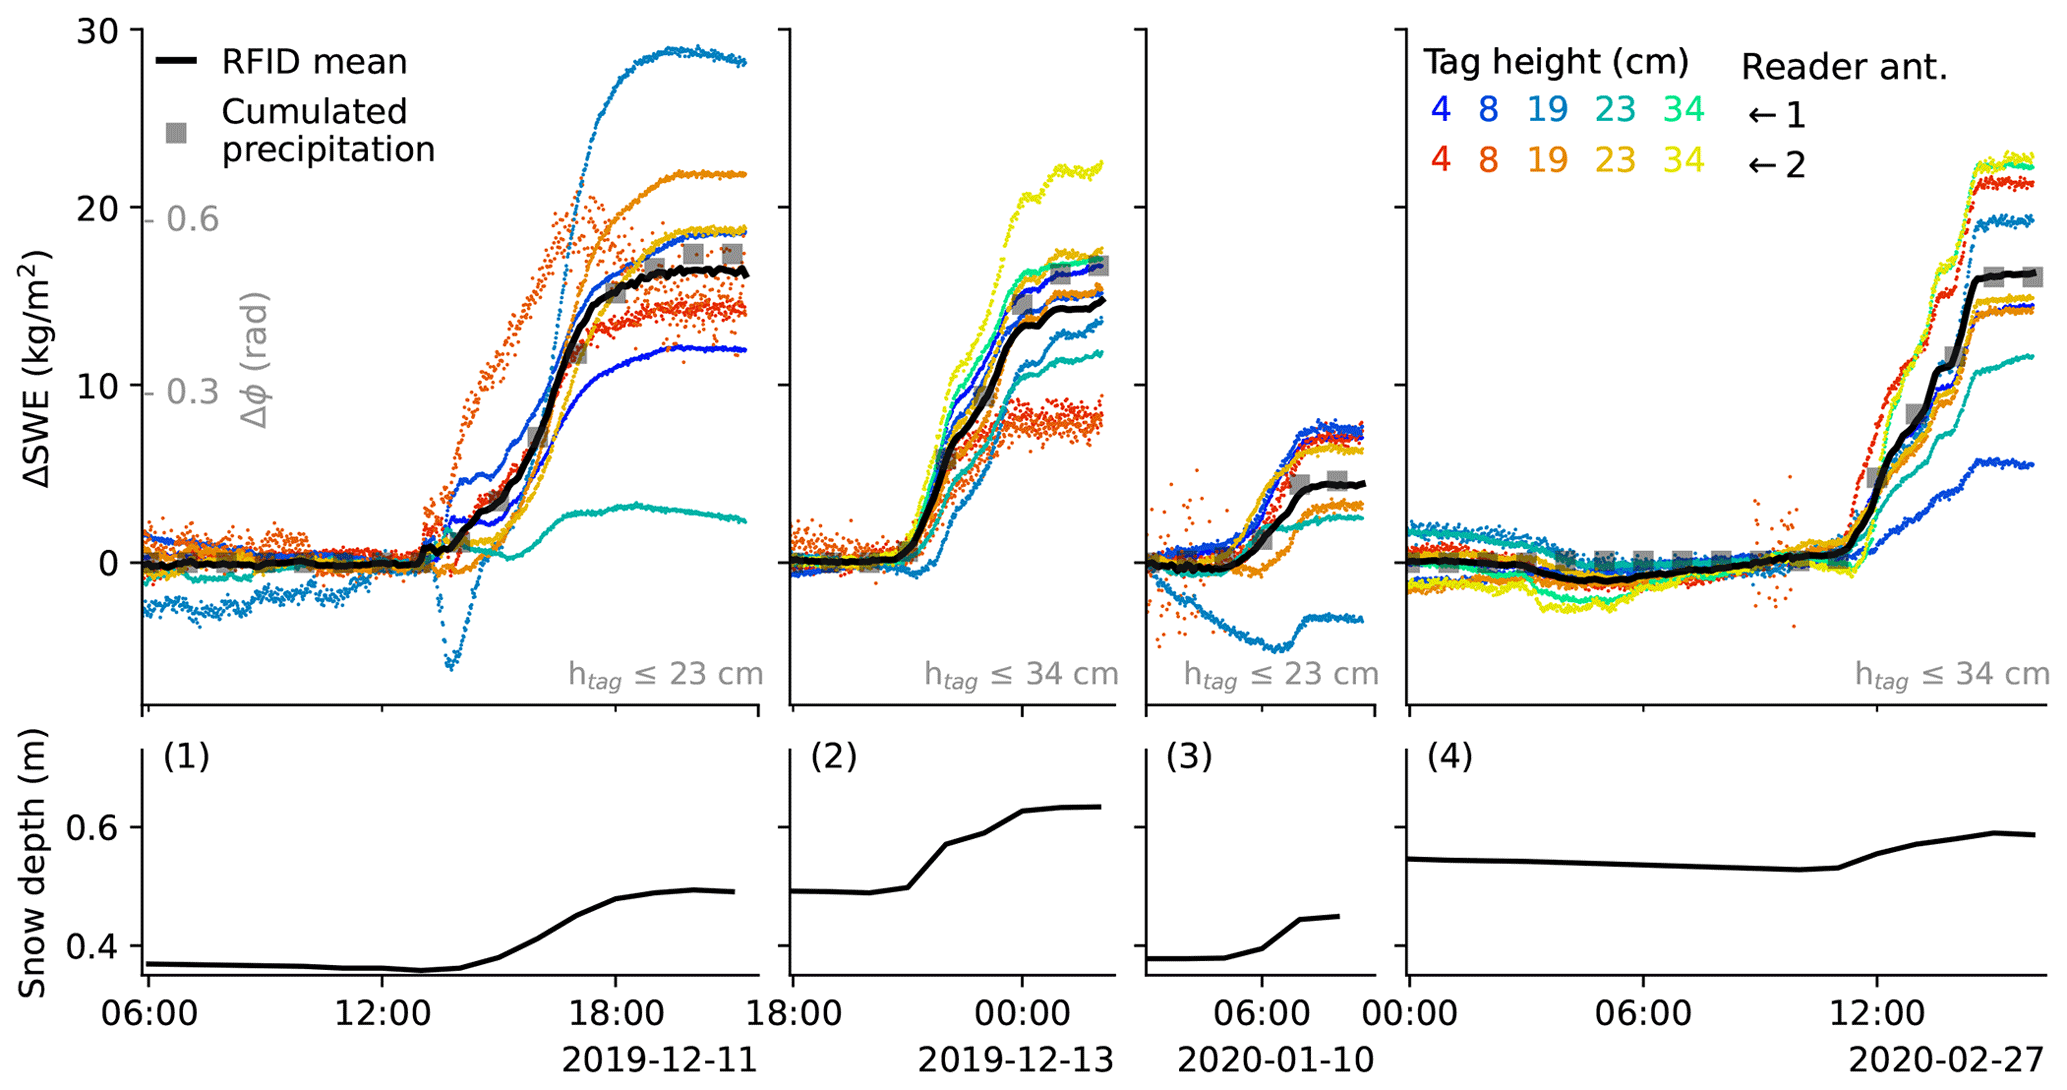
Figure 5Increase of the SWE measured over the course of four dry snowfall events, using single tags and antennas from the RFID array (see Fig. 3) (in color), the median value of the array (black line) and precipitation measured by weighing gauge (gray squares). The snow depth measured by laser is also displayed. Times in the figure are given in local time.
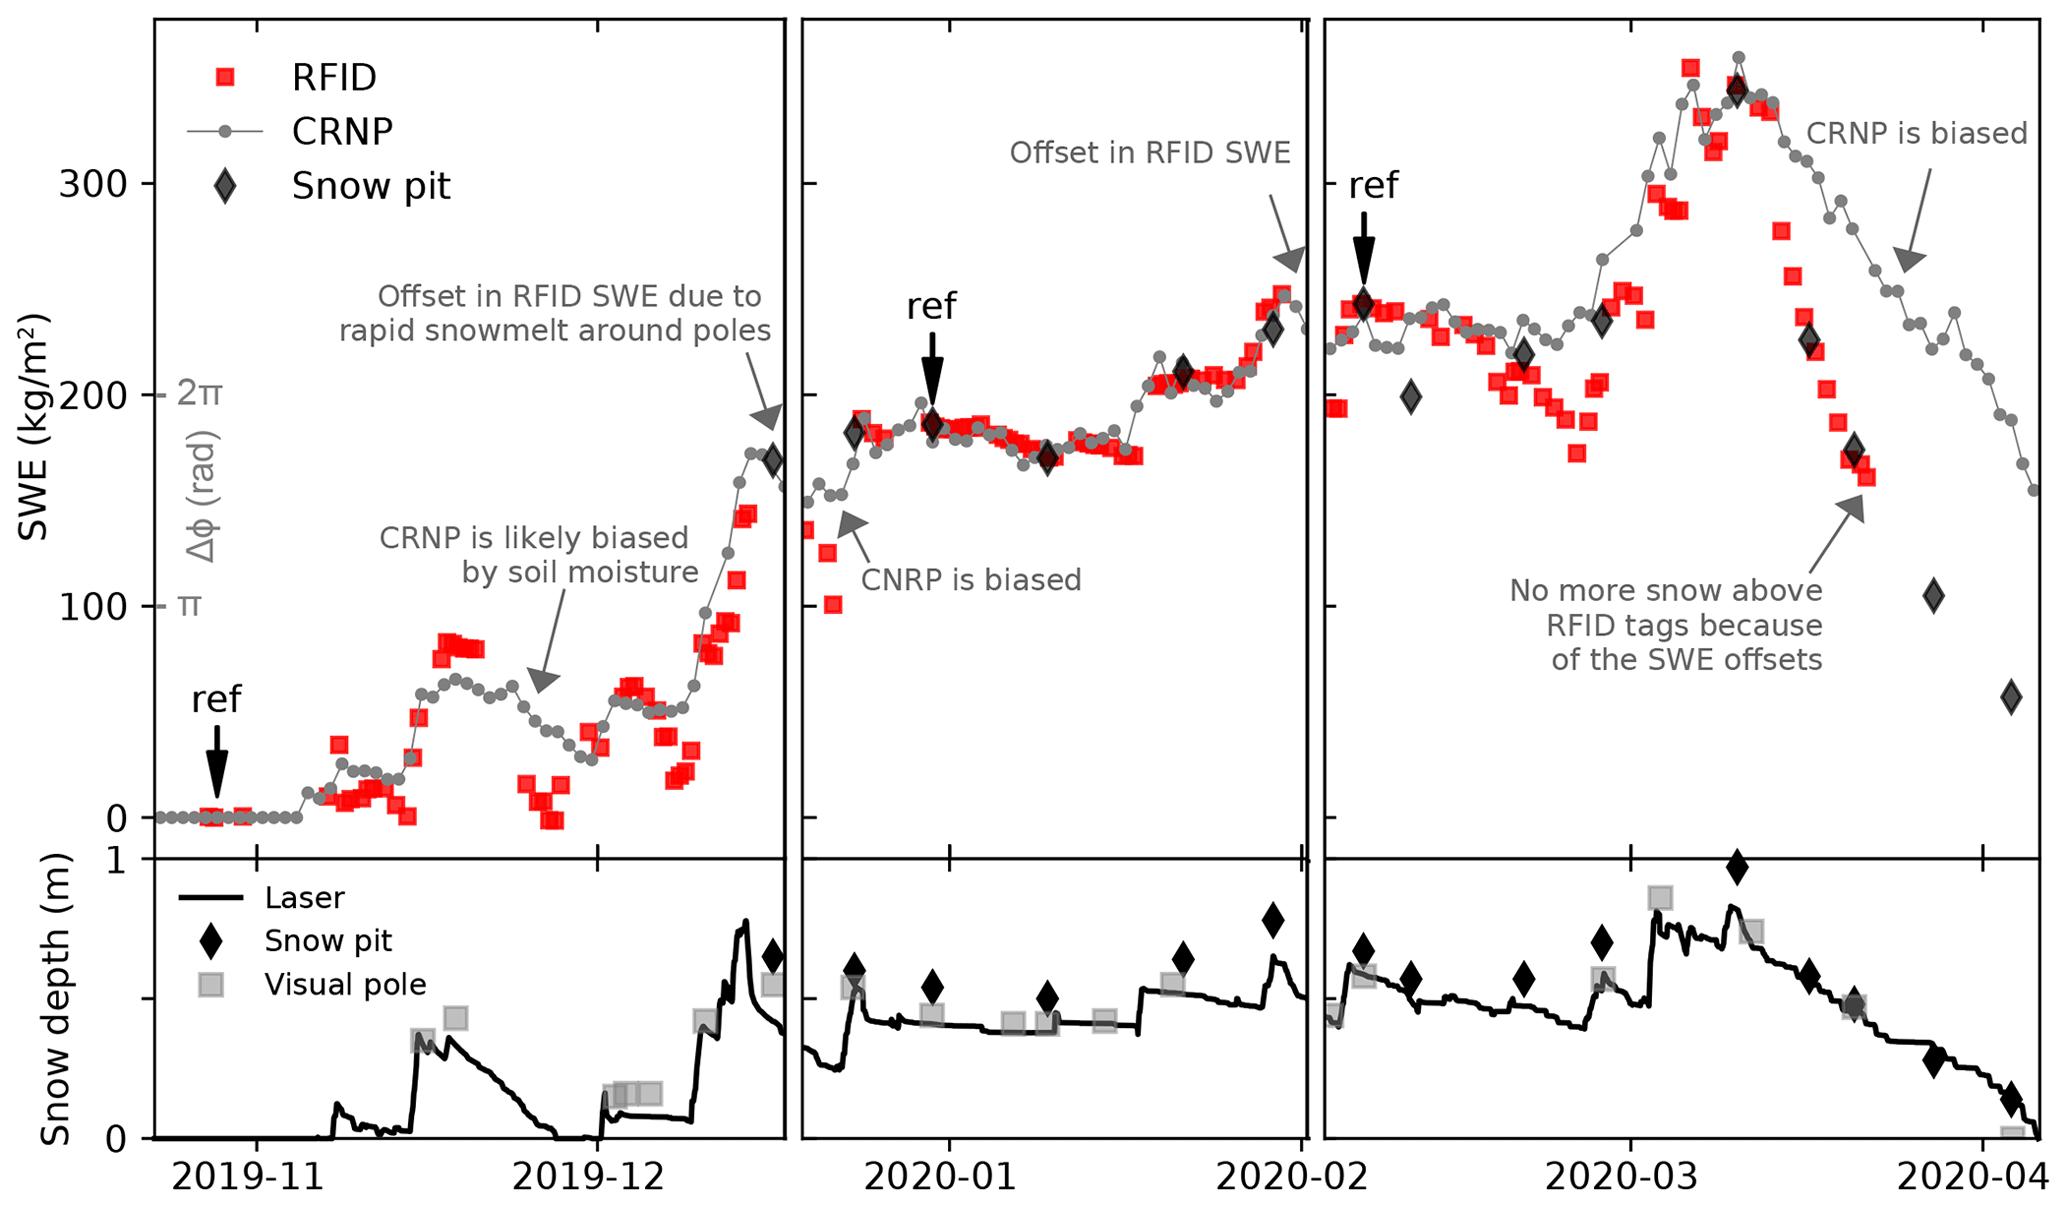
Figure 6(Top) SWE measurements for the three periods using RFID, CRNP and snow pit survey methods. (Bottom) Snow depth measurements using a laser sensor, manual surveying and a visual pole. During the first period, the data were derived only from the 4 cm high tag, due to the shallow snow depth. In subsequent periods, the data from the three lowest tags (4, 8 and 19 cm) were averaged. For each period, the SWE RFID estimation was calibrated relative to a reference SWE based on a manual measurement, indicated by the “ref” arrow.
3.3 Entire season
Over the entire season, the SWE estimated by RFID (Fig. 6, in red) is consistent with the CRNP and snow pit measurements (in gray and black). During snowmelt periods, around 27 November 2019 and after 8 March 2020, RFID sensing appeared to be more accurate than CRNP, which is influenced by water present in the soil (Sigouin and Si, 2016). Given the accuracy of CRNP (which has its own limitations) and the spatial heterogeneity in the snowpack, we considered the results close enough to validate the RFID method. We measured an uncertainty of ±18 kg m−2 compared to the snow pit period (see Appendix A).
3.4 SWE measurement accuracy compared to weighing
The difference between the SWE measured by RFID and by weighing was ±10 kg m−2 in the laboratory, ±3 kg m−2 during short snowfalls and ±18 kg m−2 during the last two periods of the season (details in Fig. A1). We did not compare the measurements with CRNP values, as we considered it not to be accurate enough to represent ground truth data. Laboratory measurements were not the most accurate, because the single combination of tag and antenna made them more sensitive to multipathing. On the contrary, the most accurate measurements occurred during snowfall, with an averaging over four to five tags and two antennas. Therefore, increasing the number of tags and antennas is the most important factor when seeking to increase accuracy, with most inaccuracies caused by multipathing.
The snow density (Fig. 7), computed as the SWE normalized relative to the snow depth, indicates that the RFID measurements occurred at 61–390 kg m−3 snow density. The role of settling (Helfricht et al., 2018) was partially compensated in the density calculation by removing the trend of snow depth decrease (visible for events 1 and 4) obtained after precipitation. Both RFID and weighing SWE methods used the same snow depth, so the relative error is unchanged. Overall, RFID measurements fitted within a 10 % relative uncertainty compared to weighing for a 61 to 390 kg m−3 density.
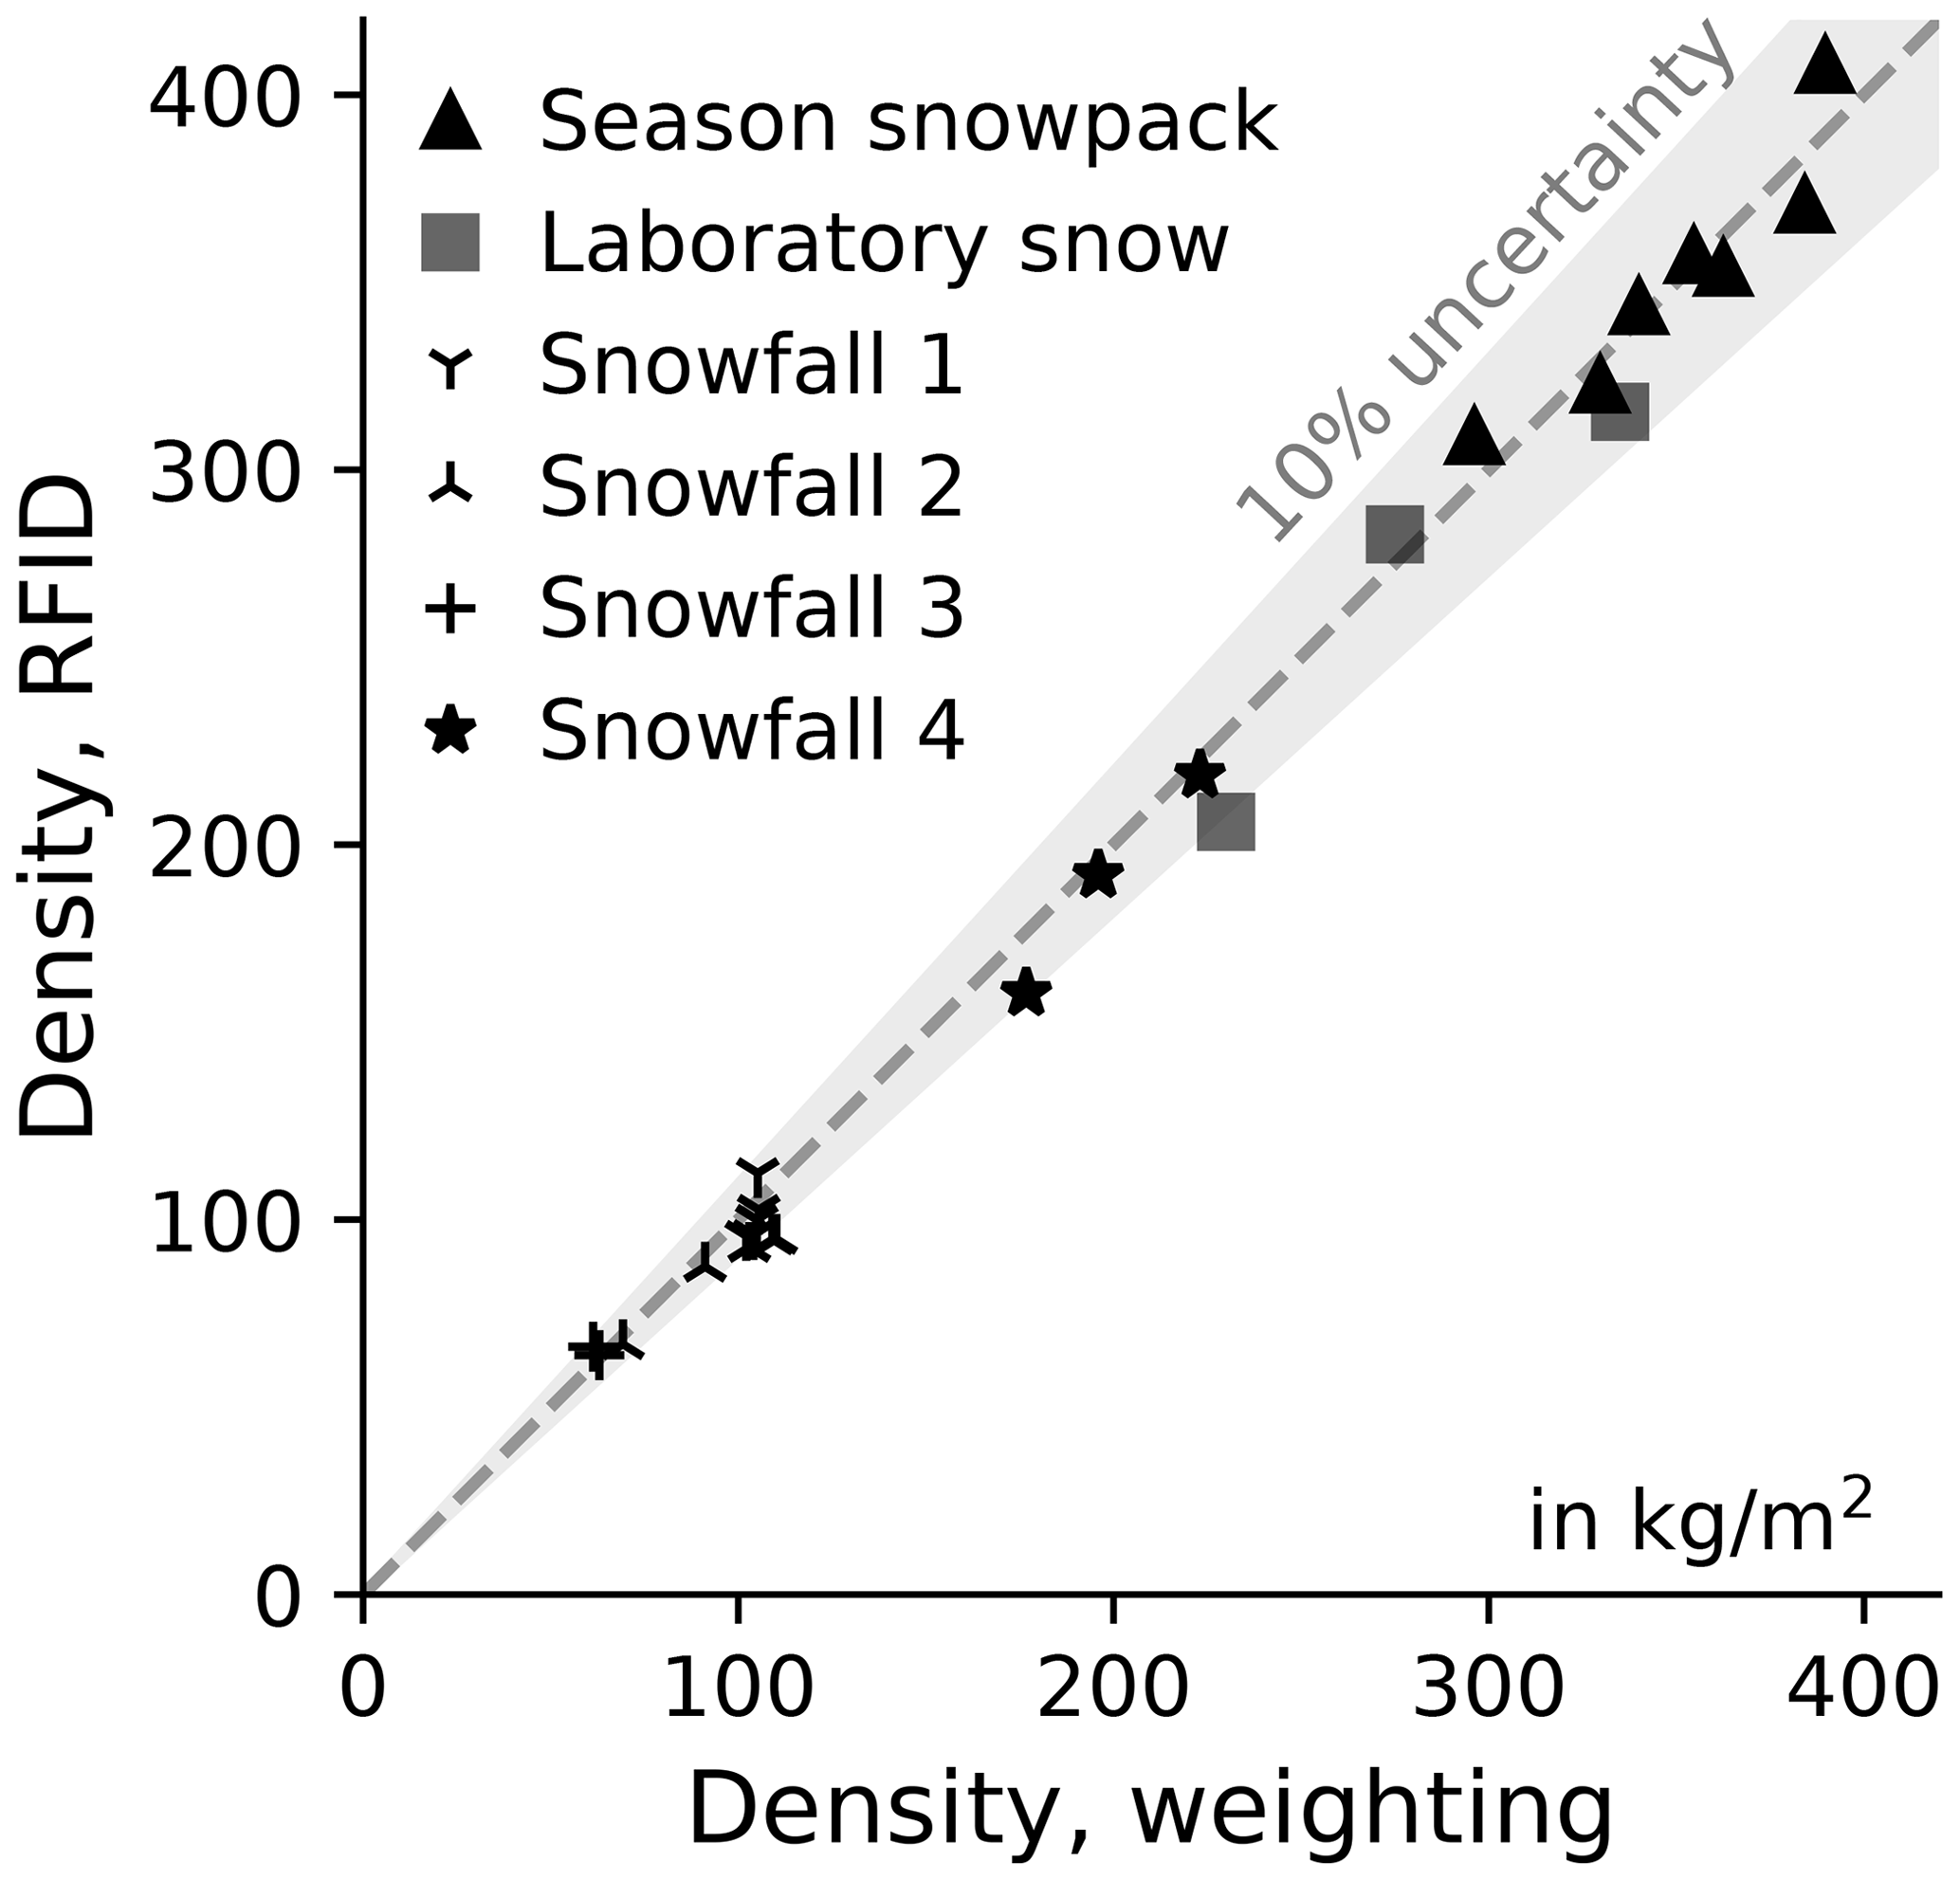
Figure 7Comparison of snow density estimated from the SWE obtained by weighing or by RFID SWE (for a known thickness). The RFID method works with fresh and compacted snow, from 61 to 390 kg m−3 density.
Table 1Evaluating the RFID method using criteria of Royer (2021).
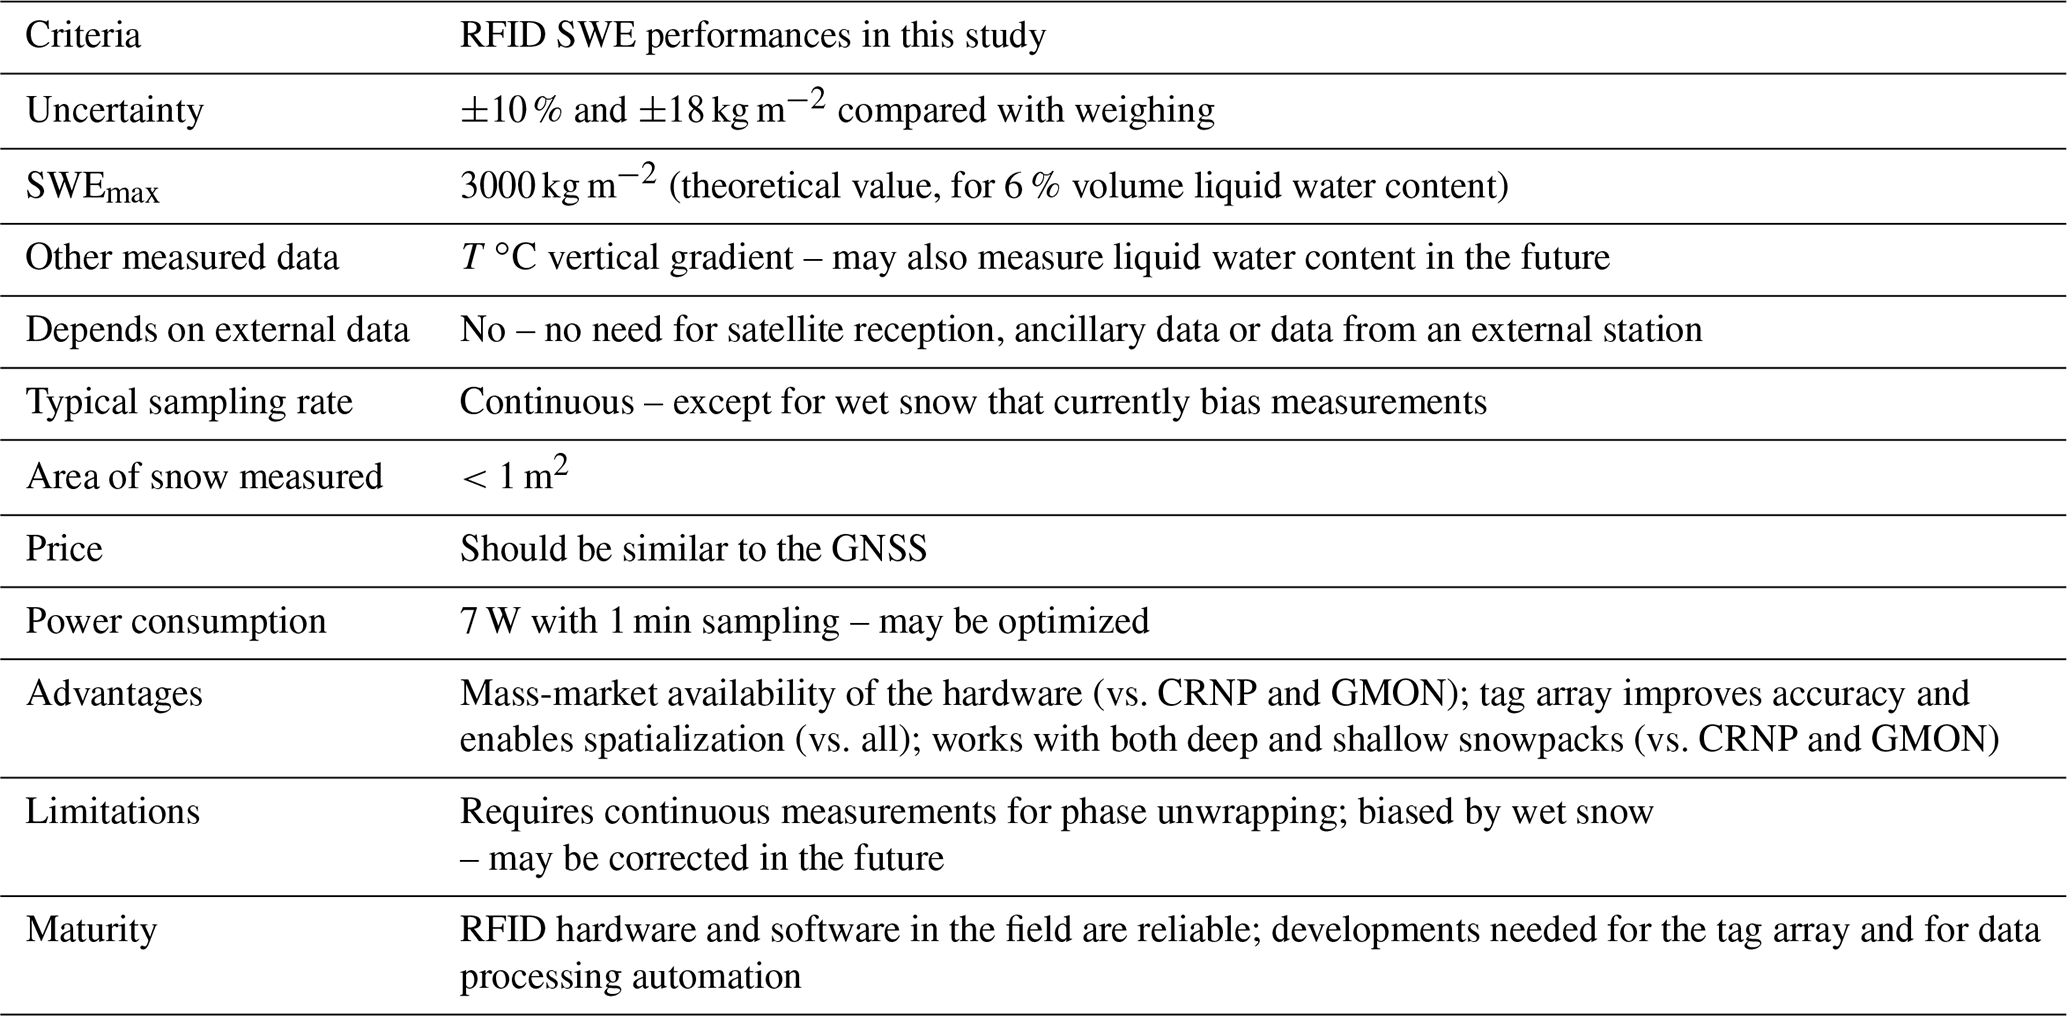
We compared the RFID performance to other non-destructive SWE monitoring methods described as mature by Royer et al. (2021): CRNP, GMON and GNSS. We omitted multifrequency radar, because its signal does not transmit in wet snow due to a severe attenuation at 24 GHz. The criteria (see Table 1) are discussed as follows. (1) The uncertainty of ±10 % and ±18 kg m−2 between RFID and weighing was similar to that obtained with the other methods, between 9 % and 15 % (Royer et al., 2021). However, estimating the uncertainty is difficult, because the snowpack is heterogeneous, and because no data represent the ground truth, rigorously speaking (Royer et al., 2021). (2) The sampling rate used was <1 s for the raw data (the reader interrogates a tag every 30 ms), 1 min during snowfall events to reduce random noise, and 12 h during the full season due to the discarded wet-snow period (wet snow could be corrected in the future, as discussed later). The 1 min sampling rate is considerably better than the typical 1 d rate possible with CRNP, GMON and GNSS. The maximum measurable SWE might be around 3000 kg m−2, based on our theoretical estimation (discussed below). (3) The complementary measurements include vertical temperature gradient measured by the tags. These might also include the liquid water content in the future, based on signal attenuation measurements (Koch et al., 2014) (discussed below). (4) The RFID method is not dependent on external data; it thus outperforms the other methods which need either satellite reception (Koch et al., 2019), cosmic ray flux reference data, or atmospheric humidity and barometric pressure (Sigouin and Si, 2016). (5) The area covered was <1 m2, comparable with the GNSS method but much less than the GMON and CRNP methods, which sense the snowpack all around. Sensing the snowpack over a larger area is generally preferable to avoid localized snowpack variability (e.g., local snowmelt caused by the installation and natural differences due to wind, topography, shade, etc.). Local sensing could be useful, however, if it was spatialized. (6) The price of a fully operational system is currently unknown as it is not yet commercialized. We can only say that the reading station accounts for most of the cost, and that the cost of tags is negligible. We can reasonably anticipate a price within the range of existing methods, i.e., from EUR 8000 to EUR 17 000 in 2021 for the sensor alone (Royer et al., 2021) (excluding installation, power, telecommunication, maintenance, etc.). (7) The method has three advantages. First, the RFID hardware is a commodity, produced at industrial scale using interoperable standards, like the GNSS but in contrast to GMON and CRNP. This ensures a better balance between cost, reliability and long-term availability than likely with custom sensors. Second, the fact that an array of tags can easily be used increases the accuracy and may enable spatialization. Third, the measurements are not biased by soil moisture, unlike GMON and CRNP, making the method more suitable for monitoring shallow snow depths when snowmelt infiltrates the soil (using RFID measurements when snow is refreezing to reduce snowmelt bias). (8) The method has two limitations today. First, the phase must be unwrapped to deal with ambiguity. This requires an efficient (and potentially complex) unwrapping algorithm (Charléty et al., 2023) and continuous measurements to avoid large swathes of missing data during which the SWE could vary by more than ±102 kg m−2. Second, measurements are biased by wet snow, which led us to discard these data. These limitations, discussed in the next paragraphs, might be mitigated in the future. (9) RFID hardware is mature, and the acquisition system (for instance provided by Géolithe) has been continuously improved as part of its use to monitor several landslides since 2017 (Le Breton et al., 2019; Charléty et al., 2022, 2023). More developments could improve the tag array, fully automate data processing, reduce power consumption and mitigate the method's limitations aforementioned. In conclusion, the RFID method matches modern non-destructive snow-sensing methods, providing several advantages: no external data needed, high temporal resolution, temperature gradient data, large industry and unaffected by soil moisture. Its limitations – that it needs phase unwrapping and is biased by snow wetness – could be mitigated in the future.
The issue of multipathing interference, for example, was mitigated in this study using tag arrays. Multipathing is a major challenge with RFID, because interference from the waves reflected by the environment can reduce the received signal strength (Lazaro et al., 2009) and alter the phase (Arnitz et al., 2012). In addition, the snowpack strongly influences multipath patterns, as seen with the GNSS reflectometry (Larson et al., 2009) and ground-penetrating radars (Espin-Lopez and Pasian, 2021; Kulsoom et al., 2021). A few centimeters of snowpack can modify the phase and signal strength of fixed tags above the ground up to ±1.5 rad and ±10 dB (Le Breton, 2019) (See Fig. D1). A first potential mitigation approach is to remove or hide reflectors (e.g., Lucas et al., 2017). Removing the vertical tag array would reduce the number of reflectors, but the snow would still create strong interference. Another mitigation approach could be to model the entire environment (Hechenberger et al., 2022) to correct the phase, using propagation models in a snowpack (Proksch et al., 2015). However, this is highly complex and dependent on the environment model, and we found no mention of any such approach in RFID localization methods (Xu et al., 2023). Another mitigation approach would be to increase the bandwidth (Arnitz et al., 2012), but RFID bandwidth is narrow, within 1.8 to 26 MHz for frequencies around 900 MHz, depending on regional regulations (e.g., ETSI-EN 302-208; FCC part 15). Finally, multipathing can be mitigated using an array of tags and reader antennas (e.g., Grebien et al., 2019). This is the option we used here. During snowfall events outdoors, we reduced the measurement bias from 30 to 3 kg m−2 by averaging measurements over 8 to 10 combinations of tags and antennas in different locations. Over the entire season, qualitatively, the SWE measured was more stable when averaged over three tags in periods 2 and 3 than over a single tag in period 1 (Fig. 6). In conclusion, using an array of tags and reader antennas efficiently mitigates RFID multipathing uncertainty.
The wet-snow bias, in contrast, has yet to be mitigated. The increase of liquid water content in the snow can increase its permittivity (e.g., Bradford et al., 2009; Tiuri et al., 1984), increasing the phase delay and leading to overestimation of the SWE. For example, for a snow density of 500 kg m−3, a liquid content increasing to 6 % would increase the permittivity from 2 to 2.7, resulting in a +35 % overestimation of the SWE. In addition, liquid water near the tag can increase the phase by changing the impedance of its antenna (Caccami et al., 2015; Le Breton et al., 2017). This effect would result in strong phase changes if ice melting occurs on the tag (Wagih and Shi, 2021). The combination of both effects explains the peaks of phases that occurred almost every day with sunlight or with wet precipitation (visible in Fig. C1). We manually discarded these data to retain the best possible SWE accuracy. Should we keep the discarding method in the future, the picking of wet periods could be automated based on a combination of signal loss (e.g., Koch et al., 2019), stable 0 ∘C temperature (e.g., Cheng et al., 2020; Dafflon et al., 2022; Reusser and Zehe, 2011) and phase peak recognition. Alternatively, the liquid water content present in the snowpack might be measured from the signal attenuation (e.g., Koch et al., 2014) to allow its influence on the phase to be corrected. In conclusion, the bias due to wet snow led us to discard the data from periods when the snow was wetter, and this limitation could be overcome in the future.
The phase ambiguity and unwrapping method is another typical issue with RFID localization and sensing based on the phase. First, it requires an adequate unwrapping algorithm that is not influenced by short spurious noise in the phase (Charléty et al., 2023). In our experience, despite the use of advanced algorithms, some unwrapping issues can remain (phase jumps of ±π). These are easily identified and corrected by human intervention – we made three corrections in our time series over the season. To overcome this need for manual intervention, one possible solution would be to exploit the tag array in the unwrapping algorithm. A second issue is that for unwrapping to proceed correctly, the phase must not vary by more than its ambiguity between two consecutive measurements (equivalent to ΔSWE ±102 kg m−2 with modern readers). The method therefore requires continuous acquisition, without large data gaps. If some data are missing, the phase ambiguity would have to be solved using an independent method that estimates the unmeasured SWE variation with an uncertainty of less than ±102 kg m−2. Absolute localization methods based on tag arrays (Xu et al., 2023; Le Breton, 2023) could also be investigated. In conclusion, the phase ambiguity is a limitation of the RFID method, because it requires a robust unwrapping algorithm and continuous data.
In contrast, measuring the snow temperature gradient using sensors in the tags (see data in Appendix B) is a definite advantage. We measured an accuracy of ±0.25 ∘C within −7 to 0 ∘C, after calibration, and saw no visible drift at 0 ∘C for 3 months. That is in line with the 3σ accuracy of ±0.2 to ±1 ∘C near 0 ∘C and of 0.5 to 1.5 ∘C within −10 to 30 ∘C on hundreds of battery-assisted tags (Jedermann et al., 2009). It is also similar to the accuracy after calibration of ±0.2 ∘C near 37 ∘C with commercial batteryless tags (Camera and Marrocco, 2021). In the snow, except for a few studies that reported a better accuracy or spatial resolution (e.g., Dafflon et al., 2022; Cheng et al., 2020), most studies used vertical temperature data that were measured with similar performances to estimate other physical indicators of the snowpack. Therefore, our temperature data may also be used to estimate the snow depth (Reusser and Zehe, 2011), water content (Marchenko et al., 2021), heat transfer (Brandt and Warren, 1997), thermal diffusivity (Oldroyd et al., 2013) and latent heat (Burns et al., 2014).
The SWE remained <350 kg m−2 in this study. We can estimate the maximum measurable SWE using the basic theory of microwave propagation in snow (e.g., Koch et al., 2014; Le Breton, 2019; Steiner et al., 2019). Its value is limited by the tag's maximum read range in the snowpack (see the influences on the read range by Le Breton et al., 2022). This value depends mostly on the RFID hardware (Nikitin and Rao, 2006) and on the signal attenuation by the snow liquid water content (Koch et al., 2014). A snow with 500 kg m−3 density and 6 % of its volume containing liquid water would have a permittivity of 2.63+0.053 j (Tiuri et al., 1984). The attenuation coefficient (Bradford et al., 2009) (in m−1), equivalent to (in dB m−1), leads to a reduction of signal strength dB × h in this snow. At normal incident angle, the loss due to reflection at the air–snow interface (around 0.5 dB) is much smaller than bulk attenuation. The other factors (multipathing, antenna coupling, reflectors within the snowpack) should be secondary compared to propagation attenuation if an appropriate tag array design is used. The maximum read range in snow rmax, snow is computed relative to the maximum read range in air, rmax, air, using . The maximum SWE is the antenna height for which the power budget available in air equals the loss in the snowpack. These calculations result in a maximum theoretical SWE of 3000 kg m−2 (6 m snow depth) for a battery-assisted tag readable at 60 m in the air (e.g., Survivor B) or 2250 kg m−2 for a batteryless tag readable at 27 m in the air (e.g., Survivor M780). The real maximum SWE may be lower in practice but nevertheless remains in the range of the GNSS limit of 2000 kg m−2 (Royer et al., 2021).
Permittivity sensing has been previously demonstrated with RFID tags, either by measuring the variations in tag antenna impedance (Bhattacharyya et al., 2010; Manzari and Marrocco, 2014; Caccami et al., 2015; Caccami and Marrocco, 2018) or by connecting a sensor to the tag (e.g., Fonseca et al., 2018). But these methods can characterize only the material in contact with the tag. Besides, their accuracy was lower than standard scientific instruments, due to the tag's limitations. In terms of accuracy, only the localization of tags in the air by the reader (review: Xu et al., 2023) could match the accuracy of the standard techniques such as the GNSS. Like localization, our sensing method is based on wave propagation, occurring, however, in another medium than air. We demonstrated that propagation-based sensing can measure the permittivity of bulk material, remotely, with scientific-level accuracy. In the future, this method could also be applied to other materials, such as vegetation (Le Breton et al., 2023).
Finally, any tag can be used with this method. It only needs a reader that can read the phase of the received signal. If the read range – frequency-dependent in wet snow – is sufficient, the method should also work with harmonic tags (Mondal et al., 2019) already used under the snow (Mike Stanford, 1994; Grasegger et al., 2016) and with chipless tags (Barbot and Perret, 2018).
We introduced a method to sense the snow water equivalent of a snowpack, which works with standard radiofrequency identification devices. Its performance was similar to mature, non-destructive, scientific-level snow sensing methods (the GNSS, gamma ray monitoring and cosmic ray neutron counting), with the accuracy of ±10 % or ±18 kg m−2 (see all criteria listed in Table 1).
In terms of advantages, the RFID method is fully independent and does not require external data or devices (e.g., the GNSS reception, temperature and pressure sensors, incoming cosmic ray fluxes). It measures data continuously with a high temporal resolution of <1 min in dry snow. With the usage of temperature-sensing tags, it can also measure the snow temperature gradient, with an accuracy of ±0.25 ∘C at around 0 ∘C. It is not affected by soil moisture content. The long-term availability of the devices is supported by the large RFID industry.
The main limitation of the RFID method is its uncertainty when dealing with wet snow. This uncertainty led us to discard wetter snow periods, but it may be corrected in the future using independent liquid water content estimations. The need for continuous data to avoid phase ambiguity (equivalent to ±102 kg m−2 SWE) is also inconvenient. This difficulty can potentially be solved with advanced localization techniques, but further investigation would be needed.
In terms of RFID sensing, we showed that propagation-based sensing using phase data can sense a material's bulk permittivity remotely with the accuracy of scientific-level instruments.
Future developments should aim to improve tag array design, correct the bias caused by wet snow, investigate phase solving methods and automate data processing.
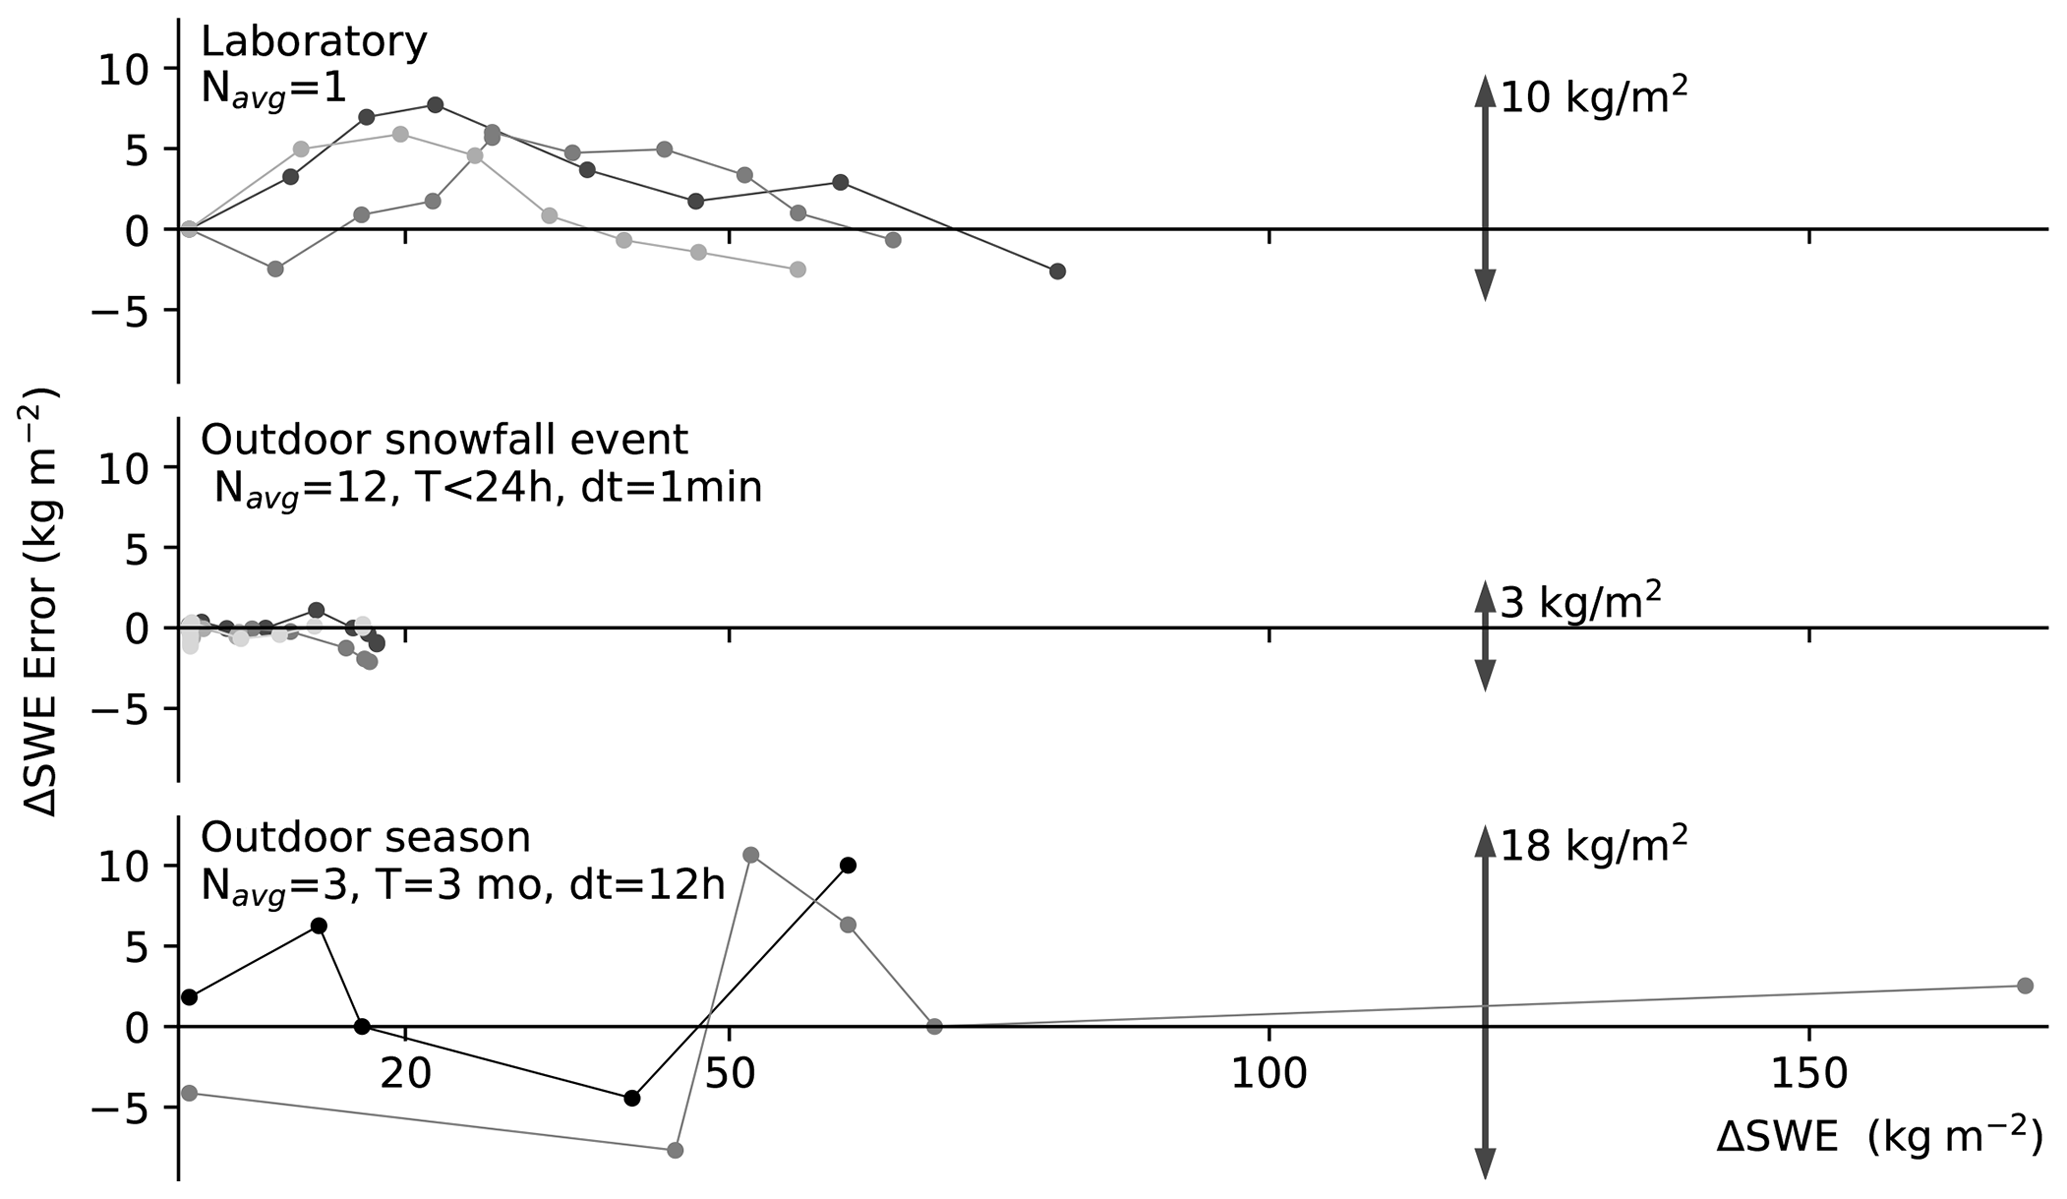
Figure A1Difference between the SWE measured by RFID and by weighing, in the laboratory, during snowfall events, and throughout the season (periods 2 and 3 are used, because snow pit weighing surveys were available). ΔSWE represents the variation in SWE measured with the same calibration. Darker curves represent earlier measurements.
The temperature data were first calibrated by setting the temperature to 0 ∘C for tags covered by wet snow. In wet snow, these tags displayed a constant temperature near 0 ∘C (indicating wet snow), preceded and followed by distinct patterns of temperature variations compared to the highest tags in the air. This occurred on 14 December 2019 and 10 March 2020 during more than 8 h for the eight tags up to 53 cm. A second calibration step was performed on the other tags, between 11 and 14 November 2019 at 20:00–06:00 LT each day when the snow was low, by fitting their intercept of a linear regression with the tags previously calibrated at 0 ∘C.
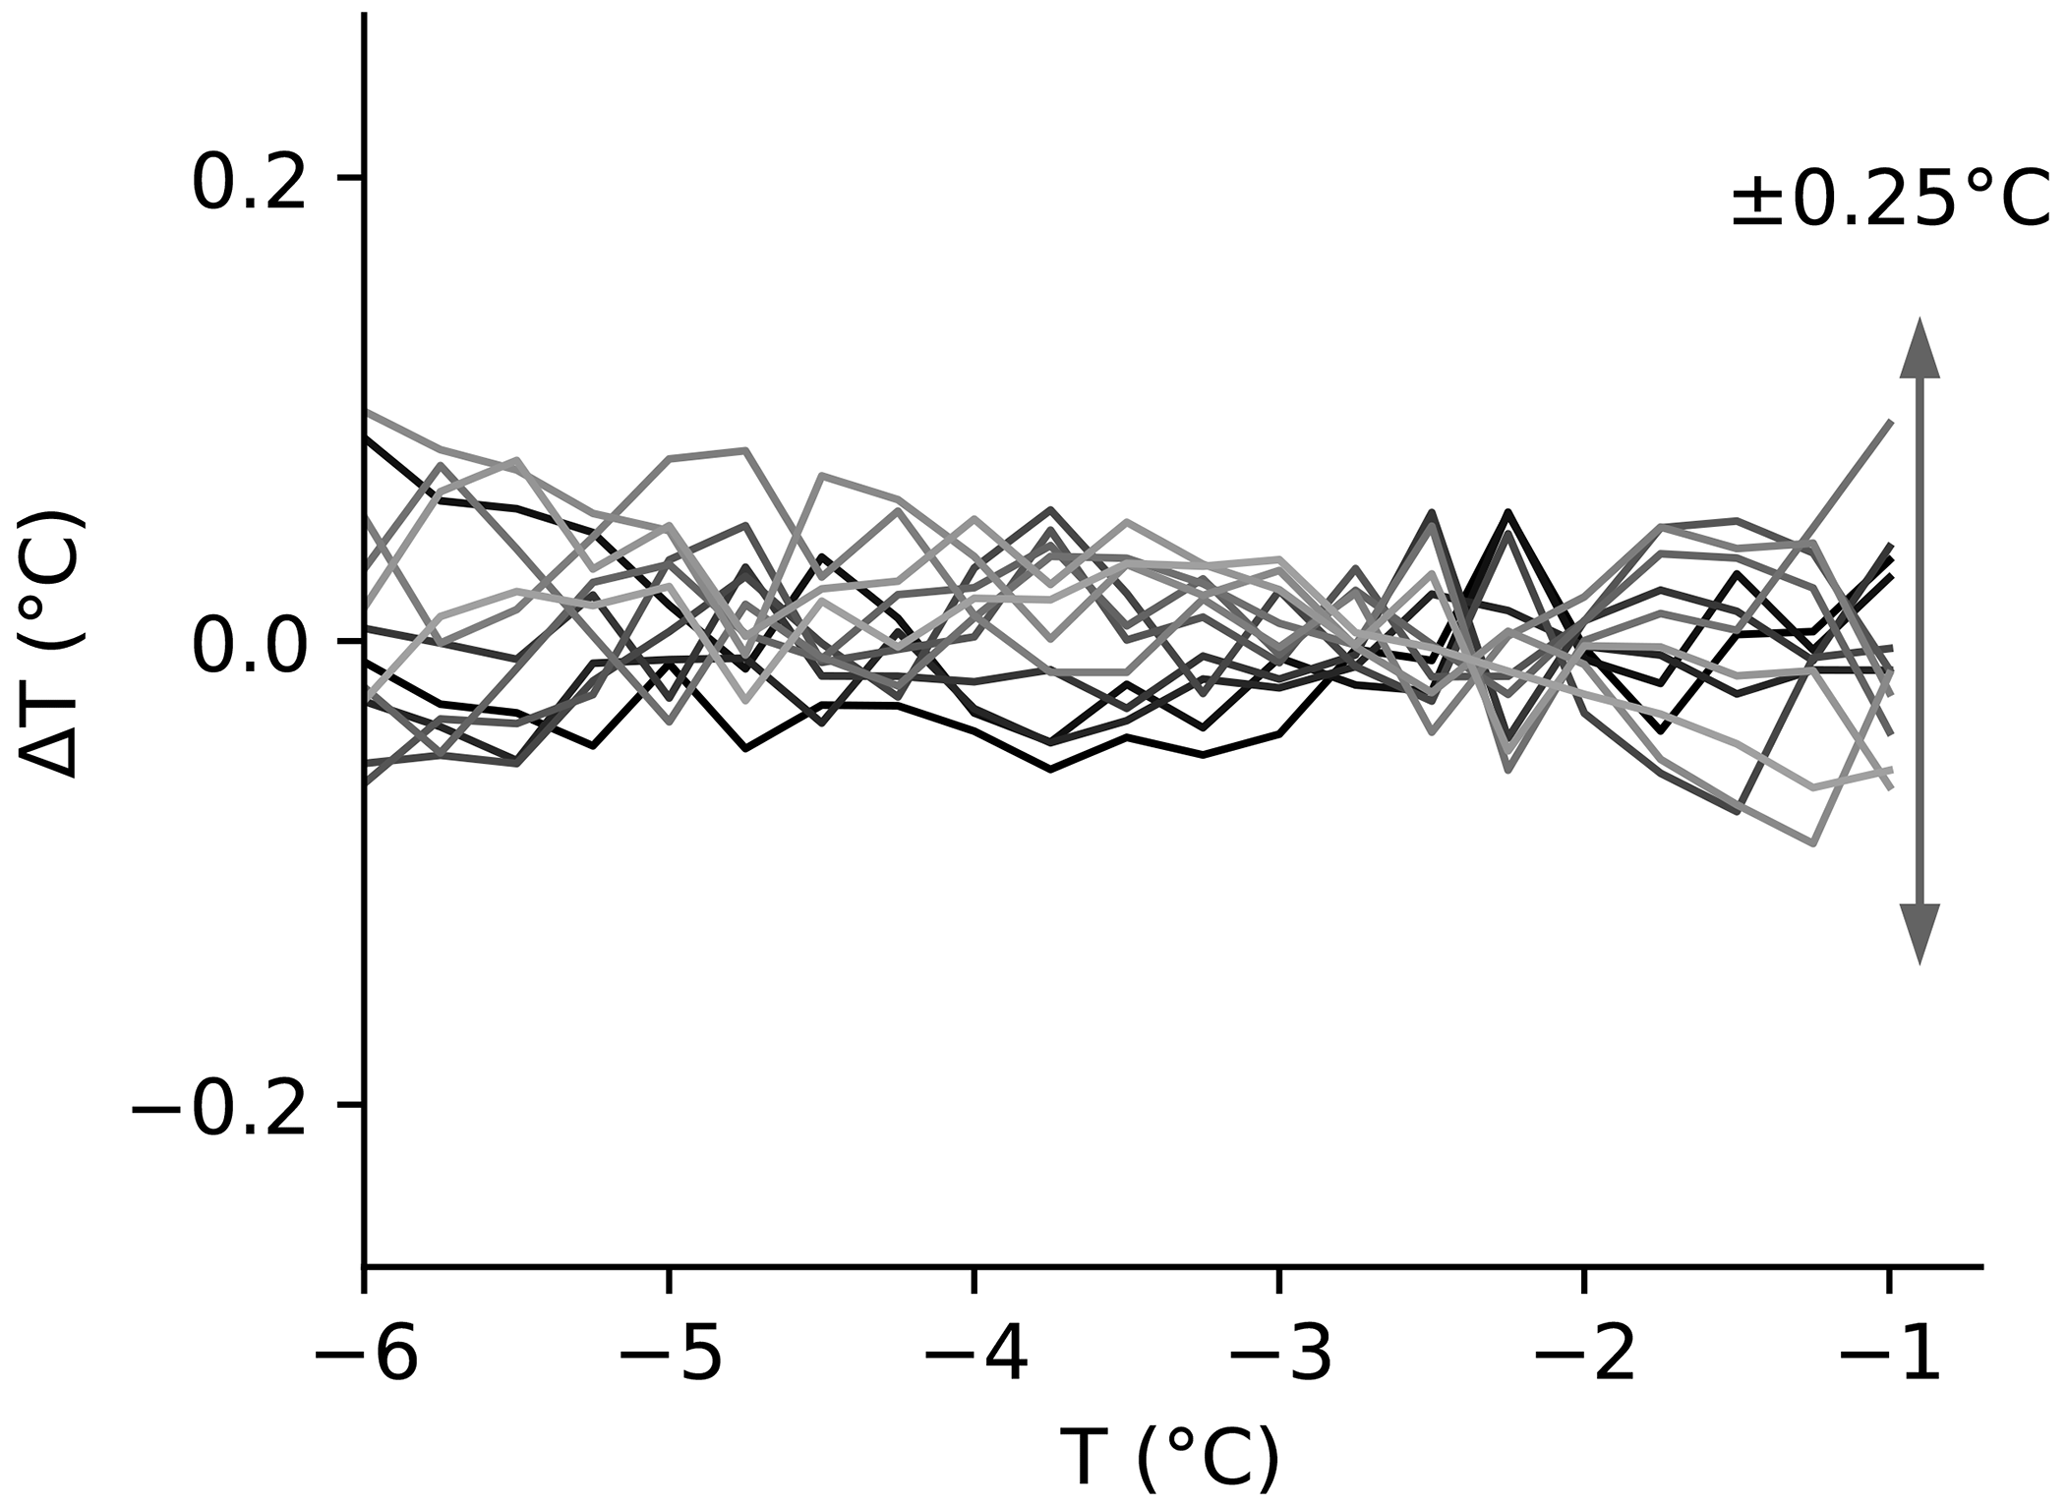
Figure B1Difference in the temperature, ΔT, measured by the tags at a height of 83–163 cm, as well as their average measurement after calibrating the offset. The data were measured during the period of the second calibration step. This shows that there is no need for a two-point calibration (meaning the measurement slope) on each individual tag.
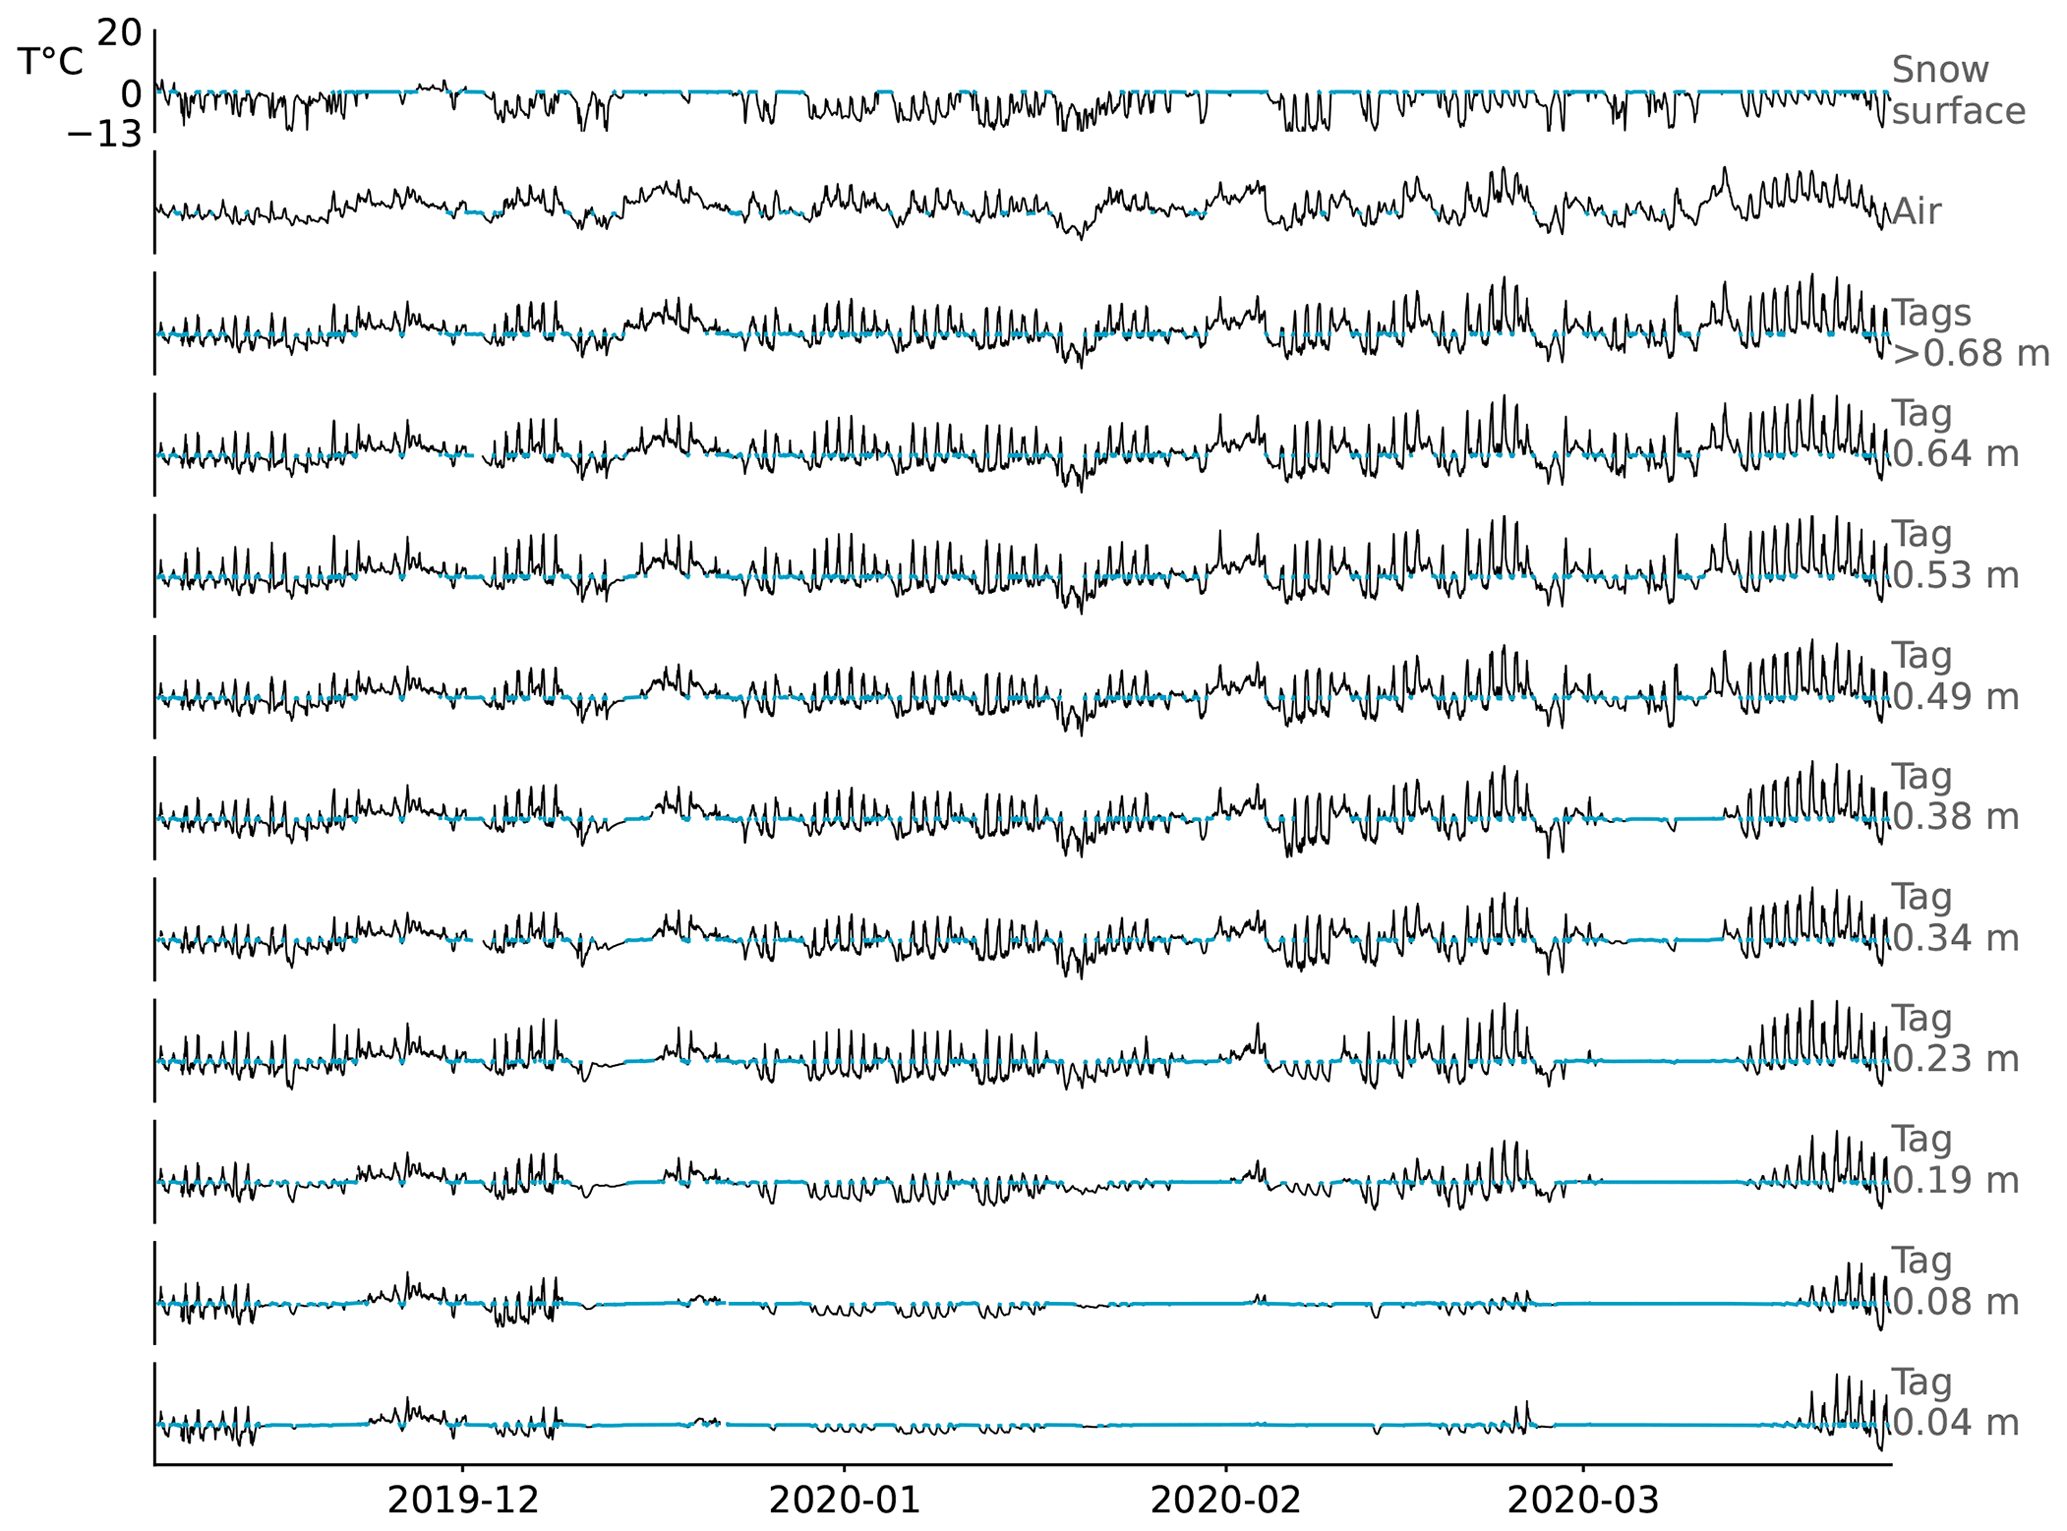
Figure B2Temperature measured by RFID tags, from 0.04 to 0.64 m above ground, and the average of tags above 0.68 height. The air and snow surface temperatures were measured by independent instruments. The lines in blue represent T=0 ∘C ±0.3 ∘C.
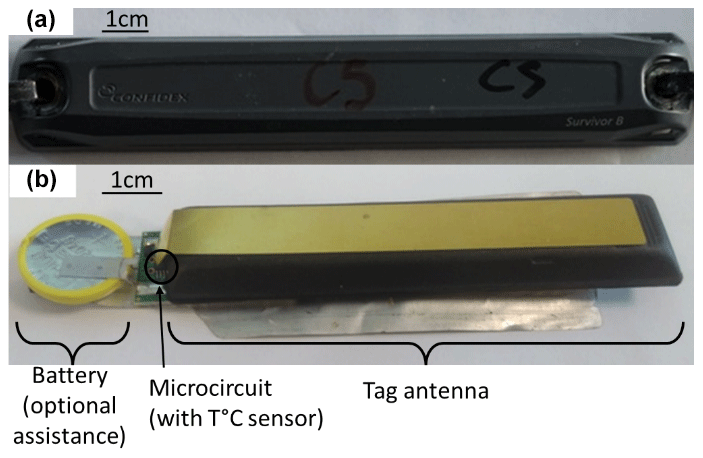
Figure B3The commercial tag used in the study (a) in its casing and (b) without its casing. The battery is optional but was used here to maximize read-range performance. The method can be replicated with any batteryless tag for the SWE. It requires specific sensing tags (with or without battery) to monitor temperature, available from any RFID reseller.
In terms of accuracy, the tag's microcircuit manufacturer indicates a maximum error of ±2 ∘C before calibration and ±1.2 ∘C after offset calibration for temperatures within the range −40 to +60 ∘C. In our hands, the error before calibration was ±0.8 ∘C within the range −7 to 0 ∘C. Calibration reduced the uncertainty to ±0.25 ∘C (Fig. B1), which corresponds to the numerical resolution (see Fig. 10). No drift or random noise was visible.
The tag temperature was plotted alongside the air temperature and the snow surface temperature (see Fig. B2 for each tag up to 0.64 m, then averages for all tags >0.68 m (always above snow)). The temperature recorded by tags above the snow level correlated well with the air temperature. Tag temperature was higher than air temperature in the sunlight and lower at night due to radiative heat transfer, temporary snow/ice accumulation on the tags and heat conduction through the tag support. For tags present in the snowpack, temperatures remained ≤0 ∘C, and no correlation with air temperature was observed. The temperature measurements confirmed that snow melted around the tag poles just before 19 December 2019 and 3 February 2020. Indeed, on 21 December 2019, the snow depth was indicated as <0.18 m based on the tag's temperature; measurement with a laser sensor indicated a depth of 0.25 m. On 6 February 2020, the snow depth determined based on tag temperature was <0.33 m, and it was 0.6 m according to the laser sensor. The snow depth offset thus appears to have accumulated after both accelerated melting events. As another indicator, a stable temperature near 0 ∘C indicates that the snowpack is partially wet near the measuring tag (e.g., on 10 March 2020, up to 38 cm). During these periods, the temperature measured remained within 0 ∘C ± 1 ∘C, which is consistent with the accuracy given by the manufacturer. Tags close to the ground remained around 0 ∘C most of the time, indicating that snow near the ground stays wet. Again, this behavior is expected to be due to heat transfer from the ground. However, the snow near the ground should remain only slightly wet most of the time, because the heat flux coming from the ground is small compared to the heat needed to melt frozen water. After 23 March 2020, once the snowpack had entirely melted near the tags, the temperature of the lowest tags increased above 0 ∘C, as expected. These results confirm that RFID tags can monitor and spatialize temperatures, opening another perspective for the use of RFID tags to monitor the snowpack (e.g., Bagshaw et al., 2018).
Details on the tags
For this study, we used Survivor B battery-powered tags, as we were accustomed to these devices and because of their long read range. A picture of the tag, as well as the inside after removing its casing, is shown in Fig. B3. We want to emphasize that (1) the method presented works with any backscattering RFID tag, provided the signal's phase can be read, and (2) the method also works without battery but only with a lower read range. Readers who wish to reproduce the experiments could use any tag with a long read range, whether batteryless or battery-assisted.
We present interim results and detail some corrections required to compute the SWE over the whole winter season (2019–2020) at Col de Porte. The raw indicator of the SWE variations is shown in Fig. C1 after unwrapping but before removing wet-snow periods, recalibrating due to melting, and averaging multiple tags. The SWE measurement based on cosmic ray data is also presented, with manual weighing of the snow pits (Lejeune et al., 2019). In addition, the snow depth (measured with a laser, in the pits, and from a visual pole), the lowest temperatures for each day (air, tags above snow and snow surface) and the daily precipitation (with an estimation of the solid-to-liquid ratio) are indicated. The solid-to-liquid ratio of precipitation was obtained by estimating whether the precipitation should contain 0 %, 50 % or 100 % liquid water, based on air temperature, snow radiation and expertise, for each hour of precipitation. The resulting quantities of liquid and solid water were cumulated every day. The unwrapped indicator of the SWE variations obtained from the three tags (Fig. C1, continuous lines in light colors) correlated visually with the reference SWE. As expected, the unwrapped phase returned to close to its initial value at the end of the season.
The presence of liquid water in the snow also modifies the phase delay, and this would not be differentiated from an increase of SWE. Liquid water affects the phase delay both by slowing the wave transmitted through the snowpack (e.g., Bradford et al., 2009; Tiuri et al., 1984) and by coupling with the tag antenna (Caccami et al., 2015; Le Breton et al., 2017; Dey et al., 2019). We identified dry snow periods from their constant or slowly evolving phase delay – occurring typically from 00:00 to 07:00 LT. In contrast, the phase delay changed constantly with wet snow, due to its unstable snow liquid water content (wet snow either melts or refreezes).
Step 5 in the Sect. 2.3 workflow was introduced to mitigate the acceleration of snowmelt caused by the installation. This effect occurred twice during the winter (from 14 to 19 December 2019 and from 1 to 3 February 2020), after strong wet precipitation combined with an air temperature that remained >0 ∘C over several days (Fig. C1), limiting the nightly refreezing. The influence was likely due to the thermal bridge and preferential melt-water path through the snow, caused by the tag support. The resulting increase in snowmelt was observed in photographs (Fig. C2), in the non-reversible offset formed between the RFID and the reference SWE (Fig. C1) and in the offset between the snow depth and the variations in tag temperature (Fig. B2). To mitigate this effect, we distinguished the three periods starting on (1) 23 October 2019, (2) 19 December 2019 and (3) 3 February 2020. In periods 2 and 3, we recalibrated the SWE by adding an offset to fit the value of a reference manual pit survey, marked as “ref” in Fig. 6 (on 30 December 2019 for period 2 and 6 February 2020 for period 3).
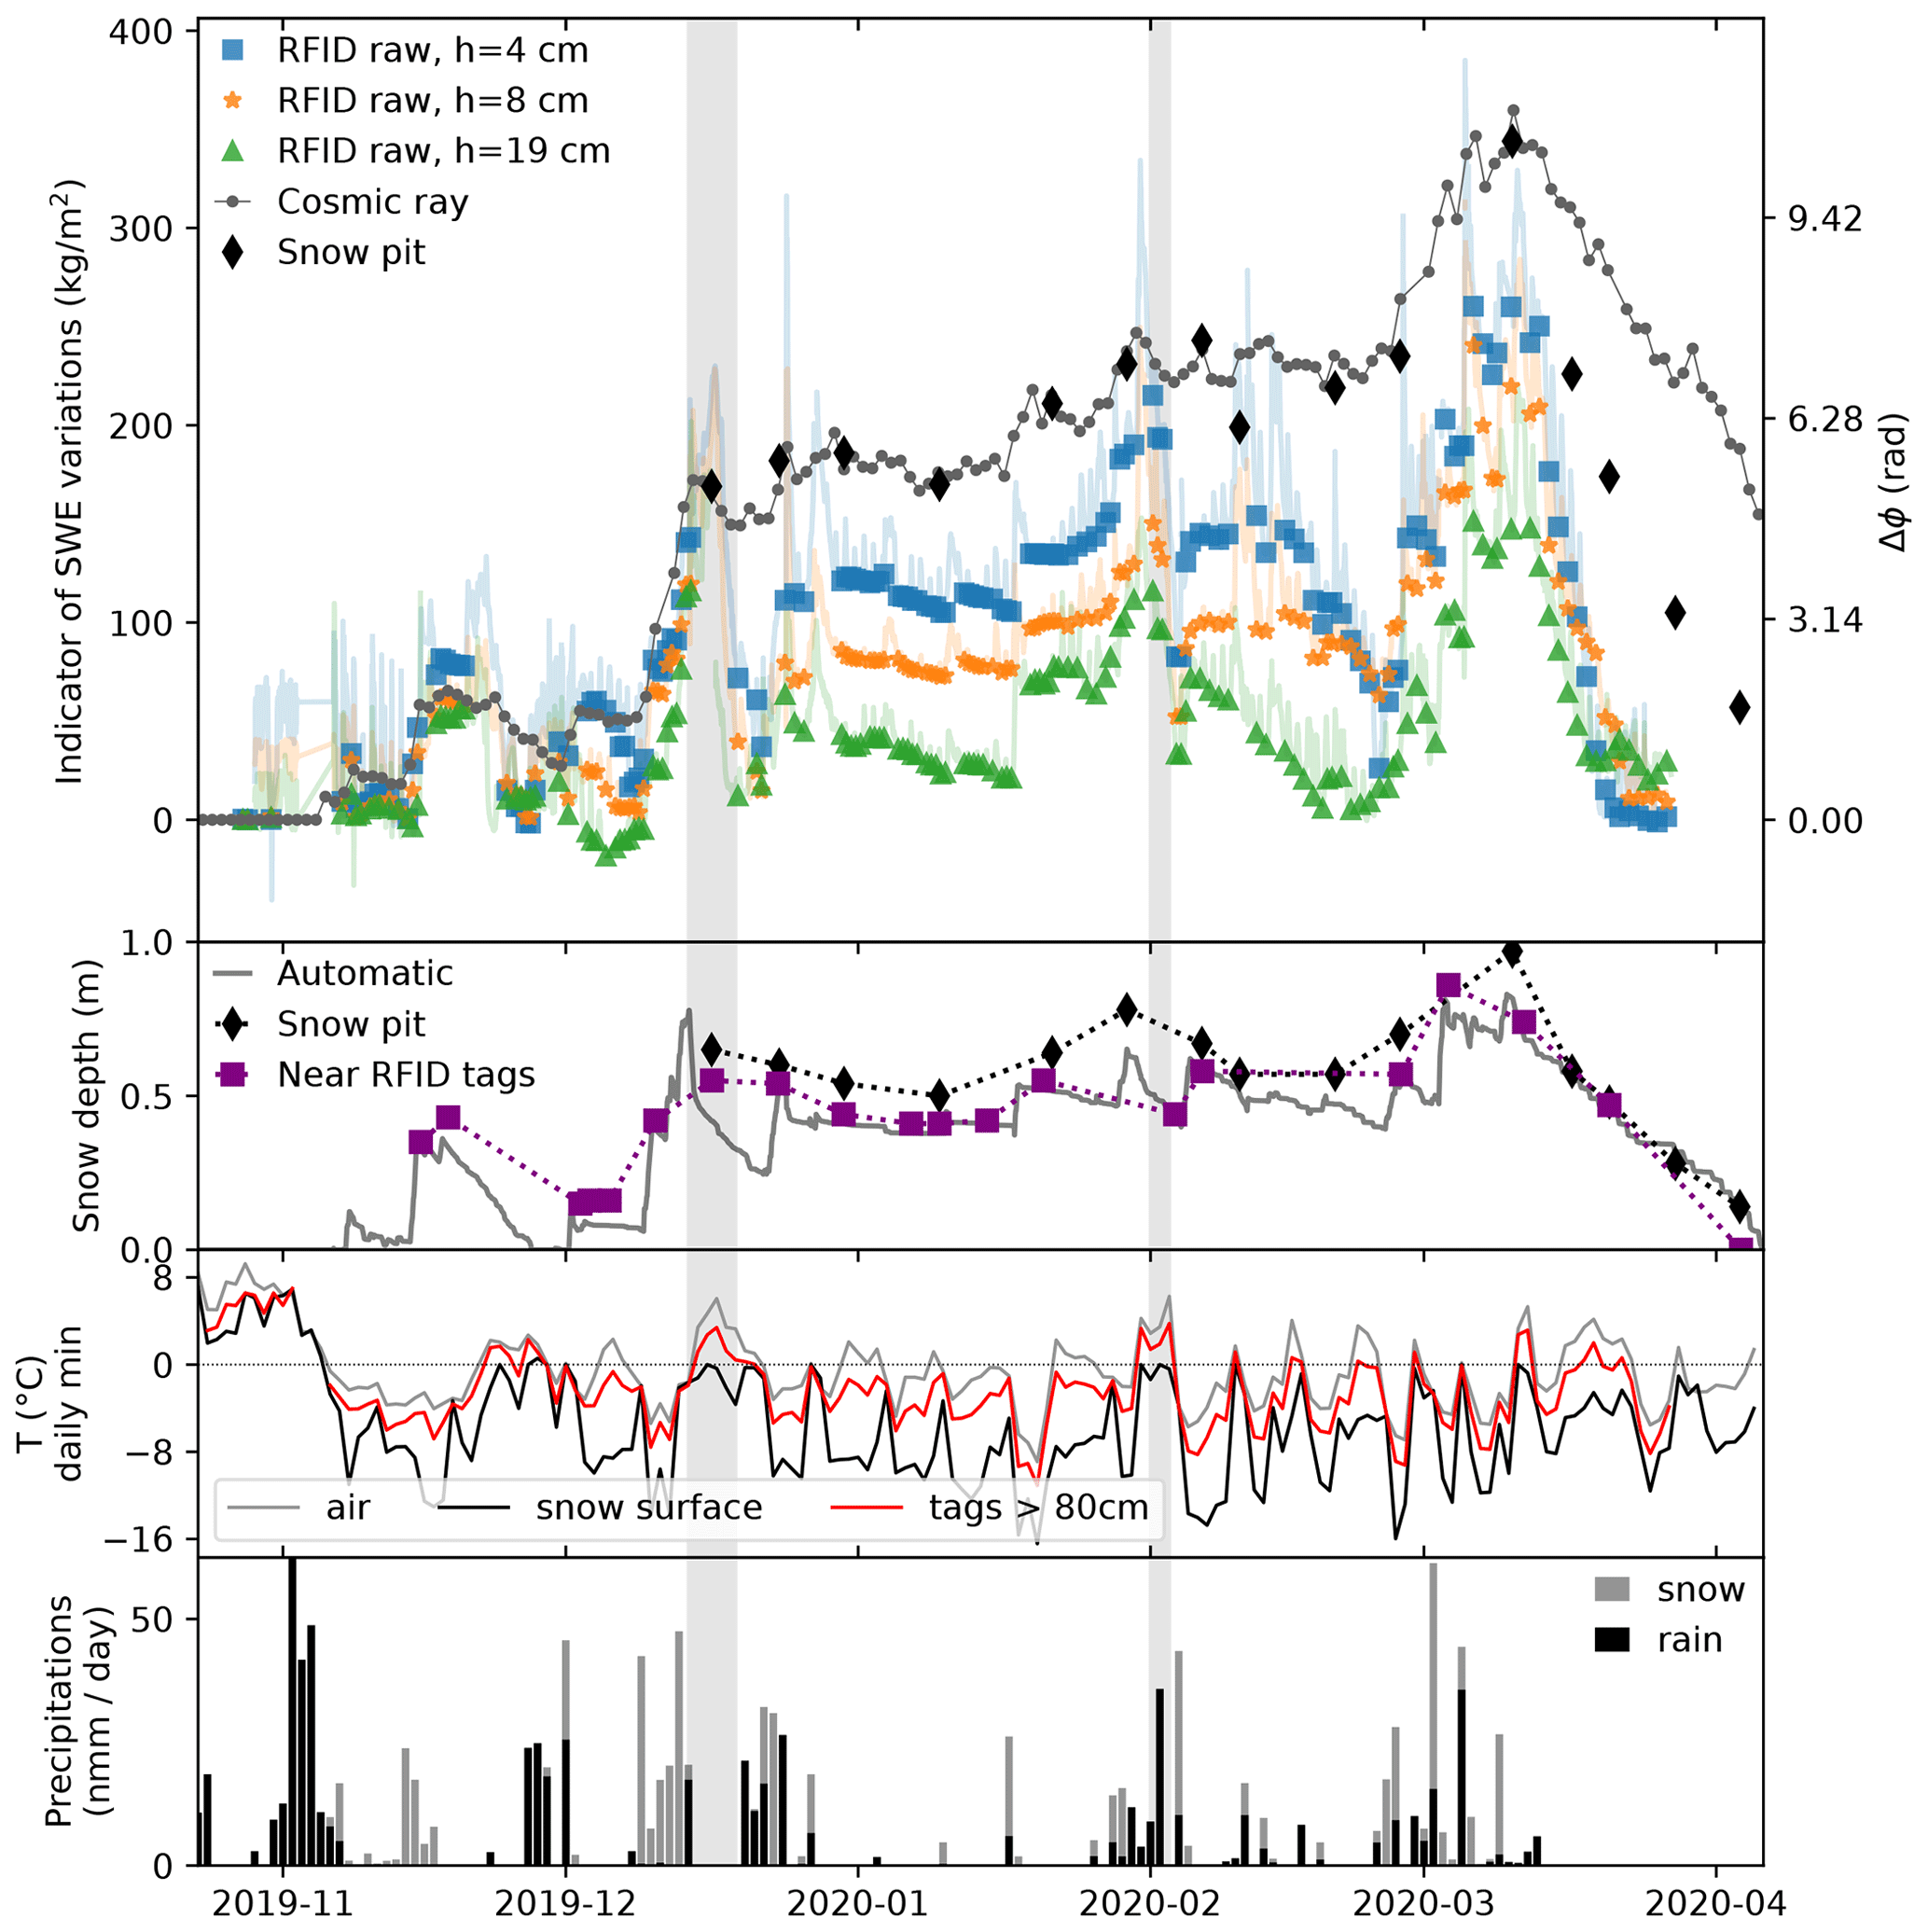
Figure C1Raw indicator of the SWE variations, with their equivalent variation of phase delay, for the snowpack located above the tags at 4, 8 and 19 cm from the ground. Periods of wet snowpack (peaks on the raw SWE indicators) were removed, and only the colored markers were considered when estimating the SWE. The SWE was also measured by automatic cosmic ray neutron counting and from snow pit surveys. The figure also shows the snow depth, daily minimum air temperature and precipitation. In the gray periods, reheating with accelerated snowpack melting around the tag support is shown.
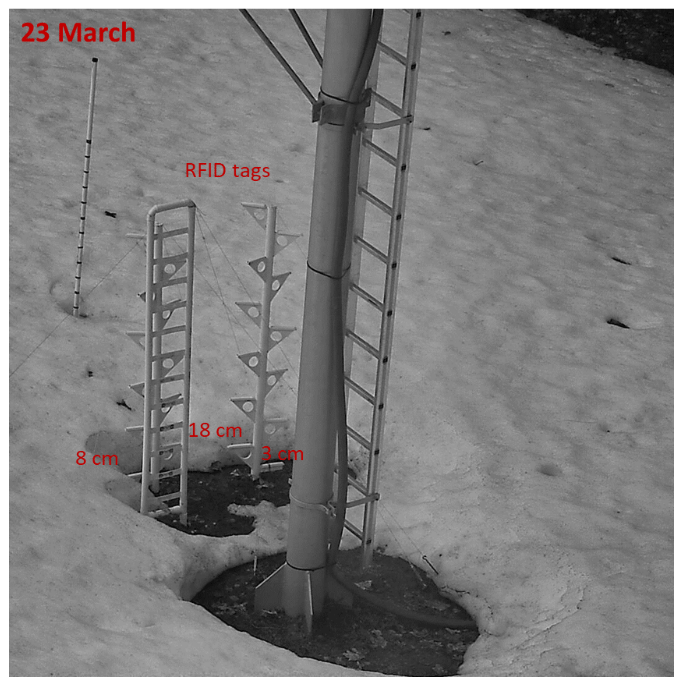
Figure C2Photograph of the monitoring installation taken from the webcam, on 23 March 2020 at 12:00 LT, confirming that the snowpack had melted faster around the tag supports, and that there was no more snow around the tags on this date.
A simple experiment was done in a similar configuration to the Col de Porte but at a different site with dry snow. Instead of placing a vertical array of tags, the same tag was moved vertically in and above the snow (See Fig. D1c). The difference between the measured phase and the theoretical phase in free space (Fig. D1a), as well as the signal strength received (Fig. D1b), revealed a clear oscillation. The period is half a wavelength (≈17.4 cm in the air). Its influence on the phase and received signal strength reaches up to ±2 rad and ±10 dB (with one peak at −45 dB inside the snow). These results illustrate the effect of multipathing and its spatial variability. A communication on this topic is in preparation.
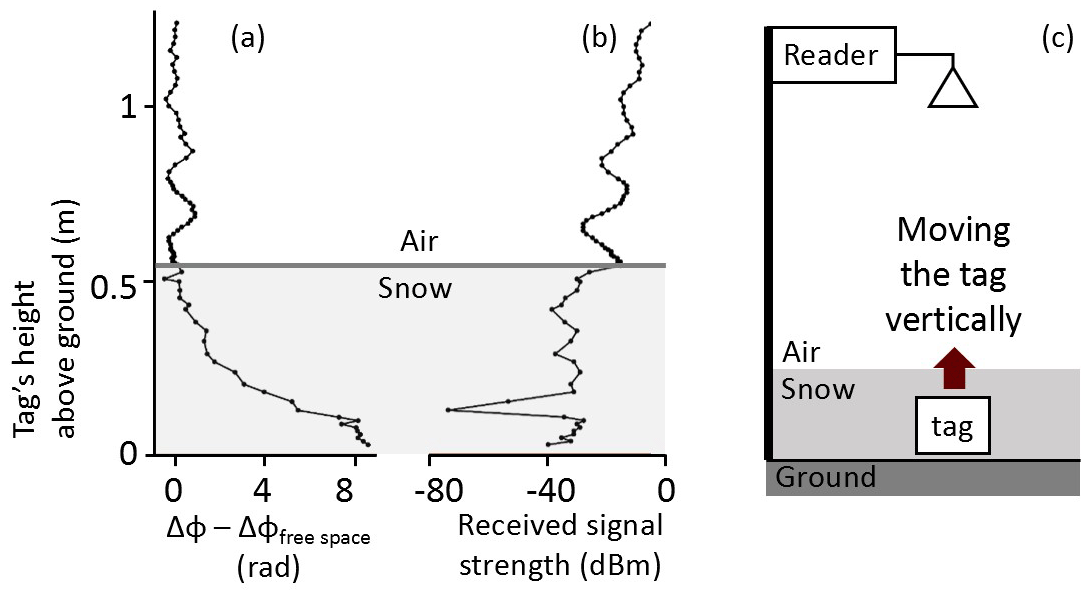
Figure D1Simple experiment to illustrate multipathing. A tag was moved above and under dry snow, with the reader located above the snow. The results present (a) the difference between the theoretical phase in free space and the measured phase and (b) the received signal strength.
The RFID acquisition software is property of Géolithe company and closed source. (However, any user can rapidly write their own acquisition code, using open-source libraries or development kits provided by reader manufacturers.) The data processing and analysis are performed with standard data processing libraries (Python, Pandas (https://doi.org/10.5281/zenodo.3509134, The Pandas Development Team, 2020), Numpy (Harris et al., 2020), Matplotlib (Hunter, 2007)).
RFID data can be made available upon request, after agreement with Géolithe; CRNP data can be made available upon request, after agreement with EDF; other snow and meteorological data can be made available upon request, after agreement with the Centre d’Étude de la Neige; all requests can be made to Mathieu Le Breton.
MLB developed the theory, analyzed the data and wrote the paper. MLB, LB and EL conceptualized the method and acquired funding. EL, MLB, AVH and YL designed, planned and performed the experiments. All the authors discussed the results and contributed to the paper.
The contact author has declared that none of the authors has any competing interests.
Publisher's note: Copernicus Publications remains neutral with regard to jurisdictional claims in published maps and institutional affiliations.
We thank Guilhem Scheiblin from ISTerre, as well as Jacques Roulle and the technical staff from Centre d’Étude de la Neige, for support with experiments. We thank EDF (Électricité de France) for providing access to their CRNP/NRC data. We thank Maighread Gallagher for the proofreading. We thank Marie Dumont, Fatima Karbou, Denis Jongmans, Étienne Rey, Fabrice Guyoton, Arnaud Belleville and Paul Carrier for their interest in our project and for fruitful discussions in the early stages and throughout the process.
This research has been supported by the Agence Nationale de la Recherche (grant no. ANR-17-LCV2-0007-01, for the Labcom Geo3iLab) and by Géolithe company and its affiliate Géolithe Innov.
This paper was edited by Franziska Koch and reviewed by Christian Mätzler and one anonymous referee.
Arnitz, D., Muehlmann, U., and Witrisal, K.: Characterization and Modeling of UHF RFID Channels for Ranging and Localization, IEEE T. Antenn. Propag., 60, 2491–2501, https://doi.org/10.1109/TAP.2012.2189705, 2012.
Bagshaw, E. A., Karlsson, N. B., Lok, L. B., Lishman, B., Clare, L., Nicholls, K. W., Burrow, S., Wadham, J. L., Eisen, O., Corr, H., Brennan, P., and Dahl-Jensen, D.: Prototype wireless sensors for monitoring subsurface processes in snow and firn, J. Glaciol., 64, 887–896, https://doi.org/10.1017/jog.2018.76, 2018.
Balanis, C. A.: Advanced Engineering Electromagnetics, Second Edition, John Wiley and Sons, ISBN: 978-0-470-58948-9, 2012.
Barbot, N. and Perret, E.: A Chipless RFID Method of 2D Localization Based on Phase Acquisition, J. Sensors, 2018, 7484265, https://doi.org/10.1155/2018/7484265, 2018.
Beaumont, R. T.: Mt. Hood Pressure Pillow Snow Gage, J. Appl. Meteorol. Clim., 4, 626–631, https://doi.org/10.1175/1520-0450(1965)004<0626:MHPPSG>2.0.CO;2, 1965.
Bhattacharyya, R., Floerkemeier, C., and Sarma, S.: Low-Cost, Ubiquitous RFID-Tag-Antenna-Based Sensing, P. IEEE, 98, 1593–1600, https://doi.org/10.1109/JPROC.2010.2051790, 2010.
Bradford, J. H., Harper, J. T., and Brown, J.: Complex dielectric permittivity measurements from ground-penetrating radar data to estimate snow liquid water content in the pendular regime, Water Resour. Res., 45, W08403, https://doi.org/10.1029/2008WR007341, 2009.
Brandt, R. E. and Warren, S. G.: Temperature measurements and heat transfer in near-surface snow at the South Pole, J. Glaciol., 43, 339–351, https://doi.org/10.3189/S0022143000003294, 1997.
Burns, S. P., Molotch, N. P., Williams, M. W., Knowles, J. F., Seok, B., Monson, R. K., Turnipseed, A. A., and Blanken, P. D.: Snow Temperature Changes within a Seasonal Snowpack and Their Relationship to Turbulent Fluxes of Sensible and Latent Heat, J. Hydrometeorol., 15, 117–142, https://doi.org/10.1175/JHM-D-13-026.1, 2014.
Caccami, M. C. and Marrocco, G.: Electromagnetic Modeling of Self-Tuning RFID Sensor Antennas in Linear and Nonlinear Regimes, IEEE T. Antenn. Propag., 66, 2779–2787, https://doi.org/10.1109/TAP.2018.2820322, 2018.
Caccami, M. C., Manzari, S., and Marrocco, G.: Phase-Oriented Sensing by Means of Loaded UHF RFID Tags, IEEE T. Antenn. Propag., 63, 4512–4520, https://doi.org/10.1109/TAP.2015.2465891, 2015.
Camera, F. and Marrocco, G.: Electromagnetic-Based Correction of Bio-Integrated RFID Sensors for Reliable Skin Temperature Monitoring, IEEE Sens. J., 21, 421–429, https://doi.org/10.1109/JSEN.2020.3014404, 2021.
Charléty, A., Le Breton, M., Larose, E., and Baillet, L.: 2D Phase-Based RFID Localization for On-Site Landslide Monitoring, Remote Sensing, 14, 3577, https://doi.org/10.3390/rs14153577, 2022.
Charléty, A., Le Breton, M., Baillet, L., and Larose, É.: RFID landslide monitoring: long-term outdoor signal processing and phase unwrapping, IEEE J. Radio Freq. Identif., 7, 319–329, https://doi.org/10.1109/JRFID.2023.3256560, 2023.
Cheng, Y., Cheng, B., Zheng, F., Vihma, T., Kontu, A., Yang, Q., and Liao, Z.: Air/snow, snow/ice and ice/water interfaces detection from high-resolution vertical temperature profiles measured by ice mass-balance buoys on an Arctic lake, Ann. Glaciol., 61, 309–319, https://doi.org/10.1017/aog.2020.51, 2020.
Choquette, Y., Ducharme, P., and Rogoza, J.: CS725, an accurate sensor for the snow water equivalent and soil moisture measurements, in: Proceedings of the International Snow Science Workshop, Grenoble, France, 7–11 October 2013, 931–936, http://arc.lib.montana.edu/snow-science/item/1770 (last access: 24 July 2023), 2013.
Confidex: Survivor B – Product datasheet, Confidex, https://www.confidex.com/wp-content/uploads/Survivor_B_Datasheet.pdf (last access: July 2023), 2019.
Costa, F., Genovesi, S., Borgese, M., Michel, A., Dicandia, F. A., and Manara, G.: A Review of RFID Sensors, the New Frontier of Internet of Things, Sensors, 21, 3138, https://doi.org/10.3390/s21093138, 2021.
Dafflon, B., Wielandt, S., Lamb, J., McClure, P., Shirley, I., Uhlemann, S., Wang, C., Fiolleau, S., Brunetti, C., Akins, F. H., Fitzpatrick, J., Pullman, S., Busey, R., Ulrich, C., Peterson, J., and Hubbard, S. S.: A distributed temperature profiling system for vertically and laterally dense acquisition of soil and snow temperature, The Cryosphere, 16, 719–736, https://doi.org/10.5194/tc-16-719-2022, 2022.
Denoth, A., Foglar, A., Weiland, P., Mätzler, C., Aebisher, H., Tiuri, M., and Sihvola, A.: A comparative study of instruments for measuring the liquid water content of snow, J. Appl. Phys., 56, 2154–2160, https://doi.org/10.1063/1.334215, 1984.
Dey, S., Bhattacharyya, R., Karmakar, N., and Sarma, S.: A Folded Monopole Shaped Novel Soil Moisture and Salinity Sensor for Precision Agriculture Based Chipless RFID Applications, in: 2019 IEEE MTT-S International Microwave and RF Conference (IMARC), 2019 IEEE MTT-S International Microwave and RF Conference (IMARC), Mumbai, India, 13–15 December 2019, 1–4, https://doi.org/10.1109/IMaRC45935.2019.9118618, 2019.
EPC-Gen2: EPC™ Radio-Frequency Identity Protocols Generation-2 UHF RFID, Version 2.01, GS1 EPC Global, https://www.gs1.org/sites/default/files/docs/epc/Gen2_Protocol_Standard.pdf (last access: 24 July 2023), 2015.
Espin-Lopez, P. F. and Pasian, M.: Determination of Snow Water Equivalent for Dry Snowpacks Using the Multipath Propagation of Ground-Based Radars, IEEE Geosci. Remote S., 18, 276–280, https://doi.org/10.1109/LGRS.2020.2974546, 2021.
Essery, R., Morin, S., Lejeune, Y., and B Ménard, C.: A comparison of 1701 snow models using observations from an alpine site, Adv. Water Resour., 55, 131–148, https://doi.org/10.1016/j.advwatres.2012.07.013, 2013.
Fierz, C., Amstrong, R. L., Durand, Y., Etchevers, P., Greene, E., McClung, D. M., Nishimura, K., Satyawali, P. K., and Sokratov, S. A.: The International Classification for Seasonal Snow on the Ground, IHP-VII Technical Documents in Hydrology No. 83 UNESCO-IHP, Paris, https://unesdoc.unesco.org/ark:/48223/pf0000186462 (last access: 24 July 2023), 2009.
Fonseca, N., Freire, R., Fontgalland, G., Arruda, B., and Tedjini, S.: A Fully Passive UHF RFID Soil Moisture Time-Domain Transmissometry Based Sensor, in: 2018 3rd International Symposium on Instrumentation Systems, Circuits and Transducers (INSCIT), 3rd International Symposium on Instrumentation Systems, Circuits and Transducers (INSCIT), Bento Goncalves, Brazil, 27–31 August 2018, 1–6, https://doi.org/10.1109/INSCIT.2018.8546707, 2018.
Grasegger, K., Strapazzon, G., Procter, E., Brugger, H., and Soteras, I.: Avalanche Survival After Rescue With the RECCO Rescue System: A Case Report, Wild. Environ. Med., 27, 282–286, https://doi.org/10.1016/j.wem.2016.02.004, 2016.
Grebien, S., Galler, F., Neunteufel, D., Muhlmann, U., Maier, S. J., Arthaber, H., and Witrisal, K.: Experimental Evaluation of a UHF-MIMO RFID System for Positioning in Multipath Channels, in: 2019 IEEE International Conference on RFID Technology and Applications (RFID-TA), 2019 IEEE International Conference on RFID Technology and Applications (RFID-TA), Pisa, Italy, 25–27 September 2019, 95–100, https://doi.org/10.1109/RFID-TA.2019.8892179, 2019.
Harris, C. R., Millman, K. J., van der Walt, S. J., et al.: Array programming with NumPy, Nature, 585, 357–362, https://doi.org/10.1038/s41586-020-2649-2, 2020.
Hechenberger, S., Neunteufel, D., and Arthaber, H.: Ray Tracing and Measurement based Evaluation of a UHF RFID Ranging System, in: 2022 IEEE International Conference on RFID (RFID), 2022 IEEE International Conference on RFID (RFID), Las Vegas, NV, USA, 17–19 May 2022, 75–80, https://doi.org/10.1109/RFID54732.2022.9795977, 2022.
Helbig, N., Schirmer, M., Magnusson, J., Mäder, F., van Herwijnen, A., Quéno, L., Bühler, Y., Deems, J. S., and Gascoin, S.: A seasonal algorithm of the snow-covered area fraction for mountainous terrain, The Cryosphere, 15, 4607–4624, https://doi.org/10.5194/tc-15-4607-2021, 2021.
Helfricht, K., Hartl, L., Koch, R., Marty, C., and Olefs, M.: Obtaining sub-daily new snow density from automated measurements in high mountain regions, Hydrol. Earth Syst. Sci., 22, 2655–2668, https://doi.org/10.5194/hess-22-2655-2018, 2018.
Hunter, J. D.: Matplotlib: A 2D graphics environment, Comput. Sci. Eng., 9, 90–95, https://doi.org/10.1109/MCSE.2007.55, 2007.
Jedermann, R., Ruiz-Garcia, L., and Lang, W.: Spatial temperature profiling by semi-passive RFID loggers for perishable food transportation, Comput. Electron. Agr., 65, 145–154, https://doi.org/10.1016/j.compag.2008.08.006, 2009.
Kinar, N. J. and Pomeroy, J. W.: Measurement of the physical properties of the snowpack, Rev. Geophys., 53, 481–544, https://doi.org/10.1002/2015RG000481, 2015.
Koch, F., Prasch, M., Schmid, L., Schweizer, J., and Mauser, W.: Measuring Snow Liquid Water Content with Low-Cost GPS Receivers, Sensors, 14, 20975–20999, https://doi.org/10.3390/s141120975, 2014.
Koch, F., Henkel, P., Appel, F., Schmid, L., Bach, H., Lamm, M., Prasch, M., Schweizer, J., and Mauser, W.: Retrieval of Snow Water Equivalent, Liquid Water Content, and Snow Height of Dry and Wet Snow by Combining GPS Signal Attenuation and Time Delay, Water Resour. Res., 55, 4465–4487, https://doi.org/10.1029/2018WR024431, 2019.
Kodama, M., Nakai, K., Kawasaki, S., and Wada, M.: An application of cosmic-ray neutron measurements to the determination of the snow-water equivalent, J. Hydrol., 41, 85–92, https://doi.org/10.1016/0022-1694(79)90107-0, 1979.
Kulsoom, F., Dell'Acqua, F., Pasian, M., and Espín-López, P. F.: Snow Layer Detection by Pattern Matching in a Multipath Radar Interference Scenario, Int. J. Remote Sens., 42, 3193–3218, https://doi.org/10.1080/01431161.2020.1854890, 2021.
Larson, K. M., Gutmann, E. D., Zavorotny, V. U., Braun, J. J., Williams, M. W., and Nievinski, F. G.: Can we measure snow depth with GPS receivers?, Geophys. Res. Lett., 36, L17502, https://doi.org/10.1029/2009GL039430, 2009.
Lazaro, A., Girbau, D., and Salinas, D.: Radio Link Budgets for UHF RFID on Multipath Environments, IEEE Trans. Antennas Propagat., 57, 1241–1251, https://doi.org/10.1109/TAP.2009.2015818, 2009.
Le Breton, M.: Suivi temporel d'un glissement de terrain à l'aide d'étiquettes RFID passives, couplé à l'observation de pluviométrie et de bruit sismique ambiant, PhD Thesis, Université Grenoble Alpes, ISTerre, Grenoble, France, https://doi.org/10.13140/RG.2.2.20636.00649, 2019.
Le Breton, M.: Increased ranging accuracy of RFID tags in ETSI regions using 53 MHz wide dual bands, TechRxiv [preprint], https://doi.org/10.36227/techrxiv.23538405, 18 June 2023.
Le Breton, M., Baillet, L., Larose, E., Rey, E., Benech, P., Jongmans, D., and Guyoton, F.: Outdoor UHF RFID: Phase Stabilization for Real-World Applications, IEEE Journal of Radio Frequency Identification, 1, 279–290, https://doi.org/10.1109/JRFID.2017.2786745, 2017.
Le Breton, M., Baillet, L., Larose, E., Rey, E., Benech, P., Jongmans, D., Guyoton, F., and Jaboyedoff, M.: Passive radio-frequency identification ranging, a dense and weather-robust technique for landslide displacement monitoring, Eng. Geol., 250, 1–10, https://doi.org/10.1016/j.enggeo.2018.12.027, 2019.
Le Breton, M., Liébault, F., Baillet, L., Charléty, A., Larose, É., and Tedjini, S.: Dense and long-term monitoring of earth surface processes with passive RFID – a review, Earth-Sci. Rev., 234, 104225, https://doi.org/10.1016/j.earscirev.2022.104225, 2022.
Le Breton, M., Baillet, L., and Larose, É.: Tomography of the quantity of grass using RFID propagation-based sensing, TechRxiv [preprint], https://doi.org/10.36227/techrxiv.23538381, 18 June 2023.
Lejeune, Y., Dumont, M., Panel, J.-M., Lafaysse, M., Lapalus, P., Le Gac, E., Lesaffre, B., and Morin, S.: 57 years (1960–2017) of snow and meteorological observations from a mid-altitude mountain site (Col de Porte, France, 1325 m of altitude), Earth Syst. Sci. Data, 11, 71–88, https://doi.org/10.5194/essd-11-71-2019, 2019.
Lucas, C., Leinss, S., Bühler, Y., Marino, A., and Hajnsek, I.: Multipath Interferences in Ground-Based Radar Data: A Case Study, Remote Sensing, 9, 1260, https://doi.org/10.3390/rs9121260, 2017.
Luvisi, A., Panattoni, A., and Materazzi, A.: RFID temperature sensors for monitoring soil solarization with biodegradable films, Comput. Electron. Agr., 123, 135–141, https://doi.org/10.1016/j.compag.2016.02.023, 2016.
Manzari, S. and Marrocco, G.: Modeling and Applications of a Chemical-Loaded UHF RFID Sensing Antenna With Tuning Capability, IEEE T. Antenn. Propag., 62, 94–101, https://doi.org/10.1109/TAP.2013.2287008, 2014.
Marchenko, S. A., Pelt, W. J. J. van, Pettersson, R., Pohjola, V. A., and Reijmer, C. H.: Water content of firn at Lomonosovfonna, Svalbard, derived from subsurface temperature measurements, J. Glaciol., 67, 921–932, https://doi.org/10.1017/jog.2021.43, 2021.
Mätzler, C.: Applications of the interaction of microwaves with the natural snow cover, Remote Sensing Reviews, 2, 259–387, https://doi.org/10.1080/02757258709532086, 1987.
Mellor, M.: Engineering Properties of Snow, J. Glaciol., 19, 15–66, https://doi.org/10.1017/S002214300002921X, 1977.
Miesen, R., Parr, A., Schleu, J., and Vossiek, M.: 360∘ carrier phase measurement for UHF RFID local positioning, in: 2013 IEEE International Conference on RFID-Technologies and Applications (RFID-TA), 2013 IEEE International Conference on RFID-Technologies and Applications (RFID-TA), Johor Bahru, Malaysia, 4–5 September 2013, 00002, 1–6, https://doi.org/10.1109/RFID-TA.2013.6694499, 2013.
Mike Stanford: Use of Recco System to Locate Buried Roads in a Winter Environment, in: Proceedings of the 1994 International Snow Science Workshop, Snowbird, Utah, USA, 30 October–3 November 1994, 601–605, https://arc.lib.montana.edu/snow-science/item/1379 (last access: 26 July 2023), 1994.
Mondal, S., Kumar, D., and Chahal, P.: A Wireless Passive pH Sensor With Clutter Rejection Scheme, IEEE Sens. J., 19, 3399–3407, https://doi.org/10.1109/JSEN.2019.2893869, 2019.
Nikitin, P. V. and Rao, K. V. S.: Performance limitations of passive UHF RFID systems, in: IEEE Antennas and Propagation Soc. Int. Symp., Albuquerque, NM, USA, 14 July 2006, 00285, https://doi.org/10.1109/APS.2006.1710704, 2006.
Nikitin, P. V., Martinez, R., Ramamurthy, S., Leland, H., Spiess, G., and Rao, K. V. S.: Phase based spatial identification of UHF RFID tags, in: IEEE Int. Conf. RFID, IEEE International Conference on RFID, Orlando, FL, USA, 16 April 2010, 00325, 102–109, https://doi.org/10.1109/RFID.2010.5467253, 2010.
Oldroyd, H. J., Higgins, C. W., Huwald, H., Selker, J. S., and Parlange, M. B.: Thermal diffusivity of seasonal snow determined from temperature profiles, Adv. Water Resour., 55, 121–130, https://doi.org/10.1016/j.advwatres.2012.06.011, 2013.
Pirazzini, R., Leppänen, L., Picard, G., Lopez-Moreno, J. I., Marty, C., Macelloni, G., Kontu, A., von Lerber, A., Tanis, C. M., Schneebeli, M., de Rosnay, P., and Arslan, A. N.: European In-Situ Snow Measurements: Practices and Purposes, Sensors-Basel, 18, https://doi.org/10.3390/s18072016, 2018.
Proksch, M., Mätzler, C., Wiesmann, A., Lemmetyinen, J., Schwank, M., Löwe, H., and Schneebeli, M.: MEMLS3&a: Microwave Emission Model of Layered Snowpacks adapted to include backscattering, Geosci. Model Dev., 8, 2611–2626, https://doi.org/10.5194/gmd-8-2611-2015, 2015.
Reusser, D. E. and Zehe, E.: Low-cost monitoring of snow height and thermal properties with inexpensive temperature sensors, Hydrol. Process., 25, 1841–1852, https://doi.org/10.1002/hyp.7937, 2011.
Royer, A., Roy, A., Jutras, S., and Langlois, A.: Review article: Performance assessment of radiation-based field sensors for monitoring the water equivalent of snow cover (SWE), The Cryosphere, 15, 5079–5098, https://doi.org/10.5194/tc-15-5079-2021, 2021.
Schattan, P., Baroni, G., Oswald, S. E., Schöber, J., Fey, C., Kormann, C., Huttenlau, M., and Achleitner, S.: Continuous monitoring of snowpack dynamics in alpine terrain by aboveground neutron sensing, Water Resour. Res., 53, 3615–3634, https://doi.org/10.1002/2016WR020234, 2017.
Schmid, L., Heilig, A., Mitterer, C., Schweizer, J., Maurer, H., Okorn, R., and Eisen, O.: Continuous snowpack monitoring using upward-looking ground-penetrating radar technology, J. Glaciol., 60, 509–525, https://doi.org/10.3189/2014JoG13J084, 2014.
Schmid, L., Koch, F., Heilig, A., Prasch, M., Eisen, O., Mauser, W., and Schweizer, J.: A novel sensor combination (upGPR-GPS) to continuously and nondestructively derive snow cover properties, Geophys. Res. Lett., 42, 3397–3405, https://doi.org/10.1002/2015GL063732, 2015.
Sigouin, M. J. P. and Si, B. C.: Calibration of a non-invasive cosmic-ray probe for wide area snow water equivalent measurement, The Cryosphere, 10, 1181–1190, https://doi.org/10.5194/tc-10-1181-2016, 2016.
Steiner, L., Meindl, M., and Geiger, A.: Characteristics and limitations of GPS L1 observations from submerged antennas, J. Geodesy, 93, 267–280, https://doi.org/10.1007/s00190-018-1147-x, 2019.
Techel, F. and Pielmeier, C.: Point observations of liquid water content in wet snow – investigating methodical, spatial and temporal aspects, The Cryosphere, 5, 405–418, https://doi.org/10.5194/tc-5-405-2011, 2011.
Tedesco, M.: Electromagnetic properties of components of the cryosphere, in: Remote Sensing of the Cryosphere, Wiley, https://doi.org/10.1002/9781118368909.ch2, 2015.
Tedesco, M., Derksen, C., Deems, J. S., and Foster, J. L.: Remote sensing of snow depth and snow water equivalent, in: Remote Sensing of the Cryosphere, John Wiley & Sons, Ltd, 73–98, https://doi.org/10.1002/9781118368909.ch5, 2014.
The Pandas Development Team: pandas-dev/pandas: Pandas, Zenodo [software], https://doi.org/10.5281/zenodo.3509134, 2020.
Tiuri, M., Sihvola, A., Nyfors, E., and Hallikaiken, M.: The complex dielectric constant of snow at microwave frequencies, IEEE J. Oceanic Eng., 9, 377–382, https://doi.org/10.1109/JOE.1984.1145645, 1984.
Wagih, M. and Shi, J.: Wireless Ice Detection and Monitoring Using Flexible UHF RFID Tags, IEEE Sens. J., 21, 18715–18724, https://doi.org/10.1109/JSEN.2021.3087326, 2021.
Xu, J., Li, Z., Zhang, K., Yang, J., Gao, N., Zhang, Z., and Meng, Z.: The Principle, Methods and Recent Progress in RFID Positioning Techniques: A Review, IEEE Journal of Radio Frequency Identification, 7, 50–63, https://doi.org/10.1109/JRFID.2022.3233855, 2023.
- Abstract
- Introduction
- Method and instruments
- Results of the SWE measurements
- Discussion
- Conclusions
- Appendix A: Uncertainty between SWE measured by RFID and weighing
- Appendix B: Temperature measurements
- Appendix C: Interim results and wet-snow periods
- Appendix D: Illustration of multipathing
- Code availability
- Data availability
- Author contributions
- Competing interests
- Disclaimer
- Acknowledgements
- Financial support
- Review statement
- References