the Creative Commons Attribution 4.0 License.
the Creative Commons Attribution 4.0 License.
 | 18 Jul 2023
Characterizing the surge behaviour and associated ice-dammed lake evolution of the Kyagar Glacier in the Karakoram
Guanyu Li
Duncan J. Quincey
Liam S. Taylor
Xinwu Li
Shiyong Yan
Yidan Sun
Huadong Guo
Glacier surges are prevalent in the Karakoram and occasionally threaten local residents by inundating land and initiating mass movement events. The Kyagar Glacier is well known for its surge history, and in particular its frequent blocking of the downstream valley, leading to a series of high-magnitude glacial lake outburst floods (GLOFs). Although the surge dynamics of the Kyagar Glacier have been broadly described in the literature, there remains an extensive archive of remote sensing observations that have great potential for revealing specific surge characteristics and their relationship with historic lake outburst floods. In this study, we propose a new perspective on quantifying the surging process using successive digital elevation models (DEMs), which could be applied to other sites where glacier surges are known to occur. Advanced Spaceborne Thermal Emission and Reflection Radiometer DEMs, High Mountain Asia 8-meter DEMs, and the Shuttle Radar Topography Mission DEM were used to characterize surface elevation changes throughout the period from 2000 to 2021. We also used Landsat time series imagery to quantify glacier surface velocities and associated lake changes over the course of two surge events between 1989 and 2021. Using these datasets, we reconstruct the surging process of the Kyagar Glacier in unprecedented detail and find a clear signal of surface uplift over the lower glacier tongue, along with uniformly increasing velocities, associated with the period of surge initiation. Seasonal variations in surface flow are still evident throughout the surge phase, indicating the presence of water at the glacier bed. Surge activity of the Kyagar Glacier is strongly related to the development and drainage of the terminal ice-dammed lake, which itself is controlled by the drainage system beneath the glacier terminus.
- Article
(17188 KB) - Full-text XML
-
Supplement
(7918 KB) - BibTeX
- EndNote


A glacier surge is defined as a quasiperiodic oscillating glacial motion switching between rapid and slow flow, periods that are known as the active and quiescent phase respectively (Benn and Evans, 2010; Jiskoot, 2011). Surge-type glaciers account for less than 1 % of mountain glaciers, but they are important for studying ice flow instabilities and advancing knowledge of glacier processes and how they respond to a capricious climate (Benn, 2021; Clarke, 1987; Sevestre and Benn, 2015; Truffer et al., 2021). Surging glaciers are usually clustered and are found within areas where inputs and outputs of enthalpy cannot keep balance (Benn et al., 2019). In this context, enthalpy refers to thermal energy and water gained at the glacier bed resulting from friction and geothermal heat. Sometimes, climate conditions, and topographic and geologic features can intensify such imbalances, and the Karakoram is one such zone (Guillet et al., 2022; Sevestre and Benn, 2015). In contrast to most glacierized regions, the Karakoram has experienced balanced to slightly positive ice mass change in recent decades (Hewitt, 2005; Gardelle et al., 2013; Farinotti et al., 2020; Hugonnet et al., 2021), and surge activity has been common (Copland et al., 2011; Bhambri et al., 2017; Paul, 2020).
Glacier surges and related glacial lake outburst floods (GLOFs) occasionally cause catastrophic damage to local residents and infrastructure in high mountain regions of Asia (Hewitt and Liu, 2010; Bhambri et al., 2019; Ding et al., 2018; Bazai et al., 2021). Most recently (2018–2019) the Shispare Glacier in the central Karakoram surged, forming an ice-dammed lake (Rashid et al., 2020). The lake partially drained in June 2019 and then again in May 2020, affecting the Karakoram Highway and the neighbouring village of Hasanabad (Bhambri et al., 2020). Similarly, the surge of Kelayayilake Glacier in the Pamir, which occurred in the spring of 2015, destroyed dozens of herders' huts and inundated valuable grazing meadows (Shangguan et al., 2016). A better understanding of surge dynamics, how they evolve, and their relationship with GLOFs would therefore be highly informative for local stakeholders.
Although it is one among hundreds of surge-type glaciers in the Karakoram, Kyagar Glacier has attracted much attention in the literature (Haemmig et al., 2014; Round et al., 2017; Zhang et al., 2020). It is well known for blocking the Shaksgam Valley and thus damming the river, which results in the formation of a large ice-dammed lake. It has been a threat over the past 2 centuries to more than one million people living in the Yarkant River basin (Yin et al., 2019). GLOFs caused by the Kyagar Glacier have been recorded by two gauging stations, at Kuluklangan and Kaqun, since the 1960s (Zhang, 1992; Haemmig et al., 2014). Attempts to provide an early warning system to alert local communities of an imminent flood have had limited success. Although the early warning station was submerged due to the rapid impoundment of the glacial lake in June 2015, the system did warn downstream communities and decision-makers about the coming GLOF (Haemmig et al., 2014; Round et al., 2017).
Previous work has focused on observational data and satellite images to characterize surface velocities and elevation changes over previous surge events (Haemmig et al., 2014; Round et al., 2017; Bhambri et al., 2019) and to discuss their relationship with ice-dammed lake evolution. Round et al. (2017) drew the conclusion that outburst events at the Kyagar Glacier are controlled by basal and subglacial hydrological conditions. They also suggested that the potential for further GLOFs in the period following 2016 was high as the tongue continued to supply mass to the terminus area, maintaining the height of the existing ice dam. Haemmig et al. (2014) and Round et al. (2017) both inferred that previous surge activity had occurred prior to 2000, but did not give direct evidence of it. They speculated that the recurring GLOFs recorded in 1978 and 1999 could indicate the maximum return period of glacier surges. Bhambri et al. (2019) reported one of the surge events lasted from 1994 to 1997. Another former surge from 1975 to 1978 was confirmed by Zhang et al. (2023) using glacial velocity data derived from Landsat images, again indicating an approximate surge cycle of 19–20 years. Like other glacier surge studies utilizing remote sensing, most of them primarily focused on the evolution of surface velocity and the description of related surface features, with limited digital elevation models (DEMs) used to discuss the amplitude of surface elevation change caused by the surges and to analyse mass balance conditions.
Remote sensing images provide an excellent means of characterizing glacier parameters, for example through the calculation of glacier flow fields and surface elevation changes. In particular, the long archive of Advanced Spaceborne Thermal Emission and Reflection Radiometer (ASTER) stereo images collected since 2000 can provide an insight into seasonal and annual changes in glacier surface elevation, especially for surge-type glaciers which experience more dramatic surface changes than non-surging glaciers. With a surge cycle comparable to the ASTER archive length, the Kyagar Glacier is an ideal case on which to test a new approach for describing glacier surge events using DEMs generated from ASTER images (Pitte et al., 2016; Bhambri et al., 2019). The primary aim of this study was, therefore, to investigate the use of the ASTER archive to quantify glacier surge elevation change before, during, and after surge events. The High Mountain Asia 8 m (HMA) DEMs (Shean, 2017a, b) and the Shuttle Radar Topography Mission (SRTM) DEM (EROS Center, 2018) were added to narrow down uncertainties, with a view to developing a workflow that could be universal and popularized for use in other surge studies. As well as using an overall larger number of DEMs to reconstruct the surging process than previous studies (Pitte et al., 2016; Bhambri et al., 2019), we also applied HMA DEMs for the first time to better understand the evolution of the Kyagar Glacier surge.
To aid in discussion of surge dynamics of the Kyagar Glacier and GLOF assessment, we used Landsat time series imagery to generate annual and monthly glacial surface velocity maps from 1989 to 2021 covering two surge events. In addition, we characterized the evolution of the ice-dammed lake up to 2022 and evaluated the potential for outburst floods emanating from this site in the future.
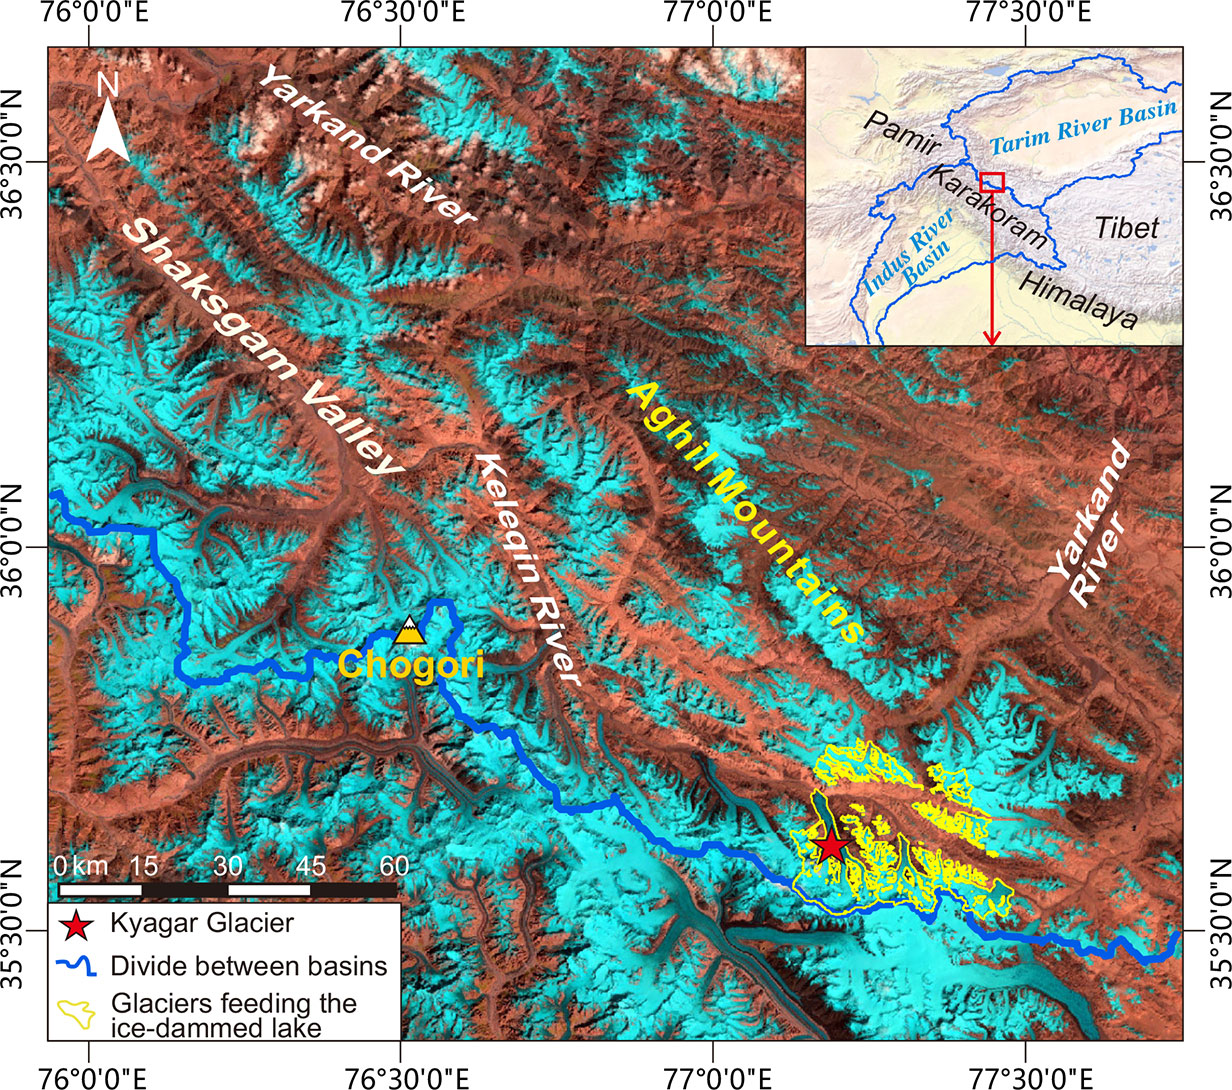
Figure 1Location of the Kyagar Glacier and regional geographical conditions. Mount Chogori is labelled to assist in orientation. The background is a Landsat OLI image (band 6-5-4) acquired on 6 September 2021.
Kyagar Glacier is located on the southern slope of Shaksgam Valley near the boundary of the Tarim River and Indus River basins (Fig. 1). To the north-west of the Kyagar Glacier stands Mount Chogori, known as K2. The glacier is polythermal in nature (Shi and Liu, 2000), and the meltwater that is discharged from the Kyagar Glacier supplies the Keleqin River, which is the largest tributary of the Yarkant River. Regional temperatures range from −25 to +10 ∘C and the peak melt season runs from June to September (Zhang et al., 2020). Records from meteorological stations in the neighbouring Tibet Plateau and Tarim Basin show an increase of ∼2 ∘C in mean annual temperature since the 1960s (Lv et al., 2020a). Precipitation in this region is primarily controlled by the Asian monsoon during summer months and westerly circulation during winter months (Bookhagen and Burbank, 2006; Thayyen and Gergan, 2010). Due to its continental nature and high-elevation situation, there is relatively little precipitation to nourish the glacier accumulation zone. Precipitation of just 8.87 mm a−1 was recently recorded by the Kyagar automatic monitoring station at an elevation of 4810 m a.s.l. (Wei et al., 2018; Fig. 2c).

Figure 2(a) Location of the ice-dammed lake and elevation profiles of the Kyagar Glacier. The background is a sharpened Landsat OLI image (band 6-5-4) acquired on 4 July 2015. Red dots indicate points along the western branch in Figs. 6 and 8. (b) Elevation along two centrelines from the terminus; the western branch is shown in red and the central branch shown in yellow. (c) Hypsometry curve of the Kyagar Glacier.
Composed of three tributaries, Kyagar Glacier has a glacierized area of 97.3 km2, flowing from its maximum elevation of 7196 m a.s.l. down to the glacier terminus at 4738 m a.s.l. It is at the glacier terminus where small fluctuations in ice flux can result in a blockage of the Keleqin River in the Shaksgam Valley and the formation of an ice-dammed lake (Fig. 2a). Meltwater from several other glaciers in the broader catchment also contribute to the lake volume. Glacier centreline elevation profiles (Fig. 2a) show that the western branch is higher than the central branch above the confluence (Fig. 2b). The glacier hypsometry indicates a bottom-heavy morphology (Fig. 2c). The glacier tongue is densely covered by ice crevasses and ice pinnacles, but there is a general absence of “classic” surge-type surface features (e.g. looped moraines; Copland et al., 2003; Sevestre and Benn, 2015).
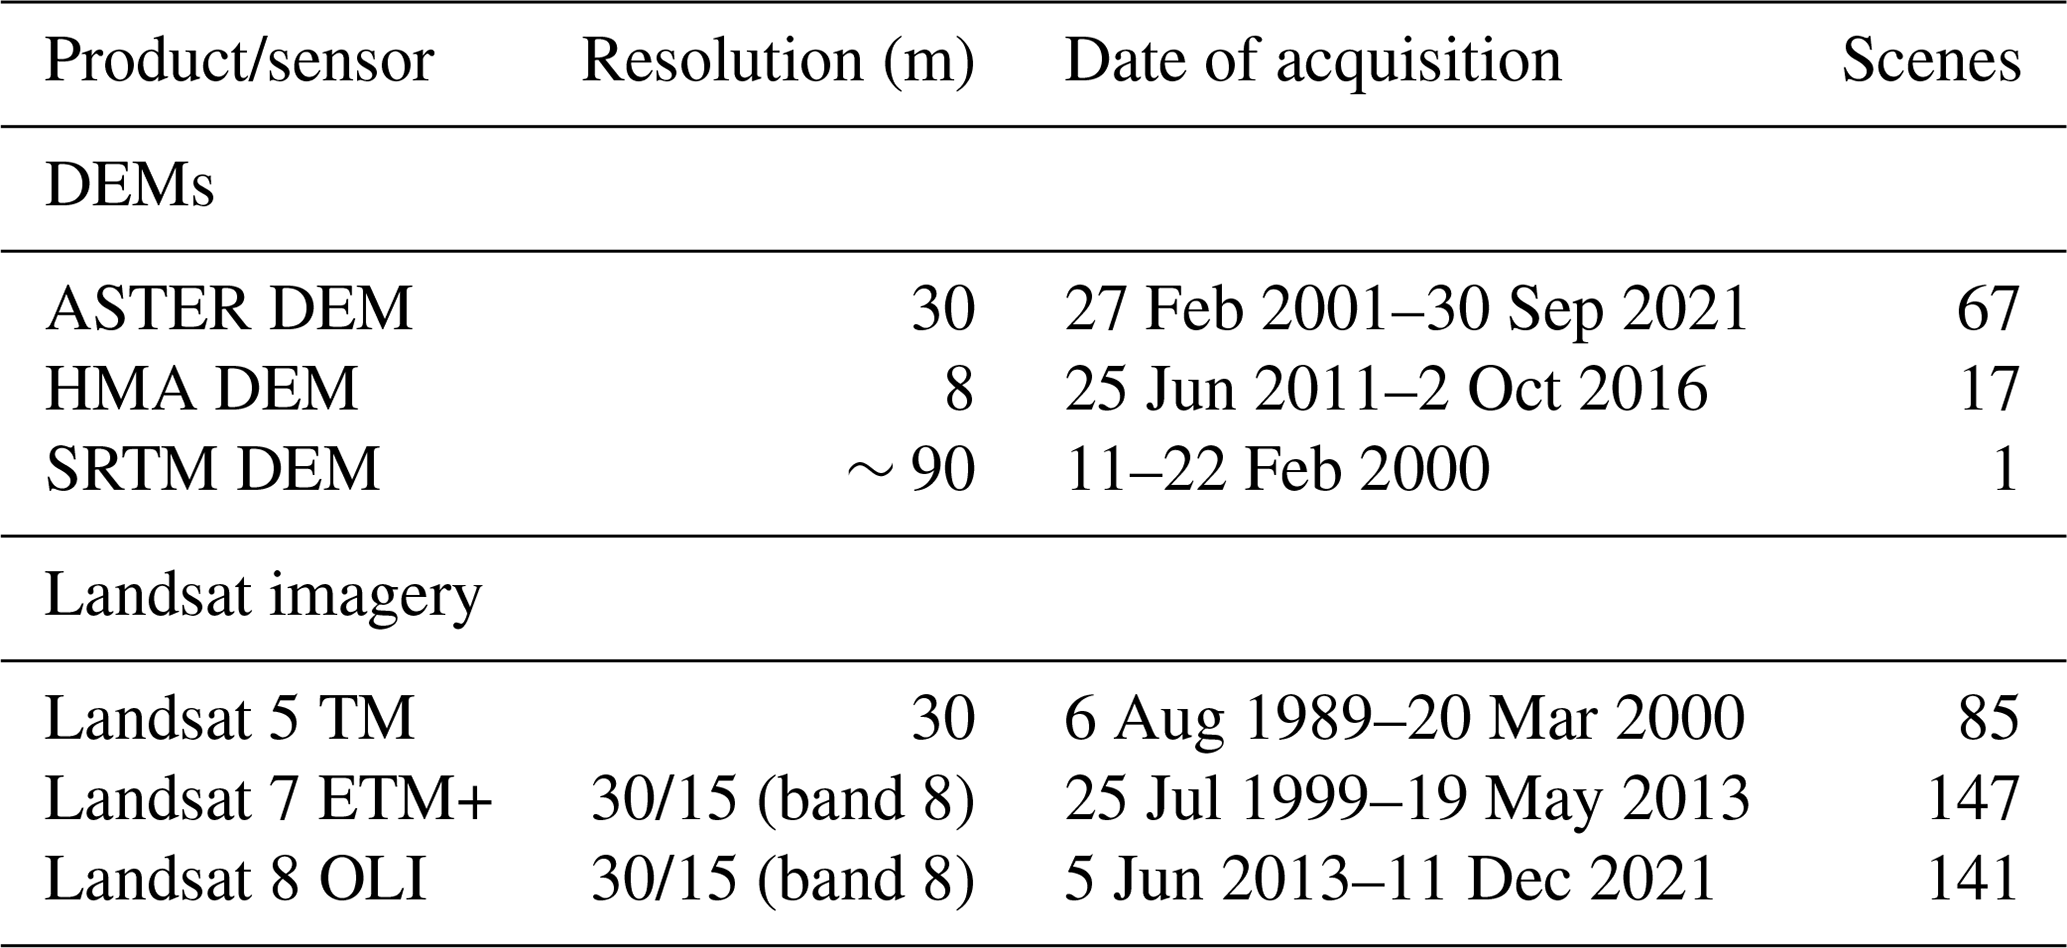
Table 1Details of the Landsat series images and DEMs used in this study.
3.1 Multi-source remote sensing data
We used three DEM products in addition to Landsat series satellite imagery to facilitate this study (Table 1). DEMs were mostly derived from stereo ASTER imagery and supplemented by the HMA DEM and the SRTM DEM. In total we compiled 85 DEMs presenting elevation conditions from 2000 to 2021. These DEMs were co-registered and differenced to generate elevation change maps over the glacierized area and surrounding stable terrain. Post-processing was conducted to identify the glacier surge period and quantify elevation changes before, during, and after the surge on a pixel level. We collected 373 images acquired by Landsat 5 TM, Landsat 7 ETM+, and Landsat 8 OLI to extract annual and monthly glacial surface velocities and investigate glacial lake evolution between 1989 and 2021.
3.1.1 ASTER DEM
The Terra ASTER DEM, also known as the AST14DEM data product (NASA/METI/AIST/Japan Spacesystems and U.S./Japan ASTER Science Team, 2001), is produced by the Land Processes Distributed Active Archive Center (LP DAAC) using two stereo images in the near-infrared spectrum (bands 3N and 3B). AST14DEM images have a spatial resolution of 30 m under the Universal Transverse Mercator (UTM) coordinate system and are more accurate than 25 m root mean square error (RMSE) in all dimensions. The ASTER DEM product was ordered through NASA's Earthdata Search (https://search.earthdata.nasa.gov, last access: 17 July 2023). In this study, the acquisition dates of 67 ASTER DEMs with less than 75 % cloud cover are evenly spread between February 2001 and September 2021 (Table S1). Having a width of 60 km, a single granule was sufficient to cover the entire Kyagar Glacier. Therefore, we used the ASTER DEM as the primary data source for quantifying surface elevation changes.
3.1.2 HMA DEM
The HMA DEM dataset is generated from stereoscopic DigitalGlobe satellite imagery released by the National Snow and Ice Data Center (NSIDC) in 2017 (Shean, 2017a, b). Benefiting from the high spatial resolution of predominantly commercial satellites, the HMA DEM has a finer resolution (8 m) than the ASTER DEM. Seventeen HMA DEM strips (with cloud cover of less than 75 %) cover the Kyagar Glacier with a temporal coverage from June 2011 to October 2016 (Table S1). Before co-registration, these DEMs were resampled to 30 m and reprojected to the UTM grid as per the ASTER DEMs. As they were fewer than the ASTER DEMs, the HMA DEMs were taken as supplementary data for quantifying surface elevation changes (Table S1).
3.1.3 SRTM DEM
The Shuttle Radar Topography Mission (SRTM) collected near-global C-band radar data for 11 d in February 2000. Two different radar antennas onboard the shuttle formed a single-pass interferometry, which was used to calculate surface elevation. The SRTM DEM has an accuracy better than 10 m in both horizontal and vertical directions, at least in areas of low relief (Farr et al., 2007). We used SRTM Non-Void Filled DEM released by the United States Geological Survey (USGS) in which the data gaps are neither interpolated nor filled using other DEMs. The SRTM DEM was resampled to 30 m and reprojected to the UTM grid. It was used as the reference elevation for co-registration with other DEM datasets. Penetration of the radar signal can be up to several metres in snow- and ice-covered areas, leading to uncertainty in the surface elevation retrieval (Rignot et al., 2001; Kääb et al., 2012). In order to correct for surface penetration, we applied adjustments of +5.5 m over firn and snow areas and +1.1 m over clean ice areas following previous studies in a nearby region (e.g. Lv et al., 2020a). Identification of ice and snow facies is based on a Landsat ETM+ image acquired in February 2000, which was approximately coincident with the SRTM mission.
3.1.4 Landsat series imagery
As Landsat is the longest continuous satellite mission observing the Earth, its imagery is perfect for monitoring environment evolution over the past half-century. As a consequence of coarse spatial resolution and data scarcity, images acquired by Landsat 1, 2, and 3 with a resolution of approximate 60 m would be extremely challenging for feature tracking. Therefore, a total of 373 radiometrically and geometrically corrected images from Landsat 5, 7, and 8 imageries were downloaded from USGS Earth Resources Observation and Science Center (EROS; https://glovis.usgs.gov/, last access: 17 July 2023; Wulder et al., 2022) to investigate glacial lake area changes. Additionally, feature tracking was applied to all acquired images and the results from 60 pairs with good correlation performance were finally selected to present annual surface displacements from 1989 to 2021 as well as monthly displacements during surge events.
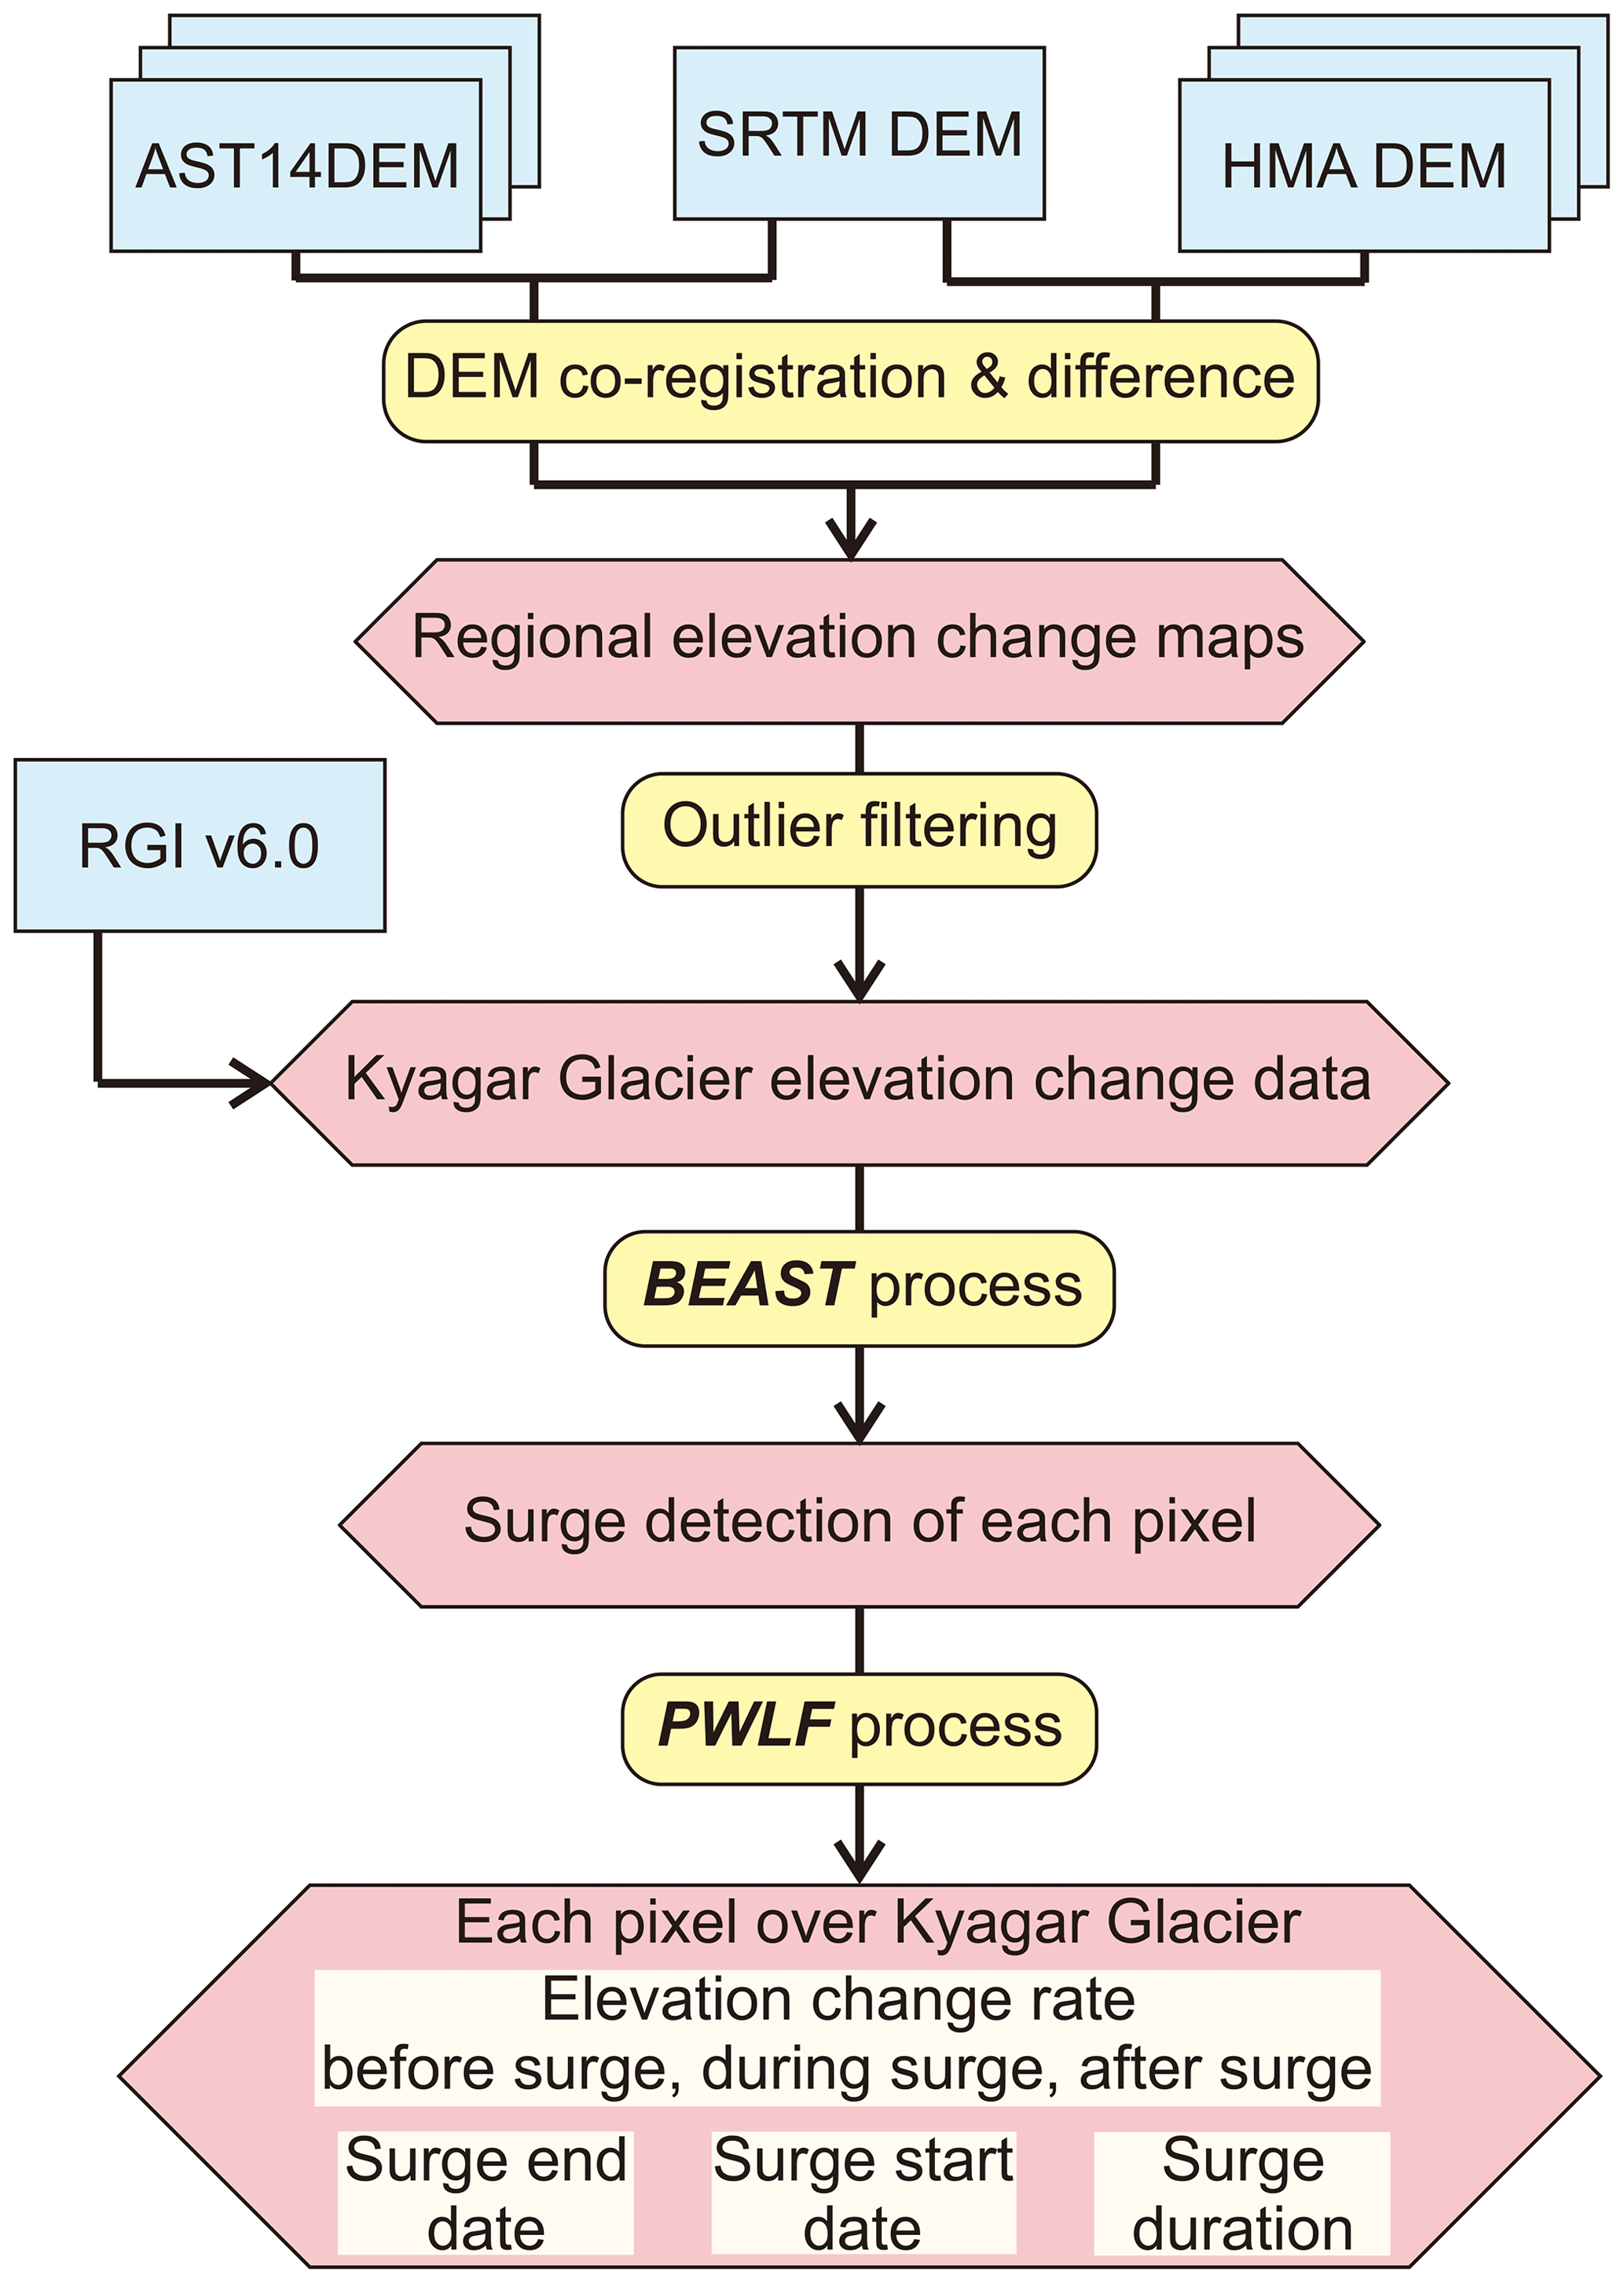
3.2 DEM co-registration and outlier filtering
Multi-source DEMs are known to have inconsistent geolocations due to varying data acquisition models, inadequate ground survey conditions, different data post-processing methods, etc. (Nuth and Kääb, 2011). Following the workflow in Fig. 3, we co-registered the ASTER DEMs and HMA DEMs to the reference SRTM DEM using Nuth and Kääb (2011) and demcoreg (Shean et al., 2016). Demcoreg is a collection of Python and shell scripts for co-registration of DEMs that automatically implements the correction algorithm using areas of stable terrain, where the DEMs are least error prone (Nuth and Kääb, 2011; Berthier et al., 2016). The mean and standard deviations of DEM offsets over off-glacier areas before and after co-registration are shown in Table S1. After co-registration, we resampled all DEMs to the resolution of the ASTER DEM (30 m) using a cubic convolution interpolation, and then we generated difference maps between ASTER/HMA DEMs and the reference SRTM DEM in order to obtain regional elevation change data.
To remove outliers in each elevation change map, glacierized and non-glacierized areas were handled separately. Non-glacier pixels with values greater than 3 standard deviations from the mean were discarded (Ragettli et al., 2016), and the vertical offsets of most selected ASTER/HMA DEMs relative to SRTM over non-glacierized terrain were reduced to within ±2 m. We assumed elevation changes over the accumulation zone did not exceed 3 m each year from 2000 to 2021 and therefore filtered pixels above 5600 m a.s.l. with values accounting for each time step (e.g. for a 10-year interval, the filter value was ±30 m; Lv et al., 2020b). Pixels at elevations below 5600 m a.s.l. were filtered with a threshold of ±150 m to avoid excluding real values associated with surging. Outlier-free elevation change maps were arranged in chronological order ready for further processing.
3.3 Post-processing of DEM differencing data
Using the elevation change data of the Kyagar Glacier as a basis, we here present a time series processing method for long-term elevation change monitoring and for the detection of possible surge events.
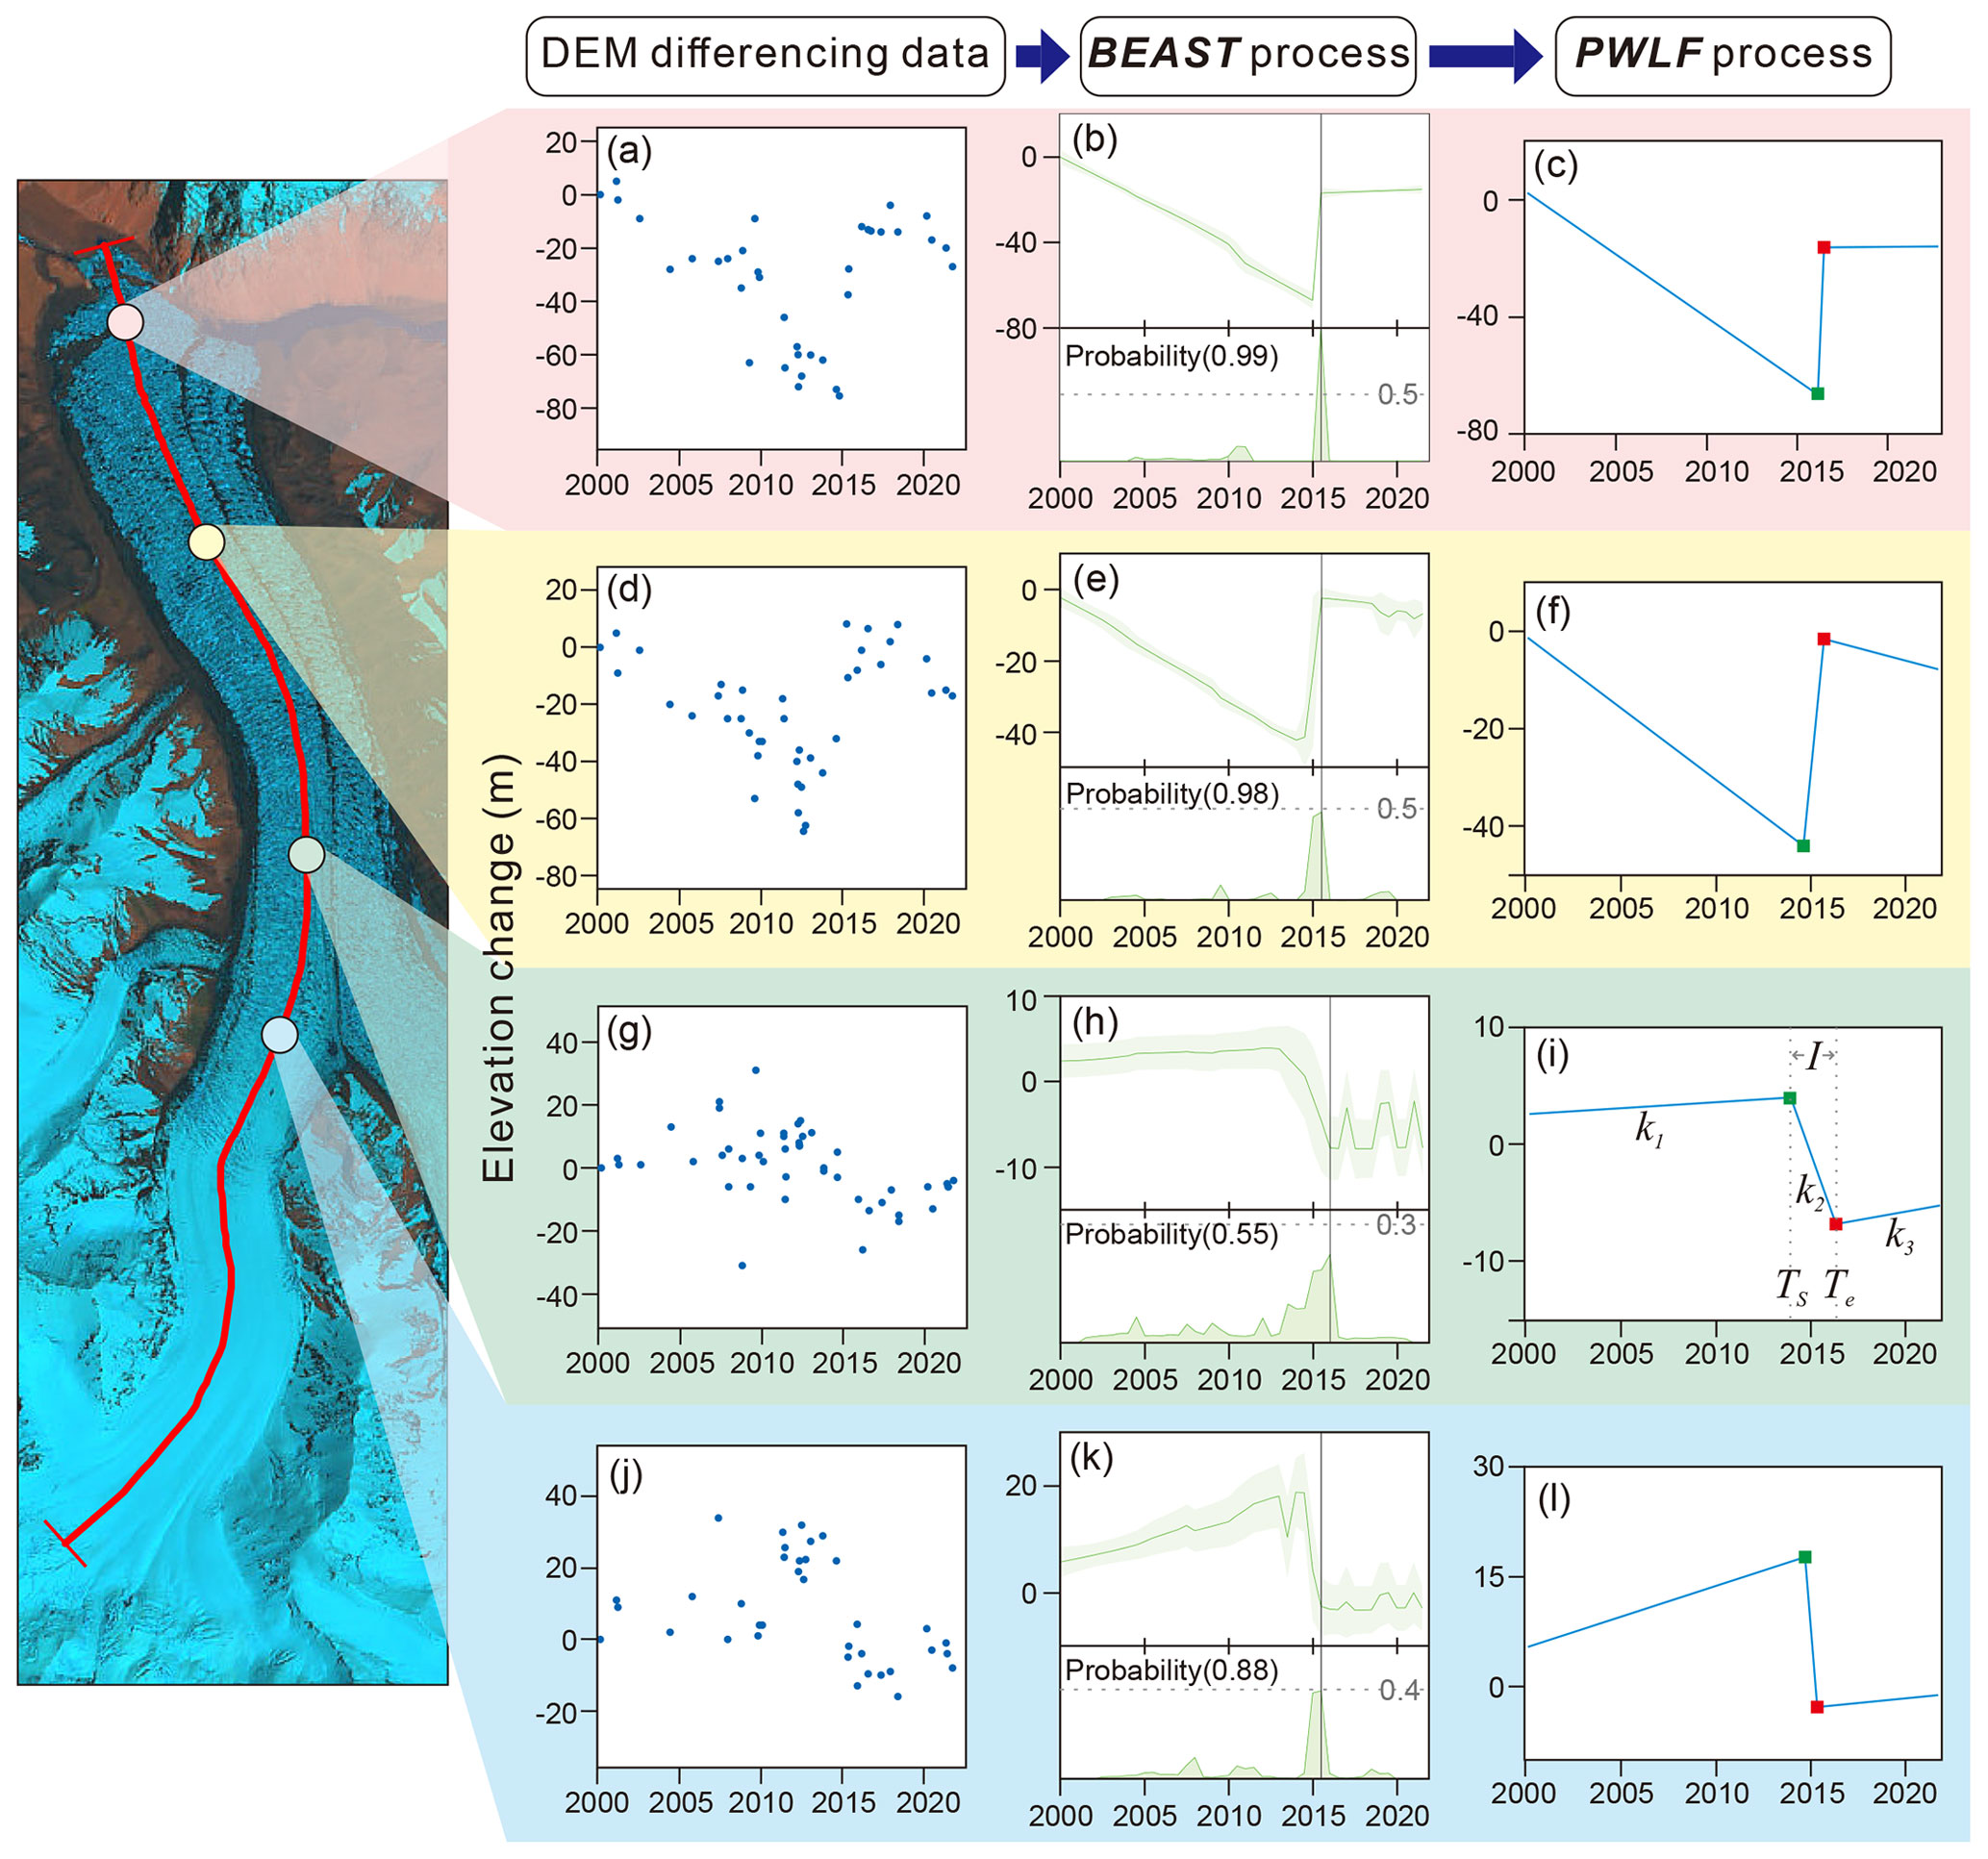
Figure 4Presentation of DEM differencing data post-processing. Four random pixels were selected along the central profile of the western branch. The green spots in (c), (f), (i), and (l) represent the timing of each pixel starting to endure surge impact. The red spots represent the end of surge impact on each pixel. Parameters identified in (i) are shown in Fig. 10. The background image was acquired by Landsat OLI on 4 July 2015.
The Bayesian Estimator of Abrupt change, Seasonality, and Trend (BEAST) is a Bayesian model-averaging algorithm to decompose time series data into components, including seasonality, trends, and abrupt changes (Zhao et al., 2019). Compared with conventional change point detection algorithms, BEAST does not seek a single best model that may result in poor fitting, but rather combines kinds of models into an ensemble model and fits the seasonal and trend signals based on Bayesian model averaging and Markov Chain Monte Carlo strategies (Cai et al., 2020). Applying the BEAST model to DEM differencing data over Kyagar Glacier pixel by pixel, we fitted trend signals and located periods of abnormal change from 2000 to 2021 on a 6-month rolling basis (Fig. 4). Given that BEAST is a general linear regression model using Bayesian probability, we evaluated its performance by common measures such as probability, R2, and RMSE. The abnormal changes in the time series elevation data were identified by the probability parameters, which are calculated by summing the probability distribution in the trend signals (Fig. 4b, e, h, k). According to the IPCC Likelihood Scale, the abnormal elevation change is “more likely than not” to occur when the probability is greater than 0.50 (Mastrandrea et al., 2010). Therefore, we propose that pixels with probability values larger than 0.50 are credible enough to be considered as abnormal changes. We also compared the findings from BEAST to the known timing of surge events as recorded in the literature.
We then applied the PieceWise Linear Functions (PWLF) Python package to further decompose the trend in elevation change into multiple piecewise linear function models (Jekel and Venter, 2019). PWLF is based on a differential evolution optimization algorithm where users can specify the location or numbers of break points (Storn and Price, 1997). For linear function models, the slope of each segment represents the elevation change rate within the corresponding period, and the breakpoints represent the abrupt change time resulting from the glacier surge event.
The results of the BEAST process clearly indicated the presence of a surge event between 2010 and 2018. Thus, we limited the detection of break points to this period. After the PWLF process, every pixel over Kyagar Glacier was assigned six parameters, elevation change rates before, during, and after the surge, the dates of surge initiation and termination, and the duration of the surge impact, using the labels k1, k2, k3, Ts, Te, and I respectively (Figs. 3 and 4i).
3.4 Extraction of glacial velocities
In order to measure surface displacements, feature tracking was conducted using COSI-Corr (Leprince et al., 2007). After co-registration, image pairs were cross-correlated using a sliding window between 32×32 and 8×8 to measure horizontal displacements between corresponding surface features along the north–south and east–west directions. Glacial velocity (Vel) was then calculated through Eq. (1).
Here, Di is the period in days between acquisitions of each image pair and Dy is assigned 365, which is the number of days in a year. Pn−s and Pe−w are the displacements in north–south and east–west directions respectively. Panchromatic bands of Landsat 7 and Landsat 8 with a resolution of 15 m were selected as the potential image pairs between 1999 and 2021. Despite the Scan Line Corrector failure in May 2003 (Markham et al., 2004), we found that feature tracking of Landsat 7 image pairs from 2003 to 2013 was still viable for tracking features between the data gaps. To cover the period before 1999, band 4 of Landsat 5 was used as features over ice and snow are more recognizable in the near-infrared spectrum. Velocity profiles along the centrelines of west and central branches in Fig. 2 were extracted and presented in chronological order so as to consider variabilities among different years and during surge events. We manually removed errors with differences more than 20 m a−1 compared to surrounding areas in each velocity profile. It has previously been shown this method is applicable to velocity analysis of mountain glaciers with varying degrees of debris cover (Lv et al., 2019).
3.5 Uncertainty of velocity extraction
We took the residual velocity value over ice-free regions as the uncertainty of the velocity extraction. Landsat sensors have different spectral features and spatial resolutions leading to different correlation qualities between image pairs. We generated detailed residual value statistics on hillside and valley areas for the three image categories. The mean uncertainties of Landsat 7 and Landsat 8 image correlation results were 1.29 and 0.69 m a−1 respectively, with standard deviations of 5.36 and 1.01 m a−1. Correlation results of Landsat 5 were slightly worse, having a mean uncertainty of 6.72 m a−1 and a standard deviation of 7.12 m a−1. Considering that the annual velocities of the Kyagar Glacier reach more than 50 m a−1 even during the quiescent phase, we consider those uncertainties acceptable for studying Kyagar Glacier motion characteristics.
3.6 Visual interpretation of ice-dammed lake evolution
We investigated the area of the ice-dammed lake using visual interpretation of satellite images. We selected 148 Landsat images and manually digitized them to extract near-monthly lake boundaries (Figs. S1–S11). The HMA DEM obtained on 13 January 2013, when the lake had completely discharged, was taken as the reference DEM. We assumed the lake bed remained stable during the studied period, and the lake surface elevations at different times were then estimated using the extracted lake boundaries and the reference HMA DEM.
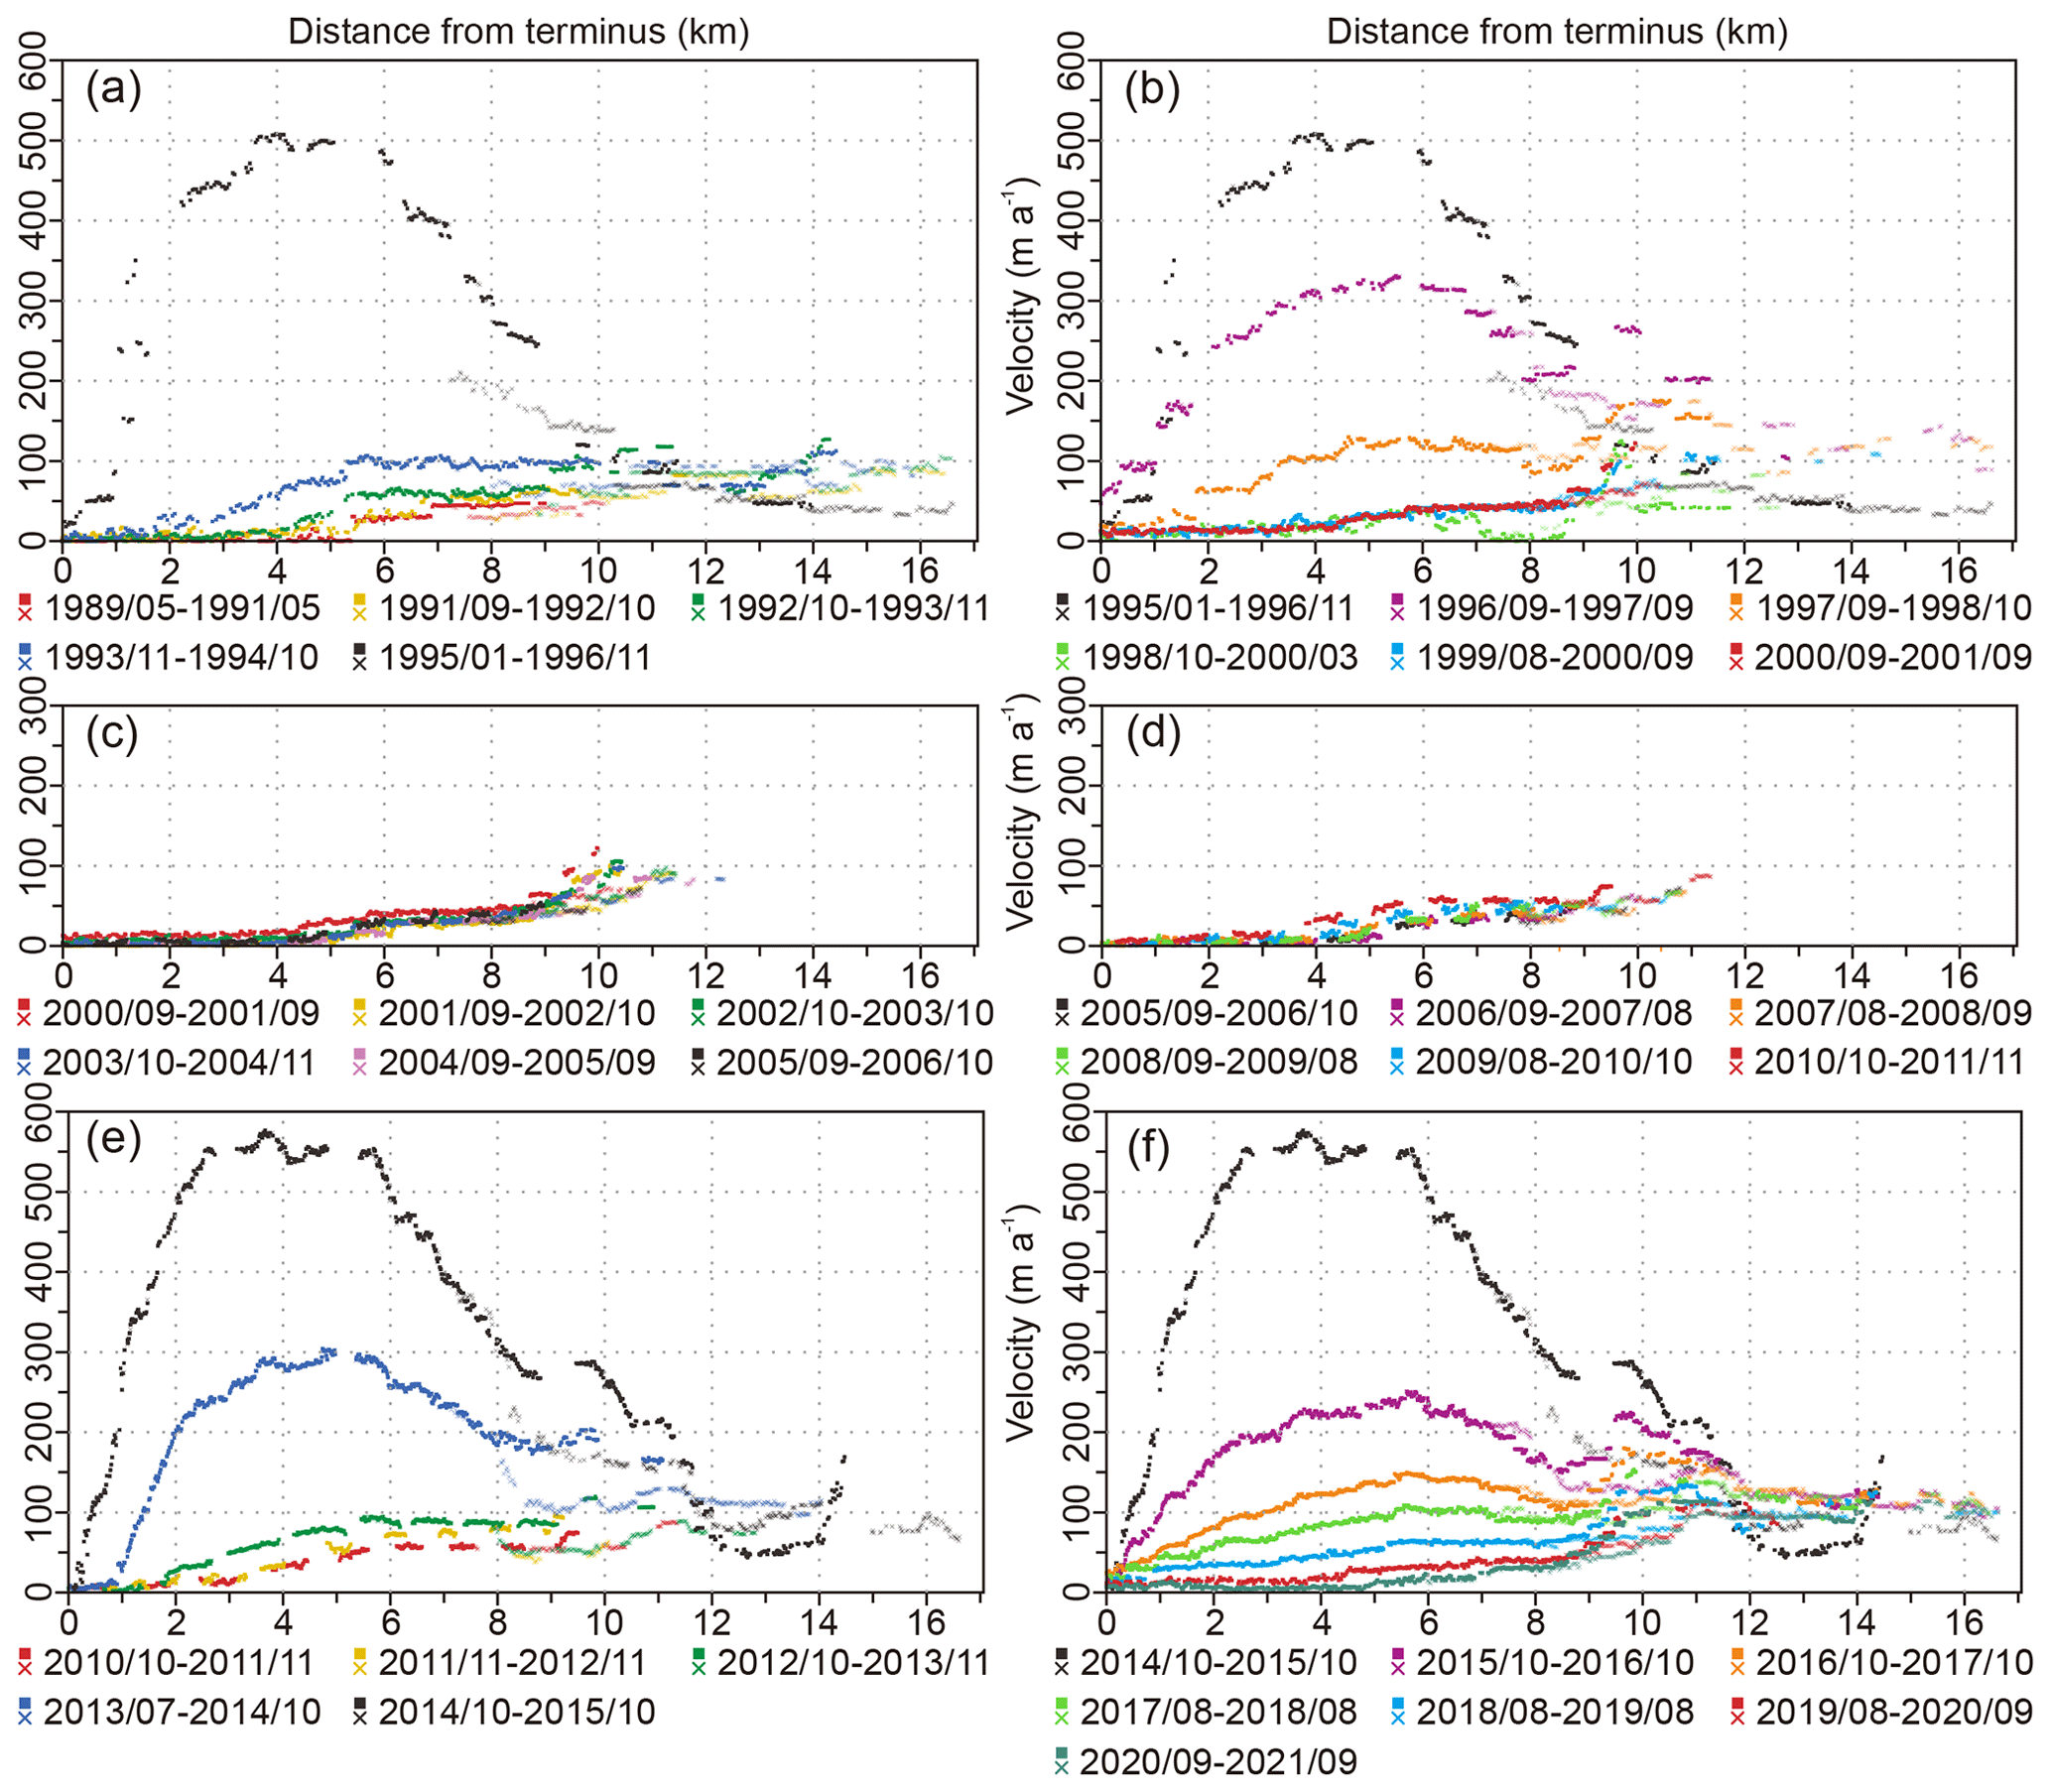
Figure 5Annual velocity profiles along the western and central branches of the Kyagar Glacier from 1989 to 2021. The centreline of the western branch is formed by square dots, and the centreline of the central branch is formed by crosses.
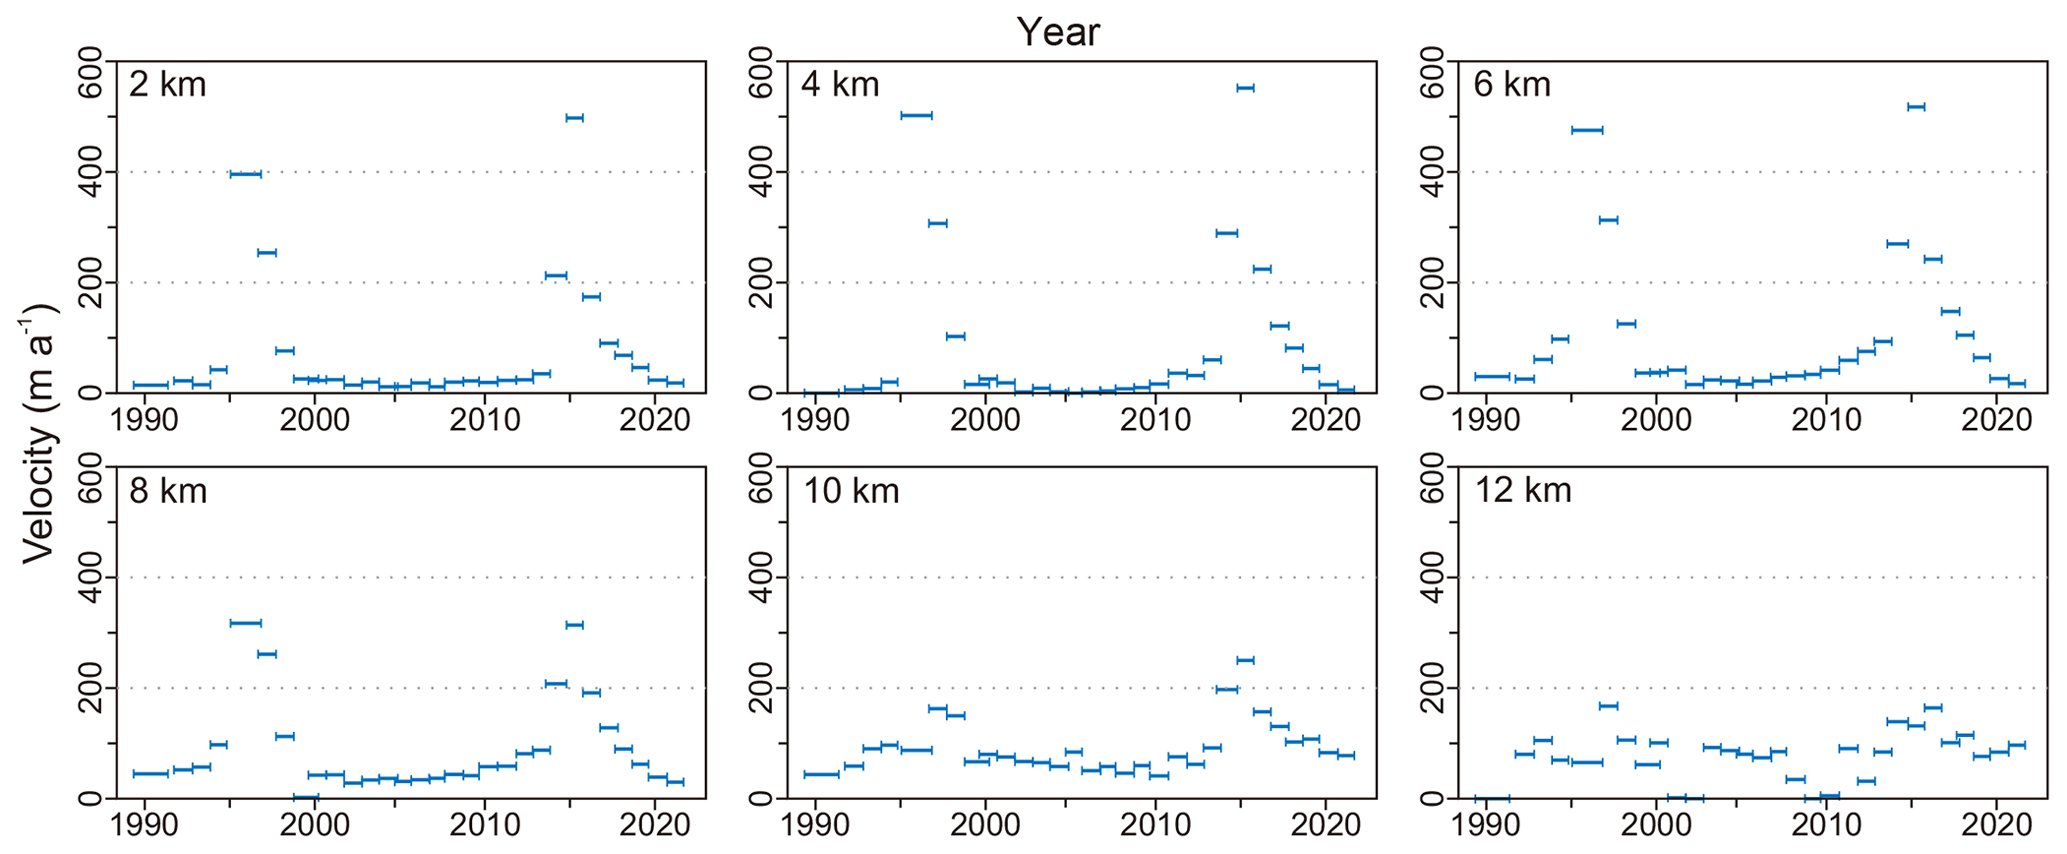
Figure 6Annual velocities of different points along the western branch of the Kyagar Glacier from 1989 to 2021. The points are shown in Fig. 2a and are located at 2, 4, 6, 8, 10, and 12 km from the terminus.
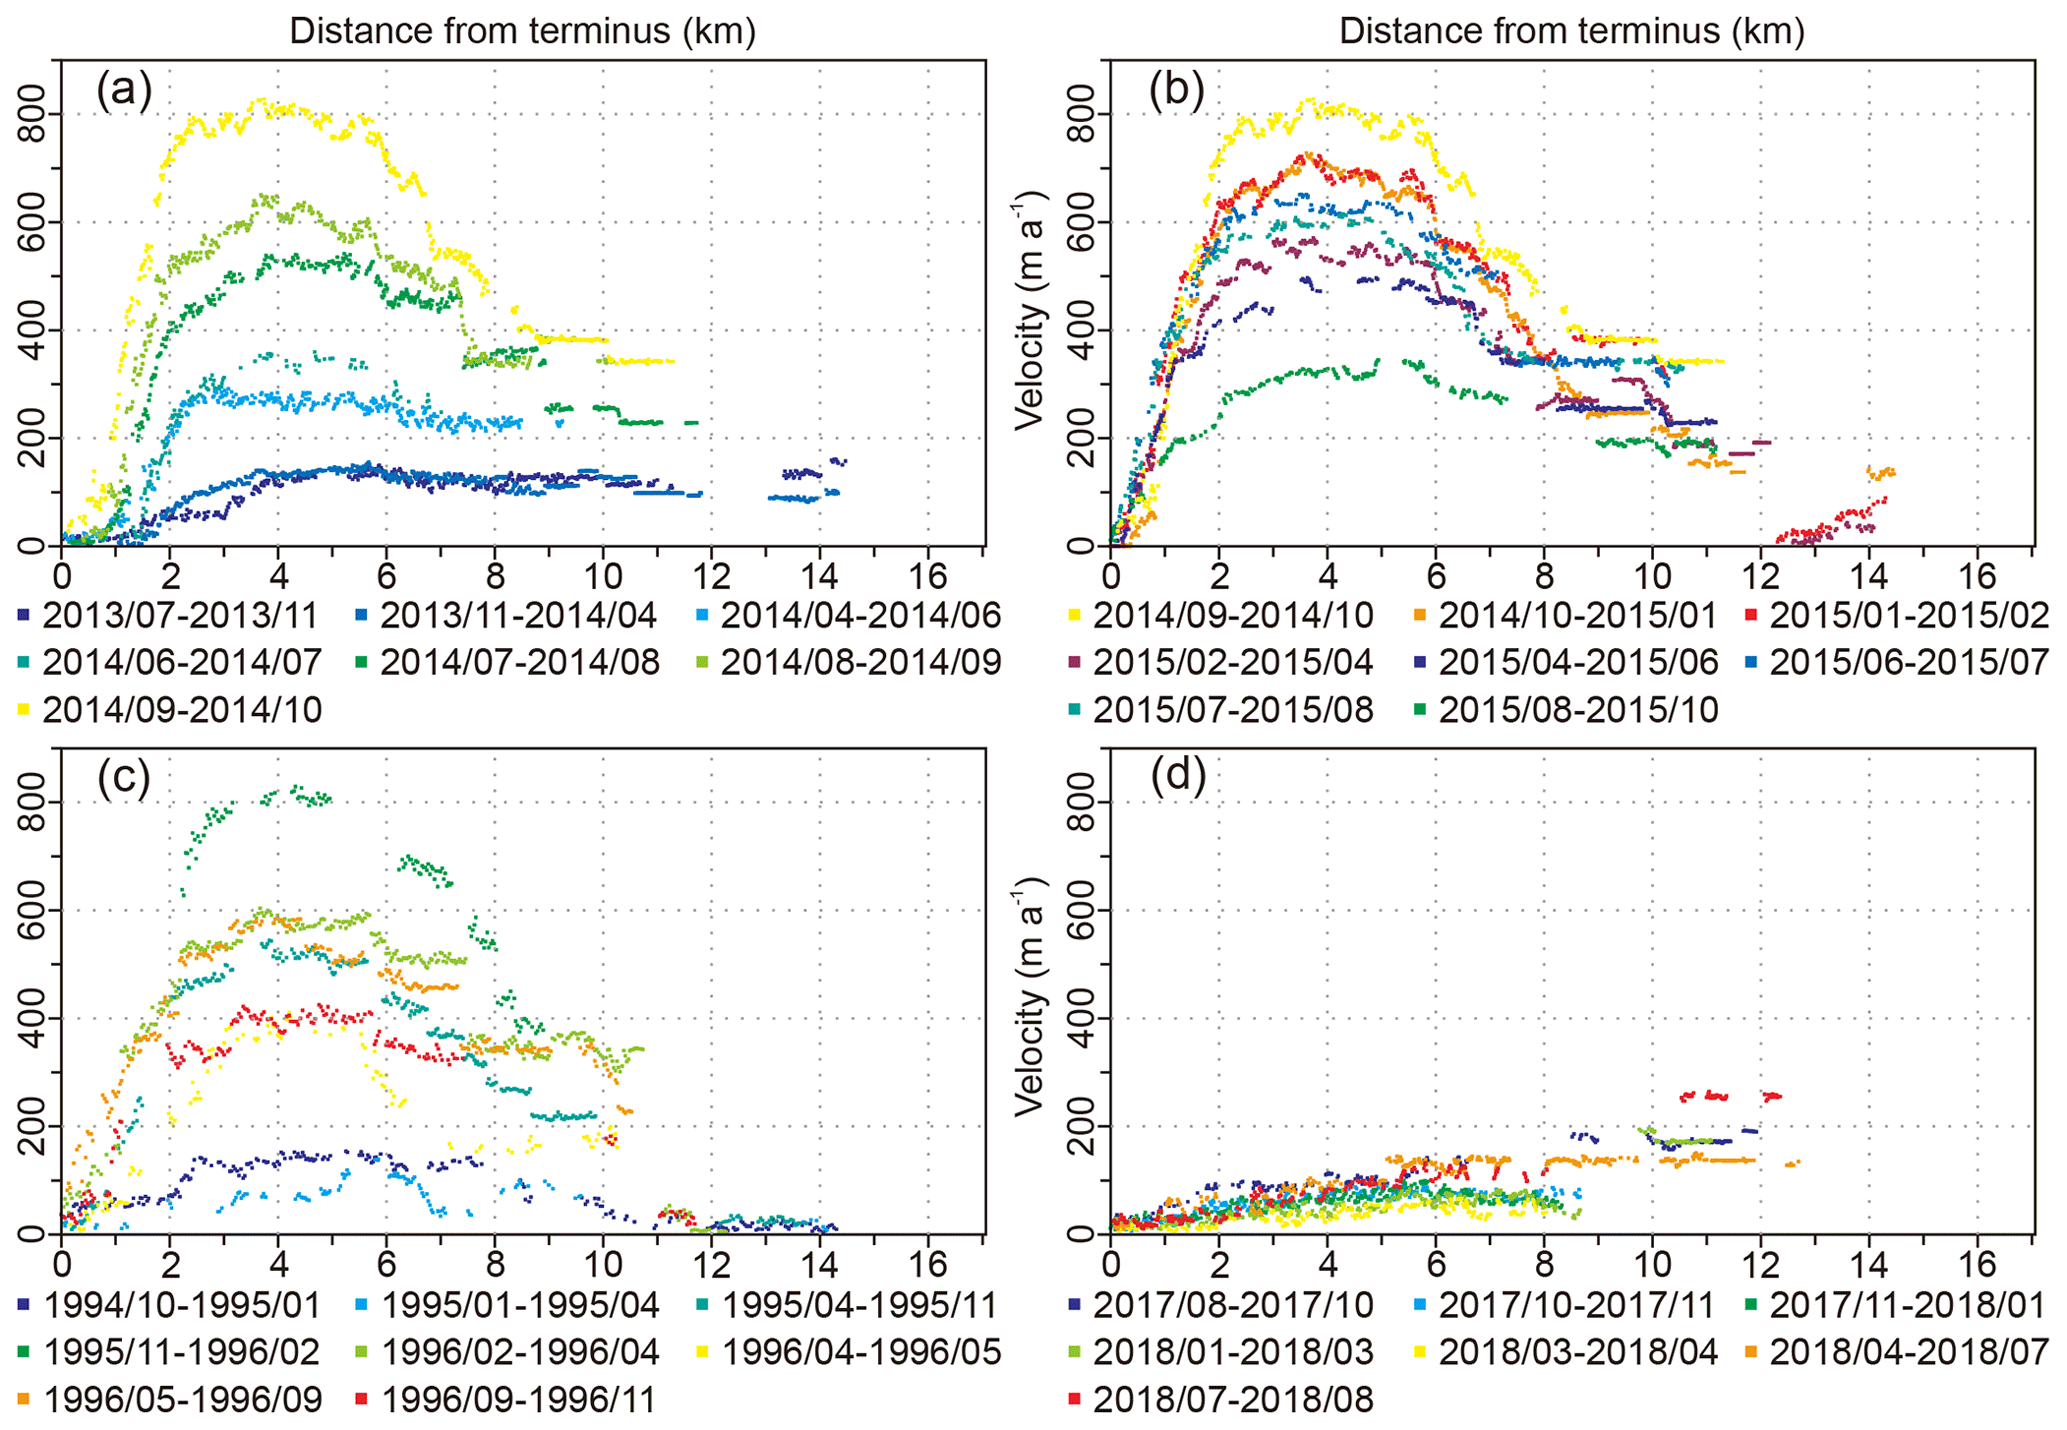
Figure 7Near-monthly velocity profiles along western branch centreline of the Kyagar Glacier during two surging periods.
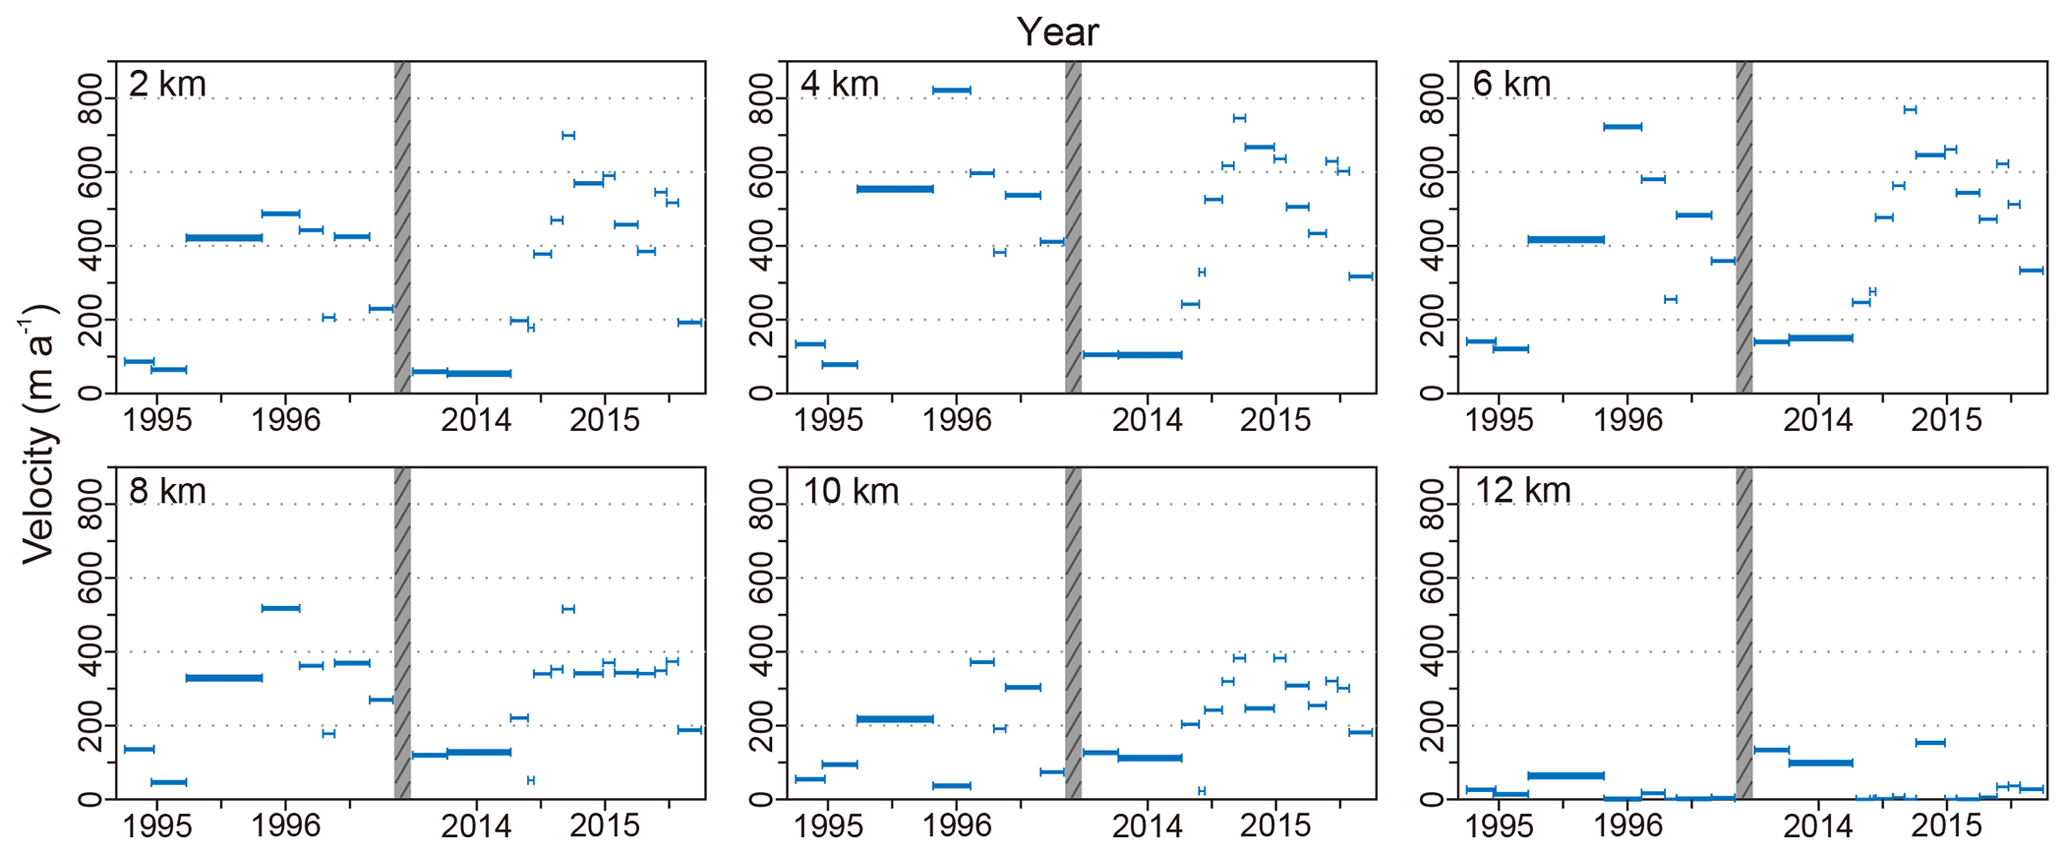
Figure 8Near-monthly velocities of different points along the western branch of the Kyagar Glacier during two surging periods. The points are shown in Fig. 2a and are located at 2, 4, 6, 8, 10, and 12 km from the terminus.
4.1 Surging characteristics
Velocity data indicate that the western branch of the Kyagar Glacier experienced two surges from 1989 to 2021, and this was validated by visual interpretation. The first surge occurred from 1992 to 1998 and the second surge from 2012 to 2019, confirming the previously inferred return period of ∼20 years (Figs. 5 and 6). The first surge peaked in November 1995 following 3 years of acceleration and declined thereafter to a minimum level over the next 3 years. The second surge peaked in September 2014 after a 2-year acceleration and declined to a minimum over the next 5 years (Figs. 7 and 8).
The two surges both reached a peak monthly velocity of ∼800 m a−1 at a distance of 2–6 km from the terminus (Fig. 7a and c). During the quiescent phase (i.e. before 1992 and from 2000 to 2012), the western branch had an average annual velocity of 40–80 m a−1 (Fig. 5c and d). Velocities of the two branches differed above the confluence (after 7 km), and the central part of the tongue also experienced coincident acceleration and deceleration, albeit at a slightly slower rate (Fig. 5a, b, e, f). This implies the surge activity of the western branch did not block the motion of the central branch, rather it promoted ice mass transportation of the central branch to some extent.
Monthly velocity profiles provide more detail of the dynamic evolution of the surge during the active phase. Figure 7d suggests that seasonal variations in flow are still an important control on velocity rates, peaking during April to October. The two surges both exhibit abrupt acceleration after spring (April–June 2014 in Fig. 7a and April–November 1995 in Figs. 7c and 8). They reached a maximum by the end of the same year and started to decline at the beginning of the next year (October 2014–January 2015 in Fig. 7b and February–April 1996 in Figs. 7c and 8). However, the deceleration was temporally variable; abnormal increases in both June–July 2015 and May–September 1996 suggest this was not a single event of summer re-acceleration after peak velocity in winter (Fig. 8).
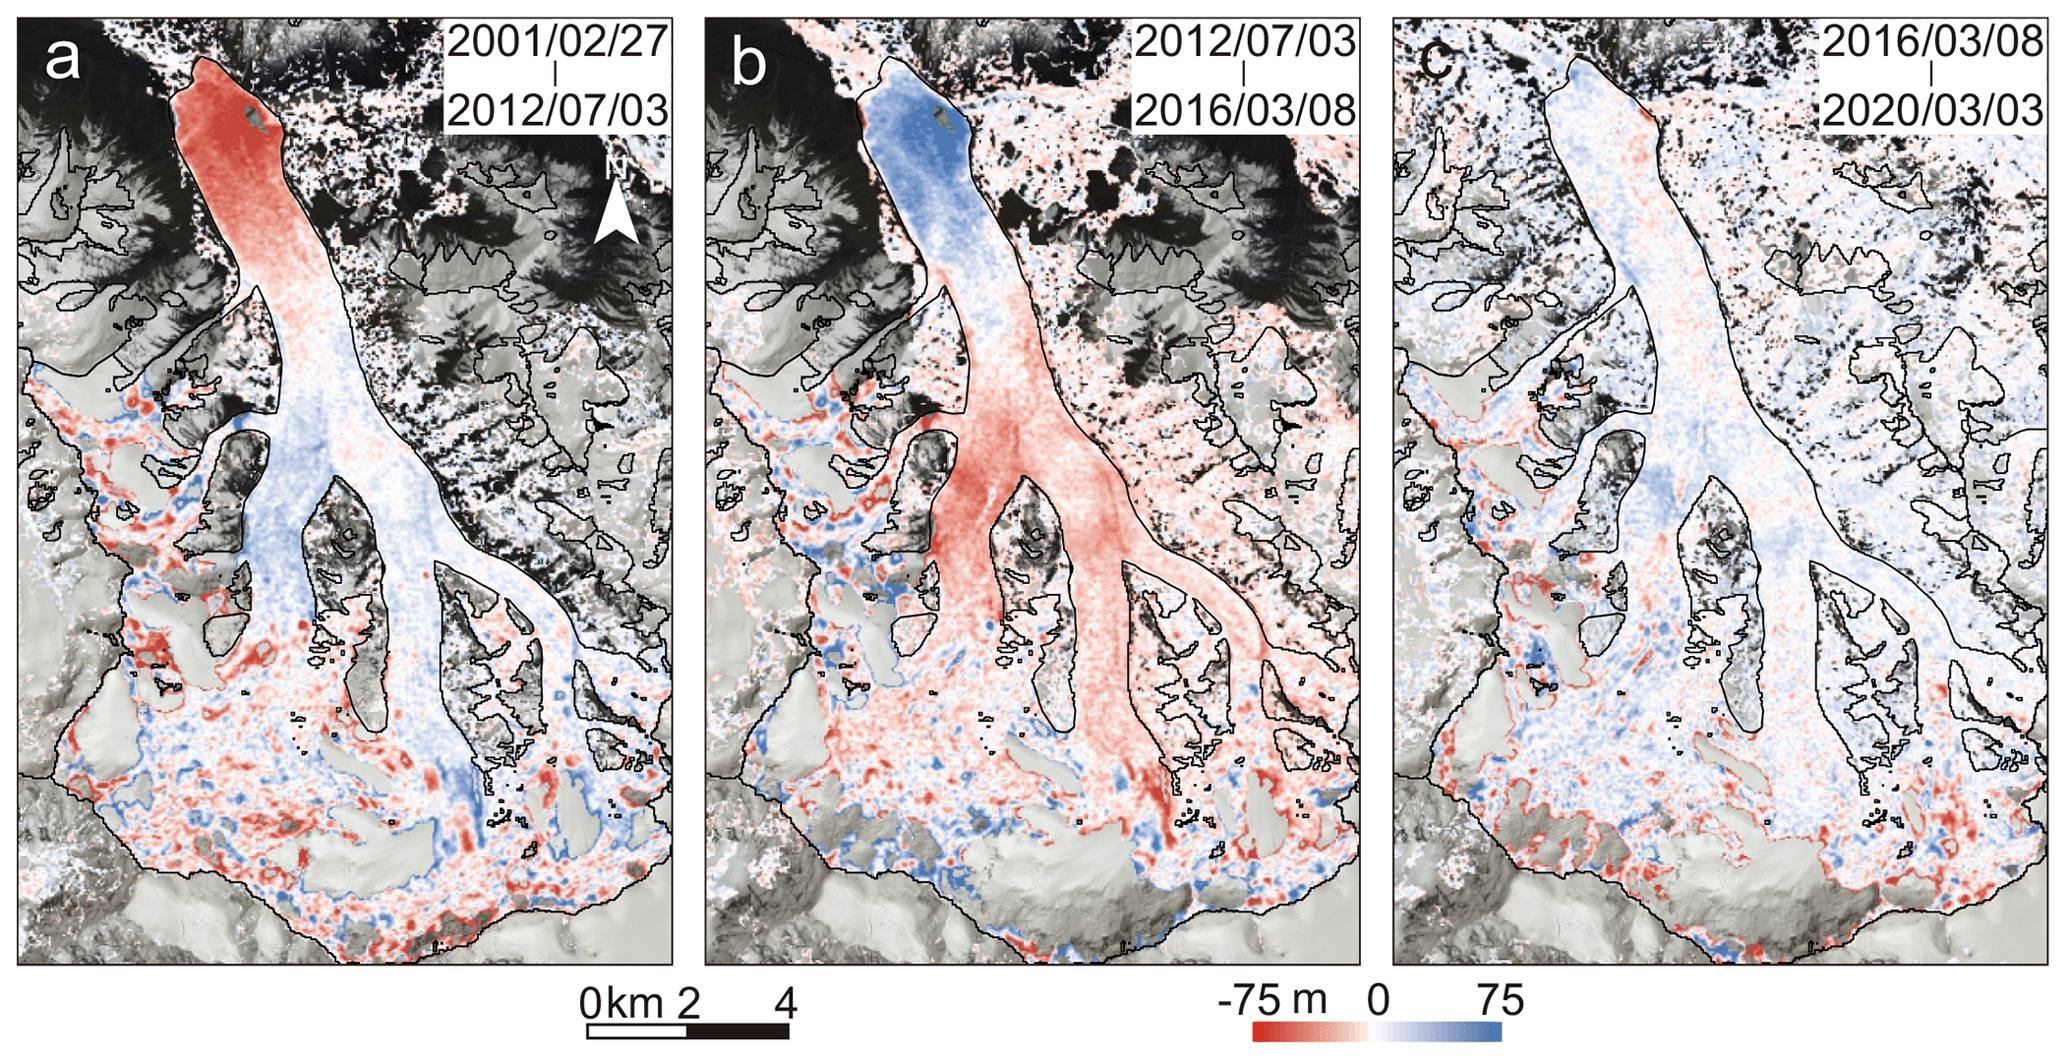
Figure 9Surface elevation changes of the Kyagar Glacier during three periods (a: 2001–2012, b: 2012–2016, c: 2016–2020).
Kyagar Glacier entered the quiescent phase after 1998. The large volume of ice in the receiving zone rapidly ablated and the reservoir began to recharge, preparing for the next surge (Fig. 9a). During the period 2012 to 2016, the second surge event occurred. The surface elevation of the central branch lowered by 20–30 m in the accumulation zone, evidencing that the surge impact was wider than just on the western branch (Fig. 9b). This is consistent with the velocity profiles, which show that the central branch also experienced surge-like acceleration and deceleration. Although the active phase ended in 2020, part of the reservoir zone had already started to recharge during the latter part of the surge (Fig. 9c).
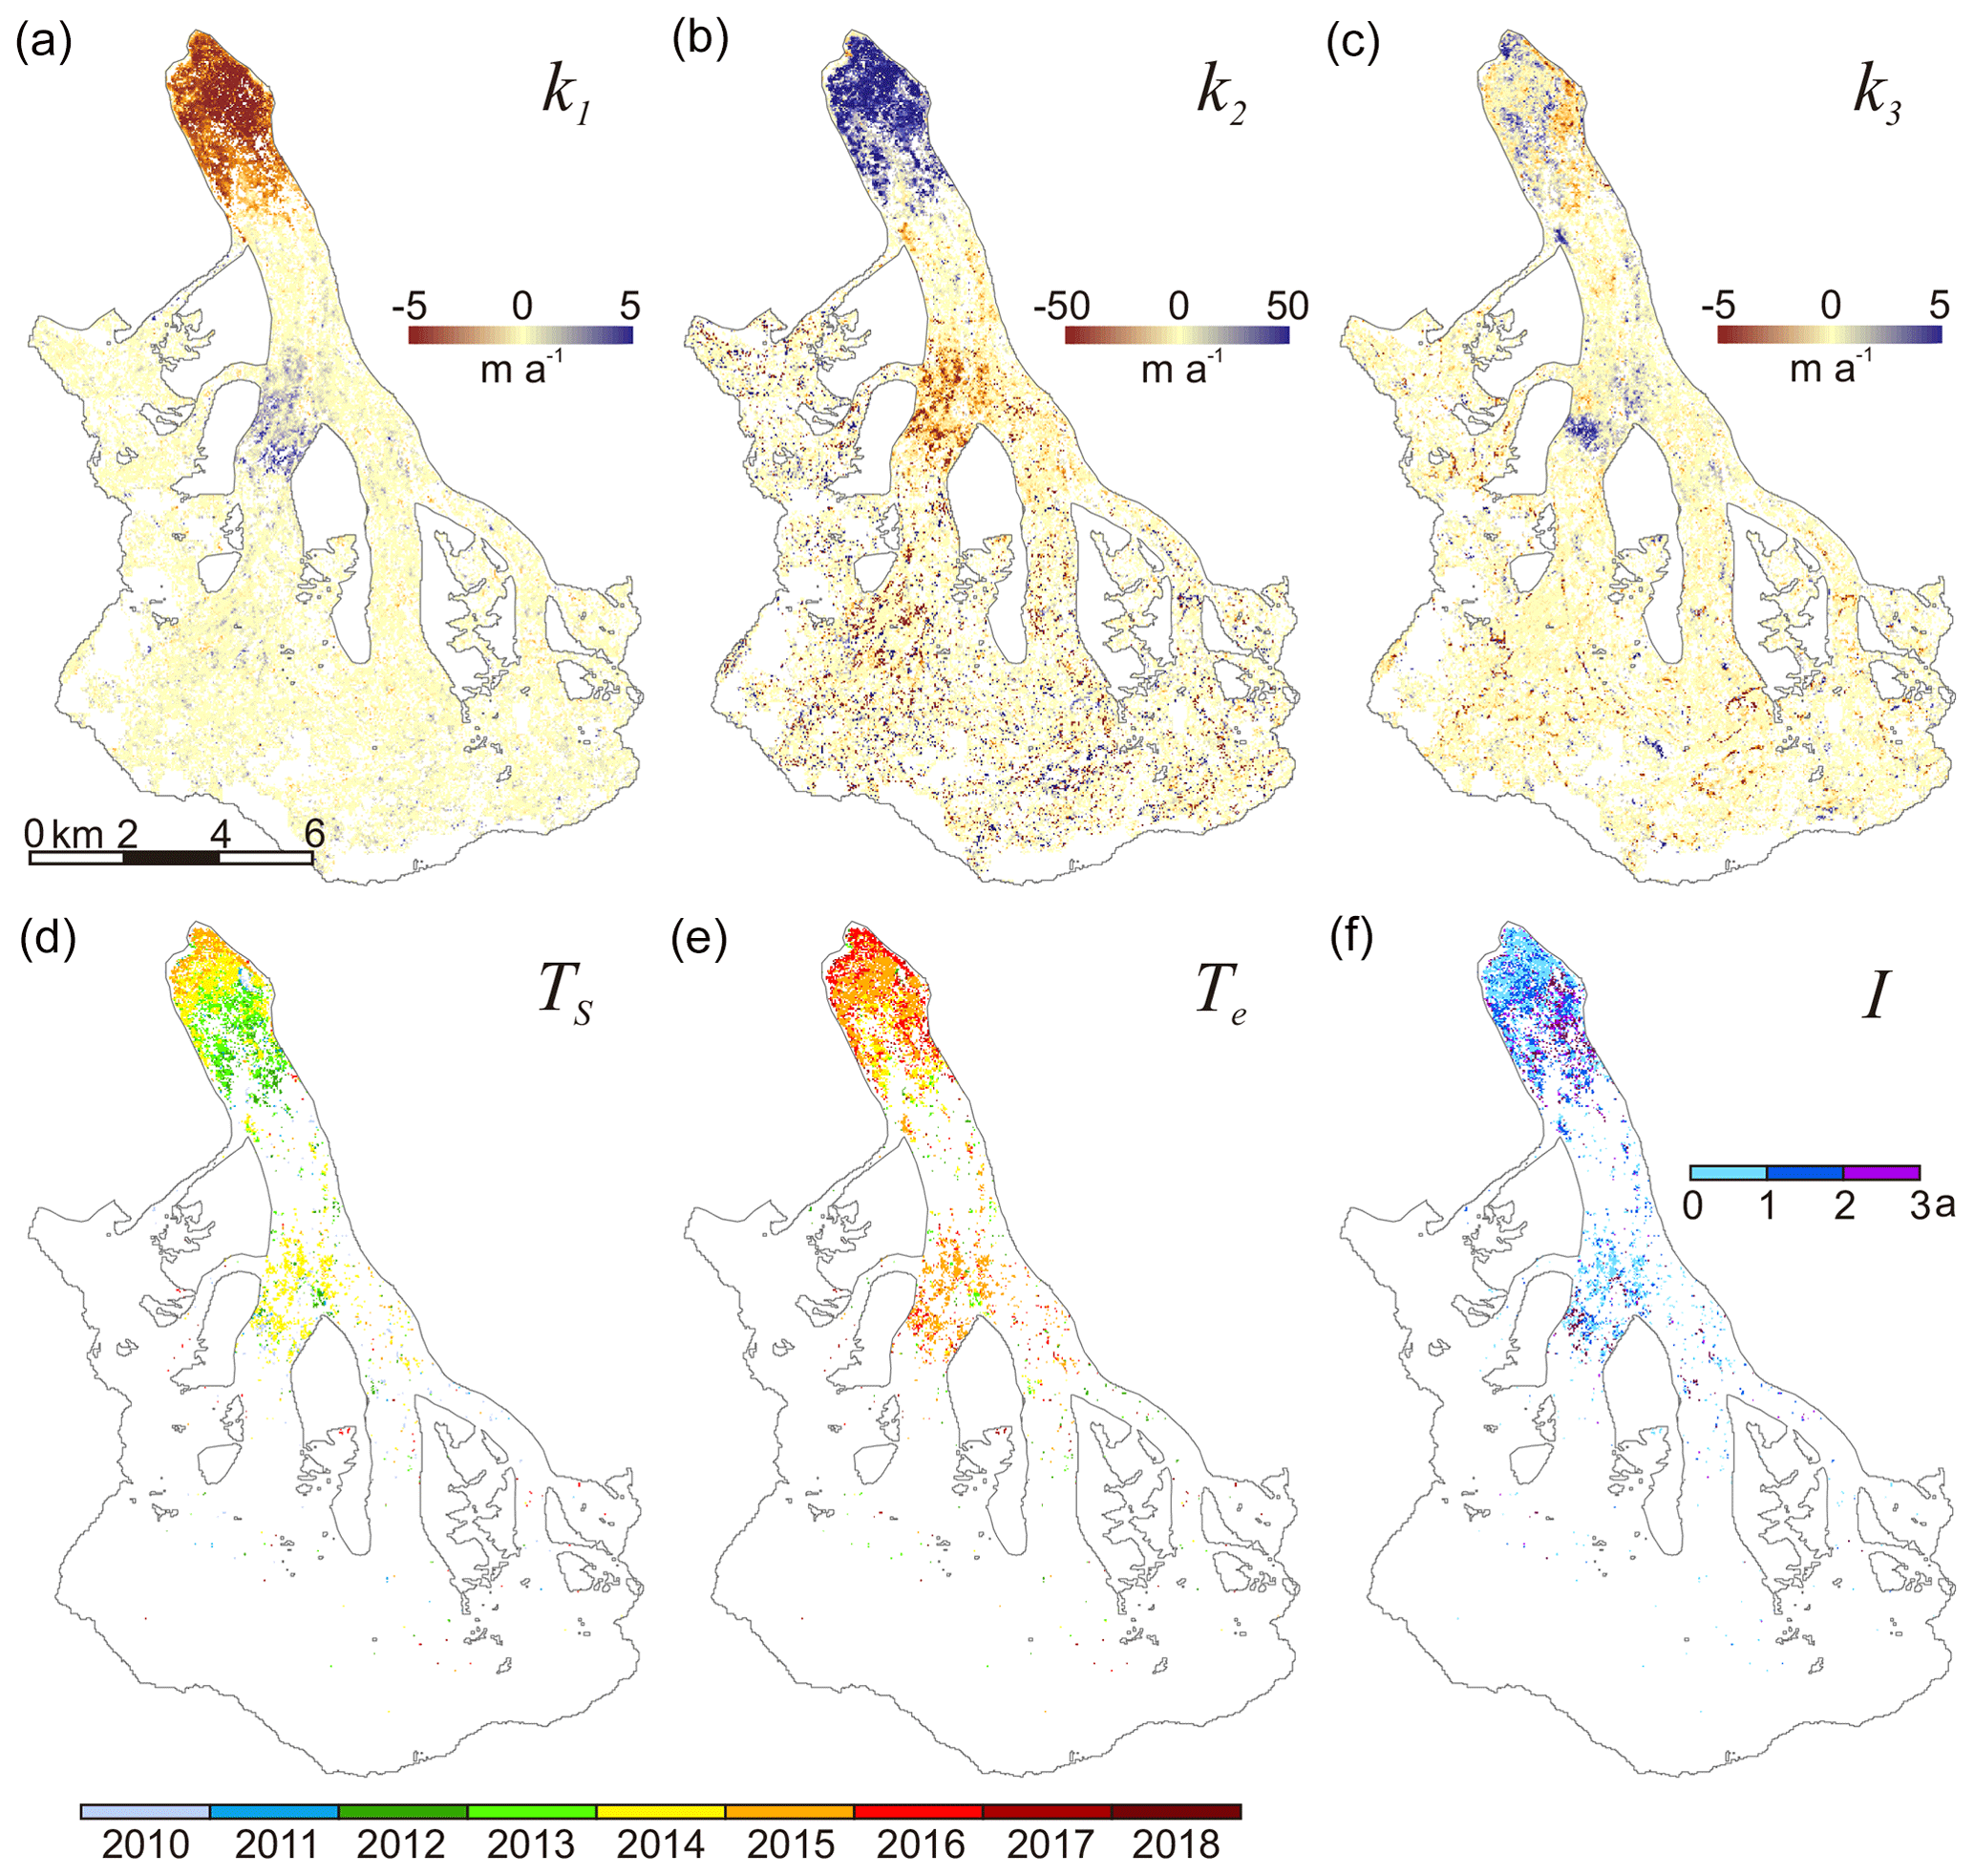
Figure 10Parameter maps quantifying elevation changes of the Kyagar Glacier. Elevation change rates before, during, and after the surge of each pixel are labelled as k1, k2, and k3. Ts and Te represent the dates of surge impact initiated and terminated on each pixel. I represents the duration of surge impact.
The multi-temporal DEM analysis (Sect. 3.3) revealed that elevation change rates in the quiescent phase (k1) reached 3 to 5 m a−1 in the reservoir and −7 to −9 m a−1 in the receiving zone (Fig. 10a). During the surge, change rates (k2) had peak values ranging from −45 to −55 m a−1 in the reservoir and 55 to 65 m a−1 in the receiving zone (Fig. 10b). In the following few years after the surge impact, change rates (k3) were 3 to 6 m a−1 in the reservoir and −1 to −2 m a−1 in the receiving zone (Fig. 10c). Elevation change rates right after the surge event (Fig. 10c) were lower than those during the entire quiescent phase (Fig. 10a). It is notable that only the lower region (0–4 km from the terminus) and another area (7–10 km from the terminus) exhibited abnormal elevation changes, while changes over the glacier surface 4–7 km from the terminus were small during the surge. This unclear change signal could result from the limited quality of the DEMs at this time.
Results of k1, k2, and k3 suggest many pixels over Kyagar Glacier did not experience abrupt elevation changes. Therefore, we only show here the surge initiation (Ts) and termination (Te) of the pixels with probabilities greater than 0.5 in the BEAST process. The earliest Ts was in 2012, detected over part of the receiving zone (Fig. 10d). The latest Te was in 2017, at the edge of the terminus (Fig. 10e).
4.2 Evolution of the ice-dammed lake
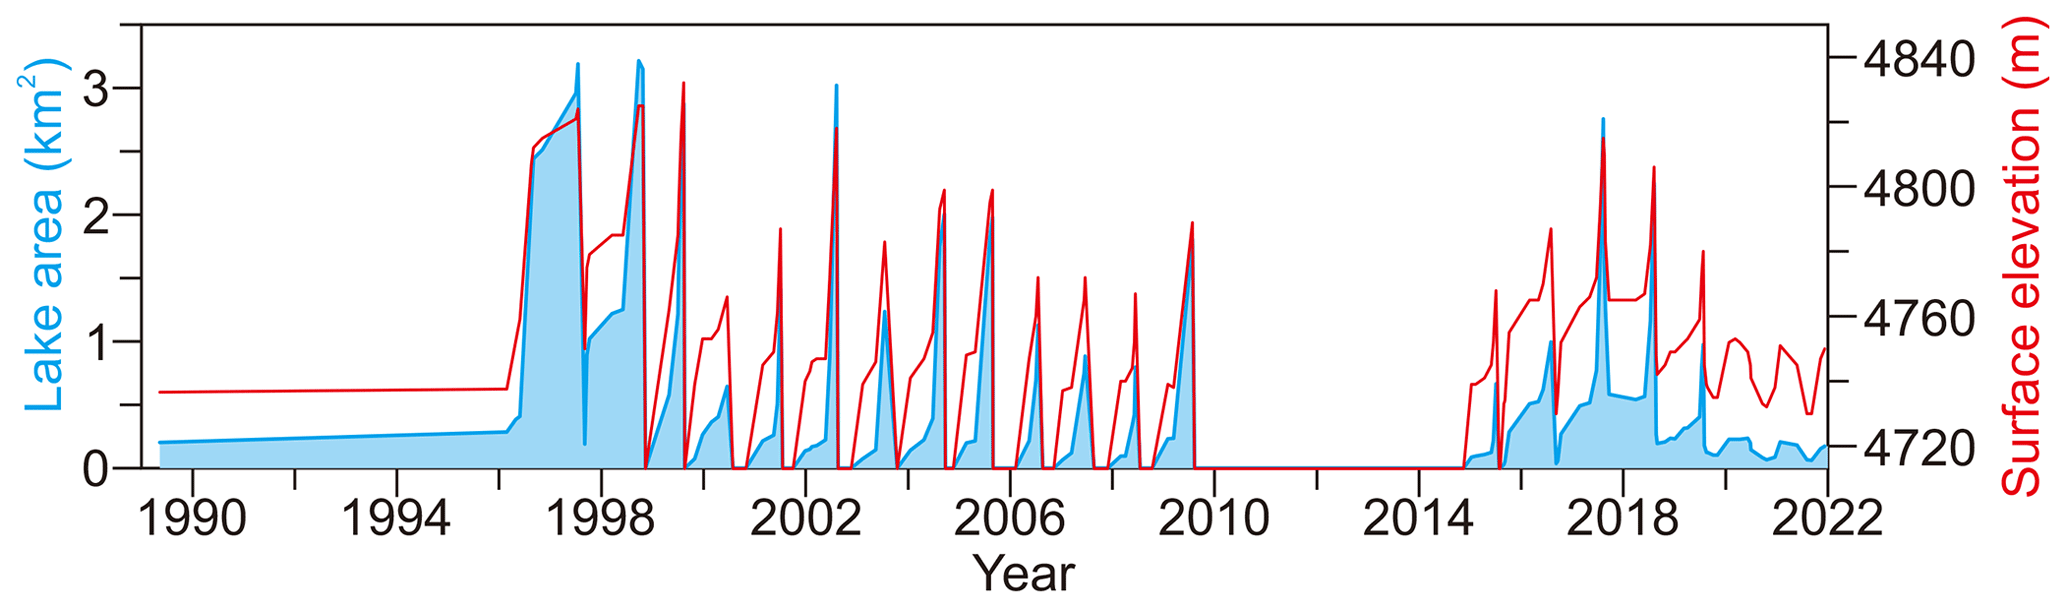
The lake exhibited an irregular change from 1989 to 2021 (Fig. 11). In the early 1990s, the lake remained stable and grew slowly. From 1996 to 2009, the lake experienced yearly oscillations both in area and surface elevation. Before 2000, the annual maximum area of the lake exceeded 2 km2 and reached a maximum of 3.21 km2 in September 1998. After reaching its maximum area in each year, the lake discharged almost entirely within about 2 d, likely resulting in annual GLOFs to the downstream valley from 1996 to 2009. No lake existed between 2009 and 2015, suggesting an open channel developed beneath the glacier. From 2015 to 2021, the lake entered another period of yearly oscillations, reaching a maximum area of 2.76 km2 in August 2017. In contrast to the earlier period, the lake did not fully disappear during each drainage event. The timing of each reduction in lake area suggests historic lake outbursts took place every summer since 1996 (July to September).
5.1 Surging process of the Kyagar Glacier
The semi-automated parameters extracted from successive DEMs have the advantage of being objectively derived and appear to show a clearer pattern than the elevation change descriptions that former studies have relied on. Combining these values with the velocity profiles, we could robustly rebuild the surging process during the last decade.
At the beginning of the surge, velocities increased uniformly and slowly along the glacier tongue starting in October 2012 (Figs. 5e and 6). It was not until April 2014 that an obvious surge front formed (Figs. 7a and 8), a pattern which was also recorded by Round et al. (2017). However, the surge front did not impact the terminus, most likely due to frictional stress at the bed and the disconnected englacial hydrological system (Björnsson, 1998). Ts values in 2012 and 2013 were detected over the area 3–4 km from the terminus (Fig. 10d), indicating a notable elevation increase, which we speculate resulted from intense compression of ice that could not be transported into the middle part of the receiving zone, while elevations over the reservoir zone had no obvious change during this period (Fig. 12).
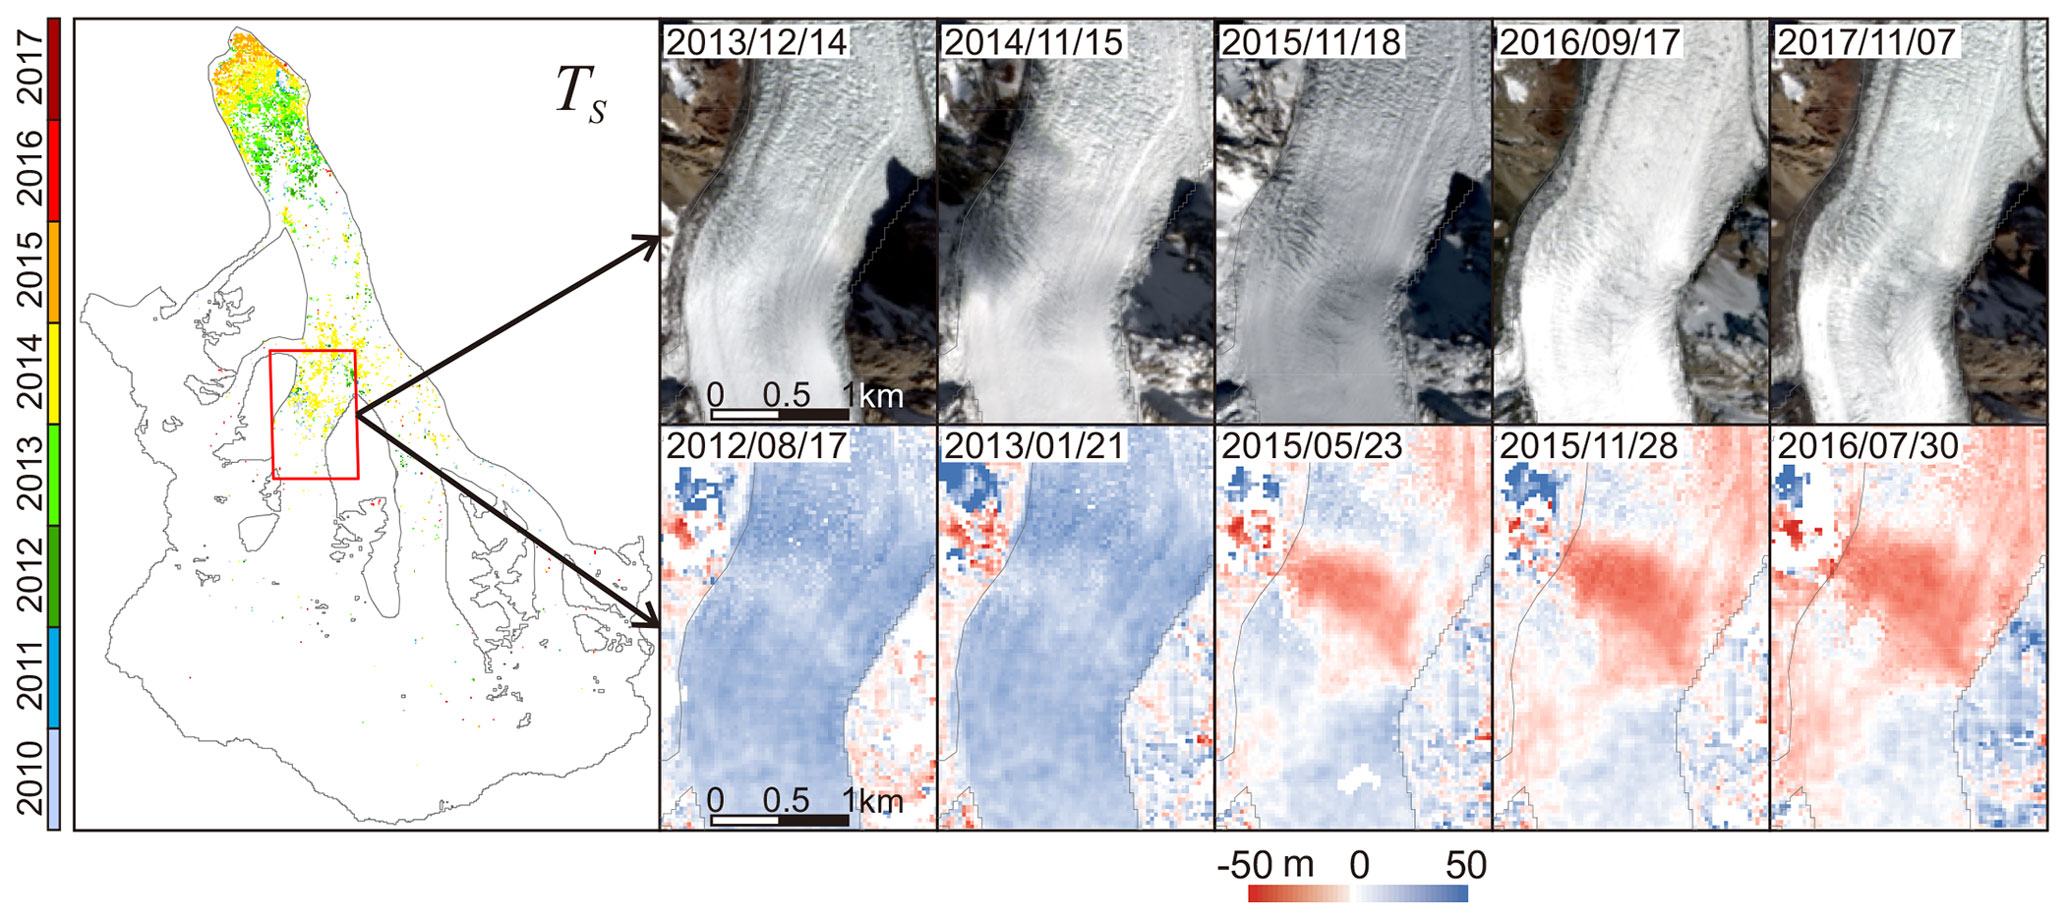
Figure 12Details of Landsat 8 OLI images and elevation changes over reservoir zone. Elevation changes between HMA DEM and SRTM DEM are shown.
The surge front was clearly evident in the velocity profiles after April 2014 (Fig. 7a). The previous surge in the 1990s also underwent abrupt acceleration after spring (April 1995; Figs. 7c and 8). We propose that this spring speed-up could have two causes. The first relates to a reduction in till strength brought about by an increase in water at the bed during spring, as discussed in previous studies (Cuffey and Paterson, 2010; Round et al., 2017). The second relates to the extrusion stress of the accumulated ice in the receiving zone during 2012 and 2013, which likely reached the deformation threshold. The abrupt speed-up along the entire glacier tongue caused the reservoir surface started to rapidly decline in 2014, transporting a massive volume of ice to the receiving zone (Fig. 12).
Velocities reached a maximum of ∼800 m a−1 in October 2014 and declined again in the coming winter and spring (Figs. 7b and 8). However, velocities increased again in June–August of 2015, which is coincident with the summer speed-up that is evident in the quiescent phase. Re-acceleration after the peak velocity was also found in May–September of 1996 during the previous surge (Figs. 7c and 8). We propose that seasonal variations could still play a role in controlling glacial motion during surges. After the summer of 2015, velocities decreased rapidly to ∼200 m a−1 within 1 year and then decreased slowly from 2016 to 2019 (Fig. 5f). In the meantime, a mass wave was generated in the receiving zone propagating towards the terminus (Fig. 10d and e).
We postulate that the surge initiation most likely coincided with the maximum volume of ice that could be stored in the reservoir zone being exceeded, as suggested by Barrand and Murray (2006). The reservoir zone was at capacity at the end of the quiescent phase and transported more ice to downstream than before, causing a slow and uniform speed-up from the reservoir to the receiving zone. Hydrologic processes within and beneath the glacier became important at the same time the surge front was formed. Once the surge front had passed through the system and the reservoir zone was largely drained, the glacier resumed its quiescent state, still maintaining a basal hydrology but with a much reduced effect.
5.2 Methodological consideration of DEM difference post-processing
The identification of the surge period (2012–2017) using multi-temporal DEM processing is shorter than that when using velocity profiles alone (2012–2019). This can most likely be attributed to the nature of the method. Specifically, we identified the lattermost profile (August 2019–September 2020 in Fig. 5f) with a decreasing velocity as the surge termination, even though the reduction may have been small (e.g. <10 m a−1). The consequent effect of such velocity changes on the surface elevation would go undetected given the vertical resolution of our data, meaning this period could have already been defined as the start of quiescent phase in PWLF process. The duration of the surge impact (I) on individual pixels varied from 1 to 3 years (Fig. 10f), meaning that the surge affected most parts of the glacier for discrete periods, rather than for the whole active phase.
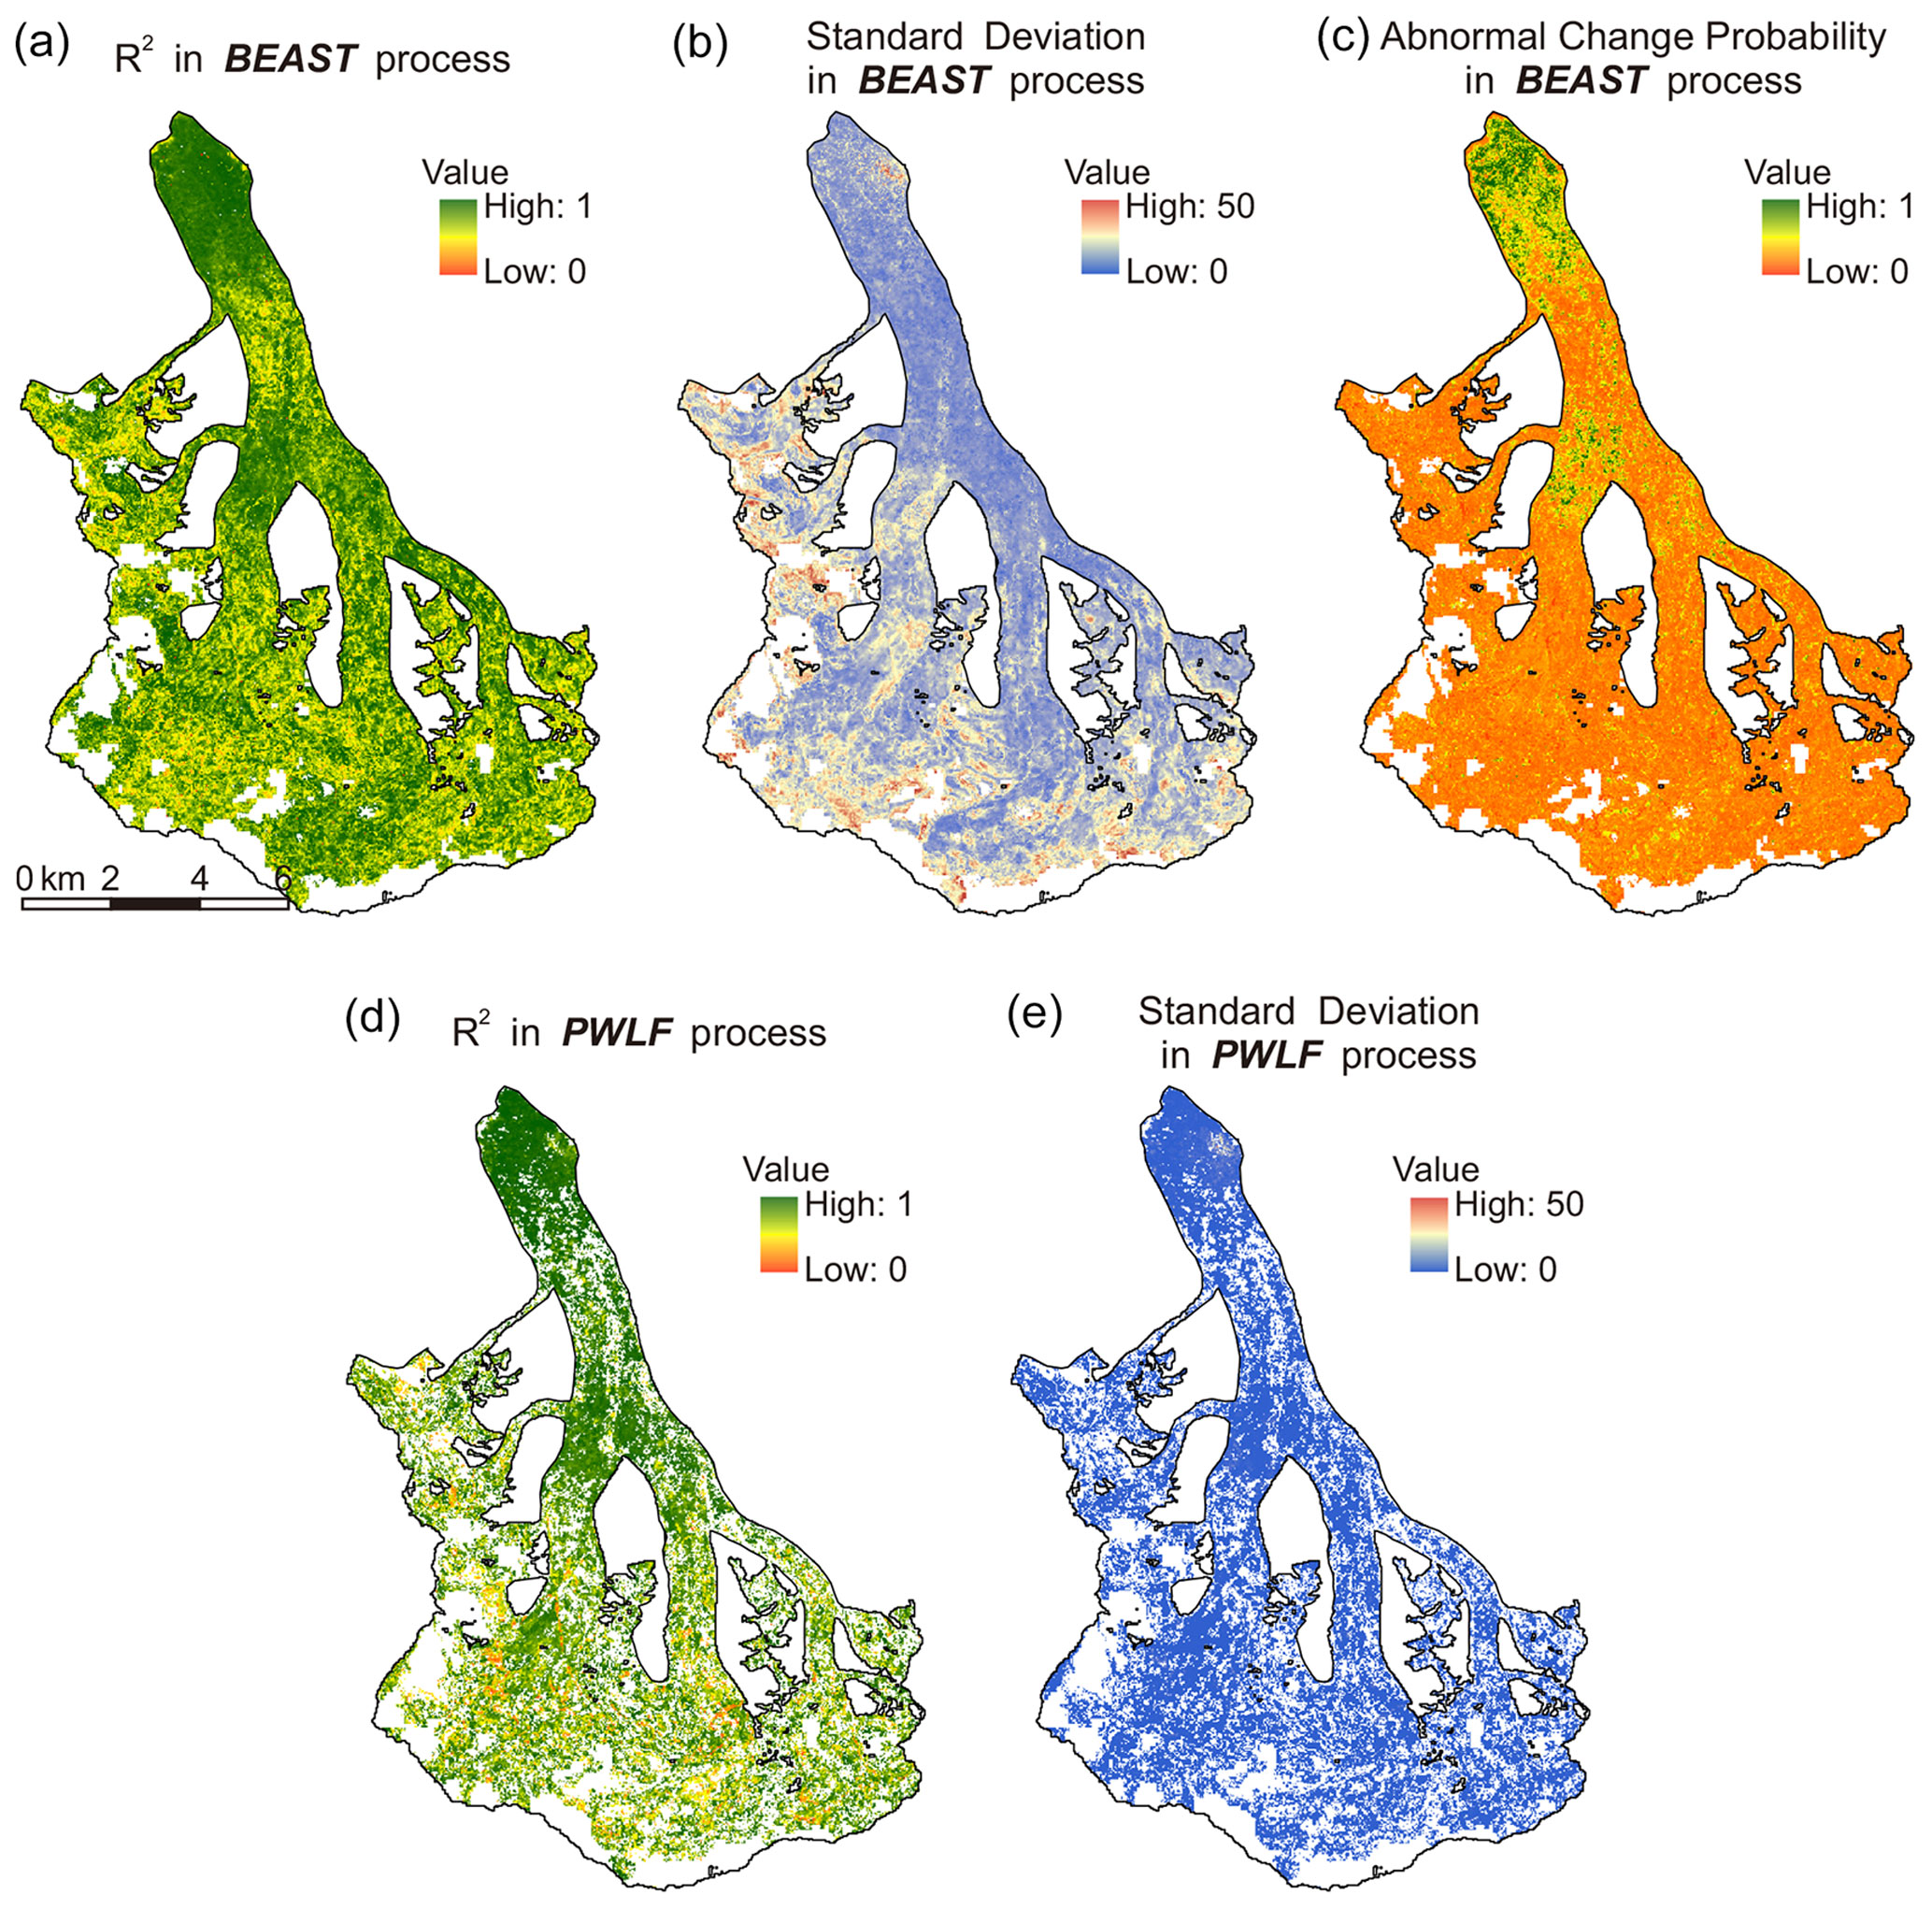
Figure 13R2 (a), standard deviation (b), and abnormal change probability (c) in the BEAST process; R2 (d) and standard deviation (e) in the PWLF process.
Uncertainties of elevation change point detection and elevation change rate calculation raised from the processing of the BEAST model and PWLF model are shown in Fig. 13. For the BEAST model, there exists three parameters to evaluate the uncertainties of the model processing, including the occurrence probability of abnormal change over time, regression evaluation parameters such as R2 and RMSE, and the estimated variance of the model error (Zhao et al., 2019). For the PWLF model, various statistics can be calculated if we assume that the breakpoint locations and model form are correct. Similar to the BEAST model, the PWLF model provides the R2 and standard deviation based on prediction variance to evaluate the uncertainty due to the lack of data in the time series (Jekel and Venter, 2019).
In both models, the output result will be not a number or null if the model fitting fails or if the identified changepoints are insufficient. Possible failure reasons include poor data quality, too few data points in the time series, or too little variation in the time series. A lower number of null values and highly concentrated valid pixel distributions over the glacier region indicate a higher reliability of the model analysis results. As shown in Fig. 13, valid pixels are filled in the flatter, lower part of the glacier, while many null pixels exist at high elevation and over steep slopes. This means the model has higher reliability over the glacier tongue.
The BEAST and PWLF models are based on general linear regression, so we evaluated the performance of the time series fitting and change point detection by using regression parameters including R2 and standard deviation. There are a large number of pixels with high standard deviation and low R2 in the higher part of glacier (Fig. 13a, b, d, e). R2 in PWLF is higher than that in BEAST, while the standard deviation in PWLF is less than that in BEAST. On the other hand, as the BEAST model is firstly conducted to process the time series DEMs, the results of BEAST could contain more information about raw data quality and spatial–temporal distribution. However, the coefficient of determination does not necessarily reflect the accuracy of detecting true trend change points (TCPs) in a time series. As introduced in Sect. 3.3, the BEAST algorithm evaluated not only the most likely timings and numbers of TCPs at any given time for each pixel in the glacier but also the probability of each TCP being true (Zhao et al., 2019). Compared to the linear regression processing, the detection of TCPs is much stricter. As a result, the pixels with higher R2 and lower standard deviation does not necessarily mean high probability of the TCP being true. In Kyagar Glacier, the pixels with high abnormal change probability (≥0.5) were mainly detected in the reservoir and receiving regions.
Although the uncertainty of this approach requires further evaluation, it can quantify surging process in unprecedented detail. Using this approach, we can investigate elevation change rates during each period of a surge-type glacier, the time of surge initiation and termination, and the surge duration. Compared to manually identifying surges from abrupt changes in DEMs, this approach is much more efficient and objective, only requiring a limited computation load. It would be valuable to attempt to extend the approach to other surge-type glaciers throughout HMA and even globally, and it would also be possible to identify surge events in a semi-automatic manner based on elevation change data. The only limiting factor in applying this approach would be that a large amount of DEMs with good spatial and temporal coverage is needed.
5.3 Relationship between ice-dammed lakes and surges
Previous studies revealed that ice-dammed lake outbursts are related with dynamics of the Kyagar Glacier, especially surging events (Haemmig et al., 2014; Zhang et al., 2020). By providing detailed lake evolution data we can offer more comprehensive insights into the relationship between surges and lake outburst events.
We identified two oscillating periods of lake area and surface elevation, which occurred from 1996 to 2009 and 2015 to 2021. Round et al. (2017) also suggested historic lake outbursts could indicate surge activities of the Kyagar Glacier. The lake burst every year during these two periods, although not every GLOF was detected at the gauging station hundreds of kilometres downstream (Chen et al., 2010). This suggests the surge was not the direct reason for triggering the GLOFs. However, we did find a relationship between them, which is that the ice-dammed lakes reached maximum area 3 years after the surge peaked in velocity. For instance, the velocity peaked in 1995 with a maximum lake area of 3.21 km2 in 1998, and in the next surge, velocity peaked in 2014 with a maximum lake area of 2.76 km2 in 2017. We propose that it would take 3 years for the terminus to build a sufficiently large barrier for the lake to develop to its greatest extent after the surge peak.
As a polythermal glacier, it is likely that the nature and efficiency of the hydrological system of the glacier varies greatly on a seasonal basis. Lakes from 1996 to 2009 nearly disappeared every time after outbursts. We propose that the lake forged an englacial channel through the dam every summer. This interpretation is supported by an evident residual channel in the downstream valley flowing from the terminus area without any obvious changes on the glacier surface (Figs. S1–S6).
Most lake areas from 2015 to 2021 were smaller than during the previous cycle, suggesting the danger associated with the outburst events could be diminishing. During this period, the lake drainage events did not entirely empty the basin (Figs. 11, S7–S11). This was probably because the connected channel was part way up the ice dam such that the lower part of the lake could not drain. It is therefore likely that it was the alteration of the drainage system beneath (or within) the glacial terminus that controlled the occurrence of each individual GLOF event.
Using SRTM, ASTER, and HMA DEMs, as well as Landsat time series images, we detected and described the vertical and horizontal glacial motion of the Kyagar Glacier and assessed its relationship with GLOFs. By proposing a new quantifying approach based on patterns shown in successive DEMs and combining velocity profiles during last 3 decades, we constructed the surging process of the Kyagar Glacier in unprecedented detail. As the first aim of this study, (1) we propose that this new quantifying approach of surge activities based on the BEAST and PWLF processes could be used in other surge-type glaciers in the HMA or in specific regions of the Arctic ring. We also find that (2) abnormal uplift over the lower glacier tongue, combined with a uniform increase in velocities, is the clearest indicator of surge initiation. (3) Seasonal variations in flow could still play a role in controlling glacial motion during surges. (4) Surge activities have a strong relationship with the ice-dammed lake evolution, but it is likely to be the alteration of the drainage system within the terminus area that triggered the GLOF events.
The Landsat series images are available from https://glovis.usgs.gov/ (last access: 17 July 2023; USGS, 2017). ASTER DEMs can be freely downloaded from https://search.earthdata.nasa.gov/search (last access: 17 July 2023) and https://doi.org/10.5067/ASTER/AST14DEM.003 (NASA/METI/AIST/Japan Spacesystems and U.S./Japan ASTER Science Team, 2001). The SRTM DEM is from the USGS EROS Archive (https://www.usgs.gov/centers/eros/science/usgs-eros-archive-digital-elevation-shuttle-radar-topography-mission-srtm-non; last access: 17 July 2023) and https://doi.org/10.5066/F7K072R7 (USGS, 2018). HMA DEMs are provided by NASA NSIDC (https://nsidc.org/data/hma_dem8m_at/versions/1 and https://nsidc.org/data/hma_dem8m_ct/versions/1; last access: 17 July 2023), through https://doi.org/10.5067/GSACB044M4PK (Shean, 2017a) and https://doi.org/10.5067/0MCWJJH5ABYO (Shean, 2017b).
The supplement related to this article is available online at: https://doi.org/10.5194/tc-17-2891-2023-supplement.
ML, DJQ, XL, and HG designed this study. GL, LST, and ML carried out the data processing. ML, GL, and DJQ wrote the article. SY and YS edited every version of the article and assisted in data analysis.
The contact author has declared that none of the authors has any competing interests.
Publisher's note: Copernicus Publications remains neutral with regard to jurisdictional claims in published maps and institutional affiliations.
We greatly thank the relevant organizations and departments for providing the data used in this study. We acknowledge the help of Fanny Brun and Evan Miles for their support during a previous version of this article. We also thank Louise Sandberg Sørensen, Rakesh Bhambri, and Thorsten Seehaus for their detailed and supportive assessments of this paper.
This research has been supported by the Innovative Research Program of the International Research Center of Big Data for Sustainable Development Goals (grant nos. CBAS2022IRP03 and CBAS2022IRP02), the National Natural Science Foundation of China (grant no. 42101124), the Strategic Priority Research Program of the Chinese Academy of Sciences (grant no. XDA19070202), the International Partnership Program of the Chinese Academy of Sciences (grant no. 183611KYSB20200059), and a project of the National Cryosphere Desert Data Center (grant no. 2020D04).
This paper was edited by Louise Sandberg Sørensen and reviewed by Rakesh Bhambri and Thorsten Seehaus.
Barrand, N. E. and Murray, T.: Multivariate Controls on the Incidence of Glacier Surging in the Karakoram Himalaya, Arct. Antarct. Alp. Res., 38, 489–498, https://doi.org/10.1657/1523-0430(2006)38[489:MCOTIO]2.0.CO;2, 2006.
Bazai, N. A., Cui, P., Carling, P. A., Wang, H., Hassan, J., Liu, D., Zhang, G., and Jin, W.: Increasing glacial lake outburst flood hazard in response to surge glaciers in the Karakoram, Earth-Sci. Rev., 212, 103432, https://doi.org/10.1016/j.earscirev.2020.103432, 2021.
Benn, D. I.: Surging glaciers in Scotland, Scott. Geogr. J., 137, 1–40, https://doi.org/10.1080/14702541.2021.1922738, 2021.
Benn, D. I. and Evans, D. J. A. (Eds.): Glaciers and glaciation, Hodder Education, London, https://doi.org/10.4324/9780203785010, 2010.
Benn, D. I., Fowler, A. C., Hewitt, I., and Sevestre, H.: A general theory of glacier surges, J. Glaciol., 65, 701–716, https://doi.org/10.1017/jog.2019.62, 2019.
Berthier, E., Cabot, V., Vincent, C., and Six, D.: Decadal Region-Wide and Glacier-Wide Mass Balances Derived from Multi-Temporal ASTER Satellite Digital Elevation Models. Validation over the Mont-Blanc Area, Front. Earth Sci., 4, 63, https://doi.org/10.3389/feart.2016.00063, 2016.
Bhambri, R., Hewitt, K., Kawishwar, P., and Pratap, B.: Surge-type and surge-modified glaciers in the Karakoram, Sci. Rep.-UK, 7, 15391, https://doi.org/10.1038/s41598-017-15473-8, 2017.
Bhambri, R., Hewitt, K., Kawishwar, P., Kumar, A., Verma, A., Snehmani, Tiwari, S., and Misra, A.: Ice-dams, outburst floods, and movement heterogeneity of glaciers, Karakoram, Global Planet. Change, 180, 100–116, https://doi.org/10.1016/j.gloplacha.2019.05.004, 2019.
Bhambri, R., Watson, C. S., Hewitt, K., Haritashya, U. K., Kargel, J. S., Pratap Shahi, A., Chand, P., Kumar, A., Verma, A., and Govil, H.: The hazardous 2017–2019 surge and river damming by Shispare Glacier, Karakoram, Sci. Rep.-UK, 10, 4685, https://doi.org/10.1038/s41598-020-61277-8, 2020.
Björnsson, H.: Hydrological characteristics of the drainage system beneath a surging glacier, Nature, 395, 771–774, https://doi.org/10.1038/27384, 1998.
Bookhagen, B. and Burbank, D. W.: Topography, relief, and TRMM-derived rainfall variations along the Himalaya, Geophys. Res. Lett., 33, L08405, https://doi.org/10.1029/2006GL026037, 2006.
Cai, Y., Liu, S., and Lin, H.: Monitoring the Vegetation Dynamics in the Dongting Lake Wetland from 2000 to 2019 Using the BEAST Algorithm Based on Dense Landsat Time Series, Appl. Sci., 10, 4209, https://doi.org/10.3390/app10124209, 2020.
Chen, Y., Xu, C., Chen, Y., Li, W., and Liu, J.: Response of glacial-lake outburst floods to climate change in the Yarkant River basin on northern slope of Karakoram Mountains, China, Quat. Int., 226, 75–81, https://doi.org/10.1016/j.quaint.2010.01.003, 2010.
Clarke, G. K. C.: Fast glacier flow: Ice streams, surging, and tidewater glaciers, J. Geophys. Res.-Sol. Ea., 92, 8835–8841, https://doi.org/10.1029/JB092iB09p08835, 1987.
Copland, L., Sharp, M. J., and Dowdeswell, J. A.: The distribution and flow characteristics of surge-type glaciers in the Canadian High Arctic, Ann. Glaciol., 36, 73–81, https://doi.org/10.3189/172756403781816301, 2003.
Copland, L., Sylvestre, T., Bishop, M. P., Shroder, J. F., Seong, Y. B., Owen, L. A., Bush, A., and Kamp, U.: Expanded and Recently Increased Glacier Surging in the Karakoram, Arct. Antarct. Alp. Res., 43, 503–516, https://doi.org/10.1657/1938-4246-43.4.503, 2011.
Cuffey, K. M. and Paterson, W. S. B. (Eds.): The physics of glaciers, Academic Press, https://doi.org/10.1016/C2009-0-14802-X, 2010.
Ding, M., Huai, B., Sun, W., Wang, Y., Zhang, D., Guo, X., and Zhang, T.: Surge-type glaciers in Karakoram Mountain and possible catastrophes alongside a portion of the Karakoram Highway, Nat. Hazards, 90, 1017–1020, https://doi.org/10.1007/s11069-017-3063-4, 2018.
EROS Center: USGS EROS Archive – Digital Elevation – Shuttle Radar Topography Mission (SRTM) 1 Arc-Second Global, https://doi.org/10.5066/F7PR7TFT, 2018.
Farinotti, D., Immerzeel, W. W., de Kok, R. J., Quincey, D. J., and Dehecq, A.: Manifestations and mechanisms of the Karakoram glacier Anomaly, Nat. Geosci., 13, 8–16, https://doi.org/10.1038/s41561-019-0513-5, 2020.
Farr, T. G., Rosen, P. A., Caro, E., Crippen, R., Duren, R., Hensley, S., Kobrick, M., Paller, M., Rodriguez, E., Roth, L., Seal, D., Shaffer, S., Shimada, J., Umland, J., Werner, M., Oskin, M., Burbank, D., and Alsdorf, D.: The Shuttle Radar Topography Mission, Rev. Geophys., 45, RG2004, https://doi.org/10.1029/2005RG000183, 2007.
Gardelle, J., Berthier, E., Arnaud, Y., and Kääb, A.: Region-wide glacier mass balances over the Pamir-Karakoram-Himalaya during 1999–2011, The Cryosphere, 7, 1263–1286, https://doi.org/10.5194/tc-7-1263-2013, 2013.
Guillet, G., King, O., Lv, M., Ghuffar, S., Benn, D., Quincey, D., and Bolch, T.: A regionally resolved inventory of High Mountain Asia surge-type glaciers, derived from a multi-factor remote sensing approach, The Cryosphere, 16, 603–623, https://doi.org/10.5194/tc-16-603-2022, 2022.
Haemmig, C., Huss, M., Keusen, H., Hess, J., Wegmüller, U., Ao, Z., and Kulubayi, W.: Hazard assessment of glacial lake outburst floods from Kyagar glacier, Karakoram mountains, China, Ann. Glaciol., 55, 34–44, https://doi.org/10.3189/2014AoG66A001, 2014.
Hewitt, K.: The Karakoram Anomaly? Glacier Expansion and the `Elevation Effect,' Karakoram Himalaya, Mt. Res. Dev., 25, 332–340, https://doi.org/10.1659/0276-4741(2005)025[0332:TKAGEA]2.0.CO;2, 2005.
Hewitt, K. and Liu, J.: Ice-Dammed Lakes and Outburst Floods, Karakoram Himalaya: Historical Perspectives on Emerging Threats, Phys. Geogr., 31, 528–551, https://doi.org/10.2747/0272-3646.31.6.528, 2010.
Hugonnet, R., McNabb, R., Berthier, E., Menounos, B., Nuth, C., Girod, L., Farinotti, D., Huss, M., Dussaillant, I., Brun, F., and Kääb, A.: Accelerated global glacier mass loss in the early twenty-first century, Nature, 592, 726–731, https://doi.org/10.1038/s41586-021-03436-z, 2021.
Jekel, C. F. and Venter, G.: Pwlf: A python library for fitting 1D continuous piecewise linear functions, https://doi.org/10.13140/RG.2.2.28530.56007, 2019.
Jiskoot, H.: Glacier Surging, in: Encyclopedia of Snow, Ice and Glaciers, edited by: Singh, V. P., Singh, P., and Haritashya, U. K., Springer Netherlands, Dordrecht, 415–428, https://doi.org/10.1007/978-90-481-2642-2_559, 2011.
Kääb, A., Berthier, E., Nuth, C., Gardelle, J. and Arnaud, Y.: Contrasting patterns of early twenty-first-century glacier mass change in the Himalayas, Nature, 488, 495–498, https://doi.org/10.1038/nature11324, 2012.
Leprince, S., Barbot, S., Ayoub, F., and Avouac, J.: Automatic and Precise Orthorectification, Coregistration, and Subpixel Correlation of Satellite Images, Application to Ground Deformation Measurements, IEEE T. Geosci. Remote, 45, 1529–1558, https://doi.org/10.1109/TGRS.2006.888937, 2007.
Lv, M., Guo, H., Lu, X., Liu, G., Yan, S., Ruan, Z., Ding, Y., and Quincey, D. J.: Characterizing the behaviour of surge- and non-surge-type glaciers in the Kingata Mountains, eastern Pamir, from 1999 to 2016, The Cryosphere, 13, 219–236, https://doi.org/10.5194/tc-13-219-2019, 2019.
Lv, M., Guo, H., Yan, J., Wu, K., Liu, G., Lu, X., Ruan, Z., and Yan, S.: Distinguishing Glaciers between Surging and Advancing by Remote Sensing: A Case Study in the Eastern Karakoram, Remote Sens., 12, 2297, https://doi.org/10.3390/rs12142297, 2020a.
Lv, M., Quincey, D. J., Guo, H., King, O., Liu, G., Yan, S., Lu, X., and Ruan, Z.: Examining geodetic glacier mass balance in the eastern Pamir transition zone, J. Glaciol., 66, 927–937, https://doi.org/10.1017/jog.2020.54, 2020b.
Markham, B. L., Storey, J. C., Williams, D. L., and Irons, J. R.: Landsat sensor performance: history and current status, IEEE T. Geosci. Remote, 42, 2691–2694, https://doi.org/10.1109/TGRS.2004.840720, 2004.
Mastrandrea, M. D., Field, C. B., Stocker, T. F., Edenhofer, O., Ebi, K. L., Frame, D. J., Held, H., Kriegler, E., Mach, K. J., Matschoss, P. R., Plattner, G.-K., Yohe, G. W., and Zwiers, F. W.: Guidance note for lead authors of the IPCC fifth assessment report on consistent treatment of uncertainties, Intergovernmental Panel on Climate Change, http://www.ipcc.ch (last access: 17 July 2023), 2010.
NASA/METI/AIST/Japan Spacesystems and U.S./Japan ASTER Science Team: ASTER DEM Product, NASA EOSDIS Land Processes DAAC [data set], https://doi.org/10.5067/ASTER/AST14DEM.003 (last access: 6 December 2022), 2001.
Nuth, C. and Kääb, A.: Co-registration and bias corrections of satellite elevation data sets for quantifying glacier thickness change, The Cryosphere, 5, 271–290, https://doi.org/10.5194/tc-5-271-2011, 2011.
Paul, F.: A 60-year chronology of glacier surges in the central Karakoram from the analysis of satellite image time-series, Geomorphology, 352, 106993, https://doi.org/10.1016/j.geomorph.2019.106993, 2020.
Pitte, P., Berthier, E., Masiokas, M. H., Cabot, V., Ruiz, L., Ferri Hidalgo, L., Gargantini, H., and Zalazar, L.: Geometric evolution of the Horcones Inferior Glacier (Mount Aconcagua, Central Andes) during the 2002–2006 surge, J. Geophys. Res.-Earth Surf., 121, 111–127, https://doi.org/10.1002/2015JF003522, 2016.
Ragettli, S., Bolch, T., and Pellicciotti, F.: Heterogeneous glacier thinning patterns over the last 40 years in Langtang Himal, Nepal, The Cryosphere, 10, 2075–2097, https://doi.org/10.5194/tc-10-2075-2016, 2016.
Rashid, I., Majeed, U., Jan, A., and Glasser, N. F.: The January 2018 to September 2019 surge of Shisper Glacier, Pakistan, detected from remote sensing observations, Geomorphology, 351, 106957, https://doi.org/10.1016/j.geomorph.2019.106957, 2020.
Rignot, E., Echelmeyer, K., and Krabill, W.: Penetration depth of interferometric synthetic-aperture radar signals in snow and ice, Geophys. Res. Lett., 28, 3501–3504, https://doi.org/10.1029/2000GL012484, 2001.
Round, V., Leinss, S., Huss, M., Haemmig, C., and Hajnsek, I.: Surge dynamics and lake outbursts of Kyagar Glacier, Karakoram, The Cryosphere, 11, 723–739, https://doi.org/10.5194/tc-11-723-2017, 2017.
Sevestre, H. and Benn, D. I.: Climatic and geometric controls on the global distribution of surge-type glaciers: implications for a unifying model of surging, J. Glaciol., 61, 646–662, https://doi.org/10.3189/2015JoG14J136, 2015.
Shangguan, D., Liu, S., Ding, Y., Guo, W., Xu, B., Xu, J., and Jiang, Z.: Characterizing the May 2015 Karayaylak Glacier surge in the eastern Pamir Plateau using remote sensing, J. Glaciol., 62, 944–953, https://doi.org/10.1017/jog.2016.81, 2016.
Shean, D. E.: High Mountain Asia 8-meter DEMs Derived from Along-track Optical Imagery, Version 1, Boulder, Colorado USA, NASA National Snow and Ice Data Center Distributed Active Archive Center [data set], https://doi.org/10.5067/GSACB044M4PK (last access: 6 December 2022), 2017a.
Shean, D. E.: High Mountain Asia 8-meter DEMs Derived from Cross-track Optical Imagery, Version 1, Boulder, Colorado USA, NASA National Snow and Ice Data Center Distributed Active Archive Center [data set], https://doi.org/10.5067/0MCWJJH5ABYO (last access: 6 December 2022), 2017b.
Shean, D. E., Alexandrov, O., Moratto, Z. M., Smith, B. E., Joughin, I. R., Porter, C., and Morin, P.: An automated, open-source pipeline for mass production of digital elevation models (DEMs) from very-high-resolution commercial stereo satellite imagery, ISPRS J. Photogramm. Remote, 116, 101–117, https://doi.org/10.1016/j.isprsjprs.2016.03.012, 2016.
Shi, Y. and Liu, S.: Estimation on the response of glaciers in China to the global warming in the 21st century, Chinese Sci. Bull., 45, 668–672, https://doi.org/10.1007/BF02886048, 2000.
Storn, R. and Price, K. V.: Differential Evolution – A Simple and Efficient Heuristic for global Optimization over Continuous Spaces, J. Glob. Optim., 11, 341–359, https://doi.org/10.1023/A:1008202821328, 1997.
Thayyen, R. J. and Gergan, J. T.: Role of glaciers in watershed hydrology: a preliminary study of a “Himalayan catchment”, The Cryosphere, 4, 115–128, https://doi.org/10.5194/tc-4-115-2010, 2010.
Truffer, M., Kääb, A., Harrison, W. D., Osipova, G. B., Nosenko, G. A., Espizua, L., Gilbert, A., Fischer, L., Huggel, C., Craw Burns, P. A., and Lai, A. W.: Chapter 13 – Glacier surges, in: Snow and Ice-Related Hazards, Risks, and Disasters (Second Edition), edited by: Haeberli, W. and Whiteman, C., Elsevier, 417–466, https://doi.org/10.1016/B978-0-12-817129-5.00003-2, 2021.
USGS: Global Visualization Viewer (GloVis), USGS [data set], https://glovis.usgs.gov/ (last access: 17 July 2023), 2017.
USGS: USGS EROS Archive – Digital Elevation – Shuttle Radar Topography Mission (SRTM) Non-Void Filled, USGS [data set], https://doi.org/10.5066/F7K072R7, 2018.
Wei, R.-j., Peng, L., Liang, C., Haemmig, C., Huss, M., Mu, Z.-x., and He, Y.: Analysis of temporal and spatial variations in hydrometeorological elements in the Yarkant River Basin, China, J. Water Clim. Change, 10, 167–180, https://doi.org/10.2166/wcc.2018.111, 2018.
Wulder, M. A., Roy, D. P., Radeloff, V. C., Loveland, T. R., Anderson, M. C., Johnson, D. M., Healey, S., Zhu, Z., Scambos, T. A., Pahlevan, N., Hansen, M., Gorelick, N., Crawford, C. J., Masek, J. G., Hermosilla, T., White, J. C., Belward, A. S., Schaaf, C., Woodcock, C. E., Huntington, J. L., Lymburner, L., Hostert, P., Gao, F., Lyapustin, A., Pekel, J.-F., Strobl, P., and Cook, B. D.: Fifty years of Landsat science and impacts, Remote Sens. Environ., 280, 113195, https://doi.org/10.1016/j.rse.2022.113195, 2022.
Yin, B., Zeng, J., Zhang, Y., Huai, B., and Wang, Y.: Recent Kyagar glacier lake outburst flood frequency in Chinese Karakoram unprecedented over the last two centuries, Nat. Hazards, 95, 877–881, https://doi.org/10.1007/s11069-018-3505-7, 2019.
Zhang, M., Chen, F., Tian, B., Liang, D., and Yang, A.: Characterization of Kyagar Glacier and Lake Outburst Floods in 2018 Based on Time-Series Sentinel-1A Data, Water, 12, 184, https://doi.org/10.3390/w12010184, 2020.
Zhang, X.: Investigation of glacier bursts of the Yarkant River in Xinjiang, China, Ann. Glaciol., 16, 135–139, https://doi.org/10.3189/1992AoG16-1-135-139, 1992.
Zhang, Z., Zhao, J., Liu, S., Zhang, Q., Jiang, Z., Xu, Y., and Su, H.: Characterization of Three Surges of the Kyagar Glacier, Karakoram, Remote Sens., 15, 2113, https://doi.org/10.3390/rs15082113, 2023.
Zhao, K., Wulder, M. A., Hu, T., Bright, R., Wu, Q., Qin, H., Li, Y., Toman, E., Mallick, B., Zhang, X., and Brown, M.: Detecting change-point, trend, and seasonality in satellite time series data to track abrupt changes and nonlinear dynamics: A Bayesian ensemble algorithm, Remote Sens. Environ., 232, 111181, https://doi.org/10.1016/j.rse.2019.04.034, 2019.