the Creative Commons Attribution 4.0 License.
the Creative Commons Attribution 4.0 License.
 | 04 Apr 2023
Rapid sea ice changes in the future Barents Sea
Ole Rieke
Jakob Simon Dörr
Observed and future winter Arctic sea ice loss is strongest in the Barents Sea. However, the anthropogenic signal of the sea ice decline is superimposed by pronounced internal variability that represents a large source of uncertainty in future climate projections. A notable manifestation of internal variability is rapid ice change events (RICEs) that greatly exceed the anthropogenic trend. These RICEs are associated with large displacements of the sea ice edge which could potentially have both local and remote impacts on the climate system. In this study we present the first investigation of the frequency and drivers of RICEs in the future Barents Sea, using multi-member ensemble simulations from CMIP5 and CMIP6. A majority of RICEs are triggered by trends in ocean heat transport or surface heat fluxes. Ice loss events are associated with increasing trends in ocean heat transport and decreasing trends in surface heat loss. RICEs are a common feature of the future Barents Sea until the region becomes close to ice-free. As their evolution over time is closely tied to the average sea ice conditions, rapid ice changes in the Barents Sea may serve as a precursor for future changes in adjacent seas.
- Article
(4341 KB) - Full-text XML
- BibTeX
- EndNote


The Arctic is a region of amplified warming, with temperatures increasing twice as fast as the global average, i.e., an Arctic amplification of climate change (Serreze et al., 2009; England et al., 2021; Shu et al., 2022). The strong temperature increase is accompanied by a decline in sea ice thickness (Kwok, 2018) and extent (Onarheim et al., 2018; Meredith et al., 2019) in all regions and all seasons. Future climate simulations project the strong sea ice decline to continue, leading to seasonally ice-free conditions in the Arctic as early as the middle of the 21st century (Notz and SIMIP Community, 2020; Årthun et al., 2021; Bonan et al., 2021b). However, future Arctic sea ice loss and the projected timing of ice-free conditions display a substantial spread across different models (Jahn et al., 2016). This large uncertainty results from model structure and emission scenarios but also internal climate variability (Swart et al., 2015; Bonan et al., 2021a). Understanding the causes and impacts of internal variability in Arctic sea ice is therefore important for predicting future sea ice change under anthropogenic warming.
Whereas Arctic summer ice loss has largely occurred in the central Arctic, winter ice loss has so far been confined to the outer shelf seas. The Barents Sea (Fig. 1) is the area of most intense winter sea ice area (SIA) loss and is on track towards experiencing year-round ice-free conditions sometime in the second half of the 21st century (Onarheim and Årthun, 2017). A large part of the recent winter sea ice loss in the Barents Sea can be related to internal variability that is particularly strong in this region (England et al., 2019; Årthun et al., 2019; Bonan et al., 2021a). Internal variability is also manifested in multi-year episodes of pronounced ice growth or ice loss that greatly exceed the long-term trend. These events of rapid changes in sea ice cover are important to understand as they are characterized by substantial movements of the sea ice edge that have potential implications for marine ecosystems (Fossheim et al., 2015; Sandø et al., 2021), shipping routes (Melia et al., 2016), and terrestrial climate (Lawrence et al., 2008; Zhang et al., 2018). Rapid ice loss events have been investigated for pan-Arctic summer sea ice (Holland et al., 2006; Auclair and Tremblay, 2018). And although there have been several studies conducted on interannual winter sea ice variability in the Barents Sea (Kwok, 2009; Schlichtholz, 2011; Årthun et al., 2012; Nakanowatari et al., 2014; Liu et al., 2022), a detailed investigation of rapid sea ice changes is lacking.
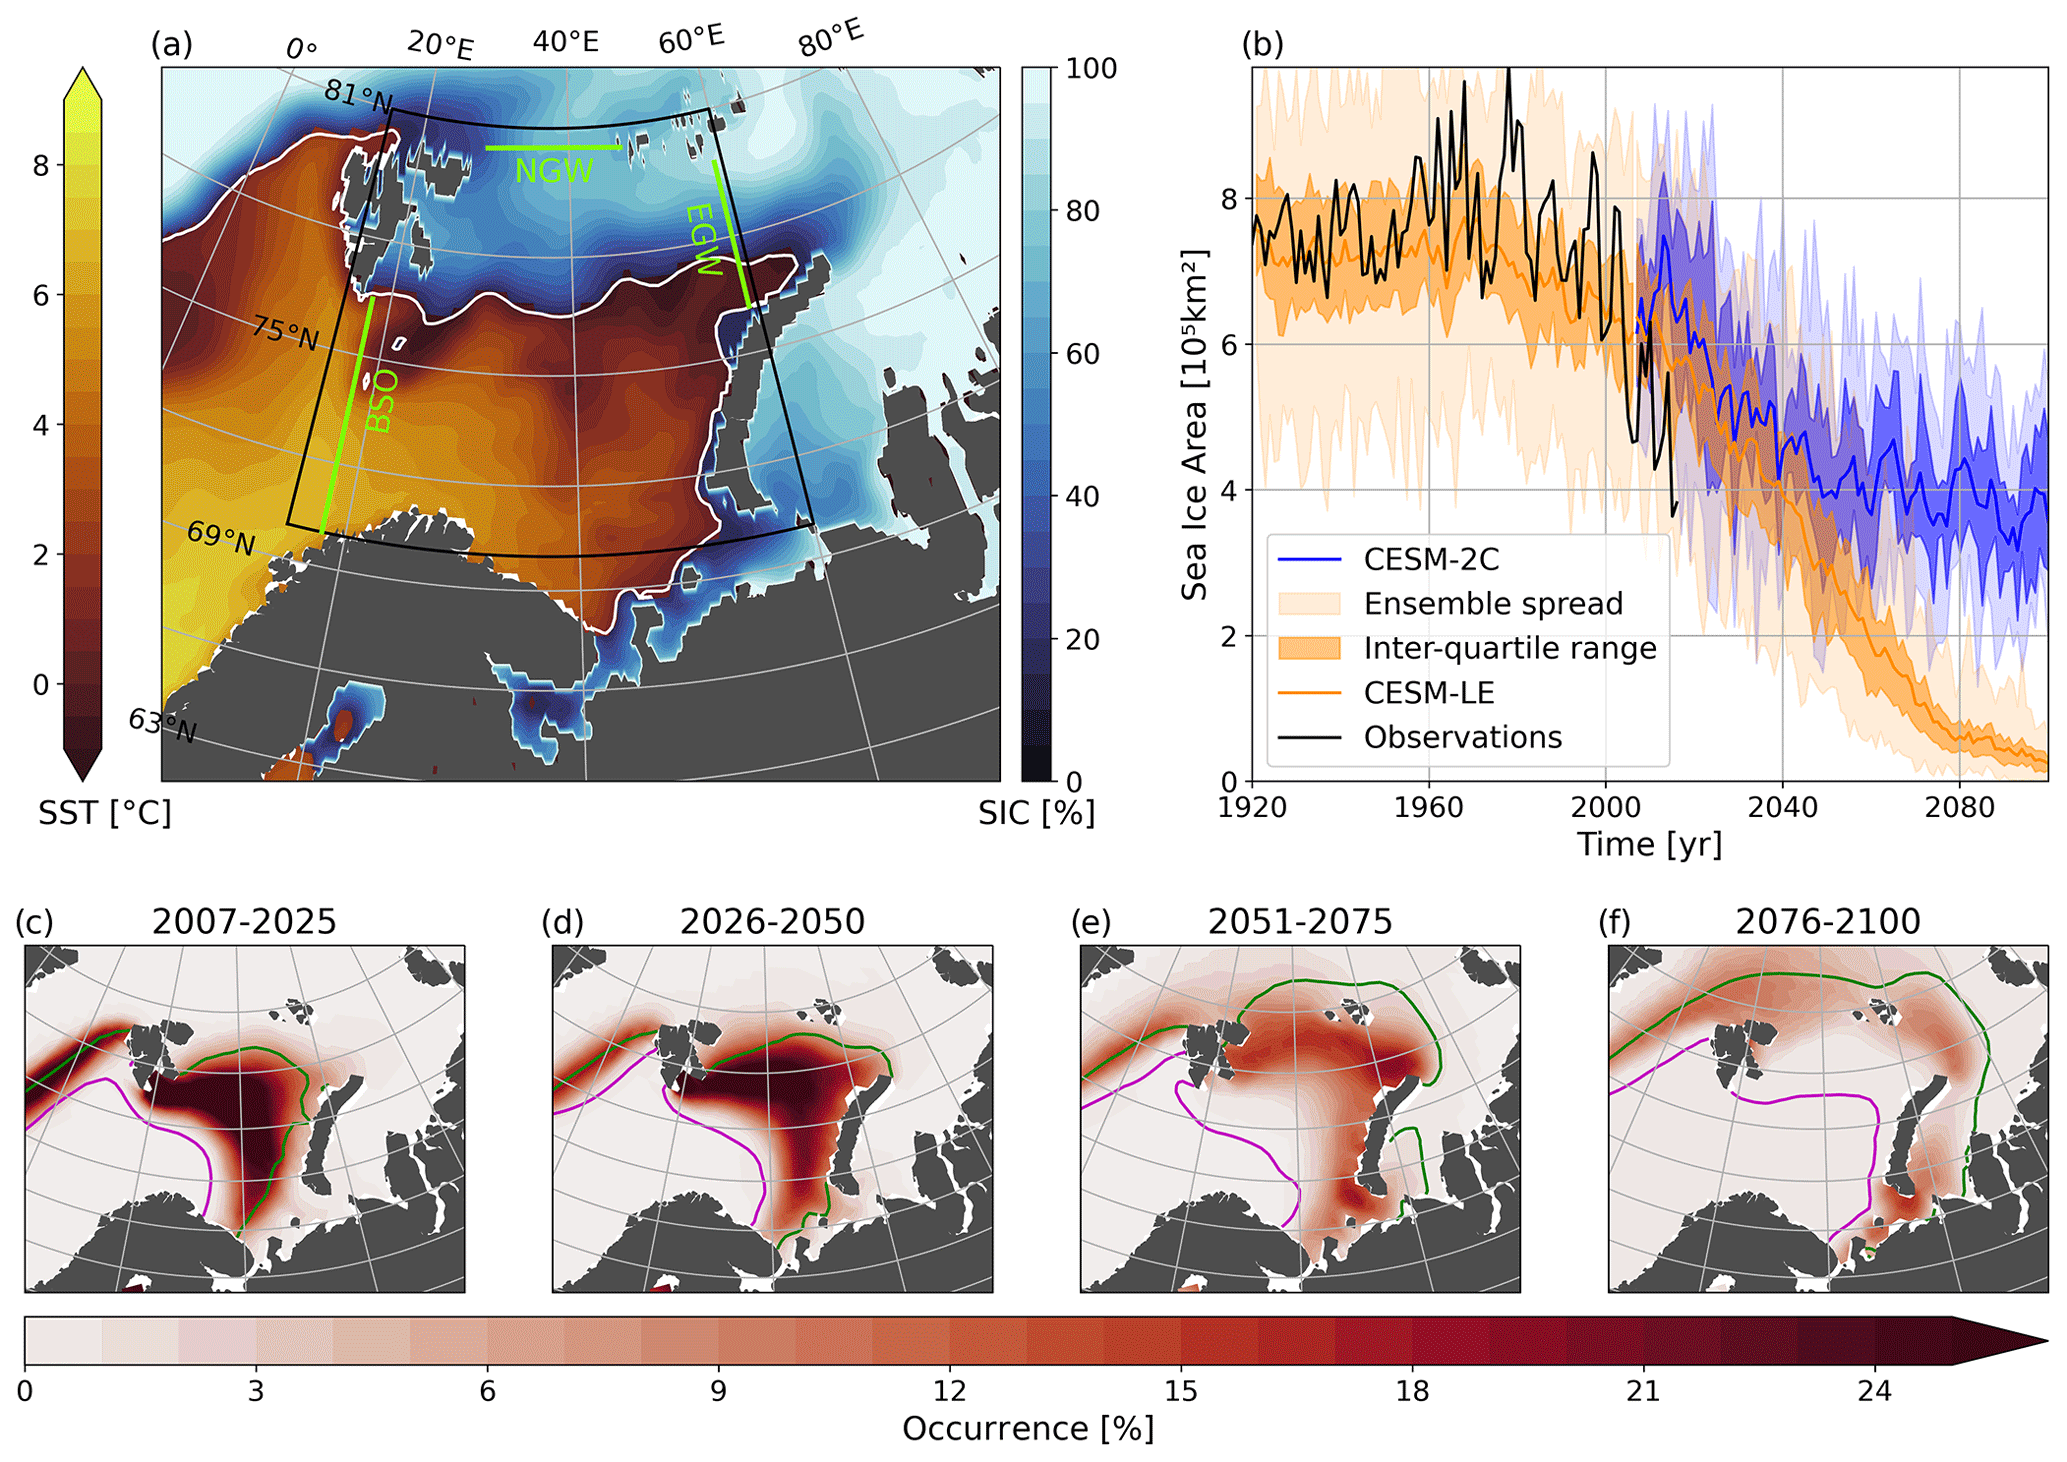
Figure 1(a) Observed winter (November–April) mean sea ice concentration (SIC; Walsh et al., 2017) and sea surface temperature (SST; Hersbach et al., 2019) in the Barents Sea (black box) between 2013 and 2017. Note the two different color bars. The white line indicates the mean location of the winter sea ice edge (15 % SIC). (b) Winter SIA in the Barents Sea from observations, CESM-LE, and CESM-2C. (c–f) Occurrence of strong 5-year trends in SIC (≥ 8 % yr−1) during different time periods of the CESM-LE simulations. The colored lines indicate the southernmost (magenta) and northernmost (green) location of the ice edge during the respective time periods.
In this study we present the first investigation of rapid ice change events (RICEs) in the Barents Sea using large ensemble climate model simulations. We first quantify the probability of RICEs in present and future climates, demonstrating that strong – more than 7 times the observed ice decline – multi-year sea ice trends are a common feature of the Barents Sea until it becomes close to ice-free. The drivers of these RICEs are thereafter investigated. Our analysis is largely based on a large ensemble simulation from the Community Earth System Model version 1, but the sensitivity of our results to model differences and future emission scenarios is also assessed using CMIP6 models.
The main part of this analysis is based on future simulations from the Community Earth System Model Version 1 (CESM1; Hurrell et al., 2013), a fully coupled climate model that has a horizontal resolution of approximately 1∘ in all model components. We make use of two sets of simulations from the model. The large ensemble experiment (CESM-LE; Kay et al., 2015) consists of 40 members and covers the period from 1920–2100 based on historical greenhouse gas emissions until 2005 (Lamarque et al., 2010) and the RCP8.5 (Moss et al., 2010) thereafter. The other experiment applies an external greenhouse gas forcing that limits global warming to 2 ∘C (CESM-2C; Sanderson et al., 2017). This experiment consists of 11 members over the period 2006–2100. The model setup is identical to CESM-LE, with the external forcing as the only difference. To test the robustness of our results, we additionally investigate RICEs in five CMIP6 climate models that have 10 or more ensemble members (Table 1), using both a high (SSP585) and a low (SSP126) warming scenario (O'Neill et al., 2017).
CESM-LE has been used in several previous studies to investigate Arctic sea ice conditions and has been found to compare well to observations (Auclair and Tremblay, 2018; Labe et al., 2018; England et al., 2019; Årthun et al., 2019; Dörr et al., 2021). The model slightly overestimates the sea ice cover in the Barents Sea as a result of lower simulated ocean temperatures than observed (Park et al., 2014). However, the observations (Walsh et al., 2017) fall within the ensemble spread (Fig. 1b). The model also has a realistic representation of sea ice transport into the Barents Sea (not shown; see Lind et al., 2018). The sensitivity of simulated Barents Sea ice extent to interannual variations in the Barents Sea Opening ocean heat transport is also consistent with observations (Årthun et al., 2019).
Using multi-member ensemble experiments allows for a detailed investigation of internal variability. The setup of the individual simulations differs only in slightly perturbed initial atmospheric conditions. Since the external forcing is the same for each simulation, the differences between the individual simulations are thus solely a result of internally generated variability (Deser et al., 2020). The externally forced contribution of sea ice change is thus defined as the ensemble mean change (either from the 40 members of the CESM-LE or each CMIP6 model). To isolate the internal variability, we subtract the ensemble mean from each ensemble member. Choosing CMIP6 models with minimum 10 ensemble members represents a trade-off between robustly separating internal and external variability and the number of available models (Milinski et al., 2020). All analysis in this paper concerns internal variability.
As the Barents Sea is practically ice-free in summer, our analysis is based on winter means (November–April). To assess RICEs we first calculate linear 5-year trends of SIA over the Barents Sea (70–81∘ N, 15–60∘ E; Fig. 1). We note that our results do not qualitatively change if we consider sea ice volume or sea ice extent instead. RICEs were then defined as linear trends that exceed 2 standard deviations of the distribution of 5-year trends in CESM-LE between 2007 and 2025. This is equivalent to 7 times the observed ice decline over the satellite era (1979–2017; Walsh et al., 2017). Our results are not sensitive to the exact choice of this threshold (e.g., 1–2.5 standard deviations). We apply the same threshold to CESM-2C and the CMIP6 models to enable direct comparison. To assess potential drivers of RICEs, we investigate ocean heat transport, SIA transport, and surface heat fluxes. First, we calculate the trend for each of these variables during the duration of each RICE. We then identify the number of RICEs where one or several of the variables have a trend that exceeds 1 standard deviation. The relative importance of the investigated drivers does not change if we rather use a different threshold (1–3 standard deviations). Our method thus identifies a fraction (in percent) of RICEs related to each driver, similar to the approach by Auclair and Tremblay (2018). Additionally, we look at the spatial distribution of surface heat fluxes, sea level pressure, and surface air temperature during RICEs. Ocean heat transport (OHT) across the Barents Sea Opening (BSO; Fig. 1a) is calculated as
where ρ and cp are the density and specific heat capacity of water, respectively, and F is the advection of temperature per unit volume (model variable UET). Ocean heat transport through individual sections (such as the BSO) must be calculated relative to a reference temperature, which is in principle arbitrary (Schauer and Beszczynska-Möller, 2009). In CESM, UET is calculated using a reference temperature of 0 ∘C. This reference temperature is in line with that used in previous studies, based on both observations and simulations, on Atlantic water heat transport into the Arctic (e.g., Årthun et al., 2012; Wang et al., 2019; Docquier et al., 2021; Dörr et al., 2021; Tsubouchi et al., 2021). We have explored other reference temperatures (−2 ∘C, 2 ∘C) and found that the magnitude of present and future trends in ocean heat transport and their link to RICEs are not sensitive to this. SIA transport between Franz Josef Land and Novaya Zemlya (eastern gateway, EGW; Fig. 1a) and between Svalbard and Franz Josef Land (northern gateway, NGW; Fig. 1a) is calculated as the product of SIC and ice drift velocity, integrated over the two gateways. Sections are defined in alignment with the native grid of the model.
Ziehn et al. (2020)Swart et al. (2019)Döscher et al. (2022)Tatebe et al. (2019)Mauritsen et al. (2019)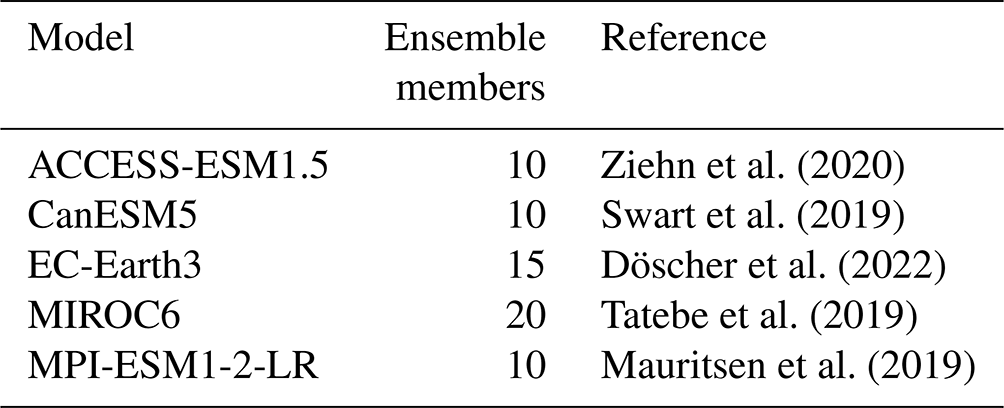
Observed winter SIA in the Barents Sea has experienced an accelerating decline in the late 20th and early 21st century, resulting in a minimum SIA in 2017 which was approximately half of the 20th century mean (Fig. 1b). Future projections under the RCP8.5 emission scenario project a continuation of this decline and an entirely ice-free Barents Sea by the end of this century (Fig. 1b; Onarheim and Årthun, 2017). The observed ice decline is, however, overlaid by large interannual to decadal fluctuations, indicative of strong internal variability. In the CESM simulations, this internal variability is expressed as an ensemble spread in SIA of approximately ±30 %. The magnitude of the internal variability in CESM-LE remains quite constant over time until SIA becomes very low (Fig. 1b). In CESM-2C, where SIA stabilizes after 2050, the ensemble spread remains unchanged. The strength of internal variability can clearly be seen in the location of the southernmost and northernmost ice edges across the different ensemble members in CESM-LE (Fig. 1c–f). Although both shift northwards during the simulation, they encompass a large area of possible locations. For example, for 2076–2100 (Fig. 1f) the ensemble spread includes an ice edge close to its present location but also one that has retreated past the boundaries of the Barents Sea.
To quantify the occurrence of rapid ice change events in the Barents Sea, distributions of 5-year SIA trends are presented in Fig. 2 for CESM-LE and CESM-2C for different periods. The distribution of SIA trends based on observations is shown for comparison and is seen to be similar to simulated trends between 2007 and 2025 (Fig. 2a). Until 2050, CESM-LE and CESM-2C show similar distributions, with many trends being much stronger than the externally forced ice decline (solid black line in Fig. 2). In CESM-2C, the distributions in the second half of the 21st century remain similar to the previous time periods, as the average SIA remains rather constant during this time (Fig. 1b). In CESM-LE, however, the distribution becomes more confined towards smaller trends between 2051 and 2075 and even more so for 2076–2100. This absence of strong sea ice trends toward the end of the century can be understood by looking at the spatial distribution of strong trends in SIC (≥8 % yr−1) in CESM-LE. It is seen that as the sea ice cover gradually retreats toward the end of the century, the area where large trends occur accordingly shifts towards the northern and eastern boundaries of the Barents Sea (Fig. 1c–f). At the end of the century, strong sea ice trends are predominantly found outside the Barents Sea (Fig. 1f), implying that a more variable winter sea ice cover in the Kara Sea and central Arctic Ocean can be expected in the future.
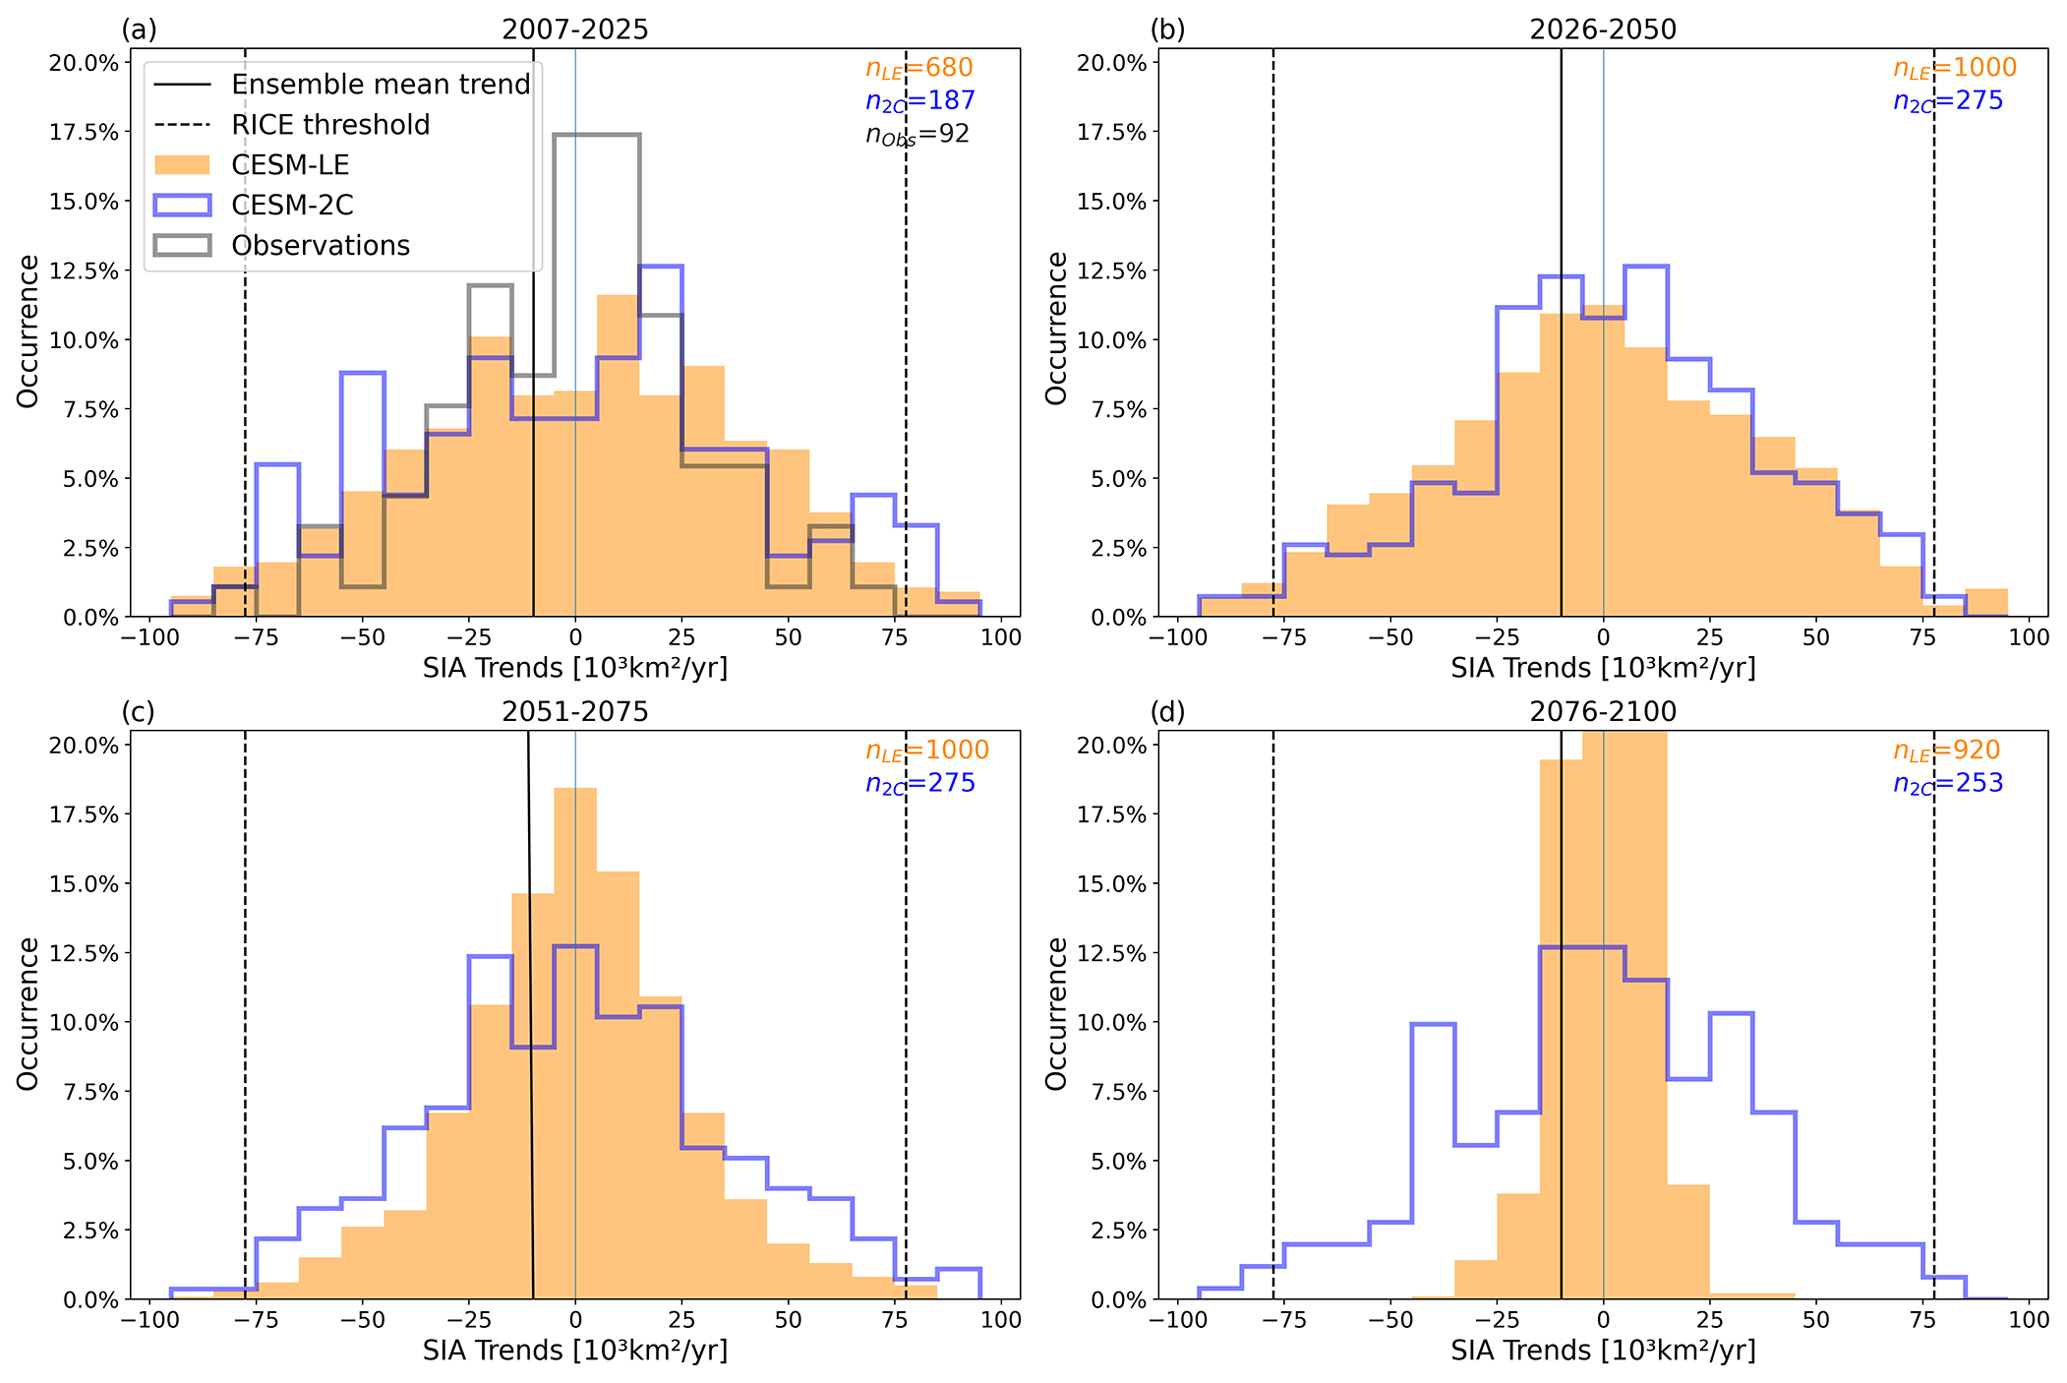
Figure 2Histograms of internally driven 5-year trends of SIA during different time periods in the 21st century for CESM-LE and CESM-2C. The black solid line indicates the externally forced ice decline in CESM-LE (defined as the maximum 30-year trend in ensemble mean SIA, 2031–2060); the dashed lines indicate the threshold for RICEs. The sample size (number of trends) of the histograms is indicated in the top-right corner. A fourth-order polynomial was removed from observations (Walsh et al., 2017) prior to calculating trends to represent the externally forced signal (following Bonan et al., 2021a).
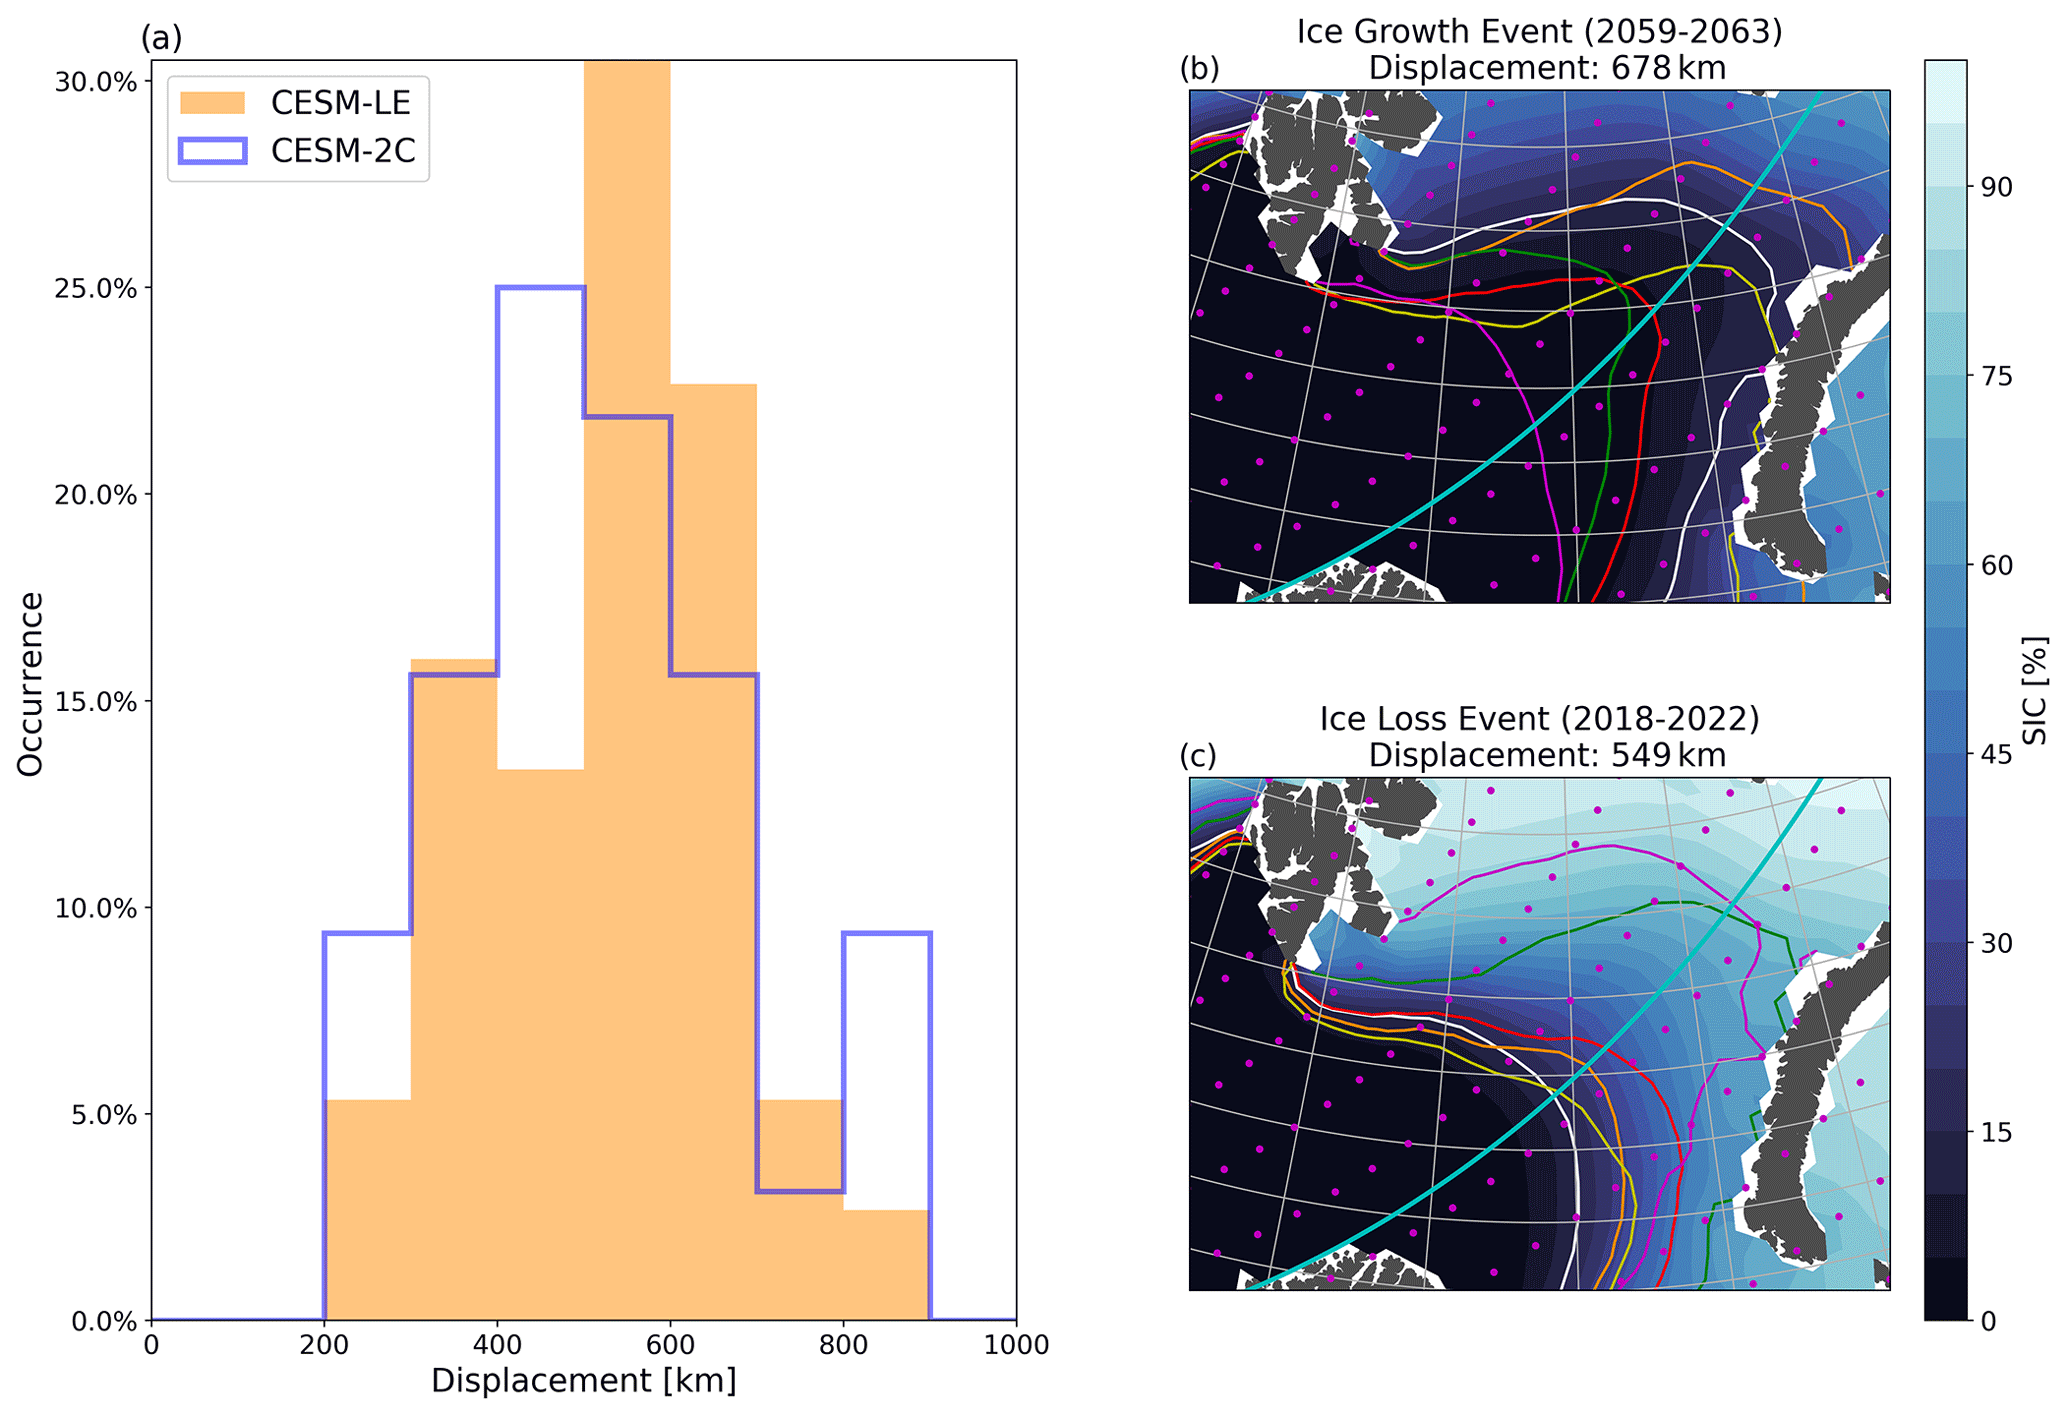
Figure 3(a) Distribution of ice edge displacement during RICEs in CESM-LE and CESM-2C. The displacement is calculated along the cyan line in panels (b) and (c). (b, c) Ice edge evolution during an example ice growth and ice loss event. Shading indicates the ensemble mean SIC during the respective time frame and the white line the ensemble mean ice edge (15 % SIC). The colored lines indicate the ice edge (15 % SIC) during the RICEs in the order orange (first year), yellow, red, green, and magenta (last year).
In the following, we will focus on the tails of the distributions, i.e., RICEs, as these trends lead to the strongest changes in Barents Sea ice conditions. In CESM-LE we find 31 ice growth and 44 ice loss events between 2006 and 2100, and in CESM-2C we find 13 ice growth and 19 ice loss events that exceed our definition of a rapid ice change event. This corresponds to an average of two RICEs per ensemble member in CESM-LE and three in CESM-2C. The RICEs are associated with a large displacement of the ice edge, with ice loss (growth) events leading to a northward (southward) movement of the ice edge of approximately 400–700 km depending on emission scenario (Fig. 3a) and time period (Fig. 4). Two example cases from CESM-LE are depicted in Fig. 3. During an ice growth event in the second half of the 21st century (2059–2063), the ice edge is pushed 678 km southwestwards, resulting in a present-day location (Fig. 3b). The example ice loss event in the early 21st century (2018–2022) demonstrates a rapid northward retreat of the ice edge (Fig. 3c). These examples emphasize the severity of RICEs as they can initiate a shift from average ice conditions to an anomalous northward or southward location of the ice edge in only a few years. All ice growth events in CESM-LE, even those after 2050, result in an ice edge location very close to or even south of the present-day average (represented by the ensemble mean ice edge between 2007–2025).
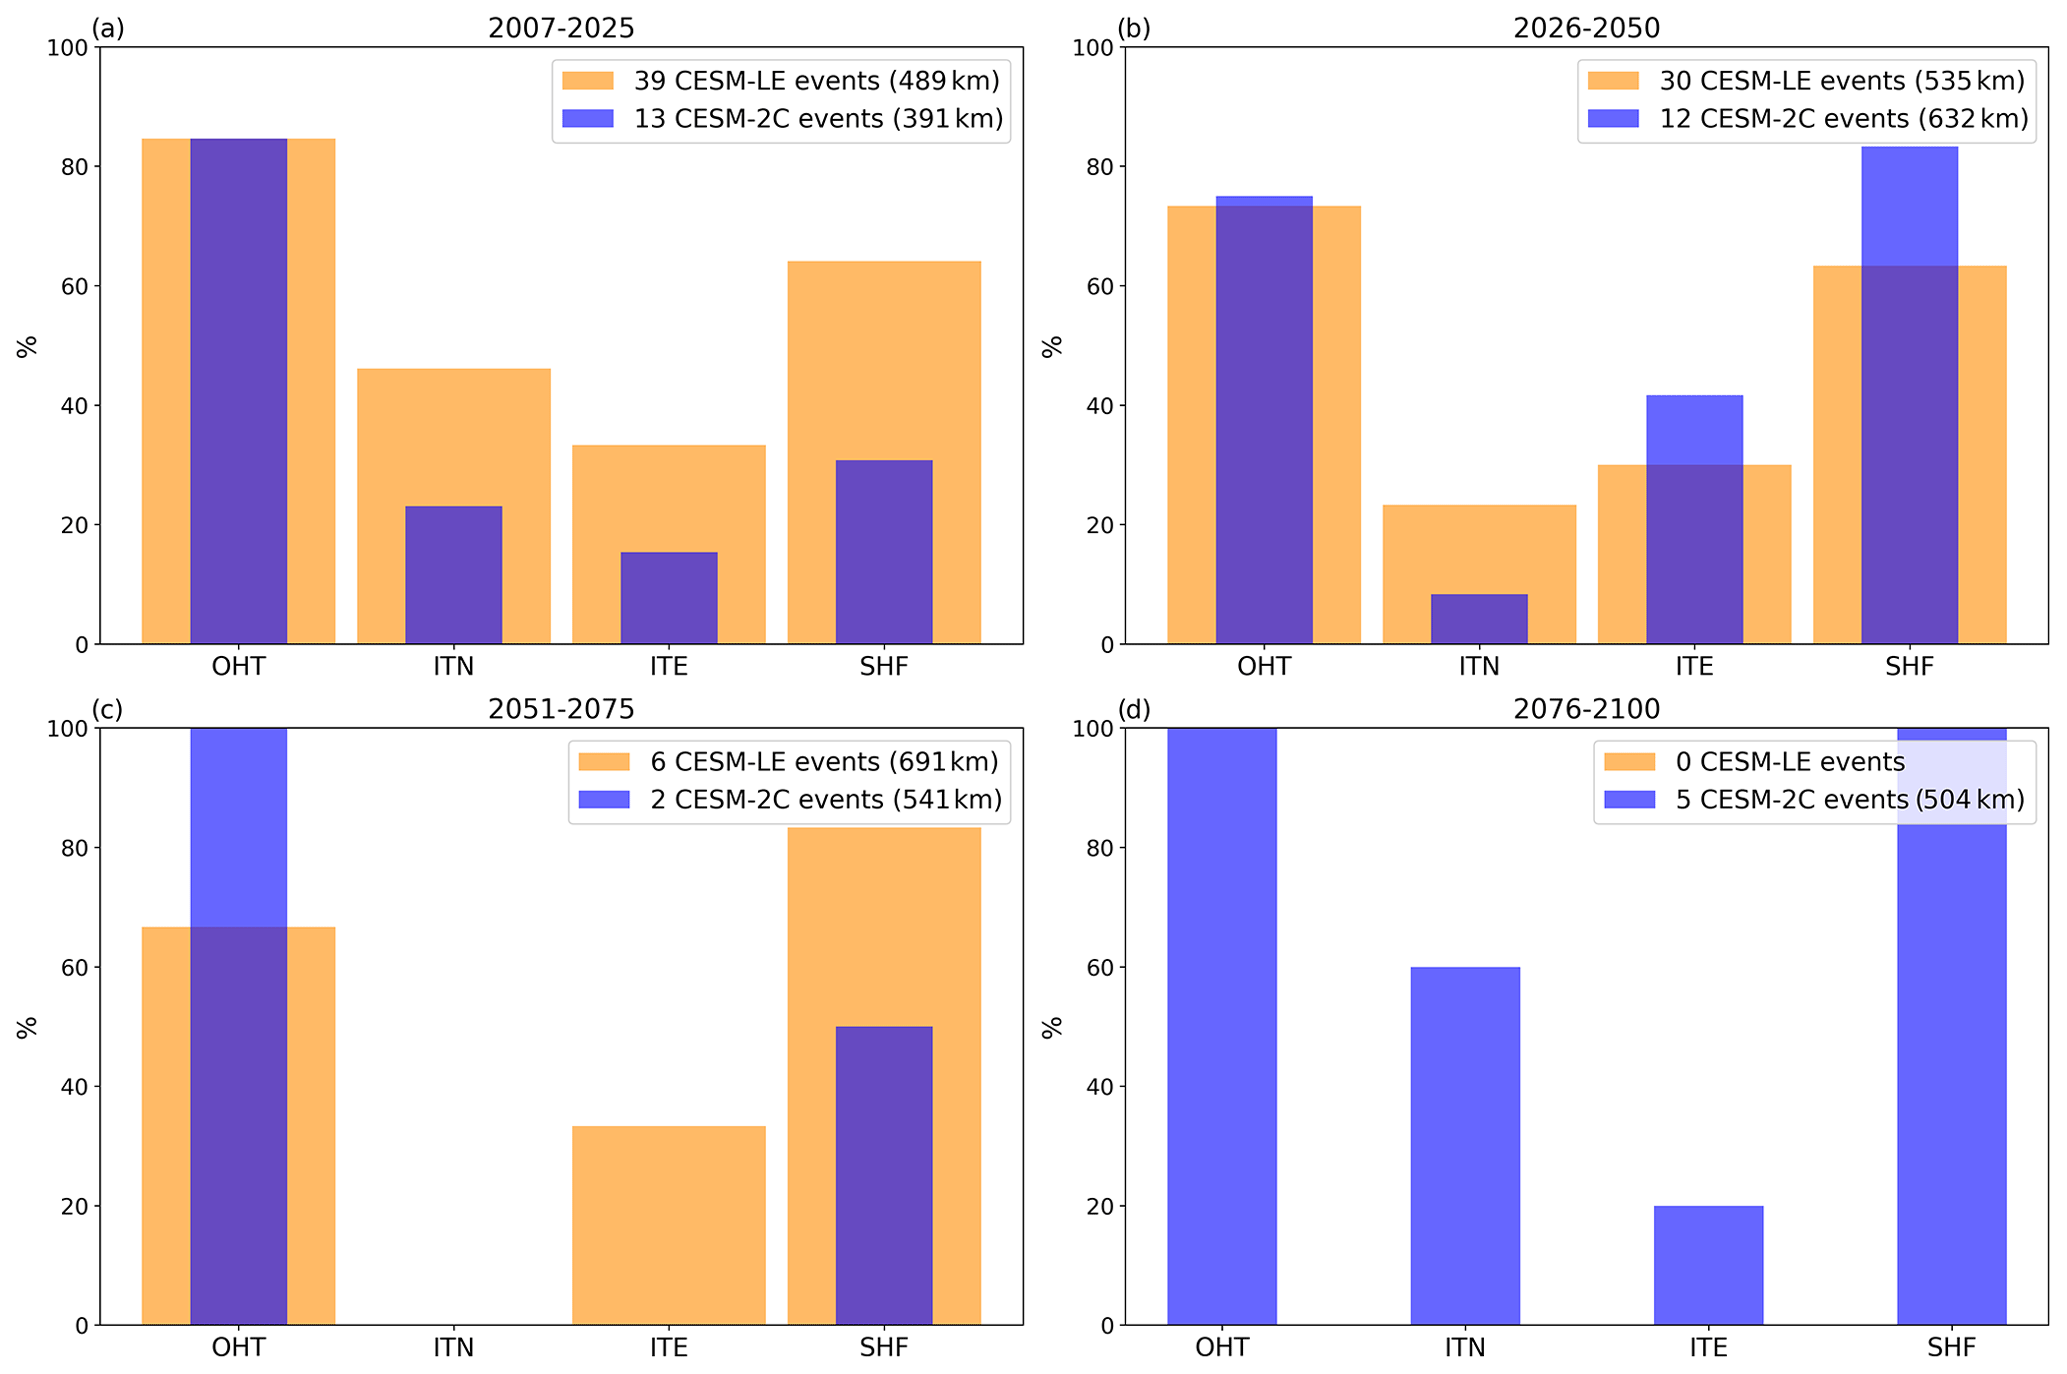
Figure 4The fraction of RICEs that show a simultaneous trend in the respective forcing parameter of more than 1 standard deviation. The drivers are BSO ocean heat transport (OHT), ice transport through the northern (ITN) and eastern (ITE) gateway, and surface heat flux (SHF) in the southwestern Barents Sea (Fig. 5c). Note that as RICEs can be related to anomalous trends in more than one driver, ratios can add up to more than 100 %. The average movement of the sea ice edge during RICEs is provided in the legend.
4.1 Forcing of rapid ice change events
To understand and possibly predict RICEs and their impacts, it is essential to identify the underlying mechanisms. There are no significant differences between ice growth and ice loss events, and the forcing is therefore evaluated for ice growth and ice loss events combined. There are also no systematic changes in the relative importance of the drivers during the simulations, suggesting that the forcing of RICEs is unaffected by the mean sea ice state. Numbers are presented for CESM-LE, but the relative importance of the different drivers is similar for CESM-2C (Fig. 4). Based on previous literature we consider three main drivers.
-
Ocean heat transport (OHT). Previous studies have found a strong influence of ocean heat transport through the Barents Sea Opening on sea ice variability, with stronger (weaker) heat import leading to less (more) sea ice (Schlichtholz, 2011; Årthun et al., 2012; Docquier et al., 2021). In line with these findings, we find ocean heat transport to be the most dominant driver of rapid ice changes. A total of 79 % of all RICEs in CESM-LE exhibit a simultaneous trend in ocean heat transport that exceeds 1 standard deviation (Fig. 4). For 5-year ocean heat transport trends the standard deviation is 5.8 TW yr−1. In comparison, the increase in ocean heat transport needed to induce the observed sea ice loss in the Barents Sea since 1979 is approximately 1 TW yr−1 (Li et al., 2017).
-
Sea ice transport (ITN, ITE). An increase (decrease) in ice import can be associated with a growing (decreasing) sea ice cover, both via direct import and influences on local ice formation via stratification changes (Kwok, 2009; Lind et al., 2018). This is the case in 33 % and 32 % of the events for the northern and eastern gateway, respectively (Fig. 4). The threshold of 1 standard deviation is 7.4×10⁴ km2 yr−2 for the northern and 4.3×10⁴ km2 yr−2 for the eastern gateway. This implies that even the strong increase in observed ice import through the northern gateway between 1999 and 2003 (6.5×10⁴ km2 yr−2; Kwok, 2009) would be too small to be considered relevant for triggering a RICE.
-
Surface heat fluxes (SHFs). Changes in atmospheric circulation and associated heat and moisture transport can also influence the sea ice cover (Woods and Caballero, 2016; Liu et al., 2022). In support of this, our results show a negative trend in sea level pressure over the Fram Strait during ice loss events (Fig. 5a) which corresponds to strengthening westerly winds over the Barents Sea Opening and southerly winds over the central and northern Barents Sea. As a result, surface air temperatures increase in the northern Barents Sea (Fig. 5b) during ice loss. Warmer westerly winds also lead to reduced ocean heat loss in the ice-free southern Barents Sea, whereas more heat is lost in the northern Barents Sea as a result of more open-ocean area (Fig. 5c; Skagseth et al., 2020). Considering surface heat fluxes in the permanently ice-free southwestern Barents Sea (71–76∘ N, 16–38∘ E) as a fingerprint of atmospheric forcing of ocean temperature and, hence, sea ice (Schlichtholz and Houssais, 2011), we find 65 % of the RICEs to be associated with anomalous trends in surface heat fluxes, with decreasing (increasing) ocean heat loss corresponding to SIA decline (increase).
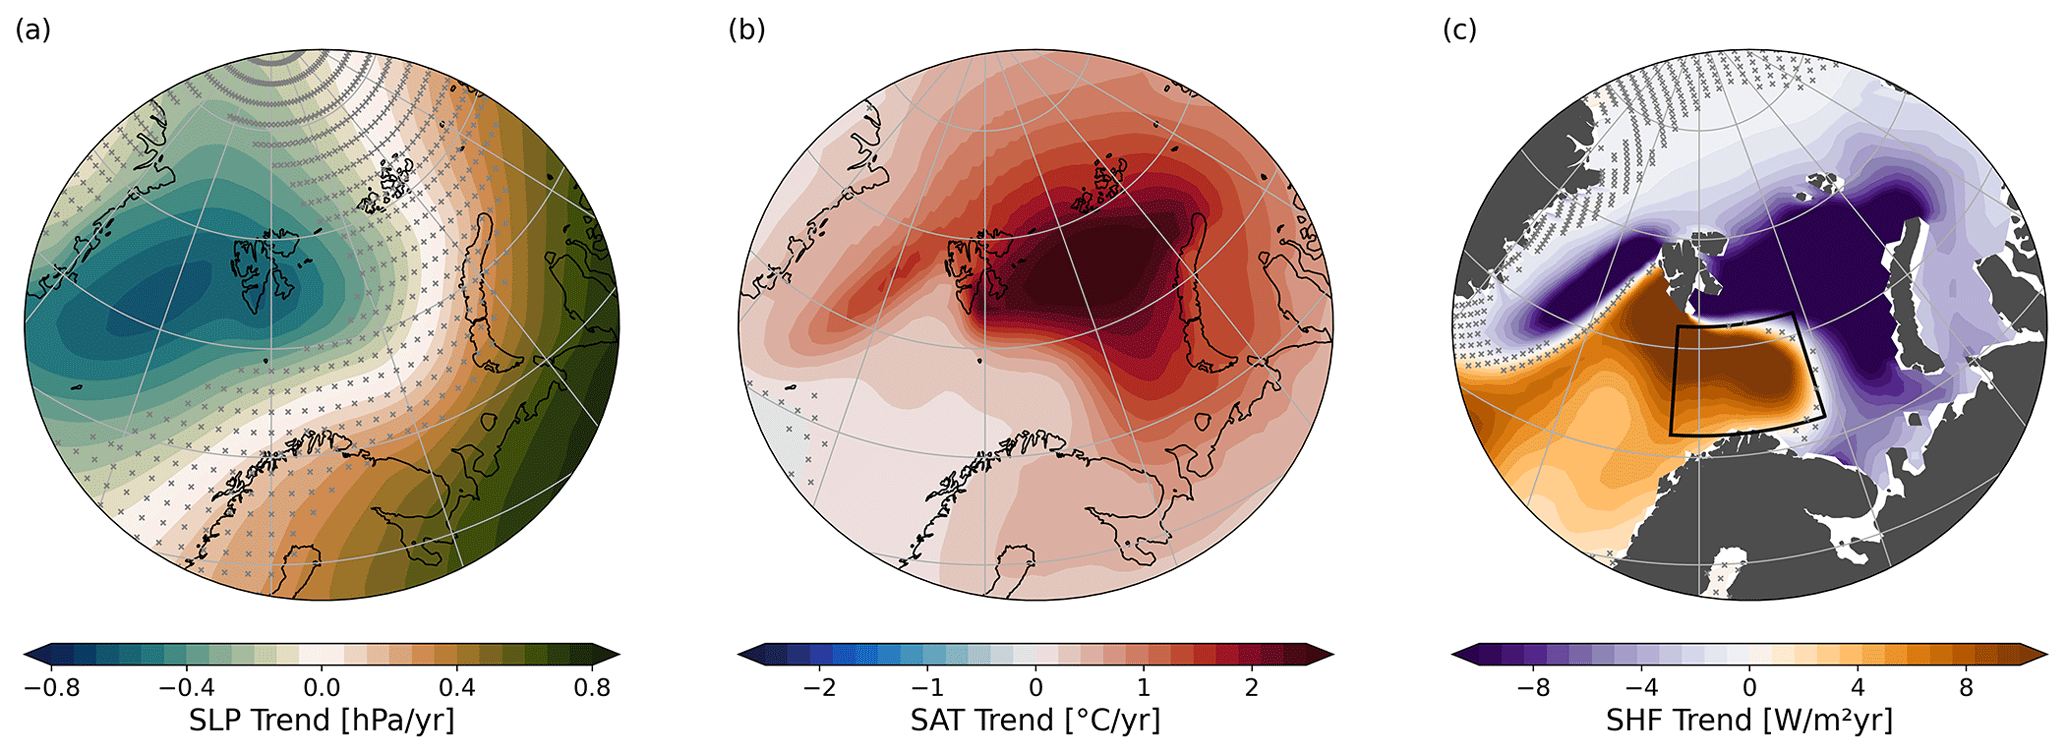
Figure 5Linear trend of (a) sea level pressure (SLP), (b) surface air temperature (SAT), and (c) surface heat flux (SHF) anomalies during ice loss events, averaged over all events. Ocean heat loss is defined as negative, meaning that positive (negative) anomalies refer to less (more) heat loss. The black box indicates the area for averaging SHF to assess its influence on RICEs. Crosses indicate areas where the trend is not statistically significant at the 95 % confidence level.
Although the different drivers have been assessed and quantified individually, they are to some extent interconnected. For example, ice loss events are associated with an anomalous atmospheric circulation (Fig. 5a) that will influence ocean heat transport (Herbaut et al., 2015), surface heat fluxes (Skagseth et al., 2020), and SIA transport (Kwok, 2009). A total of 51 % of the RICEs exhibit significant trends in both ocean heat transport and surface heat fluxes, emphasizing their interconnection. Most of the variability in ocean heat transport on interannual to decadal timescales is a result of varying volume transport, which is highly influenced by atmospheric circulation patterns (Muilwijk et al., 2018; Årthun et al., 2019). A detailed analysis of these relationships is not presented here. However, removing (by regression) the linear signal associated with ocean heat transport from time series of regional winds over the Barents Sea suggests that atmospheric circulation (wind) anomalies are mainly affecting the sea ice cover through changes in ocean heat transport, consistent with the findings of Lien et al. (2017).
The above analysis identifies the fraction of RICEs that are associated with individual drivers. We have also investigated whether the magnitude of individual RICEs relates to the strength of the corresponding trends in any of the drivers (or their linear combination) but find no significant relationships. We note that a clear relationship exists in CESM-LE between trends (5–30 years) in SIA and ocean heat transport if all trends are considered and not just those associated with RICEs (Årthun et al., 2019; Dörr et al., 2021). Our results thus suggest that the occurrence of RICEs can possibly be predicted, but not their magnitude, although more sophisticated approaches (e.g., extreme event attribution; Philip et al., 2020) should be explored with respect to the latter.
The occurrence of rapid sea ice changes is further studied in a suite of CMIP6 models. Figure 6 shows the distribution of 5-year trends from the CMIP6 models under two emission scenarios. Most models show a distribution of trends that is fairly similar to, yet slightly narrower than, CESM. An exception is CanESM5, which simulates much weaker trends than the other models, likely as a result of the low average SIA in this model after 2030 (Fig. 6). During the 21st century, SIA decreases in all model simulations, and the distributions become more confined to weaker trends. Although the models agree on this general behavior, the future changes in trends differ as a result of the different rates of SIA decline in each model. After 2050, simulated trends are generally stronger in the low-warming SSP126 simulations than in the high-warming SSP585 simulations, consistent with a larger SIA in the former. Only the MPI-ESM1-2-LR simulates a stabilization of the SIA in the Barents Sea under a low-emission scenario (in agreement with CESM-2C), whereas the other CMIP6 models show practically ice-free conditions at the end of the 21st century even under SSP126 (see also Årthun et al., 2021).
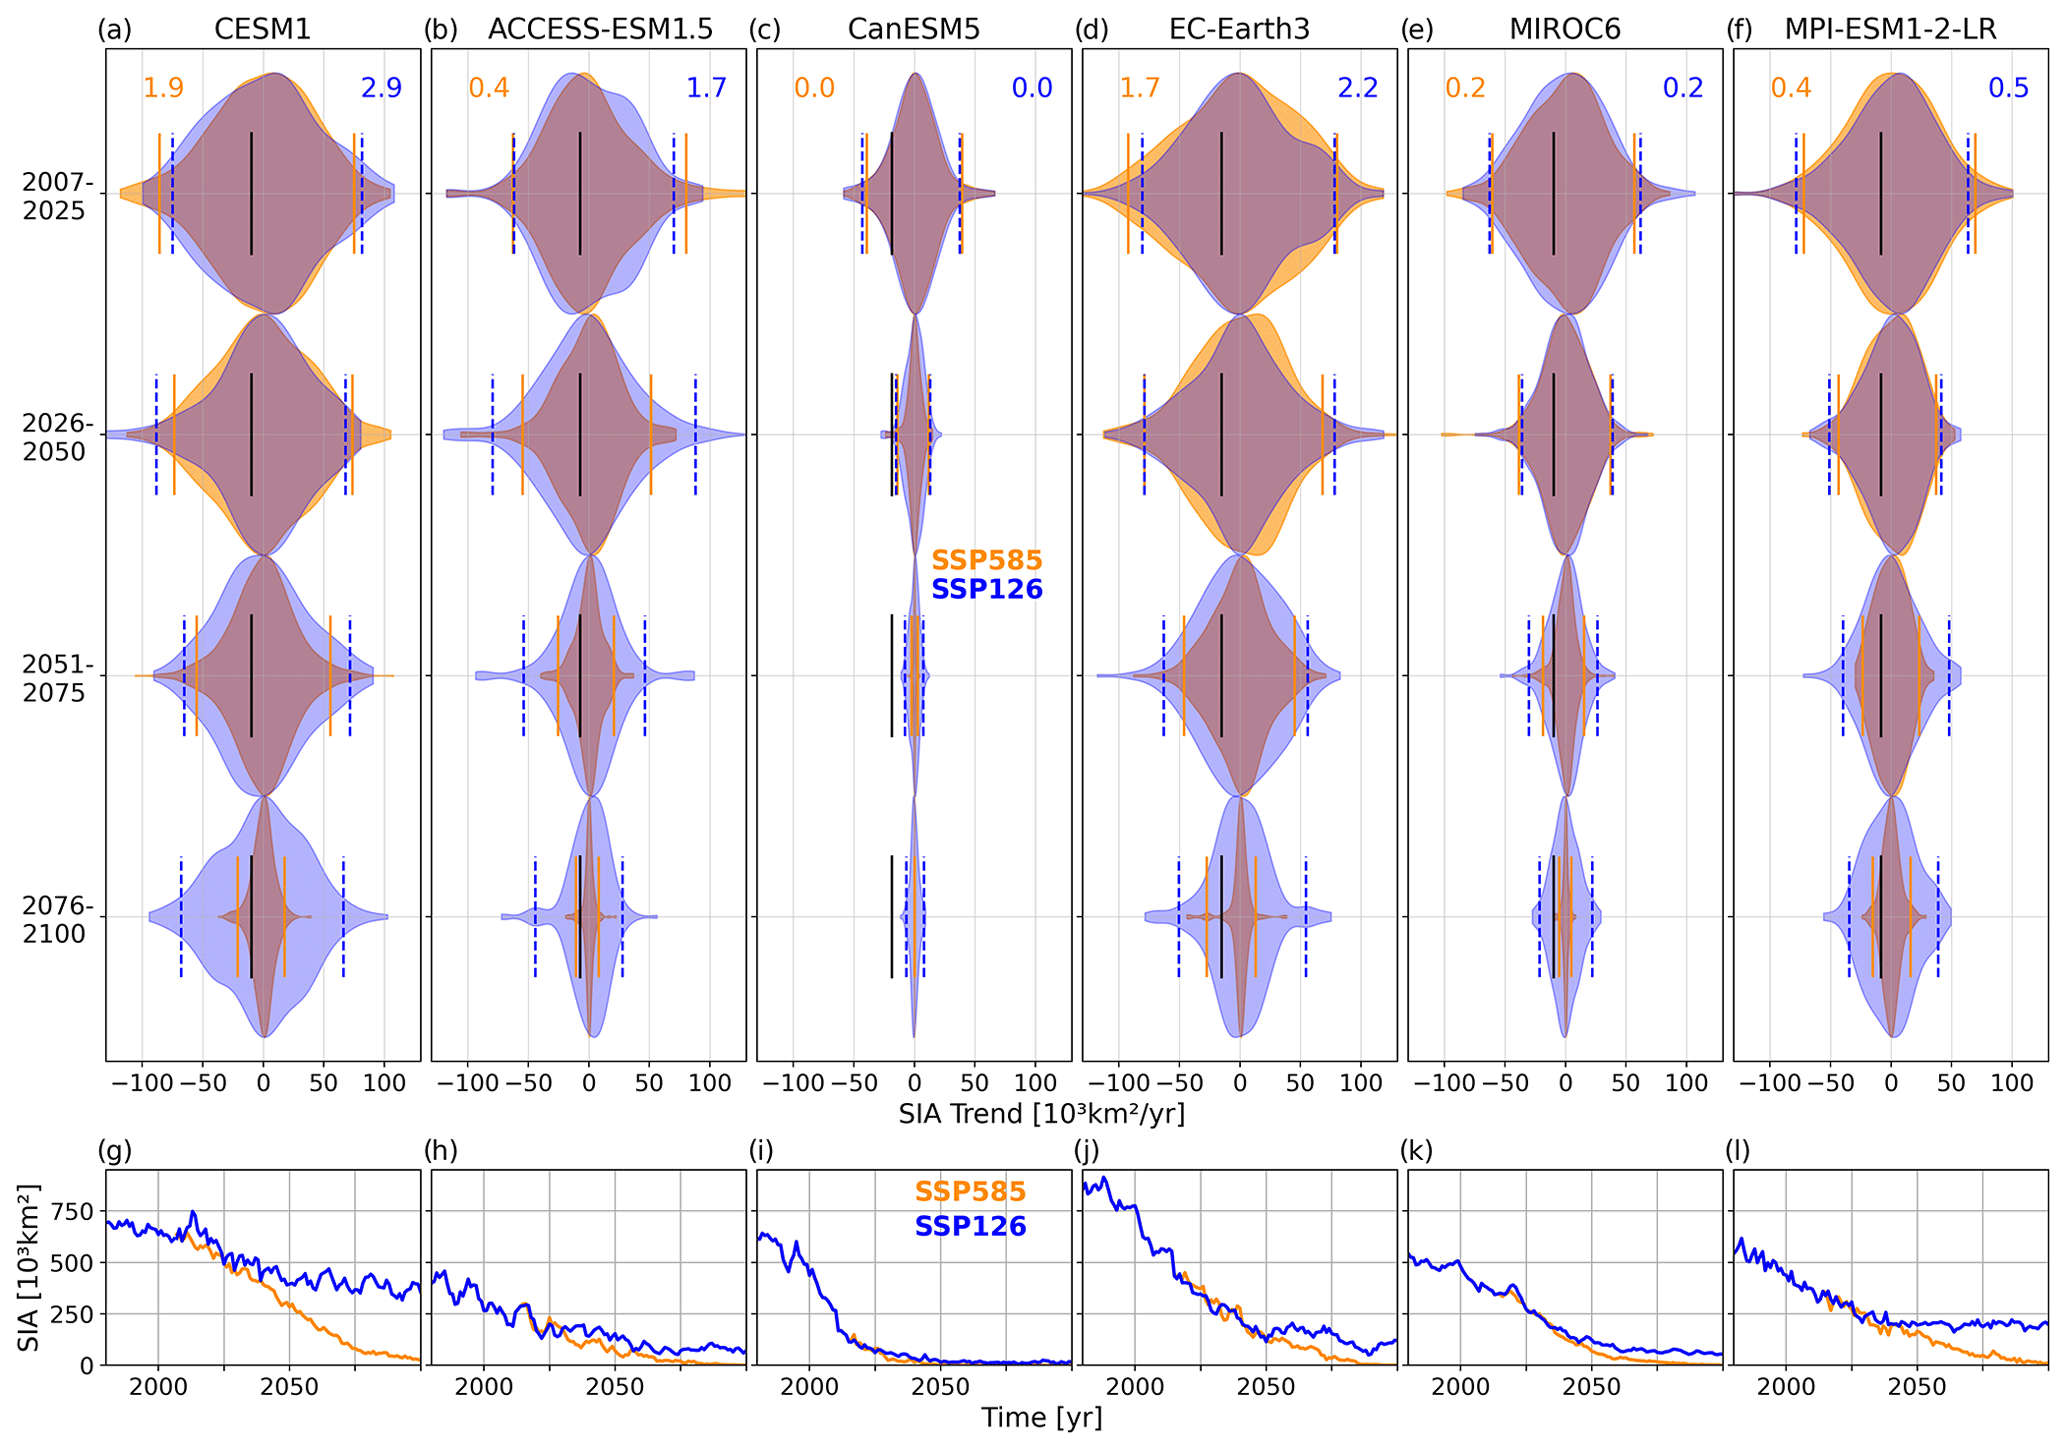
Figure 6Violin plots showing the distribution of 5-year trends of SIA during different episodes of the 21st century in different model simulations. The orange and blue vertical lines indicate the 95th percentile for SSP585 and SSP126, respectively. The black vertical lines indicate the externally forced ice decline (strongest 30-year trend of the ensemble mean) of the respective SSP585 experiment. The number of RICEs per ensemble member for the SSP585 (left) and SSP126 (right) experiment is indicated in the top panels. The bottom panels show the ensemble mean SIA in the different simulations. For CESM the colors indicate CESM-LE (RCP8.5; orange) and CESM-2C (blue).
The different mean states in the models are also reflected in the number of RICEs (provided in the top panels in Fig. 6). The CMIP6 model that simulates the largest average SIA in the Barents Sea, EC-Earth3, also simulates the most RICEs per ensemble member. However, this model exhibits a very strong externally forced (ensemble mean) ice decline (Fig. 6j), which leads to RICEs in EC-Earth3 being weaker relative to the externally forced ice loss than in CESM. In contrast, RICEs in ACCESS-ESM1.5 are much stronger than the externally forced ice loss (Fig. 6b, h). RICEs can also be found in MPI-ESM and MIROC6, which simulate average ice loss similar to that in CESM-LE. Only CanESM simulates no RICEs whatsoever in either experiment. This model is characterized by a very strong externally forced ice loss (Fig. 6i), resulting in ice-free conditions as early as 2025. CanESM5 is also the model with the weakest internal variability, evident from the very narrow distribution of sea ice trends (Fig. 6c; also manifested in a narrow ensemble spread in SIA). The weak internal variability in this model has also been noted in other studies (Bonnet et al., 2021). We thus conclude that although CESM seems to represent an upper bound for RICEs in the Barents Sea, they generally occur also in other CMIP6 models. Model differences in the occurrence of RICEs are closely related to average sea ice conditions and the strength of internal variability.
The Barents Sea is the region of most intense winter sea ice loss, and future projections show a continued decline towards ice-free conditions by the end of this century (Fig. 1; Onarheim and Årthun, 2017). Internal variability of the climate system leads to large interannual and decadal fluctuations that are superimposed on this long-term trend (England et al., 2019). A visible manifestation of these internally driven fluctuations is the occurrence of large, abrupt changes in the sea ice cover. These rapid ice change events (RICEs) are several times stronger than the externally forced ice loss and can hence lead to an acceleration, pausing, or reverse of the ice decline. In this study we present the first investigation of RICEs in the Barents Sea. We use outputs from two ensemble experiments from the CESM and multi-member CMIP6 models to investigate the future evolution of winter sea ice variability in the Barents Sea under different emission scenarios. Although CESM simulates the largest number of RICEs, possibly representing an upper bound for their occurrence, RICEs are also found at similar rates in most other models. The occurrence of RICEs is directly related to average sea ice conditions and hence to future emissions.
RICEs have previously been studied in future climate simulations for the pan-Arctic in summer. Holland et al. (2006) and Auclair and Tremblay (2018) find most of those pan-Arctic events to be associated with anomalies in ocean heat transport, which is consistent with our results for the Barents Sea. In addition to ocean heat transport we also investigate the influence of other variables and find a substantial contribution from surface heat fluxes and, to a smaller extent, sea ice area transport. Our findings are thus largely consistent with the results from studies focusing on interannual variability in the Barents Sea (Kwok, 2009; Schlichtholz, 2011; Årthun et al., 2012; Nakanowatari et al., 2014; Skagseth et al., 2020). We emphasize that this is not a priori granted and note that distinct mechanisms have been identified for interannual variability and long-term trends in ocean heat transport into the Barents Sea (Wang et al., 2019). Venegas and Mysak (2000) also found different dominant mechanisms of sea ice variability in the Barents Sea for different timescales. We find no systematic change in the underlying drivers over time, between the emission scenarios, or between ice growth and loss events. From this we infer that the underlying processes of driving rapid ice changes in the Barents Sea remain unaffected by global warming and the retreating sea ice.
In this study we have shown the importance of rapid ice changes in the Barents Sea. RICEs are especially important due to the substantial movements of the ice edge, which, as the border between ice-covered and open ocean, is of large importance for climate (e.g., Zhang et al., 2018) and ecosystem processes (e.g., Fossheim et al., 2015). Identifying the leading drivers of RICEs is therefore crucial for understanding and predicting such events and their associated broad impacts. When the Barents Sea approaches ice-free conditions, the area experiencing rapid sea ice changes will retreat past the boundaries of the Barents Sea into the central Arctic and the Kara Sea, a visible change associated with future Atlantification (Fig. 1f; Dörr et al., 2021; Shu et al., 2021). Our results could therefore provide important insight into future sea ice variability in other parts of the Arctic.
All data in this study are publicly available. Output from CESM is available via the Earth System Grid: https://doi.org/10.5065/d6j101d1 (Kay and Deser, 2016). CMIP6 data are available from the Earth System Grid Federation (ESGF) (CMIP, 2023; e.g., https://esgf-node.llnl.gov/search/cmip6). Observed Arctic SICs are available from https://doi.org/10.7265/jj4s-tq79 (Walsh et al., 2019). SST from ERA5 is available through the Copernicus Climate Change Service: https://doi.org/10.24381/cds.f17050d7 (Hersbach et al., 2019).
MÅ conceived the study. OR performed the analysis, produced the figures, and wrote the paper. MÅ and JSD contributed to improving the manuscript. All authors contributed to the method design, result analysis, and reviewing of the manuscript.
The contact author has declared that none of the authors has any competing interests.
Publisher's note: Copernicus Publications remains neutral with regard to jurisdictional claims in published maps and institutional affiliations.
We thank David B. Bonan, Lars Henrik Smedsrud, and Anne Britt Sandø for input and suggestions.
This research has been supported by the Norges Forskningsråd Nansen Legacy (grant no. 276730) and the Trond Mohn Foundation (grant no. BFS2018TMT01).
This paper was edited by Jari Haapala and reviewed by two anonymous referees.
Årthun, M., Eldevik, T., Smedsrud, L. H., Skagseth, Ø., and Ingvaldsen, R. B.: Quantifying the Influence of Atlantic Heat on Barents Sea Ice Variability and Retreat, J. Climate, 25, 4736–4743, https://doi.org/10.1175/JCLI-D-11-00466.1, 2012. a, b, c, d
Årthun, M., Eldevik, T., and Smedsrud, L. H.: The Role of Atlantic Heat Transport in Future Arctic Winter Sea Ice Loss, J. Climate, 32, 3327–3341, https://doi.org/10.1175/JCLI-D-18-0750.1, 2019. a, b, c, d, e
Årthun, M., Onarheim, I. H., Dörr, J., and Eldevik, T.: The Seasonal and Regional Transition to an Ice-Free Arctic, Geophys. Res. Lett., 48, e2020GL090825, https://doi.org/10.1029/2020GL090825, 2021. a, b
Auclair, G. and Tremblay, L. B.: The Role of Ocean Heat Transport in Rapid Sea Ice Declines in the Community Earth System Model Large Ensemble, J. Geophys. Res.-Oceans, 123, 8941–8957, https://doi.org/10.1029/2018JC014525, 2018. a, b, c, d
Bonan, D. B., Lehner, F., and Holland, M. M.: Partitioning uncertainty in projections of Arctic sea ice, Environmental Research Letters, 16, https://doi.org/10.1088/1748-9326/abe0ec, 2021a. a, b, c
Bonan, D. B., Schneider, T., Eisenman, I., and Wills, R. C. J.: Constraining the Date of a Seasonally Ice-Free Arctic Using a Simple Model, Geophys. Res. Lett., 48, e2021GL094309, https://doi.org/10.1029/2021GL094309, 2021b. a
Bonnet, R., Swingedouw, D., Gastineau, G., Boucher, O., Deshayes, J., Hourdin, F., Mignot, J., Servonnat, J., and Sima, A.: Increased risk of near term global warming due to a recent AMOC weakening, Nat. Commun., 12, 6108, https://doi.org/10.1038/s41467-021-26370-0, 2021. a
CMIP: Coupled Model Intercomparison Project Phase 6 (CMIP6) data, Working Group on Coupled Modeling of the World Climate Research Programme, Earth System Grid Federation [data set], https://esgf-node.llnl.gov/search/cmip6, last access: March 2023. a
Deser, C., Lehner, F., Rodgers, K. B., Ault, T., Delworth, T. L., DiNezio, P. N., Fiore, A., Frankignoul, C., Fyfe, J. C., Horton, D. E., Kay, J. E., Knutti, R., Lovenduski, N. S., Marotzke, J., McKinnon, K. A., Minobe, S., Randerson, J., Screen, J. A., Simpson, I. R., and Ting, M.: Insights from Earth system model initial-condition large ensembles and future prospects, Nat. Clim. Change, 10, 277–286, https://doi.org/10.1038/s41558-020-0731-2, 2020. a
Docquier, D., Koenigk, T., Fuentes-Franco, R., Karami, M. P., and Ruprich-Robert, Y.: Impact of ocean heat transport on the Arctic sea-ice decline: a model study with EC-Earth3, Clim. Dynam., 56, 1407–1432, https://doi.org/10.1007/s00382-020-05540-8, 2021. a, b
Dörr, J., Årthun, M., Eldevik, T., and Madonna, E.: Mechanisms of regional winter sea-ice variability in a warming Arctic, J. Climate, 34, 8635–8653, https://doi.org/10.1175/JCLI-D-21-0149.1, 2021. a, b, c, d
Döscher, R., Acosta, M., Alessandri, A., Anthoni, P., Arsouze, T., Bergman, T., Bernardello, R., Boussetta, S., Caron, L.-P., Carver, G., Castrillo, M., Catalano, F., Cvijanovic, I., Davini, P., Dekker, E., Doblas-Reyes, F. J., Docquier, D., Echevarria, P., Fladrich, U., Fuentes-Franco, R., Gröger, M., v. Hardenberg, J., Hieronymus, J., Karami, M. P., Keskinen, J.-P., Koenigk, T., Makkonen, R., Massonnet, F., Ménégoz, M., Miller, P. A., Moreno-Chamarro, E., Nieradzik, L., van Noije, T., Nolan, P., O'Donnell, D., Ollinaho, P., van den Oord, G., Ortega, P., Prims, O. T., Ramos, A., Reerink, T., Rousset, C., Ruprich-Robert, Y., Le Sager, P., Schmith, T., Schrödner, R., Serva, F., Sicardi, V., Sloth Madsen, M., Smith, B., Tian, T., Tourigny, E., Uotila, P., Vancoppenolle, M., Wang, S., Wårlind, D., Willén, U., Wyser, K., Yang, S., Yepes-Arbós, X., and Zhang, Q.: The EC-Earth3 Earth system model for the Coupled Model Intercomparison Project 6, Geosci. Model Dev., 15, 2973–3020, https://doi.org/10.5194/gmd-15-2973-2022, 2022. a
England, M., Jahn, A., and Polvani, L.: Nonuniform Contribution of Internal Variability to Recent Arctic Sea Ice Loss, J. Climate, 32, 4039–4053, https://doi.org/10.1175/JCLI-D-18-0864.1, 2019. a, b, c
England, M. R., Eisenman, I., Lutsko, N. J., and Wagner, T. J. W.: The Recent Emergence of Arctic Amplification, Geophys. Res. Lett., 48, e2021GL094086, https://doi.org/10.1029/2021GL094086, 2021. a
Fossheim, M., Primicerio, R., Johannesen, E., Ingvaldsen, R. B., Aschan, M. M., and Dolgov, A. V.: Recent warming leads to a rapid borealization of fish communities in the Arctic, Nat. Clim. Change, 5, 673–677, https://doi.org/10.1038/nclimate2647, 2015. a, b
Herbaut, C., Houssais, M.-N., Close, S., and Blaizot, A.-C.: Two wind-driven modes of winter sea ice variability in the Barents Sea, Deep-Sea Res. Pt. I, 106, 97–115, https://doi.org/10.1016/j.dsr.2015.10.005, 2015. a
Hersbach, H., Bell, B., Berrisford, P., Biavati, G., Horányi, A., Muñoz Sabater, J., Nicolas, J., Peubey, C., Radu, R., Rozum, I., Schepers, D., Simmons, A., Soci, C., Dee, D., and Thépaut, J.-N.: ERA5 monthly averaged data on pressure levels from 1959 to present, Copernicus Climate Change Service (C3S) Climate Data Store (CDS) [data set], https://doi.org/10.24381/cds.f17050d7, 2019. a, b
Holland, M. M., Bitz, C. M., and Tremblay, B.: Future abrupt reductions in the summer Arctic sea ice, Geophys. Res. Lett., 33, L23503, https://doi.org/10.1029/2006GL028024, 2006. a, b
Hurrell, J. W., Holland, M. M., Gent, P. R., Ghan, S., Kay, J. E., Kushner, P. J., Lamarque, J.-F., Large, W. G., Lawrence, D., Lindsay, K., Lipscomb, W. H., Long, M. C., Mahowald, N., Marsh, D. R., Neale, R. B., Rasch, P., Vavrus, S., Vertenstein, M., Bader, D., Collins, W. D., Hack, J. J., Kiehl, J., and Marshall, S.: The Community Earth System Model: A Framework for Collaborative Research, B. Am. Meteorol. Soc., 94, 1339–1360, https://doi.org/10.1175/BAMS-D-12-00121.1, 2013. a
Jahn, A., Kay, J. E., Holland, M. M., and Hall, D. M.: How predictable is the timing of a summer ice-free Arctic?, Geophys. Res. Lett., 43, 9113–9120, https://doi.org/10.1002/2016GL070067, 2016. a
Kay, J. and Deser, C.: The Community Earth System Model (CESM) Large Ensemble Projec, UCAR/NCAR Climate Data Gateway [data set], https://doi.org/10.5065/d6j101d1, 2016. a
Kay, J. E., Deser, C., Phillips, A., Mai, A., Hannay, C., Strand, G., Arblaster, J. M., Bates, S. C., Danabasoglu, G., Edwards, J., Holland, M., Kushner, P., Lamarque, J.-F., Lawrence, D., Lindsay, K., Middleton, A., Munoz, E., Neale, R., Oleson, K., Polvani, L., and Vertenstein, M.: The Community Earth System Model (CESM) Large Ensemble Project: A Community Resource for Studying Climate Change in the Presence of Internal Climate Variability, B. Am. Meteorol. Soc., 96, 1333–1349, https://doi.org/10.1175/BAMS-D-13-00255.1, 2015. a
Kwok, R.: Outflow of Arctic Ocean Sea Ice into the Greenland and Barents Seas: 1979–2007, J. Climate, 22, 2438–2457, https://doi.org/10.1175/2008JCLI2819.1, 2009. a, b, c, d, e
Kwok, R.: Arctic sea ice thickness, volume, and multiyear ice coverage: losses and coupled variability (1958–2018), Environm. Res. Lett., 13, 105005, https://doi.org/10.1088/1748-9326/aae3ec, 2018. a
Labe, Z., Magnusdottir, G., and Stern, H.: Variability of Arctic sea ice thickness using PIOMAS and the CESM large ensemble, J, Climate, 31, 3233–3247, https://doi.org/10.1175/JCLI-D-17-0436.1, 2018. a
Lamarque, J.-F., Bond, T. C., Eyring, V., Granier, C., Heil, A., Klimont, Z., Lee, D., Liousse, C., Mieville, A., Owen, B., Schultz, M. G., Shindell, D., Smith, S. J., Stehfest, E., Van Aardenne, J., Cooper, O. R., Kainuma, M., Mahowald, N., McConnell, J. R., Naik, V., Riahi, K., and van Vuuren, D. P.: Historical (1850–2000) gridded anthropogenic and biomass burning emissions of reactive gases and aerosols: methodology and application, Atmos. Chem. Phys., 10, 7017–7039, https://doi.org/10.5194/acp-10-7017-2010, 2010. a
Lawrence, D. M., Slater, A. G., Tomas, R. A., Holland, M. M., and Deser, C.: Accelerated Arctic land warming and permafrost degradation during rapid sea ice loss, Geophys. Res. Lett., 35, L11506, https://doi.org/10.1029/2008GL033985, 2008. a
Li, D., Zhang, R., and Knutson, T. R.: On the discrepancy between observed and CMIP5 multi-model simulated Barents Sea winter sea ice decline, Nat. Commun., 8, 14991, https://doi.org/10.1038/ncomms14991, 2017. a
Lien, V. S., Schlichtholz, P., Øystein Skagseth, and Vikebø, F. B.: Wind-Driven Atlantic Water Flow as a Direct Mode for Reduced Barents Sea Ice Cover, J. Climate, 300, 803–812, https://doi.org/10.1175/JCLI-D-16-0025.1, 2017. a
Lind, S., Ingvaldsen, R. B., and Furevik, T.: Arctic warming hotspot in the northern Barents Sea linked to declining sea-ice import, Nat. Clim. Change, 8, 634–639, https://doi.org/10.1038/s41558-018-0205-y, 2018. a, b
Liu, Z., Risi, C., Codron, F., Jian, Z., Wei, Z., He, X., Poulsen, C. J., Wang, Y., Chen, D., Ma, W., Cheng, Y., and Bowen, G. J.: Atmospheric forcing dominates winter Barents-Kara sea ice variability on interannual to decadal time scales, P. Natl. Acad. Sci. USA, 119, e2120770119, https://doi.org/10.1073/pnas.2120770119, 2022. a, b
Mauritsen, T., Bader, J., Becker, T., Behrens, J., Bittner, M., Brokopf, R., Brovkin, V., Claussen, M., Crueger, T., Esch, M., Fast, I., Fiedler, S., Fläschner, D., Gayler, V., Giorgetta, M., Goll, D. S., Haak, H., Hagemann, S., Hedemann, C., Hohenegger, C., Ilyina, T., Jahns, T., Jimenéz-de-la Cuesta, D., Jungclaus, J., Kleinen, T., Kloster, S., Kracher, D., Kinne, S., Kleberg, D., Lasslop, G., Kornblueh, L., Marotzke, J., Matei, D., Meraner, K., Mikolajewicz, U., Modali, K., Möbis, B., Müller, W. A., Nabel, J. E. M. S., Nam, C. C. W., Notz, D., Nyawira, S.-S., Paulsen, H., Peters, K., Pincus, R., Pohlmann, H., Pongratz, J., Popp, M., Raddatz, T. J., Rast, S., Redler, R., Reick, C. H., Rohrschneider, T., Schemann, V., Schmidt, H., Schnur, R., Schulzweida, U., Six, K. D., Stein, L., Stemmler, I., Stevens, B., von Storch, J.-S., Tian, F., Voigt, A., Vrese, P., Wieners, K.-H., Wilkenskjeld, S., Winkler, A., and Roeckner, E.: Developments in the MPI-M Earth System Model version 1.2 (MPI-ESM1.2) and Its Response to Increasing CO2, J. Adv. Model. Earth Sy., 11, 998–1038, https://doi.org/10.1029/2018MS001400, 2019. a
Melia, N., Haines, K., and Hawkins, E.: Sea ice decline and 21st century trans-Arctic shipping routes, Geophys. Res. Lett., 43, 9720–9728, https://doi.org/10.1002/2016GL069315, 2016. a
Meredith, M., Sommerkorn, M., Cassotta, S., Derksen, C., Ekaykin, A., Hollowed, A., Kofinas, G., Mackintosh, A., Melbourne-Thomas, J., Muelbert, M., Ottersen, G., Pritchard, H., and Schuur, E.: Polar Regions, in: IPCC Special Report on the Ocean and Cryosphere in a Changing Climate, edited by: Pörtner, H.-O., Roberts, D. C., Masson-Delmotte, V., Zhai, P., Tignor, M., Poloczanska, E., Mintenbeck, K., Alegría, A., Nicolai, M., Okem, A., Petzold, J., Rama, B., and Weyer, N. M., Cambridge University Press, Cambridge, UK and New York, NY, USA, 203–320, https://doi.org/10.1017/9781009157964.005, 2019. a
Milinski, S., Maher, N., and Olonscheck, D.: How large does a large ensemble need to be?, Earth Syst. Dynam., 11, 885–901, https://doi.org/10.5194/esd-11-885-2020, 2020. a
Moss, R. H., Edmonds, J. A., Hibbard, K. A., Manning, M. R., Rose, S. K., van Vuuren, D. P., Carter, T. R., Emori, S., Kainuma, M., Kram, T., Meehl, G. A., Mitchell, J. F. B., Nakicenovic, N., Riahi, K., Smith, S. J., Stouffer, R. J., Thomson, A. M., Weyant, J. P., and Wilbanks, T. J.: The next generation of scenarios for climate change research and assessment, Nature, 463, 747–756, https://doi.org/10.1038/nature08823, 2010. a
Muilwijk, M., Smedsrud, L. H., Ilicak, M., and Drange, H.: Atlantic Water Heat Transport Variability in the 20th Century Arctic Ocean From a Global Ocean Model and Observations, J. Geophys. Res.-Oceans, 123, 8159–8179, https://doi.org/10.1029/2018JC014327, 2018. a
Nakanowatari, T., Sato, K., and Inoue, J.: Predictability of the Barents Sea Ice in Early Winter: Remote Effects of Oceanic and Atmospheric Thermal Conditions from the North Atlantic, J. Climate, 27, 8884–8901, https://doi.org/10.1175/JCLI-D-14-00125.1, 2014. a, b
Notz, D. and SIMIP Community: Arctic Sea Ice in CMIP6, Geophys. Res. Lett., 47, e2019GL086749, https://doi.org/10.1029/2019GL086749, 2020. a
Onarheim, I. H. and Årthun, M.: Toward an ice-free Barents Sea, Geophys. Res. Lett., 44, 8387–8395, https://doi.org/10.1002/2017GL074304, 2017. a, b, c
Onarheim, I. H., Eldevik, T., Smedsrud, L. H., and Stroeve, J. C.: Seasonal and Regional Manifestation of Arctic Sea Ice Loss, J. Climate, 31, 4917–4932, https://doi.org/10.1175/JCLI-D-17-0427.1, 2018. a
O'Neill, B. C., Kriegler, E., Ebi, K. L., Kemp-Benedict, E., Riahi, K., Rothman, D. S., van Ruijven, B. J., van Vuuren, D. P., Birkmann, J., Kok, K., Levy, M., and Solecki, W.: The roads ahead: Narratives for shared socioeconomic pathways describing world futures in the 21st century, Global Environ. Chang., 42, 169–180, https://doi.org/10.1016/j.gloenvcha.2015.01.004, 2017. a
Park, T.-W., Deng, Y., Cai, M., Jeong, J.-H., and Zhou, R.: A dissection of the surface temperature biases in the Community Earth System Model, Clim. Dynam., 43, 2043–2059, https://doi.org/10.1007/s00382-013-2029-9, 2014. a
Philip, S., Kew, S., van Oldenborgh, G. J., Otto, F., Vautard, R., van der Wiel, K., King, A., Lott, F., Arrighi, J., Singh, R., and van Aalst, M.: A protocol for probabilistic extreme event attribution analyses, Adv. Stat. Clim. Meteorol. Oceanogr., 6, 177–203, https://doi.org/10.5194/ascmo-6-177-2020, 2020. a
Sanderson, B. M., Xu, Y., Tebaldi, C., Wehner, M., O'Neill, B., Jahn, A., Pendergrass, A. G., Lehner, F., Strand, W. G., Lin, L., Knutti, R., and Lamarque, J. F.: Community climate simulations to assess avoided impacts in 1.5 and 2 °C futures, Earth Syst. Dynam., 8, 827–847, https://doi.org/10.5194/esd-8-827-2017, 2017. a
Sandø, A. B., Mousing, E. A., Budgell, W. P., Hjøllo, S. S., Skogen, M. D., and Ådlandsvik, B.: Barents Sea plankton production and controlling factors in a fluctuating climate, ICES J. Mar. Sci., 78, 1999–2016, https://doi.org/10.1093/icesjms/fsab067, 2021. a
Schauer, U. and Beszczynska-Möller, A.: Problems with estimation and interpretation of oceanic heat transport – conceptual remarks for the case of Fram Strait in the Arctic Ocean, Ocean Sci., 5, 487–494, https://doi.org/10.5194/os-5-487-2009, 2009. a
Schlichtholz, P.: Influence of oceanic heat variability on sea ice anomalies in the Nordic Seas, Geophys. Res. Lett., 38, L05705, https://doi.org/10.1029/2010GL045894, 2011. a, b, c
Schlichtholz, P. and Houssais, M.-N.: Forcing of oceanic heat anomalies by air-sea interactions in the Nordic Seas area, J. Geophys. Res.-Oceans, 116, C01006, https://doi.org/10.1029/2009JC005944, 2011. a
Serreze, M. C., Barrett, A. P., Stroeve, J. C., Kindig, D. N., and Holland, M. M.: The emergence of surface-based Arctic amplification, The Cryosphere, 3, 11–19, https://doi.org/10.5194/tc-3-11-2009, 2009. a
Shu, Q., Wang, Q., Song, Z., and Qiao, F.: The poleward enhanced Arctic Ocean cooling machine in a warming climate, Nat. Commun., 12, 2966, https://doi.org/10.1038/s41467-021-23321-7, 2021. a
Shu, Q., Wang, Q., Årthun, M., Wang, S., Song, Z., Zhang, M., and Qiao, F.: Arctic Ocean Amplification in a warming climate in CMIP6 models, Sci. Adv., 8, eabn9755, https://doi.org/10.1126/sciadv.abn9755, 2022. a
Skagseth, O., Eldevik, T., and Årthun, M.: Reduced efficiency of the Barents Sea cooling machine, Nat. Clim. Change, 10, 661–666, https://doi.org/10.1038/s41558-020-0772-6, 2020. a, b, c
Swart, N. C., Fyfe, J. C., Hawkins, E., Kay, J. E., and Jahn, A.: Influence of internal variability on Arctic sea-ice trends, Nat. Clim. Change, 5, 86–89, https://doi.org/10.1038/nclimate2483, 2015. a
Swart, N. C., Cole, J. N. S., Kharin, V. V., Lazare, M., Scinocca, J. F., Gillett, N. P., Anstey, J., Arora, V., Christian, J. R., Hanna, S., Jiao, Y., Lee, W. G., Majaess, F., Saenko, O. A., Seiler, C., Seinen, C., Shao, A., Sigmond, M., Solheim, L., von Salzen, K., Yang, D., and Winter, B.: The Canadian Earth System Model version 5 (CanESM5.0.3), Geosci. Model Dev., 12, 4823–4873, https://doi.org/10.5194/gmd-12-4823-2019, 2019. a
Tatebe, H., Ogura, T., Nitta, T., Komuro, Y., Ogochi, K., Takemura, T., Sudo, K., Sekiguchi, M., Abe, M., Saito, F., Chikira, M., Watanabe, S., Mori, M., Hirota, N., Kawatani, Y., Mochizuki, T., Yoshimura, K., Takata, K., O'ishi, R., Yamazaki, D., Suzuki, T., Kurogi, M., Kataoka, T., Watanabe, M., and Kimoto, M.: Description and basic evaluation of simulated mean state, internal variability, and climate sensitivity in MIROC6, Geosci. Model Dev., 12, 2727–2765, https://doi.org/10.5194/gmd-12-2727-2019, 2019. a
Tsubouchi, T., Våge, K., Hansen, B., Larsen, K. M. H., Østerhus, S., Johnson, C., Jónsson, S., and Valdimarsson, H.: Increased ocean heat transport into the Nordic Seas and Arctic Ocean over the period 1993–2016, Nat. Clim. Change, 11, 21–26, https://doi.org/10.1038/s41558-020-00941-3, 2021. a
Venegas, S. A. and Mysak, L. A.: Is There a Dominant Timescale of Natural Climate Variability in the Arctic?, J. Climate, 13, 3412–3434, https://doi.org/10.1175/1520-0442(2000)013<3412:ITADTO>2.0.CO;2, 2000. a
Walsh, J. E., Fetterer, F., Scott Stewart, J., and Chapman, W. L.: A database for depicting Arctic sea ice variations back to 1850, Geograph. Rev., 107, 89–107, https://doi.org/10.1111/j.1931-0846.2016.12195.x, 2017. a, b, c, d
Walsh, J. E., Chapman, W. L., Fetterer, F., and Stewart, J. S.: Gridded Monthly Sea Ice Extent and Concentration, 1850 Onward, Version 2, Boulder, Colorado USA, NSIDC: National Snow and Ice Data Center [data set], https://doi.org/10.7265/jj4s-tq79, 2019. a
Wang, Q., Wang, X., Wekerle, C., Danilov, S., Jung, T., Koldunov, N., Lind, S., Sein, D., Shu, Q., and Sidorenko, D.: Ocean Heat Transport Into the Barents Sea: Distinct Controls on the Upward Trend and Interannual Variability, Geophys. Res. Lett., 46, 13180–13190, https://doi.org/10.1029/2019GL083837, 2019. a, b
Woods, C. and Caballero, R.: The Role of Moist Intrusions in Winter Arctic Warming and Sea Ice Decline, J. Climate, 29, 4473–4485, https://doi.org/10.1175/JCLI-D-15-0773.1, 2016. a
Zhang, P., Wu, Y., Simpson, I. R., Smith, K. L., Zhang, X., De, B., and Callaghan, P.: A stratospheric pathway linking a colder Siberia to Barents-Kara Sea sea ice loss, Sci. Adv., 4, eaat6025, https://doi.org/10.1126/sciadv.aat6025, 2018. a, b
Ziehn, T., Chamberlain, M. A., Law, R. M., Lenton, A., Bodman, R. W., Dix, M., Stevens, L., Wang, Y.-P., and Srbinovsky, J.: The Australian Earth System Model: ACCESS-ESM1.5, Journal of Southern Hemisphere Earth Systems Science, 70, 193–214, https://doi.org/10.1071/ES19035, 2020. a
- Abstract
- Introduction
- Data and methods
- Sea ice loss and variability in the Barents Sea
- Rapid sea ice changes in CESM1
- Rapid sea ice changes in CMIP6 models
- Discussion and conclusion
- Data availability
- Author contributions
- Competing interests
- Disclaimer
- Acknowledgements
- Financial support
- Review statement
- References