the Creative Commons Attribution 4.0 License.
the Creative Commons Attribution 4.0 License.
 | 23 Feb 2022
Microstructure, micro-inclusions, and mineralogy along the EGRIP (East Greenland Ice Core Project) ice core – Part 2: Implications for palaeo-mineralogy
Maria Hörhold
Tobias Erhardt
Jan Eichler
Camilla Jensen
Ilka Weikusat
Impurities in polar ice do not only allow the reconstruction of past atmospheric aerosol concentrations but also influence the physical properties of the ice. However, the localisation of impurities inside the microstructure is still under debate and little is known about the mineralogy of solid inclusions. In particular, the general mineralogical diversity throughout an ice core and the specific distribution inside the microstructure is poorly investigated; the impact of the mineralogy on the localisation of inclusions and other processes is thus hardly known. We use dust particle concentration, optical microscopy, and cryo-Raman spectroscopy to systematically locate and analyse the mineralogy of micro-inclusions in situ inside 11 solid ice samples from the upper 1340 m of the East Greenland Ice Core Project ice core. Micro-inclusions are more variable in mineralogy than previously observed and are mainly composed of mineral dust (quartz, mica, and feldspar) and sulfates (mainly gypsum). Inclusions of the same composition tend to cluster, but clustering frequency and mineralogy changes with depth. A variety of sulfates dominate the upper 900 m, while gypsum is the only sulfate in deeper samples, which however contain more mineral dust, nitrates, and dolomite. The analysed part of the core can thus be divided into two depth regimes of different mineralogy, and to a lesser degree of spatial distribution, which could originate from different chemical reactions in the ice or large-scale changes in ice cover in northeast Greenland during the mid-Holocene. The complexity of impurity mineralogy on the metre scale and centimetre scale in polar ice is still underestimated, and new methodological approaches are necessary to establish a comprehensive understanding of the role of impurities. Our results show that applying new methods to the mineralogy in ice cores and recognising its complexity, as well as the importance for localisation studies, open new avenues for understanding the role of impurities in ice cores.
- Article
(12005 KB) - Full-text XML
- Companion paper
-
Supplement
(2908 KB) - BibTeX
- EndNote


Deep ice cores from the polar ice sheets are a valuable archive of information: studying ice crystals allows the analysis of ice dynamics (e.g. Thorsteinsson et al., 1997; Faria et al., 2014; Fitzpatrick et al., 2014), while impurities and isotopes preserved in the ice enable the reconstruction of the palaeoclimate of our planet (e.g. Dahl-Jensen et al., 2013; EPICA Community Members, 2004). Impurities form solid micro-inclusions or dissolve in the ice lattice or in grain and sub-grain boundaries as snow eventually transforms into ice. Soluble impurities (in water or ice) are chemical compounds, such as Na+, Cl−, and NO, of atmospheric, marine, terrestrial, or biological origin dissolving in the lattice (Legrand and Delmas, 1988). They can originate from salts dissociated into ions (Legrand and Mayewski, 1997; Della Lunga et al., 2014) or from dissolved gases such as hydrogen peroxide (H2O2) (Legrand and Mayewski, 1997). Water-insoluble impurities are rejected from the ice lattice (Ashby, 1969; Alley et al., 1986) and range in size from sub-micrometre to hundreds of micrometres (Steffensen, 1997; Wegner et al., 2015; Simonsen et al., 2019). Micrometre-sized inclusions are called “micro-inclusions” and the focus of this study. Water-insoluble impurities normally originate from terrestrial sources and mainly consist of salts (e.g. sulfates and nitrates) and mineral dust which is abundant in elements from the crust, such as Si, Al, Ca, and Fe, and in chemical compounds, such as SiO2 or Fe2O3.
Impurities have different transport histories and originate from different atmospheric aerosols in the form of, for example, salt particles or terrestrial dust (Legrand and Mayewski, 1997; Weiss et al., 2002), and they are deposited on ice sheets. With time ice, and the impurities within, move into deeper parts of the ice column. Though the absolute concentrations are extremely low, the impurities inside the polar ice sheets are of interest for various research fields and applications. Tephra layers provide a record of local and distal volcanic eruptions and offer a chronological correlation between ice cores. The sulfate record can provide time lines and information about the atmospheric impact of volcanic eruptions. Furthermore, the isotopic and chemical composition of impurities enables the investigation of climatic and atmospheric processes of the past.
Impurities in polar ice can be measured with a variety of methods, each with certain limitations. Main differences are the state of the analysed particles (soluble or insoluble in water or ice) and the applied aggregate phase of the sample: methods analysing a liquid and thus melting the ice are, for example, ion chromatography (IC) (Cole-Dai et al., 2006), continuous flow analysis (CFA) (Röthlisberger et al., 2000a), and inductively coupled plasma mass spectrometry (McConnell et al., 2002; Erhardt et al., 2019), while laser ablation inductively coupled plasma mass spectrometry (LA-ICP-MS) (Reinhardt et al., 2001) and cryo-Raman spectroscopy (Fukazawa et al., 1998) analyse solid ice samples. Over the last decades different ice cores from Greenland and Antarctica were analysed regarding the chemistry and location of impurities, and the main results were recently summarised by Stoll et al. (2021b). While studies using optical microscopy by, for example, Kipfstuhl et al. (2006) and Faria et al. (2010) focused mainly on the location of water-insoluble particles, scanning electron microscope (SEM) coupled with energy dispersive X-ray spectroscopy (EDS) (e.g. Wolff et al., 1988; Baker et al., 2003; Barnes et al., 2003a) and LA-ICP-MS (e.g. Reinhardt et al., 2001; Della Lunga et al., 2014; Bohleber et al., 2020) studies also allowed the identification of impurities. They mainly found chlorine, sulfur and sodium at several locations, ranging from grain boundaries to filaments and the grain interior. However, these methods are limited to the investigation of elemental concentrations. Identifying the mineralogy of inclusions is however possible with Raman spectroscopy (e.g. Fukazawa et al., 1997; Ohno et al., 2005; Sakurai et al., 2011; Eichler et al., 2019) while preserving the microstructural location, a crucial aspect regarding their impact on the physical properties of the host material. Identified inclusions in Antarctic and Greenlandic ice mainly consist of terrestrial dust (e.g. quartz, feldspar, mica, hematite) and sulfates of different chemical composition (Ca, Na, Mg, K, Al) (Ohno et al., 2005; Sakurai et al., 2009, 2011; Ohno et al., 2014; Eichler et al., 2019). Calcium carbonate (CaCO3) was identified by Sakurai et al. (2009) mainly in the Last Glacial Period from the Greenland Ice Core Project (GRIP) ice core. These studies are demanding in time and cost and thus often rely on a small number of samples. The number of identified inclusions is thus limited, and the underlying processes are not fully understood yet. Developing generalisations of the mineralogy and localisation of impurities in polar ice is hence still challenging (Stoll et al., 2021b).
The impurity content plays a major role regarding the physical properties of snow, firn, and ice, such as electrical conductivity (Alley and Woods, 1996; Wolff et al., 1997), permittivity (Wilhelms et al., 1998), and mechanical properties (e.g. creep behaviour, dislocation velocity) (e.g. Jones and Glen, 1969; Dahl-Jensen and Gundestrup, 1987; Paterson, 1991; Hörhold et al., 2012). Several studies investigated the impact of impurities on the deformation of ice (e.g. Jones and Glen, 1969; Petit et al., 1987; Iliescu and Baker, 2008; Eichler et al., 2019), which in turn influences the flow of ice – a major uncertainty regarding future projections of ice sheet behaviour and solid ice discharge. This chain of processes at the micro scale resulting eventually in the large-scale deformation behaviour of ice needs to be better understood, especially in fast flowing ice, as present in ice streams. The microstructure of ice can be impacted directly by processes related to impurities such as Zener pinning (Smith, 1948; Humphreys and Hatherly, 2004) or grain boundary drag (Alley et al., 1986, 1989). These result in changes in the energy, shape, and mobility of grain boundaries. Furthermore, impurities such as micro-inclusions directly impact deformation when they form obstacles in the ice matrix and thus enhance strain localisation and the introduction of protonic defects (Glen, 1968) or the formation of dislocation lines (Weertman and Weertman, 1992). In turn, these small-scale processes can also influence climate proxies by altering the stratigraphic integrity of impurity records (Faria et al., 2010; Ng, 2021).
The mineralogy of impurities, their localisation, and the possible interplay between both certainly play a role in the interaction of impurities and ice physical properties (e.g. Jones and Glen, 1969; Paterson, 1991) and ice dynamics. Reasons for the current lack in understanding of the whereabouts of impurities in polar ice are manifold; the methodology to systematically look in parallel at localisation (as a microstructural feature) and mineralogy (as a chemical feature) of micro-inclusions has just recently been developed (e.g. Eichler et al., 2019). Commonly used methods, developed to derive (palaeo-)climate information on impurities such as CFA (e.g. Kaufmann et al., 2008), apply their analysis on melted sample water for the sake of decontamination and time constraints. In doing so, information on the phase and localisation of impurities is not considered. On the other hand, dedicated studies on localisation are spatially very limited and do not catch the overall chemistry of a certain sample. The mineralogy and its possible interplay for localisation were therefore not possible to investigate. However, to develop a deep understanding of the mineralogy and localisation of impurities in polar ice, a combination of both approaches is required.
With our study we attempt to push forward to combine the information of both microstructure and chemistry to elaborate on the mineralogy of micro-inclusions in polar ice, its possible sources, and its interplay with microstructure. There is no investigation of the mineralogy and location of inclusions in one polar ice core with a high enough spatial resolution and reliable statistics to generalise the spatial distribution of inclusions or to investigate the effect of different minerals on ice mechanics. We aim to gain a better understanding of the mineralogical variability in micro-inclusions inside one ice core on the large (hundreds of metres) and on the small (millimetre–centimetre) scale. We further investigate whether the mineralogy of the deposited impurities was stable over the last 14 kyr or whether there were changes as a result of the evolution of the Greenland Ice Sheet. Deriving a mineralogy record of inclusions might also enable a better understanding of the aerosol content of the past. Finally, we investigate whether the location of the inclusion in the ice microstructure is related to its mineralogy. Our approach is a combination of methods from microstructure and impurity research to perform a systematic high-resolution analysis along one deep ice core. The East Greenland Ice Core Project (EGRIP) ice core, the first ice core drilled through the Northeast Greenland Ice Stream (NEGIS), enables such an interdisciplinary undertaking. Stoll et al. (2021a) investigate the location of micro-inclusions and their role regarding deformation and microstructure. In this study we investigate the mineralogy of these visible micro-inclusions, which also offer a limited insight into mineral formation pathways. We use bulk insoluble particle data from CFA and optical microscopy and Raman spectroscopy on 11 samples along the EGRIP ice core. With this combined data set covering the Holocene, the Younger Dryas, and the Bølling Allerød, i.e. the upper 1340 m, we aim to give a systematic overview of the evolution of the mineralogy of the EGRIP ice core by identifying a relevant number of micro-inclusions at equal depth intervals. We discuss the interpretation of the mineralogy of micro-inclusions in the EGRIP ice core with respect to environmental boundary conditions and survey implications for future research.
2.1 The East Greenland Ice Core Project
The EGRIP ice core drilling project is located at 75∘38′ N and 35∘58′ W, 2704 m a.s.l. (2015) on NEGIS, the largest ice stream in Greenland (Joughin et al., 2010; Vallelonga et al., 2014). At the drill site the ice flows with a velocity of 55 m a−1 (Hvidberg et al., 2020) offering a novel possibility to study ice rheology and physical parameters contributing to deformation, such as crystal preferred orientation and impurity content, in an active deformation regime, i.e. an ice stream. While first results regarding the physical properties of EGRIP ice were recently published (Westhoff et al., 2020), microstructure and micro-inclusions are investigated in detail in Stoll et al. (2021a).
The present-day accumulation in water equivalent at the EGRIP drill site is between 13.8 and 14.9 cm a−1 (Nakazawa et al., 2021), and the averaged annual layer thicknesses for the period 1607–2011 is 0.11 m ice equivalent (Vallelonga et al., 2014). In the last 8 kyr before 2000 CE, i.e. the upper 900 m, annual layer thicknesses were almost constant probably due to a combination of flow-induced thinning and increased upstream accumulation (Mojtabavi et al., 2020a; Gerber et al., 2021). Accumulation rates were highest 7.8 kyr ago (0.249 m a−1) and decrease towards the Last Glacial Period with a peak during the Bølling Allerød. Due to the flow of NEGIS, ice from the last 8 kyr was deposited under increasingly higher accumulation rates with increasing age caused by higher precipitation closer to the ice divide (Gerber et al., 2021). Traced radar layers from the North Greenland Ice Core Project (NGRIP) drill site indicate an undisturbed climatic record of at least 51 kyr (Vallelonga et al., 2014).
Drilling at EGRIP has not continued since 2019, and the current drill depth is 2121 m, roughly 530 m above bedrock. We analyse the upper 1340 m of the core covering the Holocene (present–11.7 ka) in the upper 1240 m, the Younger Dryas (11.7–12.8 ka) at 1240–1280 m, and the Bølling Allerød (12.8–14.7 ka) at 1280–1375 m (Walker et al., 2018; Mojtabavi et al., 2020a). Gerber et al. (2021) propose that Last Glacial Period ice was deposited 197 to 332 km upstream from EGRIP.
2.2 Micro-particle concentration from CFA
Micro-particle data were obtained during three CFA measurement campaigns (2018–2020) at the University of Bern using the CFA set-up described in detail in Kaufmann et al. (2008) with a few minor improvements. For the analysis a longitudinal 35 × 35 mm section of the ice core was cut and melted down-core and analysed using continuous measurement methods to produce millimetre–centimetre-resolution records of soluble and water-insoluble impurities in the ice. Micro-particle concentrations were determined using an Abakus (Fa Klotz) laser particle sizer (e.g. Ruth et al., 2003) operating in the size range between 1 and 15 µm, which covers the size range of optical microscopy. The depth resolution of the data is limited by signal dispersion in the analytical system to approximately 0.5–1 cm. Depth co-registration to the samples analysed with Raman spectroscopy is limited by the accuracy of the depth assignment in the field and is typically on the order of a few millimetres. We calculated the arithmetic mean dust particle concentration of each 55 cm sample for an overview.
2.3 Sample preparation
Aiming to derive a systematic overview over the EGRIP core we selected samples roughly every 100 m of depth. Samples were chosen based on a combination of depth-representative and prominent features in the micro-particle concentration (e.g. high insoluble particle concentration), grain size (e.g. fine or large), and crystal preferred orientation. The latter two are presented in Stoll et al. (2021a), and we here focus on the mineralogy and water-insoluble particle content. Exact regions of interest in these samples for microstructural and Raman analysis were defined using high-resolution micro-particle data (Fig. 2). The chosen areas included areas without prominent properties and specific areas of interest, such as high water-insoluble particle content. We analysed 11 samples between depths of 138.92 and 1339.75 m (Fig. 1 and Table 1). The nine shallower samples are from the Holocene and the two deepest from the last glacial termination (Mojtabavi et al., 2020a).
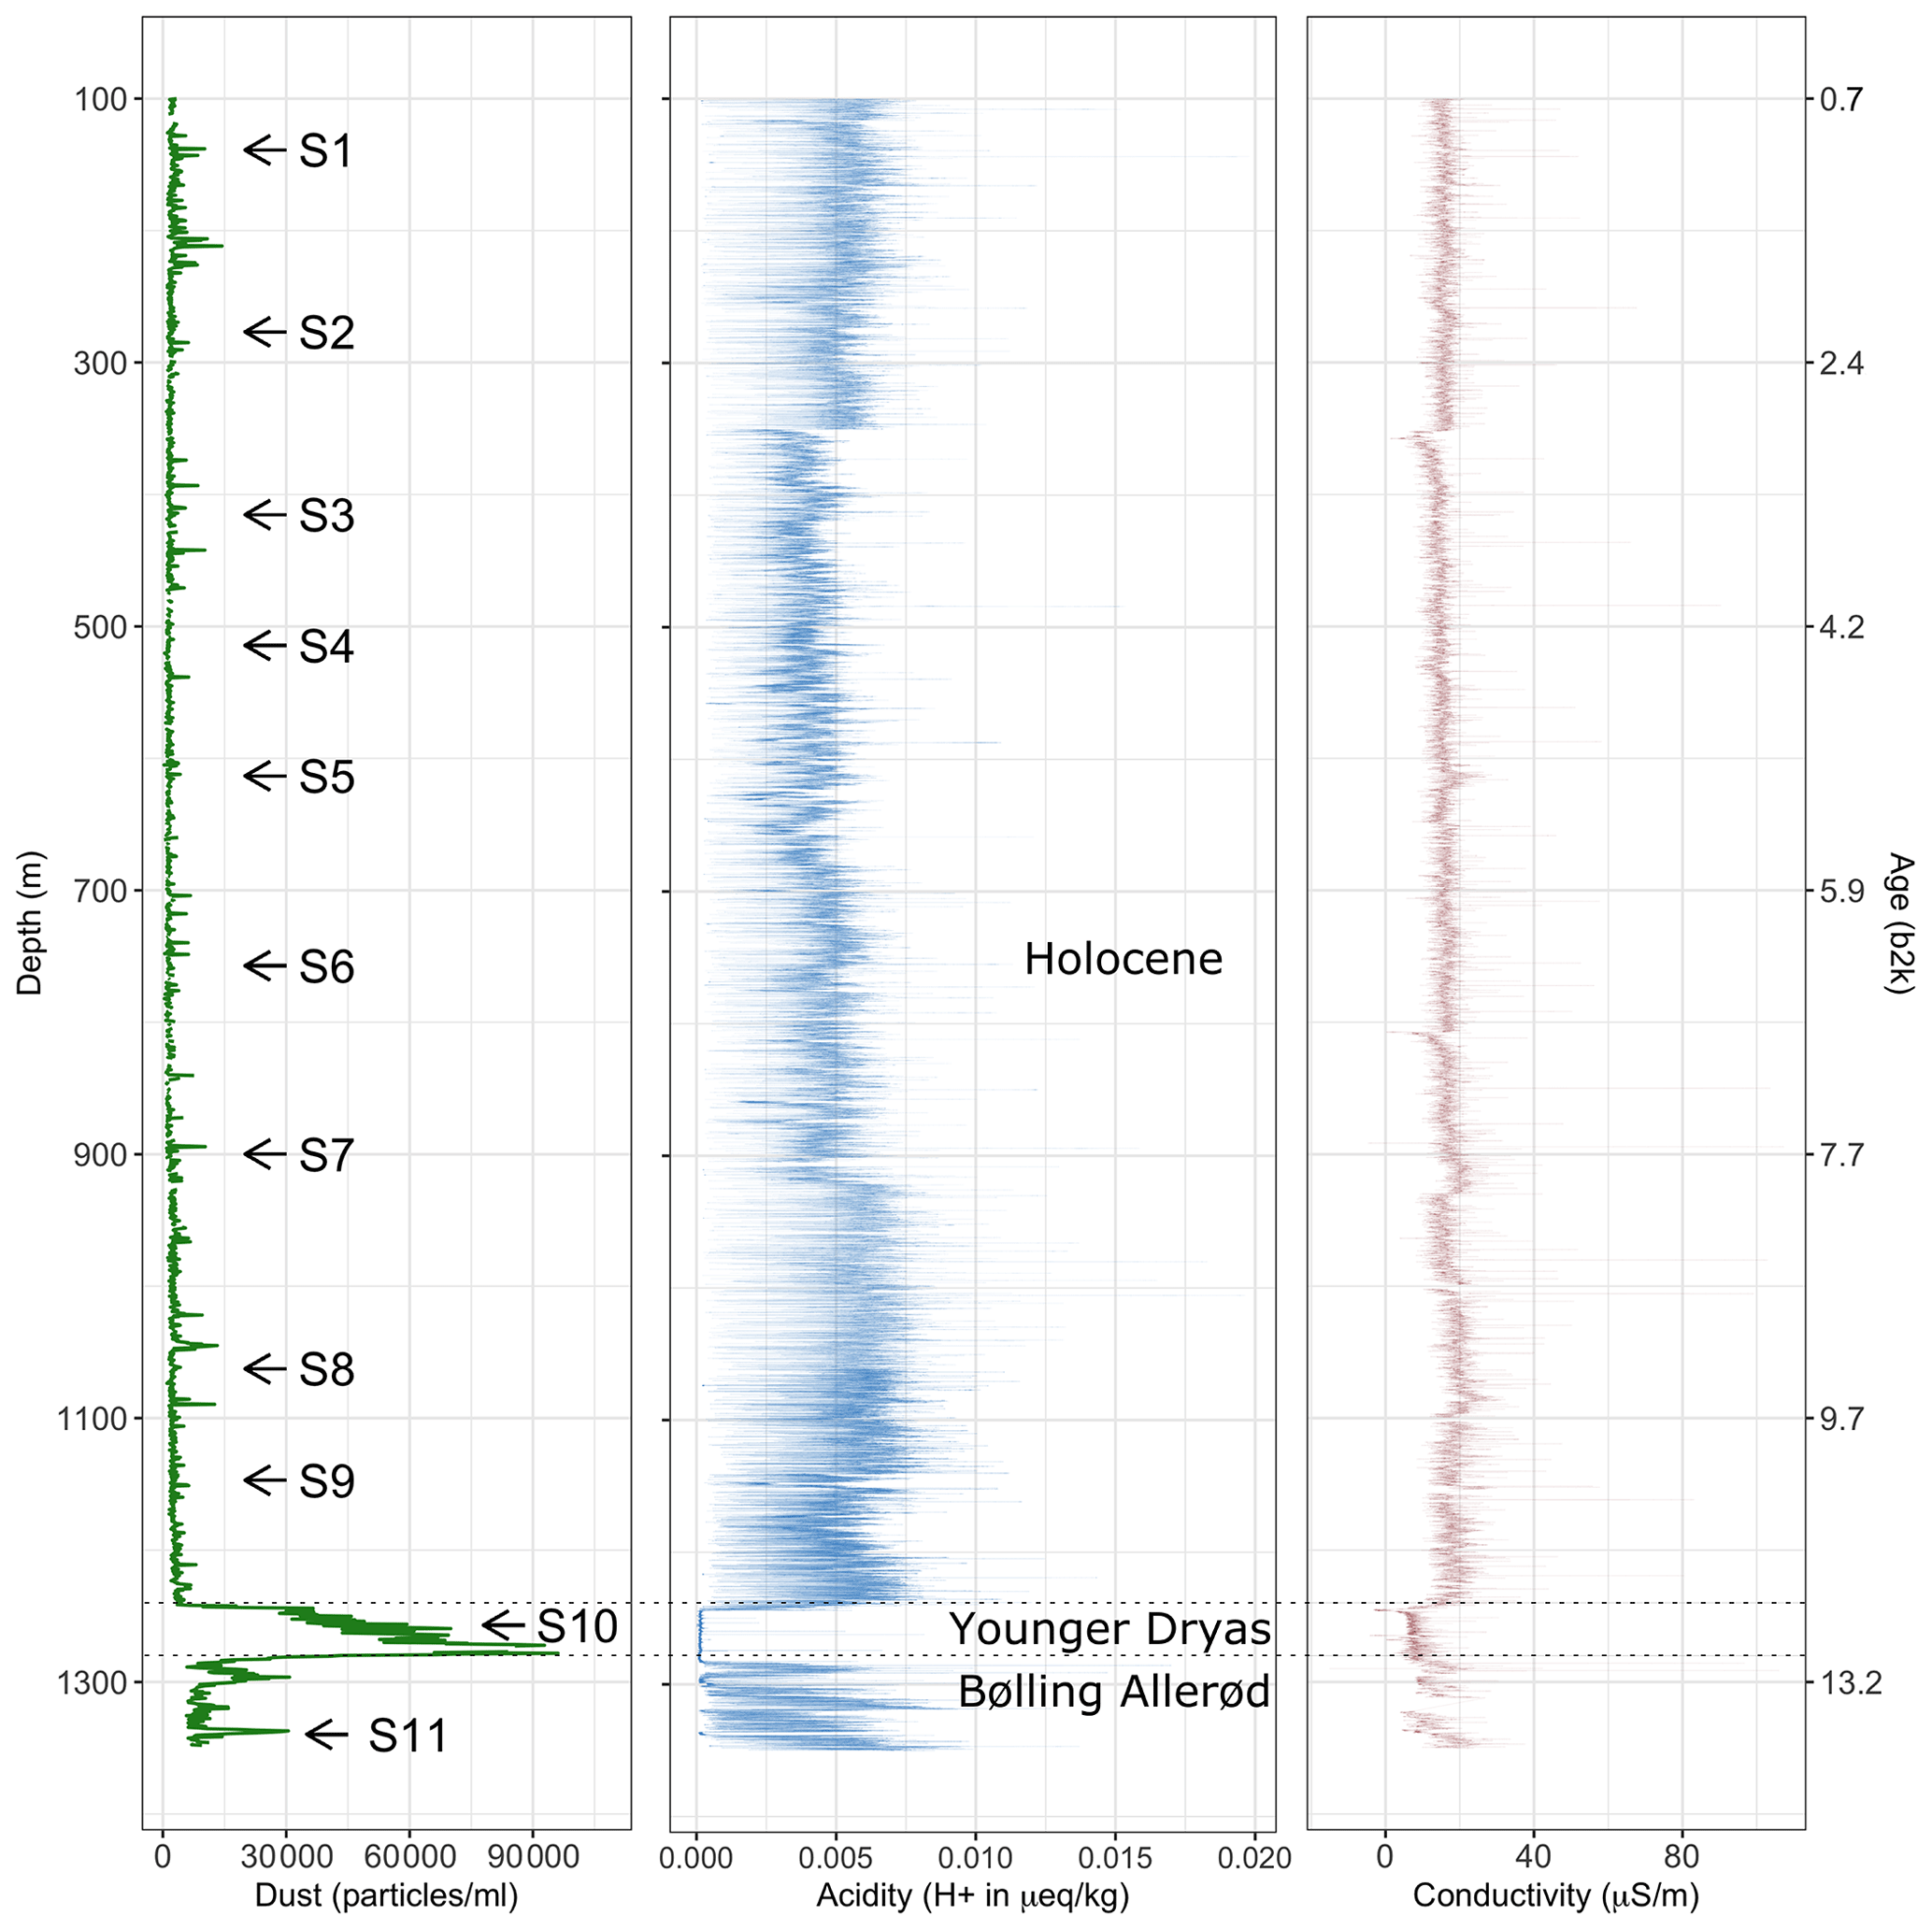
Figure 1 Number counts of particles larger than 1 µm mL−1 of melt water (dust) derived via CFA from the upper 1340 m of the EGRIP ice core. Samples analysed with Raman spectroscopy are indicated with arrows. Acidity data from Mojtabavi et al. (2020b), conductivity data from Mojtabavi et al. (2020c), and age from Mojtabavi et al. (2020a) (b2k = before 2000 CE in kyr).
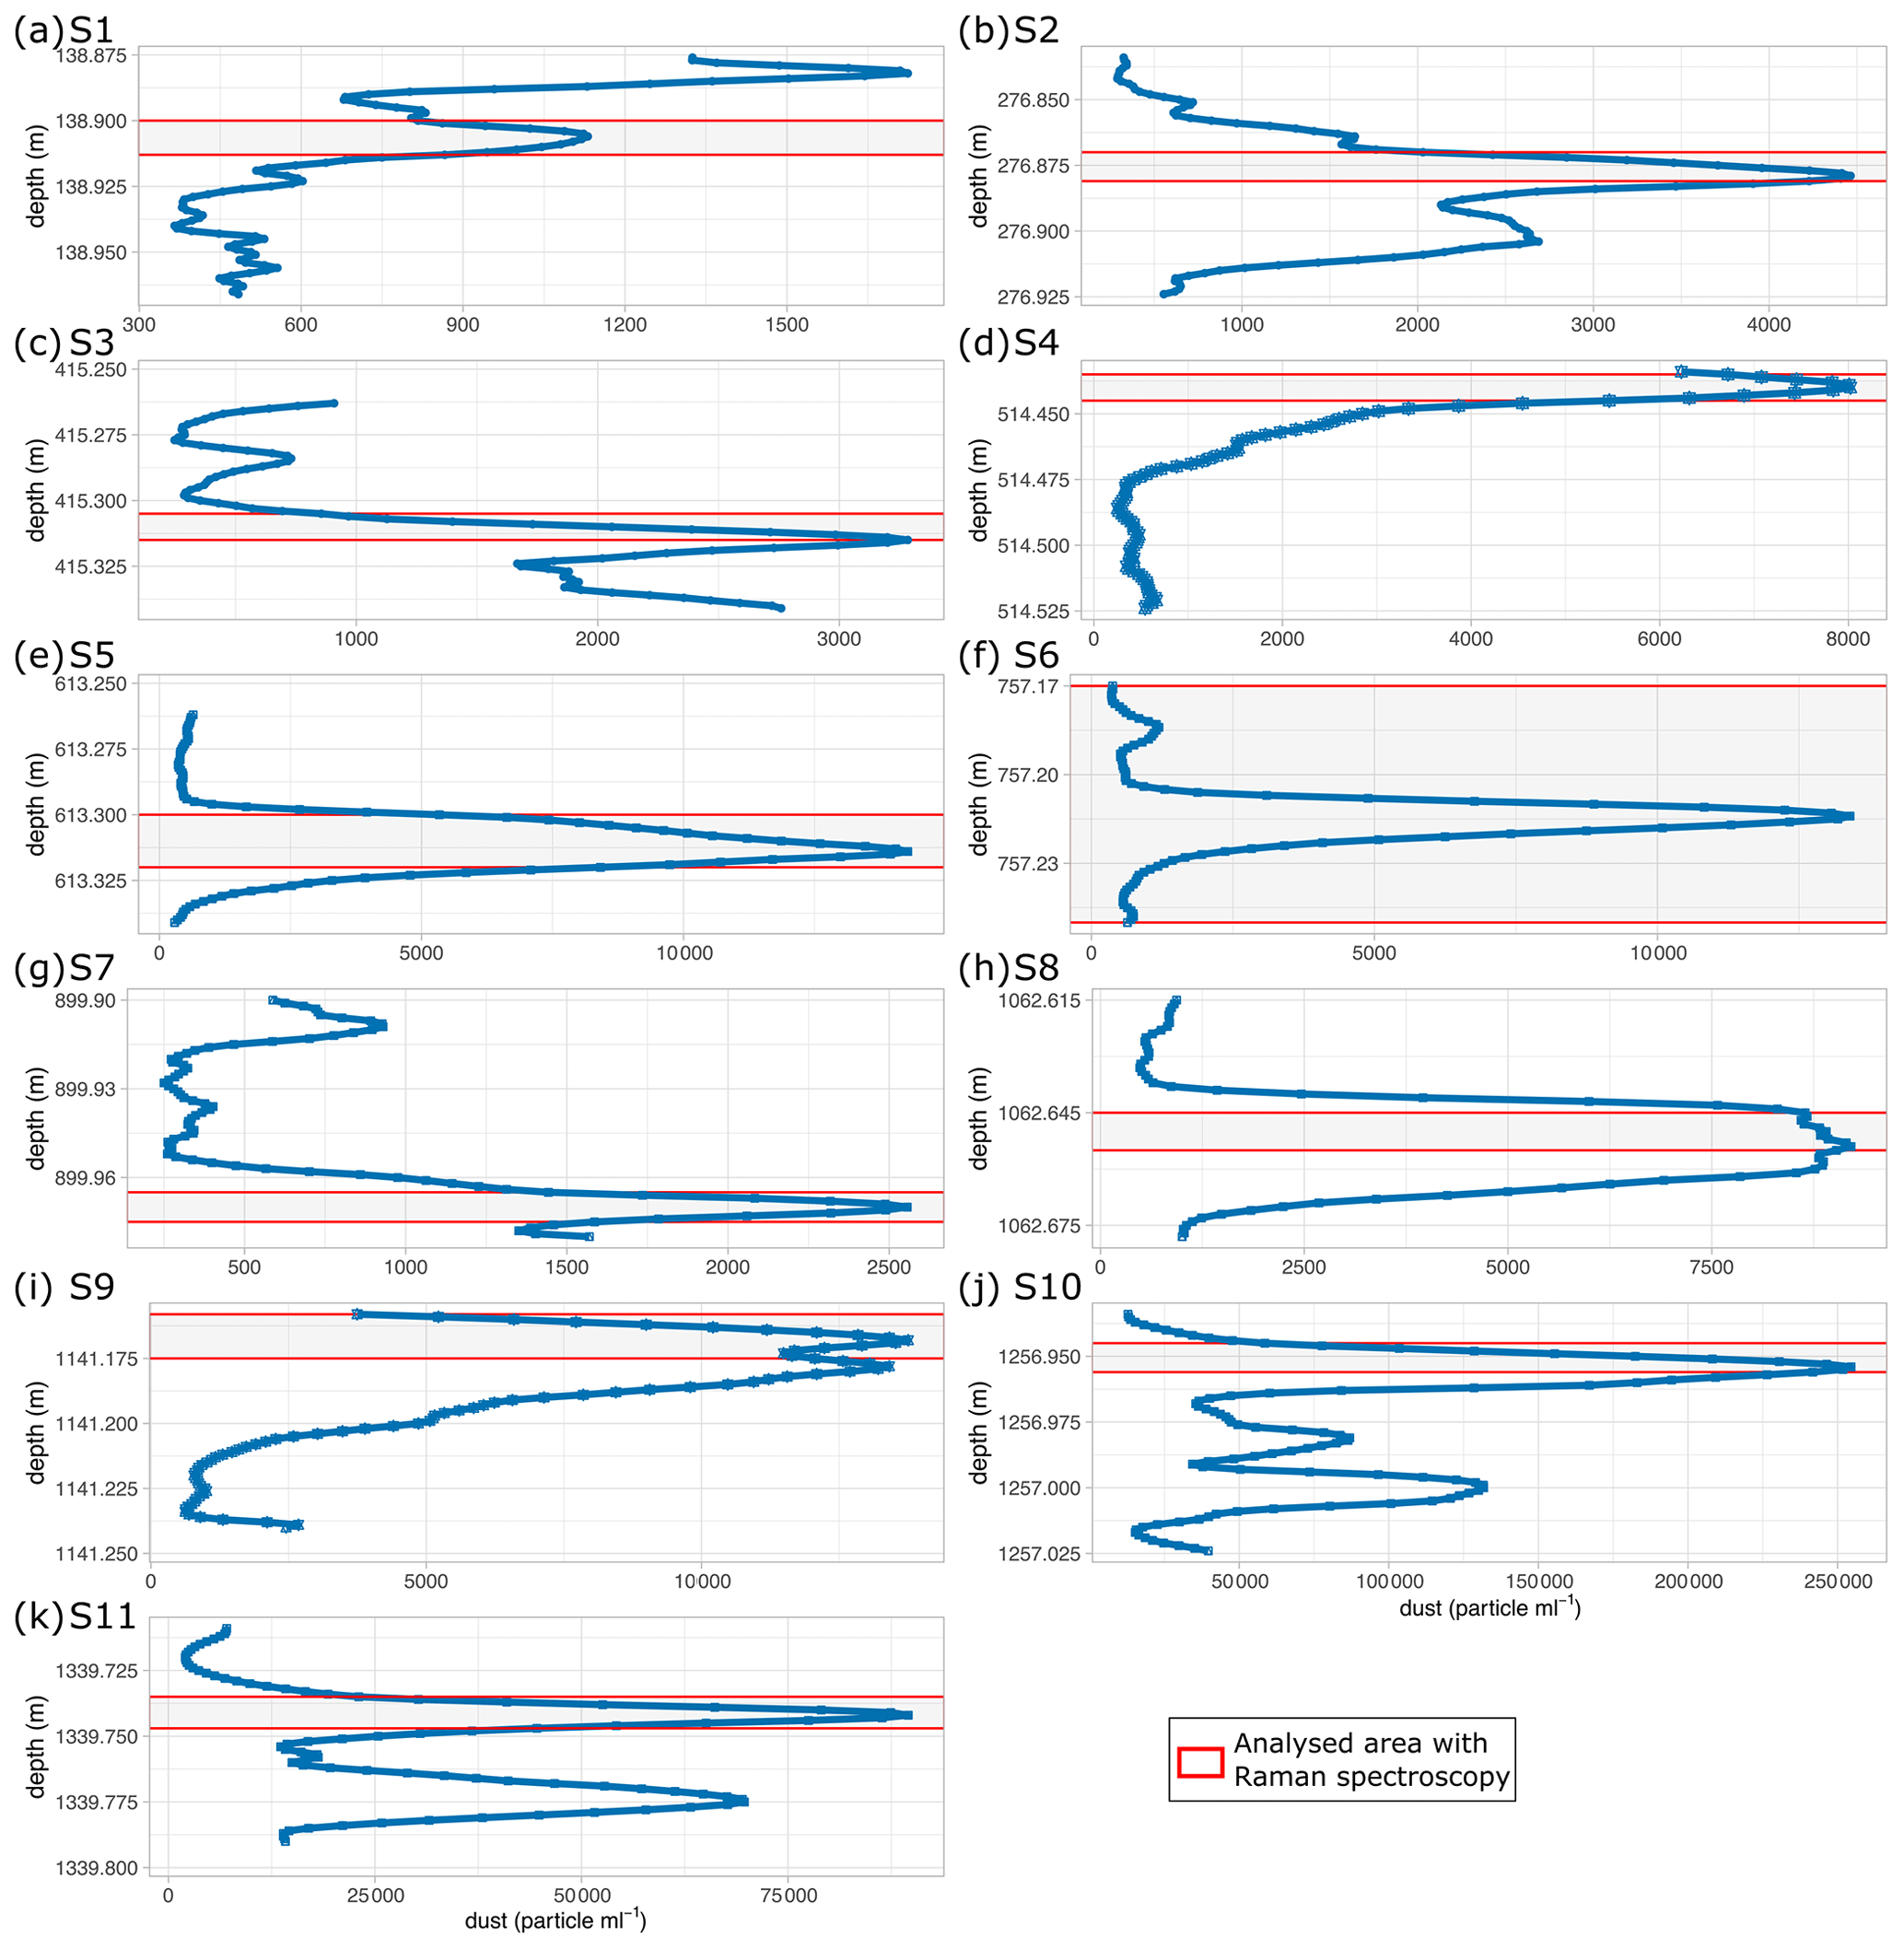
Figure 2 Number counts of insoluble particles larger than 1 µm mL−1 (dust) derived via CFA from the chosen depths analysed with Raman spectroscopy. Please note the different scales in dust concentration on the abscissa. S10 is within a cloudy band, a horizontal layer of much higher dust content than the area above and below.
Table 1Properties of the samples analysed with Raman spectroscopy. Acidity data from Mojtabavi et al. (2020b) and conductivity data from Mojtabavi et al. (2020c).
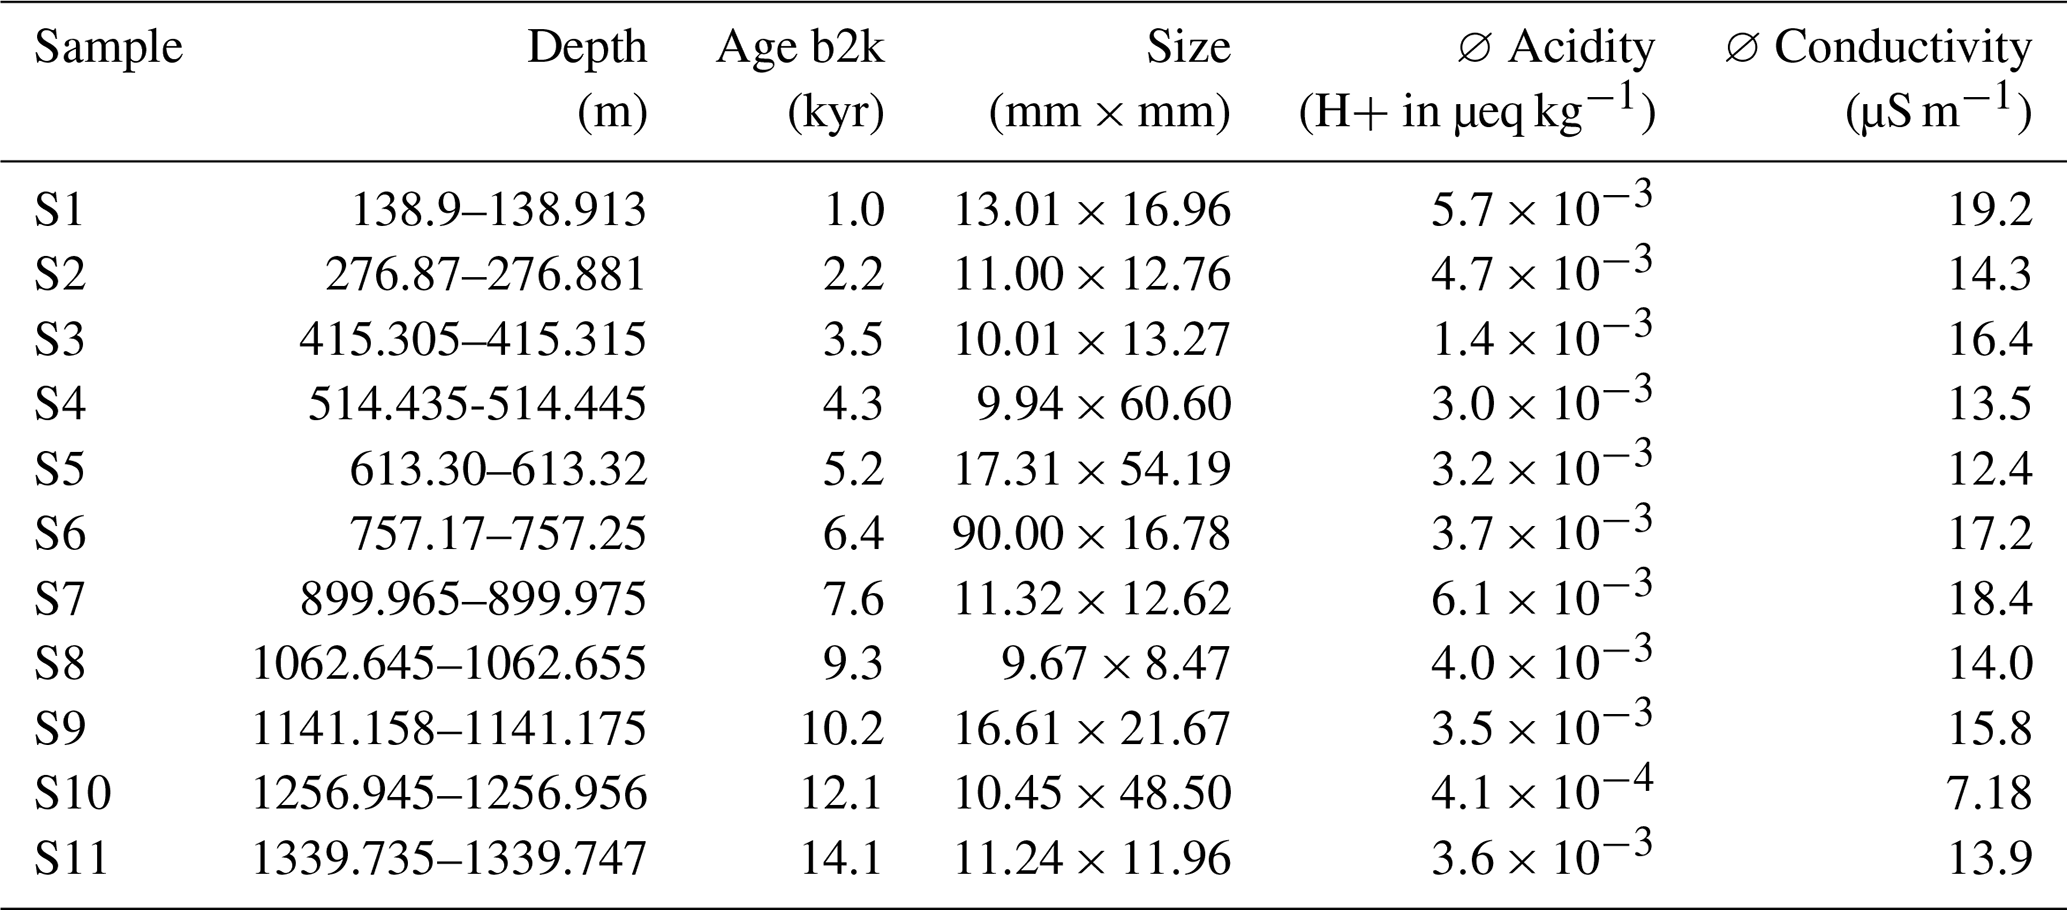
b2k = before 2000 CE (Mojtabavi et al., 2020a).
As described in Stoll et al. (2021a) we used the remaining ice of the physical property samples analysed at the EGRIP camp and created thick sections following a standard procedure (Kipfstuhl et al., 2006). No silicon oil was used to avoid artificial Raman spectra masking the micro-inclusion spectra. Most samples were approximately 10 × 10 mm, but dimensions varied (Table 1) depending on the water-insoluble particle content. A Leica microtome was used to polish the top and bottom surface of the samples, which was followed by 1.5–2 h of sublimation under controlled humidity and temperature conditions. Thus, a good sample surface quality was obtained, and small-scale disturbances (e.g. microtome scratches) were erased, while grain-boundary grooves became more distinct. Polished surfaces allow the localisation of micro-inclusions 500 µm below the sample surface and successful Raman spectroscopy measurements with strong signals.
2.4 Microstructure mapping and impurity maps
Microstructure mapping was performed following Kipfstuhl et al. (2006) and Eichler et al. (2017), and the detailed investigation of the microstructural location of micro-inclusions is explained in detail in Stoll et al. (2021a). Samples were placed under an optical Leica DMLM microscope with an attached CCD (charge-coupled device) camera (Hamamatsu C5405), and several hundred individual photomicrographs were created grid-wise with a scanning resolution of 3 µm pix−1. The creation of high-resolution maps to detect micro-inclusions provided the basis for a structured Raman analysis. These inclusions are usually 1–2 µm in diameter (Fig. 4a) and consist of droplets, dust particles, or salts. We focused inside the ice using transmission light mode and different focus depths to locate micro-inclusions below the surface (Fig. 3b). Microstructure maps with indicated micro-inclusions are from now on called “impurity maps”. We mapped grain boundaries on the sample surface and translated them into the impurity map (Fig. 3) by applying a grain boundary width of 300 µm. This is an upper-limit assumption and compensates for vertically tilted grain boundaries and internal light diffraction with depth (Eichler et al., 2017). Micro-inclusions inside these grain boundaries were classified as “at the grain boundary” (Fig. 3c).

Figure 3 Details of the analysis procedure on S11 (1339.75 m). Grain boundaries are indicated with 300 µm thick violet lines. Localised micro-inclusions 500 µm below the surface are indicated by yellow circles; micro-inclusions analysed with Raman spectroscopy are indicated by filled blue circles with white crosses. Out of focus black shapes are air bubbles. (a) Map of the sample surface with highlighted grain boundaries; the arrow indicates the surface of the ice sheet. (b) Impurity map with a focus depth of 500 µm below the sample surface; micro-inclusions and grain boundaries are indicated. (c) Detail of the area indicated in (b). (d) Identified Raman spectra of the micro-inclusions indicated in (c). One inclusion consists of a quartz and a gypsum spectrum simultaneously.
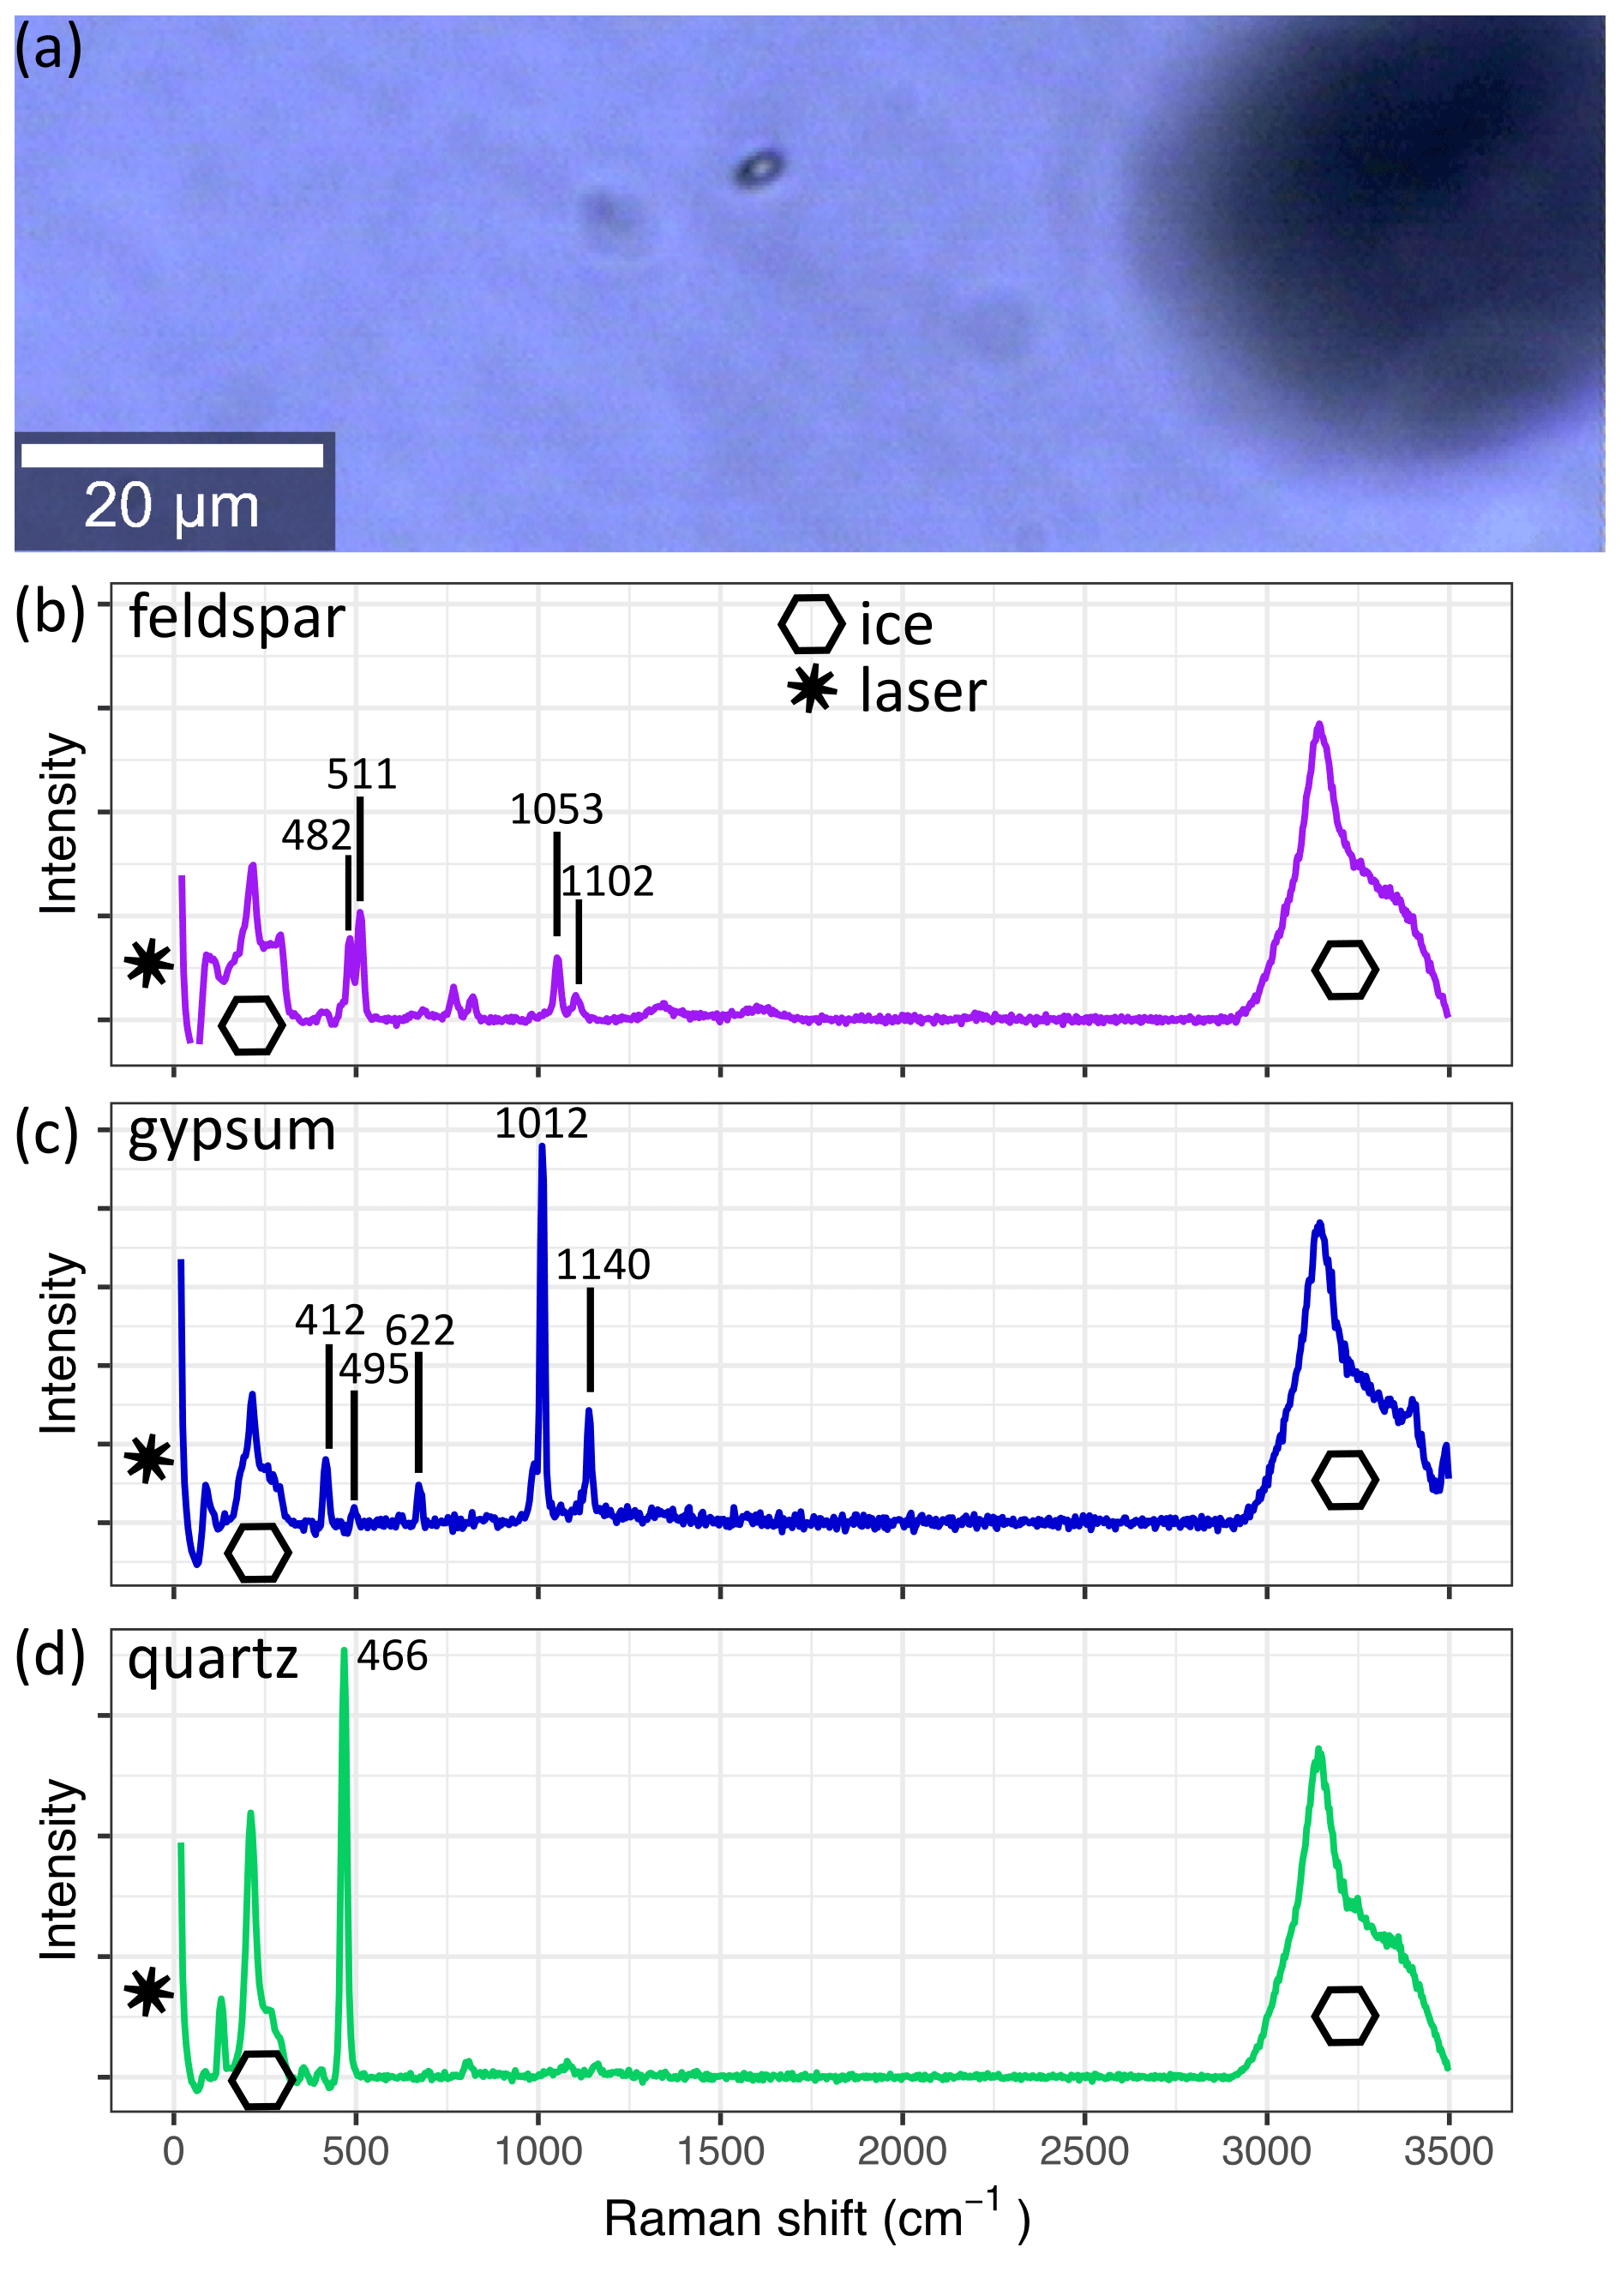
Figure 4 A micro-inclusion in S11 (1339.75 m) as seen with the 20× lens of the Raman system. The derived spectrum of the inclusion is shown in (b). The spectra in (c) and (d) are from the same sample and are frequently measured throughout the core. Spectra are background corrected, and the superimposed ice and laser signals are indicated. (a) The small black object is a micro-inclusion, and the larger black object out of focus is an air bubble. (b) Observed spectra of feldspar. (c) Observed spectra of gypsum. (d) Observed spectra of quartz.
2.5 Cryo-Raman spectroscopy
The Raman effect is the inelastic scattering of light caused by the excitation of vibrational modes of crystals or molecules. This results in the Raman shift – a loss of scattered light energy, which is specific for each vibrational mode (Raman and Krishnan, 1928). The Raman shift is used to identify chemical impurities in samples in a non-destructive way – Raman spectroscopy. It is well suited for light-transparent materials, such as ice (e.g. Fukazawa et al., 1998; Weikusat et al., 2012; Eichler et al., 2019). Using confocal optics, it is possible to focus the excitation laser on a small volume segment (few µm3) inside the sample (Fig. 4a). The same confocal optics collect the backscattered light, which is conducted into a spectrometer to resolve the spectral distribution. Due to the low probability of a photon being Raman-scattered, long integration times, high incident light intensities, and sufficient particle concentration are needed. To avoid melting, laser power is limited, and thus, well-prepared sample surfaces and precise focusing of the laser are essential to obtain identifiable spectra (Fig. 4b–d) (Eichler et al., 2019).
Spectroscopy analysis was performed at the Alfred Wegener Institute Helmholtz Centre for Polar and Marine Research, Bremerhaven, with a WITec alpha300 M+ combined with a Nd:YAG laser (λ=532 nm) and a UHTS 300 spectrometer with a 600 grooves mm−1 grating resulting in a spectral range of >3700 cm−1 and a pixel resolution of <3 cm−1. The system was calibrated with a spectral calibration lamp. The used Raman system is further described by Weikusat et al. (2015). The microscope unit is located in a small cold lab inside an insulated cabin with a temperature of −15 ∘C. The control unit, spectrometer, and excitation laser are located close to the cell at room temperature and are connected with the microscope. We used a 100 µm fibre to obtain a good compromise between signal intensity and confocality. If necessary, samples were re-polished in the same cabin, allowing fast and controlled sample sublimation and a low risk of contamination. The small cabin volume resulted in increasing temperatures over time; measurements were stopped at the very latest at −8 ∘C. To avoid extensive sublimation measurements were continued on the next day. Sample analysis was carried out until a maximum of ∼ 500 µm from the sample surface sublimated. However, we were able to analyse high numbers of micro-inclusions, often exceeding 100 micro-inclusion measurements per sample. Raman spectra were background corrected and identified using reference spectra (e.g. Ohno et al., 2005; Eichler et al., 2019) and the RRUFF project base (Lafuente et al., 2015) (examples in Fig. 4b–d).
When using Raman spectroscopy on micro-inclusions inside ice, the ice spectrum is always present (Fig. 4b–d). Other factors hampering clear Raman signals are (1) small sizes of micro-inclusions, (2) laser beam path length, (3) quality of sample surface, and (4) acquisition time. Normally, one micro-inclusion was measured 10 times with an acquisition time of 0.5–2 s per spectrum, resulting in a total acquisition time of at least 5 s. Weak signals were remeasured with up to 3 s per spectrum and thus up to 30 s in total. The potential cumulative heating of the micro-inclusion limits the total acquisition time because it could result in melting of the sample or the destruction of the inclusion.
We measured in a maximal focus depth of 500 µm below the surface to obtain high-quality signals (Fig. 3b). Surface pollution and possible reactions or rearrangements of elements on the surface were avoided by focusing into the sample, thus only analysing inclusions in the ice. Nevertheless, this leads to a permanent superimposition of the ice spectrum. Impurity peaks were well distinguishable in most cases, even though some signals with strong ice-vibrational bands were hidden by the Raman-active ice spectra. This is often the case for O–H signals of hydrates, which are luckily shifted to higher frequencies in minerals and normally very strong – distinguishing them was usually possible.
3.1 Evolution of water-insoluble particle number with depth
To put the samples analysed for micro-inclusions into a broader context, Fig. 1 shows a profile of 55 cm average micro-particle concentrations over the entire depth range of the core. Generally, during the Holocene, particle concentrations are relatively low compared to the Preboreal and Younger Dryas periods, in good agreement with previous studies of micro-particle concentrations in Greenland ice (Steffensen, 1997; Ruth et al., 2003). However, a detailed climatological interpretation of the data, including, for example, possible upstream effects, is outside the scope of this study and will follow at a later time.
Mean particle numbers are generally consistent and vary, for example, at a depth of 210 m. The general increase in water-insoluble particle numbers with depth also occurs in our chosen samples and is up to 2 orders of magnitude from the shallowest to the deepest samples (Fig. 2).
The four shallowest samples show water-insoluble particle peaks between 1400 and 8000 mL−1 (Fig. 2a–d), while the highest values are observed in the three deepest samples (up to >250 000 mL−1) (Fig. 2i–k). There is a high variability in the water-insoluble particle concentration on small spatial scales, and significant changes occur within centimetres due to the pronounced seasonality in the dust deposition in Greenland. Figure 2j and k display water-insoluble particle numbers skyrocketing and dropping over a few centimetres.
3.2 Raman spectra and derived mineralogy
We conducted Raman spectroscopy on several of the previously located micro-inclusions from all 11 samples. Analysed inclusions were chosen randomly but with the intention to represent the entire area of the sample. The use of confocal mode and a 20× and 50× lens allowed us to find more than 97 % of the micro-inclusions indicated in our impurity maps. The number of analysed micro-inclusions per sample ranged from 47 to 134, and a total of 791 spectra were identified. Luminescence was present in 131 measurements, which were excluded. Micro-inclusions with no obtained Raman signal could be Raman-inactive, or the Raman signal might be superimposed by the ice signal, i.e. too low in intensity to be identified with confidence. Some analysed micro-inclusions showed Raman spectra of more than one mineral. We classified these complex micro-inclusions (Figs. 3d and 8b) as one spectrum of each type regardless of the relative strength of the Raman peak, as done by, for example, Sakurai et al. (2011).

Figure 5 Identified Raman spectra of micro-inclusions in EGRIP Holocene ice; n is the total amount of identified spectra per sample. The two deepest samples are from the Younger Dryas and Bølling Allerød and have by far the highest water-insoluble particle concentrations. (a) All identified Raman spectra per sample. For better visibility some Raman spectra are condensed in groups (e.g. sulfates and mica). (b) Identified sulfates in detail. Sulfate diversity decreases below 900 m.
We identified 24 different Raman signals, which can be mainly differentiated into mineral dust and sulfates. An overview is presented in Fig. 5, and the most abundant minerals are displayed in Table 2 (all spectra are displayed in Table A1 and in the Appendix). Mineral dust minerals are primarily silicates such as quartz and members of the feldspar or mica group. Less abundant dust minerals are hematite, rutile and anatase (both TiO2, rutile is the high-temperature form), titanite (CaTiSiO5), and jacobsite (MnFe2O4). Sulfate minerals (from now on “sulfates”) can be difficult to distinguish due to tiny differences in their Raman spectra, but most sulfates were identified (Fig. 5b). The position of the main peaks of Na and Mg sulfates is only slightly different (1 cm−1 shifted), and we thus classify these spectra as Na and/or Mg sulfates similar to, for example, Sakurai et al. (2011). Most abundant are gypsum, Na and/or Mg sulfates, and bloedite; less abundant are K sulfates. Spectra with a peak at 1052 cm−1 indicate K nitrates, while a peak at 1070 cm−1 indicates Na nitrates (slightly shifted compared to Ohno et al., 2005). The carbonate mineral dolomite (CaMg(CO3)2) was identified in S10 (1256.96 m) in large quantities. We further measured Raman spectra of carbonaceous particles (C), prehnite (Ca2Al2Si3O10(OH)2), pyromorphite (Pb5(PO4)3Cl), and epidote (Ca2(FeAl)Al2(Si2O7)(SiO4)O(OH)); the latter two were only found once. It is likely that the carbonaceous particles originate from biomass combustion, i.e. black carbon.
Table 2Most abundant Raman spectra in EGRIP Holocene ice and localisation data. Mg and K sulfate minerals could not be identified clearly. Sulfates, except gypsum, at grain boundaries were not distinguished and are indicated with hyphens. Details on grain boundary statistics are shown in Table 1 in Stoll et al. (2021a).
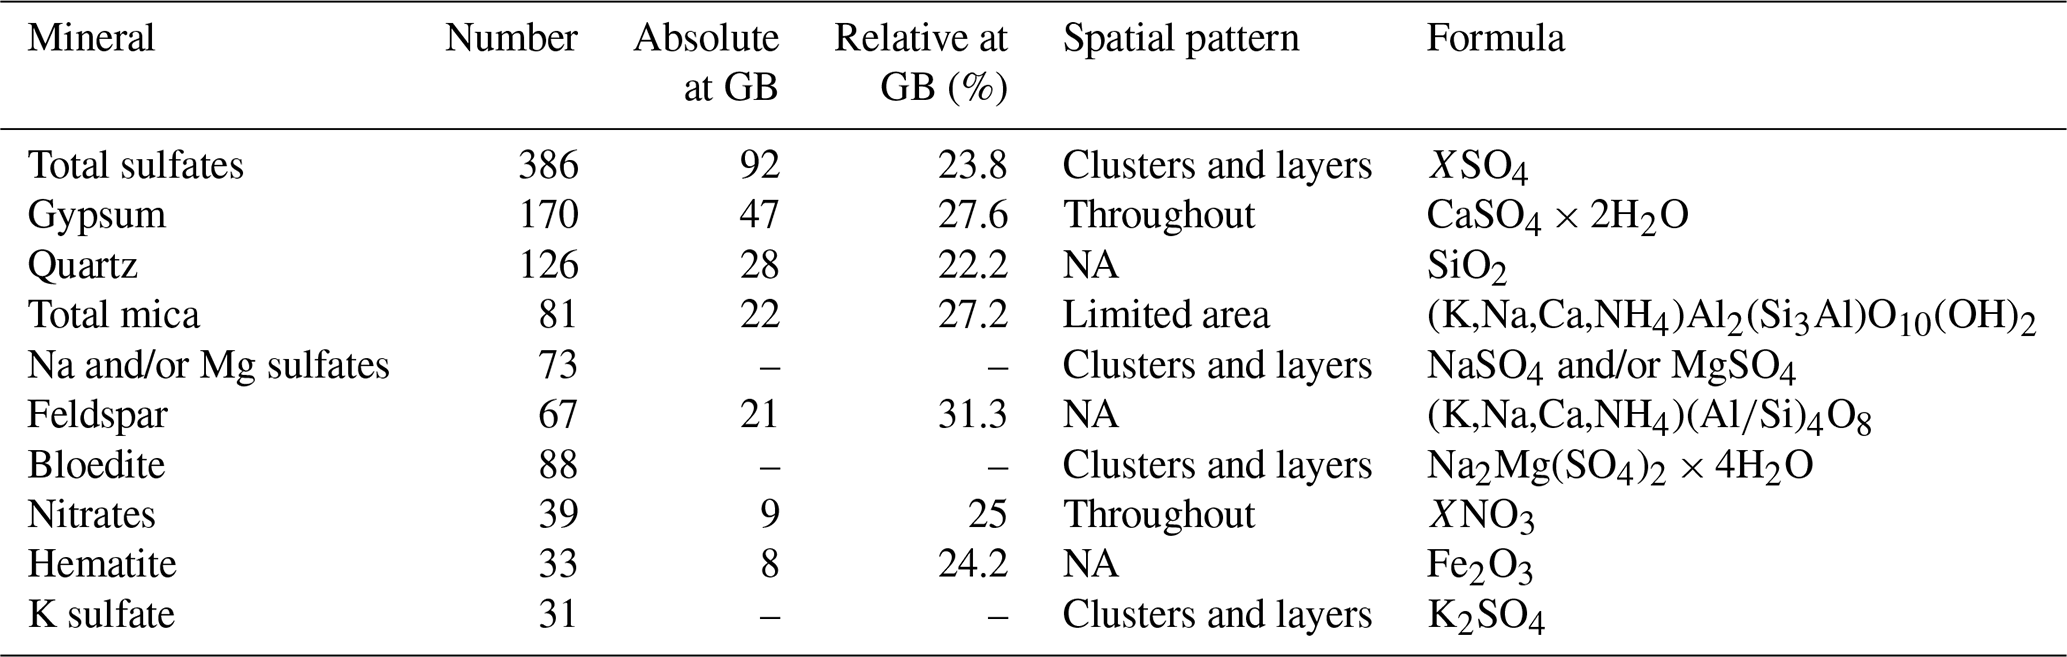
GB = grain boundary, NA = no common pattern.
3.3 Mineral diversity with depth
Between 8 and 15 different spectra were identified per sample, and the median value is 10 different spectra per sample (Fig. 6a). To compare our samples despite the varying amount of total identified Raman spectra per sample, we calculated the ratio of the amount of different minerals per sample (nm) to the total amount of identified micro-inclusions per sample (ni), resulting in the diversity index Ivar with a maximum of 1. Ivar of 1 indicates that every inclusion is of different mineralogy, while values close to 0 indicate a homogeneous mineralogy.
Ivar varies between 0.095 and 0.308, and the mean value is 0.152 (Fig. 6b). Mineralogy diversity decreases slightly with depth, and the large diversity of sulfates is only found in the upper 900 m (Fig. 5b).
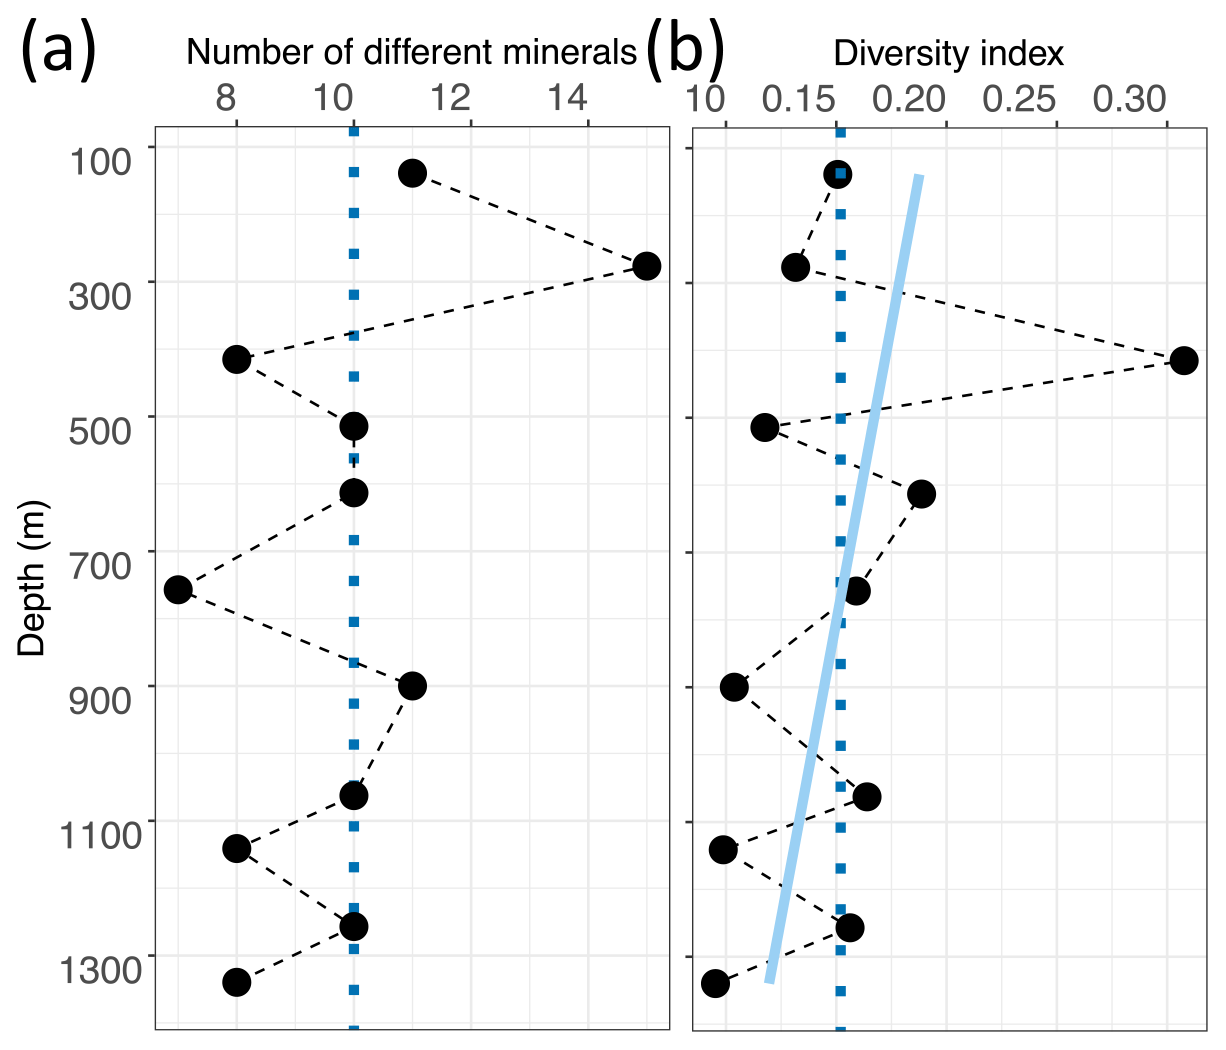
Figure 6 Mineral number and diversity with depth in EGRIP ice. (a) Absolute numbers of different minerals per sample. The dotted blue line is the median value (10). (b) Diversity index values calculated following Eq. (1). The light blue line is a linear regression, and the dotted blue line is the mean value (0.152). Higher values indicate a larger mineral diversity in relationship to the amount of identified Raman spectra per sample.
3.4 Spatial patterns revealed by mineralogy
3.4.1 Large scale: mineralogy evolution along the ice core
The relative abundance of the three silicates quartz, feldspar, and mica often correlates, with increased values at the same depths (e.g. S2, S5, S8). Quartz represents between 6.6 % (S7) and 28.3 % (S5), feldspar between 1.6 % (S10) and 22.6 % (S5), and mica between 1.9 % (S7) and 25.9 % (S9) of all identified micro-inclusions at one depth. These minerals dominate S5 and the three samples between 900 and 1257 m (S8, S9, S10). The deepest sample S11 shows an additional high amount of sulfates, i.e. gypsum (Fig. 5). Minerals, such as epidote or jacobsite, were only found in the samples below 614 m. Nitrates were found in S7 and were among the main impurities in three of the four deepest samples, i.e. S8, S10, and S11. Dolomite was only identified in S10. Carbonaceous particles were found in the four shallowest samples (S1, S2, S3, and S4) and in S10.
The majority of sulfates was found in the seven shallowest samples above a depth of 900 m (Fig. 5b). Over the core sulfate spectra represent between 9.4 % (S10) and 87.7 % (S7) of all identified micro-inclusions at one depth. As displayed in Fig. 5b and briefly described in Sect. 3.3 various different sulfates are found above 900 m, while the only sulfates below 900 m are gypsum and one bloedite micro-inclusion in S9. Gypsum sometimes follows the abundance pattern of the terrestrial dust minerals (in S2, S4, and S9).
3.4.2 Small scale: clusters
Dense clusters of micro-inclusions (minimum of three proximal inclusions) of the same mineralogy were observed throughout the core but especially above 900 m (e.g. S1, S4, S6, and S7). Specifically sulfates at these depths were often found in such clusters (Figs. 7 and 8a, b). The abundance of such clusters of micro-inclusions with similar chemistry declines with depth and is rarely observed below 900 m. Certain minerals, such as mica, only occur in a limited area of the sample (e.g. in S11) without creating distinct layers or clusters. Gypsum and nitrates were found throughout the entire sample area, while no specific localisation was identified for minerals such as quartz, hematite, or nitrates (Table 2).

Figure 7Impurity maps of S1 (138.92 m) and S2 (276.88 m). Identified micro-inclusions are represented by filled circles with different colours; sulfates are orange circles with differently coloured contours. Transparent violet lines are 300 µm thick grain boundaries, and the arrow points towards the surface of the ice sheet. (a) A layer of sulfate micro-inclusions is in the upper part of the sample, and below are almost no micro-inclusions. (b) A wide variety of different Raman spectra and spatial patterns, e.g, clusters and rows of sulfates.
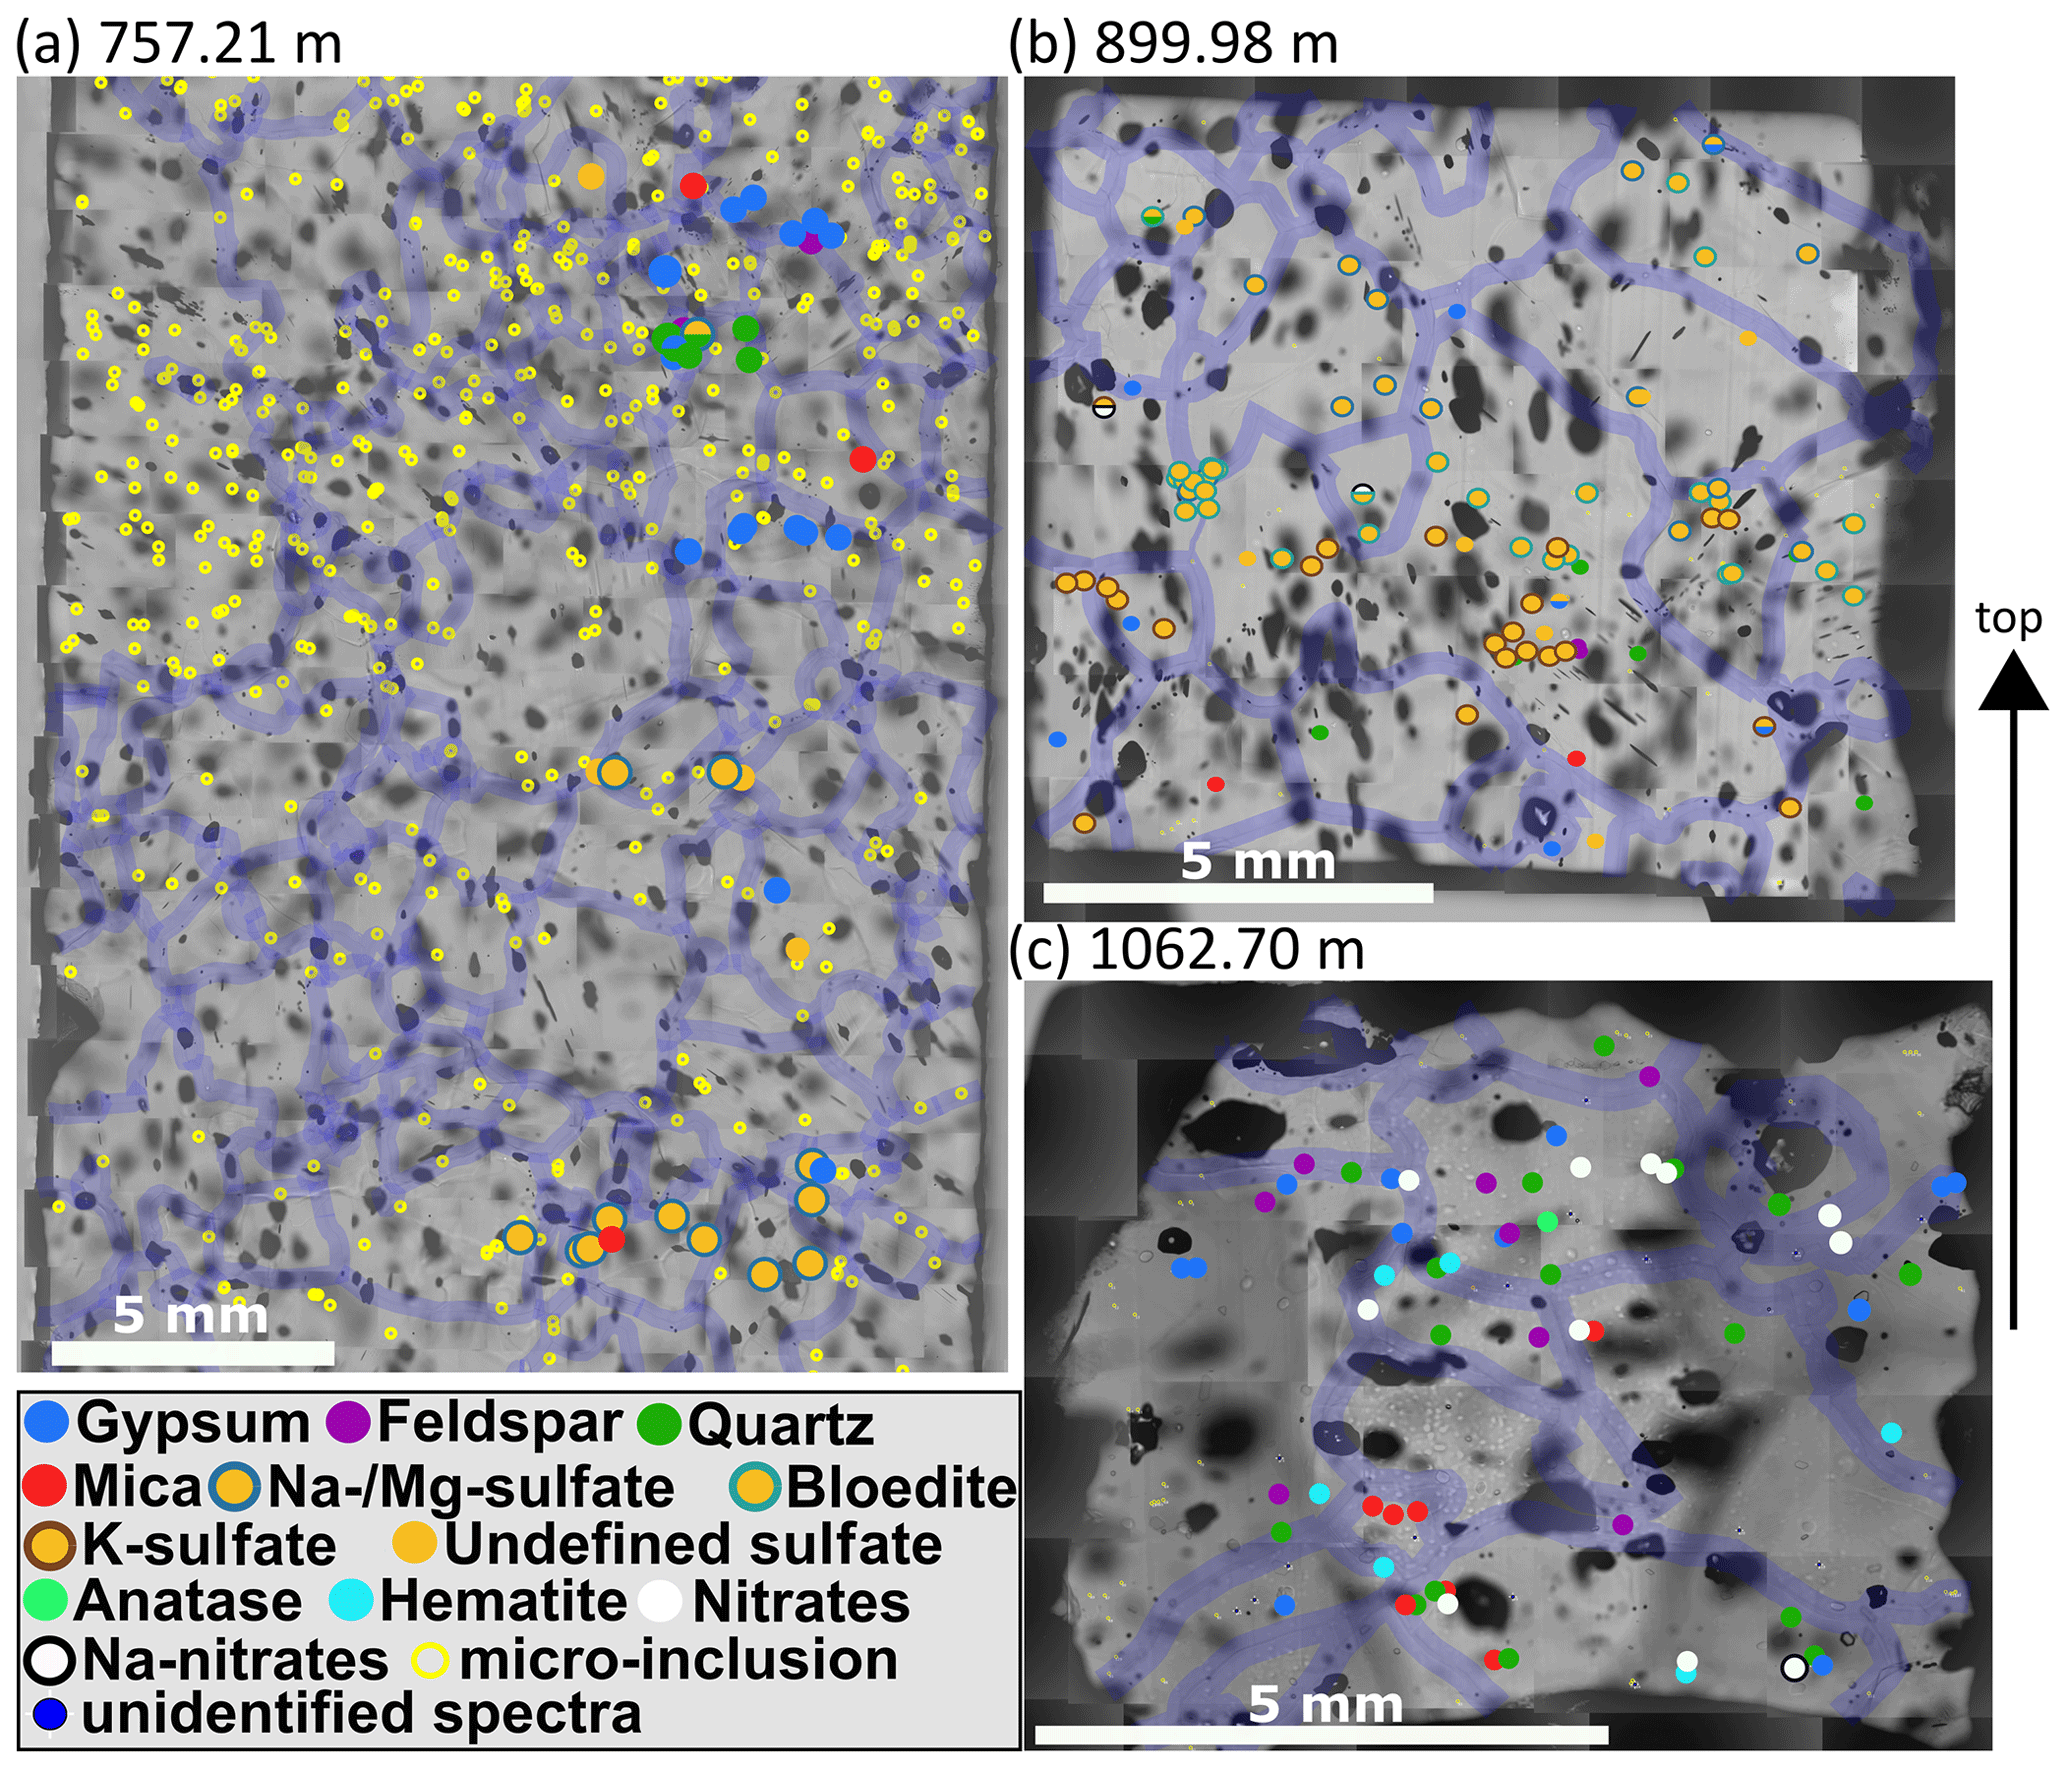
Figure 8Impurity maps from depths of 757.21 (S6), 899.98 (S7), and 1062.7 m (S8). Same annotations as in Fig. 7. (a) Mineralogy changes within centimetres along the vertical axis. The shallower part is dominated by gypsum and terrestrial dust, while the deeper part is dominated by Na and/or Mg sulfates. (b) A strong sulfate layer is found in the middle of the sample, and terrestrial dust is mainly found below. (c) Mineralogy differs strongly from the shallower samples: sulfates are less diverse, mineral dust and nitrates dominate, and clusters are less common.
3.4.3 Small scale: horizontal layers
Often micro-inclusions of the same mineralogy are found in distinct layers horizontal to the core axis (distinct vertical layers were not observed) or broader bands. Figure 8a shows that at a depth of 757.2 m (S6) mineralogy changes on the centimetre scale. The shallowest part of the sample is characterised by a mixture of sulfates (mainly gypsum) and terrestrial dust (quartz, feldspar, mica). Some centimetres deeper a small layer of gypsum is followed by a layer of mainly Na and/or Mg sulfates. At the bottom of the sample Na and/or Mg sulfates dominate, accompanied by gypsum and mica.
A broad layer is observed at 899.98 m (S7) (Fig. 8b). The upper three quarters of the sample are dominated by different sulfates; especially the middle section shows a clear layer. Sulfates in this layer are often found in clusters. The deepest part of the sample inhibits a broader variety of minerals, ranging from different sulfates to mica and quartz (Fig. 8b).
3.4.4 Small scale: localisation at grain boundaries
A total of 181 identified micro-inclusions were located at grain boundaries, i.e. in the upper-limit assumption of 300 µm thick grain boundaries. A total of 92 sulfate particles (including 47 gypsum inclusions) were found at grain boundaries, followed by quartz (28), mica (22), feldspar (21), nitrates (9), hematite (8), and anatase and titanite (both 1). In relation to the total number of each mineral 31.3 % of feldspar, 27.6 % of gypsum, 27.2 % of mica, 23.8 % of sulfate (including gypsum, 20.8 % without gypsum), and 22.2 % of quartz were located at grain boundaries.
The relative amount of sulfates at grain boundaries was higher in samples with a high diversity in sulfate types, i.e. S1, S2, S4, S5, S6, and S7, than the relative amount of terrestrial dust located at grain boundaries. Below 900 m feldspar, mica, and quartz were more common at grain boundaries than sulfates, i.e. gypsum. However, in S11 37.9 % of all identified micro-inclusions at grain boundaries were gypsum.
In this study we have shown that the water-insoluble particle content is variable on the centimetre scale but increases with depth. Furthermore, the mineralogy of micro-inclusions in EGRIP ice varies on the large scale, i.e. throughout the core, and on small spatial scales, i.e. centimetres. Applying different methods (CFA, microstructure mapping, and Raman spectroscopy) enabled us to create high-resolution impurity maps showing that sulfates and terrestrial dust are the most abundant minerals. The upper 900 m are characterised by sulfates with a diverse mineralogy, while mineral dust and gypsum dominate below. Spatial patterns of inclusions of the same mineralogy were revealed, ranging from distinct layers of several millimetres thickness to clusters (mainly of sulfates).
4.1 Water-insoluble particles at EGRIP
We here present the 55 cm sample mean water-insoluble particle number (Fig. 1), representing the dust concentration in the ice. We find the particle concentration to vary with depth, indicating changes in mineral dust through the Holocene. The concentration is comparable to, for example, the North Greenland Ice Core Project ice core (Steffensen et al., 2008) and is low in overall concentration compared to glacial ice (e.g. Steffensen, 1997; Ruth et al., 2003).
High concentrations of water-insoluble particles correlate with areas of numerous micro-inclusions observed with optical microscopy and Raman spectroscopy. The samples with the highest water-insoluble particle counts, i.e. S10 and S11, are from the Younger Dryas and the Bølling Allerød. This explains the much higher water-insoluble particle concentration compared to our Holocene samples (Fig. 1), which is closer to resemble concentrations found in glacial ice (Ruth et al., 2003). The highest amount of water-insoluble particles is in S10 (Fig. 2j), inside a cloudy band. Cloudy bands originate from seasonal events, such as atmospheric storms, resulting in increased transport and deposition of impurities on the ice sheet (Svensson et al., 2005). This explains the high number of mineral dust minerals, the low number of sulfates measured with Raman spectroscopy (Fig. 5a), and the resulting higher Ivar compared to the deepest sample S11. It further supports the hypothesis that water-insoluble dust contributes significantly to cloudy bands (Svensson et al., 2005). Because the EGRIP drilling site is uniquely located on an ice stream and because of the assumed high impact of high-impurity layers on the deformation of the ice (e.g. Dahl-Jensen and Gundestrup, 1987; Paterson, 1991; Miyamoto et al., 1999), there is a need for an in-depth study of cloudy bands at EGRIP.
We adjusted the approach of using micro-particle data, obtained from CFA, for efficient Raman analysis (Eichler et al., 2019) and conclude that analysing water-insoluble particle data first on the large scale, i.e. along one ice core (Fig. 1), followed by small-scale analysis, i.e. over centimetres (Fig. 2a–k), provides an excellent basis for a systematic analysis of different depth regimes while ensuring a sufficient number of micro-inclusions. Combined with microstructure mapping it additionally accelerates the time-consuming search for micro-inclusions, especially in pure Holocene ice.
4.2 Minerals in EGRIP ice
4.2.1 Abundance of minerals
In general, our results show a large abundance of minerals across all samples, while depth-related differences occur in total, as well as relative, mineral abundance. A detailed discussion of the observed change in mineralogy over the EGRIP ice core is presented in Sect. 4.2.2.
The most abundant minerals are sulfates and terrestrial dust minerals, which agrees with observations by, for example, Ohno et al. (2005), Sakurai et al. (2009), and Eichler et al. (2019). We identified most sulfates as gypsum or Na and/or Mg sulfates, which agrees with, for example, Ohno et al. (2005) and Eichler et al. (2019) (Fig. 5b). A total of 170 gypsum micro-inclusions makes it the most abundant mineral and the only sulfate which occurs in every sample, supporting, for example, Legrand and Mayewski (1997) and Sakurai et al. (2009). Mineral dust, such as feldspar, mica, and quartz, was abundant at all depths but generally in lower abundances than gypsum (Table 2). These minerals were especially abundant at a depth of 613.3 m (S5) and in the deepest sample close to the glacial (S11). The glacial sample analysed by Eichler et al. (2019) shows a similar abundance of terrestrial dust minerals. We observed nitrates in S7, S8, S10, and S11. Nitrates were also found with Raman spectroscopy by Fukazawa et al. (1998) and Ohno et al. (2005), while Sakurai et al. (2009) and Eichler et al. (2019) observed nitrate ions only with IC, not with Raman spectroscopy. The secondary minerals pyromorphite and epidote were each only found once. Prehnite was identified three times. Jacobsite was found twice (S2 and S5).
Antarctic ice is dominated by sulfates (Ohno et al., 2005, 2006; Sakurai et al., 2010, 2011; Eichler et al., 2019); they represent, for example, up to 96 % of all identified spectra in the interglacial samples of Eichler et al. (2019). Contrary to this, our samples show, in general, a higher diversity in minerals (Fig. 6). Only the sample from 899.98 m of depth (S7) has a comparable amount of sulfates (87.7 % of all identified spectra).
4.2.2 Change in mineralogy
We have observed a pronounced change in mineralogy from a sulfate-diverse regime in the upper 900 m to a terrestrial dust-dominated regime with comparably large amounts of gypsum at some depths (e.g. S8 and S9) (Fig. 5). The lack of a variety of sulfate minerals below 900 m is shown in our diversity index, which decreases with depth even though some minerals, such as dolomite, only occur below 900 m. Similar findings were reported by earlier studies (e.g. Ohno et al., 2005; Sakurai et al., 2009; Eichler et al., 2019) which found sulfates and mineral dust in varying numbers.
The most common minerals, i.e. sulfates and terrestrial dust, are found throughout the entire ice core but in varying abundance (Fig. 5 and simplified in Fig. 9). The abundance of comparably rare minerals, such as hematite, anatase, and titanite, does not detectably vary with depth. Other minerals, for example, rutile and epidote, were only found in shallow samples, while, for example, dolomite and nitrates were only found in deep samples. However, deeper samples show smaller amounts, and varieties, of sulfates, which almost completely disappear below 900 m. In the four deepest samples gypsum is the only sulfate, except for one bloedite micro-inclusion in S9. Though previous data are scarce, Sakurai et al. (2009, 2011) and Eichler et al. (2019) show that sulfates are found in deeper parts of ice sheets, also consisting almost entirely of gypsum and supporting our results.
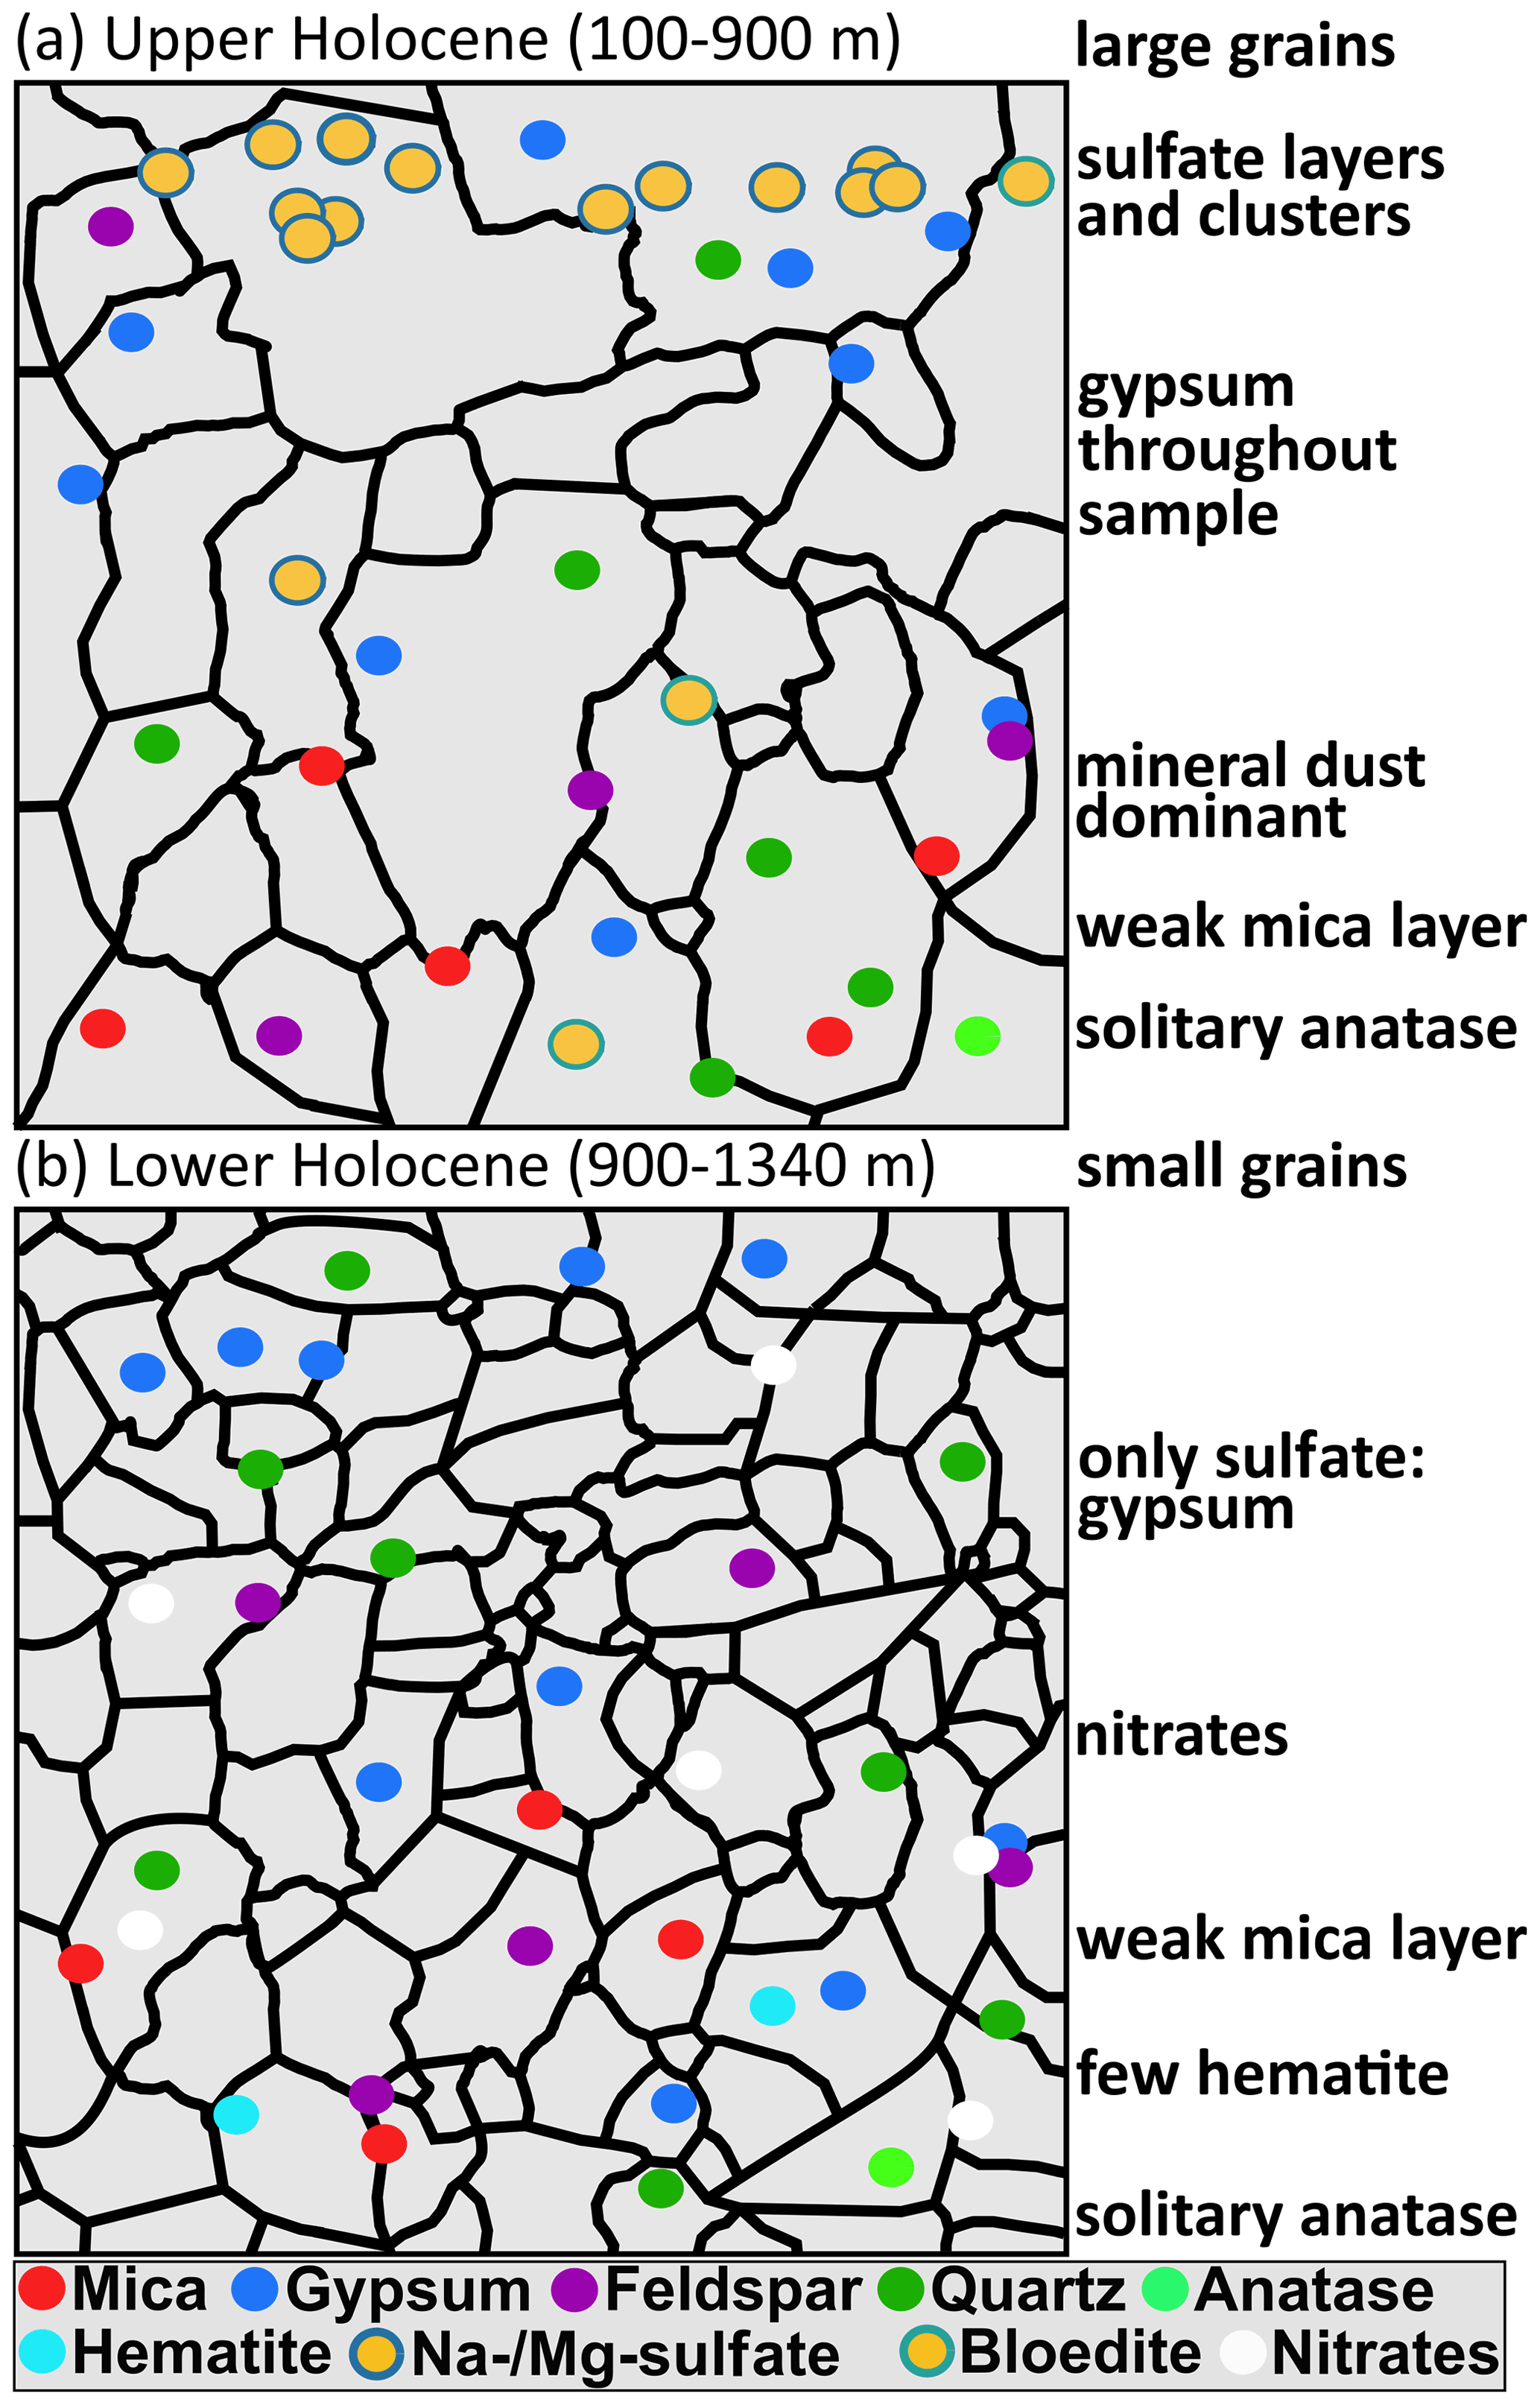
Figure 9 Sketch of the simplified distributional patterns of minerals found in (a) upper Holocene ice and (b) lower Holocene ice.
The changes in mineralogy that we observe at 900 m depth are similar to observations made in other settings at a transition between glacial and interglacial. Eichler et al. (2019) found a strong difference in mineralogy between interglacial and glacial ice in the European Project for Ice Coring in Antarctica (EPICA) Dronning Maud Land (EDML) ice core. However, main minerals in interglacial ice are sulfates (especially Na sulfate and gypsum), while mineral dust and gypsum dominate in glacial ice (Eichler et al., 2019). Ohno et al. (2005) show that inclusions consist mainly of Na and/or Mg sulfates in Holocene ice from Dome Fuji, Antarctica, while gypsum and nitrate salts dominate in the Last Glacial Maximum. This agrees with our findings and could indicate that, in Greenland and Antarctica, compounds bearing a variety of sulfates are more abundant in warm periods, such as the Holocene or the Eemian, while mineral dust and gypsum dominate during cold periods, such as the last glacial. An investigation of EGRIP glacial samples will show if prominent changes in mineralogy also occur at deeper depths than the analysed upper 1340 m.
4.2.3 Detailed comparison with mineralogy in the GRIP ice core
A limited number of polar ice cores have been drilled over the last decades, and mineralogy data are only available for a few of those. In Greenland, the GRIP ice core was analysed with Raman spectroscopy and EDS by Sakurai et al. (2009). The GRIP and EGRIP drill sites are relatively close by, and we thus compare both cores here in detail.
We found gypsum at all depths at EGRIP resembling the results of Sakurai et al. (2009). Similar to our findings, Na and/or Mg sulfates, quartz, and nitrates are less abundant in their samples. Sakurai et al. (2009) analysed 6.9 and 9.8 kyr old samples, which we compare to our 6.4 (S6), 9.3 (S8), and 10.2 kyr (S9) old samples. The younger samples from both studies are mainly composed of gypsum, Na and/or Mg sulfates, and smaller amounts of quartz, feldspar, and mica. In the 9.8 kyr old sample Sakurai et al. (2009) found gypsum, slightly less Na and/or Mg sulfates, and some “other” minerals, while our 9.3 and 10.2 kyr old samples (S8 and S9) show a slightly different mineralogy. Quartz is dominant in both samples and is accompanied by gypsum, feldspar, and, to varying degrees, mica. Both samples contain no sulfates except gypsum and bloedite. Gypsum is the only sulfate in our oldest sample S11 (14.1 ka), which agrees well with the 13.5 ka sample from Sakurai et al. (2009).
The higher relative amount of terrestrial minerals in our samples is difficult to explain conclusively because the GRIP and EGRIP sites are comparably close to each other and at similar distances to the coast. Intentionally choosing samples with a high water-insoluble particle content could partly explain this observed difference. In certain samples, for example, S5, S8, and S10, the majority of micro-inclusions consist of mineral dust, which might indicate strong dust storms or deposition events as proposed for cloudy bands by, for example, Svensson et al. (2005). However, we show that the diversity in mineralogy can be high within centimetres (e.g. Fig. 8). The observed differences are thus probably caused by natural variability amplified by methodological differences, such as different sample sizes.
4.2.4 Methodological drawbacks
We can not determine if rarely found minerals only occur at certain depths or if this is related to statistics drawbacks. Minerals, such as hematite and anastase, were only found in a few samples, while epidote, prehnite, pyromorphite, and dolomite were only found in one sample. Unfortunately, the problem of statistics reoccurs in microstructural impurity research, which can only be partly solved by analysing larger samples and with a higher spatial resolution which is not always feasible due to the amount of work needed for the analysis.
Furthermore, there are known drawbacks of Raman spectroscopy, such as the inability to identify Raman-inactive compounds, the superimposition of the ice spectra, and the focus on visible, undissolved impurities. Especially the main component of sea salt, NaCl, is inaccessible with Raman spectroscopy and thus not considered in our analysis. Some Raman spectra in S3 were difficult to identify; we thus had to exclude several spectra. However, analysing inclusions inside the ice prevents contamination, preserves their in situ locations, and is thus a well justified approach.
Obtaining good Raman spectra and identifying them with enough confidence will always be a challenge. We could not identify all measured Raman spectra similar to other studies using this method. As an example we measured the same unknown spectra as presented in Fig. 2g of Sakurai et al. (2011). These technical limitations hamper a fully holistic analysis and are difficult to overcome. A partial solution would be an analysis of the same samples with a subsidiary method which identifies location and chemistry of impurities, such as SEM coupled with EDS or LA-ICP-MS.
4.3 Mineral origin and possible formation pathways
Raman spectroscopy data do not allow insights into the specific formation pathways of the identified inclusions. However, we give a brief overview of the most likely origins or formation pathways of the major groups of minerals and of some rare minerals.
4.3.1 Mineral dust
Dust minerals, such as quartz, feldspar, hematite, and mica, usually originate from desert regions where strong winds erode crustal material. The small, sub-micron particles can then be transported over long distances by the prevailing winds. As the particles are crustal material the most abundant elements are consequently Si, Al, and Fe, and their mineralogy can depend on the source regions. These particles represent the chemical composition of the crust, and the most abundant elements are consequently Si, Al, and Fe.
4.3.2 Sulfates
The high abundance of sulfates in many samples can be largely explained by blown-in sulfate-bearing compounds from the continents (e.g. gypsum) or from sea salt (e.g. Na2SO4) (Legrand and Mayewski, 1997). However, sulfate minerals can also form after initial deposition when acidic aerosols of sulfuric acid, such as H2SO4 droplets, gain cations from other sources (e.g. Ohno et al., 2005). The main cations of the sulfate minerals in our samples are Ca2+, Mg2+, and Na+ (Table 2). Ohno et al. (2005) suggest that Mg2+ and Na+ could originate from blown-in sea salt (NaCl and MgCl2), which was deposited on the ice sheet. This would result in the possibility that HCl and Cl− enter the ice lattice creating point defects and thus effecting the electric conductivity (Petrenko and Whitworth, 1999; Ohno et al., 2005) and dislocation mobility (e.g. Hu et al., 1995). HCl solution is monatomic, without a vibrational spectrum, and thus not detectable with Raman spectroscopy. We are limited in evaluating the process of sulfatisation in our samples, but our results imply that the process proposed by Ohno et al. (2005) could occur.
The difference in sulfate diversity between shallower and deeper samples could be explained by a difference in available dust (Figs. 1 and 2). Iizuka et al. (2012) concluded that aerosol sulfatisation in Antarctica is proportional to the dust flux and more likely to occur in the atmosphere or during fallout than after deposition. During the Holocene, sea salt aerosols reacted with acid-gas particles during transport and in the snowpack. In the glacial, however, acids were often neutralised by the higher amounts of terrestrial dust, i.e. with high concentrations of Ca2+, and thus reacted less with sea salt (Röthlisberger, 2003). Fittingly, our results show that high dust concentrations often correlate with the dominance of gypsum over other sulfate minerals, while lower dust values correlate with medium to high numbers of Na and/or Mg sulfates.
4.3.3 Nitrates
Nitrates are very soluble in water and a major impurity component in polar ice as obtained from CFA (Röthlisberger et al., 2000b) and IC (Eichler et al., 2019) analyses, but there is a lack of understanding of which form they are present in when in ice. Nitric acid (N2O5 or HNO3) is a component of atmospheric fallout, and thus of ice cores, and could compete with other acids, such as sulfuric acids. Sulfuric acid competes with other acids to react with the relatively rare cations, replaces other acids in their salts, and thus forms a variety of sulfate salts (Iizuka et al., 2008). The relative abundance of nitrates at a certain depth (Fig. 5a) indicates that similar processes occur with nitrates. However, nitrate ions seem to be more likely to exist in dissolved forms than in particle forms due to their good solubility in water.
4.3.4 Rare minerals
The rarely observed minerals pyromorphite, epidote, prehnite, and jacobsite are most likely of detrital origin and were transported together with more common dust minerals. The micrometre sizes of the inclusions indicate a distant source region, such as the deserts of Asia (Bory et al., 2003; Vallelonga and Svensson, 2014).
Pyromorphite and epidote are secondary minerals and were only found once. Pyromorphite is usually found in the oxidised zones of lead ore deposits. Epidote is abundant in, for example, schistose rocks or marble. It can be a product of the hydrothermal alteration of minerals in igneous rocks, such as feldspar or mica. Prehnite was identified three times and is normally found in Mg- or Fe-rich (i.e. mafic) volcanic rocks and can be a product of hydrothermal alteration in chasms or veins. Jacobsite was found twice (S2 and S5) and can occur as a primary phase or as a product of the metamorphism of manganese deposits and thus altered manganese minerals. It is typically associated with, among others, hematite, and both were identified in S2. Fe minerals, such as hematite and jacobsite, were identified in this study and occur relatively often in polar ice (e.g. Baccolo et al., 2018; Eichler et al., 2019; Baccolo et al., 2021). Baccolo et al. (2018) showed that the deep ice sheet environment is not anoxic, and dissolved oxygen and liquid water veins might support the oxidation and dissolution of specific mineral phases.
Dolomite was only observed in S10 originating from the Younger Dryas, which is the only section of the ice core that is not acidic (Fig. 1). This indicates either that the carbonate is dissolving in the other parts of the core or that it has precipitated in the part where the acidity was low.
4.3.5 Chemical reactions in ice
Chemical reactions occurring inside the ice could explain the diversity in chemical compounds as summarised for snow by Bartels-Rausch et al. (2014) and further discussed for ice by Steffensen (1997), de Angelis et al. (2013), Baccolo et al. (2018), and Eichler et al. (2019). Time spans of several thousand years could enable impurities in the ice to react, thus leading to post-depositional changes in the composition of impurities. Barnes et al. (2003b), Masson-Delmotte et al. (2010), and de Angelis et al. (2013) suggest movement of chloride and sulfate ions after deposition, while Barnes and Wolff (2004) report possible reactions between dust particles and soluble impurities. Faria et al. (2010) observed the formation of solid inclusions in deep ice, which was supported by Eichler et al. (2019). A local mixing of impurities in shear bands with high strain rate and strain could explain our observations of clustering of sulfates and is not unlikely due to the dynamic conditions inside NEGIS. Local small-scale processes could lead to preferred clustering of micro-inclusions with similar chemistry. We observed preferred clustering at all depths; however, samples below 900 m show significantly fewer clusters. This correlates with the depth of declining sulfate diversity and could indicate that, around this depth, certain unknown chemical reactions occur or that large-scale boundary conditions, such as climate or ice sheet extent, changed during the time of deposition. Furthermore, visual stratigraphy data (Weikusat et al., 2020) and the core break record show that the brittle zone, the transition from air bubbles to clathrate hydrates (Ohno et al., 2004; Neff, 2014), at EGRIP is roughly at 550–1000 m of depth. Defects in the ice matrix, grain boundaries, and micro-inclusions can act as nucleation sites for hydrate nucleations (Ohno et al., 2010). We found most clathrates below 900 m evoking the possibility that this transition zone also impacts sulfate chemistry, but details are unknown.
4.4 Mineralogy related to Holocene climate
We observed a diverse mineralogy of micro-inclusions in EGRIP ice across all scales. Mineral abundance changes throughout the core, i.e. the observed change in sulfate diversity (Sect. 4.2.2), and across samples, i.e. in distinct layers and clusters (Sect. 3.4). This can be partly explained by different deposition conditions throughout the Holocene which we briefly discuss here.
Previous studies have suggested two possible scenarios for the Holocene climate evolution. It was either a stable period of climate with the Holocene Thermal Maximum in the mid-Holocene (9–5 ka) or a period with a rather long-term cooling trend and an earlier, stronger Holocene Thermal Maximum (Axford et al., 2021). The prominent change in abundant minerals at a depth of 900 m could be explained by these two scenarios leaving different imprints on the mineralogy. The extension of the Greenland Ice Sheet during the Holocene cannot be constrained exactly, and it probably differed significantly between regions (Lecavalier et al., 2014; Young and Briner, 2015). The rapid retreat of the ice sheet in northeast Greenland 12 kyr ago lead to ice-free coastal areas in northeast Greenland after ∼ 9 ka (Lecavalier et al., 2014; Simonsen et al., 2019). Air temperatures over Greenland increased in the Holocene Thermal Maximum and peaked ∼ 7.8 ka (Lecavalier et al., 2014; Axford et al., 2021). The average EGRIP annual layer thickness is surprisingly constant during the Holocene, but a significant change occurs around 7–8 ka (Mojtabavi et al., 2020a). The RECAP dust record shows the exposition of local dust sources, for example, in King Christian X Land, between 12.1 ± 0.1 and 9.0 ± 0.1 ka (Simonsen et al., 2019). Syring et al. (2020) show that the sea ice cover in northeast Greenland transformed from a reduced state towards a marginal, almost extended state between the Early (∼ 11.7–9 ka) and mid-Holocene (∼ 9–5 ka), possibly impacting the input of sea salt (ss), a major source of sulfates (ss-SO). The variability in sulfate diversity and number could display the variety in blown-in sea salt aerosols (ssas) carrying sulfate compounds, such as gypsum. Even though the main dust input to Greenland was from East Asia (Svensson et al., 2000; Bory et al., 2003), regional changes (e.g. exposed bedrock) might have had an impact on the availability of chemical compounds in the air and thus during deposition. The occurrence of other sulfates than gypsum in 9.8 kyr old GRIP ice (Sakurai et al., 2009) supports a site-specific, regional difference at EGRIP compared to GRIP.
A difference in the chemistry at the ice sheet surface at the time of deposition and different atmospheric circulation patterns, and thus varying aerosol input, could be indicated by the micro-particle record (Fig. 1). Dust particle numbers generally increase with depth (Fig. 2), and especially S10 is from a dust-rich period, the Younger Dryas. For Greenland, the major dust source areas for the Last Glacial and the Younger Dryas were the East Asian deserts (Svensson et al., 2000; Vallelonga and Svensson, 2014) with minor contributions from the Sahara (Han et al., 2018). Dust particles deposited in the Holocene are likely from the Takla Makan and Gobi deserts (Bory et al., 2003; Vallelonga and Svensson, 2014). These differences in dust input between the Holocene and the Last Glacial are represented in our results; for example, the lowest Ivar value was measured in the deepest sample originating from the Bølling Allerød. The strong layering and clustering of sulfates observed in some samples could originate from dry deposition events, which form deposition crusts mainly containing sulfates.
Another possible aspect is the impact of NEGIS. Our analysed samples were deposited within 197 km upstream from EGRIP and thus at slightly higher surface elevations (2993 ± 7 m a.s.l. at 1400 m depth), which limits the impact on the aerosol input. Accumulation rates for ice from depths of 900 to 1400 m were low, except the peak during the Bølling Allerød (Gerber et al., 2021). This peak coincides with a low Ivar value in S11 displaying that a high accumulation rate does not necessarily lead to mineral diversity. However, it is difficult to compare the Holocene samples to the two samples from the Younger Dryas and Bølling Allerød. A systematic follow-up study on EGRIP glacial ice is needed to investigate if the observed trends, for example, of mineral diversity, continue with depth.
We here derive the first systematic analysis of the mineralogy of micro-inclusions in Holocene and late glacial ice from the EGRIP ice core, the first deep ice core from a fast flowing ice stream. More specific, we used dust particle concentration derived via CFA along the upper 1340 m and analysed micro-inclusions in detail with a combination of optical microscopy and cryo-Raman spectroscopy at 11 different depths. Combining these methods, and thus covering different scales, provides a good basis for a systematic analysis of different depth regimes while ensuring a sufficient number of micro-inclusions.
By identifying almost 800 Raman spectra we obtained new qualitative and quantitative insights into the mineralogy of micro-inclusions in polar ice. A total of 24 different spectra were identified, which indicates a more diverse mineralogy in ice from the last 14 kyr than previously observed. In general most inclusions are sulfates, especially gypsum, and mineral dust, such as quartz, mica, and feldspar. Sulfates in the upper 900 m tend to create clusters of similar chemical compositions, and mineral diversity decreases slightly with depth. The 1340 m of the EGRIP ice core analysed here can be divided into two depth regimes of different mineralogy. The upper 900 m are characterised by various sulfates, while below this depth gypsum is the only sulfate. This might be explained by different amounts of water-insoluble particle input; other reasons might be large-scale changes in northeast Greenland during the mid-Holocene, such as the decreasing lateral extent of the Greenland Ice Sheet revealing bedrock at the coast, the varying sea ice cover impacting the availability of sulfates in the air during deposition, or processes taking place at the bubble–clathrate transition. Further studies are however needed to define exact reasons.
Our study emphasises the need to overcome technical limitations, which could be achieved by an inter-method comparison of, for example, Raman spectroscopy, LA-ICP-MS, and SEM. However, our systematic overview of the mineralogy of micro-inclusions throughout a large part of one deep ice core helps to develop a better understanding of the role of impurities in polar ice.
Table A1Identified Raman spectra in the upper 1340 m of the EGRIP ice core.

Raman data and high-resolution microstructure and impurity maps are available at PANGAEA (https://doi.pangaea.de/10.1594/PANGAEA.933053, Stoll et al., 2021c). CFA dust particle data are available on request.
The supplement related to this article is available online at: https://doi.org/10.5194/tc-16-667-2022-supplement.
The conceptualisation was done by NiS, IW, and MH. Microstructure mapping and Raman methodology were developed by NiS, JE, and IW; measurements were performed by NiS. CFA micro particle data were provided by CJ and TE. Investigation and data curation were conducted by NiS, TE, and CJ. Formal analysis was done by NiS and TE. Funding for NiS was acquired by IW. The manuscript was written by NiS with assistance from all co-authors.
The contact author has declared that neither they nor their co-authors have any competing interests.
Publisher’s note: Copernicus Publications remains neutral with regard to jurisdictional claims in published maps and institutional affiliations.
This work was carried out as part of the Helmholtz Junior Research group “The effect of deformation mechanisms for ice sheet dynamics” (VH-NG-802). We thank all EGRIP participants for logistical support, ice processing, and fruitful discussions. EGRIP is directed and organised by the Centre for Ice and Climate at the Niels Bohr Institute, University of Copenhagen. It is supported by funding agencies and institutions in Denmark (A. P. Møller Foundation, University of Copenhagen), USA (US National Science Foundation, Office of Polar Programs), Germany (Alfred Wegener Institute, Helmholtz Centre for Polar and Marine Research), Japan (National Institute of Polar Research and Arctic Challenge for Sustainability), Norway (University of Bergen and Trond Mohn Foundation), Switzerland (Swiss National Science Foundation), France (French Polar Institute Paul-Emile Victor, Institute for Geosciences and Environmental research), Canada (University of Manitoba), and China (Chinese Academy of Sciences and Beijing Normal University). Tobias Erhardt and Camilla Jensen gratefully acknowledge the long-term financial support of ice core research at the University of Bern by the Swiss National Science Foundation (grant no. 200020_172506 (iCEP) and 20FI21_164190 (EGRIP).
This research has been supported by the Helmholtz Association (grant no. VH-NG-802) and the Schweizerischer Nationalfonds zur Förderung der Wissenschaftlichen Forschung (grant nos. 200020_172506 (iCEP) and 20FI21_164190 (EGRIP)).
The article processing charges for this open-access publication were covered by the Alfred Wegener Institute, Helmholtz Centre for Polar and Marine Research (AWI).
This paper was edited by Melody Sandells and reviewed by Anders Svensson and two anonymous referees.
Alley, R., Perepezko, J., and Bentley, C. R.: Grain Growth in Polar Ice: I. Theory, J. Glaciol., 32, 415–424, https://doi.org/10.3189/S0022143000012132, 1986. a, b
Alley, R. B. and Woods, G. A.: Impurity influence on normal grain growth in the GISP2 ice core, Greenland, J. Glaciol., 42, 255–260, 1996. a
Alley, R. B., Blankenship, D. D., Rooney, S. T., and Bentley, C. R.: Water-pressure coupling of sliding and bed deformation: III. Application to Ice Stream B, Antarctica, J. Glaciol., 35, 130–139, https://doi.org/10.3189/002214389793701572, 1989. a
Ashby, M. F.: Boundary defects and the mechanism of particle movement through crystals, Scripta Metallurgica, 3, 843–848, https://doi.org/10.1016/0036-9748(69)90192-6, 1969. a
Axford, Y., de Vernal, A., and Osterberg, E. C.: Past Warmth and Its Impacts During the Holocene Thermal Maximum in Greenland, Annu. Rev. Earth Pl. Sc., 49, 279–307, https://doi.org/10.1146/annurev-earth-081420-063858, 2021. a, b
Baccolo, G., Cibin, G., Delmonte, B., Hampai, D., Marcelli, A., Stefano, E. D., Macis, S., and Maggi, V.: The Contribution of Synchrotron Light for the Characterization of Atmospheric Mineral Dust in Deep Ice Cores: Preliminary Results from the Talos Dome Ice Core (East Antarctica), Condensed Matter, 3, 25, https://doi.org/10.3390/condmat3030025, 2018. a, b, c
Baccolo, G., Delmonte, B., Niles, P. B., Cibin, G., Di Stefano, E., Hampai, D., Keller, L., Maggi, V., Marcelli, A., Michalski, J., Snead, C., and Frezzotti, M.: Jarosite formation in deep Antarctic ice provides a window into acidic, water-limited weathering on Mars, Nat. Commun., 12, 436, https://doi.org/10.1038/s41467-020-20705-z, 2021. a
Baker, I., Cullen, D., and Iliescu, D.: The microstructural location of impurities in ice, Can. J. Phys., 81, 1–9, https://doi.org/10.1139/p03-030, 2003. a
Barnes, P. R., Wolff, E. W., Mallard, D. C., and Mader, H. M.: SEM studies of the morphology and chemistry of polar ice, Microsc. Res. Techniq., 62, 62–69, https://doi.org/10.1002/jemt.10385, 2003a. a
Barnes, P. R. F. and Wolff, E. W.: Distribution of soluble impurities in cold glacial ice, J. Glaciol., 50, 311–324, https://doi.org/10.3189/172756504781829918, 2004. a
Barnes, P. R. F., Wolff, E. W., Mader, H. M., Udisti, R., Castellano, E., and Röthlisberger, R.: Evolution of chemical peak shapes in the Dome C, Antarctica, ice core, J. Geophys. Res., 108, 4126, https://doi.org/10.1029/2002JD002538, 2003b. a
Bartels-Rausch, T., Jacobi, H.-W., Kahan, T. F., Thomas, J. L., Thomson, E. S., Abbatt, J. P. D., Ammann, M., Blackford, J. R., Bluhm, H., Boxe, C., Domine, F., Frey, M. M., Gladich, I., Guzmán, M. I., Heger, D., Huthwelker, Th., Klán, P., Kuhs, W. F., Kuo, M. H., Maus, S., Moussa, S. G., McNeill, V. F., Newberg, J. T., Pettersson, J. B. C., Roeselová, M., and Sodeau, J. R.: A review of air–ice chemical and physical interactions (AICI): liquids, quasi-liquids, and solids in snow, Atmos. Chem. Phys., 14, 1587–1633, https://doi.org/10.5194/acp-14-1587-2014, 2014. a
Bohleber, P., Roman, M., Šala, M., and Barbante, C.: Imaging the impurity distribution in glacier ice cores with LA-ICP-MS, J. Anal. Atom. Spectrom., 35, 2204–2212, https://doi.org/10.1039/d0ja00170h, 2020. a
Bory, A. J.-M., Biscaye, P. E., Piotrowski, A. M., and Steffensen, J. P.: Regional variability of ice core dust composition and provenance in Greenland, Geochem. Geophy. Geosy., 4, 1107, https://doi.org/10.1029/2003GC000627, 2003. a, b, c
Cole-Dai, J., Budner, D. M., and Ferris, D. G.: High Speed, High Resolution, and Continuous Chemical Analysis of Ice Cores Using a Melter and Ion Chromatography, Environ. Sci. Technol., 40, 6764–6769, https://doi.org/10.1021/es061188a, 2006. a
Dahl-Jensen, D. and Gundestrup, N. S.: Constitutive properties of ice at Dye 3, Greenland, International Association of Hydrological Sciences Publication, 31–43, http://hydrologie.org/redbooks/a170/iahs_170_0031.pdf (last access: 22 April 2021), 1987. a, b
Dahl-Jensen, D., Albert, M. R., Aldahan, A., Azuma, N., Balslev-Clausen, D., Baumgartner, M., Berggren, A. M., Bigler, M., Binder, T., Blunier, T., Bourgeois, J. C., Brook, E. J., Buchardt, S. L., Buizert, C., Capron, E., Chappellaz, J., Chung, J., Clausen, H. B., Cvijanovic, I., Davies, S. M., Ditlevsen, P., Eicher, O., Fischer, H., Fisher, D. A., Fleet, L. G., Gfeller, G., Gkinis, V., Gogineni, S., Goto-Azuma, K., Grinsted, A., Gudlaugsdottir, H., Guillevic, M., Hansen, S. B., Hansson, M., Hirabayashi, M., Hong, S., Hur, S. D., Huybrechts, P., Hvidberg, C. S., Iizuka, Y., Jenk, T., Johnsen, S. J., Jones, T. R., Jouzel, J., Karlsson, N. B., Kawamura, K., Keegan, K., Kettner, E., Kipfstuhl, S., Kjær, H. A., Koutnik, M., Kuramoto, T., Köhler, P., Laepple, T., Landais, A., Langen, P. L., Larsen, L. B., Leuenberger, D., Leuenberger, M., Leuschen, C., Li, J., Lipenkov, V., Martinerie, P., Maselli, O. J., Masson-Delmotte, V., McConnell, J. R., Miller, H., Mini, O., Miyamoto, A., Montagnat-Rentier, M., Mulvaney, R., Muscheler, R., Orsi, A. J., Paden, J., Panton, C., Pattyn, F., Petit, J. R., Pol, K., Popp, T., Possnert, G., Prié, F., Prokopiou, M., Quiquet, A., Rasmussen, S. O., Raynaud, D., Ren, J., Reutenauer, C., Ritz, C., Röckmann, T., Rosen, J. L., Rubino, M., Rybak, O., Samyn, D., Sapart, C. J., Schilt, A., Schmidt, A. M., Schwander, J., Schüpbach, S., Seierstad, I., Severinghaus, J. P., Sheldon, S., Simonsen, S. B., Sjolte, J., Solgaard, A. M., Sowers, T., Sperlich, P., Steen-Larsen, H. C., Steffen, K., Steffensen, J. P., Steinhage, D., Stocker, T. F., Stowasser, C., Sturevik, A. S., Sturges, W. T., Sveinbjörnsdottir, A., Svensson, A., Tison, J. L., Uetake, J., Vallelonga, P., Van De Wal, R. S., Van Der Wel, G., Vaughn, B. H., Vinther, B., Waddington, E., Wegner, A., Weikusat, I., White, J. W., Wilhelms, F., Winstrup, M., Witrant, E., Wolff, E. W., Xiao, C., and Zheng, J.: Eemian interglacial reconstructed from a Greenland folded ice core, Nature, 493, 489–494, https://doi.org/10.1038/nature11789, 2013. a
de Angelis, M., Tison, J. L., Morel-Fourcade, M. C., and Susini, J.: Micro-investigation of EPICA Dome C bottom ice: Evidence of long term in situ processes involving acid-salt interactions, mineral dust, and organic matter, Quaternary Sci. Rev., 78, 248–265, https://doi.org/10.1016/j.quascirev.2013.08.012, 2013. a, b
Della Lunga, D., Müller, W., Rasmussen, S. O., and Svensson, A.: Location of cation impurities in NGRIP deep ice revealed by cryo-cell UV-laser-ablation ICPMS, J. Glaciol., 60, 970–988, https://doi.org/10.3189/2014JoG13J199, 2014. a, b
Eichler, J., Kleitz, I., Bayer-Giraldi, M., Jansen, D., Kipfstuhl, S., Shigeyama, W., Weikusat, C., and Weikusat, I.: Location and distribution of micro-inclusions in the EDML and NEEM ice cores using optical microscopy and in situ Raman spectroscopy, The Cryosphere, 11, 1075–1090, https://doi.org/10.5194/tc-11-1075-2017, 2017. a, b
Eichler, J., Weikusat, C., Wegner, A., Twarloh, B., Behrens, M., Fischer, H., Hörhold, M., Jansen, D., Kipfstuhl, S., Ruth, U., Wilhelms, F., and Weikusat, I.: Impurity Analysis and Microstructure Along the Climatic Transition From MIS 6 Into 5e in the EDML Ice Core Using Cryo-Raman Microscopy, Front. Earth Sci., 7, 1–16, https://doi.org/10.3389/feart.2019.00020, 2019. a, b, c, d, e, f, g, h, i, j, k, l, m, n, o, p, q, r, s, t, u, v
EPICA Community Members: Eight glacial cycles from an Antarctic ice core EPICA community members, Nature, 429, 623–628, 2004. a
Erhardt, T., Jensen, C. M., Borovinskaya, O., and Fischer, H.: Single Particle Characterization and Total Elemental Concentration Measurements in Polar Ice Using Continuous Flow Analysis-Inductively Coupled Plasma Time-of-Flight Mass Spectrometry, Environ. Sci. Technol., 53, 13275–13283, https://doi.org/10.1021/acs.est.9b03886, 2019. a
Faria, S. H., Freitag, J., and Kipfstuhl, S.: Polar ice structure and the integrity of ice-core paleoclimate records, Quaternary Sci. Rev., 29, 338–351, https://doi.org/10.1016/j.quascirev.2009.10.016, 2010. a, b, c
Faria, S. H., Weikusat, I., and Azuma, N.: The microstructure of polar ice. Part II: State of the art, J. Struct. Geol., 61, 21–49, https://doi.org/10.1016/j.jsg.2013.11.003, 2014. a
Fitzpatrick, J. J., Voigt, D. E., Fegyveresi, J. M., Stevens, N. T., Spencer, M. K., Cole-Dai, J., Alley, R. B., Jardine, G. E., Cravens, E. D., Wilen, L. A., Fudge, T., and Mcconnell, J. R.: Physical properties of the WAIS Divide ice core, J. Glaciol., 60, 1181–1198, https://doi.org/10.3189/2014JoG14J100, 2014. a
Fukazawa, H., Suzuki, D., Ikeda, T., Mae, S., and Hondoh, T.: Raman Spectra of Translational Lattice Vibrations in Polar Ice, J. Phys. Chem. B, 101, 6184–6187, https://doi.org/10.1021/jp963161r, 1997. a
Fukazawa, H., Sugiyama, K., Shinji, M., Narita, H., and Hondoh, T.: Acid ions at triple junction of Antarctic ice observed by Raman scattering, Geophys. Res. Lett., 25, 2845–2848, 1998. a, b, c
Gerber, T. A., Hvidberg, C. S., Rasmussen, S. O., Franke, S., Sinnl, G., Grinsted, A., Jansen, D., and Dahl-Jensen, D.: Upstream flow effects revealed in the EastGRIP ice core using Monte Carlo inversion of a two-dimensional ice-flow model, The Cryosphere, 15, 3655–3679, https://doi.org/10.5194/tc-15-3655-2021, 2021. a, b, c, d
Glen, J. W.: The Effect of Hydrogen Disorder on Dislocation Movement and Plastic Deformation of Ice, Physik der kondensierten Materie, 7, 43–51, 1968. a
Han, C., Do Hur, S., Han, Y., Lee, K., Hong, S., Erhardt, T., Fischer, H., Svensson, A. M., Steffensen, J. P., and Vallelonga, P.: High-resolution isotopic evidence for a potential Saharan provenance of Greenland glacial dust, Scientific Reports, 8, 15582, https://doi.org/10.1038/s41598-018-33859-0, 2018. a
Hörhold, M. W., Laepple, T., Freitag, J., Bigler, M., Fischer, H., and Kipfstuhl, S.: On the impact of impurities on the densification of polar firn, Earth Planet. Sc. Lett., 325–326, 93–99, https://doi.org/10.1016/j.epsl.2011.12.022, 2012. a
Hu, X., Jia, K., Liu, F., Baker, I., and Black, D.: Dislocation Mobility in HCL-doped Ice, Proceedings of the Material Research Society, 375, 287–292, 1995. a
Humphreys, F. and Hatherly, M.: Recrystallization and Related Annealing Phenomena, 2nd edn., Elsevier, https://doi.org/10.1016/B978-0-08-044164-1.X5000-2, 2004. a
Hvidberg, C. S., Grinsted, A., Dahl-Jensen, D., Khan, S. A., Kusk, A., Andersen, J. K., Neckel, N., Solgaard, A., Karlsson, N. B., Kjær, H. A., and Vallelonga, P.: Surface velocity of the Northeast Greenland Ice Stream (NEGIS): assessment of interior velocities derived from satellite data by GPS, The Cryosphere, 14, 3487–3502, https://doi.org/10.5194/tc-14-3487-2020, 2020. a
Iizuka, Y., Horikawa, S., Sakurai, T., Johnson, S., Dahl-Jensen, D., Steffensen, J. P., and Hondoh, T.: A relationship between ion balance and the chemical compounds of salt inclusions found in the Greenland Ice Core Project and Dome Fuji ice cores, J. Geophys. Res.-Atmos., 113, D07303, https://doi.org/10.1029/2007JD009018, 2008. a
Iizuka, Y., Tsuchimoto, A., Hoshina, Y., Sakurai, T., Hansson, M., Karlin, T., Fujita, K., Nakazawa, F., Motoyama, H., and Fujita, S.: The rates of sea salt sulfatization in the atmosphere and surface snow of inland Antarctica, J. Geophys. Res.-Atmos., 117, D04308, https://doi.org/10.1029/2011JD016378, 2012. a
Iliescu, D. and Baker, I.: Effects of impurities and their redistribution during recrystallization of ice crystals, J. Glaciol., 54, 362–370, 2008. a
Jones, S. J. and Glen, J. W.: The effect of dissolved impurities on the mechanical properties of ice crystals, Philos. Mag., 19, 13–24, https://doi.org/10.1080/14786436908217758, 1969. a, b, c
Joughin, I., Smith, B. E., Howat, I. M., Scambos, T., and Moon, T.: Greenland flow variability from ice-sheet-wide velocity mapping, J. Glaciol., 56, 415–430, https://doi.org/10.3189/002214310792447734, 2010. a
Kaufmann, P. R., Federer, U., Hutterli, M. A., Bigler, M., Schüpbach, S., Ruth, U., Schmitt, J., and Stocker, T. F.: An Improved Continuous Flow Analysis System for High-Resolution Field Measurements on Ice Cores, Environ. Sci. Technol., 42, 8044–8050, https://doi.org/10.1021/es8007722, 2008. a, b
Kipfstuhl, S., Hamann, I., Lambrecht, A., Freitag, J., Faria, S. H., Grigoriev, D., Azuma, N.: Microstructure mapping: a new method for imaging deformation-induced microstructural features of ice on the grain scale, J. Glaciol., 52, 398–406, 2006. a, b, c
Lafuente, B., Downs, R. T., Yang, H., and Stone, N.: 1. The power of databases: The RRUFF project, in: Highlights in Mineralogical Crystallography, edited by: Armbruster, T. and Danisi, R. M., De Gruyter, Berlin, 1–30, https://doi.org/10.1515/9783110417104-003, 2015. a
Lecavalier, B. S., Milne, G. A., Simpson, M. J., Wake, L., Huybrechts, P., Tarasov, L., Kjeldsen, K. K., Funder, S., Long, A. J., Woodroffe, S., Dyke, A. S., and Larsen, N. K.: A model of Greenland ice sheet deglaciation constrained by observations of relative sea level and ice extent, Quaternary Sci. Rev., 102, 54–84, https://doi.org/10.1016/j.quascirev.2014.07.018, 2014. a, b, c
Legrand, M. and Mayewski, P.: Glaciochemistry of polar ice cores: A review, Rev. Geophys., 35, 219–243, https://doi.org/10.1029/96RG03527, 1997. a, b, c, d, e
Legrand, M. R. and Delmas, R. J.: Soluble Impurities in Four Antarctic Ice Cores Over the Last 30 000 Years, Ann. Glaciol., 10, 116–120, https://doi.org/10.3189/s0260305500004274, 1988. a
Masson-Delmotte, V., Stenni, B., Pol, K., Braconnot, P., Cattani, O., Falourd, S., Kageyama, M., Jouzel, J., Landais, A., Minster, B., Barnola, J. M., Chappellaz, J., Krinner, G., Johnsen, S., Röthlisberger, R., Hansen, J., Mikolajewicz, U., and Otto-Bliesner, B.: EPICA Dome C record of glacial and interglacial intensities, Quaternary Sci. Rev., 29, 113–128, https://doi.org/10.1016/j.quascirev.2009.09.030, 2010. a
McConnell, J. R., Lamorey, G. W., Lambert, S. W., and Taylor, K. C.: Continuous Ice-Core Chemical Analyses Using Inductively Coupled Plasma Mass Spectrometry, Environ. Sci. Technol., 36, 7–11, https://doi.org/10.1021/es011088z, 2002. a
Miyamoto, A., Narita, H., Hondoh, T., Shoji, H., Kawada, K., Watanabe, O., Dahl-Jensen, D., Gundestrup, N. S., Clausen, H. B., and Duval, P.: Ice-sheet flow conditions deduced from mechanical tests of ice core, Ann. Glaciol., 29, 179–183, https://doi.org/10.3189/172756499781820950, 1999. a
Mojtabavi, S., Wilhelms, F., Cook, E., Davies, S. M., Sinnl, G., Skov Jensen, M., Dahl-Jensen, D., Svensson, A., Vinther, B. M., Kipfstuhl, S., Jones, G., Karlsson, N. B., Faria, S. H., Gkinis, V., Kjær, H. A., Erhardt, T., Berben, S. M. P., Nisancioglu, K. H., Koldtoft, I., and Rasmussen, S. O.: A first chronology for the East Greenland Ice-core Project (EGRIP) over the Holocene and last glacial termination, Clim. Past, 16, 2359–2380, https://doi.org/10.5194/cp-16-2359-2020, 2020a. a, b, c, d, e, f
Mojtabavi, S., Wilhelms, F., Cook, E., Davies, S. M., Sinnl, G., Skov Jensen, M., Dahl-Jensen, D., Svensson, A. M., MøllesøVinther, B., Kipfstuhl, S., Karlsson, N. B., Faria, S. H., Gkinis, V., Kjær, H. A., Erhardt, T., Berben, S. M. P., Nisancioglu, K. H., Koldtoft, I., and Rasmussen, S. O.: Acidity measured with the Electrical Conductivity Method (ECM) on the EGRIP ice core (down to 1383.84 m depth), converted to hydrogen ion concentration, PANGAEA [data set], https://doi.org/10.1594/PANGAEA.922199, 2020b. a, b
Mojtabavi, S., Wilhelms, F., Cook, E., Davies, S. M., Sinnl, G., Skov Jensen, M., Dahl-Jensen, D., Svensson, A. M., Vinther, B. M., Kipfstuhl, S., Karlsson, N. B., Faria, S. H., Gkinis, V., Kjær, H. A., Erhardt, T., Berben, S. M. P., Nisancioglu, K. H., Koldtoft, I., and Rasmussen, S. O.: Specific conductivity measured with the dielectric profiling (DEP) technique on the EGRIP ice core, 13.77–1383.84 m depth, PANGAEA [data set], https://doi.org/10.1594/PANGAEA.919313, 2020c. a, b
Nakazawa, F., Nagatsuka, N., Hirabayashi, M., Goto-Azuma, K., Steffensen, J. P., and Dahl-Jensen, D.: Variation in recent annual snow deposition and seasonality of snow chemistry at the east Greenland ice core project (EGRIP) camp, Greenland, Polar Sci., 27, 100597, https://doi.org/10.1016/j.polar.2020.100597, 2021. a
Neff, P. D.: A review of the brittle ice zone in polar ice cores, Ann. Glaciol., 55, 72–82, https://doi.org/10.3189/2014AoG68A023, 2014. a
Ng, F. S. L.: Pervasive diffusion of climate signals recorded in ice-vein ionic impurities, The Cryosphere, 15, 1787–1810, https://doi.org/10.5194/tc-15-1787-2021, 2021. a
Ohno, H., Lipenkov, V. Y., and Hondoh, T.: Air bubble to clathrate hydrate transformation in polar ice sheets: A reconsideration based on the new data from Dome Fuji ice core, Geophys. Res. Lett., 31, L21401, https://doi.org/10.1029/2004GL021151, 2004. a
Ohno, H., Igarashi, M., and Hondoh, T.: Salt inclusions in polar ice core: Location and chemical form of water-soluble impurities, Earth Planet. Sc. Lett., 232, 171–178, https://doi.org/10.1016/j.epsl.2005.01.001, 2005. a, b, c, d, e, f, g, h, i, j, k, l, m, n
Ohno, H., Igarashi, M., and Hondoh, T.: Characteristics of salt inclusions in polar ice from Dome Fuji, East Antarctica, Geophys. Res. Lett., 33, L08501, https://doi.org/10.1029/2006GL025774, 2006. a
Ohno, H., Lipenkov, V. Y., and Hondoh, T.: Formation of air clathrate hydrates in polar ice sheets: heterogeneous nucleation induced by micro-inclusions, J. Glaciol., 56, 917–921, https://doi.org/10.3189/002214310794457317, 2010. a
Ohno, H., Iizuka, Y., Horikawa, S., Sakurai, T., Hondoh, T., and Motoyama, H.: Potassium alum and aluminum sulfate micro-inclusions in polar ice from Dome Fuji, East Antarctica, Polar Sci., 8, 1–9, https://doi.org/10.1016/j.polar.2013.11.003, 2014. a
Paterson, W. S. B.: Why ice-age ice is sometimes “soft”, Cold Reg. Sci. Technol., 20, 75–98, 1991. a, b, c
Petit, J. R., Duval, P., and Lorius, C.: Long-term climatic changes indicated by crystal growth in polar ice, Nature, 326, 62–64, 1987. a
Petrenko, V. F. and Whitworth, R. W.: Physics of ice, 1st edn., Clarendon Press, London, ISBN 9780191581342, 1999. a
Raman, C. V. and Krishnan, K. S.: A New Type of Secondary Radiation, Nature, 121, 501–502, 1928. a
Reinhardt, H., Kriews, M., Miller, H., Schrems, O., Lüdke, C., Hoffmann, E., and Skole, J.: Laser ablation inductively coupled plasma mass spectrometry: a new tool for trace element analysis in ice cores, Fresen. J. Anal. Chem., 370, 629–636, https://doi.org/10.1007/s002160100853, 2001. a, b
Röthlisberger, R.: Limited dechlorination of sea-salt aerosols during the last glacial period: Evidence from the European Project for Ice Coring in Antarctica (EPICA) Dome C ice core, J. Geophys. Res., 108, 4526, https://doi.org/10.1029/2003JD003604, 2003. a
Röthlisberger, R., Bigler, M., Hutterli, M., Sommer, S., Stauffer, B., Junghans, H. G., and Wagenbach, D.: Technique for continuous high-resolution analysis of trace substances in firn and ice cores, Environ. Sci. Technol., 34, 338–342, https://doi.org/10.1021/es9907055, 2000a. a
Röthlisberger, R., Hutterli, M. A., Sommer, S., Wolff, E. W., and Mulvaney, R.: Factors controlling nitrate in ice cores: Evidence from the Dome C deep ice core, J. Geophys. Res.-Atmos., 105, 20565–20572, https://doi.org/10.1029/2000JD900264, 2000b. a
Ruth, U., Wagenbach, D., Steffensen, J. P., and Bigler, M.: Continuous record of microparticle concentration and size distribution in the central Greenland NGRIP ice core during the last glacial period, J. Geophys. Res.-Atmos., 108, 4098, https://doi.org/10.1029/2002JD002376, 2003. a, b, c, d
Sakurai, T., Ilzuka, Y., Horlkawa, S., Johnsen, S., Dahl-Jensen, D., Steffensen, J. P., and Hondoh, T.: Direct observation of salts as micro-inclusions in the Greenland GRIP ice core, J. Glaciol., 55, 777–783, https://doi.org/10.3189/002214309790152483, 2009. a, b, c, d, e, f, g, h, i, j, k, l, m
Sakurai, T., Ohno, H., Genceli, F. E., Horikawa, S., Iizuka, Y., Uchida, T., and Hondoh, T.: Magnesium methanesulfonate salt found in the Dome Fuji (Antarctica) ice core, J. Glaciol., 56, 837–842, https://doi.org/10.3189/002214310794457335, 2010. a
Sakurai, T., Ohno, H., Horikawa, S., Iizuka, Y., Uchida, T., Hirakawa, K., and Hondoh, T.: The chemical forms of water-soluble microparticles preserved in the Antarctic ice sheet during Termination I, J. Glaciol., 57, 1027–1032, https://doi.org/10.3189/002214311798843403, 2011. a, b, c, d, e, f, g
Simonsen, M. F., Baccolo, G., Blunier, T., Borunda, A., Delmonte, B., Frei, R., Goldstein, S., Grinsted, A., Kjær, H. A., Sowers, T., Svensson, A., Vinther, B., Vladimirova, D., Winckler, G., Winstrup, M., and Vallelonga, P.: East Greenland ice core dust record reveals timing of Greenland ice sheet advance and retreat, Nat. Commun., 10, 4494, https://doi.org/10.1038/s41467-019-12546-2, 2019. a, b, c
Smith, C. S.: Grains, phases, and interfaces: An introduction of microstructure, Transactions of the American Institute of Mining, Metallurgical, and Petroleum Engineers, 175, 15–51, 1948. a
Steffensen, J. P.: The size distribution of microparticles from selected segments of the Greenland Ice Core Project ice core representing different climatic periods, J. Geophys. Res., 102, 26755–26763, 1997. a, b, c, d
Steffensen, J. P., Andersen, K. K., Bigler, M., Clausen, H. B., Dahl-Jensen, D., Fischer, H., Goto-Azuma, K., Hansson, M., Johnsen, S. J., Jouzel, J., Masson-Delmotte, V., Popp, T., Rasmussen, S. O., Rothlisberger, R., Ruth, U., Stauffer, B., Siggaard-Andersen, M.-L., Sveinbjornsdottir, A. E., Svensson, A., and White, J. W. C.: High-Resolution Greenland Ice Core Data Show Abrupt Climate Change Happens in Few Years, Science, 321, 680–684, https://doi.org/10.1126/science.1157707, 2008. a
Stoll, N., Eichler, J., Hörhold, M., Erhardt, T., Jensen, C., and Weikusat, I.: Microstructure, micro-inclusions, and mineralogy along the EGRIP ice core – Part 1: Localisation of inclusions and deformation patterns, The Cryosphere, 15, 5717–5737, https://doi.org/10.5194/tc-15-5717-2021, 2021a. a, b, c, d, e, f
Stoll, N., Eichler, J., Hörhold, M., Shigeyama, W., and Weikusat, I.: A Review of the Microstructural Location of Impurities and Their Impacts on Deformation, Front. Earth Sci., 8, 615613, https://doi.org/10.3389/feart.2020.615613, 2021b. a, b
Stoll, N., Weikusat, I., and Eichler, J.: Locations of micro-inclusions identified with Raman spectroscopy in eleven samples (138–1340 m) from the EastGRIP ice core, PANGAEA [data set], https://doi.org/10.1594/PANGAEA.933053, 2021c. a
Svensson, A., Biscaye, P. E., and Grousset, F. E.: Characterization of late glacial continental dust in the Greenland Ice Core Project ice core, J. Geophys. Res.-Atmos., 105, 4637–4656, https://doi.org/10.1029/1999JD901093, 2000. a, b
Svensson, A., Nielsen, S. W., Kipfstuhl, S., Johnsen, S. J., Steffensen, J. P., Bigler, M., Ruth, U., and Röthlisberger, R.: Visual stratigraphy of the North Greenland Ice Core Project (NorthGRIP) ice core during the last glacial period, J. Geophys. Res., 110, D02108, https://doi.org/10.1029/2004JD005134, 2005. a, b, c
Syring, N., Stein, R., Fahl, K., Vahlenkamp, M., Zehnich, M., Spielhagen, R. F., and Niessen, F.: Holocene changes in sea-ice cover and polynya formation along the eastern North Greenland shelf: New insights from biomarker records, Quaternary Sci. Rev., 231, 106173, https://doi.org/10.1016/j.quascirev.2020.106173, 2020. a
Thorsteinsson, T., Kipfstuhl, J., and Miller, H.: Textures and fabrics in the GRIP ice core, J. Geophys. Res.-Oceans, 102, 26583–26599, https://doi.org/10.1029/97JC00161, 1997. a
Vallelonga, P. and Svensson, A.: Ice Core Archives of Mineral Dust, in: Mineral Dust, 1st edn., edited by: Knippertz, P. and Stuut, J.-B. W., Springer Netherlands, Dordrecht, 463–485, https://doi.org/10.1007/978-94-017-8978-3_18, 2014. a, b, c
Vallelonga, P., Christianson, K., Alley, R. B., Anandakrishnan, S., Christian, J. E. M., Dahl-Jensen, D., Gkinis, V., Holme, C., Jacobel, R. W., Karlsson, N. B., Keisling, B. A., Kipfstuhl, S., Kjær, H. A., Kristensen, M. E. L., Muto, A., Peters, L. E., Popp, T., Riverman, K. L., Svensson, A. M., Tibuleac, C., Vinther, B. M., Weng, Y., and Winstrup, M.: Initial results from geophysical surveys and shallow coring of the Northeast Greenland Ice Stream (NEGIS), The Cryosphere, 8, 1275–1287, https://doi.org/10.5194/tc-8-1275-2014, 2014. a, b, c
Walker, M., Head, M. J., Berkelhammer, M., Björck, S., Cheng, H., Cwynar, L., Fisher, D., Gkinis, V., Long, A., Lowe, J., Newnham, R., Rasmussen, S. O., and Weiss, H.: Formal ratification of the subdivision of the Holocene Series/Epoch (Quaternary System/Period): two new Global Boundary Stratotype Sections and Points (GSSPs) and three new stages/subseries, Episodes, 41, 213–223, https://doi.org/10.18814/epiiugs/2018/018016, 2018. a
Weertman, J. and Weertman, J. R.: Elementary Dislocation Theory, 1st edn., Oxford University Press, Oxford, ISBN 0024250309, 1992. a
Wegner, A., Fischer, H., Delmonte, B., Petit, J.-R., Erhardt, T., Ruth, U., Svensson, A., Vinther, B., and Miller, H.: The role of seasonality of mineral dust concentration and size on glacial/interglacial dust changes in the EPICA Dronning Maud Land ice core, J. Geophys. Res.-Atmos., 120, 9916–9931, https://doi.org/10.1002/2015JD023608, 2015. a
Weikusat, C., Freitag, J., and Kipfstuhl, S.: Raman spectroscopy of gaseous inclusions in EDML ice core: first results – microbubbles, J. Glaciol., 58, 761–766, https://doi.org/10.3189/2012JoG11J222, 2012. a
Weikusat, C., Kipfstuhl, S., and Weikusat, I.: Raman tomography of natural air hydrates, J. Glaciol., 61, 923–930, https://doi.org/10.3189/2015JoG15J009, 2015. a
Weikusat, I., Westhoff, J., Kipfstuhl, S., and Jansen, D.: Visual stratigraphy of the EastGRIP ice core (14 m–2021 m depth, drilling period 2017–2019), PANGAEA [data set], https://doi.org/10.1594/PANGAEA.925014, 2020. a
Weiss, J., Vidot, J., Gay, M., Arnaud, L., Duval, P., and Petit, J. R.: Dome Concordia ice microstructure: impurities effect on grain growth, Ann. Glaciol., 35, 552–558, https://doi.org/10.3189/172756402781816573, 2002. a
Westhoff, J., Stoll, N., Franke, S., Weikusat, I., Bons, P., Kerch, J., Jansen, D., Kipfstuhl, S., and Dahl-Jensen, D.: A stratigraphy-based method for reconstructing ice core orientation, Ann. Glaciol., 62, 191–202, https://doi.org/10.1017/aog.2020.76, 2020. a
Wilhelms, F., Kipfstuhl, J., Miller, H., Heinloth, K., and Firestone, J.: Precise dielectric profiling of ice cores: a new device with improved guarding and its theory, J. Glaciol., 44, 171–174, 1998. a
Wolff, E. W., Mulvaney, R., and Oatest, K.: The location of impurities in Antarctic ice, Ann. Glaciol., 11, 194–197, 1988. a
Wolff, E. W., Miners, W. D., Moore, J. C., and Paren, J. G.: Factors Controlling the Electrical Conductivity of Ice from the Polar Regions – A Summary, J. Phys. Chem. B, 101, 6090–6094, https://doi.org/10.1021/jp9631543, 1997. a
Young, N. E. and Briner, J. P.: Holocene evolution of the western Greenland Ice Sheet: Assessing geophysical ice-sheet models with geological reconstructions of ice-margin change, Quaternary Sci. Rev., 114, 1–17, https://doi.org/10.1016/j.quascirev.2015.01.018, 2015. a