the Creative Commons Attribution 4.0 License.
the Creative Commons Attribution 4.0 License.
 | 06 Dec 2022
Geophysical measurements of the southernmost microglacier in Europe suggest permafrost occurrence in the Pirin Mountains (Bulgaria)
Gergana Georgieva
Christian Tzankov
Atanas Kisyov
There are no large glaciers in the territory of Bulgaria, but small patches of snow and firn have been observed in the high mountains at the end of summer. Perennial snow patches and microglaciers are considered indicators of permafrost occurrence. The results from the first detailed geophysical investigations of the Snezhnika glacieret, considered to be the southernmost microglacier in Europe, situated in the Golyam Kazan cirque, Pirin Mountains, Bulgaria, are presented in the paper. Ground-penetrating radar (GPR) and 2D electrical resistivity tomography (ERT) were used to estimate the thickness of the microglacier as well as its subsurface structure. Measurements started in 2018 and continued over the next 2 years in order to assess changes in its size and thickness. The mean thickness of Snezhnika is about 4–6 m, reaching 8 m or probably more in some areas. ERT measurements of the deeper parts of the microglacier beds show high electrical resistivities reaching over 60 000 Ωm at a depth of 4–10 m. An anomaly at this depth is likewise distinguishable on the GPR profiles. These anomalies are interpreted as permafrost areas and were consistently observed on the ERT and GPR profiles in the 2 years of the study. These results imply for the first time the existence of permafrost in the Pirin Mountains and in Bulgaria.
- Article
(12915 KB) - Full-text XML
- BibTeX
- EndNote


Of all the glaciers in the world, 82 % are smaller than 0.5 km2 and cover 21 % of the Earth's total glaciated area (Zemp, 2006). Despite their small size, perennial snow patches and microglaciers are an important object of study for their vital role as water reservoirs for many downstream ecosystems (Milner et al., 2009; Barry and Gan, 2011). They are sensitive to climate change although they are less influenced by global changes than glaciers (Glazirin et al., 2004; Williams et al., 2022). Perennial snow patches survive as a result of stabilization processes of accumulation as avalanching and wind-drift snow (Grunewald and Scheithauer, 2010a) and ablation (solar radiation, shading, debris) (Glazirin et al., 2004). Together with microglaciers they are also important for estimating local permafrost areas in high mountains (Hughes, 2014, 2018).
There have been no large glaciers on the territory of Bulgaria since the end of the Pleistocene (Gachev, 2020), but small patches of snow and firn have been observed in the high parts of the Rila and Pirin Mountains at the end of the summer. Two microglaciers are also located in the Pirin Mountains. Snezhnika is the most studied among them (Gruenewald and Scheithauer, 2008; Gachev et al., 2016). It is also called a “glacieret” or microglacier due to observed moraines, indicating movements of the ice mass (Gachev, 2016). It is the modern remains of the Vihren glacier in the Pirin Mountains, and at present it varies in size between 0.02 and 0.07 km2 (Gachev, 2017a). The first measurements of its size were made in the 1960s (Popov, 1964), and systematic measurements have been conducted every year at the end of summer since 1994 (Gruenewald et al., 2008; Gachev, 2016). The size of the microglacier is well monitored, but information about its thickness is sparse. In October 1957, Popov (1962) bored into the middle part of Snezhnika and reached ground at 8 m. He also estimated the structure as follows: the upper 80–100 cm represents an icy layer or icy crust which is under direct influence of the surface temperatures. Beneath this layer there is firn consisting of grain sizes between 1 and 2 cm, increasing with depth. At the end of summer 2006, depth measurements were carried out again and three boreholes were made. The depth in two of them was estimated to be 11 m (Gruenewald et al., 2008). Geophysical measurements for estimation of the thickness and structure of microglacier were not carried out until 2018 (Georgieva et al., 2019; Onaca et al., 2022).
Glaciers and permafrost are well studied separately, but the interaction between them is a topic of fewer publications (Harris and Murton, 2005). Permafrost is a section of the subsurface in which the temperature has been continually below 0 ∘C for at least 2 years (Washburn, 1979; Harris et al., 1988). The definition is exclusively based on the temperature regime, and thus permafrost can exist in any type of sediment or rock (Ingeman-Nielsen, 2005). Permafrost can be absent in areas where glaciers are present, but ice-rich permafrost and ground ice can be formed in front of and beneath glaciers (Harris and Murton, 2005). Mountain permafrost is a good indicator for climate change (Guodong and Dramis, 1992; Fort, 2015). Thawing of permafrost decreases the stability of slopes and can affect infrastructure in mountain regions. The main factor affecting mountain permafrost is topography (Etzelmüller and Frauenfelder, 2009) and especially the topographic conditions influencing incoming solar radiation. According to Gruber and Haeberli (2009), there are two types of surface phenomena indicating the presence of permafrost in mountains – rock glaciers and other creep phenomena and hanging glaciers and ice faces. Damm and Langer (2006) give geomorphological indicators for mountain permafrost, among which are perennial snow patches. Perennial snow patches contribute to local permafrost occurrence and aggradation because they work as a shield with relatively high albedo, protecting the frozen underground from heat flux in summer. The existence of many perennial snow patches in an area in the mountains indicates a wider distribution of permafrost, especially in the shade of surrounding peaks (Haeberli, 1975; Rolshoven, 1982). Although there are high mountains reaching almost 3000 m in Bulgaria with suitable conditions for the presence of permafrost (Dobinski, 2005), there are only a small number of studies on this topic (Onaca et al., 2020). No publications have been found that investigate the long-term state of the frozen subsurface in high mountains in Bulgaria.
With the development of modern technologies and in particular the equipment used in exploration geophysics, high-quality in-depth information can now be obtained. Geophysical techniques such as electrical resistivity tomography (ERT) and ground-penetrating radar (GPR) are widely used today for multi-dimensional investigations of subsurface conditions in permafrost environments and corresponding landforms (Onaca et al., 2022; Navarro and Eisen, 2009; etc.). Until the late 1980s, they were mostly applied in polar regions (see the review by Scott et al., 1990). The ERT technique is a commonly used geophysical method for permafrost evidence and studies (Mares and Tvrdý, 1984; Scott et al., 1990). Geophysical methods are also applied in glacial studies with the GPR technique used for the imaging of glacial subsurface conditions (Navarro and Eisen, 2009) and internal glacial structure (Arcone, 1996).
The application of geophysical methods in mountain permafrost regions is related to changes in the physical properties of earth material mainly associated with the freezing of incorporated water. The degree of change in the physical properties depends on water content, pore size, pore water chemistry, ground temperature, and pressure on the material (Hoekstra and McNeill, 1973; Hoekstra and Delaney, 1974; King, 1984; King et al., 1988; Scott et al., 1990). When applied on permafrost, most geophysical methods detect parameters correlated to ice content (Hauck, 2001) like high electrical resistivities (Yakupov, 1973).
Using GPR and ERT methods, the structure, depth, and extent of frozen areas beneath and near the snow field, as well as the location of accompanying snow bodies and karst formations, can be determined relatively quickly and easily (Scott et al., 1990; Dimovski and Stoyanov, 2015; Kisyov et al., 2018; Georgieva et al., 2019).
GPR is a high-resolution geophysical technique based on the propagation of electromagnetic waves. Dry snow and ice provide the optimal permittivity conditions of the radar signal from all possible geological environments for georadar pulses with a center frequency above 1 MHz. This is due to the extremely low degree of signal attenuation, which is a result of low conductivity and the absence of any dielectric or magnetic relaxation processes above this frequency. The successful application of GPR in glaciology is related to the peculiar dielectric properties of frozen materials and to the large contrast with other geological materials (Evans, 1965; Fitzgerald and Paren, 1975). In employing high-frequency GPR antennas (>400 MHz), good results can be obtained in delineating the internal structure of glaciers or permafrost zones (Annan and Davis, 1976; Berthling et al., 2000; Hinkel et al., 2001; Jørgensen and Andreasen, 2007; Gadek and Grabiec, 2008; Onaca et al., 2015). The advantages of GPR are that data acquisition and processing are relatively fast and the interpretation result can be focused on different depths and scales, with a variety of antenna configurations and frequencies (Pipan et al., 1999, 2000; van der Kruk et al., 2003; Jol, 2009; Zhao et al., 2015, 2016).
On the other hand, snow and ice comprise an ideal environment for exploration as stratigraphically they are made up of horizons with good endurance and characteristic shapes. Glaciers from temperate continental belts may contain layers rich in dust, sand, or rock debris from a few millimeters to tens of meters (Arcone et al., 1995; Lawson et al., 1998). The microglaciers and perennial snow patches in high mountains also contain layers of rock material between thin layers of snow, ice, and firn (Kawashima et al., 1993).
The ERT method can be successfully applied for studying permafrost areas (Kneisel et al., 2008). ERT is sensitive to changes in the electrical properties of rocks, using different electrode circuits both vertically and horizontally (Dimovski et al., 2007). Changes in electrical resistivity depend not only on changes in lithology but also on the presence of water (Hoekstra and McNeill, 1973; Olhoeft, 1978; Dimovski and Stoyanov, 2015) in the cracks and pores of the rocks and its mineralization (Mares and Tvrdý, 1984). The decrease in temperature leads to a decrease in electrolytic activity and hence a decrease in conductivity. This effect is significant below the freezing point, and the resistivities increase exponentially (Hauck, 2001). A marked increase in resistivity at the freezing point has been shown in several field studies (Ikeda, 2006; Kneisel and Kääb, 2007; Mauer and Hauck, 2007; Kneisel et al., 2008; Hilbich et al., 2009; Hausmann et al., 2012; Hauck, 2013; Supper et al., 2014; Onaca et al., 2015; Emmert and Kneisel, 2017). In most permafrost materials, electrolytic conduction takes place, where the current is carried by ions in the pore fluids of the material. In poor conductors with few carriers, such as ice, a slight displacement of electrons with respect to their nuclei produces a dielectric polarization of the material, leading to displacement currents (Telford et al., 1990).
The ERT cross-sections suffer inherently from non-uniqueness as different subsurface features can have similar resistivities. GPR, as an independent method of subsurface investigation, can supply more accurate information about where the boundaries between layers are located. This in turn can be used to give some geological context to the ERT tomograms or even constrain the ERT inversion results. However, there are some limitations in using GPR and ERT methods in mountain regions and highly rugged terrain (Kneisel et al., 2008). A big limitation comprises the accessibility to the study site, the complicated logistics of transporting the measuring equipment, and the aspects regarding a safe system of work. Highly rugged terrain complicates the GPR data processing (Annan, 1999) and needs complex mathematical corrections for relief and proper estimation of the velocity of pulse propagation. The velocity is dependent on the dielectric properties of the media. Particularly in glaciers and permafrost it is a function of the temperature and water, ice, and air content. The abovementioned inaccuracies can cause distortions in the spatial distribution of georadar data and registered boundaries and, accordingly, in the incorrect shape of the boundaries and the thickness of the individual layers and their actual depth. To minimize the inaccuracies, the relief can be estimated using, for example, unmanned aerial vehicles (UAVs) (Turner et al., 2012; Sanz-Ablanedo et al., 2018). The velocities can be estimated using reference values from boreholes or by producing a velocity model based on the radargrams. ERT has limitations when applied in sites covered with coarse gravel or when a thick ice layer is present (Kneisel et al., 2008). Firstly, the effect from coarse gravel is to have bad contact between the electrodes and the ground, while in the second case the high electrical resistivity of ice can hinder the measurements. Distortions in estimating subsurface structure can occur in highly rugged terrain due to inaccurate estimations of the surface and measurement geometry. Interpretation of ERT and GPR data can also be ambiguous, and consequently, it is advisable to use more geophysical methods on one site (Hauck, 2001; Kneisel et al., 2008).
In 2018, 2019, and 2020 geophysical measurements including GPR, 2D ERT, a very short meteorological record, and surface capture with a UAV were conducted by the authors and a team of students in the Golyam Kazan cirque, Pirin Mountains. The aim was to investigate the thickness and internal structure of the Snezhnika microglacier and the subsurface structure near it (within the glacial bed). In addition, we investigated where the meltwater from Snezhnika disappears beneath the microglacier's bed. Even though this glacieret has been monitored since 1994 (Gruenewald et al., 2008), there is not much information about the ice thickness. It is necessary to know the thickness of the microglacier at many points to estimate the ice mass. Further measurements of its size and thickness will allow us to monitor the mass balance of Snezhnika and then determine the relationship between the change in meteorological parameters and the change in ice mass.
2.1 Study site description
The Pirin Mountains comprise a crystalline horst which is part of the Rila–Rhodope massif located in southwestern Bulgaria. The studied site is situated in the northern Pirin Mountains, around the highest peak Vihren (2914 m). This part of the Pirin Mountains consists mainly of marble that makes up the steep ridges and lends the relief its characteristic appearance (Boyadjiev, 1959). It has been subject to cryogenesis and karstification since the glaciers' retreat (Gachev, 2017b; Gachev and Mitkov, 2019).
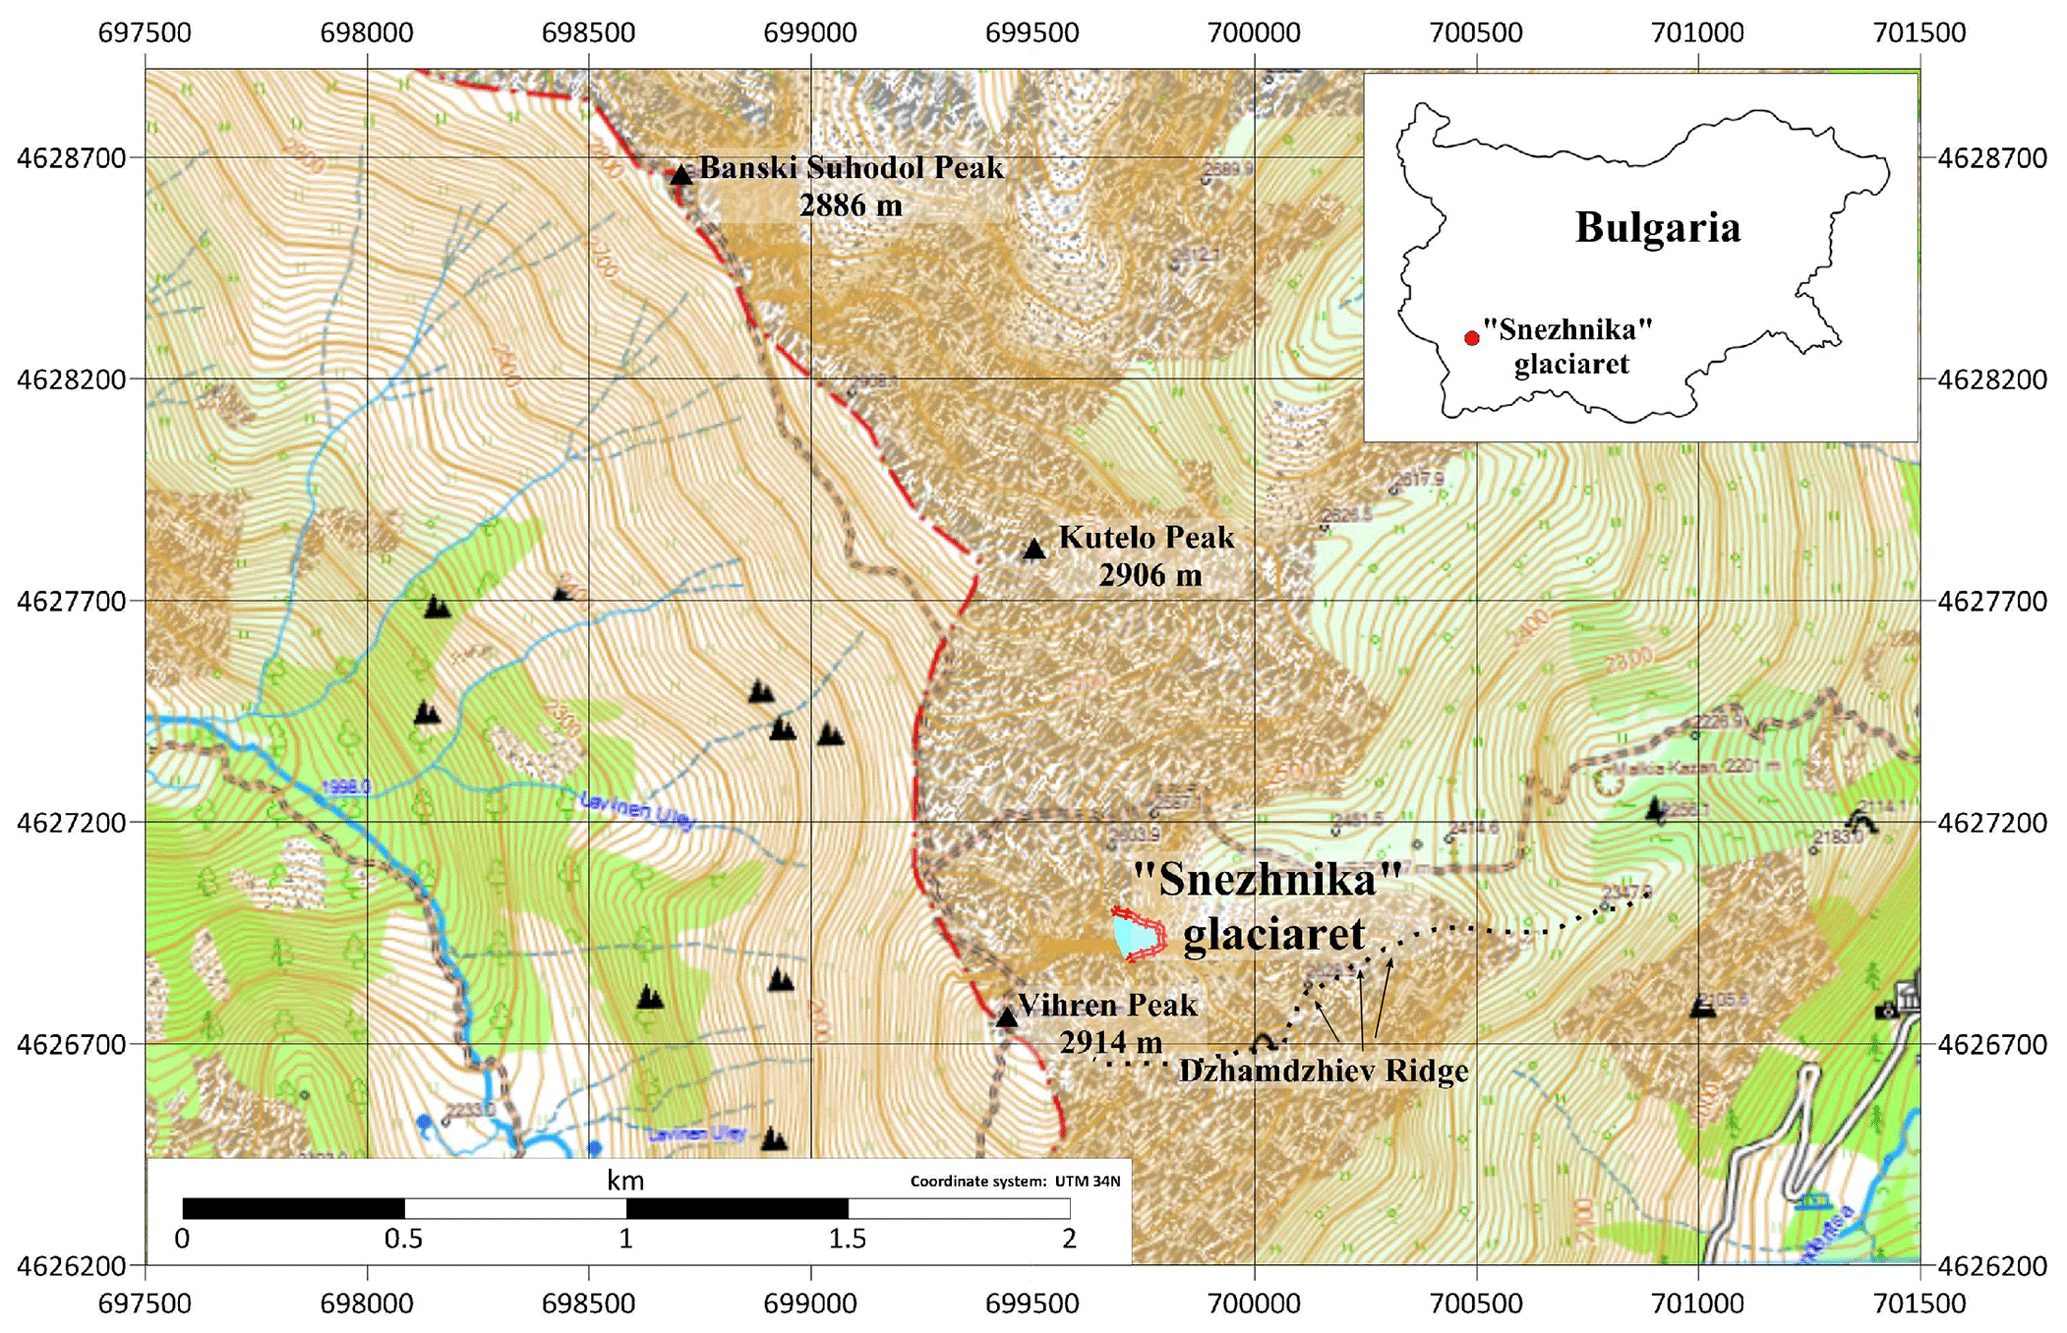
Figure 1Snezhnika microglacier in the Golyam Kazan cirque, surrounded by the highest peaks in the Pirin Mountains – Vihren and Kutelo. On the northern side of the cirque is the Dzhamdzhiev ridge, which starts from the Vihren peak and ends in the valley near the Banderitsa hut. The map base layer is provided by http://karta.bg (last access: 1 December 2022, map version OFRM Geotrade 2022Q1 TOPO LAT).
The Snezhnika microglacier (Gruenewald et al., 2008), noted as the southernmost microglacier in Europe (Grunewald and Scheithauer, 2010b; Gachev, 2017a), is situated in the Golyam Kazan cirque. The location of Snezhnika is determined by the morphological features of the Golyam Kazan cirque, formed between the eastern slope of the Vihren peak and the southern slope of the Kutelo peak (2908 m) (Fig. 1), at around 2400 m a.s.l. It is open to the east, with dimensions of 1200 m by 1250 m and a surface of about 1.2 km2. The western and southern parts of the cirque are outlined by the steeper slope of the Vihren peak and Dzhamdzhiev ridge. The morphology of this slope, in particular the morphology of the Vihren wall, at the base of which the glacieret is located, favors the accumulation of snow masses through avalanches and shading. The Vihren wall rises west of the microglacier and 420 m above its surface. The wall has mainly eastern exposure and partly northern exposure with slopes from 55 to 65∘ (almost half of its area). The largest slopes, reaching in places 85 to 90∘, are characteristic of the lower part of the wall. The steep slopes were formed during the final phase of the last (Würm) glaciation (Popov, 1962, 1964).
The Pirin Mountains are on the crossroads of a Mediterranean and continental climate. Snow cover in the mountains of southwestern Bulgaria is present for 180–200 d annually. The mean maximum thickness of snow is about 180 cm, and the absolute maximum thickness measured until 2005 was about 350 cm (Brown and Petkova, 2007). In the Golyam Kazan Cirque there is low-coverage alpine and subalpine vegetation. It is present mainly in the central part of the cirque and is almost absent in the area of the microglacier. There is no evidence of surface water, lakes, or rivers in the cirque.
The size of Snezhnika microglacier varies from year to year as can be observed in Fig. 2, but no trend can be determined (Gachev, 2016). Therefore, it cannot be said whether its size has decreased or increased starting from the first measurements in 1994 (Gachev, 2016). During the period in which the present study was conducted (2018–2020), the size of Snezhnika decreased. This made it possible to make ERT profiles in the same place over the microglacier's bed where the GPR profiles had been made the previous year.
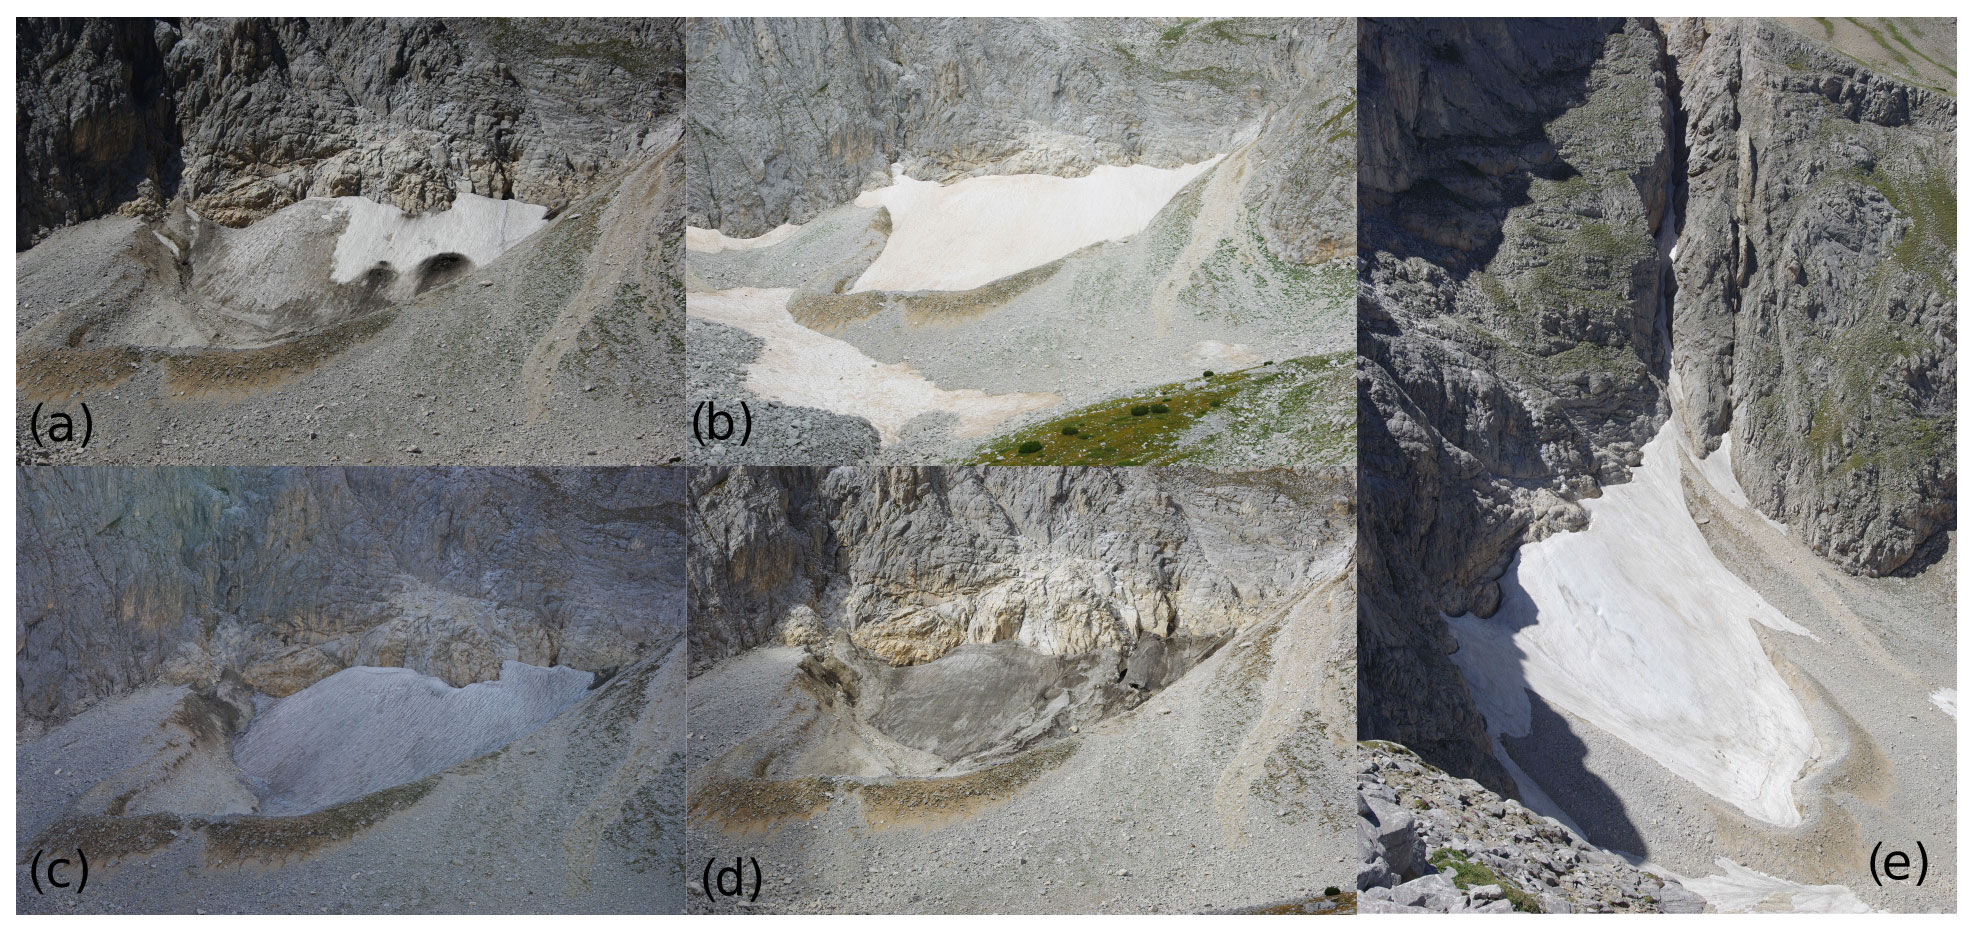
Figure 2Snezhnika microglacier in Golyam Kazan over the years: (a) 25 August 2017, (b) 25 August 2018, (c) 5 October 2019, and (d) 9 October 2020. Picture (e) is taken from the Dzhamdzhiev ridge (near the Vihren peak) on 1 July 2017. The shading of the ridge is already visible.
2.2 Ground-penetrating radar
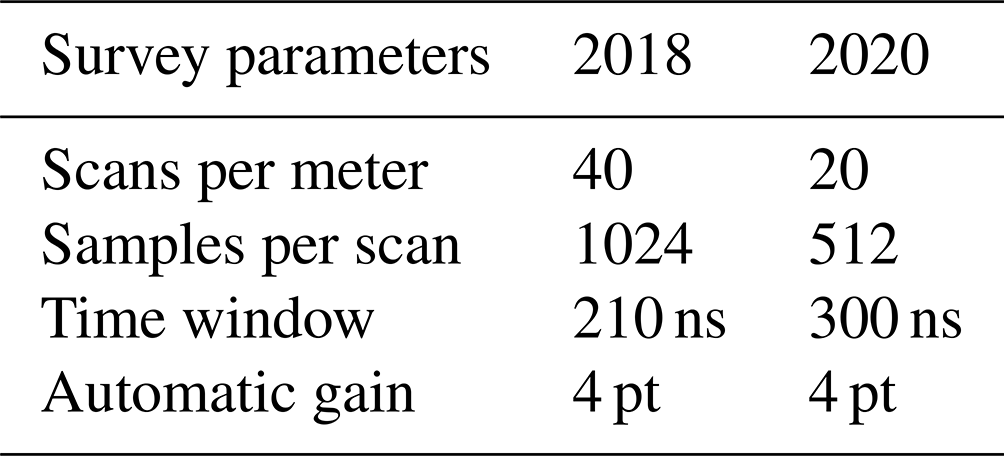
The measurements in the Pirin Mountains were carried out using a GPR system, including a SIR-3000 control unit and 270 MHz antenna model 5104A by GSSI, Inc., USA. The settings used are listed in Table 1. By default, all radargrams are processed with the following processing levels:
-
pre-processing and geometrization of the radargrams (profile length adjustments, orientation flip, declipping of extreme values and multiplying by scaling factor 1.44, dewow by subtracting mean value at a 4 ns time window, resampling the data in the x direction by 2.5 cm trace increments, fixing the zero level by cutting the time section where waves pass through the air before the ground surface),
-
standard filtration and smoothing (cosine-tapered bandpass filter with low cut frequency 50 MHz, lower plateau 75 MHz, upper plateau 550 Mhz, and high cut frequency 750 MHz; 2 d median xy filter in a window of five traces by five samples),
-
signal amplification (profile normalizing by energy equalization of the parallel profiles; profile trace normalizing in order to produce mean amplitude equality distribution for all traces),
-
eliminating horizontal reverberations (applying a background removal filter).
Table 1GPR settings of the measurements.
Infinite impulse response (IIR) filter vertical: low-pass (LP) filter is 700 MHz; high-pass (HP) filter is 75 MHz.
The following generalized lithological media with their estimated mean velocities taken from standard property tables were used for the inverting and interpreting of GPR data in the radargram models: ice 0.15 m ns−1, gravel with ice 0.13 m ns−1, and limestone 0.12 m ns−1 (Baker et al., 2007).
GPR profiles within this study were made in 2018 and 2020. The locations are presented in Fig. 3. The profile coordinates and the outlines of the microglacier in the different years were recorded with Garmin GPSMAP 64st and Garmin GPSMAP 66s with error in the horizontal coordinates of 1–2 m. The exact positions of the profiles and the outline of Snezhnika from 2018 were then evaluated from UAV images, and the accuracy was improved. All profiles from 2018 are perpendicular to the slope and follow the relief's horizontals. The first one, GPR(2018)-01, is located in the lowest and comparatively flattened section of the microglacier, and the last, GPR(2018)-05, is in the highest-elevation area accessible with the gear and tools available at the time. From 2020, two profiles were situated along the slope and two were in the lower part of the microglacier's bed between head moraine and ice. The two profiles along the slope (GPR(2020)-1 and GPR(2020)-2) allowed determining the depth of the ice in the upper parts of the glacieret. There was no repetition of the GPR profile within the 2 years. Efforts were made to cover more of the microglacial area with GPR data and to estimate its thickness in more places. In addition, most of the GPR profiles from 2018 were not a part of the microglacier in 2020.
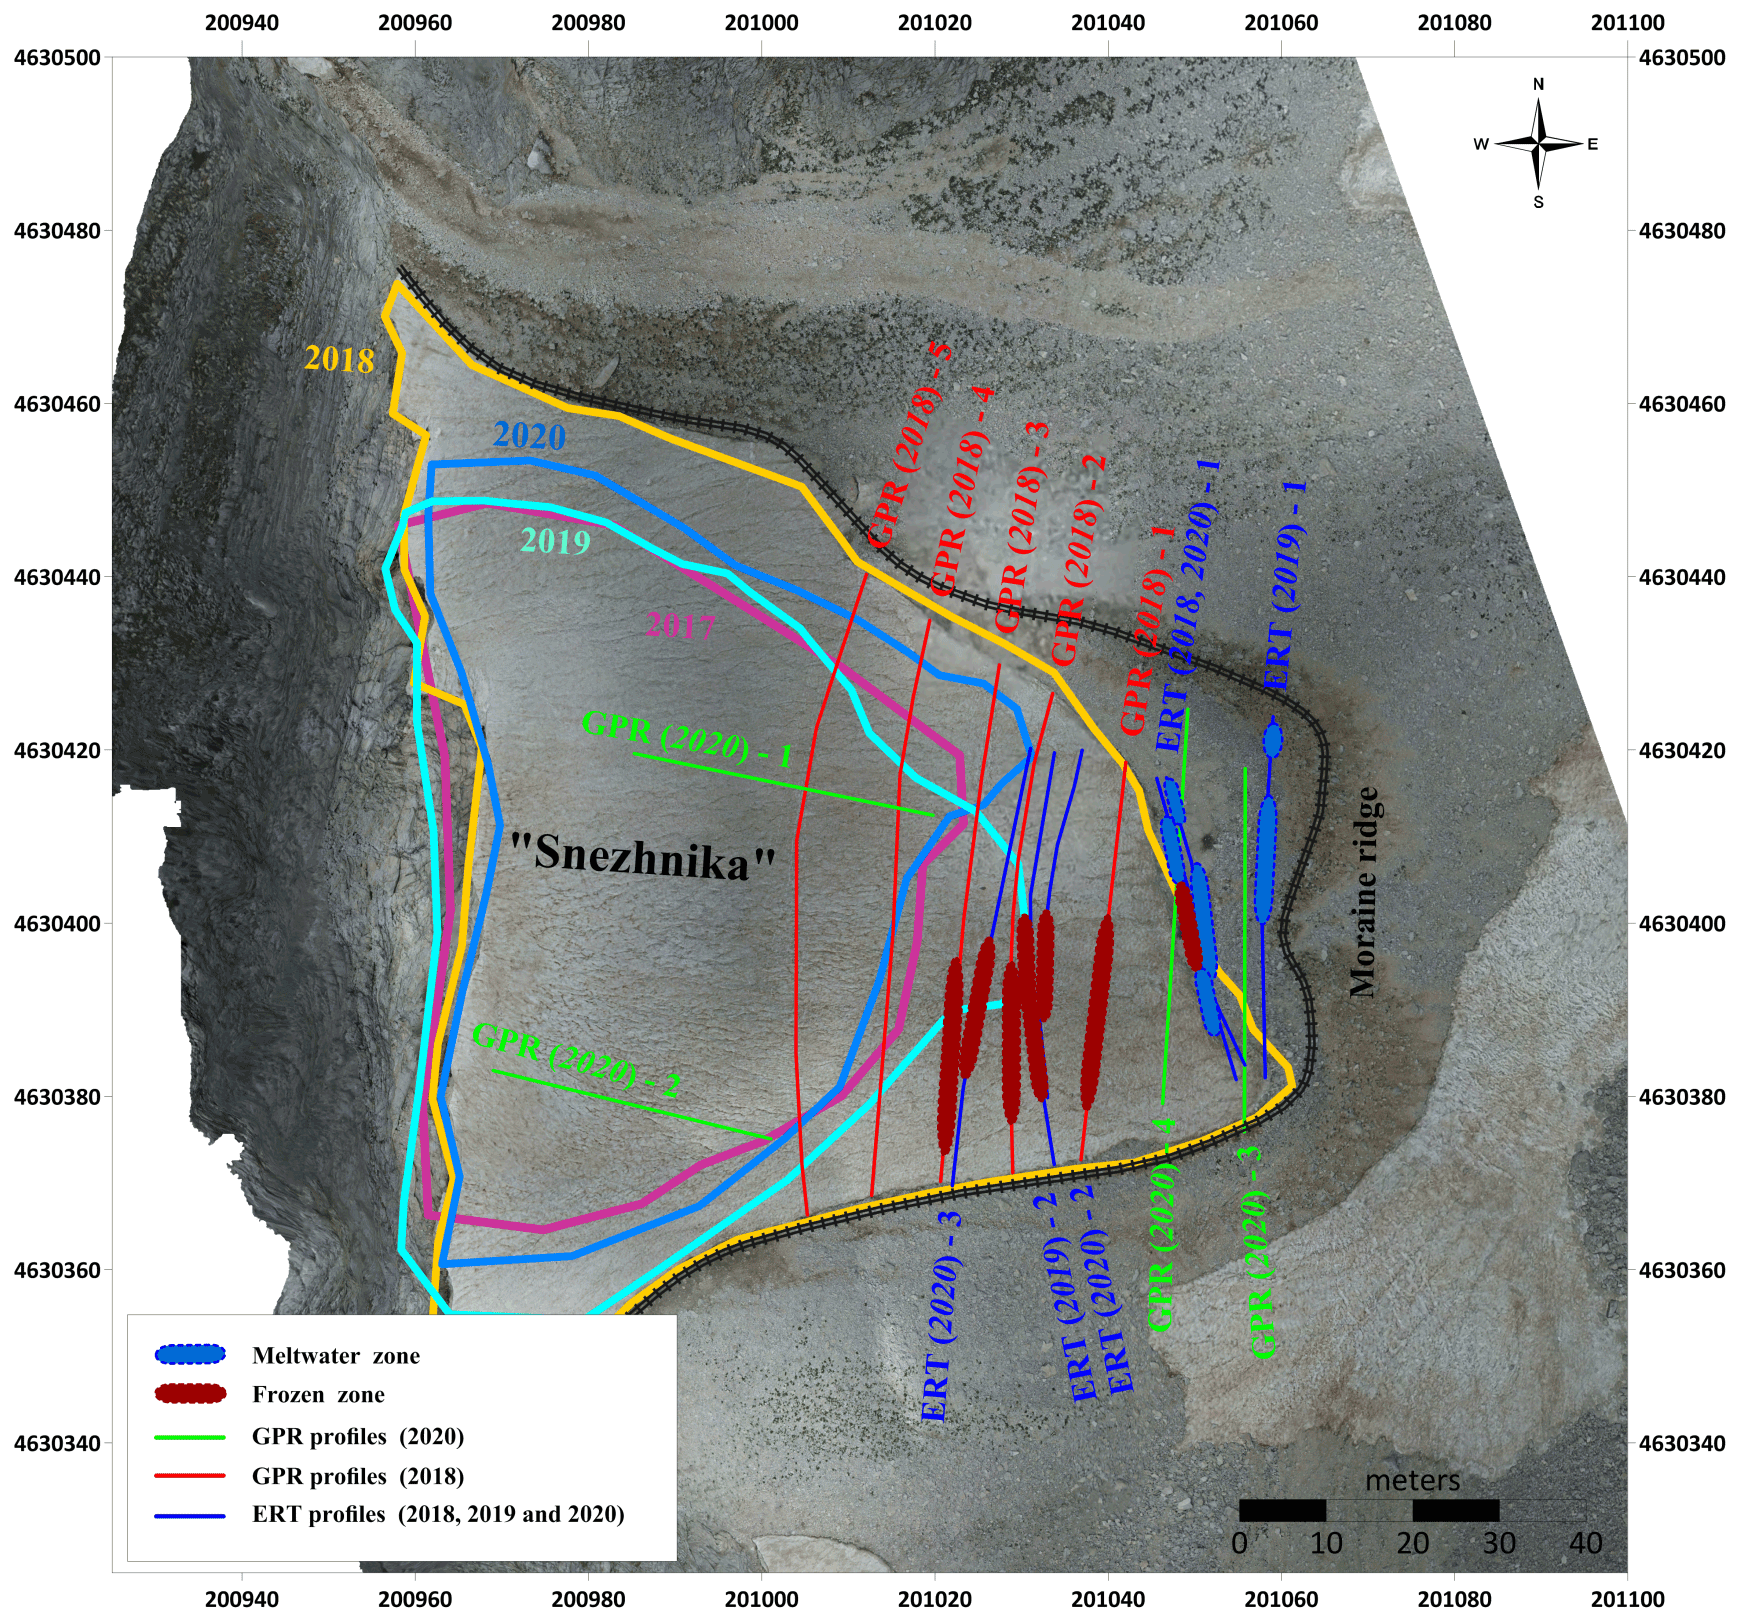
Figure 3Location of all the GPR (red for 2018 and green for 2020) and ERT (blue) profiles in the Snezhnika area. The size of the glacieret between 2017 and 2020 is given with lines in different colors. Bold red lines show the position of the permafrost area, and bold blue lines show the location of meltwater (subsurface drainage system). The background picture, as well as the moraine ridge outline (black line), is made with the UAV in 2018 on the same day as the measurements.
2.3 Electrical resistivity method
Based on other surveys conducted in different areas of Europe (Hauck, 2001; Ingeman-Nielsen, 2005; Mauer and Hauck, 2007; Supper et al., 2014), the most suitable parameters of the measuring scheme were determined for optimal results when observing permafrost. Measurements in the Pirin Mountains were carried out using 24 electrodes connected to a resistivity meter ABEM SAS 1000. The field measurements were performed utilizing a four-electrode Schlumberger array. The multi-electrode resistivity technique consists in using a multi-core cable with 24 conductors, as electrodes are plugged into the ground at a fixed spacing. The number of 24 electrodes allowed 121 measurements per profile. The relays which ensure the switching of those electrodes according to a sequence of readings predefined and stored in the internal memory of the equipment are located in the resistivity meter itself. The various combinations of transmitting (A, B) and receiving (M, N) pairs of electrodes construct the mixed sounding–profiling section, with a maximum investigation depth which mainly depends on the total length of the cable. The lengths of the profiles were chosen to have the maximum length and depth of study while not having to cross over the moraine ridge of the microglacier (which was unstable and dangerous for climbing). Profiles are around 30–40 m long with a north–south direction and electrode spacing of 1.5 m. The depth of the study depends on the distance between the electrodes and the geometry of the circuit; the gradual increase in distance makes it possible to increase the depth of the subsurface study. In our study, a maximum depth of 9–10 m is reached, and for most of the profiles the expected depth at this length of the measuring line with the multi-electrode system was 6–7 m. The selected length of the profiles and the type of measuring scheme were in accordance with the conditions in the field (namely, the width of the glacier bed and safe access to the first and last electrodes).
The ERT data obtained were processed with RES2DINV (Loke, 2001, 2010). Data preprocessing includes extermination of bad data points and applying of a vertical–horizontal filter weight. An option for the effect reduction of side blocks and obtaining smooth anomalies is also used. First, a trial inversion is made, and afterwards, an RMSE (root-mean-square error) is calculated. Then, the data points with extreme values are removed and the inversion is made again.
ERT measurements near Snezhnika were conducted in 2018, 2019, and 2020 along one, two, and three profiles, respectively. They were situated in the lower part of the microglacier's bed on an area without any ice and snow cover (depending on the size of the microglacier in the respective year, Fig. 2). Thus, the first profile was measured over in each of the 3 years, the second twice, and the third only in 2020. The last profile crosses a small part of the microglacier (Fig. 3). A pseudo-section of the apparent resistivity for each profile was then obtained. It consists of the measured values at certain points along horizontal lines at a certain depth. In order to obtain a model of electrical resistivity, an inversion algorithm proposed by Loke et al. (1996) was used in which a starting resistivity model is iteratively adjusted in order to achieve the best fit with the measured apparent resistivity values.
In addition to both the main geophysical methods, a digital terrain model (DTM) of Snezhnika with a resolution of 7.63 cm px−1 was produced using UAV photogrammetry. The elevations in the study are taken from topographical maps at a scale of 1:5000, from the DTM produced and the GPS data.
Measurements were made on 25 August 2018, 4–5 October 2019, and 8–9 October 2020. Harsh weather conditions in the mountain prevented data acquisition on the same date every year. The time of measurements was chosen to be at the end of the summer and before the first snow in the mountain when the size of the glacieret is expected to be the smallest. This measurement window is relative, changing from one year to another, with 2017 and 2018 seeing the first snowfall in September, whereas in 2020, with a warm October, the first snowfall was recorded at the end of November.
3.1 Thickness of Snezhnika microglacier
The thickness and internal structure of the Snezhnika microglacier were investigated using only GPR. Nine radargrams were obtained, analyzed, and interpreted, and seven of them are presented in Figs. 4 and 5. Across these radargrams the discontinuity between the microglacier's ice and bed is well visible. On the other two profiles, situated in an area free from ice, this discontinuity is not presented.
In Fig. 4 are presented radargrams from 2018, which are horizontal relative to the slope. The uppermost layer represents the microglacier. Its depth varies between 1–2 m in the lowest part (Fig. 4a) and 5–6 m on the last profile (Fig. 4e). In 2018 the size of microglacier was bigger than in 2017 (Figs. 2a and 3) and, accordingly, its lowest part consists only of the snow left from the last winter. This can be observed on profiles GPR(2018)-1 and GPR(2018)-2 and partially on GPR(2018)-3 (Fig. 4a, b, and c) situated in the lowest part of the microglacier. Within the first layer, there are some less differentiated discontinuities. They are probably related to periods of snow accumulation in winter, avalanches, and periods of warm and cold weather during the winter of 2017/18 when the melting and freezing that occurred formed thin ice crusts.
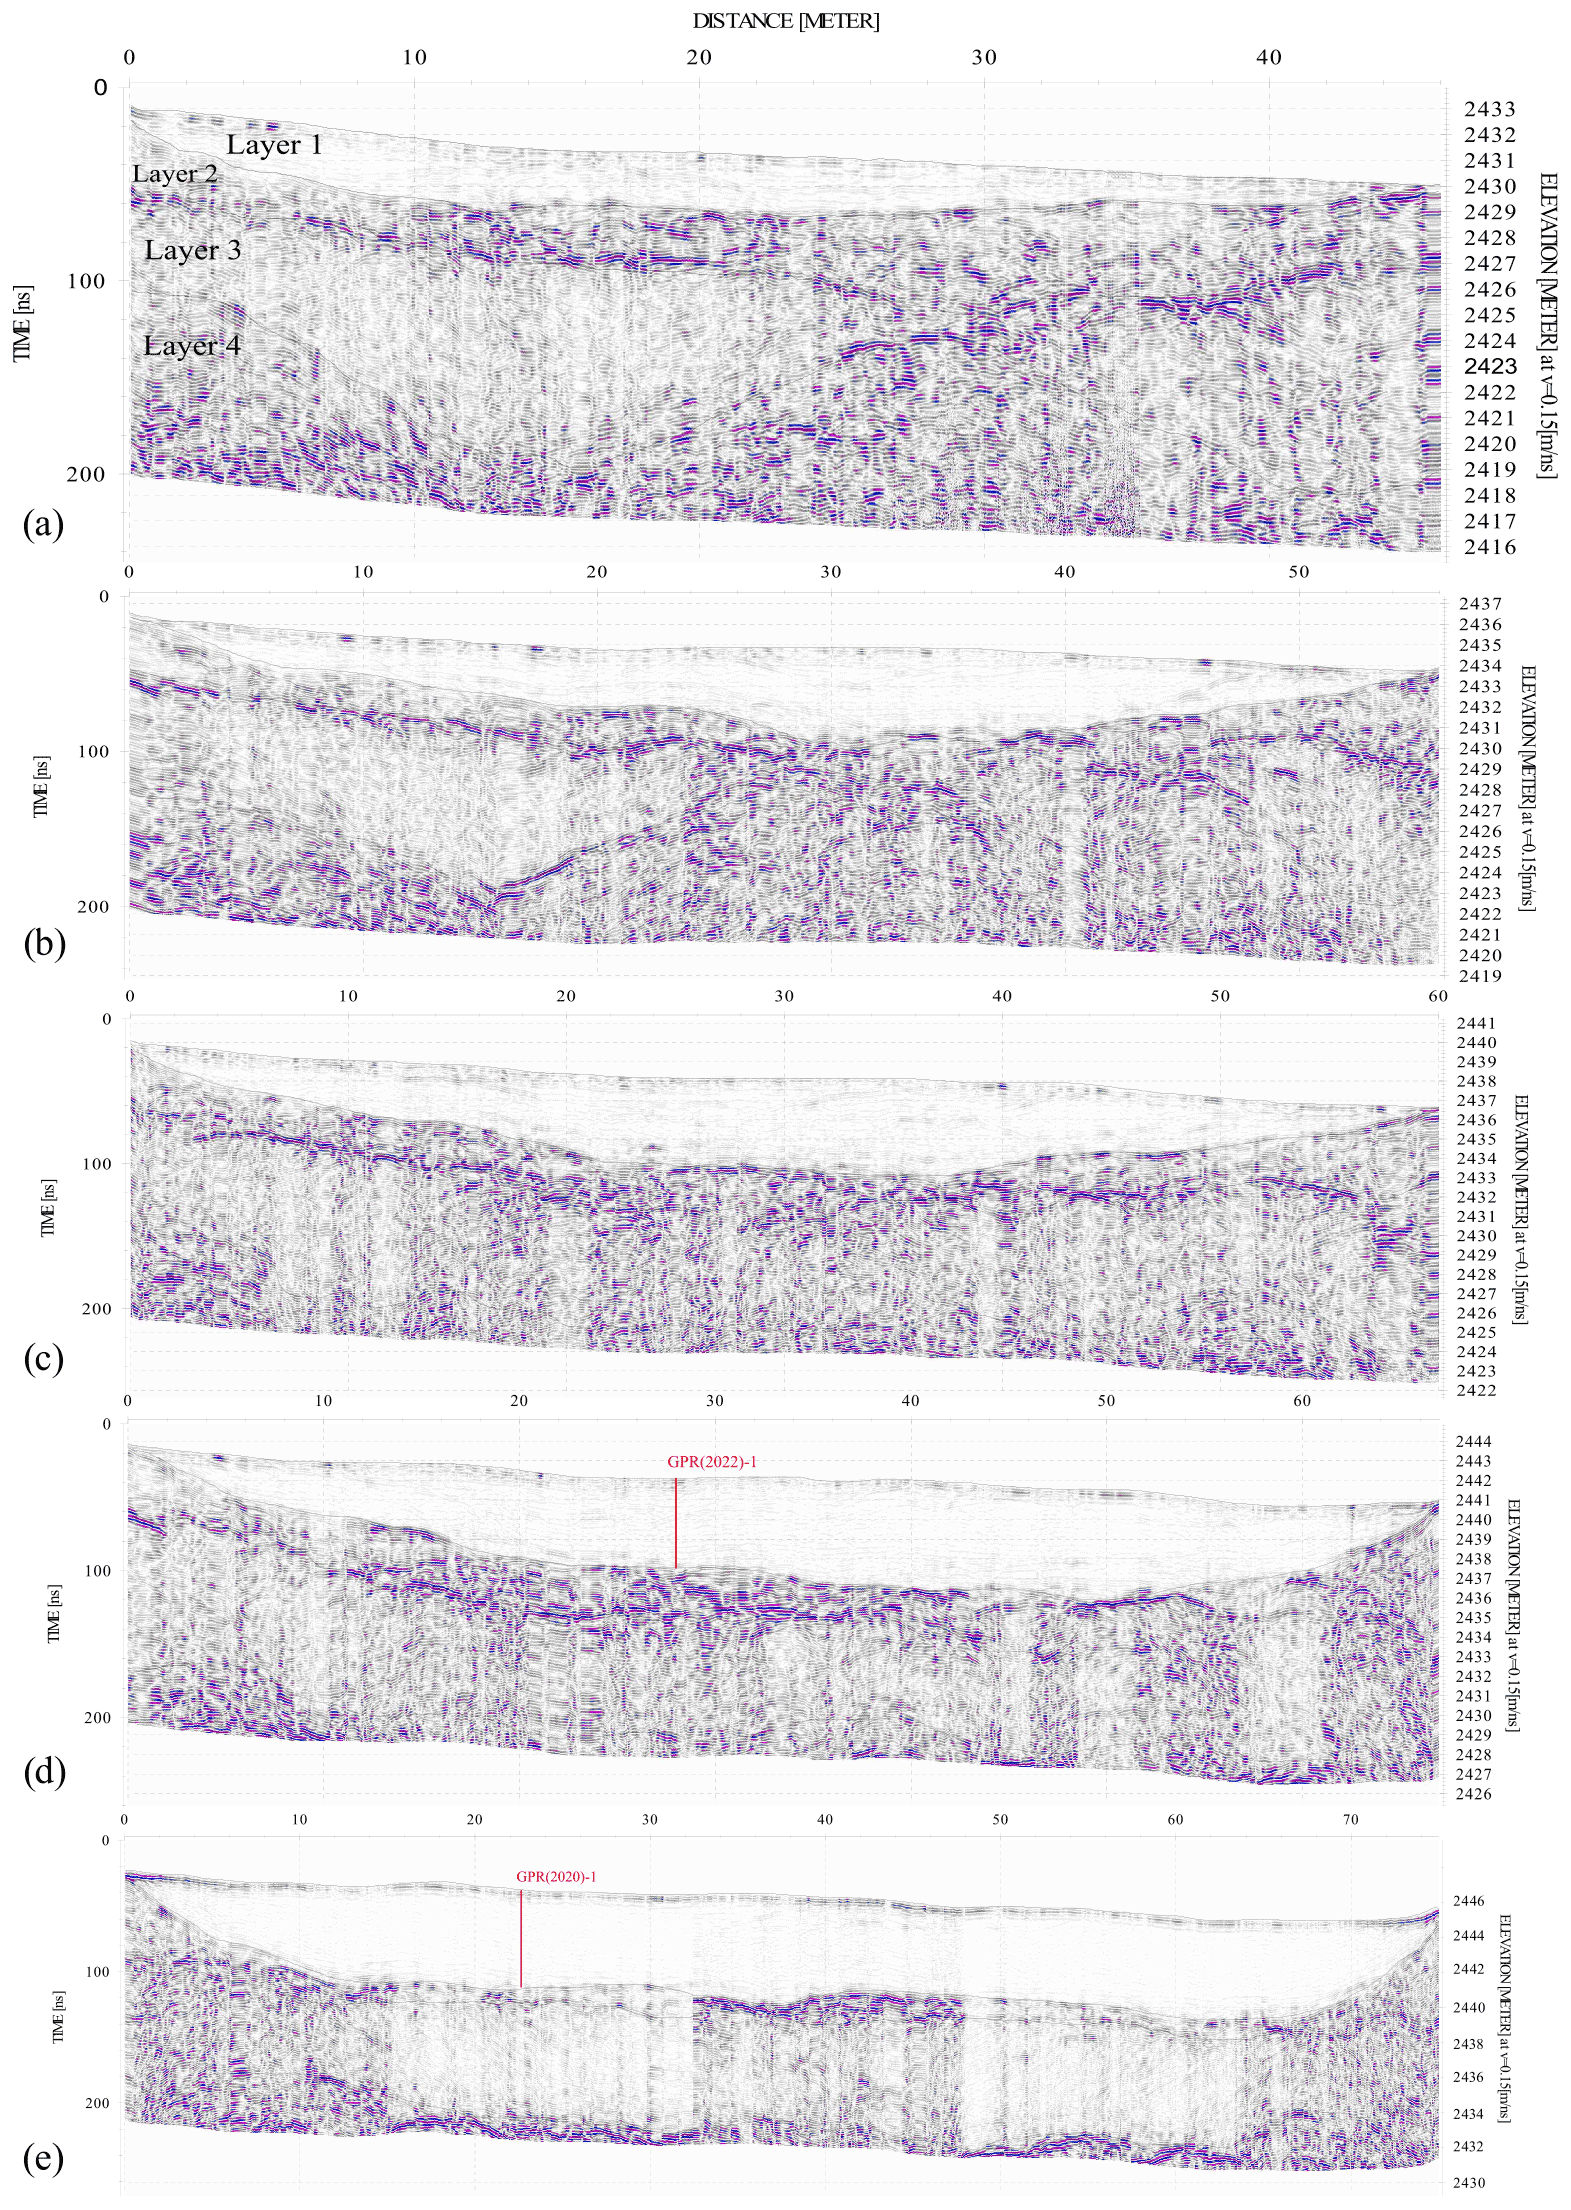
Figure 4GPR profiles from 2018: (a) GPR(2018)-1 situated at the lowest altitude; (b) GPR(2018)-2; (c) GPR(2018)-3; (d) GPR(2018)-4; (e) GPR(2018)-5 situated at the highest altitude. All profiles are with horizontal elevation. Red lines indicate the point of intersection with GPR(2020)-1.
The second layer lies under the snow and the ice, representing the glacial bed which consists of cobbles and pebbles. The voids between them are filled with water, and this area has low resistivity values on ERT profiles. It is presumed that this layer drains the melted glacial water. The thickness of this layer varies from 1 to 4 m along the particular lines, and its depth is between 3.5–6 m on the first profile (Fig. 4a) and 5–8 m on the last one (Fig. 4e).
The third layer has a complex topography along the lower-elevation survey lines, while along the higher-elevation lines (GPR(2018)-03, GPR(2018)-04, and GPR(2018)-05; Fig. 4c, d, and e) it becomes almost parallel to the one above with a thickness of 4–6 m. In the first and second profiles (GPR(2018)-01 and GPR(2018)-02), the layer is relatively thin in its central part (about 1 m), while two pocket-like recesses with thickness of up to about 6–7 m (and depth 10–12 m from the ground level) are formed along the left part. The presence of ice causes a decrease in reflections of electromagnetic waves, and based on this it is assumed that the pocket-like structures are ice lenses or ice-rich areas.
Pale rectangular areas are visible on the radargrams. They are most visible on the higher-elevation profile (GPR(2018)-05, Fig. 4e). They have no scientific meaning and are the result of technical difficulties due to the steep slope in the upper part of the microglacier. The measurements were stopped and resumed several times, and this caused gain level changes in some places.

Figure 5GPR profiles from 2020 along the slope of Snezhnika: (a) GPR(2020)-1 north; (b) GPR(2020)-2 south. Red lines indicate the point of intersection of GPR(2020)-1 with GPR(2018)-4 and GPR(2018)-5.
In 2020 two more GPR profiles were made on Snezhnika in order to add more information about the thickness of the ice. The first profile (GPR(2020)-1, Fig. 5a) clearly outlines the lower surface of the glacieret with a depth of between 4 and 7 m. At the beginning of the profile (left part of radargram), fading of the phases is observed at a greater depth (>7 m), which may be due to a frozen zone beneath the upper part of the microglacier. In the first half of the radargram a hill-like structure is visible, which is interpreted as a plucking zone of the microglacier. On the right part of the profile the discontinuity between the microglacier's ice and the bed has the greatest depth of 7 m, which becomes shallower at the end of the profile, in the last 4–5 m of it. Beneath the lowest part of the microglacier another hill-like structure is visible. It can be interpreted as the new head moraine.
In the second profile (GPR(2020)-2, Fig. 5b), the relief of the lower surface is clearly traced at a depth of about 8 m. Here, a layer with a depth of 4 to 8 m is distinguished, which is composed of either frozen and well-joined rock blocks or older ice. At the lower end of the profile (right part of the radargram), single reflections can be observed in this layer, caused by boulders covered by ice.
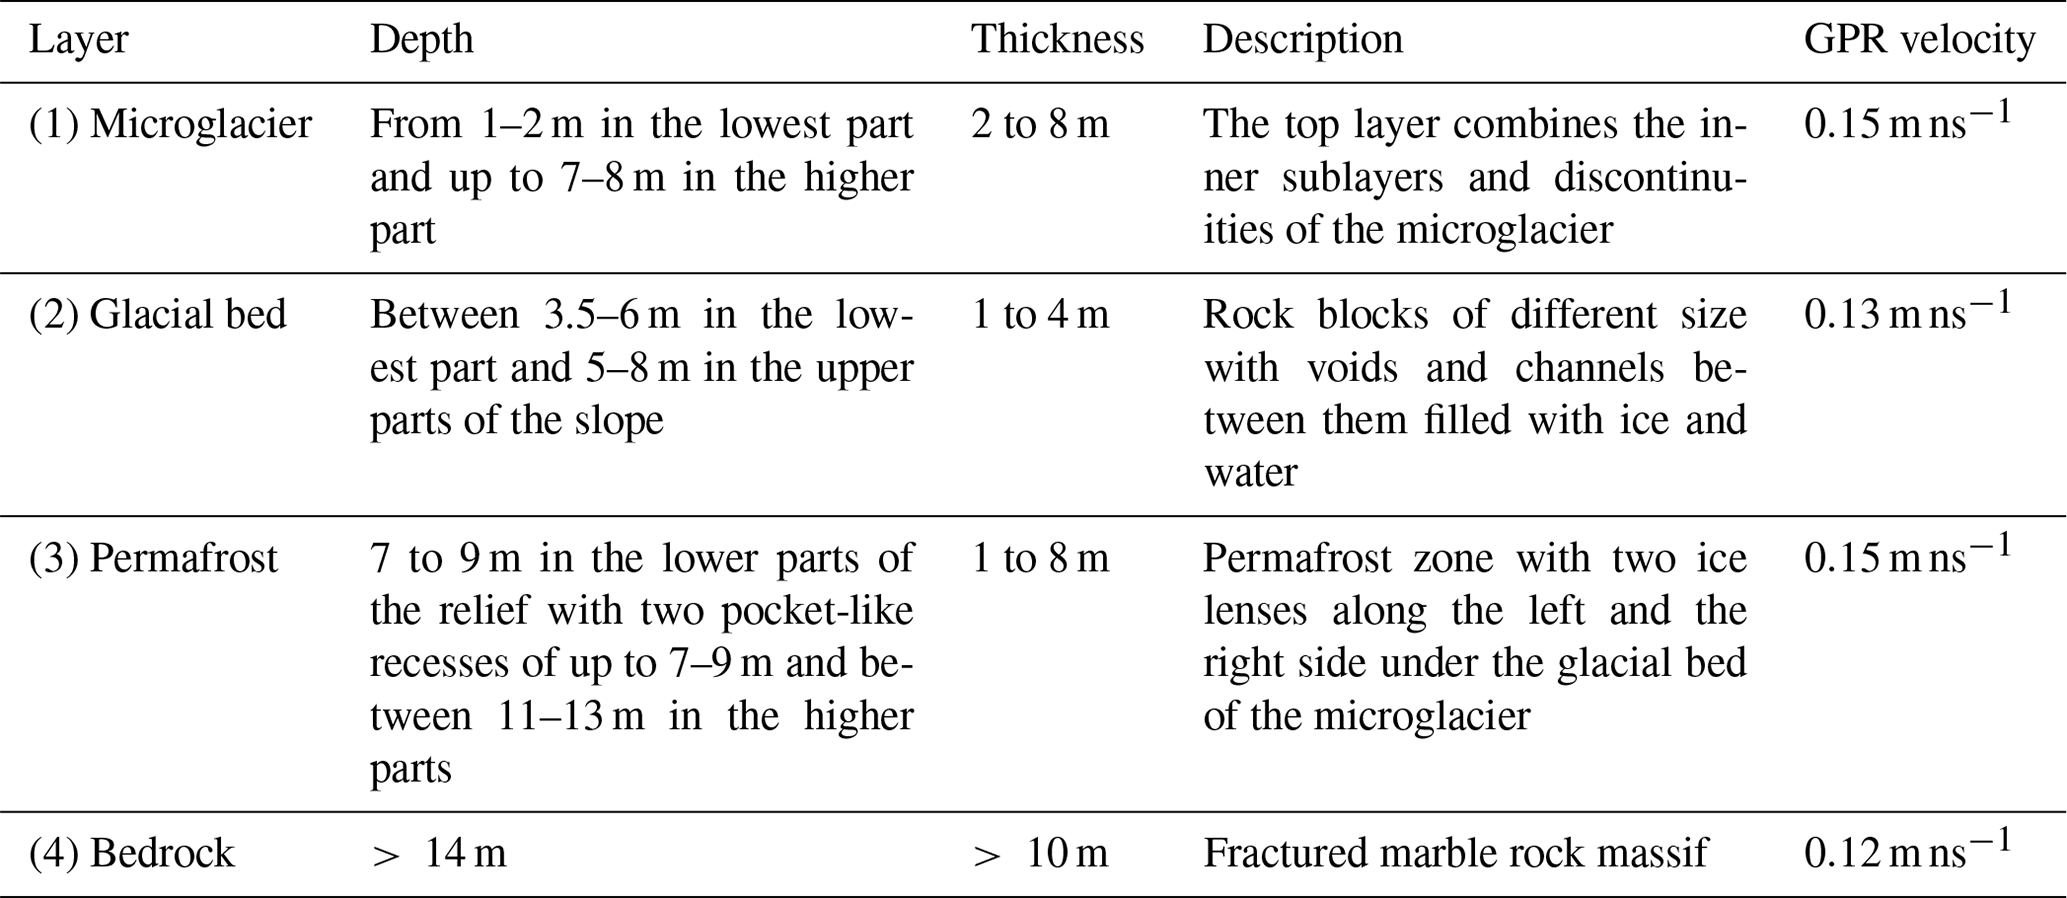
The obtained depths of Snezhnika in 2020 correlate very well with the results obtained in 2018. At that time, the depth in the uppermost profile is about 6–7 m (Fig. 4e). Profile GPR(2020)-1 intersects profiles GPR(2018)-4 and GPR(2018)-5, and as can be seen from Figs. 3 and 5a the place of intersection is also the place of the greatest thickness, with a depth of 7 m. The deepest part of the microglacier is detected on GPR(2020)-2, where the thickness of the ice is 8 m. This profile is located in the southern part of microglacier, which is most shaded by the Vihren wall and Dzhamdzhiev ridge (Fig. 2e). The effect of shading is also well visible in Fig. 4a where the snow layer is thicker in the southern part of the profile. The obtained maximum thickness of the microglacier shows agreement with the results from early borehole measurements conducted by Popov (1962). The depth of 11 m obtained by Gruenewald et al. (2008) is not detected. It should be noted that borehole measurements of depth give only point information, compared to the profile measurements conducted by the authors. The whole area of the microglacier was not covered by GPR profiles in years 2018 and 2020, and this can be a reason for not observing a depth greater than 8 m. Onaca et al. (2022) measured a depth of the border between ice and gravel of 12 m in a small area in the upper part of the microglacier, which is probably the maximum estimated thickness of Snezhnika. GPR profiles made within the present study do not cross this area. This indicates a necessity for using a thicker net of GPR profiles in the future to better map the lower border of the microglacier. The main layers outlined in the study area are also presented in Table 2.
3.2 Subsurface structure of microglacier's bed
The two GPR profiles from 2020, situated in the glacial bed and in the lower-in-elevation part of the investigated area (Fig. 3), were also covered by ERT measurements. Figure 6 shows the electrical resistivity values for profile ERT-1, measured in 2018, 2019, and 2020. In the resulting plot, three zones can be clearly distinguished. Zone 1 is situated near the surface and represents a mix mainly of pebbles and cobbles. It is characterized by a relatively high electrical resistivity of 8000 to 40 000 Ωm. Based on these values (Dortman, 1984) and the lithology of the area, it can be assumed that this layer consists of broken marble rock. In 2018 (Fig. 6c) the thickness of this zone is 1.5–2 m, and in the next 2 years it reaches up to 4 m (Fig. 6a and b). Below the first zone, at a depth of 1 to 5 m, the second zone is located (Zone 2). It is characterized by relatively low values of specific electrical resistivity within the range of 1000 to 8000 Ωm. This zone represents a highly watered zone. Its size is smaller in 2018, and it is located mainly at the edges of the glacial bed at a depth of 3 m. In the next 2 years its size increases and its thickness decreases to 2 m. The deepest zone (Zone 3) is of greatest interest and is characterized by resistivity over 60 000 Ωm. High resistivities (Hauck, 2001; Kneisel et al., 2008) are typical of ice and permafrost, and Zone 3 represents an ice-rich permafrost area.
In 2018 the meltwater was drained around the frozen subsurface areas in the lower part of Snezhnika in Zone 2. In 2019 and 2020 the size of the glacieret was smaller, and this obstacle no longer existed or it was deeper than the depth reached by the ERT method. Then the main flow of meltwater was directed below the central part of the microglacier's bed. Profile ERT(2019)-1 is situated 5–6 m lower in elevation than profiles ERT(2018)-1 and ERT(2020)-1 (Fig. 3). On this profile, the lowest resistivities in Zone 2 are observed. The meltwater is probably collected in this area in the lowest part of the microglacier's bed, and then it flows deeper through a karst structure. This could be assumed because the area is very close to the head moraine, but no surface water is observed on the opposite side of the moraine or down along the slope.

Figure 6Electrical resistivity sections along ERT-1 obtained near the Snezhnika microglacier in 2020 (a), 2019 (b), and 2018 (c). Blue color represents low resistivities, and red color indicates areas with very high resistivities.
In the second electrical profile (ERT(2019,2020)-2), presented in Fig. 7, two zones are distinguished. Zone 2 is located in the near-surface area of the profile, with a thickness of up to 2 m. This area represents the accommodating medium composed of crushed marble pieces of different sizes (as the marble is the main rock type in the area), having a resistivity between 10 000 and 40 000 Ωm. The zone is highly watered and is a result of the melting of the microglacier. In the southern part of the profile at a depth beyond the third meter in the section, Zone 3 is located. This zone appears with values of electrical resistivity over 60 000 Ωm and represents an ice-rich permafrost area in the base of the microglacier. In 2020 (Fig. 7b) the frozen area is located about 1 m deeper than in 2019 (Fig. 7a). The sinking of the permafrost area in 2020 compared to 2019 is probably a result of two factors. The first one is the interannual change in the meteorological parameters. In October 2019, there was much less precipitation in the area (below average) and slightly lower air temperatures than in October 2020, when air temperatures were higher and the precipitation was above average (based on Copernicus Climate Change Service reports). This might have led to an increase in the active layer thickness in 2020. The second reason for this change is that the two profiles do not exactly match in location. Although they are quite close to each other, the small displacement may be the reason for the greater change in depth.
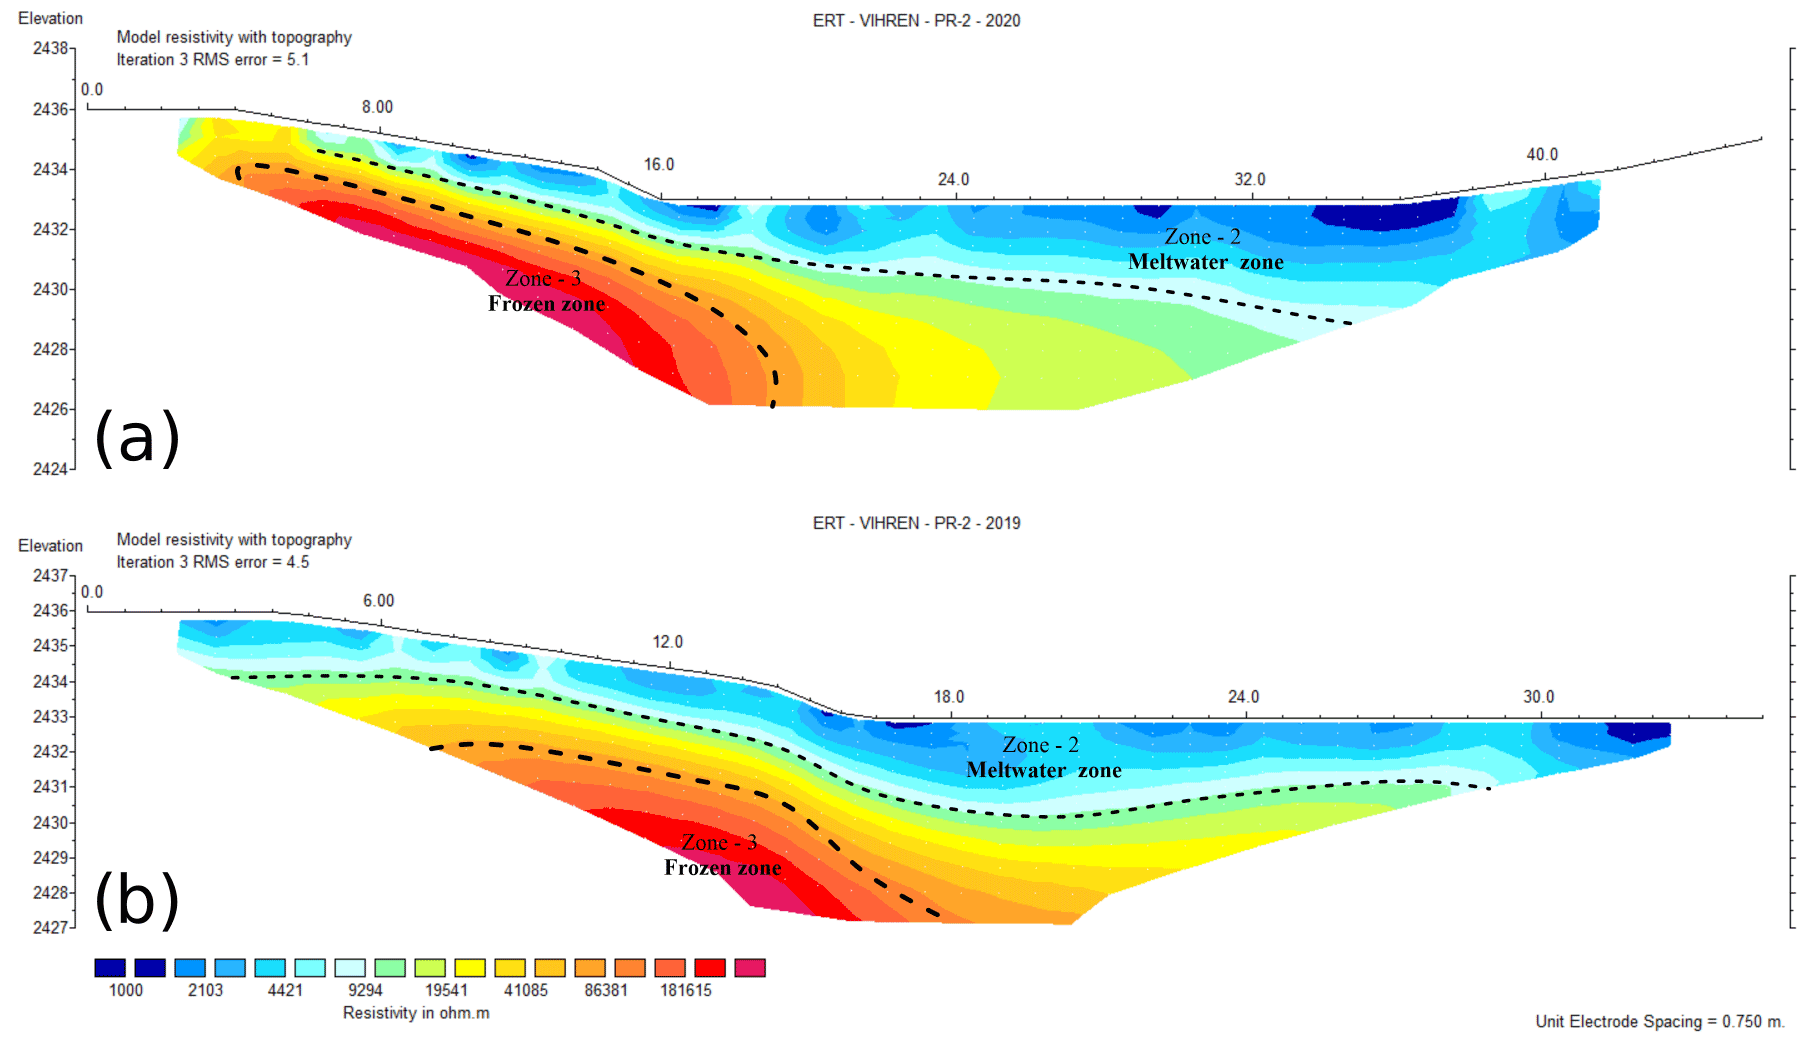
Figure 7Electrical resistivity sections along ERT-2 obtained in the Golyam Kazan area in 2020 (a) and 2019 (b).
Figure 8 shows the third ERT profile (ERT(2020)-3), located just below the glacieret. This profile was measured only in 2020 when the size of Snezhnika was the smallest. The measuring line passed through a small piece of the microglacier, which is clearly seen in Fig. 8. Only one electrode was in the ice, which was covered by a thin debris layer, and this probably made the measurement possible. Zone 3, representing again the ice-rich area in the base of the microglacier, occupies a large part of the section. It is located at a depth of 4 m in the southern part of the profile, and in the northern part it reaches the surface. Namely, the northern part of the profile crosses part of the glacieret (Fig. 3). Zone 2 on ERT-3 is distinguished only in the very shallow parts of the profile.
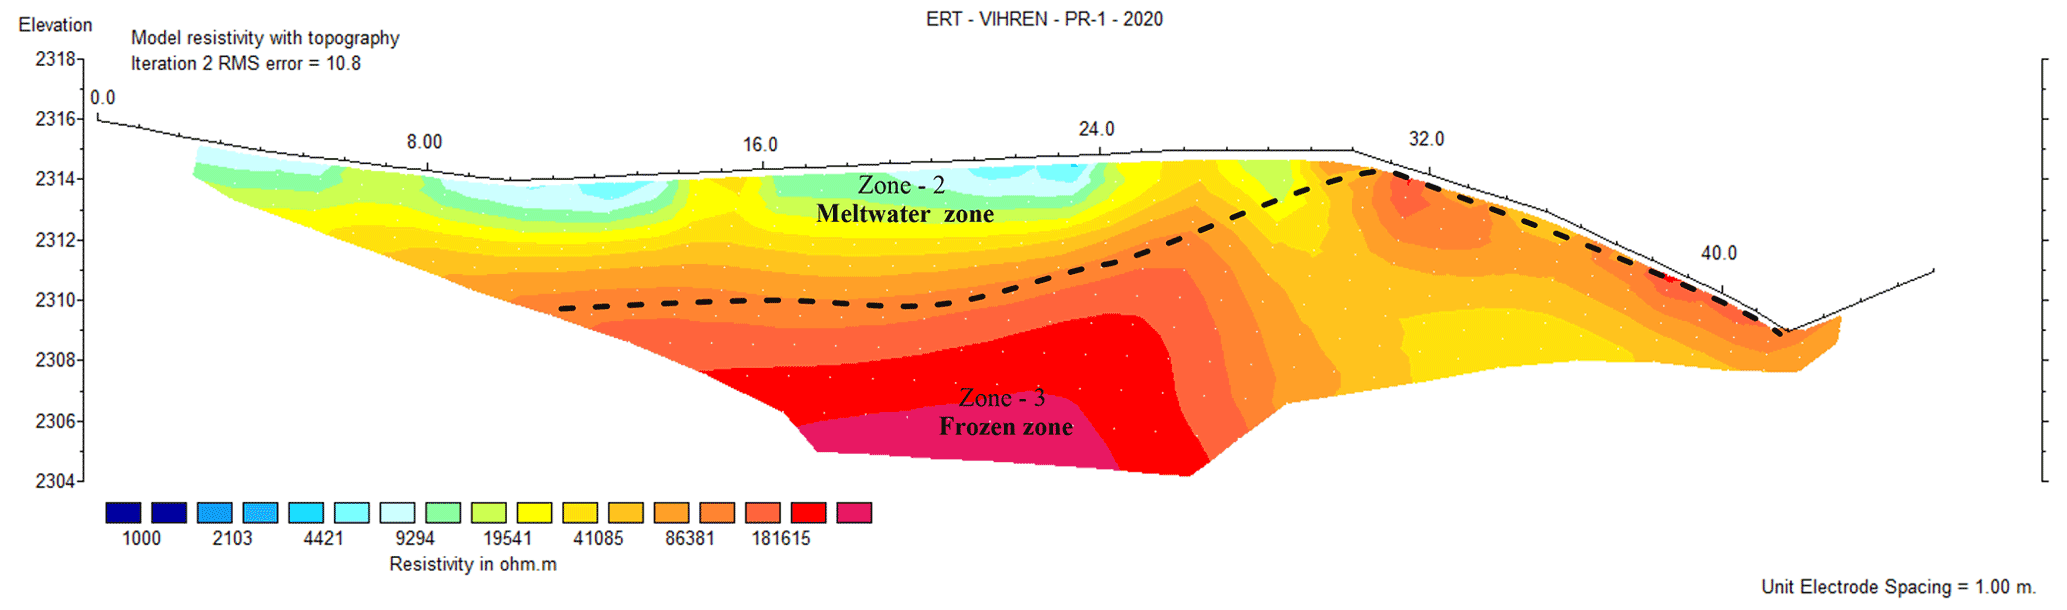
Figure 8Electrical resistivity sections along ERT-3 obtained in the Golyam Kazan area in 2020.
On the aligned GPR and ERT profiles shown in Fig. 9, the permafrost area and drainage layer of meltwater are more visible. The figure presents the alignment of profiles ERT(2020)-2 and GPR(2018)-1 and profiles ERT(2019)-2 and GPR(2018)-2. The two ERT profiles are located between GPR profiles and are shifted by several meters. The surface beneath the snow on the GPR profiles has a similar shape to the surface on the ERT profiles without snow. In the aligned plot the high-resistivity zone fits well with the area identified as ice-rich permafrost on the GPR profiles. This zone is observed on both GPR(2018)-1 and GPR(2018)-2. Over the next 2 years, ERT(2019)-2 and ERT(2020)-2 profiles show very high resistivities at the site where the permafrost zone was observed. In Fig. 9, these zones of overlap are shown with a red-shaded area on radargrams. ERT profiles have shorter lengths and smaller depths and make it possible to explore only part of the permafrost area. Some changes in the depth and expansion of the zone during the period (2018–2020) can also be observed. But as the profiles do not fully overlap, it is difficult to analyze the reasons for these changes, and it is advisable this finding to be investigated in depth during future measurements in the area.
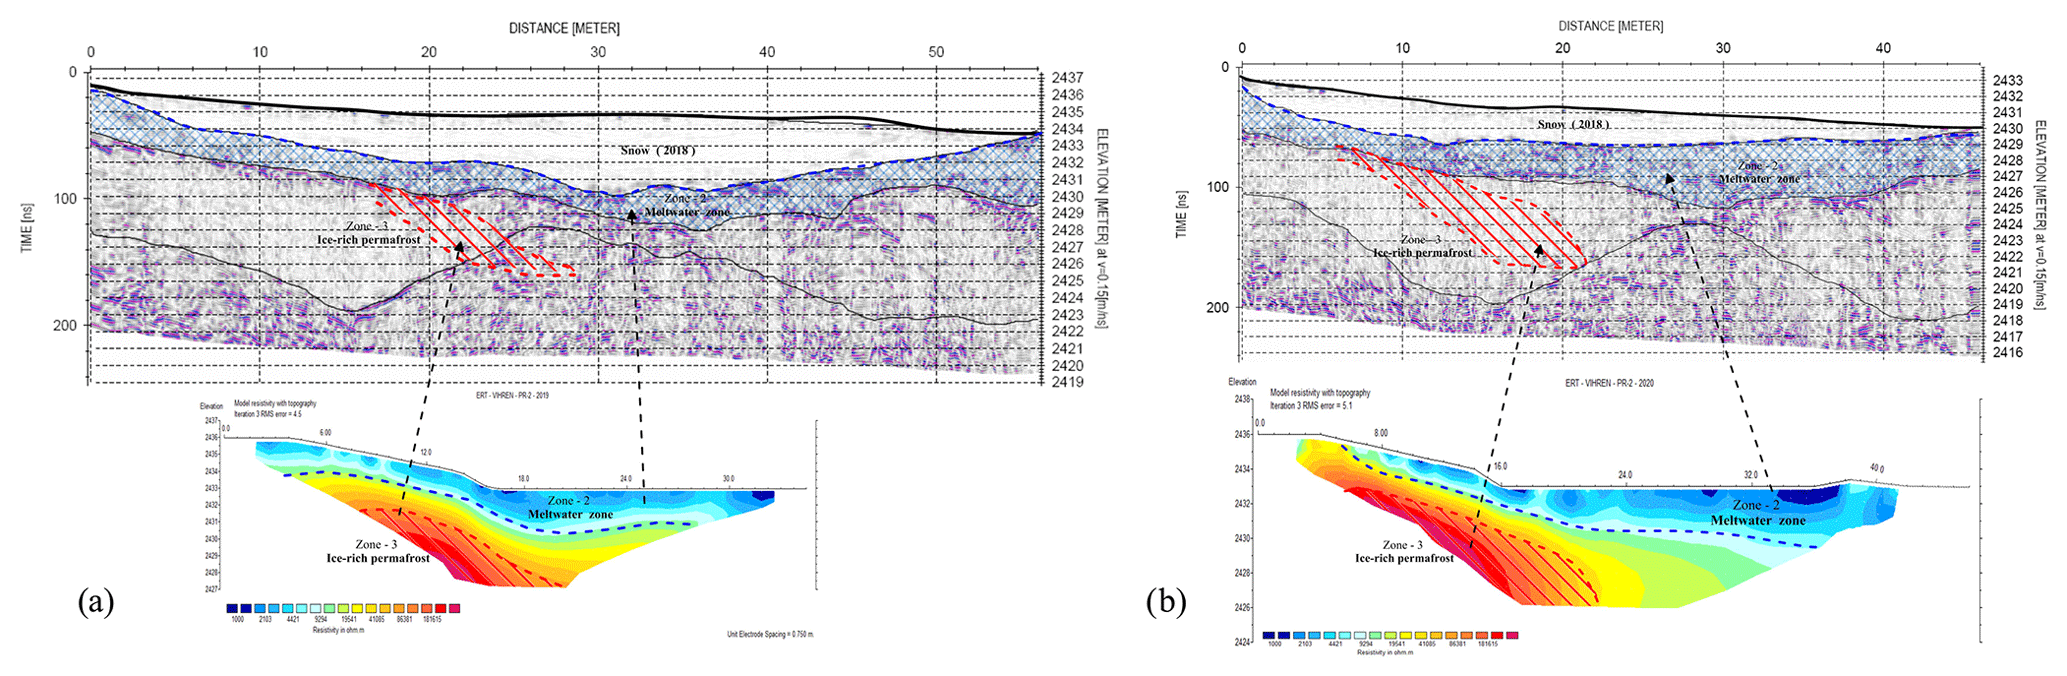
Figure 9Aligned profiles ERT(2019)-2, ERT(2020)-2, GPR(2018)-1, and GPR(2018)-2. The red-shaded zones have the same size on ERT and GPR profiles to show areas of overlap for the permafrost zone. Blue-shaded areas present the layer draining the meltwater.
The study presented includes measurements made over 3 consecutive years, and a frozen zone is observed every year. As permafrost is defined as subsurface area in which the temperature remains below 0 ∘C for at least 2 consecutive years (Harris et al., 1988) or, as in our case, with the presence of ice, this can be treated as evidence of permafrost existence in high mountains (particularly the Pirin Mountains) in Bulgaria. The permafrost area near the Snezhnika microglacier is presented by a zone with a lack of reflections on GPR. This allows us to assume that this is ice-rich permafrost. It might be buried ice, a remnant from Snezhnika when it had a bigger size for several consecutive years, followed by a long warm period of debris accumulation over the ice.
Our results show that the permafrost zone is situated mainly in the southern part of the microglacier's bed (Fig. 3). Also, the southern part of the microglacier is at least 1 m thicker than the northern one (Fig. 5). The snow layer in 2018 is also thicker in the southern part (Fig. 4a). The reason for this is that this part is closer to the Dzhamdzhiev ridge and the wall of the Vihren peak, both with very steep slopes and rising 300–400 m above the surface. They shade Snezhnika for most of the day, as it is visible in Fig 2e. The picture is taken from the Dzhamdzhiev ridge on 1 July, in the middle of the day and the shadow over the southern part of the microglacier can already be observed. The shading effect causes the northern part of the area to be exposed to the sun longer than the southern part. During the summer this protects the microglacier and the permafrost area from increasing solar radiation. Proof of this assumption is the presence of snow patches, located at the bottom of the Dzhamdzhiev ridge, close to Snezhnika. Snow patches are not observed in the northern part of the cirque. The role of shading from the surrounding mountain ridge and the glacieret is very important for preservation of the ice-rich area. Other factors for permafrost formations and preservation should also be investigated in future studies in order to have a more complex view of processes that maintain the buried ice not only near Snezhnika but also in similar locations worldwide.
The permafrost zone in the Golyam Kazan cirque was obtained in 2018 on the ERT profile and in the GPR profiles PR(2018)-1 and GPR(2018)-2. The 2020 results show again indications of a frozen area below the surface, although its upper part was not found at the same depth as in 2018. One reason for this may be the smaller size of Snezhnika in 2020 compared to 2018. The glacieret preserves the frozen subsurface area in summer. Even when the size of the microglacier is smaller, a permafrost zone exists but is observed at a greater depth. This change in depth is probably due to several factors such as the lack of shading from the glacieret, the interannual changes in meteorological parameters between 2018 and 2020, and the shift of the GPR and ERT profiles between the campaigns.
Bulgaria and the Balkan Peninsula are situated in lower latitudes where no continuous permafrost exists. Only isolated patches of permafrost are present in high mountains (Brown et al., 2001). However, permafrost distribution has been much less investigated (Oliva et al., 2018). Permafrost probably exists above ∼2350 m in the Rila Mountains (Oliva et al., 2018) and above ∼2400 m in the Pirin Mountains. In the Golyam Kazan cirque it can be sporadic and present in the area south of the glacieret, where snow patches are observed in some summers. To prove this, more studies including geophysical measurements are needed. The area was described above as well shaded by the Dzhamdzhiev ridge. Most of the places in the high mountains of Bulgaria, where permafrost is probably present, are steep, and this makes it difficult for geophysical measurements to be carried out. Nevertheless, more investigation into permafrost distribution and its monitoring in time should be made. It is important because changing climatic conditions can lead to the disappearing of isolated permafrost patches, especially in areas with a relatively warm climate like the Balkan Peninsula. Disappearance of permafrost patches can cause rapid degradation processes and rock avalanches. In Bulgaria there is not much infrastructure in the high mountains that can be damaged, unlike in the Alps or other inhabited mountains. However, many hiking trails cross slopes that can be unstable and dangerous when permafrost melts.
Detailed geophysical measurements of the Snezhnika microglacier in Golyam Kazan, Pirin Mountains, were conducted in 2018, 2019, and 2020 in order to estimate the thickness and internal structure of the glacieret and the subsurface structure beneath it. One of the main results from the study is a more comprehensive large-scale assessment of the ice thickness than has been made before. The mean thickness estimated from GPR profiles is about 4–6 m. In some places in the southern part of the ice body it reaches 8 m. These results show partial agreement with the results from early borehole measurements and results obtained by Popov (1962), but the depths of 11 m (Gruenewald et al., 2008) and 12 m (Onaca et al., 2022) are not detected. The reason for this can be that our GPR profiles cover a large area but not the whole area of the microglacier. It is still not possible to estimate the changes in thickness of the microglacier through the years starting from 1962 due to insufficient data. However, the thickness values estimated are a good base for monitoring the microglacier Snezhnika not only by its surface area.
The second significant finding is the indication of permafrost in the Pirin Mountains. The complementary data from GPR and ERT measurements allow us to distinguish a zone of ice-rich permafrost in the southern part of the microglacier bed, between the head moraine and the ice. The zone has a complex shape; lack of reflections in GPR profile; and very high resistivity, ⩾60 000 Ωm, values typical of ice. ERT measurements were repeated over 3 consecutive years, detecting the anomaly during every measurement campaign. This can be taken as evidence of permafrost in the Pirin Mountains.
An important finding is also the information obtained on the hydrology of the microglacier's area. This is also important for the preservation of snow and ice. Based on our observations, a hypothesis about where the meltwater disappears can be supported. It was identified that the underlying layer is most likely draining the melted glacial water. The microglacier drainage system is fully situated beneath the surface as surface water is rarely observed and in most cases it is only close to the glacieret.
The frozen zone is situated in the southern part of the microglacier and exists beneath the snow (in 2018) and without snow cover as in the late autumn of 2020, when the microglacier's size was the smallest and no shading of the ice layer was possible. The area is closer to the Dzhamdzhiev ridge and is shaded by it for most of the day in summer. This result suggests the importance of mountain ridge shading for the preservation of frozen subsurface areas in the Golyam Kazan cirque, Pirin Mountains, but the role of other factors should also be considered.
The knowledge of permafrost on the Balkan Peninsula and, particularly, in Bulgaria is very general, and studies of permafrost, including geophysical measurements, are still rare. Even though the present study is focused on a small area of the Pirin Mountains (Bulgaria), it gives important information on the presence, extent, and state of a permafrost area which has survived due to the local conditions despite a warming climate.
The authors are happy to share data requested by email. Available data are GPR data from Golyam Kazan (2018 and 2020); ERT measurements in Golyam Kazan (2018, 2019, and 2020); GPS tracks of snowfields; photos; and short meteorological records of the temperature, atmospheric pressure, and humidity made at two points in Golyam Kazan. A DTM with 7.63 cm px−1 resolution was also constructed using UAV photogrammetry.
AK led ERT measurements and processed the data. CT led the GPR measurements and processed the data. GG led the projects and organized the fieldwork. GG prepared the manuscript with contribution of all co-authors.
The contact author has declared that none of the authors has any competing interests.
Publisher's note: Copernicus Publications remains neutral with regard to jurisdictional claims in published maps and institutional affiliations.
All measurements were carried out with the participation of students from both universities (Sofia University and the University of Mining and Geology). The authors thank the following students: Boriyana Chtirkova, Bojourka Georgieva, Daniel Ishlyamski, Dragomir Dragomirov, Yanko Ivanov, Spas Nikolov, Valentin Buchakchiev, Kalina Stoimenova, and Angel Dimitrov. We also thank Vassil Gourev for sharing ideas and knowledge of studying perennial snow patches in Bulgarian mountains. Measurements were performed with the permission of the Pirin National Park administration.
The fieldwork was supported by the Science Fund of Sofia University within the projects 80-10-126/21.04.2017, 80-10-217/26.04.2018, and 80-10-24/18.03.2020 and Science Fund of the University of Mining and Geology within the project GPF-222/11.03.2019. The publication is funded within the framework of the National Science Program “Environmental Protection and Reduction of Risks of Adverse Events and Natural Disasters”, approved by the Resolution of the Council of Ministers no. 577/17.08.2018 and supported by the Ministry of Education and Science (MES) of Bulgaria (agreement no. D01-279/03.12.2021).
This paper was edited by Adam Booth and reviewed by Mihai Cimpoiasu and one anonymous referee.
Annan, A. P.: ractical processing of GPR data, Proceedings of the Second Government Workshop on Ground Penetrating Radar, Columbus, Ohio, October 1999. a
Annan, P. and Davis, J.: Impulse radar sounding in permafrost, Radio Sci., 11, 383–394, 1976. a
Arcone, S. A.: High Resolution of Glacial Ice Stratigraphy: A Ground-penetrating Radar Study of Pegasus Runway, McMurdo Station, Antarctica, Geophysics, 61, 1653–1663, 1996. a
Arcone, S. A., Lawson, D. E., and Delaney, A. J.: Short-pulse radar wavelet recovery and resolution of dielectric contrasts within englacial and basal ice of Matanuska Glacier, Alaska, J. Glaciol., 41, 68–86, 1995. a
Baker, G. S., Jordan, T. E., and Pardy, J.: An introduction to ground penetrating radar (GPR), Stratigraphic Analyses Using GPR, Geological Society of America, ISBN 9780813724324, https://doi.org/10.1130/2007.2432(01), 2007. a
Barry, R. and Gan, T. Y.: The global cryosphere: past, present and future, 1st Edn., Cambridge University Press, Cambridge, 498 pp., ISBN-10 0521156858, ISBN-13 978-0521156851, https://doi.org/10.1017/CBO9780511977947, 2011. a
Berthling, I., Etzelmuller, B., Isaksen, K., and Sollid, J. L.: Rock glaciers on Prins Karls Forland. II: GPR soundings and the development of internal structures, Permafrost Periglac., 11, 357–369, 2000. a
Boyadjiev, S.: On the geology of Pirin Mountain, Annuaire de la Direction des Recherches Geologiques et Minieres 8, 89–125, 1959 (in Bulgarian). a
Brown, J., Ferrians, O. J., Heginbottom, J. A., and Melnikov, E. S.: Circum-arctic map of permafrost and ground ice conditions, Circum-pacific map series, Reston, VA, US Geological Survey, https://doi.org/10.3133/cp45, 2001. a
Brown, R. and Petkova, N.: Snow Cover Variability in Bulgarian Mountainous Regions: 1931–2000, Int. J. Climatol., 27, 1215–1229, https://doi.org/10.1002/joc.1468, 2007. a
Damm, B. and Langer, M.: Kartierung und Regionalisierung von Permafrostindikatoren im Rieserfernergebiet (Südtirol/Osttirol), Mitt. Österr. Geogr. G., 148, 295–314, 2006. a
Dimovski, S. and Stoyanov, N.: Localization of suitable sites for the construction of monitoring wells in a small-scale rock complex, Annual of University of Mining and Geology “St. Ivan Rilski”, 58, 140–145, 2015. a, b
Dimovski, S., Stoyanov, N., and Gyurov, C.: Efficiency of electromotography for detailed geoelectrical mapping of nearsurface geological section, Bulaqua, 4, 47–55, 2007. a
Dobinski, W.: Permafrost of the Carpathian and Balkan Mountains, eastern and southeastern Europe, Permafrost Periglac., 16, 395–398, https://doi.org/10.1002/ppp.524, 2005. a
Dortman, N. B.: Physical Properties of the Rocks and Mineral Resources, Handbook of the Geophysicist, Nedra, Moscow, 552.08:53(03), 1984 (in Russian). a
Emmert, A. and Kneisel, C.: Internal structure of two alpine rock glaciers investigated by quasi-3-D electrical resistivity imaging, The Cryosphere, 11, 841–855, https://doi.org/10.5194/tc-11-841-2017, 2017. a
Etzelmüller, B. and Frauenfelder, R.: Factors Controlling The Distribution of Mountain Permafrost in The Northern Hemisphere and Their Influence on Sediment Transfer, Arct. Antarct. Alp. Res., 41, 48–58, https://doi.org/10.1657/1523-0430-41.1, 2009. a
Evans, S.: Dielectric properties of ice and snow – a review, J. Glaciol., 5, 773–792, 1965. a
Fitzgerald, W. J. and Paren, J. G.: The dielectric properties of Antarctic ice, J. Glaciol., 15, 39–48, 1975. a
Fort, M.: Impact of climate change on mountain environment dynamics, J. Alp. Res., 103, 103-2, https://doi.org/10.4000/rga.2877, 2015. a
Gadek, B. and Grabiec, M.: Glacial ice and permafrost distribution in the Medena Kotlina (Slovak Tatras): mapped with application of GPR and GST measurements, Studia Geomorphologica Carpatho-Balcanica, XLII, 5–22, 2008. a
Gachev, E.: Climatic factors for the year-round dynamics of microglacier Snezhnika in Pirin, Scientific conference “Geographic aspects of planning and the use of the territory in the context of global changes”, Extended Abstracts, ISBN 978-619-90446-1-2, 2016 (in Bulgarian). a, b, c, d
Gachev, E.: The Unknown Southernmost Glaciers of Europe, in: Glacier Evolution in a Changing World, edited by: Godone, D., London, IntechOpen, https://doi.org/10.5772/intechopen.68899, 2017a. a, b
Gachev, E.: High mountain relief in marble in Pirin mountains, Bulgaria: Structure, specifics and evolution, Rev. Geomorfol., 19, 118–135, 2017b. a
Gachev, E.: Holocene glaciation in the mountains of Bulgaria, Med. Geosc. Rev., 2, 103–117, https://doi.org/10.1007/s42990-020-00028-3, 2020. a
Gachev, E. and Mitkov, I.: Small glaciers in Pirin (Bulgaria) and Durmitor (Montenegro) as glacio-karstic features, Similarities and differences in their recent behaviour, Quatern. Int., 504, 153–170, https://doi.org/10.1016/j.quaint.2018.03.032, 2019. a
Gachev, E., Stoyanov, K., and Gikov, A.: Small glaciers on the Balkan Peninsula: State and changes in the last several years, Quatern. Int., 415, 33–54, https://doi.org/10.1016/j.quaint.2015.10.042, 2016. a
Georgieva, G., Kisyov, A., Tzankov, C., Chtirkova, B., Gourev, V., and Ivanov, Y.: Evaluation of geophysical methods for studying snowfields in Pirin Mountain, Bulgaria Extended abstract from 10th Congress of Balkan Geophysical Society, BGS 2019, https://doi.org/10.3997/2214-4609.201902662, 2019. a, b
Glazirin, G. E., Kodama, Y., and Ohata, T.: Stability of drifting snow-type perennial snow patches Bull. Glaciol. Res., 21, 1–5, 2004. a, b
Gruber, S. and Haeberli, W.: Mountain Permafrost, in: Permafrost Soils. Soil Biology, edited by: Margesin, R., Springer, Berlin, Heidelberg, Vol. 16, https://doi.org/10.1007/978-3-540-69371-0_3, 2009. a
Grunewald, K. and Scheithauer, J.: Klima- und Landschaftgeschichte Sudosteuropas. Rekonstruktion anhand von Geoarchiven im Piringebirge (Bulgarien), Rhombos Verlag, Berlin, 178 pp., ISBN 978-3-941216-02-0, 2008. a
Grunewald, K. and Scheithauer, J.: Europe's southernmost glaciers: Response and adaptation to climate change, J. Glaciol., 56, 129–142, https://doi.org/10.3189/002214310791190947, 2010a. a
Grunewald, K. and Scheithauer, J.: Europe's southernmost glaciers: response and adaptation to climate change, J. Glaciol., 56, 129–142, 2010b. a
Gruenewald, K., Scheithauer, J., and Gikov, A.: Microglaciers in the Pirin Mountains, Problems of Geography, 1–2, 1–16, 2008 (in Bulgarian). a, b, c, d, e, f
Guodong, C. and Dramis, F.: Distribution of mountain permafrost and climate, Permafrost Periglac., 3, 83–91, 1992. a
Harris, Ch. and Murton, J.: Interactions between glaciers and permafrost: an introduction, Geol. Soc. Lond. Spec. Pub., 242, 1–9, https://doi.org/10.1144/GSL.SP.2005.242.01.01, 2005. a, b
Harris, S. A., French, H. M., Heginbottom, J. A., Johnston, G. H., Ladanyi, B., Sego, D. C., and van Everdingen, R. O.: Glossary of permafrost and related ground-ice terms, Technical Memorandum (National Research Council of Canada. Associate Committee on Geotechnical Research), no. ACGR-TM-142, 159 pp., https://doi.org/10.4224/20386561, 1988. a, b
Hauck, C.: Geophysical methods for detecting permafrost in high mountains, Versuchsanstalt für Wasserbau Hydrologie und Glaziologie der Eidgenossischen, Technischen Hochschule Zurich, ISSN 0374-0056, 2001. a, b, c, d, e
Hauck, C.: New Concepts in Geophysical Surveying and Data Interpretation for Permafrost Terrain, Permafrost Periglac., 24, 131– 137, https://doi.org/10.1002/ppp.1774, 2013. a
Hausmann, H., Krainer, K., Brück, E., and Ullrich, C.: Internal structure, ice content and dynamics of Ölgrube and Kaiserberg rock glaciers (Ötztal Alps, Austria) determined from geophysical surveys, Austr. J. Earth Sci., 105, 12–31, 2012. a
Haeberli, W.: Untersuchungen zur Verbreitung von Permafrost zwischen Flüelapass und Piz Grialetsch (Graubünden). Mitteilung der Versuchsanstalt für Wasserbau, Hydrologie und Glaziologie, 18, 7–128, 1975. a
Hilbich, C., Marescot, C. L. Hauck, C., Loke, M. H., and Mäusbacher, R.: Applicability of Electrical Resistivity Tomography Monitoring to Coarse Blocky and Ice-rich Permafrost Landforms, Permafrost Periglac., 20, 269–284, 2009. a
Hinkel, K. M., Doolittle, J. A., Bockheim, J. G., Nelson, F. E., Paetzold, R., Kimble, J. M., and Travis, R.: Detection of subsurface permafrost features with ground-penetrating radar, Barrow Alaska, Permafrost Periglac., 12, 179–190, 2001. a
Hoekstra, P. and Delaney, A.: Dielectric properties of soils at UHF and microwave frequencies, J. Geophys. Res., 79, 1699–1708, 1974. a
Hoekstra, P. and McNeill, D.: Electromagnetic probing of permafrost, in: North American Contribution, Second International Conference on Permafrost, Yakutsk, USSR, Washington DC, National Academy of Sciences, 10009483183, 517–526, 1973. a, b
Hughes, P. D.: Little Ice Age glaciers in the Mediterranean mountains, Mediterranee, 122, 63–79, 2014. a
Hughes, P. D.: Little Ice Age glaciers and climate in the Mediterranean mountains: a new analysis, Cuadernos de Investigación Geográfica, 44.1, 15–45, 2018. a
Ikeda, A.: Combination of conventional geophysical methods for sounding the composition of rock glaciers in the Swiss Alps, Permafrost Periglac., 17, 35–48, https://doi.org/10.1002/ppp.550, 2006. a
Ingeman-Nielsen, T.: Geophysical techniques applied to permafrost investigations in Greenland. PhD Thesis BYG DTU R-123 Arctic Technology Centre Department of Civil Engineering Technical University of Denmark, ISSN 1602-2917, 2005. a, b
Jol, H. M. (Ed.): Ground Penetrating Radar Theory and Applications, 1st Edn., Elsevier, 544 pp., ISBN 9780444533487 7, 2009. a
Jørgensen, A. S. and Andreasen, F.: Mapping of permafrost surface using ground-penetrating radar at Kangerlussuaq Airport, western Greenland, Cold Reg. Sci. Technol., 48, 64–72, 2007. a
Kawashima, K., Yamada, T., and Wakahama, G.: Investigations of internal structure and transformational processes from firn to ice in a perennial snow patch, Ann. Glaciol., 18, 117–122, https://doi.org/10.3189/S0260305500011368, 1993. a
King, M. S.: The influence of clay-sized particles on seismic velocity for Canadian Arctic Permafrost, Can. J. Earth Sci., 21, 19–24, 1984. a
King, M. S., Zimmerman, R. W., and Corwin, R. F.: Seismic and electrical properties of unconsolidated permafrost, Geophys. Prospect., 36, 349–364, 1988. a
Kisyov, A., Tzankov, Ch., Chtirkova, B., Georgieva, G., Ivanov, Y., Georgieva, B., Ishlyamski, D., Gourev, V., and Nikolov, S.: Study of perennial snow patches in Bulgaria, Proceedings of IX National Geophysical Conference, Sofia, ISSN 1314–2518, 2018 (in Bulgarian). a
Kneisel, C. and Kääb, A.: Mountain permafrost dynamics within a recently exposed glacier forefield inferred by a combined geomorphological, geophysical and photogrammetrical approach, Earth Surf. Proc. Land., 32, 1797–1810, https://doi.org/10.1002/esp.1488, 2007. a
Kneisel, C., Hauck, C., Fortier, R., and Moorman, B.: Advances in geophysical methods for permafrost investigations, Permafrost Periglac., 19, 157–178, https://doi.org/10.1002/ppp.616, 2008. a, b, c, d, e, f
Lawson, D. E., Strasser, J. C., Evenson, E. B., Alley, R. B., Larson, G. J., and Arcone, S. A.: Glaciohydraulic supercooling: A freeze-on mechanism to create stratified, debris-rich basal ice: I. Field evidence, J. Glaciol., 44, 547–562, 1998. a
Loke, M. and Barker, R.: Rapid leastsquares inversion of apparent resistivity pseudosections by a quasi Newton method, Geophys. Prospect., 44, 131–152, https://doi.org/10.1111/j.1365-2478.1996.tb00142.x, 1996. a
Loke, M. H.: A practical guide to RES2DINV ver. 3.4; Rapid 2-D resistivity & IP inversion usingthe least-squares method, Geotomo Software, Penang, Malaysia, 2001. a
Loke, M. H.: Res2Dinv ver. 3.59 for Windows XP/Vista/7, Rapid 2-D Resistivity & IP Inversion Using the Least-Squares Method, Geoelectrical Imaging 2D & 3D Geotomo Software 2010, Malaysia, 2010. a
Mares, S. and Tvrdý, M.: Introduction to Applied Geophysics, Springer Netherlands, 581 pp., ISBN 978-90-277-1424-4, 1984. a, b
Maurer, H. and Hauck, C.: Geophysical imaging of alpine rock glaciers, J. Glaciol., 53, 110–120, https://doi.org/10.3189/172756507781833893, 2007. a, b
Milner, A. M., Brown, L. E., and Hannah, D. M.: Hydroe-cological response of river systems to shrinking glaciers, Hydrol. Process., 23, 62–77, 2009. a
Navarro, F. and Eisen, O.: Ground-penetrating radar in glaciological applications, Remote Sens. Glaciers, chap. 11, 195–229, ISBN 9780429206429, https://doi.org/10.1201/b10155, 2009. a, b
Olhoeft, G. R.: Electrical properties of permafrost, 3rd International Conference on Permafrost 1, 127–131, ISBN 0-600-1735-0, 1978. a
Oliva, M., Zebre, M., Guglielmin, M., Hughes, P. D., Çiner, A., Vieira, G., Bodin, X., Andres, N., Colucci, R. R., García-hernández, C., Mora, C., Nofre, J., Palacios, D., Pérez-alberti, A., Ribolini, A., Ruiz-fernandez, J., Sarıkaya, M. A., Serrano, E., Urdea, P., and Yıldırım, C.: Permafrost conditions in the Mediterranean region since the Last Glaciation. Earth-Sci. Rev., 185, 397–436. https://doi.org/10.1016/j.earscirev.2018.06.018, 2018. a, b
Onaca, A., Ardelean, A. C., Urdea, P., Ardelean, F., and Sîrbu, F.: Detection of mountain permafrost by combining conventional geophysical methods and thermal monitoring in the Retezat Mountains, Romania, Cold Reg. Sci. Technol., 119, 111–123, 2015. a, b
Onaca, A., Ardelean, F., Ardelean, A., Magori, B., Sirbu, F., Voiculescu, M., and Gachev, E.: Assessment of permafrost conditions in the highest mountains of the Balkan Peninsula, Catena, 185, 104–288, https://doi.org/10.1016/j.catena.2019.104288, 2020. a
Onaca, A., Gachev, E., Ardelean, F., Ardelean, A., Perșoiu, A., and Hegyi, A.: Small is strong: Post-LIA resilience of Europe's Southernmost glaciers assessed by geophysical methods, Catena, 213, 106143, https://doi.org/10.1016/j.catena.2022.106143, 2022. a, b, c, d
Pipan, M., Baradello, L., Forte, E., Prizzon, A. and Finetti, I.: 2-D and 3-D processing and interpretation of multi-fold ground penetrating radar data: a case history from an archaeological site J. Appl. Geophys., 41, 271–292, 1999. a
Pipan, M., Baradello, L., Forte, E., and Prizzon, A.: Polarization and kinematic effects in azimuthal investigations of linear structures with Ground Penetrating Radar, Proceedings of the Symposium on the Application of Geophysics to Engineering and Environmental Problems EEGS, 433–442, https://doi.org/10.4133/1.2922773, 2000. a
Popov, V.: Morphology of the Cirque Golemia Kazan – Pirin Mountains, Announcements of the Institute of Geography, 6, 86–99, 1962 (in Bulgarian). a, b, c, d
Popov, V.: Observations on the Glacieret in the Cirque Golemia Kazan, the Pirin Mountains, Announcements of the Institute of Geography, Bulgarian Academy of Sciences, 7, 198–207, 1964 (in Bulgarian). a, b
Rolshoven, M.: Alpines Permafrostmilieu in der Lasörlinggruppe/ Nördliche Deferegger Alpen (Osttirol)), Polarforschung, Bremerhaven, Alfred Wegener Institute for Polar and Marine Research & German Society of Polar Research, 52, 55–64, https://doi.org/10013/epic.29521, 1982. a
Sanz-Ablanedo, E., Chandler, J. H., Rodriguez-Perez, J. R., and Ordonez, C.: Accuracy of Unmanned Aerial Vehicle (UAV) and SfM Photogrammetry Survey as a Function of the Number and Location of Ground Control Points Used, Remote Sensing, 10, 1606, https://doi.org/10.3390/rs10101606, 2018. a
Scott, W., Sellmann, P., and Hunter, J.: Geophysics in the study of permafrost, in: Geotechnical and Environmental Geophysics, edited by: Ward, S., Society of Exploration Geophysics, Tulsa, 355–384, https://doi.org/10.1190/1.9781560802785.ch13, 1990. a, b, c, d
Supper, R., Ottowitz, D., Jochum, B., Romer, A., Pfeiler, S., Kauer, S., Keuschnig, M., and Ita, A.: Geoelectrical monitoring of frozen ground and permafrost in alpine areas: field studies and considerations towards an improved measuring technology, Near Surf. Geophys., 12, 93–115, 2014. a, b
Telford, W. M., Geldart, L. P., and Sheriff, R. E.: Applied geophysics, 2nd Edn., Cambridge University Press, ISBN 0-521-32693-1, 1990. a
Turner, D., Lucieer, A., and Watson, C.: An Automated Technique for Generating Georectified Mosaics from Ultra-High Resolution Unmanned Aerial Vehicle (UAV) Imagery, Based on Structure from Motion (SfM) Point Clouds, Remote Sensing, 4, 1392–1410, https://doi.org/10.3390/rs4051392, 2012. a
van der Kruk, J., Wapenaar, C. P. A., Fokkema, J. T., and Van den Berg, P. M.: Three-dimensional imaging of multicomponent ground-penetrating radar data, Geophysics, 68, 1241–1254, https://doi.org/10.1190/1.1598116, 2003. a
Washburn, A. L.: Geocryology – A survey of periglacial processes and environments, University of Washington, ISBN 0-470-26582-5, 1979. a
Williams, K. E., McKay, C. P., Toon, O. B., and Jennings, K. S.: Mass balance of two perennial snowfields: Niwot Ridge, Colorado, and the Ulaan Taiga, Mongolia, Arct. Antarct. Alp. Res., 54, 41–61, https://doi.org/10.1080/15230430.2022.2027591, 2022. a
Yakupov, V. S.: Electrical conductyvity of frozen roks, Permafrost: Second International Conference, 13–28 July, National Academy of Sciences, Washington, D.C., ISBN 0-309-02746-2, 1973. a
Zemp, M.: Glaciers and Climate Change – Spatio-temporal Analysis of Glacier Fluctuations in the European Alps after 1850, Dissertation, Zürich, 2006. a
Zhao, W., Tian, G., Forte, E., Pipan, M., Wang, Y., Li, X., Shi, Z., and Liu, H.: Advances in GPR data acquisition and analysis for archaeology Geophys. J. Int., 202, 62–71, 2015. a
Zhao, W., Forte, E., Colucci, R. R., and Pipan, M.: High-resolution glacier imaging and characterization by means of GPR attribute analysis, Geophys. J. Int., 206, 1366–1374, https://doi.org/10.1093/gji/ggw208, 2016. a