the Creative Commons Attribution 4.0 License.
the Creative Commons Attribution 4.0 License.
 | 19 Oct 2022
In situ measurements of meltwater flow through snow and firn in the accumulation zone of the SW Greenland Ice Sheet
Horst Machguth
Andrew Tedstone
Nicolas Jullien
Nander Wever
Rolf Weingartner
Ole Roessler
The Greenland Ice Sheet is losing mass, part of which is caused by increasing runoff. The location of the runoff limit, the highest elevation from which meltwater finds its way off the ice sheet, plays an important role in the surface mass balance of the ice sheet. The recently observed rise in runoff area might be related to an increasing amount of refreezing: ice layer development in the firn reduces vertical percolation and promotes lateral runoff. To investigate meltwater flow near the runoff limit in the accumulation zone on the southwestern Greenland Ice Sheet, we carried out in situ measurements of hydrological processes and properties of firn and snow. The hydraulic conductivity of icy firn in pre-melt conditions measured using a portable lysimeter ranges from 0.17 to 12.8 m h−1, with flow predominantly occurring through preferential flow fingers. Lateral flow velocities of meltwater on top of the near-surface ice slab, measured at the peak of the melt season by salt dilution and tracer experiments, range from 1.3 to 15.1 m h−1. With these lateral flow velocities, the distance between the slush limit, the highest elevation where liquid water is visible on the ice sheet surface, and the runoff limit could be roughly 4 km in regions where near-surface ice slabs are present. These measurements are a first step towards an integrated set of hydrological properties of firn on the SW Greenland Ice Sheet and show evidence that meltwater runoff may occur from elevations above the visible runoff area.
- Article
(11466 KB) - Full-text XML
- BibTeX
- EndNote


Since 1991 the Greenland Ice Sheet (GrIS) has lost around 4000 Gt of mass, which corresponds to roughly 10 mm of sea level rise (The IMBIE Team, 2019). Over a third of this mass loss, ∼ 34 %, is accounted for by a negative surface mass balance (Mouginot et al., 2019). Meltwater runoff, one of the major surface mass balance parameters, has increased by > 40 % since the 1990s due to a warming climate (Hanna et al., 2012; Hall et al., 2013). This has caused the contribution from the GrIS to global mean sea level rise to increase from < 5 % in 1993 to > 25 % in 2014 (Chen et al., 2017).
Quantifying what governs the location and evolution of the runoff limit throughout the melt season is critical for accurate firn modelling and ice sheet mass balance calculations (van As et al., 2016; Nienow et al., 2017). Even though only meltwater that runs off contributes to mass loss of the GrIS, estimates of refreezing and retention of melt as predicted by surface mass balance (SMB) and regional climate models (RCMs) currently are subject to high uncertainties (Smith et al., 2017; Nienow et al., 2017). Existing parametrizations that are used for firn densification and vertical meltwater percolation in Greenland-wide firn models (e.g. Brown et al., 2012; Steger et al., 2017; Vandecrux et al., 2020) are often based on knowledge gained from other environments such as seasonal snowpacks and/or smaller (alpine or arctic) glacier settings. The actual conditions of meltwater runoff to occur on the GrIS remain largely unvalidated.
Firn has a large buffering capacity for meltwater through refreezing in its pore space (Pfeffer et al., 1991; Harper et al., 2012) and covers over 80 % of the GrIS (Box et al., 2012; Fausto et al., 2018). At the ice sheet scale, models estimate that approximately 45 % of the generated meltwater has been retained in firn over the past 5 decades (van Angelen et al., 2013; Noël et al., 2016; Steger et al., 2017). Firn structure is therefore an influential parameter in the surface mass balance of the GrIS (van den Broeke et al., 2017).
In recent years, after a series of extraordinary melt events, firn stratigraphy in the accumulation zone of the GrIS has changed significantly. In situ observations, as well as ground-based and airborne radar data, show that widespread near-surface ice slabs have rapidly developed and expanded to higher elevations (Machguth et al., 2016; MacFerrin et al., 2019). These ice slabs reduce the overall buffering capacity of the firn layer by impeding meltwater from percolating into the porous, underlying firn (Nghiem, 2005; Humphrey et al., 2012; Polashenski et al., 2014) and could force large amounts of water to run off at the surface (Tedstone and Machguth, 2022).
In the southwest of the GrIS, recent ice slab formation has enabled meltwater to run off in supraglacial rivers from elevations at least as high as 1840 m a.s.l. (above sea level) (Machguth et al., 2016; Tedstone and Machguth, 2022). These rivers tend to initiate in slush fields: water-saturated areas of firn and snow with visible meltwater ponding on the surface. Slush is therefore an important component in the hydrological system on the SW GrIS strongly linked to runoff (Holmes, 1955). Here we define the slush limit as the uppermost altitude at which liquid meltwater is visible at the surface during the melt season, as first suggested by Müller (1962). This term was later added to Benson's widely used firn classification scheme (1996). The runoff limit is the elevation below which at least part of the meltwater present begins to leave the ice sheet. Both the runoff and slush limit are located above the equilibrium line altitude (ELA; Shumskii, 1964), and we hypothesize that the runoff limit generally lies above the slush limit. The hydrological processes occurring at the slush and runoff limit are critical for meltwater retention and runoff, but it is unclear how these two limits are related and how they are affected by changes in firn stratigraphy (i.e. meltwater refreezing and ice slab formation).
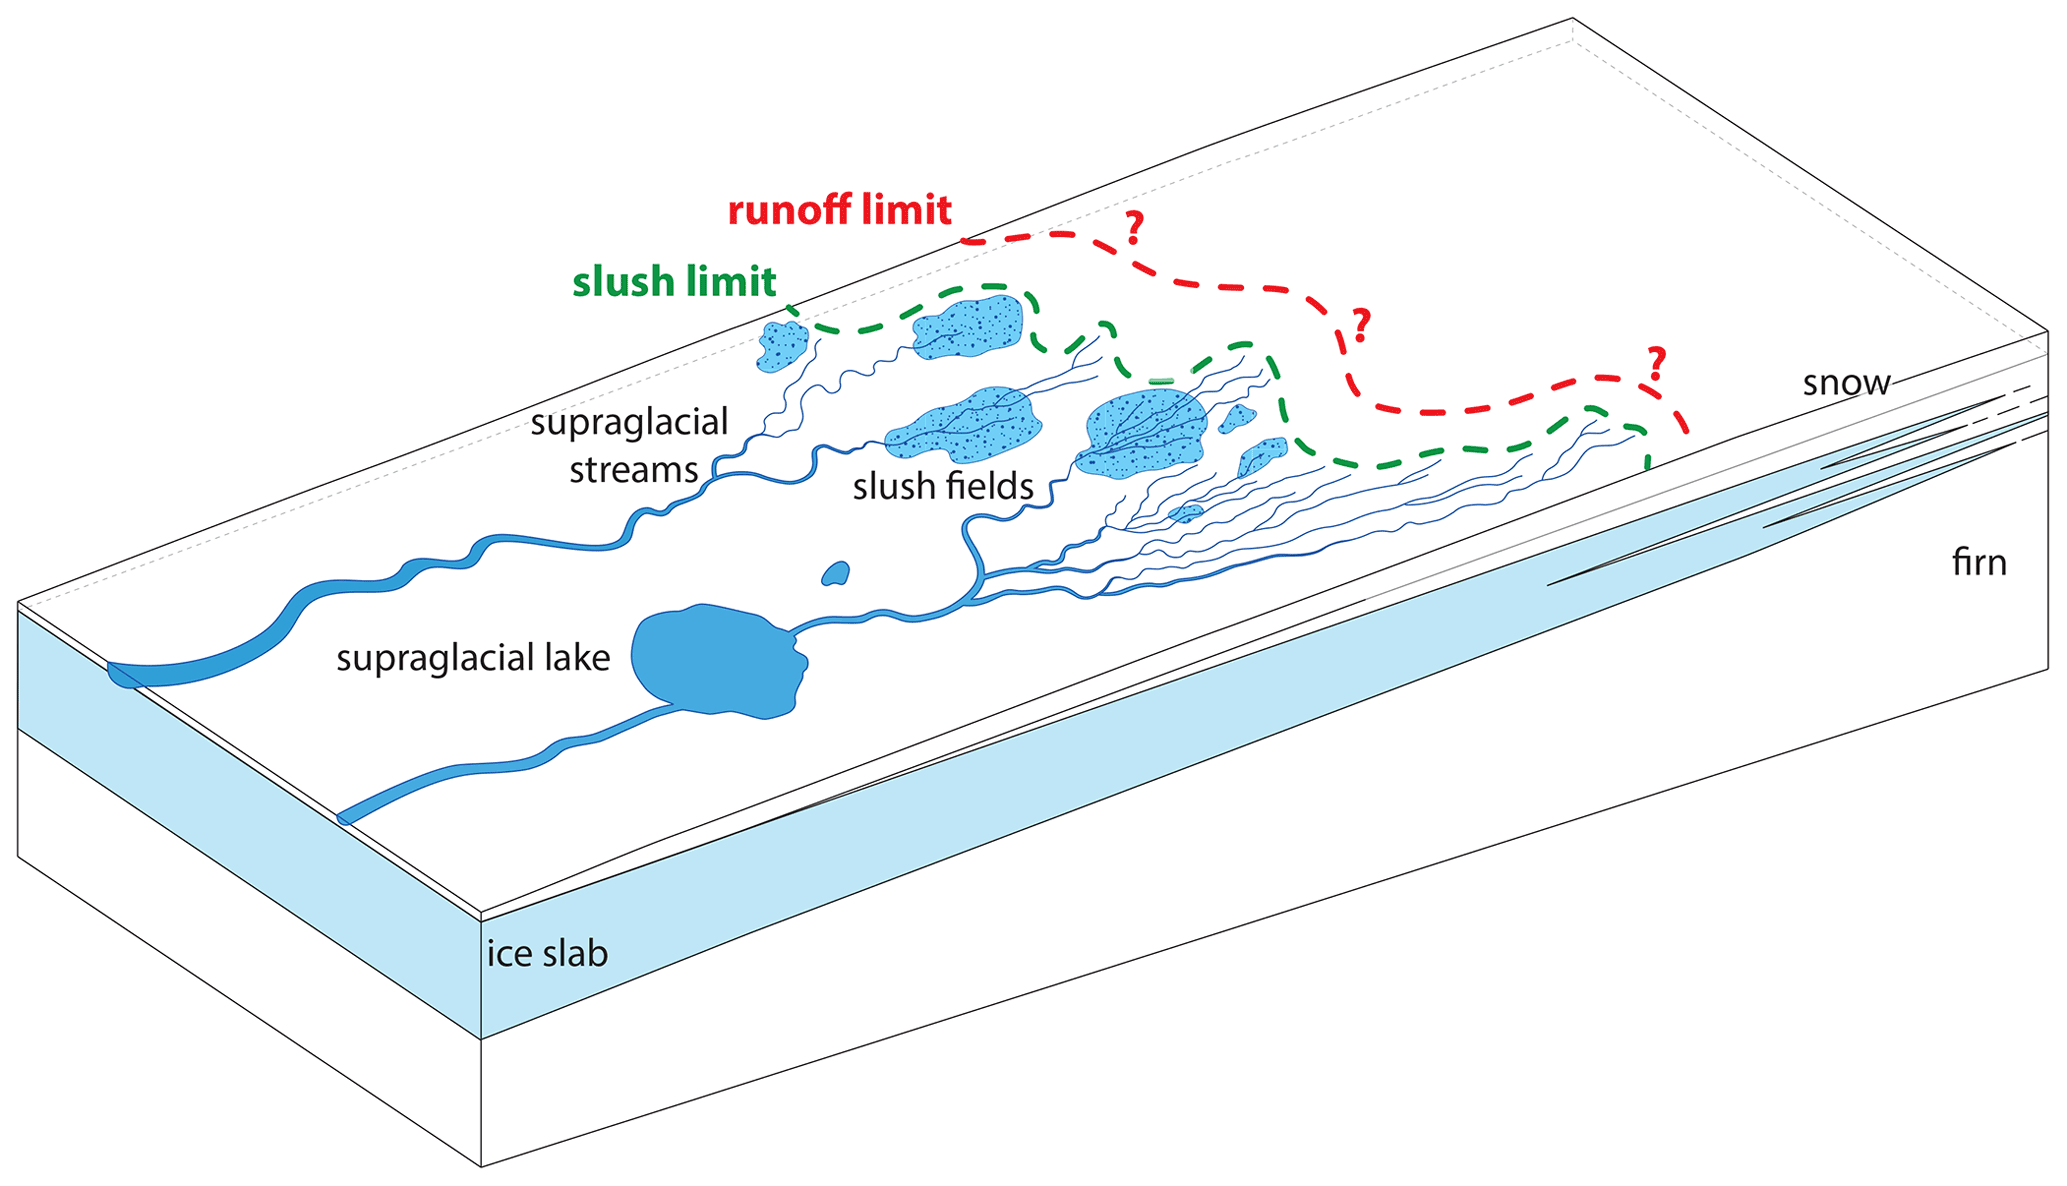
Figure 1Schematic overview of the elements of the hydrologic system in the accumulation zone of the SW GrIS. Water that percolates through the snow/firn pools into slush regions and is eventually evacuated through supraglacial streams. Liquid meltwater can be present above the slush limit during the summer season; the exact location of the runoff limit is unknown.
To date, the location of the slush and runoff limit has received limited attention. The slush limit in the 1990s was mapped using Advanced Very High Resolution Radiometer (AVHRR) satellite data by Greuell and Knap (2000), and using SMB analyses (Reeh, 1991), but until recently it has not received further attention. Tedstone and Machguth (2022) used Landsat satellite imagery to map the visible runoff limit (the slush limit as per our definition here) for all of Greenland. They were able to show that regional climate models simulate runoff areas that substantially exceed the runoff areas mapped using Landsat. This indicates uncertainties in model estimates of Greenland mass balance and shows the need to improve our understanding of the meltwater hydrology in the accumulation area. In situ measurements of firn hydrology around the runoff limit are scarce and spatially limited (e.g. Ambach, 1963; Braithwaite et al., 1994; Humphrey et al., 2012; Koenig et al., 2014; Cox et al., 2015), which means that adequate constraints on the hydrological properties of snow and firn in the GrIS accumulation area are lacking. It is therefore hard to quantify meltwater retention and runoff and to predict where this occurs.
Water flow in snow and firn is considered analogous to multi-phase flow through a porous medium: water and air are the two phases, and snow or firn is the medium or matrix through which flow takes place (Freeze and Cherry, 1979; Ambach et al., 1981; Colbeck, 1982). Vertical meltwater flow generally takes place when the snow or firn is not yet fully water-saturated and when there are no laterally extensive impermeable boundaries. Lateral meltwater flow occurs either when a uniform wetting front propagates downslope through fully saturated snow or firn or when vertical percolation is impeded by a permeability contrast that is too large, e.g. in the case of ice layers (Fountain, 1996).
Vertical flow, or water percolation, can be classified into two flow regimes: stable flow with a uniform wetting front and unstable flow through preferential flow paths (Mitterer et al., 2011). The distribution and size of preferential flow paths in snow is dependent on the structure of the snowpack and the meltwater generation rate (Schneebeli, 1995). Microstructural properties of the snowpack strongly influence the hydraulic properties of snow (Colbeck, 1974; Marsh and Woo, 1985; Yamaguchi et al., 2010). Porosity, irreducible liquid water content, water density and viscosity, permeability (contrasts), and snowmelt intensity are the main parameters driving the velocity of vertically percolating meltwater (Martinec, 1987). Because of capillary effects, preferential vertical flow paths (pipes or flow fingers) often develop when the snowpack is not fully saturated, causing a very heterogeneous water saturation throughout the snowpack. These preferential flow paths provide a more efficient water transport mechanism than matrix flow alone and often precede a background wetting front which will form when meltwater generation rates are sufficiently high or when saturation increases because percolation is impeded due to permeability contrasts (Marsh and Woo, 1984a, b). Once flow fingers have frozen, new preferential flow paths will form, and older flow fingers will generally not be reactivated, since preferential flow paths from subsequent melt–refreezing cycles are mostly mutually exclusive (Schneebeli, 1995).
Similar to the case of vertical flow, preferential flow plays an important role for lateral meltwater transport in the case that the snowpack is not yet fully saturated (Kattelmann, 1989). Occasional vertical breakthroughs in stratigraphic boundaries can route meltwater to deeper layers in the snowpack (Kattelmann and Dozier, 1999; Eiriksson et al., 2013). Once a shallow snowpack is fully saturated and the hydrostatic water level rises above the snowpack surface, water starts moving as sheet flow over the snow. In deep snowpacks, channels may develop on the snow surface or within the snow (Woo and Sauriol, 1980). Governing parameters for lateral meltwater flow are similar to those for vertical flow, with water saturation and slope as additional inputs.
In this paper we focus on the hydrological processes in, and matrix properties of, snow, slush and firn near the runoff limit on the southwestern Greenland Ice Sheet. We undertook two fieldwork campaigns to measure the hydrology of snow, slush and firn. In one campaign we investigated the hydrological properties of icy firn above the current runoff limit, with an emphasis on constraining vertical meltwater percolation rates, which we describe in Sect. 4. In the other campaign we measured saturated lateral flow inside the snow matrix directly on top of an ice slab, focusing on its ability to transport meltwater laterally, which we describe in Sect. 5. We also present measured values for snow and firn permeability and compare these to other existing literature data. Lastly, we show how our measured values compare to existing permeability parametrizations.
The study area (Fig. 2) is located in the southwestern part of the Greenland Ice Sheet, around the upper end of the K transect (van de Wal et al., 2005), which is a region with an excellent availability of firn records (Rennermalm et al., 2021). This area in the accumulation zone is relatively flat: average surface slope is around 0.30∘ based on ArcticDEM V1 (Porter et al., 2018).
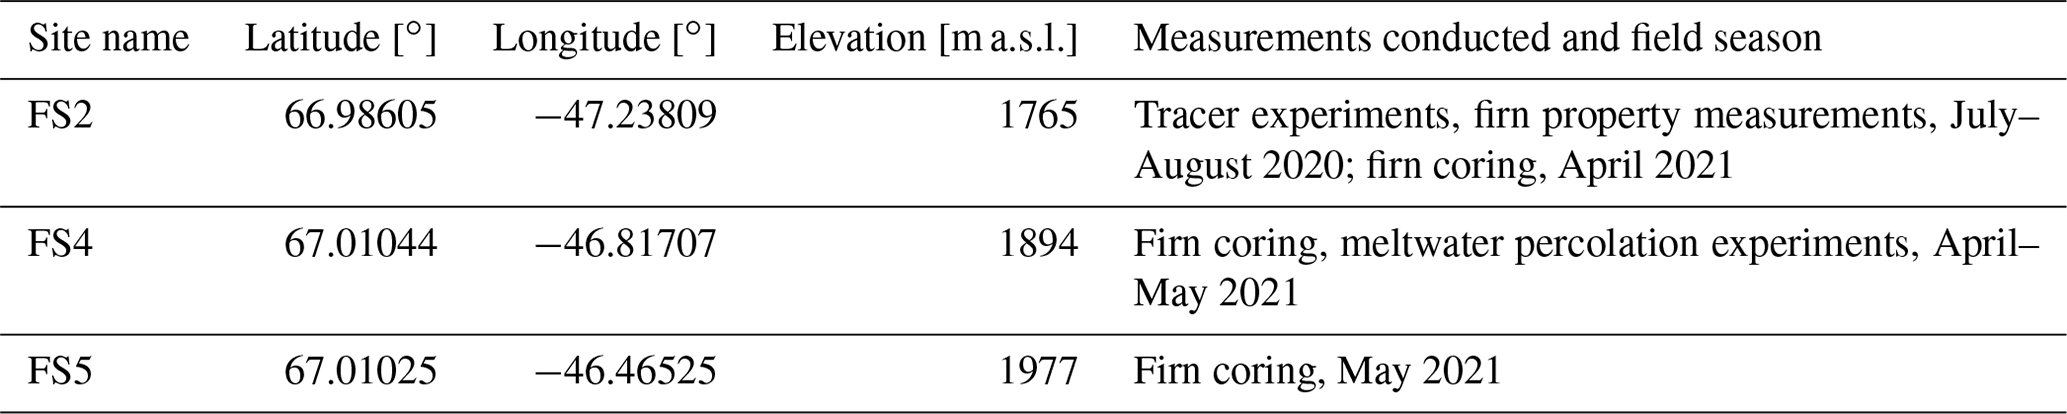
The field sites (Fig. 1, Table A1) are located around the elevation at which, in recent years, the slush limit occurred. The slush limit falls within the area of recently identified and widespread near-surface ice slabs (Machguth et al., 2016; MacFerrin et al., 2019). We undertook fieldwork in July–August 2020 and in April–May 2021.
During summer fieldwork in 2020 the slush limit was not as high as shown in Fig. 2b, since this satellite image is deemed to represent the maximum extent of liquid water visible on the surface in recent history, given that 2019 was a record melt year (Sasgen et al., 2020). At the start of the summer field campaign the slush limit was clearly below the elevation of the FS2 site, based on observations in the field and confirmed by Sentinel data (Fig. 2c). During the field campaign, liquid water presence in the area occurred at progressively higher elevations (Fig. 2d).
The KAN_U weather station, part of the Programme for Monitoring of the Greenland Ice Sheet (PROMICE; Ahlstrøm et al., 2008), is located in the study area at an elevation of 1830 m a.s.l. (Fig. 2b). Average surface melting at this weather station between 1980 and 2013, as simulated by the RACMO2 regional climate model (RACMO2.3p2, Noël et al., 2018), was 0.33 m w.e. yr−1 (Verjans et al., 2019). In the record melt year 2012 approximately 35 melt days occurred along the K transect (Tedesco et al., 2013) with a total amount of surface melt of roughly 0.85 m w.e. yr−1 (Verjans et al., 2019). This would result in an hourly melt rate of ∼ 2 mm w.e. h−1 when assuming a maximum of 12 h of melt per day.
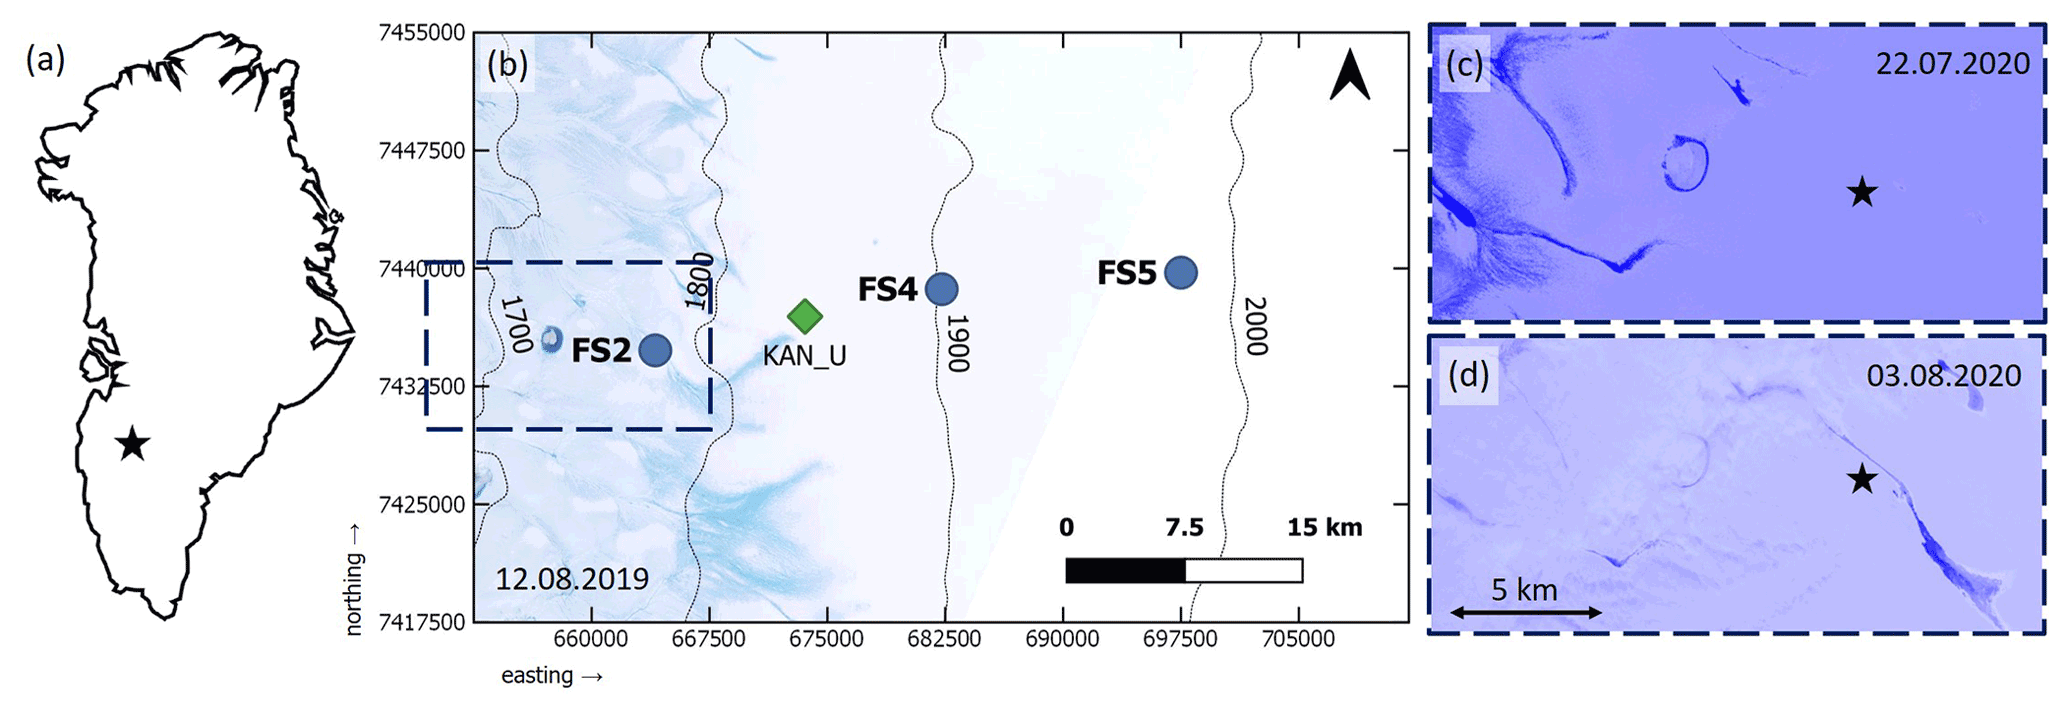
Figure 2(a) Overview map of Greenland, with the black star indicating the approximate field site location. (b) Map of the study area, showing the various field sites (FS2 for summer measurements; FS4 for spring data collection; FS2, FS4 and FS5 for firn stratigraphy and KAN_U for meteorological data). Thin black lines represent elevation contours from the ArcticDEM modified to show elevation (in m a.s.l.). (Porter et al., 2018). The background image is a Sentinel-2 true colour composite from around the time of maximum melt extent in 2019. The dashed dark blue rectangle indicates the outline of the composites shown in panels (c) and (d). (c) Sentinel-2 Normalized Difference Water Index (NDWI) composite showing the liquid water presence (in dark blue) on the ice sheet surface on 22 July 2020. (d) Sentinel-2 NDWI composite showing the liquid water presence on the ice sheet surface, again in dark blue, on 3 August 2020. Note that the surface meltwater in the lower areas is masked by the presence of clouds. For (c) and (d), the black star indicates the location of field site FS2. For (b), (c) and (d), the source is Sinergise Ltd. (2022).
Firn and snow are mixtures of air, ice and water, in which metamorphic processes change the morphology and physical properties of the snow particles (Bartelt and Lehning, 2002). The density of snow or firn ρ is related to the density of air ρa, the density of water ρw and the density of ice ρi:
where θa, θw and θi are the volumetric fractions of air, water and ice, respectively.
Porosity ϕ is the volume fraction of pore space in a medium. When neglecting the density of air and assuming that the volume fraction of water Vw≈0, it can be calculated as
where VT is the total volume [m3], ρ is the sample density [kg m−3], and ρi is the density of ice [kg m−3].
The liquid water content θw and liquid water saturation Sw are two distinct measurements of snow wetness: θw is defined as a volumetric percentage of total volume, whereas water saturation Sw is defined as the amount of pore space occupied by liquid water:
We define slush as snow or firn in which all pore space is occupied by liquid water, i.e. Sw=1. Slush consists of separated and rounded particles and polycrystals completely immersed in water (i.e. water-saturated soaked snow and firn), with ice and water in thermodynamic equilibrium (Fierz et al., 2009).
The irreducible water saturation Sw,ir is the residual fraction of liquid water that cannot be removed from the pore space due to capillary forces. According to several experimental studies (e.g. Colbeck, 1974; Coléou and Lesaffre, 1998), the irreducible water saturation Sw,ir of snow is approximately 7 %. Measured values of liquid water content (LWC) in a ripe snowpack, i.e. a snowpack that has warmed up to 0 ∘C and now consists of metamorphosed, granular snow crystals and hence can yield meltwater, have been reported between 2 % and 4 % (e.g. Jordan et al., 1999; Yamaguchi et al., 2012; Katsushima et al., 2013). Numerical simulations suggest that water saturation in the case of preferential flow can be as low as 1 % (Marchenko et al., 2017).
Since meltwater flow through snow and firn is an example of flow through a porous medium (Jordan et al., 2008), the empirical Darcy's law can be used to calculate the hydraulic conductivity of firn:
where q is the instantaneous flux [m s−1], Q is discharge [m3 s−1], A is the area through which flow occurs [m2], K is hydraulic conductivity [m s−1], k is the permeability of the medium [m2], μ is the dynamic viscosity [Pa s] of the fluid, and is the hydraulic gradient. The hydraulic gradient describes the difference in hydraulic head h [m], which is defined as
where Ψ is the pressure head [m], z is the elevation head [m], P is the fluid pressure [Pa], ρ is bulk density of the fluid [kg m−3], and g is acceleration due to gravity [m s−2]. Darcy's law is valid as long as flow is laminar (i.e. when the Reynolds number, describing the ratio of inertial to viscous forces within a fluid, does not exceed some value between 1 and 10; Bear, 1972). Furthermore, the fluid is assumed to be incompressible and the porous medium to be solid, i.e. consisting of a non-deforming matrix. Note that in snow and firn, meltwater percolation often takes place through preferential flow paths. Although in these flow fingers the meltwater flow is saturated, the bulk of the snow and firn mass is not.
Permeability is an intrinsic material property that indicates the ability for fluids to flow through this material, independent of the fluid. It is a function of porosity but also related to grain shape and connectivity of the pores. The hydraulic conductivity, an extrinsic material property that describes the ease with which a given liquid can move through porous media, is related to permeability as follows:
Rewriting Eq. (4) for vertical percolation to solve for hydraulic conductivity (in the case that the total differential pressure is equal to the difference in hydrostatic pressure) gives, since in this case,
For the case of lateral meltwater flow through a porous medium without significant pressure changes, the hydraulic gradient reduces to the elevation head only, and hence Darcy's law can be rewritten as
where ΔH is the elevation difference [m] over a distance of ΔL [m].
The Kozeny–Carman equation relates a medium's permeability to pressure drop and fluid viscosity for laminar flow through a packed bed of solids, and when combined with Darcy's law, it can be used to predict permeability (Kozeny, 1927; Carman, 1937; Bear, 1972):
where ϵs is sphericity (= 1 for perfect spheres and between 0 and 1 for all other grain shapes), ϕ is porosity, and Dp is effective grain diameter [m].
For snow and firn many other parametrizations exist that relate permeability to density or grain size, based either on direct measurements of air or liquid permeability (e.g. Shimizu, 1970; Jordan et al., 1999; Albert et al., 2000) or on numerically computed material properties using 3-D microstructural images (e.g. Freitag et al., 2002; Calonne et al., 2012). Since the power law exponents in parametrizations based on direct permeability measurements are commonly site-specific (Adolph and Albert, 2014), here we use the parametrization by Calonne et al. (2012) that links permeability to specific surface area, density and microstructural anisotropy:
where ρs is snow density [kg m−3], and res is the equivalent sphere radius [m]. The equivalent sphere radius relates the specific surface area of a snow particle (SSA) to ice density (ρi) as follows based on German (1996):
4.1 Methods
To measure firn density and stratigraphy, we drilled multiple 8.9 cm diameter firn cores during the spring 2021 field campaign using a Kovacs coring system. Firn stratigraphy was recorded at centimetre scale, and 10 cm core sections were measured and weighed for density. Furthermore, traditional snowpack profiles in snowpits were analysed following the international classification of seasonal snow on the ground (Fierz et al., 2009), including observations on grain size and shape, snow temperature, layer thickness, snow hardness, and density.
To measure the hydraulic properties of icy firn, i.e. firn interspersed with discontinuous ice lenses, we carried out meltwater percolation experiments. A portable lysimeter, a “rain on snow appliance” (ROSA), was installed in a temporary laboratory at FS4 (Fig. 2) to investigate water percolation and retention in firn. ROSA was originally designed and constructed by the University of Bern and used to study hydrological processes during rain-on-snow events in the Swiss Alps (Probst, 2016; Zaugg, 2017). We adapted the device to undertake experiments to determine the hydraulic conductivity and water retention capacity of icy firn.
4.1.1 Measurement set-up
ROSA consists of a frame with a square base and a height of about 2 m (Fig. 3). The sprinkling system through which liquid water is delivered to the snow or firn block is attached at the top of the frame. Irrigation intensity is controlled by a digital Alicat LC flow controller, which has an operating range between 0.5 and 500 cm3 min−1 and an accuracy of ±2 % of the set flow rate. Liquid water used for simulating melt is dyed (low concentration solution of Rhodamine water tracer, afterwards Rhodamine WT or RWT) and delivered to the sprinkling system from a barrel through Comet submersible aquarium pumps. The temperature of the sprinkling water is monitored, and snow is added to maintain a consistent 0 ∘C. The firn sample is placed in a cage which is suspended from the frame with strain-based load cells. The runoff from the firn block is collected below the cage and channelled into two RainWise tipping bucket rain gauges.
The sprinkling head on ROSA has 84 outlets that each have a diameter of 3.5 mm, arranged in a diamond grid. Before each experiment we ensured that all outlets contributed to irrigation roughly equally. The sprinkling head is located 1 m above the “dripping plate” on which the sample is placed. The total distance between the injectors and the snow/firn surface was roughly 85 cm on average (depending on the thickness of the sample). To irrigate the firn block surface uniformly, the sprinkling system was moved by an electrical motor throughout each experiment. In the field, this motor stopped working after a few experiments. A stationary sprinkling system resulted in deep holes within the firn block, as liquid water did not disperse homogeneously within the sample. For subsequent experiments the sprinkling head was therefore moved manually in 2 cm increments every 3 min, leading to homogeneous distribution of supplied meltwater over the surface of the samples.
At the base, middle and top of the sample cage, one hygroclip and two HygroVUE5 sensors are attached to the metal frame to measure air temperature and humidity. The flow controller, tipping buckets, temperature and time domain reflectometry (TDR) sensors (Campbell Scientific 107 temperature and CS655 TDR probes), as well as the three hygroclips, are connected to a Campbell Scientific CR1000 datalogger that records data at a 10 s interval.
Ambient temperature was monitored during each experiment to prevent melting of the firn sample or refreezing of discharged water. Whenever the ambient temperature rose above 0 ∘C, we used an electrical fan to blow colder outside air into the tent. Temperatures that were too low were avoided by doing experiments only at times when solar radiation could sufficiently heat the tent. Furthermore, the base of the metal plate funnelling discharged water into the tipping buckets is equipped with resistor heating wires to prevent freeze-on.
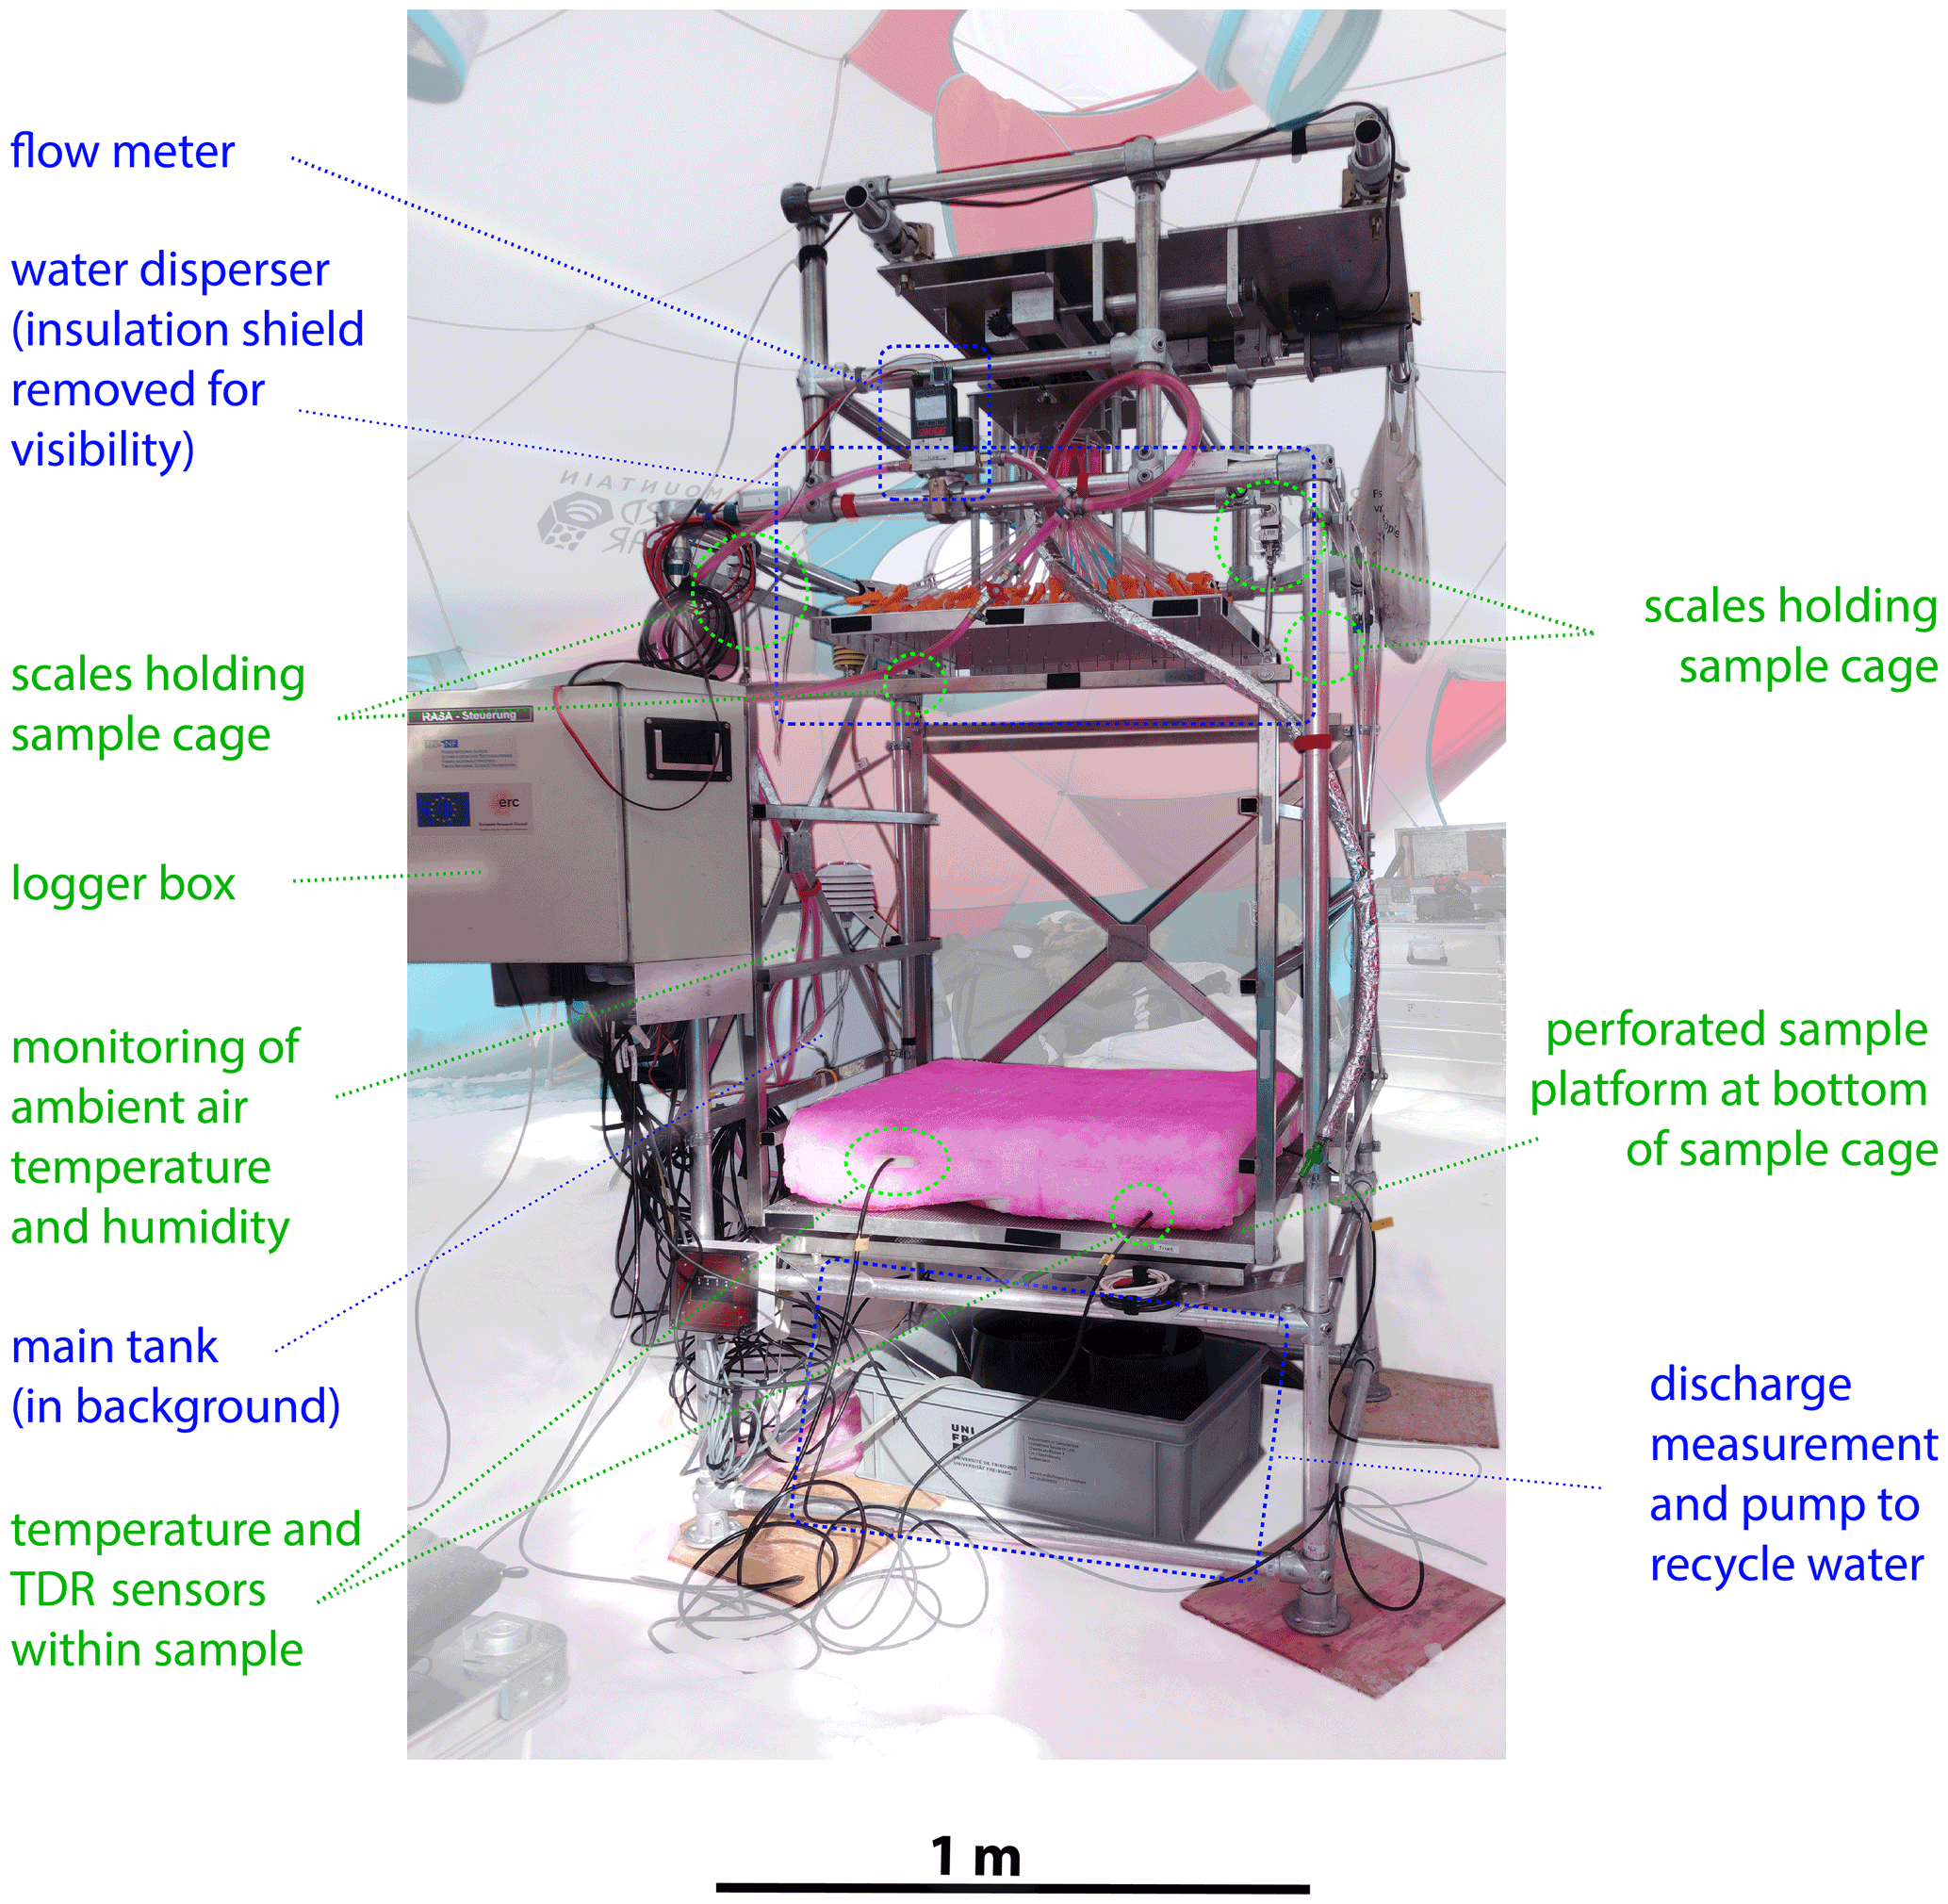
Figure 3The rain on snow appliance (ROSA) as deployed on the Greenland Ice Sheet. Items related to the water circulation are labelled in blue; other parts are highlighted in green.
Before the start of each percolation experiment, four temperature sensors were inserted horizontally to about 20 cm into the sample ∼1 cm above its base. A fifth sensor monitored water temperature in the sprinkling supply barrel. Two TDR sensors were installed at the front and back side of the firn block, approximately 20 cm inside the sample and about 10 cm above its base.
4.1.2 Experimental procedure
Snow and firn samples were collected at FS4, either from a snowpit or the 2 m deep “firn quarry”. The stratigraphy of the snowpit and the quarry is described following Fierz et al. (2009).
Samples were transported and inserted into ROSA manually. Once inside the measurement cage, sensors were drilled into the sample using a 1 cm diameter, 20 cm long drill bit mounted onto a battery-powered drill. The length, width and height of the block were measured close to the sample edges once the experiment had started, taking the average of three measurements on each side for height determination.
All experiments were carried out at a fixed flow rate of 100 cm3 min−1, which is equivalent to a meltwater supply rate of roughly 12 mm h−1 for this measurement set-up. The exact duration of individual experiments was not fixed beforehand, but we ran each experiment long enough for throughflow to occur for around 30–60 min (Table 1). Theoretically, longer experiment durations would have been desirable to be able to simulate lower, more realistic surface melt rates, but this proved unfeasible on the ice sheet where the meteorological conditions introduced practical and physical limitations. Upon completion of an experiment we recorded preferential flow paths and block stratigraphy. Starting at the front vertical face of the block we made individual slices with a spacing of 10 cm that were systematically photographed.
4.2 Results
4.2.1 Firn stratigraphy
To determine firn stratigraphy and identify the extent of near-surface ice content, we drilled a total of five firn cores at FS2 (12 m depth), FS4 (5 and 22 m) and FS5 (5 and 21 m) (Fig. 4). The thick ice slab visible at FS2 does not extend to FS4. Although ice lenses of multiple metres thickness are still present in the cores at FS4, the ice content in the top 10 m of the firn (excluding the seasonal snowpack) has reduced from 94 % at FS2 to 54 % at FS4. At FS5, which is at an even higher altitude, total ice content in the uppermost 10 m of the firn further decreases to 35 %, and maximum ice lens thickness is less than 1 m.
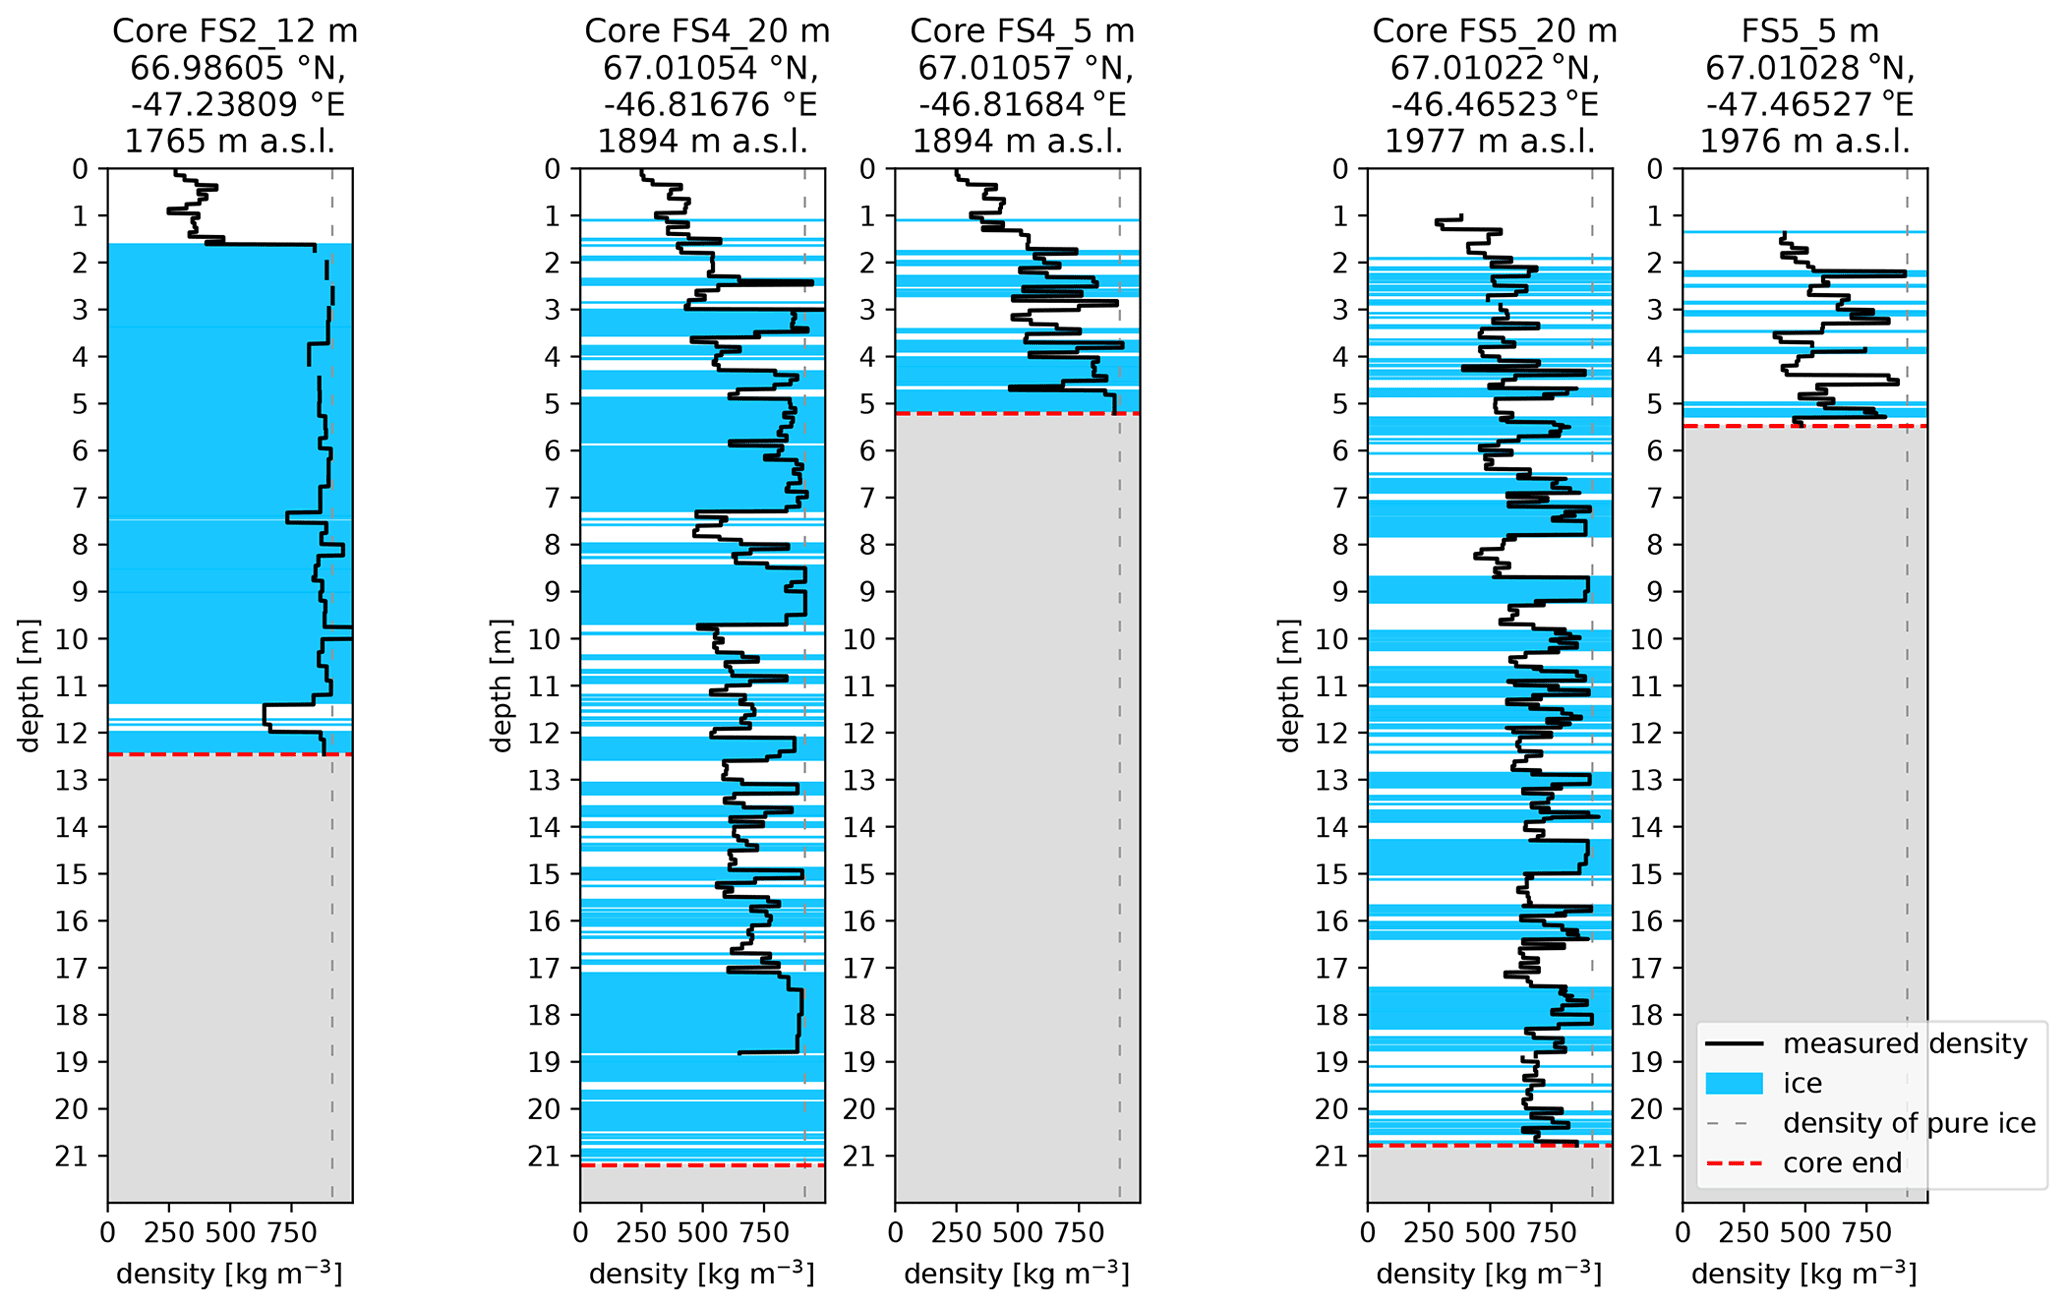
Figure 4Firn stratigraphy at the three field sites as measured in spring 2021. Core logs are displayed W–E or low–high altitude from left to right. Core FS2_12 is at the location of the 2020 summer field measurements, whereas the meltwater percolation experiments carried out in spring 2021 are co-located with Core FS4_20m and Core FS4_5m (see Fig. 2).
4.2.2 Vertical water percolation through icy firn
Using ROSA, we carried out seven meltwater percolation experiments: six with firn blocks and one using a snow sample. All samples had a footprint of roughly 70×70 cm and a thickness ranging from 13–28 cm. Initial density was measured between 414 and 600 kg m−3. The block for the snow experiment originated from a snowpit at ∼ 1.5 m depth and consisted of older, transformed, relatively coarse-grained snow including layers of depth hoar, alternated with layers of finer-grained wind-blown snow. The firn blocks originated from a 2 m deep quarry at FS4. The samples were extracted side by side, and the depth of their top surface (i.e. the top of the firn layer at the time) was at 1.32 m below the snow surface. All firn blocks contained several discontinuous ice lenses with a thickness ranging from 0.5–2 cm. One firn sample (firn4) contained a thicker ice lens of 3–5 cm, visible on all sides of the block. The results of the seven experiments highlighted in Table 1 are presented in this section.
Table 1Metadata for the various meltwater percolation experiments.
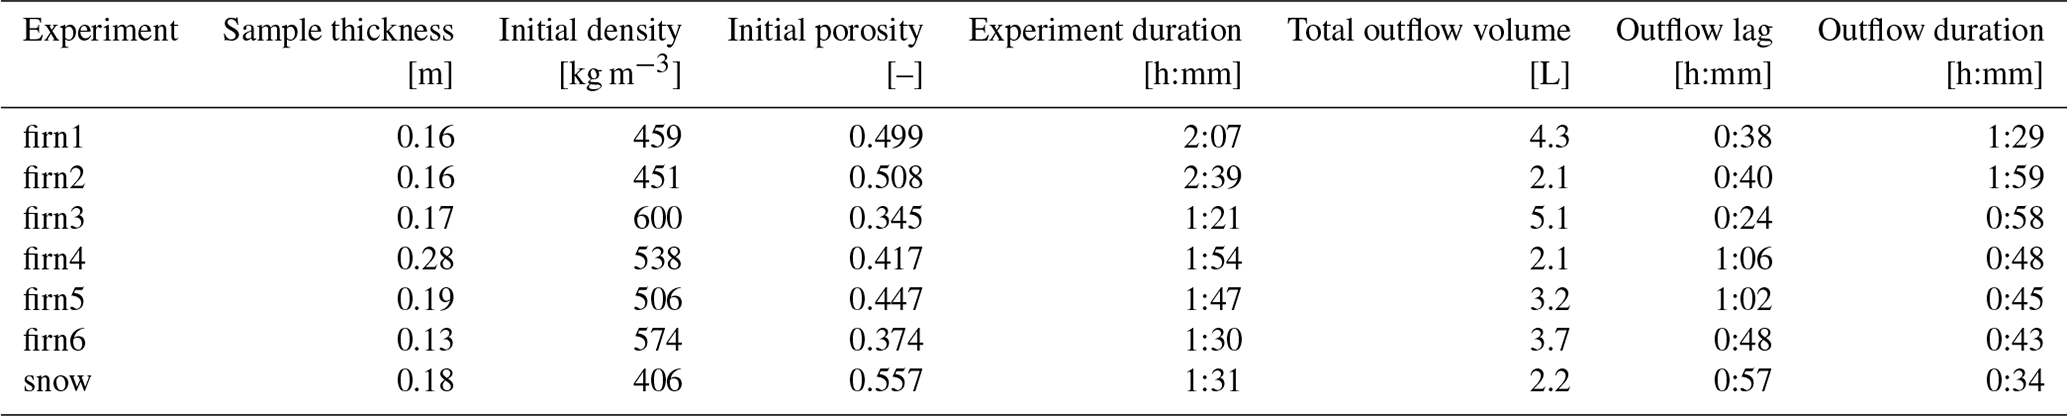
We distinguish velocities of unsaturated vertical meltwater percolation, calculated using the elapsed time between the start of meltwater in- and outflow, and flow velocities that represent “saturated” meltwater flow through preferential flow fingers, i.e. the firn hydraulic conductivity, calculated using Eq. (7) with the final 15 min of outflow before the water supply was stopped. Here Q is the average discharge as measured by the lysimeters in this time period, and A is the surface area of the sample. Note that this could be a significant overestimation of the surface that is actually used for flow given that meltwater predominantly flows through preferential flow fingers, meaning that actual flow velocities could be (in extreme cases) up to 20× higher – reported measurements of minimum flow finger area as a percentage of the total snow/firn sample area range between 5 %–30 % (Williams et al., 2010; Katsushima et al., 2013). Figure 5 shows the evolution of “hydraulic conductivity”, density and firn sample mass over time for all percolation experiments, and Table 2 shows the main calculated parameters. In all experiments there is a pronounced change in the rate of densification once continuous water outflow commences. This is especially clear in the firn2, firn5 and firn6 experiments (Fig. 5). Note that the densification is purely due to adding mass to the sample; no compaction was observed throughout the experiments. The formation of preferential flow paths is probably the reason for the distinct stages in densification rate: before continuous outflow occurs, the preferential flow paths are insufficient to evacuate the supplied meltwater. Once outflow starts, the development of preferential flow paths continues until sufficient water evacuation channels have developed, at which point the densification rate becomes more or less constant.
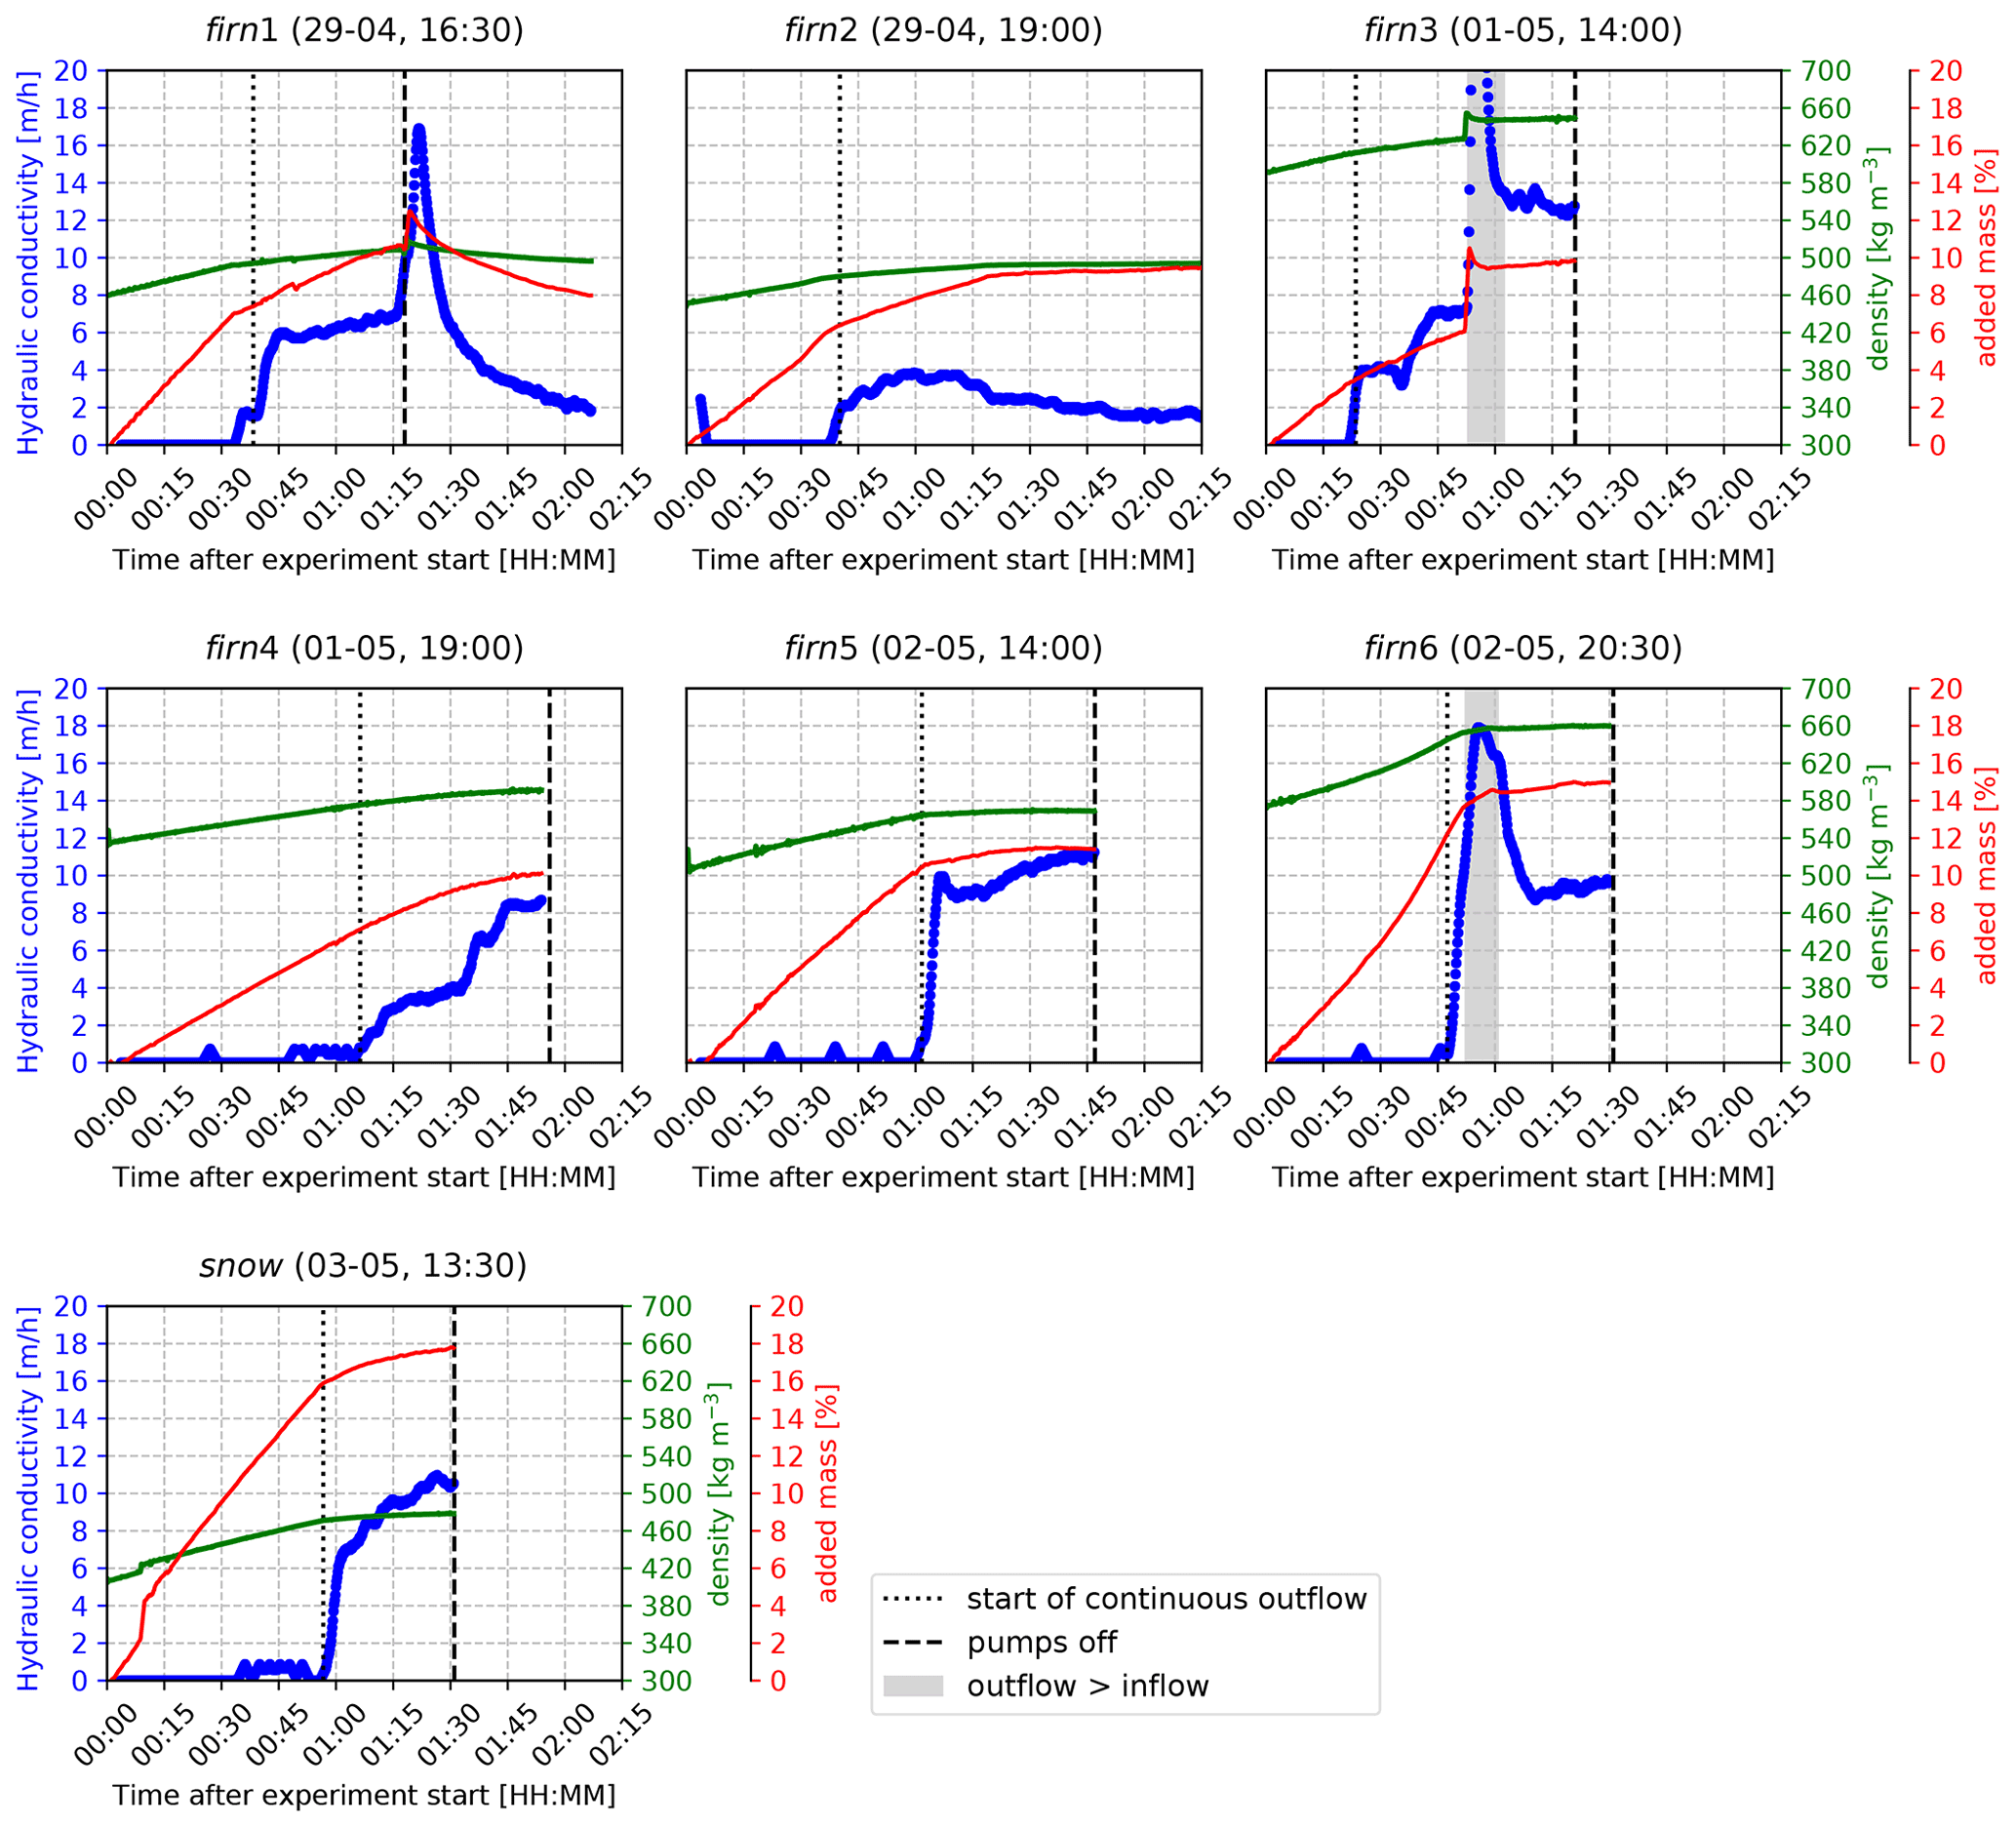
Figure 5Hydraulic conductivity, added mass and density over time for seven individual ROSA experiments. In blue is the calculated hydraulic conductivity, in red is the firn sample mass as a percentage of its mass pre-experiment, and in green is the density over time. The dotted line indicates start time of continuous outflow, and the dashed line shows the time at which water supply was stopped (note that for experiment firn2 the label “pumps off” is not shown since this experiment was continued for longer than the time displayed here). Grey shading shows where outflow > inflow. The title shows the name of the experiment and its starting date and time (dd-mm, HH:MM) in local time (UTC −4:00); all measurements were carried out in 2021.
Table 2Measured and calculated parameters for the percolation experiments.
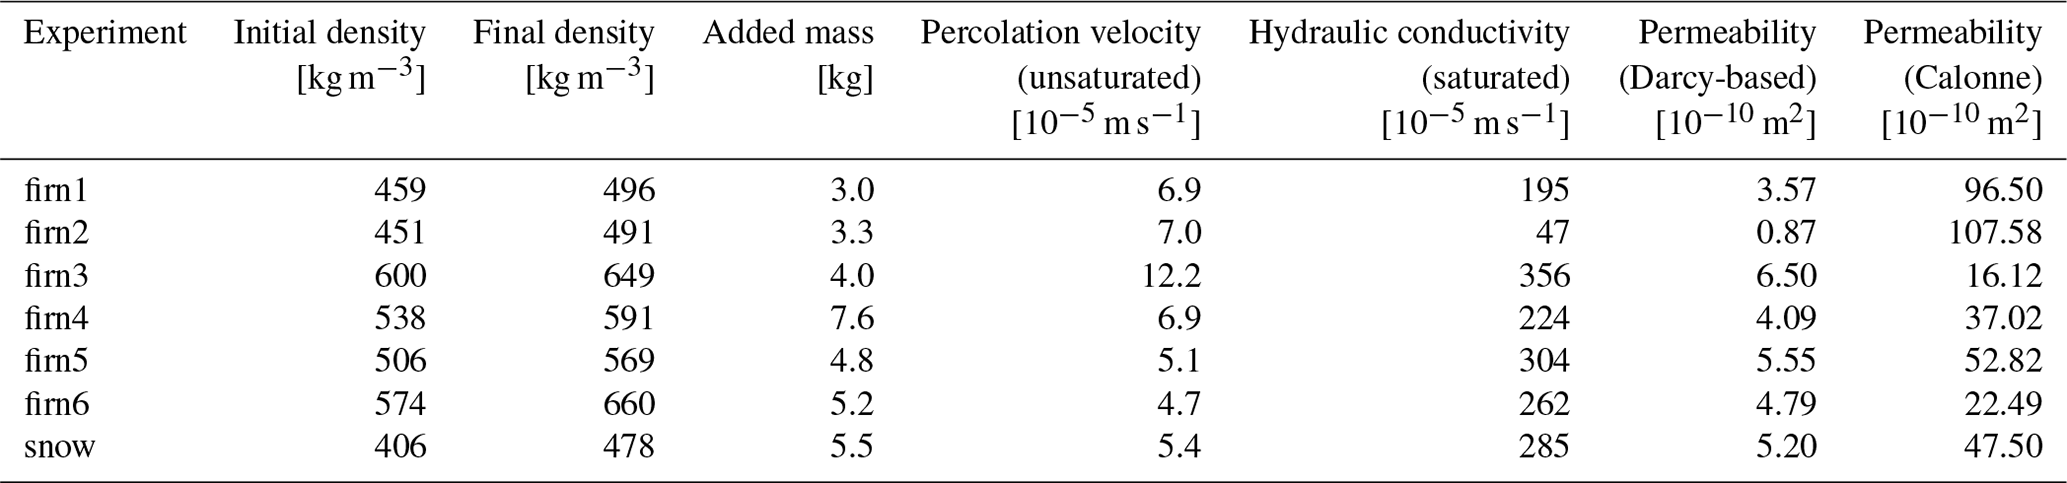
Measured hydraulic conductivity values range between 1.71 and 12.80 m h−1 (47–356 × 10−5 m s−1), averaging 8.60 ± 3.58 m h−1. Permeability was calculated in two ways: (i) derived from the hydraulic conductivity (Eq. 8) and (ii) using Eq. (6) in combination with Calonne's parametrization (2012; Eq. 10), calculating the SSA using Eq. (11) assuming that 2⋅res equals the average grain size observed in the sample. Minimum and maximum permeability of the analysed samples varied between 0.87 × 10⁻¹⁰ and 6.50 × 10⁻¹⁰ m2 according to the Darcy-based calculation. A larger permeability range was found using Calonne's parametrization with an estimated average grain size for each of the firn blocks: 1.61 × 10⁻⁹ to 1.08×10⁻⁸ m2.
Outflow occurred in all experiments. Lag times between experiment start and outflow start ranged from 23 min to 1 h and 7 min, although no significant relationship between outflow lag and initial density or any other measured variable exists. Velocities of unsaturated flow were calculated using the lag time of meltwater outflow and sample height and range from 0.167–0.438 m h−1 (=4.65 × 10⁻⁵–1.22 × 10⁻⁴ m s−1), with an average of 0.25 ± 0.091 m h−1. This is up to 2 orders of magnitude smaller than the observed hydraulic conductivities (i.e. the “saturated” meltwater flow velocities). Outflow started before the entire firn block reached 0 ∘C (Fig. 6). As the experiments progressed, firn temperature continued to increase. Consistent outflow had already begun once all sensors inside the firn block showed a temperature of 0 ∘C for all experiments.

Figure 6Air and firn temperature over time for experiments firn1 and firn3. The dashed blue line indicates start time of continuous outflow, and the grey shading shows where outflow > inflow. The dashed black line shows the time at which the experiment was stopped (when pumps were turned off). Coloured lines show temperature evolution at four locations within the firn block, ∼ 1 cm above its base. Grey dashed and dotted lines represent air temperatures at the side of ROSA.
Preferential flow and fingering was clearly visible in many of the experiments (Fig. 7). Note that in Fig. 7a and b sections of firn blocks are shown after water percolation, which means that higher concentrations of dye highlight icy layers and preferential flow fingers, whereas Fig. 7c displays a section of a snow sample in which dye accumulates in finer-grained layers due to capillary forces. The fact that firn temperatures were locally still sub-zero but outflow was already taking place (Fig. 6) is further evidence that preferential flow occurred. A homogeneous pink colouring of the full sample, suggesting that a uniform wetting front had travelled through the entire block, was not observed in any of the experiments.

Figure 7Three examples of firn and snow block sections after water percolation showing preferential flow paths and structural heterogeneity. Figures (a) and (b) are firn samples (firn3, firn6) where higher concentrations of dyed water highlight icy layers and preferential flow fingers, whereas figure (c), displaying the sample after experiment snow, shows that in mature snow dye accumulates in finer-grained layers due to capillary forces.
During experiment firn1, the motor that moved the sprinkling head stopped working. When trying to move the sprinkling head manually, it fully drained instantaneously. Since this probably only occurred after the firn block had completely reached 0 ∘C, all sensors were left in the firn sample to continue measuring, and the firn block was let to drain naturally. Due to the lack of water supply, outflow quickly diminished (Fig. 5). Experiment firn2 was carried out with a stationary sprinkling head, and as a result water droplets created narrow but deep holes within the firn block. During experiment firn3, almost 30 min after continuous outflow had started but well before the block was isothermal, an inadvertent 0.5–1 min long peak of water inflow caused nearly instantaneous warming of about 5 ∘C (Fig. 6). About 2 min thereafter, this inflow peak was also clearly visible in the outflow curve (Fig. 5). In experiment firn4, with the firn sample containing the thickest (3–5 cm thick) and ostensibly fully continuous ice lens, water was observed to flow around this ice lens on the side of the firn block. We measured the volume of water bypassing the ice lens, by repeatedly weighing the amount of water absorbed by paper towels pressed against the ice lens for a fixed period of time, making sure that no water was sucked into the tissue from within the firn above and below the ice lens by capillary forces. On average, 35 out of the total 42 mL min−1 water outflow was found to not flow through but around the ice lens. This would mean that about 15 % of the total measured outflow was still percolating through the ice lens within the firn sample. Given the uncertainty of the method, however, it is unclear whether any water actually percolated through the ice. Observations of dyed water presence in the centre of the block after the experiment are inconclusive – it is unclear whether the minor amounts of pink dye present should be attributed to cutting artefacts from after the experiment or whether its presence was a result of actual flow through the ice lens.
5.1 Methods
5.1.1 Measurement set-up
During the summer field campaign in July–August 2020, we measured lateral flow velocity around FS2 (Fig. 2). We drilled a borehole transect to investigate lateral meltwater flow through a slush matrix over the near-surface ice slab (Fig. 8a).
Along the transect, we drilled cores and dug snow pits to the top of the ice slab, which was encountered at a maximum depth of 1.2 m (average depth of the ice slab was approximately 0.57 m). We logged the cores and snow pits for grain size and wetness and noted the presence of ice lenses and layers. The depth of the ice slab below the snow surface was measured, and to determine water table height we applied the steel-tape method using a folding ruler and a chalk marker pen.1 Water table height here is defined as the thickness of the water column on top of the ice slab after the water level has nearly instantaneously equilibrated following drilling of the borehole and removal of residual snow from the hole.
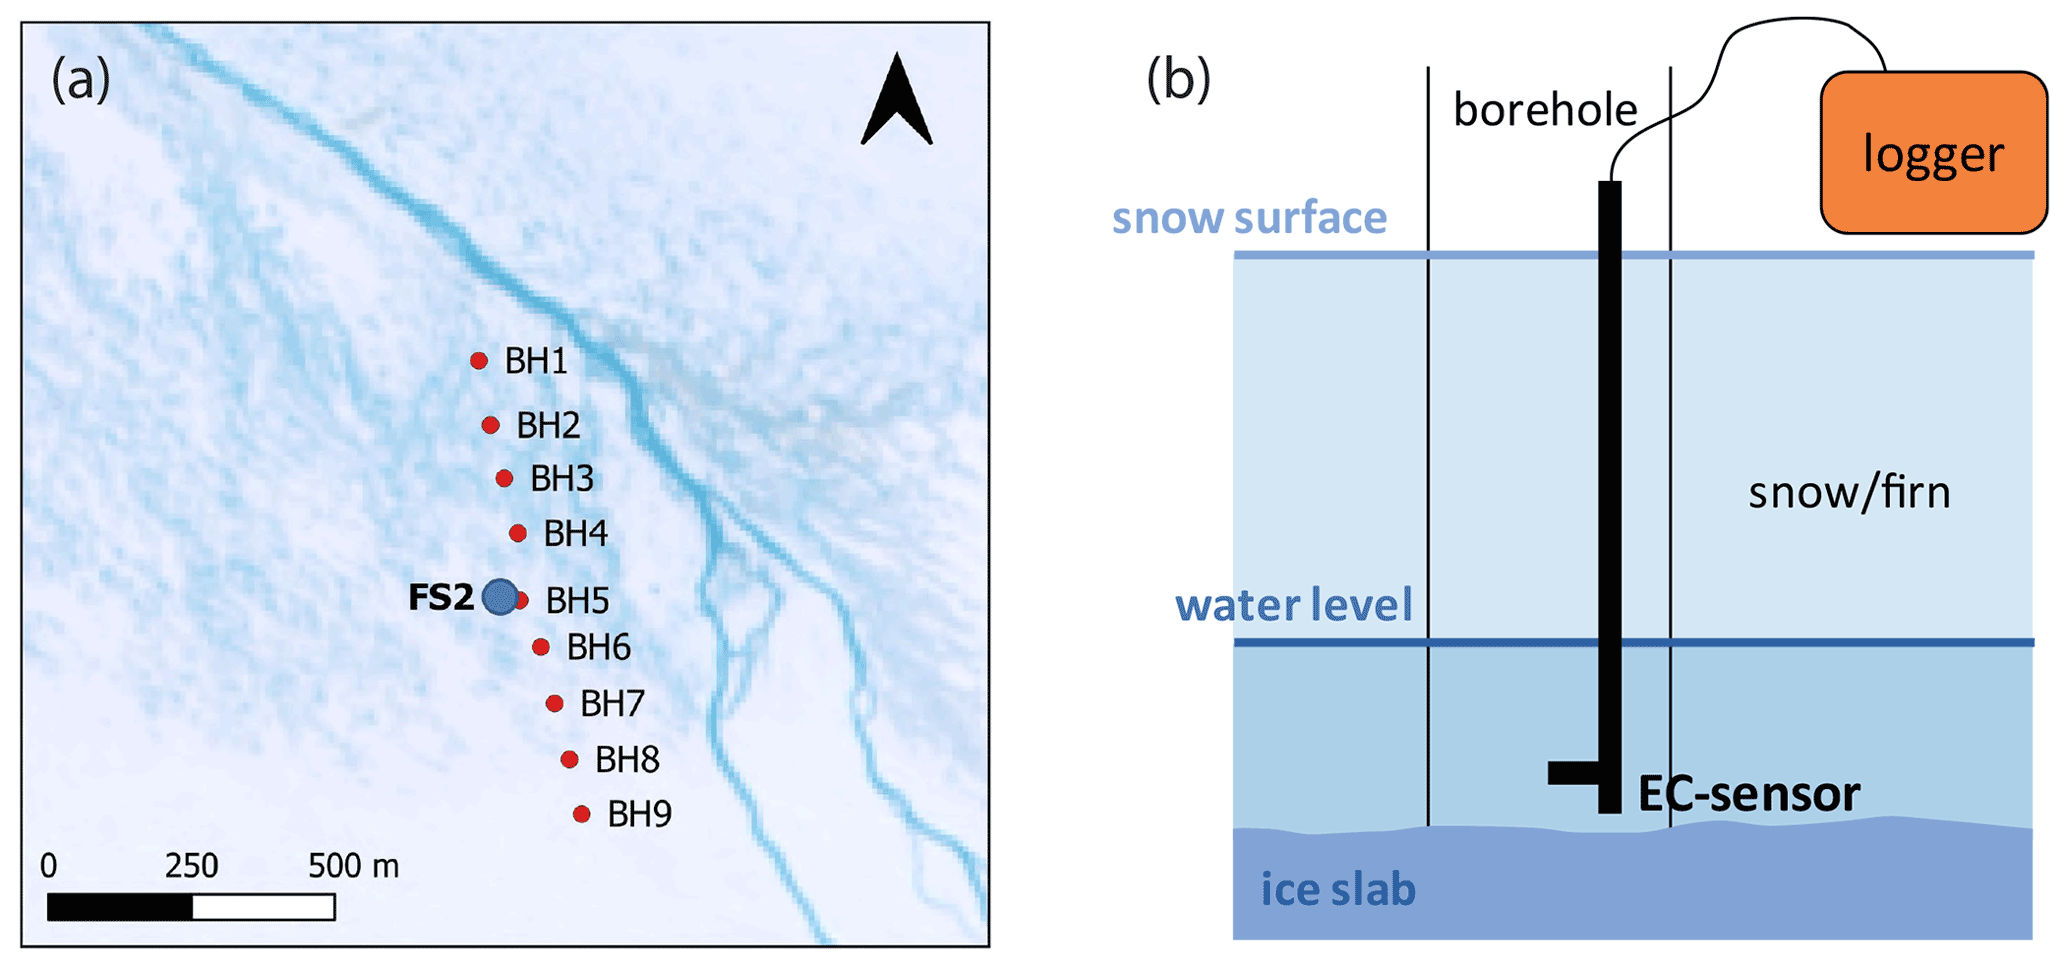
Figure 8(a) Location of boreholes (red points) on the GrIS during the summer 2020 field campaign. The background image is a Sentinel 2 true colour composite from 12 August 2019, around the time of maximum melt extent that year. (b) Schematic representation of the measurement set-up during salt dilution experiments.
During the data acquisition period, an initial warm and sunny spell was followed by decreasing temperatures and cloudy weather with precipitation, initially some rain followed by intense snowfall. Figure 9 shows the air temperature and cloud cover measured at the nearby KAN_U weather station for the 2020 melt season. Despite the decrease in temperature and nearly continuous full cloud cover from halfway through the campaign onwards, liquid water remained present at the ice sheet surface throughout the fieldwork period and for even longer on top of the near-surface ice slab (see also Fig. 2c and d).
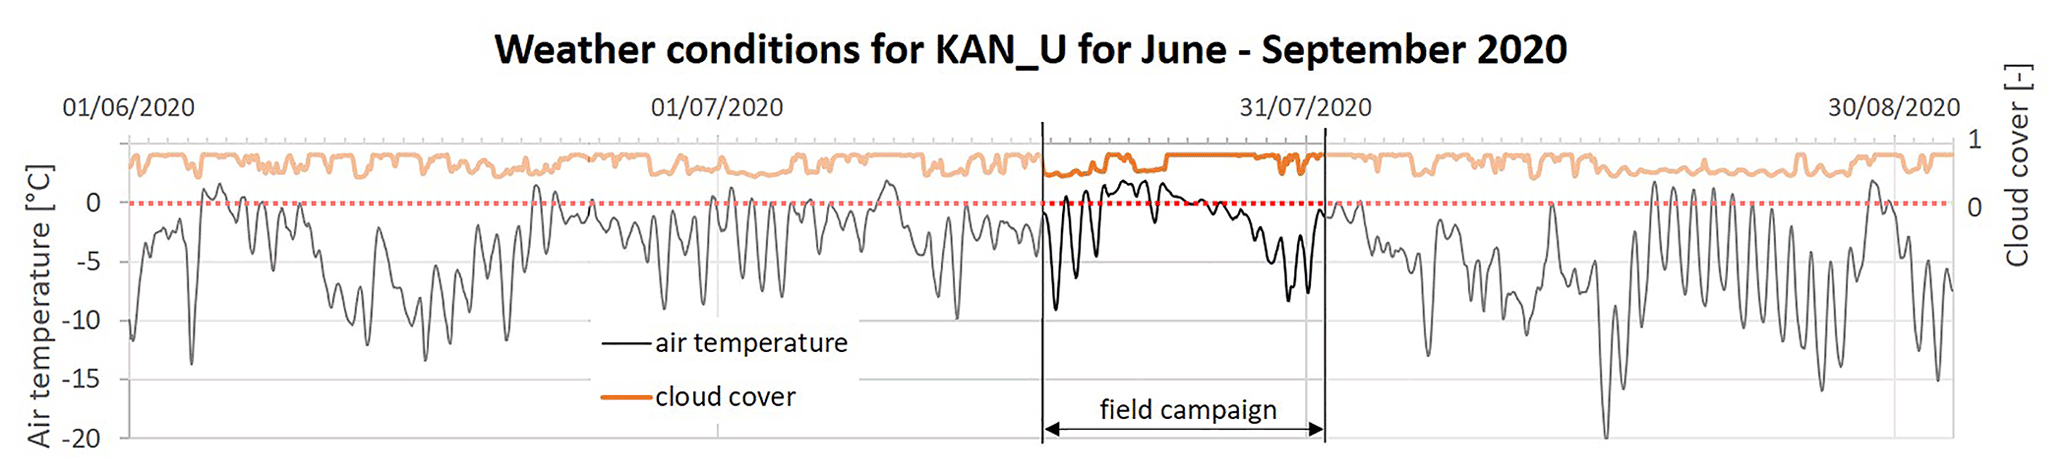
Figure 9Air temperature and cloud cover at KAN_U weather station from 1 June to 1 September 2020 (source: PROMICE; Ahlstrøm et al., 2008; How et al., 2022).
5.1.2 Experimental procedures
Porosity measurements were made using a measuring cylinder that was inserted into the fully water-saturated matrix and then carefully extracted so as not to lose any liquid or slush matrix. Subsequently the weight of the filled cylinder was determined, liquid water was poured off, and the cylinder's weight with the drained matrix was determined. Using these measurements we calculated slush matrix porosity following Eq. (2), taking a value of 917 kg m−3 for the ice density ρi at 0 ∘C.
To measure lateral meltwater flow rates, we used two different methods: salt dilution experiments and dye tracing. For the salt dilution experiments, Darcy's law allows for calculating the flow velocity based on the concentration decay of the used tracer (Freeze and Cherry, 1979):
where q is the meltwater flow rate [m s−1], r is the borehole radius [m], t is time over which the concentration decay is measured [s], α is the “drainage coefficient” required to correct the flow velocity for borehole effects, commonly taken to be 2 (Pitrak et al., 2007), and is the relative tracer concentration at a given time (Miller et al., 2018). Flow velocity can be determined from the gradient of the linear regression of ln (C) vs. time when rewriting Eq. (12) as
After measuring the water depth and determining the background conductivity of the meltwater in a borehole with a Hanna Instruments HI98195 multi-parameter sensor, a dilute salt and water solution (10 g L−1 NaCl) was injected into the borehole. The subsequent conductivity decay was measured to determine the lateral meltwater flow velocity over the ice slab (see Fig. 8b for a schematic overview of the measurement set-up).
The dye tracer experiments were carried out to visually determine lateral meltwater flow velocity and confirm unidirectional flow. We injected liquid Rhodamine WT into the meltwater on top of the ice slab and at multiple locations visually determined the timing of first occurrence of the tracer in thin trenches. These were dug before the start of each experiment, to avoid disturbing the overlying snowpack and meltwater flow as much as possible. After identifying the dyed water in all trenches, we carefully removed the overlying snowpack to study the complete flow path.
All meltwater flow velocity measurements, as well as the slush property measurements, were carried out at locations where there was no visible water at the surface, i.e. where meltwater had not yet fully saturated the snow and firn on top of the ice slab (Fig. 2c and d).
5.2 Results
5.2.1 Slush matrix properties
During the summer 2020 field campaign, a total of 27 slush samples from along the borehole transect were collected. All samples consisted of rounded, sometimes clustered ice grains and water (MFsl and MFcl according to Fierz et al., 2009) of about 1.5–3 mm in diameter for individual slush grains and up to multiple centimetres for the clusters (Fig. 10a). We found little lateral variation in slush properties, although the overlying, unsaturated snow showed some variation in grain size and hardness. Below the water table we could not identify any visual variation in slush matrix properties.
Total porosity of the slush samples was determined between 18 % and 67 %, with a mean of 41 % and a standard deviation of 10 %. Some residual water remained in the firn samples after porosity measurements (Fig. 10b). Actual porosity therefore is likely somewhat higher than the measured values, ranging between 23 % and 72 % with a mean of 45 ± 10 % (assuming a residual LWC of 4 %).
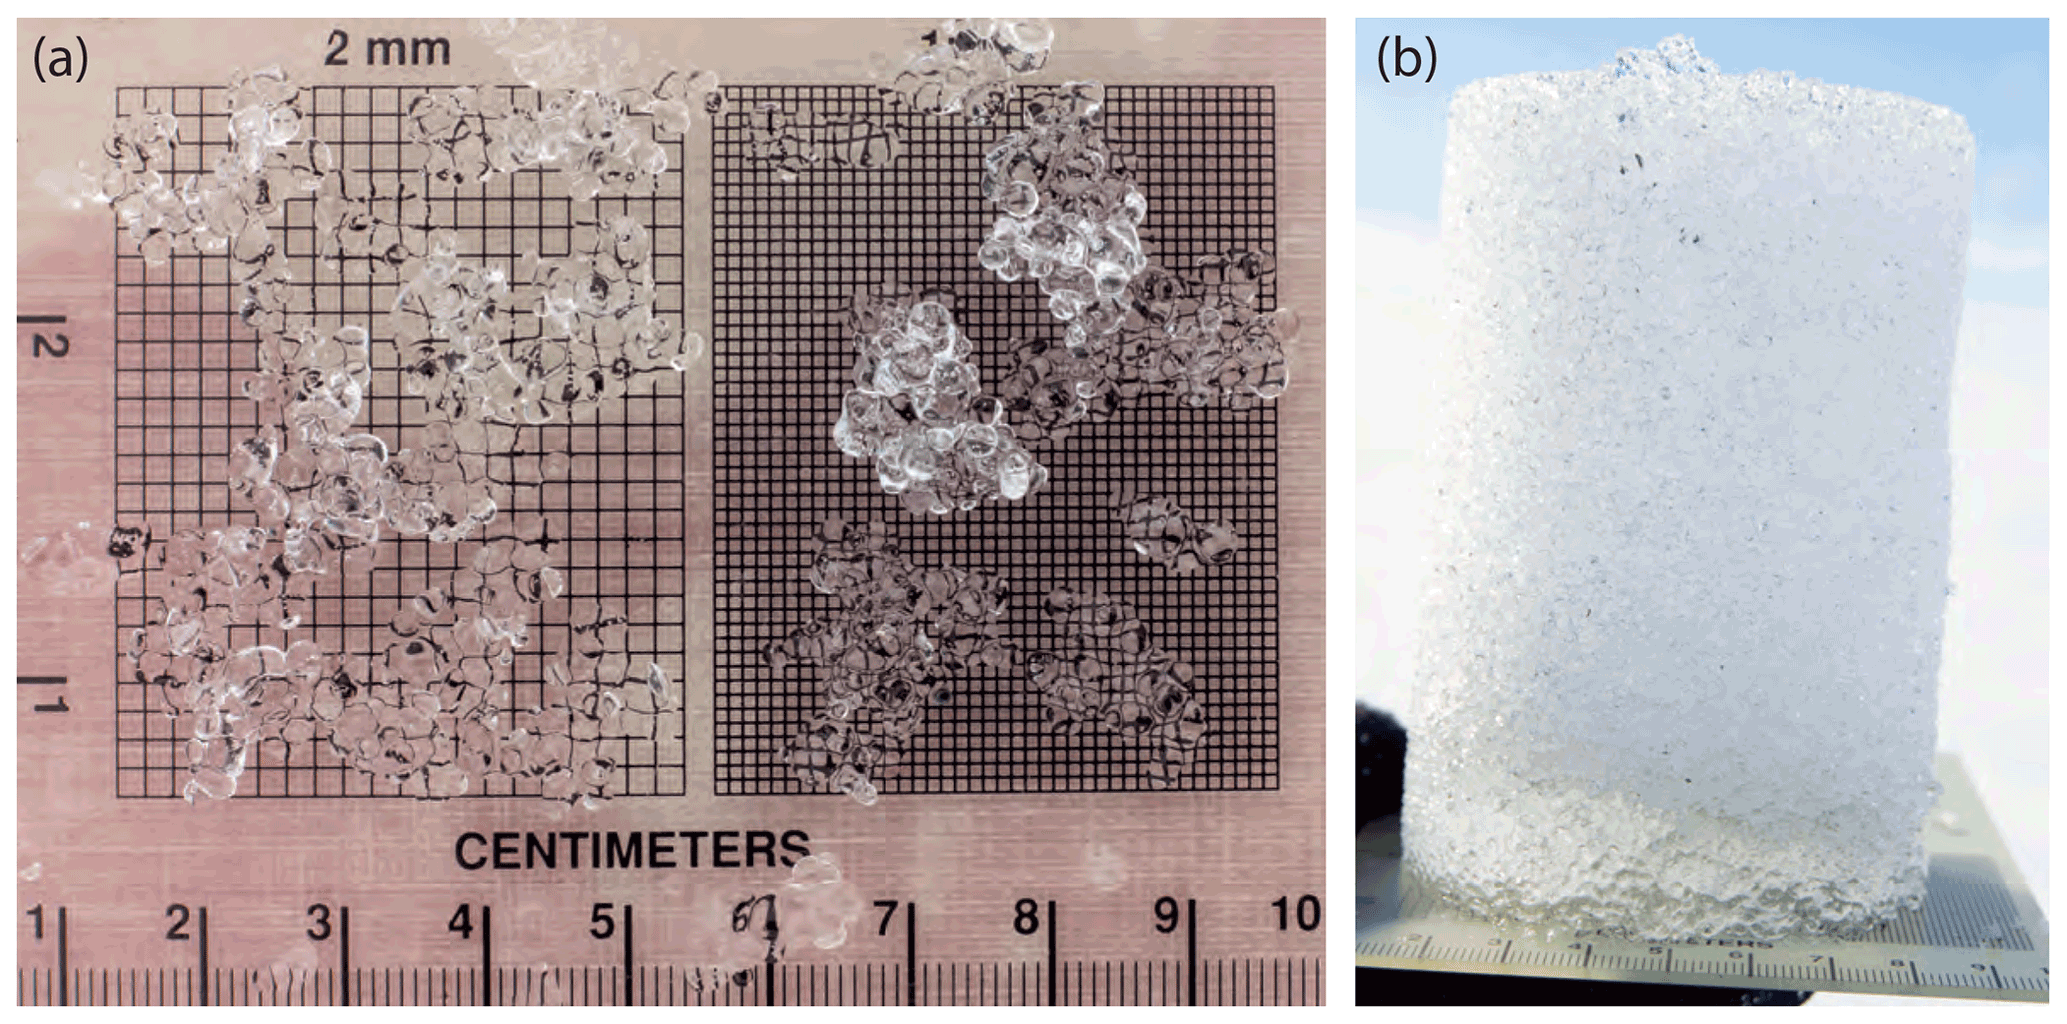
Figure 10(a) Sample of slush matrix showing relatively homogeneous 2 mm large rounded melt forms. (b) Sample of drained slush, showing water retention due to capillary forces (residual water).
5.2.2 Lateral meltwater flow velocity measurements
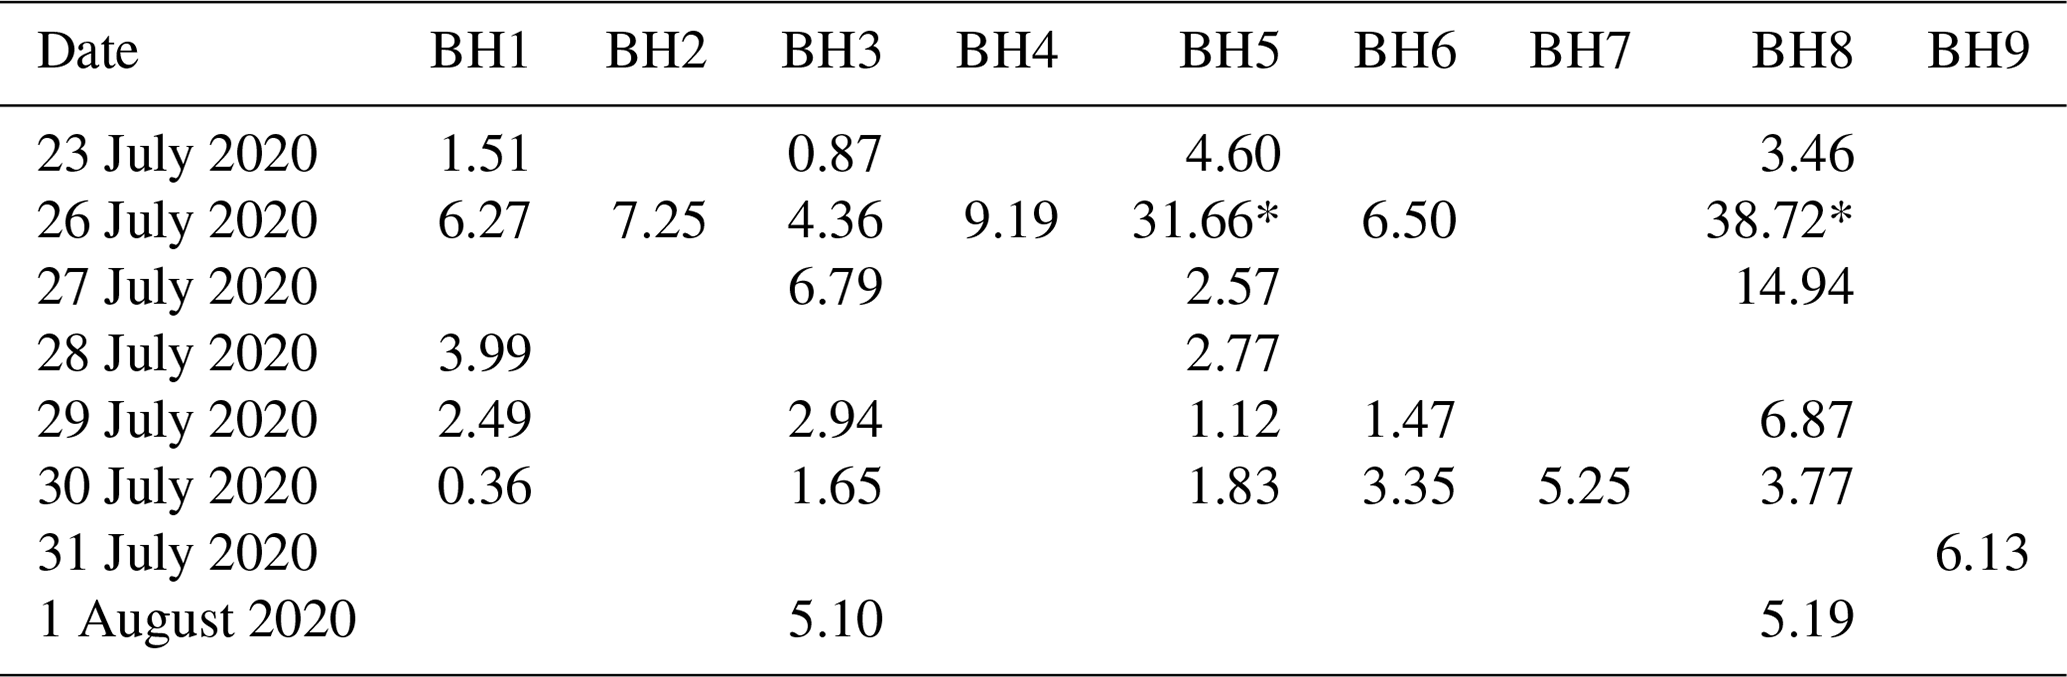
A total of 85 salt dilution experiments were carried out along the shallow borehole transect, resulting in an average flow velocity of ∼ 7.0 ± 10.0 m h−1 (192 ± 277 × 10−5 m s−1), with minimum and maximum trusted measured velocities ranging between 1.3–14.2 m h−1. Trusted velocities do not include very low and high measured velocity values that are likely due to measurement errors related to the EC probe's high sensitivity to sensor positioning, in particular in the earlier salt dilution experiments when still optimizing the measurement routine. Furthermore, water level variation over time meant that it was sometimes difficult to fully submerse the sensor of the EC probe in the liquid water. This issue was circumvented by either tilting the probe or drilling a new borehole close by to tap into a more significant water table. Table 3 shows a summary of the salt dilution measurements, displaying average flow velocities measured on various days throughout the melt season. An example curve of the salt concentration decay is shown in Fig. A1. BH1 is closest to the main river system and BH9 furthest away (Fig. 8), but neither in terms of flow velocity nor in terms of water table height atop the ice slab is there a relationship with distance to the main drainage channel. No clear temporal trends are visible, nor is there a significant correlation between lateral meltwater flow velocity and water table height.
Table 3Overview of average flow velocities measured on various dates in all the boreholes along the transect (in m h−1). Values represent average velocities measured on a specific date: in most cases three experiments were carried out per borehole per day, but only the average of these velocities is displayed here. Values denoted with an asterisk (*) are likely overestimations of the actual flow velocity due to sensor misorientation.
We undertook several dye tracing experiments, yielding an average flow velocity of ∼ 7.0 m h−1 in a total range of 3.5–15.1 m h−1. Note that these velocities are based on first arrival times and not the timing of peak concentration – given the simplistic nature of the experiments measuring tracer concentrations was not possible. The values reported here therefore are biased high. Dye tracing did reveal that meltwater flow over the ice slab is clearly directional (Fig. 11). Differences in RWT dye concentration (Fig. 11d) show that small localized meltwater ponds are present on top of the ice slab due to small-scale surface roughness.
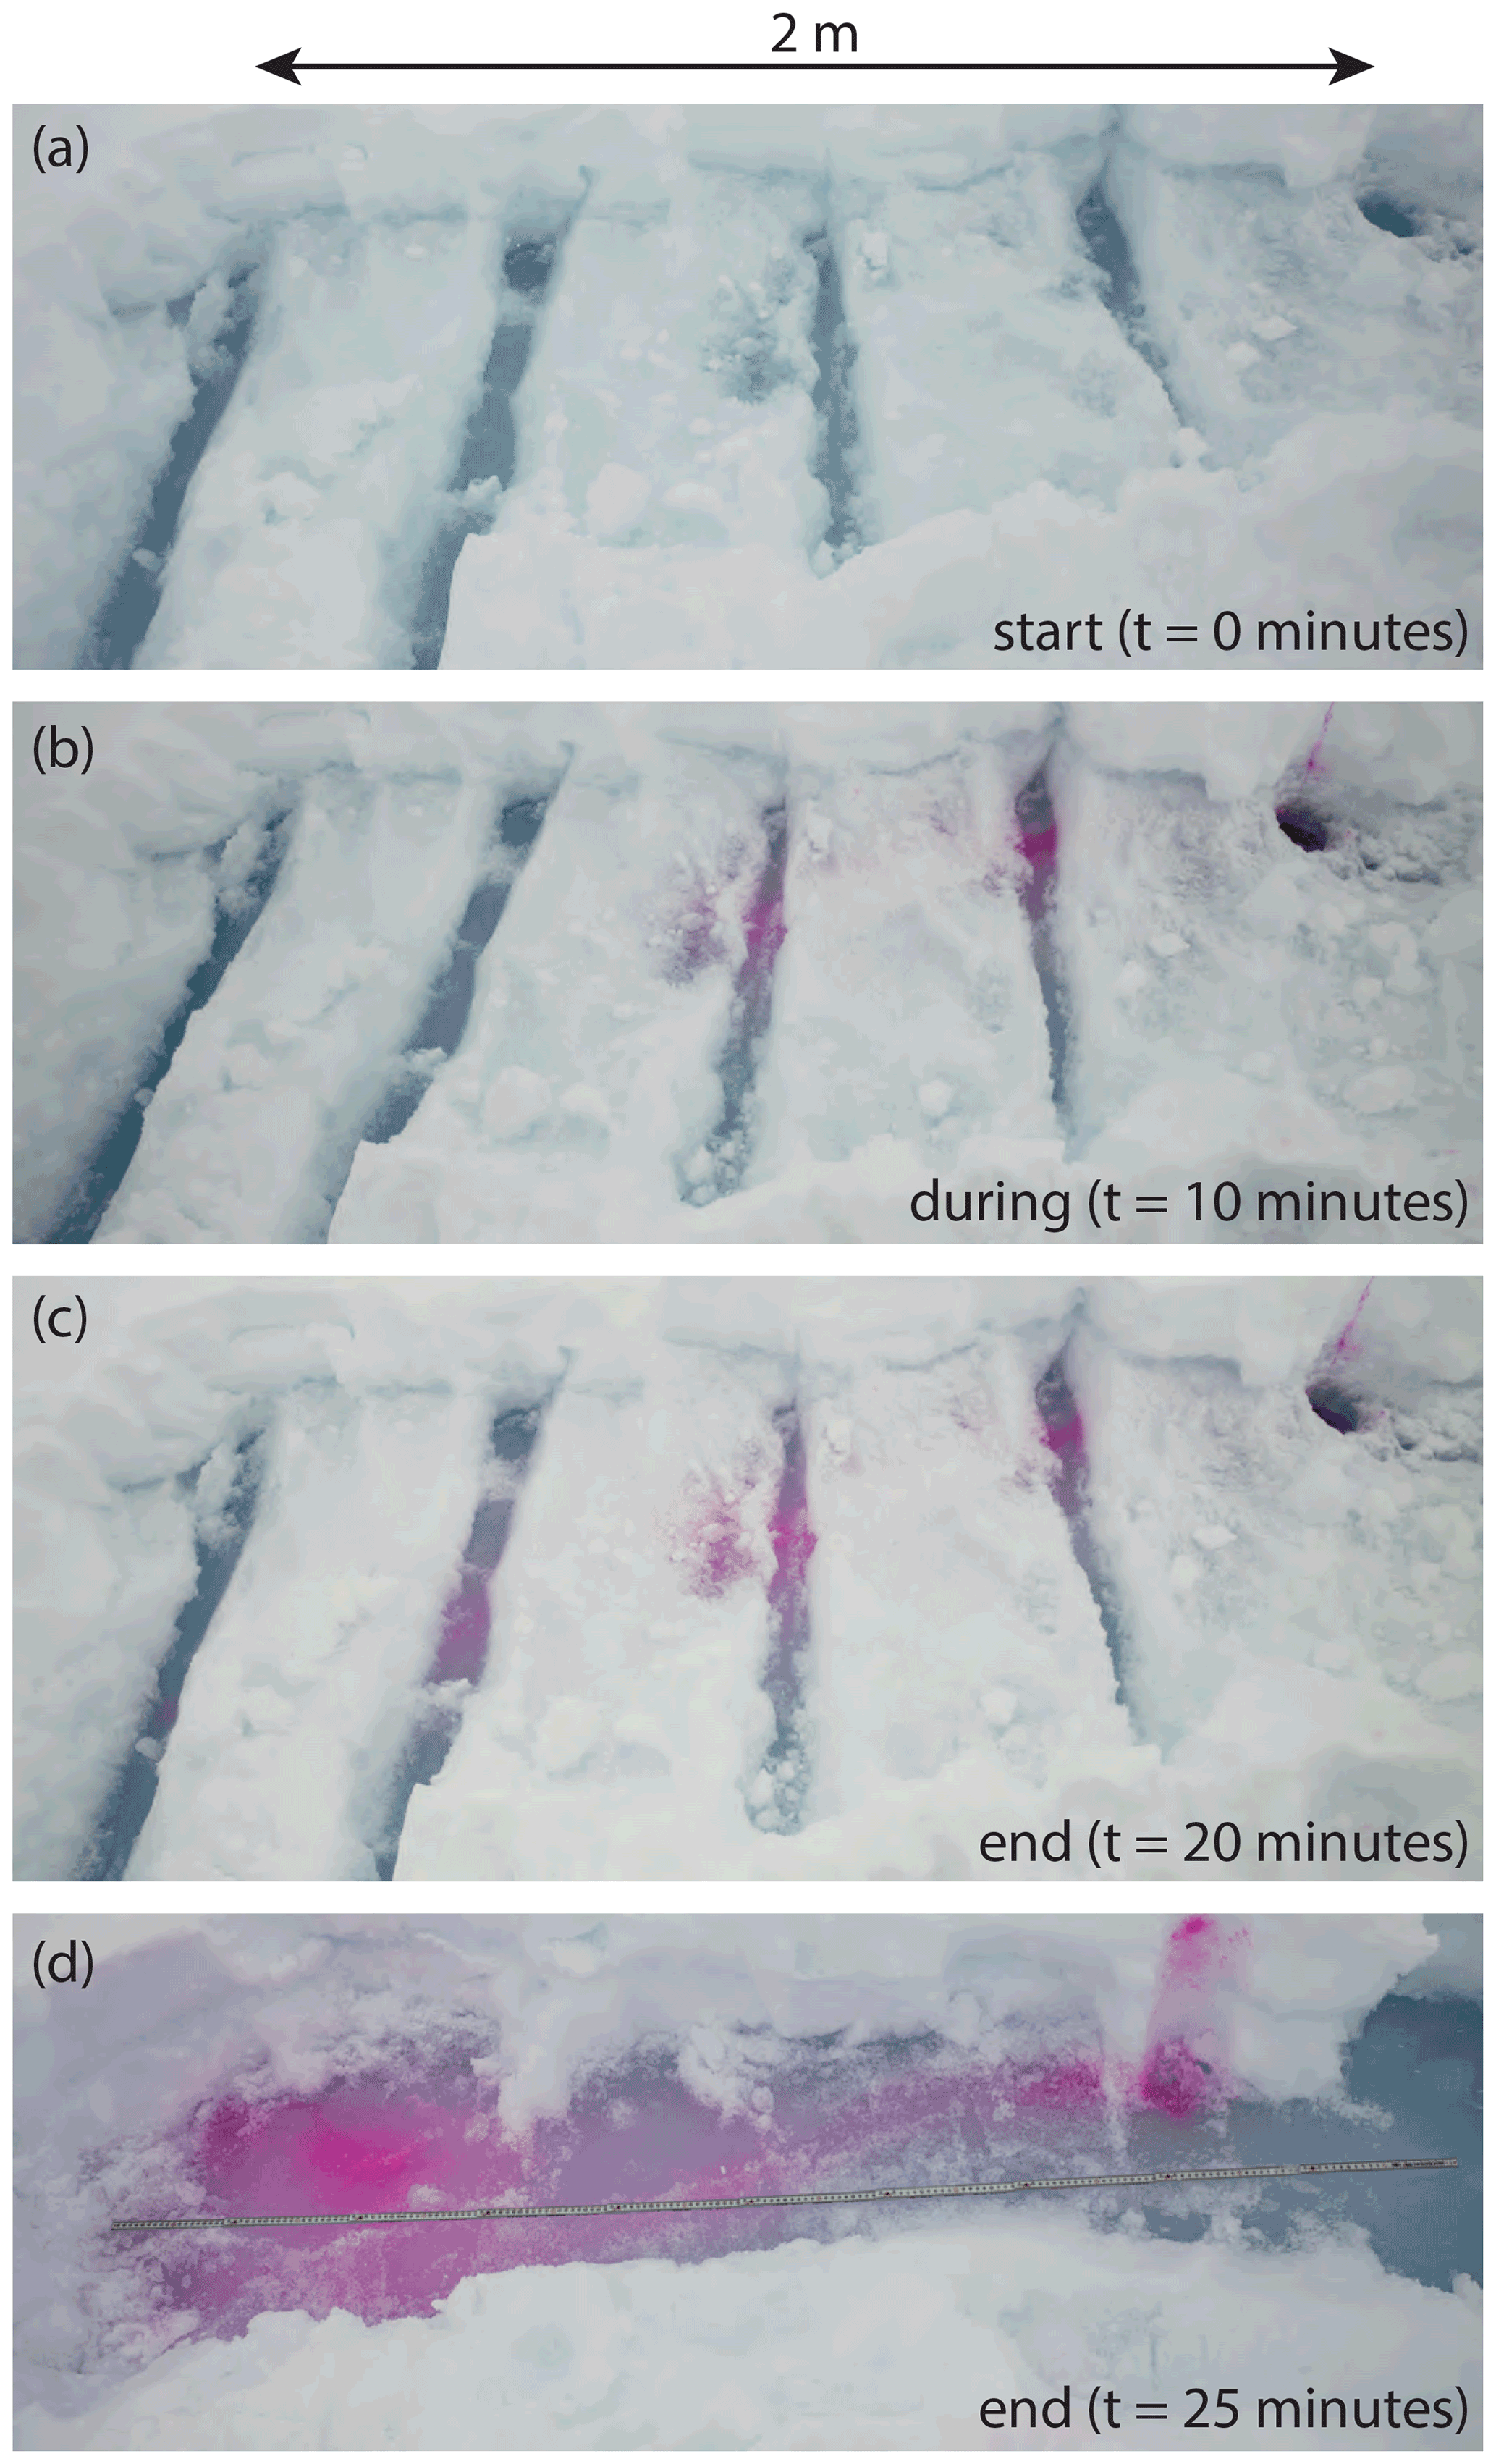
Figure 11Results from an RWT dye tracing experiment, showing the monitored site at the time of dye injection (a), halfway (b) and at the end of the experiment before (c) and after (d) full exposure of the flow path. Rhodamine WT was injected in the borehole (in the top right corner of the image, located upstream). Note that in panel (d) the snow was also excavated uphill from the insertion point.
Given the relative dimensions of small-scale undulations of the ice slab surface (in the orders of centimetres) compared to the overall ice sheet surface slope (0.30∘, i.e. a height difference of 0.5 cm per metre distance), local irregularities of the ice slab surface are important in determining local flow direction.
5.3 Theoretical determination of lateral meltwater flow velocity
We calculated lateral flow velocities for meltwater flowing through the subsurface matrix following Darcy's law (Eq. 8). To obtain permeability, we used both the Kozeny–Carman equation (Eq. 9) and Calonne's parametrization (Eq. 10) for perfectly spherical grains, in a matrix with a porosity of 0.25 and 0.50, based on our slush property measurements. The equivalent sphere radius was set to half the observed grain size of the matrix, since snow/ice particles in the slush were near-perfect spheres. We set the ice slab slope equal to the local ice sheet surface slope along flow lines of supraglacial streams visible on satellite imagery (around 5 m elevation difference per kilometre, which equals a slope of ∼ 0.30∘).
Resulting calculated lateral flow velocities range from 0.073 to 1.31 m h−1 for the permeabilities obtained using the Kozeny–Carman equation and between 0.052 and 0.96 m h−1 for permeabilities according to Calonne's parametrization. These are up to 3 orders of magnitude smaller than the flow velocities measured in the tracer experiments. Using Darcy's law to back-calculate values of permeability for measured flow velocities during summer (1.3–15.1 m h−1) results in values between 3.55 × 10⁻⁸ and 1.53 × 10⁻⁷ m2 for an ice slab slope of ∼ 0.30∘. This is up to 3 orders of magnitude larger than the permeabilities calculated based on the slush matrix properties using either the Kozeny–Carman or Calonne parametrization.
Hydraulic head variations between individual boreholes throughout the field work period were calculated based on measured water table heights along the transect to see if the assumption that the regional surface slope is the main driver for lateral meltwater flow is correct. Resulting flow velocities using the “measured” hydraulic gradients significantly underestimate meltwater flow rates when compared to the observed values from dye tracing and salt dilution experiments.
6.1 Meltwater flow velocities through snow and firn
Figure 12 shows a comparison of our measured flow velocities to other studies measuring flow speeds through snow, firn and firn aquifers. The velocities shown were determined using different methods, including slug tests, snowshed lysimeters and measuring the lag time of meltwater poured on the snow surface reaching a certain depth, as well as using dielectric sensors detecting changes in LWC. The percolation velocities do not all capture the same process: in some cases the values show the percolation velocity of water through preferential flow fingers (i.e. unsaturated flow), whereas velocities resulting from slug tests measure hydraulic conductivity in fully saturated snow or firn. Furthermore, some measurements relate to vertical flow, whereas others present values for lateral flow velocities.
Measured velocities presented in this paper are relatively high compared to previously published values, but they overlap with measurements by, for example, Gerdel (1954), Kattelmann (1987), Fountain (1989), and Miller et al. (2017). Hydraulic conductivities for saturated water percolation through the firn are in the same order of magnitude as the observed lateral matrix flow velocity of meltwater on top of near-surface ice slabs. The lower flow velocities for unsaturated vertical meltwater percolation show more overlap with some of the existing measurements but are still relatively high.
Flow velocities through snow and firn presented in this paper were determined in two ways: directly, by measuring lateral flow over an ice slab, and by calculating the percolation velocity along with hydraulic conductivity from ROSA data assuming that Darcy's law is valid. Here we compare these two parameters as firn hydrological properties, although this direct comparison should be done with caution. The measured lateral flow velocities are not only a function of the firn hydraulic conductivity but are also governed by other external factors such as ice slab slope (microtopography), and therefore they are not purely material properties of the firn. Furthermore, the calculated hydraulic conductivities are based on meltwater percolation through preferential flow fingers, and hence the resulting values might not represent the “overall” firn hydraulic conductivity.
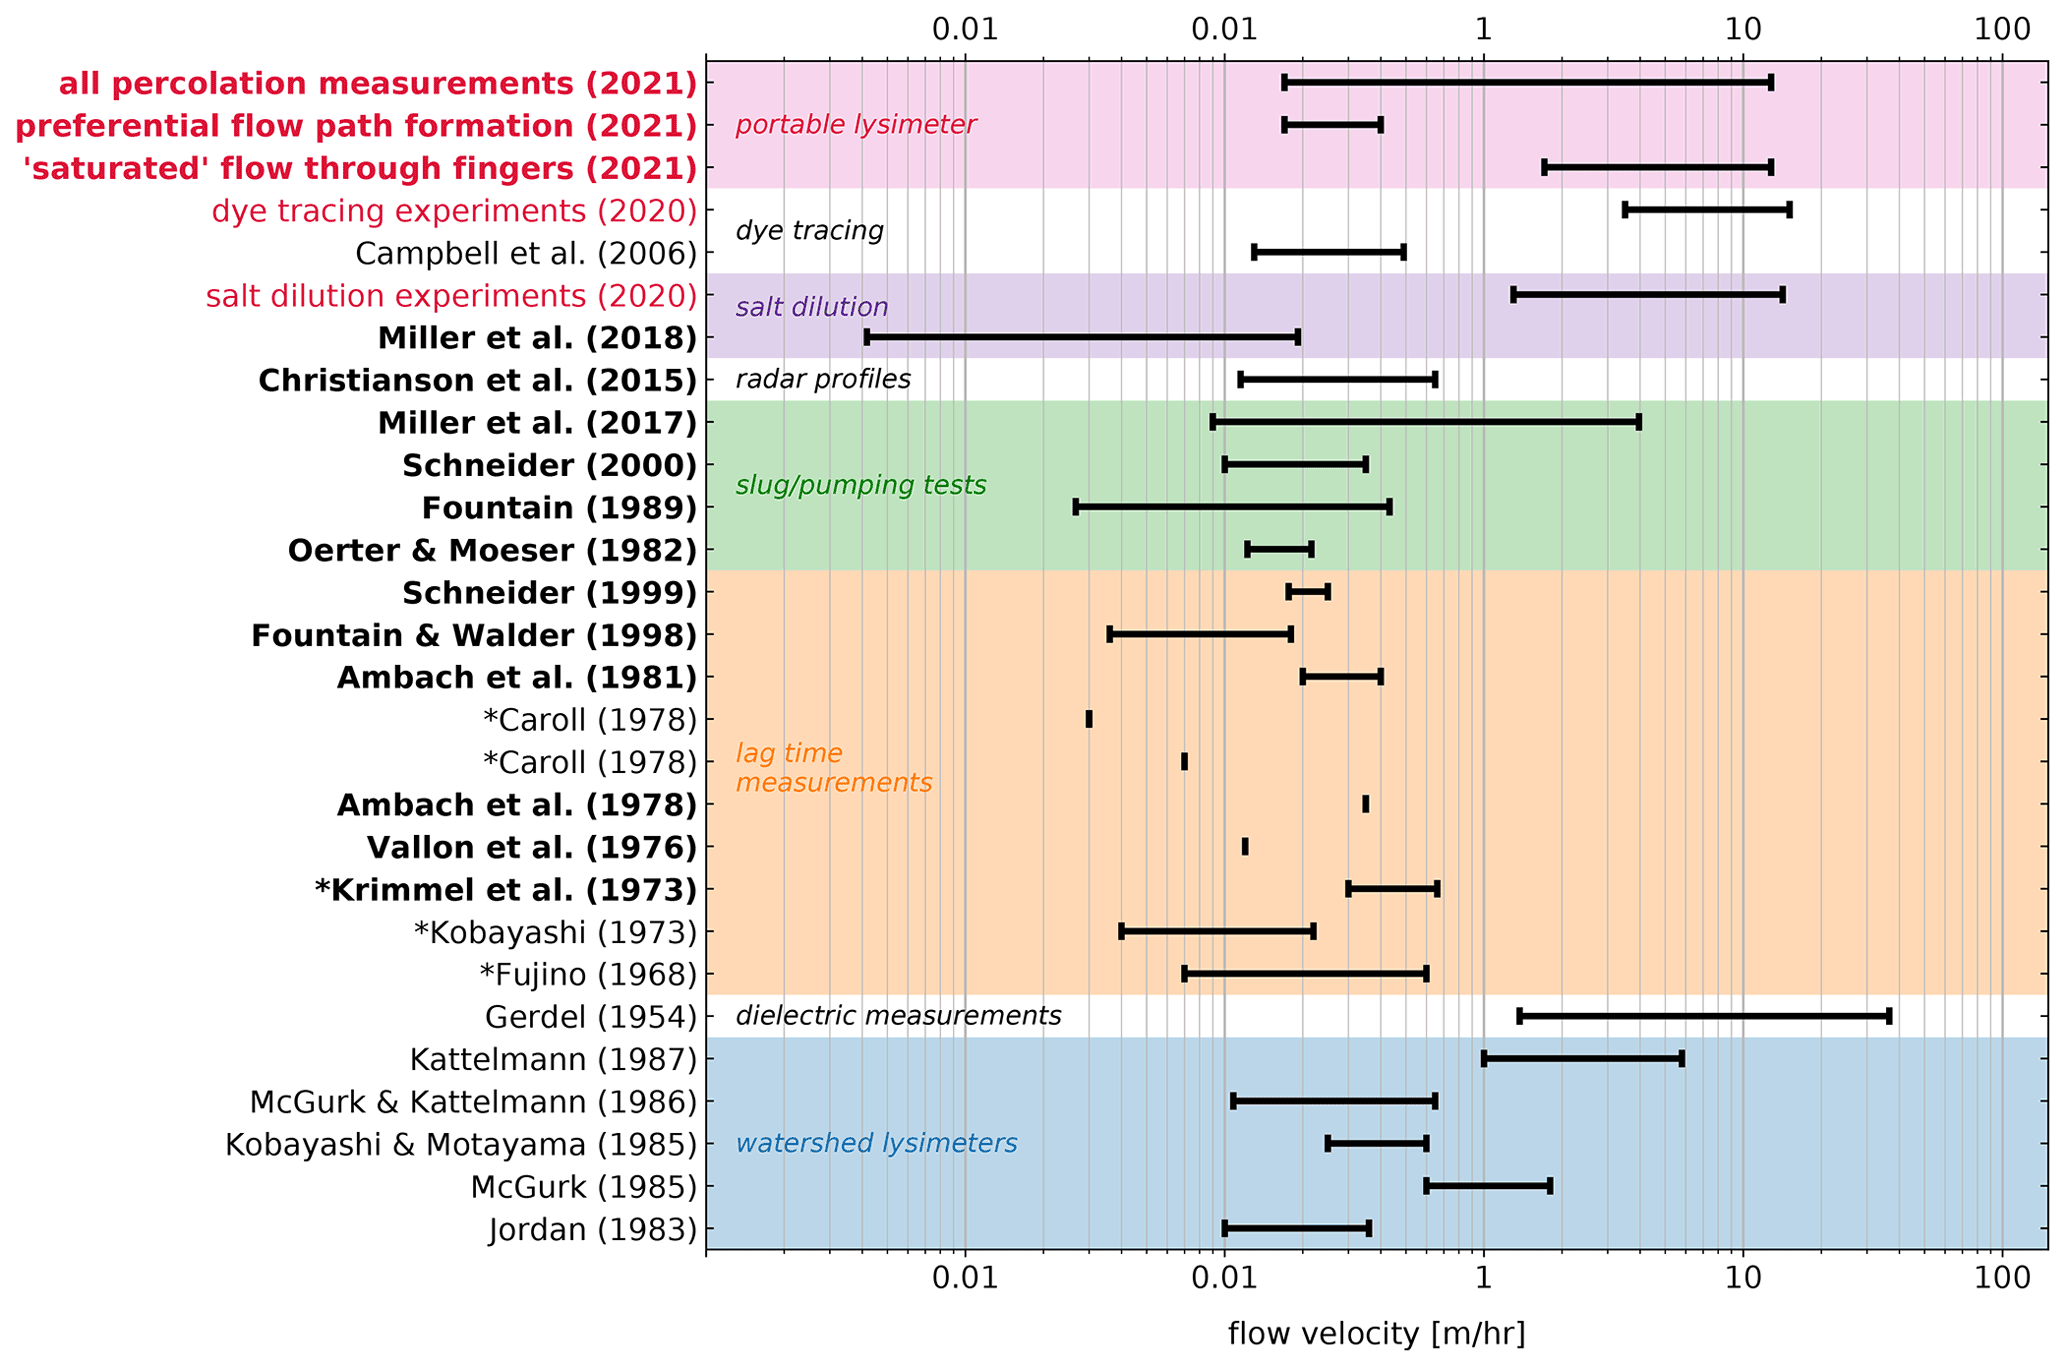
Figure 12Flow velocities through snow (regular font) and firn (bold font) as measured in this study (in red), compared to other values published in the literature. Author names preceded by an * indicate that the original papers were not available, but quoted values were found in Kattelmann (1987).
6.2 Vertical percolation experiments
Meltwater percolation in the ROSA experiments predominantly occurs through flow fingers, and water ponds on permeability barriers such as ice lenses or grain size contrasts. The start of continuous outflow does not mean that firn samples were fully saturated: density continued increasing once outflow had started, and temperature measurements indicated heterogeneous warming of the block. Mass gain and hence densification occurred at different rates before and after the start of continuous outflow. This is likely due to an initial increase in sample water saturation until sufficient preferential flow paths have formed, and water saturation is locally high enough for outflow to occur. There is no clear correlation between firn sample density and outflow lag time.
Vertical percolation velocities as measured for unsaturated flow varied between 0.17 and 0.44 m h−1 with an average of 0.25 ± 0.091 m h−1. In the final part of the experiments, when preferential flow paths had sufficiently developed and flow is hence assumed to be saturated within these flow fingers, hydraulic conductivities ranged from 1.71 to 12.80 m h−1 with an average of 8.60 ± 3.58 m h−1. It is uncertain to what extent exactly the preferential flow paths are saturated, but it is evident that water saturation of the firn samples was highly variable in the meltwater percolation experiments.
The order of magnitude difference between observed flow velocities of unsaturated and “saturated” meltwater percolation clearly shows the efficiency of preferential flow paths. It is unclear whether formation of preferential flow paths is still ongoing or has finalized by the end of the percolation experiments, as it appears that firn blocks were not yet fully in equilibrium state (albeit close – the slope of the hydraulic conductivity plots in Fig. 5 is close to zero). Hirashima et al. (2019) conducted computer simulations to investigate the transition from preferential to matrix flow and showed that preferential flow paths likely continue migrating through the snowpack over time because of wet snow metamorphism. This suggests that preferential flow path development is not a finite process.
Even though ice lenses of up to several centimetres thickness were present, they never impeded percolation fully, with the exception of the 3–5 cm thick ice lens present in the sample used for firn4. According to the measurements of flow around the ice lens during this experiment, a maximum of 15 % of the supplied water percolated through the firn block. Our measurements are not accurate enough to tell whether these 15 % actually percolated through the ice lens or not.
Firn permeabilities calculated using Darcy's law and ROSA data range between 0.87 × 10⁻¹⁰ and 6.50 × 10⁻¹⁰ m2. On average, the permeability values calculated using the approximation by Calonne et al. (2012) are at least an order of magnitude larger than the permeabilities resulting from the vertical percolation measurements. This could mean that the actual hydraulic conductivity of a fully saturated firn block is underestimated in the calculations based on the ROSA measurements, which assume that the water saturation and flow velocity in the preferential flow fingers are representative of the hydraulic conductivity. This is potentially related to the fact that the water saturation in the observed preferential flow paths is unknown. Calculating values for unsaturated permeability, for example by applying the Richards equation which describes water flow in unsaturated media (Richards, 1931), would be possible in theory, but this would require more detailed knowledge on the firn grain and pore size distribution and hence add significant measurement challenges. Another potential reason for the discrepancy in calculated permeabilities is an overestimation of res, which we assumed to be equivalent to the radius of individual firn grains (smaller res leads to lower permeabilities). Back-calculating values for res using the Darcy-based permeabilities, however, leads to grain sizes that are relatively similar to those observed: required theoretical grain diameters ranging from 0.2–1.4 mm as opposed to the 1–2 mm grain sizes assumed in the initial permeability calculations.
Given the metre-scale size of the firn blocks used in the ROSA experiments, we assume that the measured hydrological properties of icy firn are representative more generically for firn in the accumulation area on the SW GrIS, above the region where near-surface ice slabs are present. However, we observed that firn properties (i.e. ice content or water saturation at the end of all experiments) are highly variable within individual samples. Based on the firn cores that we drilled at FS4, very close to the location of firn sample collection, the ice content of the samples used for the percolation experiments is significantly below the average ice content in the upper 10 m of the firn at this location (54 % in the FS4 firn core vs. a maximum estimated ice content in the firn blocks of approximately 20 %). This is a significant but necessary shortcoming of our measurements: the icier the firn, the larger the samples would need to be in order to sufficiently accommodate lateral flow and to adequately represent the percolation process. As far as we are aware, no observations exist that quantify the ratio between ice lens thickness and width. The lateral continuity of ice lenses, and hence the representativeness of the used samples for average firn properties, therefore remains uncertain. Brown et al. (2011) tried to laterally correlate ice lenses and layers using ground penetrating radar data and firn cores but found that this is challenging. In our experiments, we observed no significant relationship between ice content and outflow lag time or hydraulic conductivity, which further emphasizes the uncertainty in spatial representativeness of the experimental results.
6.3 Slush matrix properties and water table variation
Measured porosity of the slush was on average 45 % (after correction for the residual water content), ranging between 18 % and 67 %, with a clear residual water saturation due to capillary forces. The lack of variation in slush matrix properties within the water column is likely due to the thermodynamic equilibration process between snow and ice at this high liquid water content.
Local-scale ice slab topography has a significant impact on local meltwater flow direction and velocity. There is no correlation between water table height and flow velocity, nor with distance to the main supraglacial drainage channel. We therefore conclude that the overall meltwater flow direction is principally governed by the regional ice sheet and slab surface slope. Since this is very gentle, second-order factors like local firn stratigraphic features and ice slab surface undulations also affect meltwater flow direction on a smaller scale. In some cases, the ice slab surface undulations and ice structures on top of the ice slab surface that we found (i.e. refrozen preferential flow pipes) were surprisingly large: up to 50 cm in height variation within 3 m distance. However, we noticed that lateral flow was present whenever the water table was high enough to do salt dilution experiments, i.e. roughly 5 cm. Since we furthermore found no correlation between water depth and flow speed, we conclude that for water depths > 5 cm, the water always finds a way around local undulations and refreezing features on the ice slab. Surface irregularity might change flow direction locally, but there is no evidence that this fully impedes meltwater flow. Given the surface undulations of the ice slab, water table heights reported here (referenced to the ice slab surface) might suffer from an inconsistent datum height. Further, more detailed measurements would be required to better test a potential relationship between water table height and flow velocity.
During the summer 2020 field campaign, we observed that there was no clear link between weather conditions and water table height on top of the ice sheet. Changes in water depth only occurred with a clear delay after changing meteorological conditions: when the weather turned colder and more cloudy, there was an obvious time lag before any significant decrease of the water table could be seen.
6.4 Lateral meltwater flow velocity
Measured lateral flow velocities of meltwater over the ice slab, obtained by salt dilution and dye tracing experiments, range from 1.3 to 15.1 m h−1. We note that there is good agreement between velocities resulting from the salt dilution and dye tracing experiments. The RWT measurements furthermore validate the results of the salt dilution experiments as velocities of directional flow and not just the speed of omnidirectional tracer dispersion in a larger water body.
Local ponding of laterally flowing meltwater occurs (see Fig. 11d), so measured flow velocities are likely a combination of relatively fast directional flow and temporary local meltwater storage. This could also explain the considerable variability in the velocities resulting from the salt dilution experiments.
Lateral meltwater flow velocities calculated using Darcy's law in combination with the observed slush properties are 1 to 3 orders of magnitude smaller than the measured velocities: 0.07–1.3 and 0.05–1.0 m h−1 using the Kozeny–Carman and Calonne's parametrization for permeability, respectively, vs. 1.3–15.1 m h−1 as measured in the tracer experiments. This large discrepancy is difficult to explain, as the matrix through which flow occurs is obviously fully water-saturated, and therefore Darcy's law should hold. The most probable cause for the multi-order of magnitude difference is that the slush matrix is actually not well represented by a solid porous medium consisting of spheres (for the Kozeny–Carman equation) or a compacted dry snowpack (Calonne's parametrization). The majority of the matrix consists of ice grain clusters, but these are potentially not as well packed as shown in Fig. 10b. Maybe the sampling method compacted the matrix. If that is the case, then it is possible that the original microstructure allowed for more “free” water flow and subsequently a higher permeability in between the various ice grain clusters. Further field measurements or detailed fluid flow simulations of various matrix “configurations” could help in clarifying this issue.
6.5 The slush vs. the runoff limit
We show that runoff was occurring through the subsurface around FS2, even in the absence of visible slush at the surface. Runoff below the ice sheet surface continued for days after surface melting had stopped, resulting in the water table surfacing at various locations only after cooling, as observed in the field and identified in visible satellite imagery (Fig. 2d). The high lateral flow velocities that we measured, and the ample presence of liquid water during our field campaign, are strong indications that FS2 was below the runoff limit, i.e. within the runoff area, during summer 2020. As the melt season progressed, the slush limit moved upslope, towards the vicinity of our FS2 site.
Based on the measured lateral flow velocities presented here and the number of 35 melt days at KAN_U in the record melt year 2012 (Tedesco et al., 2013), we estimate the maximum distance between the slush and runoff limit at 4 km. However, we suggest that the real difference is likely to be less. Lateral meltwater flow is inhibited by local subsurface ponding, and flow direction is significantly influenced by small-scale ice slab topographic variations. Our calculations furthermore assume that surface meltwater input and snowpack thickness are constant over time and through space, which is a major simplification. We think that the main uncertainty in our calculations, however, is the period during which meltwater can travel (likely related to the number of melt days but in an unknown way).
The evolution of slush limit altitude throughout the melt season has been investigated based on remote sensing data and by degree-day modelling (Greuell and Knap, 2000; Machguth et al., 2022), but since in situ measurements made at the runoff limit do not exist as of yet, it is challenging to determine what governs the distance between the slush and runoff limit. Even though we have quantified vertical and lateral meltwater flow velocities through snow and firn near the runoff limit in this paper, we lack other essential data to further constrain and describe the hydrological system in the accumulation area of the SW Greenland Ice Sheet.
We carried out fieldwork on the southwestern Greenland Ice Sheet around the K transect, in regions where (i) near-surface ice slabs are present and (ii) the firn has not yet been substantially affected by ice slab formation. We present a novel dataset of hydraulic conductivity measured in icy firn and, to our knowledge, the first measurements of slush properties and lateral meltwater flow velocity through this slush matrix over the ice slab.
Firn hydraulic conductivity measured in vertical percolation experiments, ranging between 1.71 and 12.80 m h−1, is in the same order of magnitude as the measured lateral meltwater flow velocities through a slush matrix on top of near-surface ice slabs (1.3–15.1 m h−1 with an average of 7 m h−1). Vertical percolation predominantly takes place through preferential flow fingers. Even at the relatively high rate of meltwater input, the firn samples never reached full saturation due to the efficiency of preferential flow.
Lateral meltwater flow velocity through a saturated matrix calculated using Darcy's law combined with existing parametrizations for snow and firn permeability results in flow velocities of only 0.020–2.38 m h−1 with an average of 0.22 m h−1 (mainly depending on the slush density), which is about an order of magnitude lower than the lateral flow velocities observed in the tracer experiments. Why this is the case remains unclear, but potentially the slush through which the lateral meltwater flow occurs is less well represented by a matrix of packed spheres than assumed.
These measurements are a first step towards a better understanding of the hydrological system in firn on the SW Greenland Ice Sheet. We have not yet been able to link vertical and lateral meltwater flow directly. We still lack understanding of the processes that drive the transition from meltwater flow dominated by preferential vertical percolation to laterally oriented flow which contributes to ice sheet runoff. Our data do, however, provide evidence that the slush limit and the runoff limit are not necessarily co-located, since we show that laterally flowing meltwater can be present above the slush limit. The distance between the slush and runoff limit varies throughout the melt season, although the absolute separation between the two likely is in the order of several kilometres. What this means in terms of meltwater retention between the slush and runoff limit and how this impacts the surface mass balance of the Greenland Ice Sheet remain unknown.

Figure A1Example salt concentration decay curve showing fitted curve based on which meltwater flow velocity was calculated.
Table A1Description of field sites where firn cores and shallow boreholes were drilled for tracer experiments and where meltwater percolation experiments were carried out.
Code for data processing and data analysis is available at https://doi.org/10.5281/zenodo.7119818 (Clerx et al., 2022).
Measured data presented in this paper are available at https://doi.org/10.5281/zenodo.7119818 (Clerx et al., 2022). The ArcticDEM Release 7 v3.0 is available at https://www.pgc.umn.edu/data/arcticdem/ (last access: 12 March 2020, Porter et al., 2018). PROMICE weather station data are available at https://dataverse.geus.dk/dataverse/AWS (last access: 30 October 2020, How et al., 2022). Sentinel imagery is available at https://apps.sentinel-hub.com/sentinel-playground (last access: 21 February 2022, Sinergise Ltd., 2022).
NC together with HM and AT designed the study and collected field data, and NJ assisted with data collection and fieldwork logistics. NW contributed to intellectual content, and RW and OR provided fundamental knowledge and advice on operating ROSA. NC conducted data analysis and interpretation and prepared the manuscript with contributions from all co-authors.
The contact author has declared that none of the authors has any competing interests.
Publisher's note: Copernicus Publications remains neutral with regard to jurisdictional claims in published maps and institutional affiliations.
We thank Olivia Miller for advice on measurement strategies, as well as fruitful discussions on firn hydrology. We also thank the reviewers Sergey Marchenko and C. Max Stevens and the editor Kristin Poinar for their constructive feedback.
This project has been supported by the European Research Council (ERC) under the European Union's Horizon 2020 research and innovation programme (project acronym CASSANDRA, grant no. 818994) and the Schweizerischer Nationalfonds zur Förderung der Wissenschaftlichen Forschung (grant no. CRSK-2_190845).
This paper was edited by Kristin Poinar and reviewed by C. Max Stevens and Sergey Marchenko.
Adolph, A. C. and Albert, M. R.: Gas diffusivity and permeability through the firn column at Summit, Greenland: measurements and comparison to microstructural properties, The Cryosphere, 8, 319–328, https://doi.org/10.5194/tc-8-319-2014, 2014. a
Ahlstrøm, A., Gravesen, P., Andersen, S., van As, D., Citterio, M., Fausto, R., Nielsen, S., Jepsen, H., Kristensen, S., Christensen, E., Stenseng, L., Forsberg, R., Hanson, S., and Petersen, D.: A new programme for monitoring the mass loss of the Greenland ice sheet, Geological Survey of Denmark and Greenland Bulletin, 15, 61–64, https://doi.org/10.34194/geusb.v15.5045, 2008. a, b
Albert, M. R., Shultz, E. F., and Perron, F. E.: Snow and firn permeability at Siple Dome, Antarctica, Ann. Glaciol., 31, 353–356, https://doi.org/10.3189/172756400781820273, 2000. a
Ambach, W.: Untersuchungen zum Energieumsatz in der Ablationszone des Grönländischen Inlandeises, Meddelelser om Grønland, 174, 1–311, 1963. a
Ambach, W., Blumthaler, M., Eisner, H., Kirchlechner, P., Schneider, H., Behrens, H., Moser, H., Oerter, H., Rauert, W., and Bergman, H.: Untersuchungen der Wassertafel am Kesselwandferner (Ötztaler Alpen) an einem 30 Meter tiefen Firnschacht, Zeitschrift für Gletscherkunde und Glazialgeologie, 14, 61–71, 1978.
Ambach, W., Blumthaler, M., and Kirchlechner, P.: Application of the Gravity Flow Theory to the Percolation of Melt Water Through Firn, J. Glaciol., 27, 67–75, https://doi.org/10.3189/s0022143000011230, 1981. a
Bartelt, P. and Lehning, M.: A physical SNOWPACK model for the Swiss avalanche warning, Cold Reg. Sci. Technol., 35, 123–145, https://doi.org/10.1016/s0165-232x(02)00074-5, 2002. a
Bear, J.: Dynamics of fluids in porous media, edition 1988, Dover Publications, Inc., New York, ISBN-10 0-186-65675-6, ISBN-13 978-0-186-65675-5, 1972. a, b
Benson, C. S.: Stratigraphic Studies in the Snow and Firn of the Greenland Ice Sheet, Research Report 70, U.S. Army Snow, Ice and Permafrost Research Establishment, 1996.
Box, J. E., Fettweis, X., Stroeve, J. C., Tedesco, M., Hall, D. K., and Steffen, K.: Greenland ice sheet albedo feedback: thermodynamics and atmospheric drivers, The Cryosphere, 6, 821–839, https://doi.org/10.5194/tc-6-821-2012, 2012. a
Braithwaite, R. J., Laternser, M., and Pfeffer, W. T.: Variations of near-surface firn density in the lower accumulation area of the Greenland ice sheet, Pâkitsoq, West Greenland, J. Glaciol., 40, 477–485, https://doi.org/10.3189/s002214300001234x, 1994. a
Brown, J., Harper, J., Pfeffer, W. T., Humphrey, N., and Bradford, J.: High-resolution study of layering within the percolation and soaked facies of the Greenland ice sheet, Ann. Glaciol., 52, 35–41, https://doi.org/10.3189/172756411799096286, 2011. a
Brown, J., Bradford, J., Harper, J., Pfeffer, W. T., Humphrey, N., and Mosley-Thompson, E.: Georadar-derived estimates of firn density in the percolation zone, western Greenland ice sheet, J. Geophys. Res.-Earth, 117, F01011, https://doi.org/10.1029/2011jf002089, 2012. a
Calonne, N., Geindreau, C., Flin, F., Morin, S., Lesaffre, B., Rolland du Roscoat, S., and Charrier, P.: 3-D image-based numerical computations of snow permeability: links to specific surface area, density, and microstructural anisotropy, The Cryosphere, 6, 939–951, https://doi.org/10.5194/tc-6-939-2012, 2012. a, b, c
Campbell, F. M. A., Nienow, P. W., and Purves, R. S.: Role of the supraglacial snowpack in mediating meltwater delivery to the glacier system as inferred from dye tracer investigations, Hydrol. Process., 20, 969–985, https://doi.org/10.1002/hyp.6115, 2006.
Carman, P. C.: Fluid flow through granular beds, Chemical Engineering Research and Design, 75, S32–S48, https://doi.org/10.1016/s0263-8762(97)80003-2, 1937. a
Chen, X., Zhang, X., Church, J. A., Watson, C. S., King, M. A., Monselesan, D., Legresy, B., and Harig, C.: The increasing rate of global mean sea-level rise during 1993–2014, Nat. Clim. Change, 7, 492–495, https://doi.org/10.1038/nclimate3325, 2017. a
Christianson, K., Kohler, J., Alley, R. B., Nuth, C., and van Pelt, W. J. J.: Dynamic perennial firn aquifer on an Arctic glacier, Geophys. Res. Lett., 42, 1418–1426, https://doi.org/10.1002/2014GL062806, 2015.
Clerx, N., Machguth, H., Tedstone, A., Jullien, N., Wever, N., Weingartner, R., and Roessler, O.: DATASET: In situ measurements of meltwater flow through snow and firn in the accumulation zone of the SW Greenland Ice Sheet, Zenodo [code and data set], https://doi.org/10.5281/zenodo.7119818, 2022. a, b
Colbeck, S. C.: Water Flow Through Snow Overlying an Impermeable Boundary, Water Resour. Res., 10, 119–123, https://doi.org/10.1029/wr010i001p00119, 1974. a, b
Colbeck, S. C.: An overview of seasonal snow metamorphism, Rev. Geophys., 20, 45–61, https://doi.org/10.1029/rg020i001p00045, 1982. a
Coléou, C. and Lesaffre, B.: Irreducible water saturation in snow: experimental results in a cold laboratory, Ann. Glaciol., 26, 64–68, https://doi.org/10.3189/1998aog26-1-64-68, 1998. a
Cox, C., Humphrey, N., and Harper, J.: Quantifying meltwater refreezing along a transect of sites on the Greenland ice sheet, The Cryosphere, 9, 691–701, https://doi.org/10.5194/tc-9-691-2015, 2015. a
Cunningham, W. L. and Schalk, C. W.: Groundwater technical procedures of the U.S. Geological Survey, Tech. rep., U.S. Geological Survey, 2011. a
Eiriksson, D., Whitson, M., Luce, C. H., Marshall, H. P., Bradford, J., Benner, S. G., Black, T., Hetrick, H., and McNamara, J. P.: An evaluation of the hydrologic relevance of lateral flow in snow at hillslope and catchment scales, Hydrol. Process., 27, 640–654, https://doi.org/10.1002/hyp.9666, 2013. a
Fausto, R. S., Box, J. E., Vandecrux, B., van As, D., Steffen, K., MacFerrin, M. J., Machguth, H., Colgan, W., Koenig, L. S., McGrath, D., Charalampidis, C., and Braithwaite, R. J.: A Snow Density Dataset for Improving Surface Boundary Conditions in Greenland Ice Sheet Firn Modeling, Front. Earth Sci., 6, 1–10, https://doi.org/10.3389/feart.2018.00051, 2018. a
Fierz, C., Armstrong, R., Durand, Y., Etchevers, P., Greene, E., McClung, D., Nishimura, K., Satyawali, P., and Sokratov, S.: The international classification for seasonal snow on the ground, UNESCO, IHP (International Hydrological Programme) – VII, Technical Documents in Hydrology, No. 83, IACS (International Association of Cryospheric Sciences) contribution No 1, 2009. a, b, c, d
Fountain, A. G.: The Storage of Water in, and Hydraulic Characteristics of, the Firn of South Cascade Glacier, Washington State, U.S.A., Ann. Glaciol., 13, 69–75, https://doi.org/10.3189/s0260305500007667, 1989. a
Fountain, A. G.: Effect of Snow and Firn Hydrology on the Physical and Chemical Characteristics of Glacial Runoff, Hydrol. Process., 10, 509–521, https://doi.org/10.1002/(sici)1099-1085(199604)10:4<509::aid-hyp389>3.0.co;2-3, 1996. a
Fountain, A. G. and Walder, J. S.: Water flow through temperate glaciers, Rev. Geophys., 36, 299–328, https://doi.org/10.1029/97rg03579, 1998.
Freeze, R. and Cherry, J.: Groundwater, Prentice-Hall, Englewood Cliffs, New Jersey, ISBN 0-13-365312-9, 1979. a, b
Freitag, J., Dobrindt, U., and Kipfstuhl, J.: A new method for predicting transport properties of polar firn with respect to gases on the pore-space scale, Ann. Glaciol., 35, 538–544, https://doi.org/10.3189/172756402781816582, 2002. a
Gerdel, R. W.: The transmission of water through snow, T. Am. Geophys. Un., 35, 475, https://doi.org/10.1029/tr035i003p00475, 1954. a
German: Sintering Theory and Practice, 1st Edn., John Wiley & Sons, 1996. a
Greuell, W. and Knap, W. H.: Remote sensing of the albedo and detection of the slush line on the Greenland ice sheet, J. Geophys. Res.-Atmos., 105, 15567–15576, https://doi.org/10.1029/1999jd901162, 2000. a, b
Hall, D. K., Comiso, J. C., DiGirolamo, N. E., Shuman, C. A., Box, J. E., and Koenig, L. S.: Variability in the surface temperature and melt extent of the Greenland ice sheet from MODIS, Geophys. Res. Lett., 40, 2114–2120, https://doi.org/10.1002/grl.50240, 2013. a
Hanna, E., Mernild, S. H., Cappelen, J., and Steffen, K.: Recent warming in Greenland in a long-term instrumental (1881–2012) climatic context: I. Evaluation of surface air temperature records, Environ. Res. Lett., 7, 045404, https://doi.org/10.1088/1748-9326/7/4/045404, 2012. a
Harper, J., Humphrey, N., Pfeffer, W. T., Brown, J., and Fettweis, X.: Greenland ice-sheet contribution to sea-level rise buffered by meltwater storage in firn, Nature, 491, 240–243, https://doi.org/10.1038/nature11566, 2012. a
Hirashima, H., Avanzi, F., and Wever, N.: Wet-Snow Metamorphism Drives the Transition From Preferential to Matrix Flow in Snow, Geophys. Res. Lett., 46, 14548–14557, https://doi.org/10.1029/2019gl084152, 2019. a
Holmes, C. W.: Morphology and Hydrology of the Mint Julep Area, Southwest Greenland, in: Project Mint Julep Investigation of Smooth Ice Areas of the Greenland Ice Cap, 1953, Part II Special Scientific Reports, Arctic, Desert, Tropic Information Center, Research Studies Institute, Air University, 1955. a
How, P., Mankoff, K. D., Wright, P. J., Vandecrux, B., Ahlstrøm, A. P., and Fausto, R. S.: AWS one boom tripod Edition 4, GEUS Dataverse [data set], https://doi.org/10.22008/FK2/IW73UU, 2022. a, b
Humphrey, N. F., Harper, J. T., and Pfeffer, W. T.: Thermal tracking of meltwater retention in Greenland's accumulation area, J. Geophys. Res.-Earth, 117, F01010, https://doi.org/10.1029/2011jf002083, 2012. a, b
Jordan, P.: Meltwater movement in a deep snowpack: 1. Field observations, Water Resour. Res., 19, 971–978, https://doi.org/10.1029/wr019i004p00971, 1983.
Jordan, R., Albert, M., and Brun, E.: Snow and Climate: Physical Processes within the snow cover and their parametrization, vol. 20, Cambridge University Press (CUP), https://doi.org/10.1017/S0954102008001612, 2008. a
Jordan, R. E., Hardy, J. P., Perron, F. E., and Fisk, D. J.: Air permeability and capillary rise as measures of the pore structure of snow: an experimental and theoretical study, Hydrol. Process., 13, 1733–1753, https://doi.org/10.1002/(sici)1099-1085(199909)13:12/13<1733::aid-hyp863>3.0.co;2-2, 1999. a, b
Katsushima, T., Yamaguchi, S., Kumakura, T., and Sato, A.: Experimental analysis of preferential flow in dry snowpack, Cold Reg. Sci. Technol., 85, 206–216, https://doi.org/10.1016/j.coldregions.2012.09.012, 2013. a, b
Kattelmann, R.: Some measurements of water movement and storage in snow, in: Avalance Formation, Movement and Effects, edited by: Bruno Salm, H. G., IAHS, 162, 245–254, 1987. a, b
Kattelmann, R.: Spatial Variability of Snow-Pack Outflow at a Site in Sierra Nevada, U.S.A., Ann. Glaciol., 13, 124–128, https://doi.org/10.3189/s0260305500007758, 1989. a
Kattelmann, R. and Dozier, J.: Observations of snowpack ripening in the Sierra Nevada, California, U.S.A., J. Glaciol., 45, 409–416, https://doi.org/10.3189/S002214300000126X, 1999. a
Kinar, N. J. and Pomeroy, J. W.: Measurement of the physical properties of the snowpack, Rev. Geophys., 53, 481–544, https://doi.org/10.1002/2015rg000481, 2015.
Kobayashi, D. and Motoyama, H.: Effect of Snow Cover on Time Lag of Runoff from a Watershed, Ann. Glaciol., 6, 123–125, https://doi.org/10.3189/1985AoG6-1-123-125, 1985.
Koenig, L. S., Miège, C., Forster, R. R., and Brucker, L.: Initial in situ measurements of perennial meltwater storage in the Greenland firn aquifer, Geophys. Res. Lett., 41, 81–85, https://doi.org/10.1002/2013gl058083, 2014. a
Kozeny, J.: Über kapillaire Leitung des Wassers im Boden, Sitzungsberichte der Akademie der Wissenschaften mathematisch-naturwissenschaftliche Klasse, 136, 271–306, 1927. a
Kruseman, G., de Ridder, N., and Verweij, J.: Analysis and Evaluation of Pumping Test Data, ILRI, International Institute for Land Reclamation and Improvement, 2nd Edn., vol. 47, ISBN-10 9070754207, ISBN-13 978-9070754204, 1994.
MacFerrin, M., Machguth, H., van As, D., Charalampidis, C., Stevens, C. M., Heilig, A., Vandecrux, B., Langen, P. L., Mottram, R., Fettweis, X., van den Broeke, M. R., Pfeffer, W. T., Moussavi, M. S., and Abdalati, W.: Rapid expansion of Greenland's low-permeability ice slabs, Nature, 573, 403–407, https://doi.org/10.1038/s41586-019-1550-3, 2019. a, b
Machguth, H., MacFerrin, M., van As, D., Box, J. E., Charalampidis, C., Colgan, W., Fausto, R. S., Meijer, H. A., Mosley-Thompson, E., and van de Wal, R. S.: Greenland meltwater storage in firn limited by near-surface ice formation, Nat. Clim. Change, 6, 390–393, https://doi.org/10.1038/nclimate2899, 2016. a, b, c
Machguth, H., Tedstone, A., and Mattea, E.: Daily Variations in Western Greenland Slush Limits, 2000 to 2021, mapped from MODIS, J. Glaciol., https://doi.org/10.1017/jog.2022.65, in press, 2022. a
Marchenko, S., van Pelt, W. J. J., Claremar, B., Pohjola, V., Pettersson, R., Machguth, H., and Reijmer, C.: Parameterizing Deep Water Percolation Improves Subsurface Temperature Simulations by a Multilayer Firn Model, Front. Earth Sci., 5, 1–20, https://doi.org/10.3389/feart.2017.00016, 2017. a
Marsh, P. and Woo, M.-K.: Wetting front advance and freezing of meltwater within a snow cover: 1. Observations in the Canadian Arctic, Water Resour. Res., 20, 1853–1864, https://doi.org/10.1029/wr020i012p01853, 1984a. a
Marsh, P. and Woo, M.-K.: Wetting front advance and freezing of meltwater within a snow cover: 2. A simulation model, Water Resour. Res., 20, 1865–1874, https://doi.org/10.1029/WR020i012p01865, 1984b. a
Marsh, P. and Woo, M.-K.: Meltwater Movement in Natural Heterogeneous Snow Covers, Water Resour. Res., 21, 1710–1716, https://doi.org/10.1029/wr021i011p01710, 1985. a
Martinec, J.: Meltwater percolation through an alpine snowpack, in: Avalanche Formation, Movement and Effects, IAHS special publication, 162, 255–264, ISBN 0-947571-95-7, 1987. a
McGurk, B. J.: Five snowmelt models: a comparison of prediction accuracy. Proc. West. Snow Conf, 53rd Annual Meeting, 16–18 April 1985, Boulder, Colorado, 171–174, 1985.
McGurk, B. J. and Kattelmann, R. C.: Water flow rates, porosity and permeability in snowpacks in the central Sierra Nevada, in: Proceedings of the Symposium on Cold Regions Hydrology, edited by: Kane, D. L., 22–25 July 1986, Fairbanks, Alaska, Bethesda, MD, American Water Resources Association, AWRA Technical Publication Series TPS-86-1, 359–366, 1986.
Miller, O., Solomon, D. K., Miège, C., Koenig, L., Forster, R., Schmerr, N., Ligtenberg, S. R. M., and Montgomery, L.: Direct Evidence of Meltwater Flow Within a Firn Aquifer in Southeast Greenland, Geophys. Res. Lett., 45, 207–215, https://doi.org/10.1002/2017gl075707, 2018. a
Miller, O. L., Solomon, D. K., Miège, C., Koenig, L. S., Forster, R. R., Montgomery, L. N., Schmerr, N., Ligtenberg, S. R. M., Legchenko, A., and Brucker, L.: Hydraulic Conductivity of a Firn Aquifer in Southeast Greenland, Front. Earth Sci., 5, https://doi.org/10.3389/feart.2017.00038, 2017. a
Mitterer, C., Hirashima, H., and Schweizer, J.: Wet-snow instabilities: comparison of measured and modelled liquid water content and snow stratigraphy, Ann. Glaciol., 52, 201–208, https://doi.org/10.3189/172756411797252077, 2011. a
Mouginot, J., Rignot, E., Bjørk, A. A., van den Broeke, M., Millan, R., Morlighem, M., Noël, B., Scheuchl, B., and Wood, M.: Forty-six years of Greenland Ice Sheet mass balance from 1972 to 2018, P. Natl. Acad. Sci. USA, 116, 9239–9244, https://doi.org/10.1073/pnas.1904242116, 2019. a
Müller, F.: Zonation in the accumulation area of the glaciers of Axel Heiberg Island, N.W.T., Canada, J. Glaciol., 4, 302–311, https://doi.org/10.3189/s0022143000027623, 1962. a
Nghiem, S. V.: Mapping of ice layer extent and snow accumulation in the percolation zone of the Greenland ice sheet, J. Geophys. Res., 110, F02017, https://doi.org/10.1029/2004jf000234, 2005. a
Nienow, P. W., Sole, A. J., Slater, D. A., and Cowton, T. R.: Recent Advances in Our Understanding of the Role of Meltwater in the Greenland Ice Sheet System, Current Climate Change Reports, 3, 330–344, https://doi.org/10.1007/s40641-017-0083-9, 2017. a, b
Noël, B., van de Berg, W. J., Machguth, H., Lhermitte, S., Howat, I., Fettweis, X., and van den Broeke, M. R.: A daily, 1 km resolution data set of downscaled Greenland ice sheet surface mass balance (1958–2015), The Cryosphere, 10, 2361–2377, https://doi.org/10.5194/tc-10-2361-2016, 2016. a
Noël, B., van de Berg, W. J., van Wessem, J. M., van Meijgaard, E., van As, D., Lenaerts, J. T. M., Lhermitte, S., Kuipers Munneke, P., Smeets, C. J. P. P., van Ulft, L. H., van de Wal, R. S. W., and van den Broeke, M. R.: Modelling the climate and surface mass balance of polar ice sheets using RACMO2 – Part 1: Greenland (1958–2016), The Cryosphere, 12, 811–831, https://doi.org/10.5194/tc-12-811-2018, 2018. a
Oerter, H. and Moser, H.: Water storage and drainage within the firn of a temperate glacier (Vernagtferner, Oetztal Alps, Austria), in: Hydrological Aspects of Alpine and High Mountain Areas, IAHS Publications, vol. 182, 71–82, 1982.
Pfeffer, W. T., Meier, M. F., and Illangasekare, T. H.: Retention of Greenland runoff by refreezing: Implications for projected future sea level change, J. Geophys. Res., 96, 22117, https://doi.org/10.1029/91jc02502, 1991. a
Pitrak, M., Mares, S., and Kobr, M.: A Simple Borehole Dilution Technique in Measuring Horizontal Ground Water Flow, Ground Water, 45, 89–92, https://doi.org/10.1111/j.1745-6584.2006.00258.x, 2007. a
Polashenski, C., Courville, Z., Benson, C., Wagner, A., Chen, J., Wong, G., Hawley, R., and Hall, D.: Observations of pronounced Greenland ice sheet firn warming and implications for runoff production, Geophys. Res. Lett., 41, 4238–4246, https://doi.org/10.1002/2014gl059806, 2014. a
Porter, C., Morin, P., Howat, I., Noh, M.-J., Bates, B., Peterman, K., Keesey, S., Schlenk, M., Gardiner, J., Tomko, K., Willis, M., Kelleher, C., Cloutier, M., Husby, E., Foga, S., Nakamura, H., Platson, M., Wethington, M., Williamson, C., Bauer, G., Enos, J., Arnold, G., Kramer, W., Becker, P., Doshi, A., D’Souza, C., Cummens, P., Laurier, F., and Bojesen, M.: “ArcticDEM”, Harvard Dataverse, V1 [data set], https://doi.org/10.7910/DVN/OHHUKH, 2018. a, b, c
Probst, S.: Die Rolle des Schneezustandes bei Regen-auf-Schnee-Ereignissen, Master's thesis, University of Bern, Publikation Gewässerkunde Nr. 659, 2016. a
Reeh, N.: Parameterization Melt Rate and Surface Temperature on the Greenland Ice Sheet, Polarforschung, 59, 113–128, 1991. a
Rennermalm, Å. K., Hock, R., Covi, F., Xiao, J., Corti, G., Kingslake, J., Leidman, S. Z., Miège, C., Macferrin, M., Machguth, H., Osterberg, E., Kameda, T., and McConnell, J.: Shallow firn cores 1989–2019 in southwest Greenland’s percolation zone reveal decreasing density and ice layer thickness after 2012, J. Glaciol., 68, 431–442, https://doi.org/10.1017/jog.2021.102, 2021. a
Richards, L. A.: Capillary Conduction of Liquids through Porous Mediums, Physics, 1, 318–333, https://doi.org/10.1063/1.1745010, 1931. a
Sasgen, I., Wouters, B., Gardner, A. S., King, M. D., Tedesco, M., Landerer, F. W., Dahle, C., Save, H., and Fettweis, X.: Return to rapid ice loss in Greenland and record loss in 2019 detected by the GRACE-FO satellites, Commun. Earth Environ., 1, 8, https://doi.org/10.1038/s43247-020-0010-1, 2020. a
Schneebeli, M.: Development and stability of preferential flow paths in a layered snowpack, in: Biogeochemistry of Seasonally Snow Covered Basins, IAHS, 228, 89–95, 1995. a, b
Schneider, T.: Water movement in the firn of Storglaciären, Sweden, J. Glaciol., 45, 286–294, https://doi.org/10.3189/s0022143000001787, 1999.
Schneider, T.: Hydrological processes in the wet-snow zone of glaciers: a review, Zeitschrift für Gletscherkunde und Glazialgeologie, 36, 89–105, 2000.
Sharp, R. P.: Meltwater behavior in firn on upper Seward Glacier, – St. Elias Mountains, Canada, in: IAHS Publications, 32, 246–253, 1952.
Shimizu, H.: Air Permeability of Deposited Snow, Contributions from the Institute of Low Temperature Science, 1–32, http://eprints.lib.hokudai.ac.jp/dspace/handle/2115/20234 (last access: 26 March 2007), 1970. a
Shumskii, P.: Principles of structural glaciology, Dover Publications, New York, 1964. a
Sinergise Ltd.: Sentinel Playground, Copernicus Sentinel data 2019, https://apps.sentinel-hub.com/sentinel-playground (last access: 15 December 2021), 2022. a, b
Smith, L. C., Yang, K., Pitcher, L. H., Overstreet, B. T., Chu, V. W., Rennermalm, Å. K., Ryan, J. C., Cooper, M. G., Gleason, C. J., Tedesco, M., Jeyaratnam, J., van As, D., van den Broeke, M. R., van de Berg, W. J., Noël, B., Langen, P. L., Cullather, R. I., Zhao, B., Willis, M. J., Hubbard, A., Box, J. E., Jenner, B. A., and Behar, A. E.: Direct measurements of meltwater runoff on the Greenland ice sheet surface, P. Natl. Acad. Sci. USA, 114, E10622–E10631, https://doi.org/10.1073/pnas.1707743114, 2017. a
Steger, C. R., Reijmer, C. H., van den Broeke, M. R., Wever, N., Forster, R. R., Koenig, L. S., Munneke, P. K., Lehning, M., Lhermitte, S., Ligtenberg, S. R. M., Miège, C., and Noël, B. P. Y.: Firn Meltwater Retention on the Greenland Ice Sheet: A Model Comparison, Fron. Earth Sci., 5, 1–16, https://doi.org/10.3389/feart.2017.00003, 2017. a, b
Tedesco, M., Fettweis, X., Mote, T., Wahr, J., Alexander, P., Box, J. E., and Wouters, B.: Evidence and analysis of 2012 Greenland records from spaceborne observations, a regional climate model and reanalysis data, The Cryosphere, 7, 615–630, https://doi.org/10.5194/tc-7-615-2013, 2013. a, b
Tedstone, A. and Machguth, H.: Increasing surface runoff from Greenland's firn areas, Nat. Clim. Change, 12, 672–676, https://doi.org/10.1038/s41558-022-01371-z, 2022. a, b, c
The IMBIE Team: Mass balance of the Greenland Ice Sheet from 1992 to 2018, Nature, 579, 233–239, https://doi.org/10.1038/s41586-019-1855-2, 2019. a
Vallon, M., Petit, J.-R., and Fabre, B.: Study of an Ice Core to the Bedrock in the Accumulation zone of an Alpine Glacier, J. Glaciol., 17, 13–28, https://doi.org/10.3189/s0022143000030677, 1976.
van Angelen, J. H., Lenaerts, J. T. M., van den Broeke, M. R., Fettweis, X., and van Meijgaard, E.: Rapid loss of firn pore space accelerates 21st century Greenland mass loss, Geophys. Res. Lett., 40, 2109–2113, https://doi.org/10.1002/grl.50490, 2013. a
van As, D., Box, J. E., and Fausto, R. S.: Challenges of Quantifying Meltwater Retention in Snow and Firn: An Expert Elicitation, Fron. Earth Sci., 4, https://doi.org/10.3389/feart.2016.00101, 2016. a
Vandecrux, B., Mottram, R., Langen, P. L., Fausto, R. S., Olesen, M., Stevens, C. M., Verjans, V., Leeson, A., Ligtenberg, S., Kuipers Munneke, P., Marchenko, S., van Pelt, W., Meyer, C. R., Simonsen, S. B., Heilig, A., Samimi, S., Marshall, S., Machguth, H., MacFerrin, M., Niwano, M., Miller, O., Voss, C. I., and Box, J. E.: The firn meltwater Retention Model Intercomparison Project (RetMIP): evaluation of nine firn models at four weather station sites on the Greenland ice sheet, The Cryosphere, 14, 3785–3810, https://doi.org/10.5194/tc-14-3785-2020, 2020. a
van den Broeke, M., Box, J., Fettweis, X., Hanna, E., Noël, B., Tedesco, M., van As, D., van de Berg, W. J., and van Kampenhout, L.: Greenland Ice Sheet Surface Mass Loss: Recent Developments in Observation and Modeling, Current Climate Change Reports, 3, 345–356, https://doi.org/10.1007/s40641-017-0084-8, 2017. a
van de Wal, R., Greuell, W., van den Broeke, M., Reijmer, C., and Oerlemans, J.: Surface mass-balance observations and automatic weather station data along a transect near Kangerlussuaq, West Greenland, Ann. Glaciol., 42, 311–316, https://doi.org/10.3189/172756405781812529, 2005. a
Verjans, V., Leeson, A. A., Stevens, C. M., MacFerrin, M., Noël, B., and van den Broeke, M. R.: Development of physically based liquid water schemes for Greenland firn-densification models, The Cryosphere, 13, 1819–1842, https://doi.org/10.5194/tc-13-1819-2019, 2019. a, b
Williams, M. W., Erickson, T. A., and Petrzelka, J. L.: Visualizing meltwater flow through snow at the centimetre-to-metre scale using a snow guillotine, Hydrol. Process., 24, 2098–2110, https://doi.org/10.1002/hyp.7630, 2010. a
Woo, M.-K. and Sauriol, J.: Channel Development in Snow-Filled Valleys, Resolute, N. W. T., Canada, Geogr. Ann., 62, 37–56, https://doi.org/10.2307/520451, 1980. a
Yamaguchi, S., Katsushima, T., Sato, A., and Kumakura, T.: Water retention curve of snow with different grain sizes, Cold Reg. Sci. Technol., 64, 87–93, https://doi.org/10.1016/j.coldregions.2010.05.008, 2010. a
Yamaguchi, S., Watanabe, K., Katsushima, T., Sato, A., and Kumakura, T.: Dependence of the water retention curve of snow on snow characteristics, Ann. Glaciol., 53, 6–12, https://doi.org/10.3189/2012aog61a001, 2012. a
Zaugg, T.: Experimentell-empirische und modellbasierte Analyse der Rolle des Schneezustandes bei Regen-auf-Schnee-Ereignissen, Master's thesis, University of Bern, Publikation Gewässerkunde Nr. 725, 2017. a
The steel-tape method involves marking the bottom part of a ruler or steel tape with chalk and subsequently lowering it into a hole, typically a well, until a certain known depth where the bottom of the tape is below the water table. Upon bringing the tape back to the surface, the wetted part of the chalk indicates the water level. For more details, see Cunningham and Schalk (2011) or https://pubs.usgs.gov/tm/1a1/pdf/GWPD1.pdf (last access: 2 December 2016).
- Abstract
- Introduction
- Field site description
- Theoretical background
- Hydrology of icy firn above the runoff limit
- Lateral meltwater flow in slush
- Discussion
- Conclusions
- Appendix A
- Code availability
- Data availability
- Author contributions
- Competing interests
- Disclaimer
- Acknowledgements
- Financial support
- Review statement
- References