the Creative Commons Attribution 4.0 License.
the Creative Commons Attribution 4.0 License.
 | 09 Sep 2022
Mechanisms and effects of under-ice warming water in Ngoring Lake of Qinghai–Tibet Plateau
Mengxiao Wang
Zhaoguo Li
Matti Leppäranta
Victor Stepanenko
Yixin Zhao
Ruijia Niu
Liuyiyi Yang
Georgiy Kirillin
The seasonal ice cover in lakes of the Qinghai–Tibet Plateau is a transient and vulnerable part of the cryosphere, whose characteristics depend on the regional climate: strong solar radiation in the context of the dry and cold environment because of the high altitude and relatively low latitude. We use the first under-ice temperature observations from the largest Tibetan freshwater lake, Ngoring Lake, and a one-dimensional lake model to quantify the mechanism of solar thermal accumulation under ice, which relies on the ice optical properties and weather conditions, as well as the effect of the accumulated heat on the land–atmosphere heat exchange after the ice breakup. The model was able to realistically simulate the feature of the Ngoring Lake thermal regime: the “summer-like” temperature stratification with temperatures exceeding the maximum density point of 3.98 ∘C across the bulk of the freshwater column. A series of sensitivity experiments revealed solar radiation was the major source of under-ice warming and demonstrated that the warming phenomenon was highly sensitive to the optical properties of ice. The heat accumulated under ice contributed to the heat release from the lake to the atmosphere for 1–2 months after ice-off, increasing the upward sensible and latent surface heat fluxes on average by ∼ 50 and ∼ 80 W m−2, respectively. Therefore, the delayed effect of heat release on the land–atmosphere interaction requires an adequate representation in regional climate modeling of the Qinghai–Tibet Plateau and other lake-rich alpine areas.
- Article
(4768 KB) - Full-text XML
- BibTeX
- EndNote


Seasonal lake ice is a part of the cryosphere, gaining recent attention from researchers due to its sensitivity to climate change (Kirillin et al., 2012; Sharma et al., 2020). The duration of ice cover affects the stability and vertical mixing of lakes, as well as the lake–atmosphere matter and energy exchange (Rösner et al., 2012; Efremova et al., 2013; Ramp et al., 2015). Ice cover regulates lake biochemical indicators, such as the concentration of dissolved oxygen, nitrogen, and phosphorus, changing the biochemical reaction rate and affecting the water quality and distribution of aquatic organisms (Weitere et al., 2010; Dokulil, 2013; G. C. Li et al., 2015; Hardenbicker et al., 2016). Shortening of the ice season has been observed worldwide (Sharma et al., 2019; Dauginis and Brown, 2021) and attributed to anthropogenic warming (Grant et al., 2021). Future climate predictions indicated the accelerated reduction in seasonal lake ice, especially pronounced in the lake-rich Arctic regions (Brown and Duguay, 2011). Global assessment of seasonal lake ice changes requires quantification of the major heat sources and sinks on seasonal to climatic timescales. While the major prerequisite for the ice cover development is a sufficiently long season with air temperature below the freezing point of water, the heat budget of ice-covered lakes varies with latitude and altitude, depending strongly on the available solar radiation, the latter being the major source of heat for under-ice lake water (Kirillin et al., 2012). During the polar night in the Arctic and temperate lakes covered by snow, the solar heating is minor, and the bottom sediment is the main heat source (Winter I according to Kirillin et al., 2012); at later stages of the ice season (Winter II), as the snow melts, solar radiation becomes the main heat source governing thermal stratification and mixing under ice and the melting process at the ice base (Kirillin et al., 2018, 2020). Further, lakes with seasonal ice cover can be divided into cryomictic and cryostratified according to their maximum depth, surface area, and wind speed (Yang et al., 2021). In dry and cold areas with little snow, Winter II can occupy the entire ice-covered period (Kirillin et al., 2012), making solar radiation the major factor affecting the lake ice regime. The situation is relevant to the alpine lakes.
In particular, the largest alpine lake system of the Qinghai–Tibet Plateau (TP) is located not only at the highest plateau on Earth, with an average altitude of 4000–5000 m, but also at the relatively low latitude of 26–39∘ N in the TP, ensuring a high amount of solar radiation. The TP is covered by more than 1400 lakes with areas larger than 1 km2, and the total lake area is more than 5 × 10⁴ km2, accounting for 57.2 % of that in China (Wan et al., 2016; Zhang et al., 2019). Recent studies reported the first observations from ice-covered Tibetan lakes, indicating the major role of solar radiation in their thermal regime (Wang et al., 2021). Water temperatures in lakes Bangong Co and Nam Co constantly increased during the ice-covered period, with a stronger increase in shallower Bangong Co (Lazhu et al., 2021). Observations in meromictic Dagze Co demonstrated that stable temperatures in the early ice-covered period start warming only in the late ice-covered period, conditioned by the high water salinity (Wang et al., 2014; Lazhu et al., 2021). Salinity has a strong influence on the temperature and mixing regime of all three abovementioned lakes, by altering their density stratification and vertical heat transport. Among freshwater lakes in the TP, Ngoring Lake is the largest one (Kirillin et al., 2017; Wen et al., 2022). Kirillin et al. (2021a) found strong solar radiation under ice cover heating the entire lake water column to the maximum freshwater density temperature (Tmd; ∼ 3.98 ∘C) more than a month before the ice breakup; this situation is never found in lowland freshwater lakes. As a result, strong heat release from water to the ice base turned into the major factor governing the ice melt, with the water temperature under ice reaching 6 ∘C. This radiation-dominated regime differs dramatically from the typical heat budget known from earlier studies on ice-covered lakes. Although it belongs to the classification that Winter II occupies the whole ice-covered period, the under-ice lake temperature exceeds 4 ∘C in the late stage due to the strong solar radiation (SR) on the TP. Quantification of the resulting heat balance and thermal stratification characteristics of alpine conditions is the subject of the present study.
Due to the harsh environment of the TP and difficulties in collecting field observations, numerical models are often used to investigate phenomena and mechanisms of TP lakes. At present, the widely used lake models are the FLake model and the lake scheme coupled in the CLM (Community Land Model), CoLM (Common Land Model), and WRF (Weather Research and Forecasting Model) (Lazhu et al., 2016; Wen et al., 2016; Fang et al., 2017; Dai et al., 2018; Huang et al., 2019; Song et al., 2020; Wu et al., 2021). However, for computational efficiency, winter dynamics in these highly parameterized lake models are represented in a rather simplified way, lacking the detailed mechanisms of heating by radiation and resulting vertical heat transports across the water column (Lazhu et al., 2016; Wen et al., 2016; Huang et al., 2019). As an alternative, we adopt for this study a “classical” two-equation turbulence modeling approach proving its reliability in decades of studies on the environmental turbulent fluid dynamics. The one-dimensional model LAKE implements the approach in application to lake dynamics and was applied previously to different lakes (Stepanenko et al., 2011, 2016; Guseva et al., 2016). We combine modeling with in situ observations from Ngoring Lake, data on weather forcing, and remote sensing to (i) test the ability of a one-dimensional lake model LAKE to simulate temperature and stratification driven by intense solar heating in ice-covered Lake Ngoring, (ii) conduct series of sensitivity experiments aimed at revealing the role of meteorological forcing and ice optical properties in lake temperature and mixing regime, and (iii) reveal the effects of temperature distribution before ice breakup on lake heat storage and lake–atmosphere heat transfer.
2.1 Study area
Ngoring Lake (34.76–35.08∘ N, 97.53–97.90∘ E; Fig. 1) is located in the western valley of Maduo County on the eastern TP, with an average lake surface elevation of 4274 m a.s.l. It is the largest freshwater lake in the Yellow River source region, with a salinity of about 0.27 g kg−1 (Shen et al., 2012). It has a surface area of 610 km2, a maximum depth of 32 m, and an average depth of 17 m. The pH is 8.49, and there are very few fish in the lake. Aquatic plants grow only in the riparian area. The lake thermally stratifies in summer and is covered by ice from late November or early December to late April (Wen et al., 2016). According to observational data from 1953 to 2016 at Maduo station (34.9∘ N, 98.2∘ E) of the China Meteorological Administration, the average annual precipitation was 322.4 mm, mostly concentrated from May to September. The average annual air temperature was −3.53 ∘C. The maximum air temperature was 24.3 ∘C and occurred on 20 July 2006, and the minimum air temperature was −48.1 ∘C and occurred on 2 January 1978.

Figure 1(a) Location and (b) bathymetry of Ngoring Lake. Panel (b) is adapted from Kirillin et al. (2021a). The pentagrams denote the lake border station (LBS) and water temperature measurement site (WS).
2.2 Data
2.2.1 Observations: LBS station and WS site
The long-term automatic lake border station (LBS; 34.91∘ N, 97.55∘ E; Fig. 1) was installed in October 2012, at an altitude of 4282 m a.s.l., providing meteorological forcing data: wind speed at 10 m and air temperature, specific humidity, and air pressure at 2 m as well as downward shortwave (SR) and longwave radiation (LR) at 1.5 m from September 2015 to September 2016 (Li et al., 2020). The detailed information about site configuration and measured quantities are referred to in Z. G. Li et al. (2015) and Wen et al. (2016). The precipitation was obtained from the daily value data set (V3.0) at Maduo station of Chinese surface climate data (http://data.cma.cn, last access: 27 August 2022).
The water temperature measurement site (WS; 35.03∘ N, 97.70∘ E; Fig. 1) was located in the north of Ngoring Lake, where the total water depth was about 26.5 m. The multi-layer water temperature observation system consisted of 16 self-recording RBR SOLO water temperature probes with a precision of 0.01 ∘C. The sampling distance and time intervals were 1 m and 10 min, respectively.
2.2.2 MODIS lake surface temperature
The 8 d L3 global lake surface temperature product (MYD11C2) was derived from the data of Moderate Resolution Imaging Spectroradiometer (MODIS) and was used to evaluate the simulated results. MODIS offers long-term daily global coverage data with high spatial resolution. This product provides an 8 d combined radiative surface temperature at approximately 10:30 and 22:30 LT (local time), which is the satellite transit time. The resolution is 0.05∘ latitude–longitude (5600 m at the Equator) for the Climate Modeling Grid (CMG) (https://ladsweb.nascom.nasa.gov/search, last access: 27 August 2022) (Wan et al., 2004).
2.2.3 ERA5-Land data
ERA5-Land is produced as an enhanced global data set for the land component of the fifth generation of European Reanalysis (ERA5) by the European Centre for Medium-Range Weather Forecasts (ECMWF), framed within the Copernicus Climate Change Service (C3S) of the European Commission. It is available for the hourly record for about 40 years, from 1981 to the present. Expediently, ERA5-Land has an enhanced horizontal resolution of 9 km (∼ 0.08∘) compared to ERA5 (31 km) and ERA-Interim (80 km) (https://cds.climate.copernicus.eu/cdsapp#!/dataset/reanalysis-era5-land?tab=form, last access: 27 August 2022) (Hersbach et al., 2020; Muñoz-Sabater et al., 2021).
ERA5-Land data are applied for a comparative analysis of warming mechanisms and thermal conditions in Tibetan ice-covered lakes against those in the Arctic. The reanalysis forcing data for the geographical position 69.05∘ N, 20.83∘ E, were adopted as “typical” arctic weather conditions; that is the SR is 0 W m−2 during the winter polar night period. Northern Fennoscandia is covered by several lakes characterized by the longest ice-covered period in western Europe. The largest of these lakes, Kilpisjärvi, has a similar morphometrical feature to Ngoring (average depth of 19.5 m, maximum depth of 57 m, surface area of 37 km2). However, they receive different SR because of different latitudes. The lake has been intensively studied in the last decades (Kirillin et al., 2015, 2018; Leppäranta et al., 2017, 2019). Its under-ice water temperature remained stable during winter from 1992 to 1993 (Tolonen, 1998). In the following, model experiments forced by the ERA5 weather data (1992–1993) for the Arctic refer to “Kilpisjärvi” runs.
3.1 LAKE model
The one-dimensional model LAKE, simulating thermodynamic, hydrodynamic, and biogeochemical processes, is used to solve the horizontally averaged transfer of gases, heat, salts, and momentum in an enclosed water body (Stepanenko et al., 2011, 2016). The vertical heat diffusion is simulated, and the penetration of solar radiation into the water ice, snow, and bottom sediment layers (Heiskanen et al., 2015; Cao et al., 2020) is taken into account. The exchange between the water and the inclined bottom is modeled explicitly because the model equations have been averaged over horizontal sections of the water body. The second-order κ–ε parametrization of turbulence is applied (Stepanenko et al., 2016).
3.1.1 Heat transfer in water body
The water temperature is calculated according to the one-dimensional thermal diffusion equation:
where cw is water specific heat, ρw is water density, Tw is water temperature, h(t) is lake depth, t is time, is a normalized vertical coordinate is located at the free water surface of the lake, S is downward shortwave radiation, Aw is the z-dependent cross-sectional area of water, KT is the thermal diffusivity coefficient equal to the sum of molecular and turbulent diffusivities, Sb(ξ) is shortwave radiation flux, Fiz,b is soil heat flux at the level z, n is an outer vector normal to the boundary ΓA of the horizontal cross-section A, and uh is a horizontal vector in water (Stepanenko et al., 2016; Guseva et al., 2016).
3.1.2 Heat transfer in ice cover
When the air temperature decreases below 0 ∘C, and the surface water temperature drops to the freezing point, the initial ice cover forms. When the net radiation of the lake is positive, the ice melts continuously until the ice thickness declines to zero. The general heat conduction equation in ice cover follows the equation
where ci is ice specific heat, ρi is ice density, Ti is ice temperature, λi is ice thermal conductivity, hi is ice thickness, is the increment of ice thickness on its surface, FT,b is the heat flux at the ice–sediment boundary, Ai is the z-dependent cross-sectional area of the ice cover determined by the basin morphometry, L is the latent heat of water, and p is ice porosity (Stepanenko et al., 2019). The last term to the right-hand side presents heat of phase transition of salty water in ice pores.
The penetration of solar radiation into the medium is calculated using the Beer–Lambert law (Stepanenko and Lykossov, 2005; Stepanenko et al., 2019):
where ae is the medium extinction coefficient. To solve the temperature in Eqs. (1) and (2), it is necessary to specify the top and bottom boundary conditions and provide the method to calculate the heat flux at each depth z. The atmospheric turbulent heat flux schemes are based on the Monin–Obukhov similarity theory (Stepanenko et al., 2016).
When the lake is covered by ice, the temperatures of the bottom layer of ice and the top layer of water are equal and fixed to the melting/freezing point temperature (Stepanenko et al., 2019), which is calculated by the following formula:
where Tmp is the melting/freezing point temperature (∘C), C is salinity at the water–ice interface, and and is assumed constant.
Based on the study by Leppäranta (2015), the albedo regulates the surface energy budget, and the extinction coefficient controls the vertical distribution of radiation energy in the medium. In the LAKE model, the albedo of water (Aw) is 0.06, and the snow extinction coefficient (Es) decreases with increased snow density. Snow accumulation in the Ngoring Lake area is almost zero. Therefore, only Ai, Ei, and Ew are analyzed in this study. Version 2.3, called LAKE2.3, is used in this article.
3.2 Methods to evaluate the model accuracy
The indexes to evaluate accuracy of the model are the root mean square error (RMSE), bias, and correlation coefficient (CC):
where mj and oj represent the simulations and observations; and are the corresponding average values; Var(M) and Var(O) are the variances of observed and simulated values, respectively; and Cov(M,O) is the covariance.
3.3 Calculation method of heat storage
The heat storage evolution in water is calculated by the following formulation:
where cw=4192 J kg−1 K−1 and ρw=103 kg m−3, n is the layer number, Δzk is depth interval between two successive layers, and Tk (K) is the average temperature in layer k (Nordbo et al., 2011; Gan and Liu, 2020).
4.1 Characteristics of water temperature
It is pointed out that the under-ice water temperature from 2015 to 2016 in Ngoring Lake rose continuously during the entire ice-covered period according to observations (Wang et al., 2021; Kirillin et al., 2021a). In November, because of the strong wind and wide surface, the lake mixed evenly with slight oscillation (<1 ∘C between 2 and 22 m), and water temperature decreased gradually until the lowest point of 0.47 ∘C at 2 m on 12 December, after which the lake froze up completely (Fig. 2a). Meanwhile, the 2 m air temperature fell to −7.79 ∘C. Ngoring Lake is mostly covered only by bare ice in winter due to drought and less precipitation and snow. In the early ice-covered phase (from 12 December to 7 March), the whole lake mixed completely because solar radiation penetrated ice and heated the upper water, which was warm (<Tmd), heavy, and sinking (Fig. 2b) (Kirillin et al., 2012). In parallel, water temperature continued to warm until it reached Tmd on 7 March (Fig. 2a).
In the late ice-covered stage (from 7 March to 18 April), the lake stratified, on the one hand owing to strengthened solar radiation and on the other hand since radiation absorption of water decayed with depth based on the Beer–Lambert law. Water temperature increased at the rate of 0.052 ∘C d−1 in the layers from 2 to 6 m, which was more rapid than the early stage of 0.035 ∘C d−1. On 18 April, the ice melted entirely, and water temperature rose to 5.83 ∘C at 2 m while remaining at Tmd below 9 m. After that, full mixing took place rapidly because the lake warmed, gaining heat from the sun and atmosphere as a result of ice breaking up (Fig. 2b).
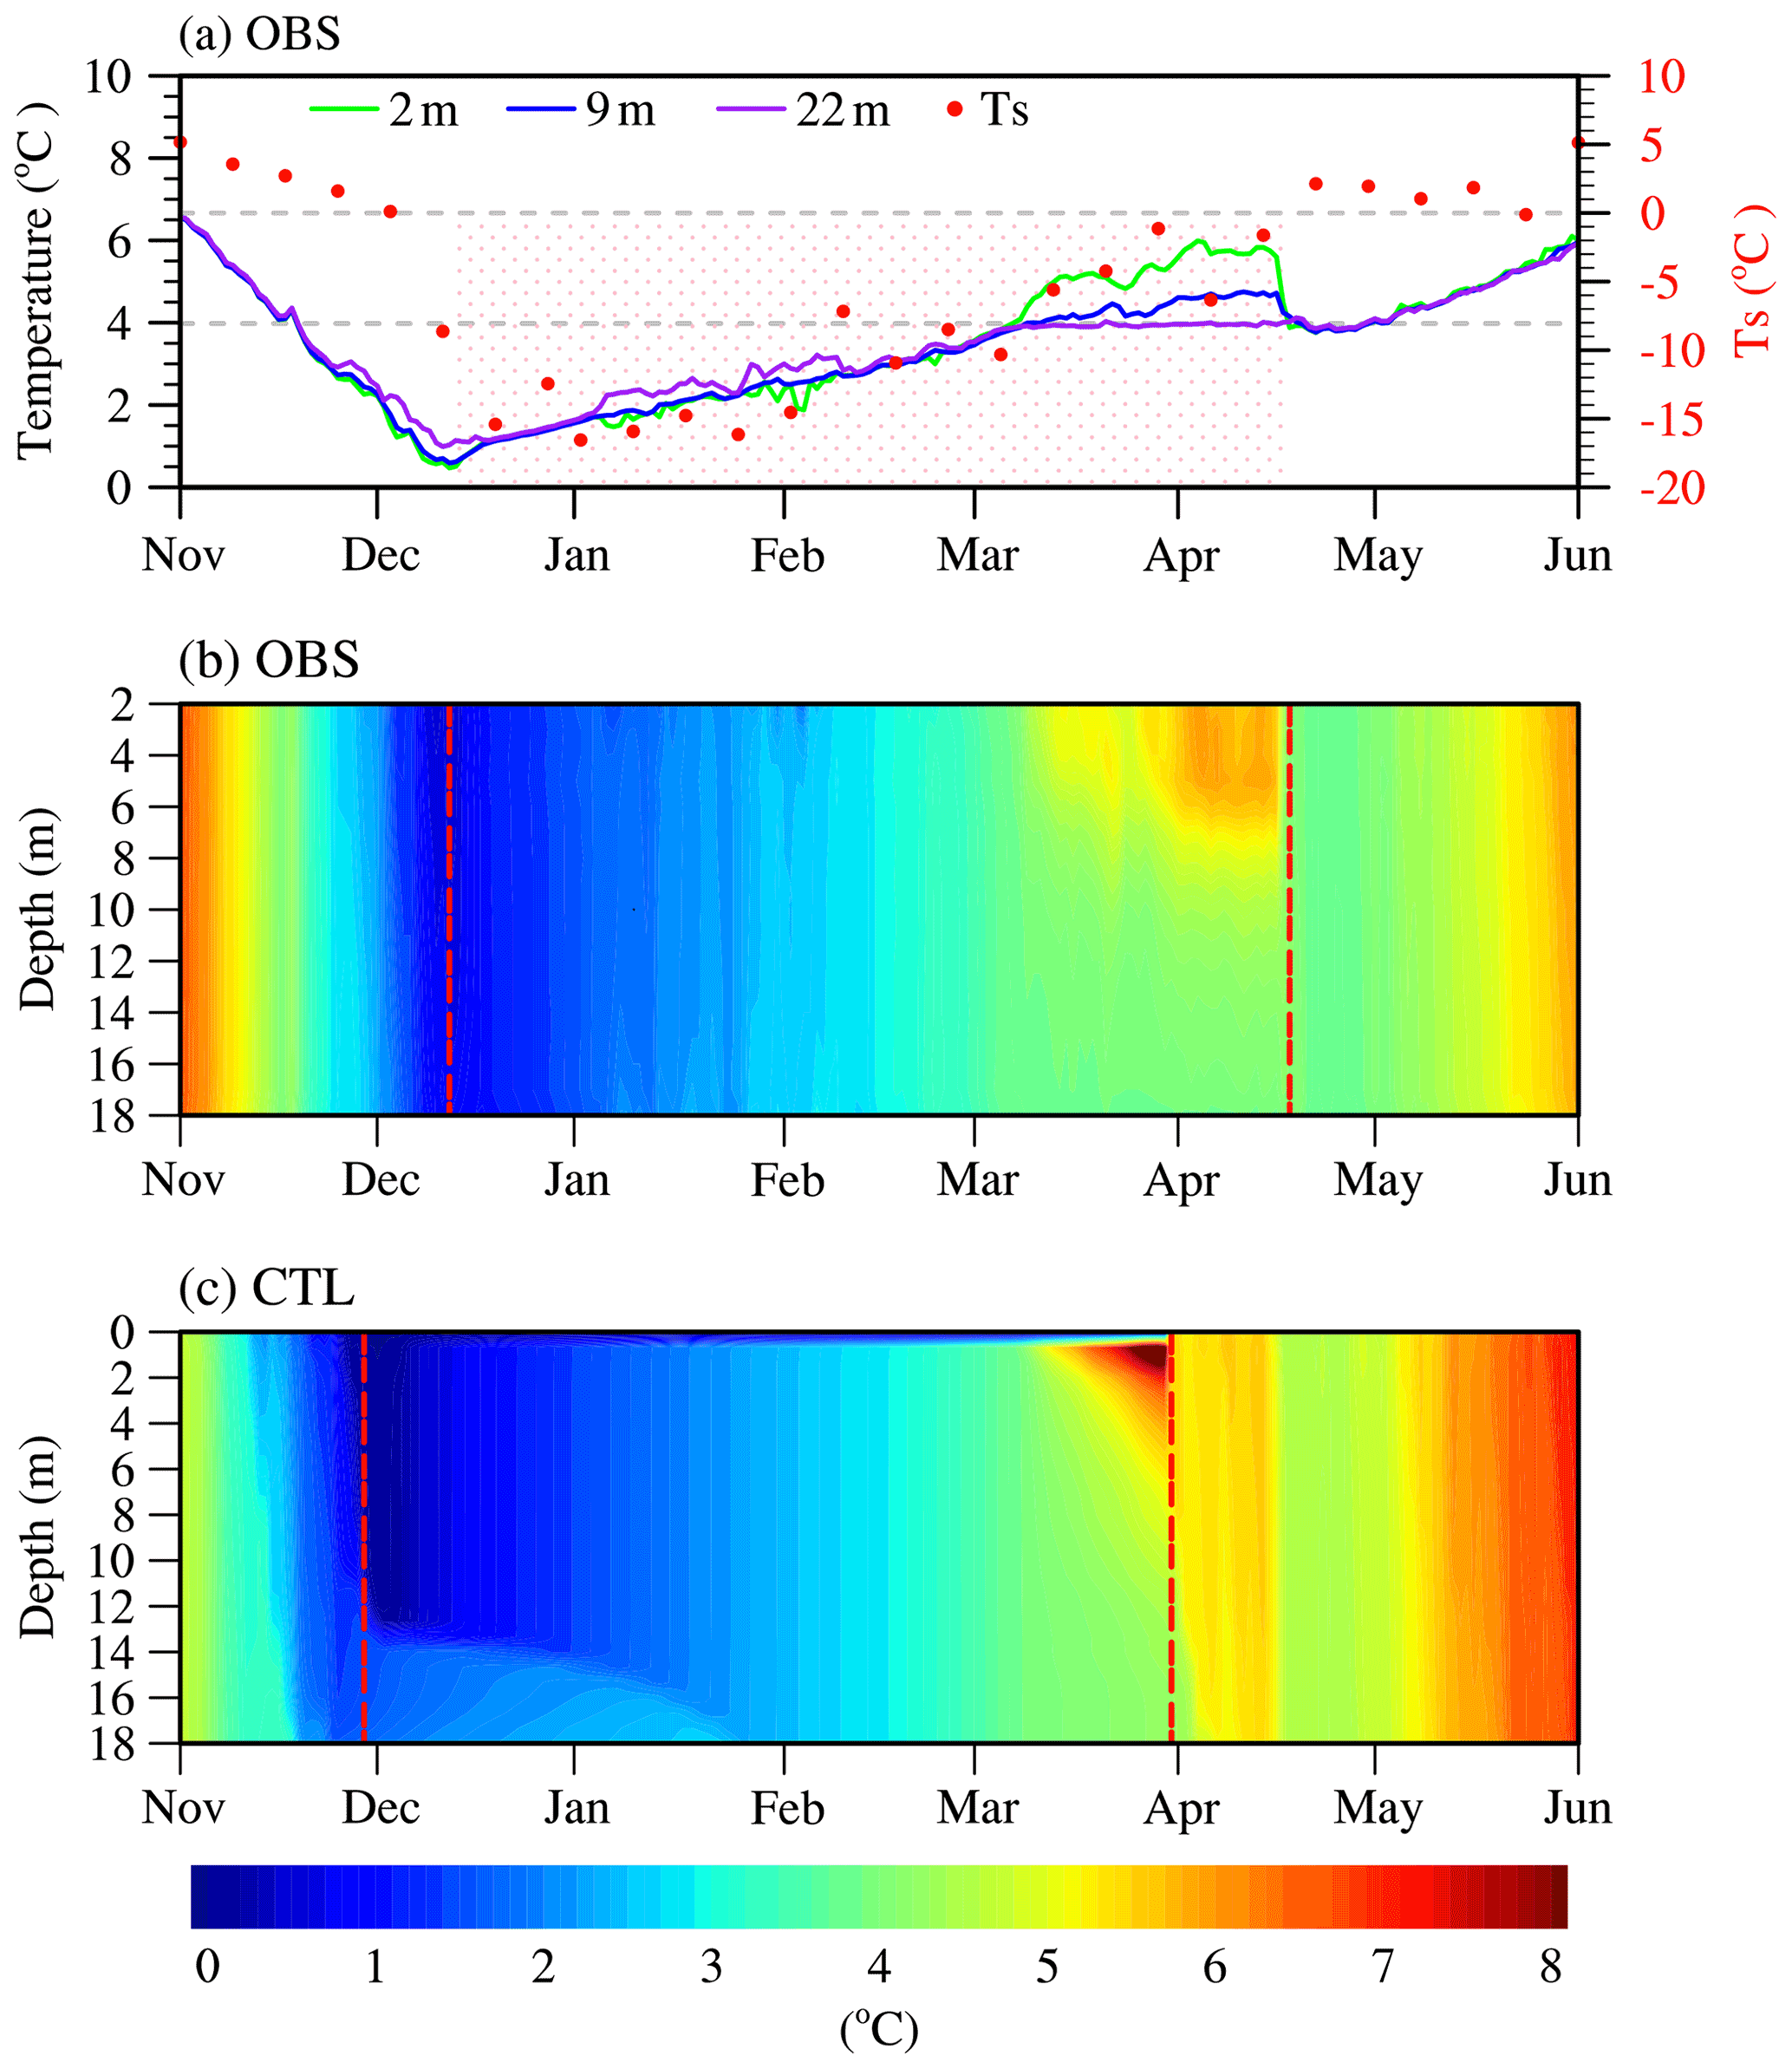
Figure 2(a) The daily average water temperature observations of Ngoring Lake at the surface (Ts) and at 2, 9, and 22 m from 1 November 2015 to 1 June 2016. Ts is MODIS lake surface temperature. The gray reference lines denote 3.98 and 0 ∘C, respectively. The shaded pink area denotes the ice-covered period. The water temperature profile (b) observed and (c) simulated in CTL. The ice-covered period is represented between the two dashed red lines.
4.2 Local climate: Tibet vs. Kilpisjärvi
The daily averages of meteorological variables between Tibet and Kilpisjärvi are shown in Fig. 3, and the ranges and averages of those meteorological variables during the ice-covered period (from 12 December to 18 April based on Ngoring Lake) are compared (Table 1). The average differences in air temperature, specific humidity, and downward LR were −0.42 ∘C, −0.38 g kg−1, and 41.9 W m−2, respectively. The wind speed of Tibet was 1.7 times that of Kilpisjärvi, and the downward SR in Tibet of 199.41 W m−2 was stronger than that in Kilpisjärvi of 40.46 W m−2. In Tibet, the precipitation was a multiple of 0.037 less than that in Kilpisjärvi.
On the whole, there were few differences in air temperature, specific humidity, and downward LR in the two regions. Nevertheless, there was much lower precipitation and much higher downward SR and wind speed in the high-altitude and relatively low-latitude Tibet. Surface pressure was not considered in this study due to the minor effect on water temperature.
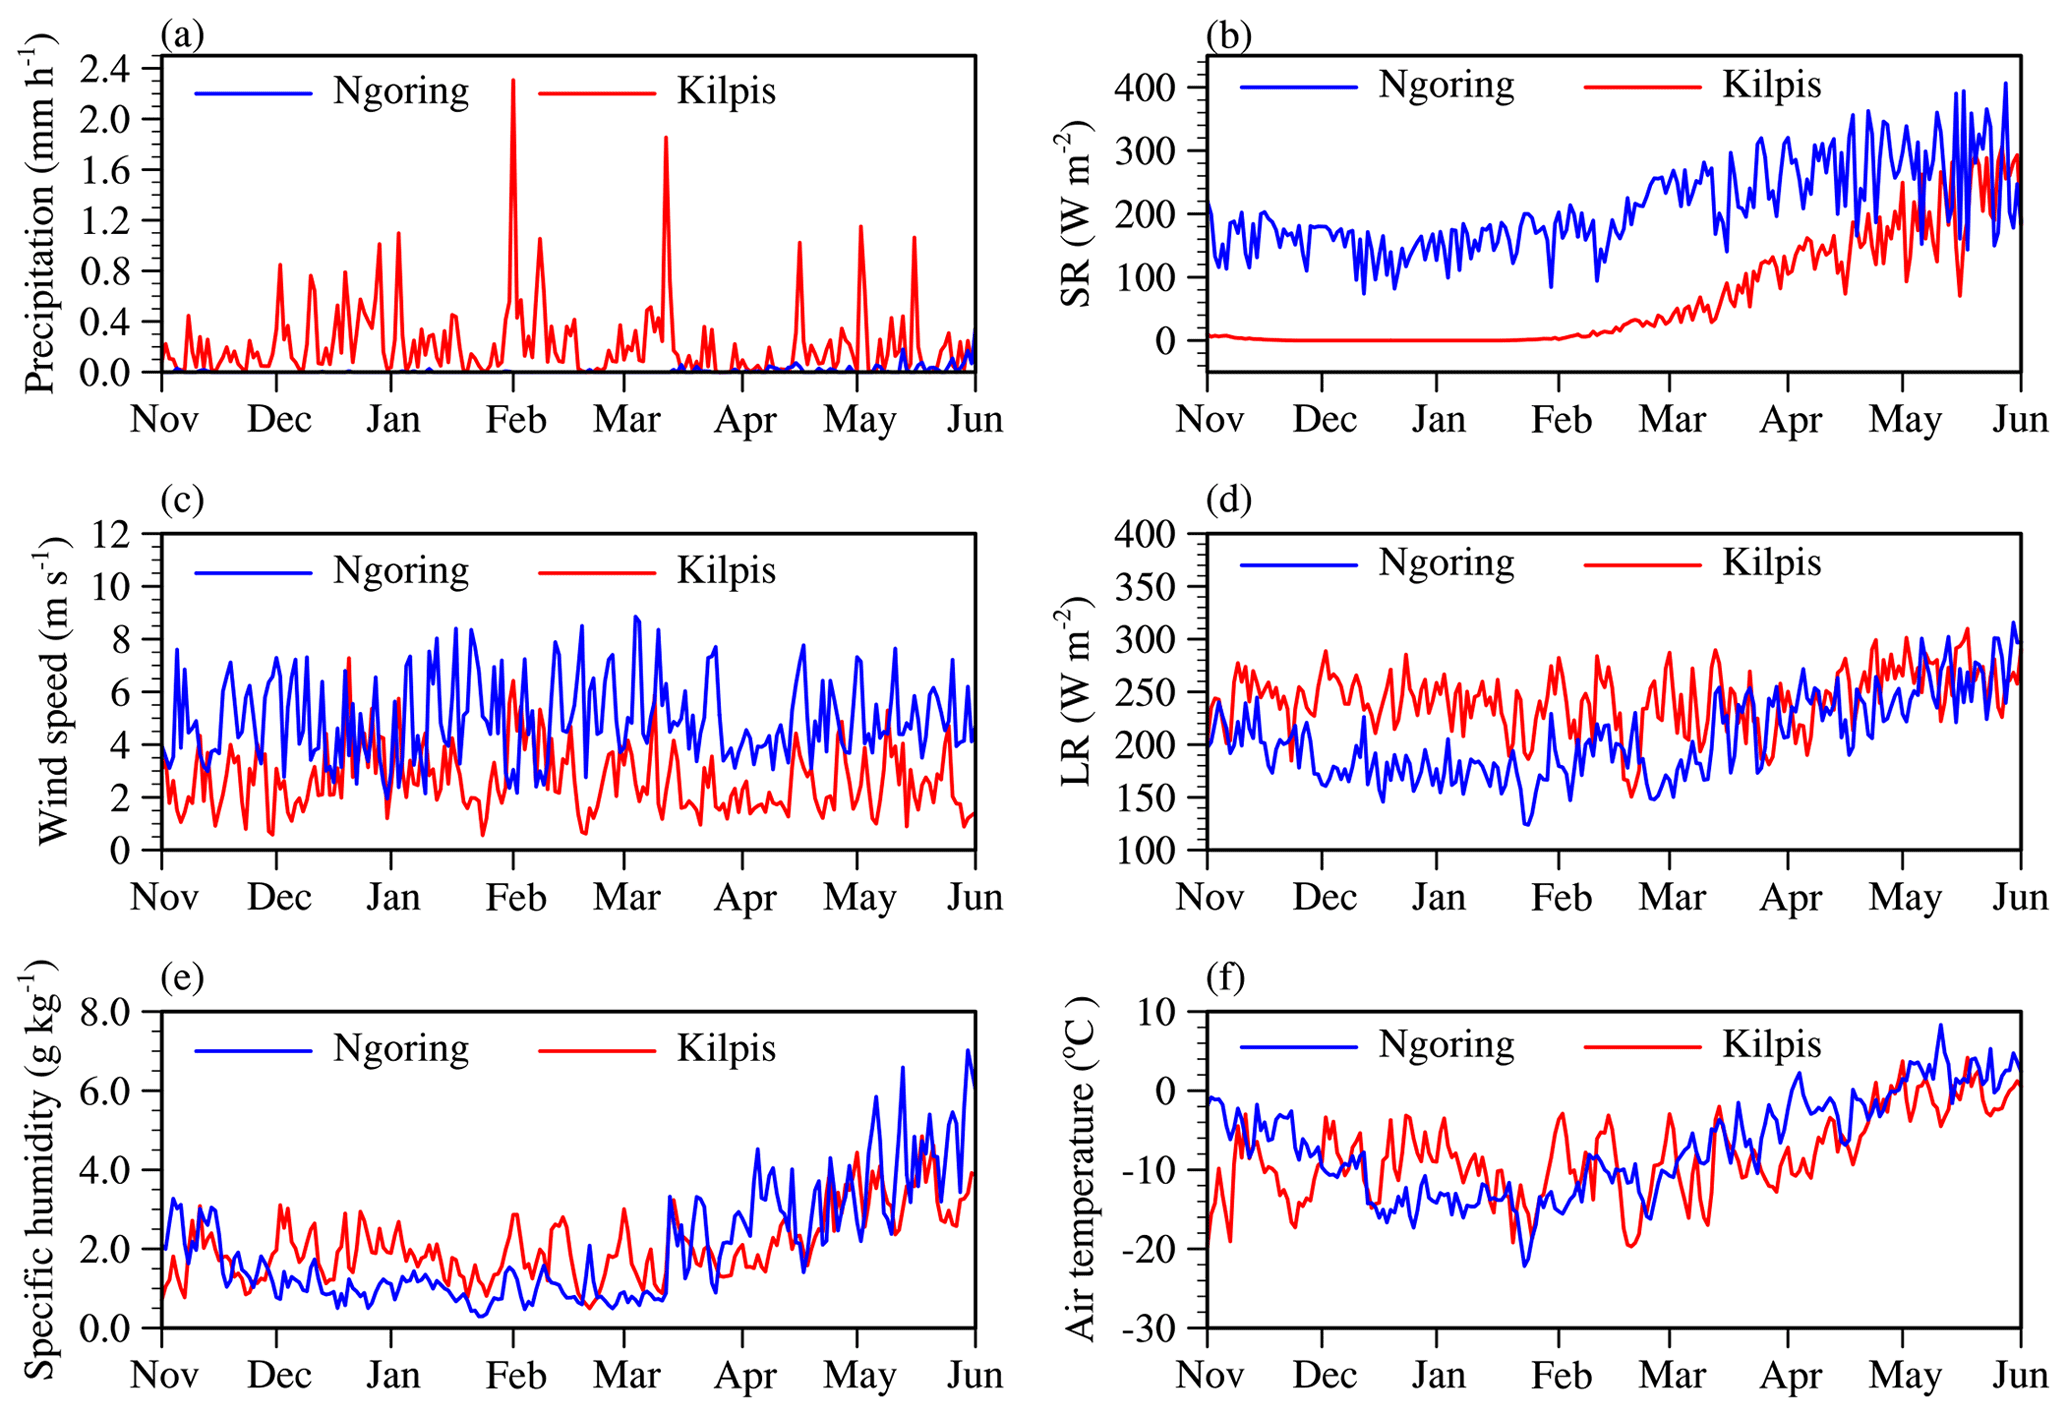
Figure 3Comparison of daily average values of the meteorological variables for Tibet from 2015 to 2016 and for Kilpisjärvi from 1992 to 1993. (a) Precipitation, (b) downward SR, (c) wind speed, (d) downward LR, (e) specific humidity, and (f) air temperature. “Ngoring” represents the Tibet region, and “Kilpis” represents Kilpisjärvi region.
Table 1Ranges and averages of the meteorological variables of Tibet (2015–2016) compared with Kilpisjärvi (1992–1993) during the ice-covered period (12 December–18 April).

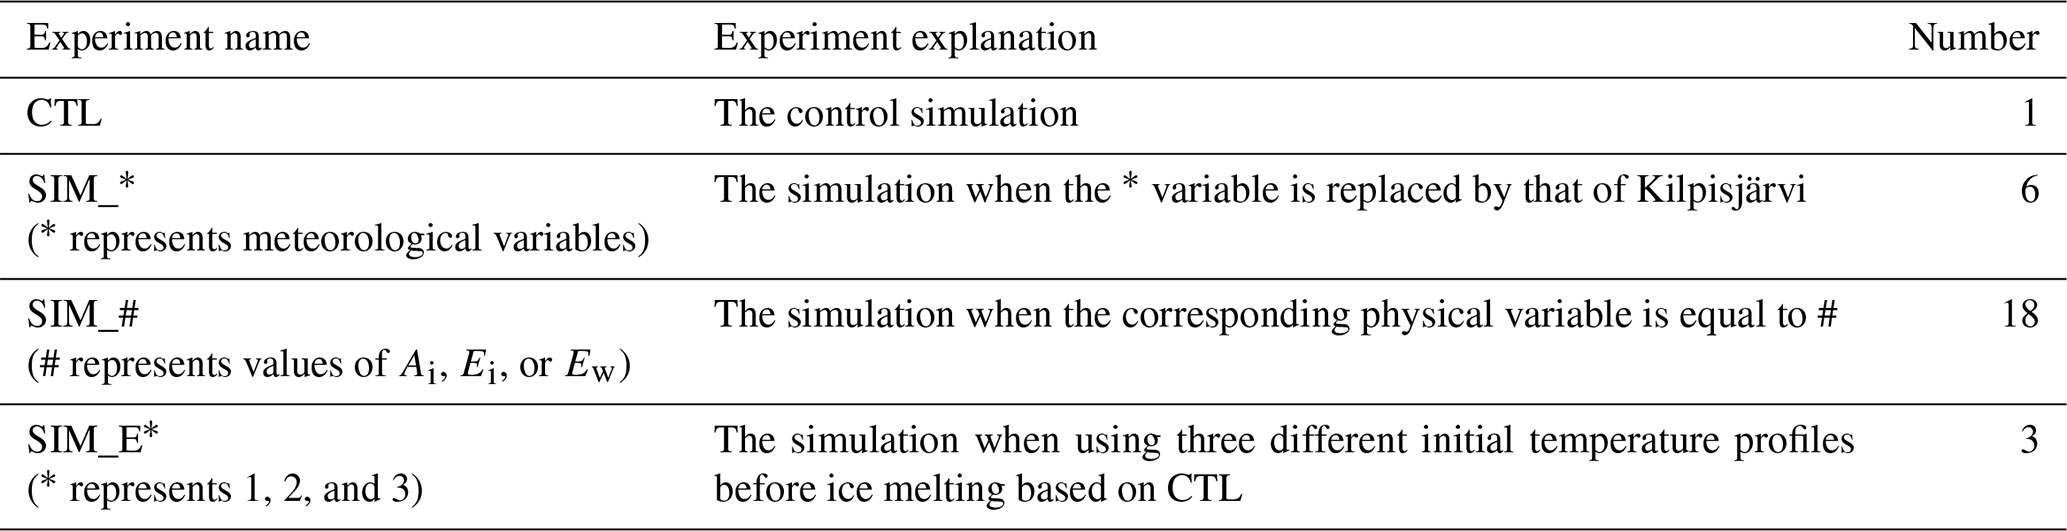
To reveal the mechanism of water temperature rising during the ice-covered period in Ngoring Lake and its further influences, one control simulation (CTL) and 27 sensitivity simulations (SIMs) depending on CTL were set in this study (Table 2).
5.1 Setup in CTL
The depth was set as 26.5 m, measured at the WS point, and divided vertically into 35 layers. The simulation period was from September 2015 to September 2016. The initial vertical profile of water temperature, mixed layer, and the bottom temperature was set following the observations (Fig. 2b). The albedos of snow and ice and the extinction coefficients of ice and water were set as As=0.7, Ai=0.25, Ei=2.5 m−1, and Ew=0.15 m−1 based on previous investigations (Lei et al., 2011; Li et al., 2018, 2020; Shang et al., 2018). The inputs driving meteorological variables were air pressure, wind speed, specific humidity, air temperature, precipitation, and downward SR and LR. The forcing data and model run intervals were 30 min and 15 s respectively.
5.2 Setup in SIMs
To explore the influence of a single meteorological variable, SIM_* simulations were set up. The symbol * is SR, Precip, LR, U, Tair, or q in Kilpisjärvi. These scenarios were quite artificial because these variables are closely correlated. Despite that, these sensitivity simulations can shed light on the influence of local climate on lake temperature evolution during the ice-covered period.
To discuss the effect of the main physical parameters, SIM_# simulations were set up. The sign # represents the values of Ai, Ei, or Ew. SIM_E* (* equal to 1, 2, or 3) is set for exploring the effects of three different initial water temperature profiles before ice breakup on the lake heat storage and heat fluxes.
6.1 Model validation
The CTL simulation was relatively consistent with the observations (Fig. 2b, c), even though the whole ice season of the CTL started about 15 d earlier than the observed. Water temperature was a little higher in CTL than that in the observations from mid-March to late May. The deviation was greater in the deep water. The simulated temperature warmed faster and was higher by 1 ∘C than the observed value after ice melted.
The results were evaluated by calculating RMSE, bias, and CC between simulated and observed water temperature at the lake surface (Ts) and at 2, 9, and 22 m (Fig. 4). The CC in each layer was equal to or even greater than 0.95, and the CC at 2 and 9 m was as high as 0.98, even though RMSE and bias of lake surface were 3.25 and 1.42 ∘C, respectively. The Ts RMSE was largely due to the uncertainty in MODIS lake surface temperature (Donlon et al., 2002; Tavares et al., 2019). The absolute bias values in the internal lake were less than 0.01 ∘C, and RMSE was less than 0.95 ∘C. More importantly, the under-ice water temperature warming phenomenon was reproduced reasonably.
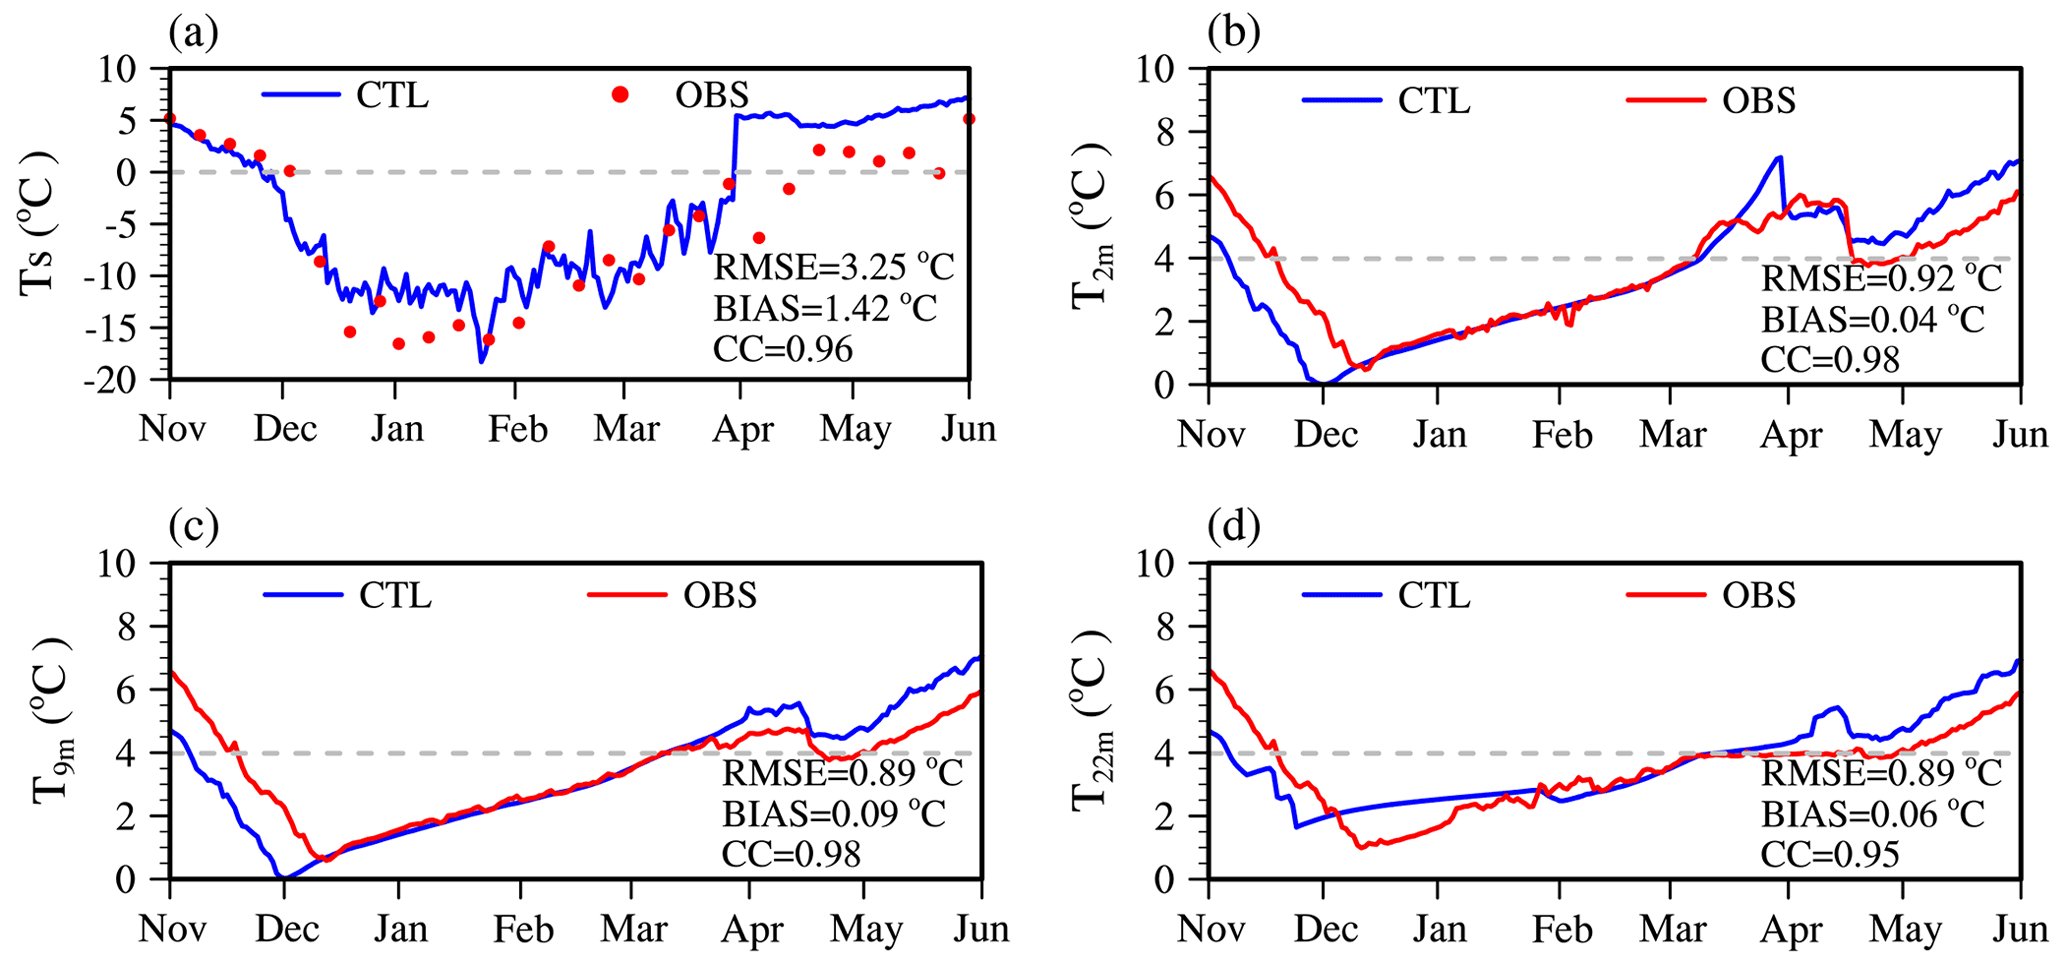
Figure 4The daily average water temperature observed and simulated in CTL of (a) the surface (Ts), (b) 2 m, (c) 9 m, and (d) 22 m in Ngoring Lake from November 2015 to June 2016. The dotted lines represent Tmd 3.98 ∘C.
6.2 Influences of local climate on water temperature
To explore the influences of local climate on water temperature, six SIM_* (* represents six meteorological variables; Table 2) simulations were designed. The 3 m water temperature was typically selected to analyze since water temperature at different depths varied consistently over time.
SIM_SR was the simulation when the Kilpisjärvi downward SR was substituted for that in Tibet. During the ice-covered period, the downward SR difference between CTL (199.41 W m−2) and SIM_SR (40.46 W m−2) was 158.95 W m−2. In the sensitivity simulation SIM_SR, the 3 m water temperature was stable, keeping in the range of 0–0.1 ∘C (Fig. 5a). The ice formation date was earlier, and the ice-breaking date was delayed, which led to the growth of the whole ice season. The mixed layer depth increased (Fig. 5d). Consequently, the strong downward SR on the TP generated the under-ice water warming in Ngoring Lake.
In the simulation SIM_Precip, the Tibet precipitation was replaced by that in Kilpisjärvi. In the sensitivity experiment SIM_Precip, the 3 m water temperature was fixed, then increased but did not exceed Tmd in the early ice cover stage (Fig. 5a). The stratification and temperature maximum center disappeared in late March, and the lake was fully mixed (Figs. 2c, 5g). Because the average precipitation in SIM_Precip (0.12 mm h−1) was approximately 30 times larger than that in CTL (0.0044 mm h−1) during the ice-covered period, more solar radiation was reflected and absorbed by snow due to more snowfall accumulation. Thus, the high precipitation damped the water temperature rise.
In the SIM_LR simulation, the downward LR in Kilpisjärvi superseded that in Tibet. The average downward LR was 233.62 W m−2 in SIM_LR, which was stronger than that in CTL (191.73 W m−2) during the ice-covered period. The 3 m water temperature still warmed, and the complete ice melting time of late February was ahead. The heat was transferred from lake to atmosphere because of lower air temperature after ice breakup. The water temperature underwent a cooling process (2 ∘C) until reaching a new equilibrium with the atmosphere (Fig. 5b). Compared with the CTL, water mixing in the ice-covered period was more uniform, the stratification in late March was weakened, and the temperature maximum center advanced by about 15 d (Fig. 5e).
In the SIM_U simulation, the wind speed of Kilpisjärvi was substituted for that of Tibet. The wind speed in SIM_U (2.83 m s−1) was weaker than that in CTL (4.93 m s−1) for the ice-covered period. In the sensitivity experiment SIM_U, the 3 m water temperature kept rising, but it was about 3 ∘C higher than that in CTL during the whole simulation period (Fig. 5b). Due to the decrease in wind speed, the mixed layer depth was reduced, and the lake stratification was more stable (Fig. 5h).
In the SIM_Tair simulation, the air temperature of Kilpisjärvi was replaced by that of Tibet. The average air temperature difference between SIM_Tair (−9.83 ∘C) and CTL (−10.25 ∘C) was negligible (0.42 ∘C). In the sensitivity experiment SIM_Tair, the water temperature decreased more quickly, and in late October, the lake froze, no longer releasing heat into the atmosphere. The lake stratification was enhanced, and the water temperature maximum center was ahead by about 10 d (Fig. 5c, f).
In the SIM_q simulation, the specific humidity of Kilpisjärvi was substituted for Tibet. The difference in specific humidity between SIM_q and CTL was 0.38 g kg−1 during the ice-covered period. In the sensitivity experiment SIM_q, the simulations were coincidental to that in CTL, and thus the specific humidity had little effect on the water temperature (Fig. 5c, i).
In conclusion, the stronger downward SR and lower precipitation in the high-altitude and relatively low-latitude TP played positive roles in the water temperature warming during the ice-covered period in Ngoring Lake. Less downward LR, lower air temperature, and larger wind speed did not change the warming trend but affected the warming amplitude and rate. Specific humidity had no significant influence.

Figure 5The simulated 3 m daily average water temperature in (a), (d) SIM_SR, (a), (g) SIM_Precip, (b), (e) SIM_LR, (b), (h) SIM_U, (c), (f) SIM_Tair, and (c), (i) SIM_q sensitivity experiments from November 2015 to June 2016 is compared with the CTL and the observation, and the change in vertical stratification is shown. The dotted line represents 3.98 ∘C.
6.3 Influences of main physical parameters on water temperature
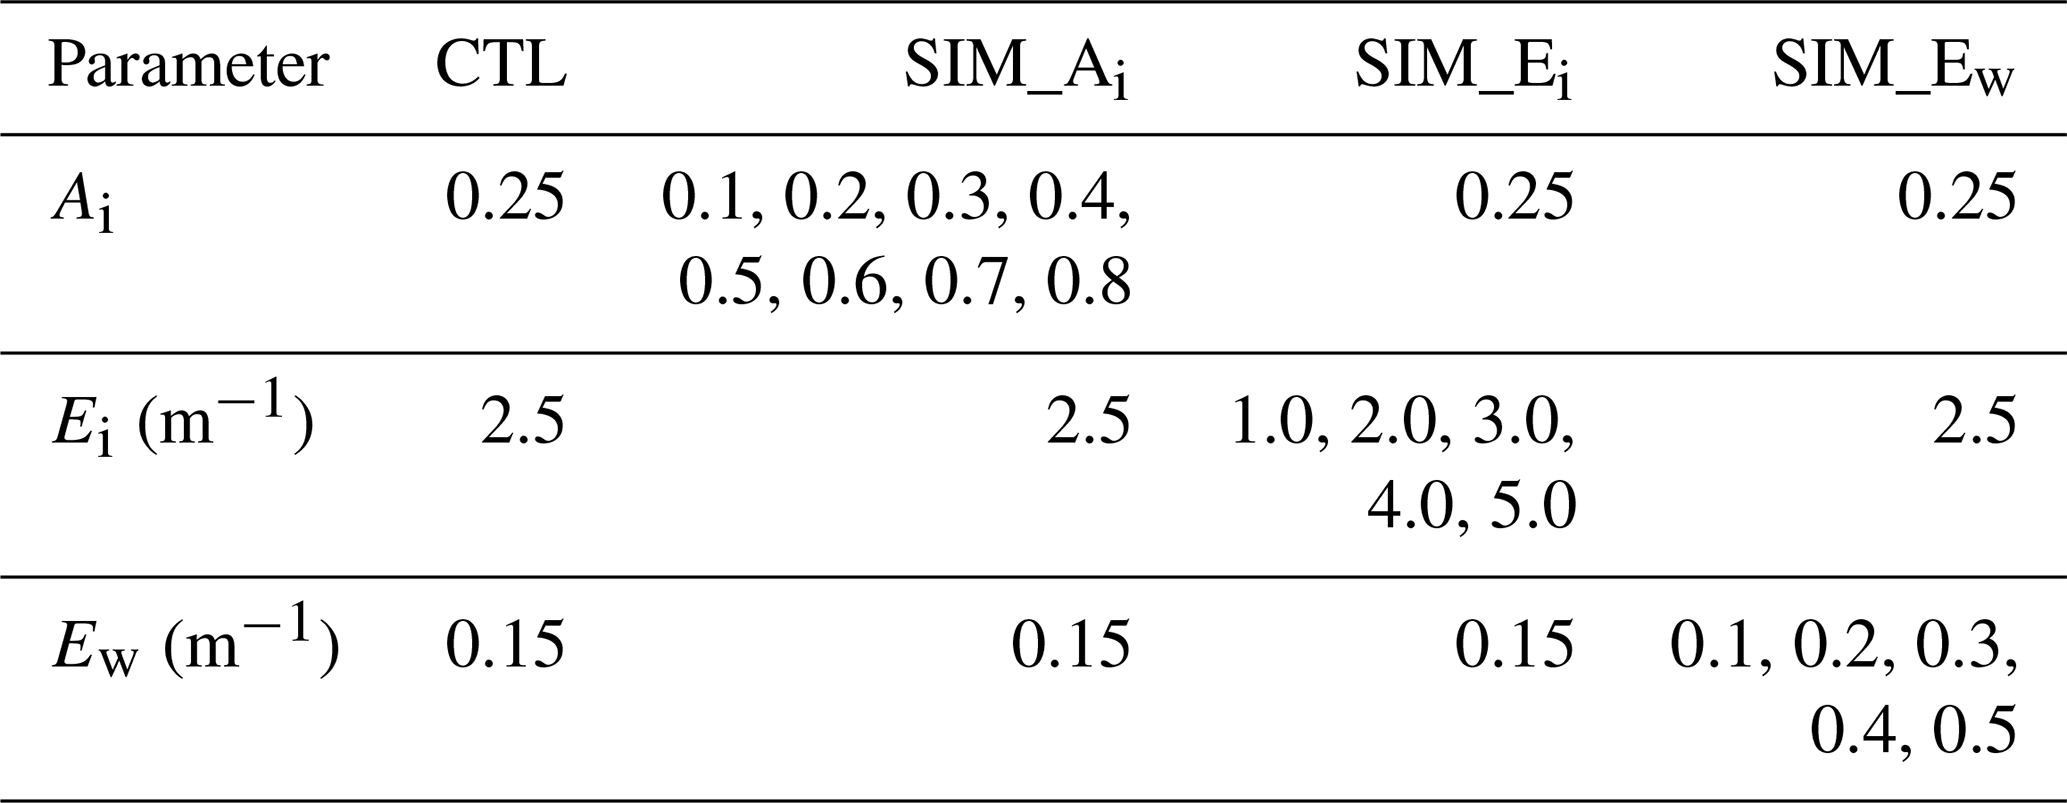
The radiation transfer, which depended on the albedo and extinction coefficient, played a decisive role in the water temperature. Only influences of Ai, Ei, and Ew on water temperature simulation were discussed with sensitivity experiments due to less snow in Tibet. According to previous observations, Ai as observed on the TP was mostly less than 0.12, and the albedo of clear blue ice was only 0.075 (Li et al., 2018). The range of Ai without snow cover was set as 0.1–0.8 with an interval of 0.1 in SIM_Ai experiments.
Ei has not been observed on the TP, but surveys in Finnish lakes show that the value of bare ice varies between 1–4 m−1, while the value of snow-covered ice can reach 5 m−1 (Lei et al., 2011). In SIM_Ei simulations, Ei was equal to 1–5 m−1 with an interval of 1 m−1.
For the Ew, Zolfaghari et al. (2017) found that the FLake model is particularly sensitive at Ew≤0.5 m−1. Shang et al. (2018) observed that Ei varies from 0.11 to 0.67 m−1 in a few TP lakes. Therefore, the sensitivity simulations SIM_Ew were designed so that the Ew varied from 0.1 to 0.5 m−1 with an increment step of 0.1 m−1. The experimental settings are shown in Table 3.
Table 3Numerical sensitivity simulations of parameters affecting the radiative transfer.
In the SIM_Ai sensitivity experiment, the 3 m water temperature decreased by approximately 1 ∘C when ice albedo increased by 0.1. When the albedo grew to 0.80, and the water temperature warming decreased from 4 to 2 ∘C. The increase in ice albedo did not affect the ice formation date but remarkably delayed the ice melting time, accordingly prolonging the ice-covered period. When the albedo increased from 0.1 to 0.8, the ice-covered period was extended for 15–30 d for every increase of 0.1 (Fig. 6a).
In the sensitivity experiment SIM_Ei, the ice extinction coefficient changes did not all make a continuous rise in water temperature, but the 3 m water temperature decreased by 1–2 ∘C when the ice extinction coefficient increased by 1 m−1 (Fig. 6b). The ice absorbed more heat, and less heat entered the lake water under ice due to the larger ice extinction coefficient.
To further discuss influences of Ai and Ei on lake temperature during the ice-covered period, the period was divided into two stages: Period A and Period B in CTL and SIM_Ai. Period A ranged from freezing point to Tmd, and Period B ranged from Tmd to maximum temperature (Tm). The duration of Period A was longer than that of Period B, and the temperature heating rate in Period B (∼ 0.1 ∘C d−1) was 2.5 times greater than that of Period A (∼ 0.04 ∘C d−1). The reason was that the lake was completely covered by ice, and the inner lake was evenly mixed in Period A, while the ice thickness decreased, and the radiation absorbed by the ice decreased in Period B. The upper layer absorbed more heat than the deeper layer, and the upper water temperature increased rapidly. When Ai and Ei increased, the heating rate decreased, and the duration increased in Period A, while the maximum temperature decreased, and the heating rate and duration fluctuated in Period B. When Ai≥0.6, the heating rate during the ice-covered period decreased and did not rise to Tmd.
In the SIM_Ew sensitivity experiment, the water extinction coefficient had just a little influence on the winter water temperature; 3 m water temperature decreased with the increase in Ew (Fig. 6c). When only the extinction coefficient of water changed, the solar radiation entering the water through the ice is unchanged, and so the heat storage of the lake was unaffected. It is just that the heat distribution in the vertical direction is changed. The higher the extinction coefficient of water was, the more heat was absorbed by the surface layer and the less heat reached the deep layer. The phenomenon that the 3 m water temperature decreases with increasing extinction coefficient becomes more and more obvious in the later stage of ice melting.
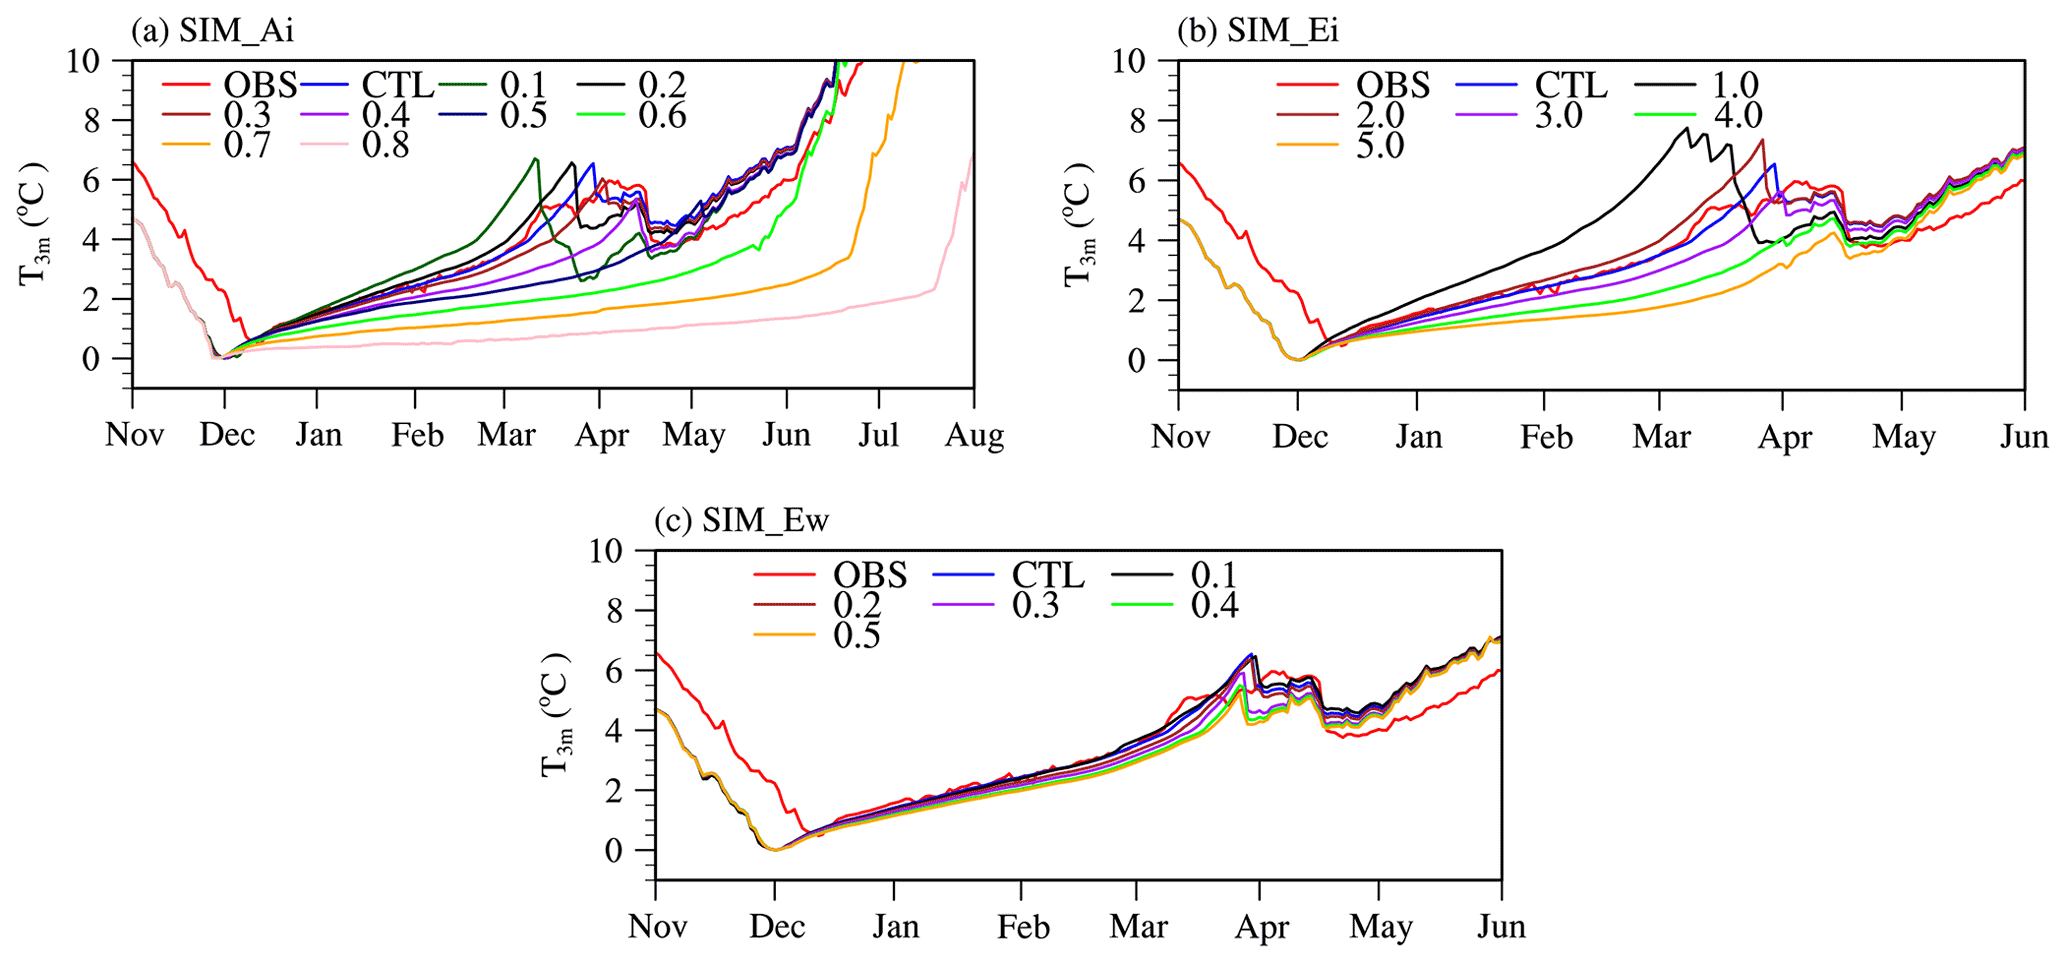
Figure 6Comparison of the 3 m simulated daily average water temperature with the observed value under different (a) Ai, (b) Ei, and (c) Ew.
6.4 Influences of water temperature on lake–atmosphere exchange
The thermal conditions in an ice-covered lake just before ice melting have a significant influence on the air–lake energy exchange. To analyze the effects of lake temperature characteristics on the atmosphere at ice melting, three experiments – SIM_E1, SIM_E2, and SIM_E3 (Table 1) – were set up based on the CTL and the observed lake temperature profile on 25 March 2016, 5 d before ice completely melted (Fig. 7a). The characteristics of the initial water temperature profile were as follows.
-
SIM_E1. The stratification was weak, the first layer temperature was at the melting point, and from the second layer down the water temperature was set as 2 ∘C, corresponding to Bangong Co (Wang et al., 2014).
-
SIM_E2. The lake was strongly stratified. The first layer was at the melting point, and the temperature increased linearly, reaching Tmd at the bottom, corresponding to Valkea-Kotinen lake (Bai et al., 2016).
-
SIM_E3. The temperature of the first layer was at the melting point, the temperature gradually increased with the depth from the second layer to the middle layer, and the temperature in the middle layer increased to Tmd, corresponding to Thrush Lake (Fang and Stefan, 1996).
In CTL, the first layer temperature was equal to the freezing/melting point, and the second layer reached the maximum temperature on 25 March. The temperature became lower with the deeper layer, until the temperature reached Tmd.
With the different initial temperature profiles, the heat storage was different after ice breakup, and the difference persisted for about 2 months (Fig. 7b). In CTL, from 30 to 31 March, when ice melted completely, the lake heat storage ranged from 30893.02 to 30874.51 MJ m−2, and the heat released was 18.51 MJ m−2. In the three experiments, from 1 to 2 April, when ice melted completely, the lake heat storage changed from 30657.51 to 30651.67 MJ m−2 in SIM_E1, from 30781.07 to 30769.91 MJ m−2 in SIM_E2, and from 30833.28 to 30822.42 MJ m−2 in SIM_E3, and the heat release was 5.84, 11.16, and 10.86 MJ m−2, respectively (Fig. 7b).
The heat released was in the form of sensible heat and latent heat, accounting for 0.060 % (CTL), 0.019 % (SIM_E1), 0.036 % (SIM_E2), and 0.035 % (SIM_E3) of the ice-covered heat storage, respectively. As the initial lake temperature profiles were different before the ice completely melted, the ice melted earlier and faster with the higher lake temperature. The lake heat storage increased from 25 March to 24 May, and the heat release rate was different under different circumstances. After late May, the heat balance between the lake and the atmosphere was the same, and so the heat storage basically stayed equal after that.
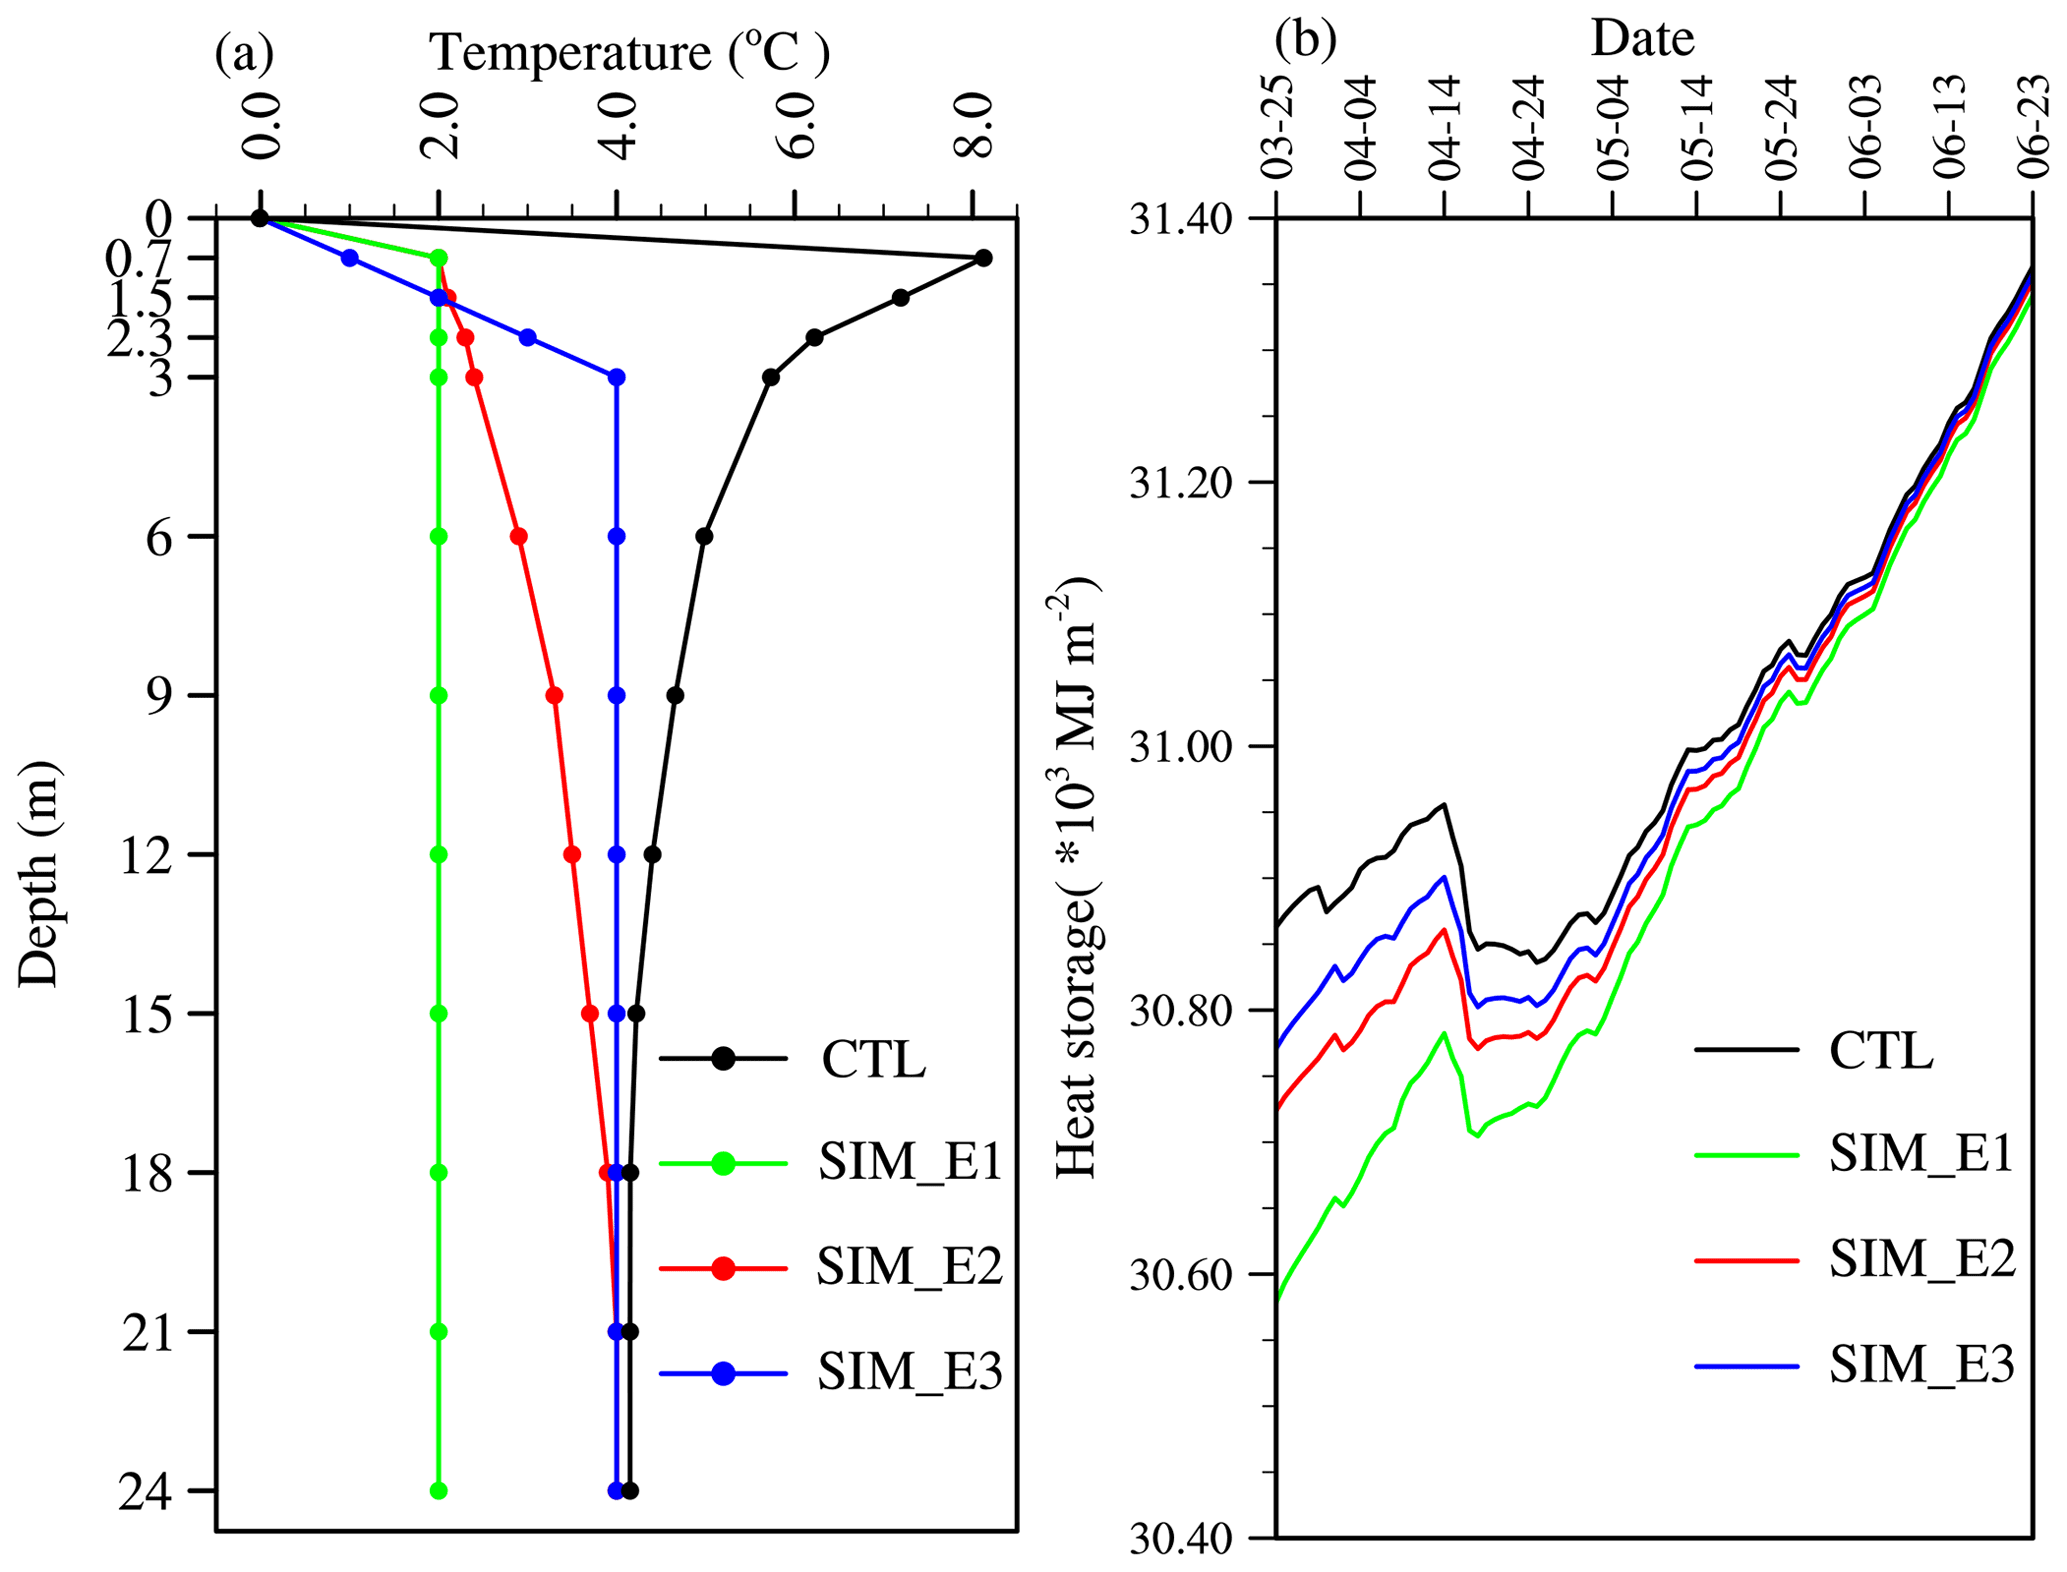
Figure 7(a) The initial water temperature profiles in the model are set on 25 March 2016, and the corresponding daily average (b) lake heat storage is simulated. SIM_E1, SIM_E2, and SIM_E3 are three different sensitivity simulations.
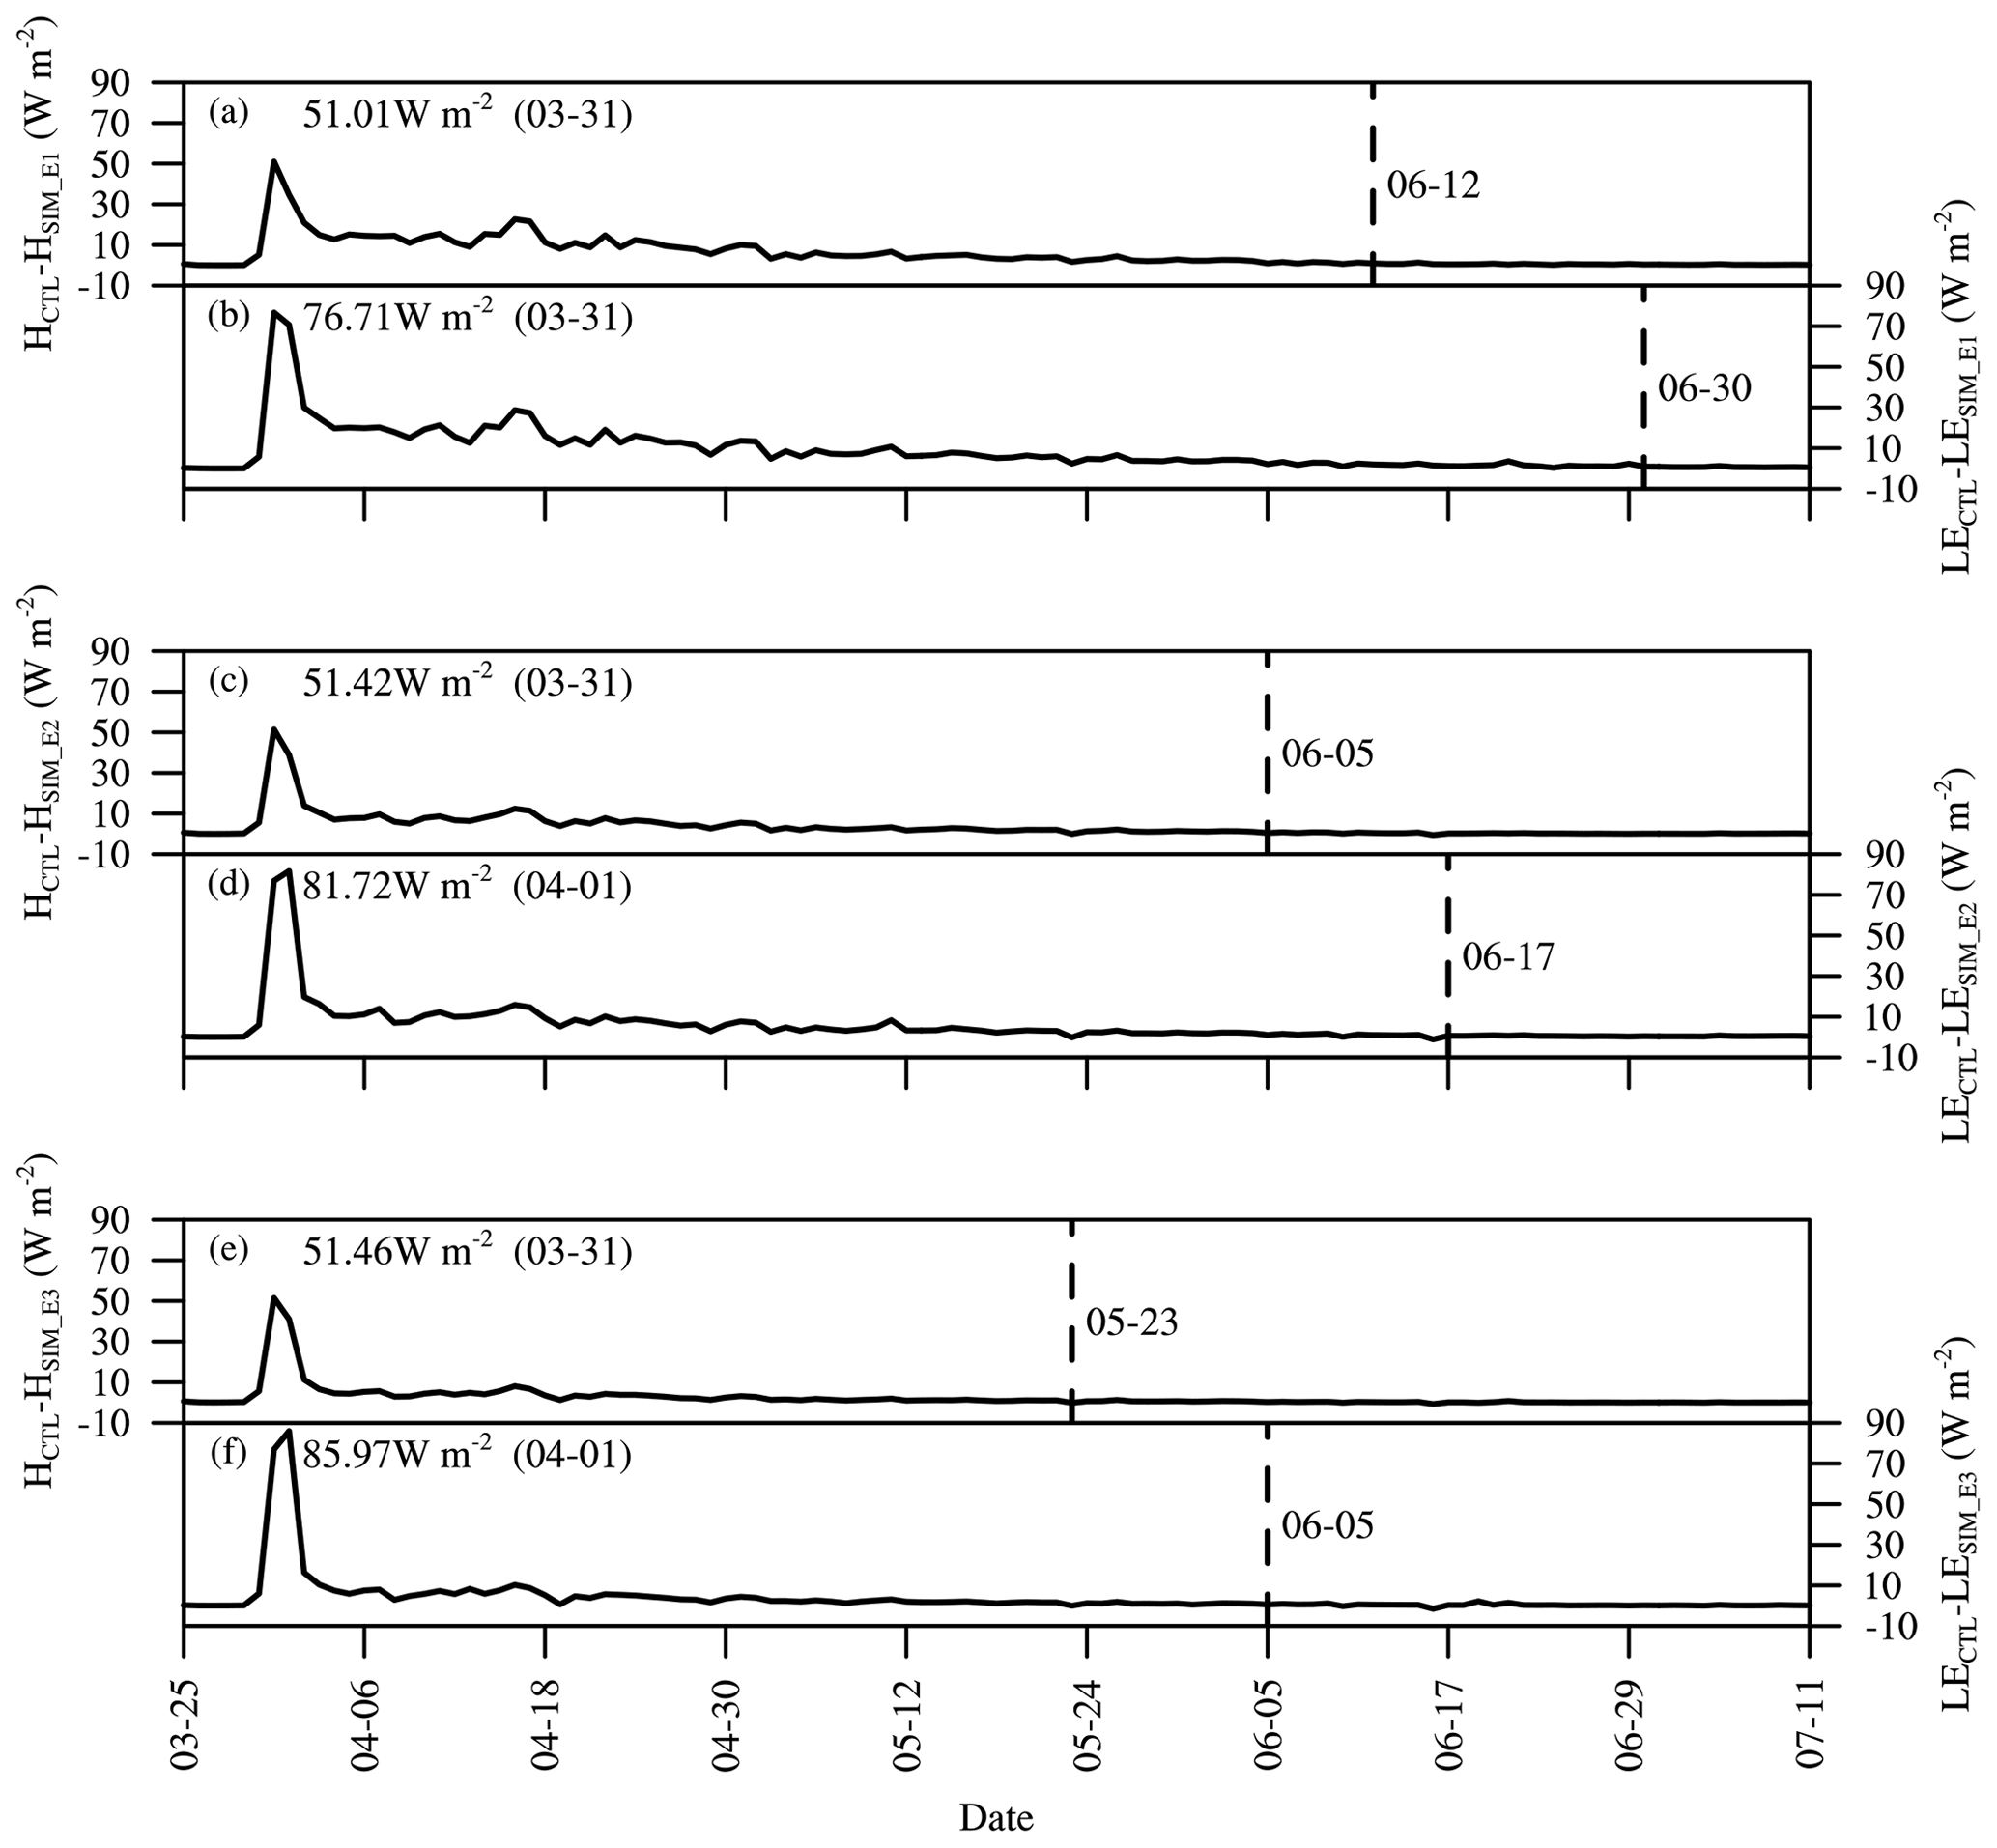
Figure 8The difference in the daily average sensible and latent heat between the CTL and the three sensitivity simulations under the water temperature profiles in SIM_E1, SIM_E2, and SIM_E3.
The lake surface temperature also affected the sensible and latent heat release, whose differences were calculated between CTL and the three experimental simulations (Fig. 8). The influence of different initial water temperature profiles started on 31 March, which is when the ice had melted completely in CTL, and when the sensible and latent differences between CTL and three experimental simulations were less than 0.1 W m−2 for 3 consecutive days, we judged that the influence had ended. The maximum differences in the sensible heat (51.0 W m−2) and latent heat (76.7 W m−2) between SIM_E1 and CTL appeared on 31 March and ended on 12 and 30 June, respectively (Fig. 8a). In SIM_E2 the corresponding numbers were 51.4 W m−2 (31 March to 5 June) for sensible heat and 81.7 W m−2 (1 April to 17 June) for latent heat (Fig. 8b), and in SIM_E3 they were 51.5 W m−2 (31 March to 23 May) for sensible heat and 86.0 W m−2 (1 April to 5 June) for latent heat (Fig. 8c). Compared with the three lake temperature experiments, the heating characteristics of Ngoring Lake made the heat release higher and faster during ice breakup. The duration of heat release difference was from 59 (to 23 May) to 97 (to 30 June) days, and for the latent heat release, the situation lasted about 12–18 d longer than for the sensible heat release.
The analysis demonstrates a significant increase in lake temperature during the ice-covered period in Ngoring, the largest freshwater lake on the Tibetan Plateau (TP), with water temperatures exceeding the freshwater maximum density value Tmd. The heating is governed by strong solar radiation, the factor making alpine lakes on the high-altitude and relatively low-latitude TP differ from the high-latitude and low-altitude northern lakes with similar winter air temperature patterns. The one-dimensional lake model LAKE2.3 successfully captured the major mechanisms of warming and vertical thermal stratification during the ice-covered period. Compared with MODIS surface temperature data, the bias, RMSE, and CC were 1.42, 3.25 ∘C, and 0.96, respectively. The absolute values of bias and RMSE were less than 0.1 and 1 ∘C at 2, 9, 14, and 22 m. The CC of simulated and observed water temperature at 2, 9, and 14 m was as high as 0.98, and the CC of simulated and observed water temperature at 22 m was 0.95.
Sensitivity simulations with perturbed local climate data confirmed the decisive role of subsurface solar radiation in the water temperature rise and demonstrated strong negative feedback with winter precipitation amount. The downward longwave radiation, air temperature, and wind speed had only a minor influence on the water temperature.
The warming rates and, as a result, the duration of the ice-covered period were sensitive to the physical ice properties: ice albedo and light extinction coefficient both reduced the amount of the subsurface solar radiation. An increase in the albedo of ice reduced the rising trend of water temperature and prolonged the ice season. At the critical albedo of 0.6, the lake water warming decreased obviously, and temperature remained stable at no more than 3.98 ∘C. The extinction coefficient of water had just a minor effect on water temperature under the ice.
An important consequence of the under-ice solar heat accumulation consisted of increased sensible and latent heat releases in the subsequent open-water phase. According to the model results, the effects on the surface fluxes of Ngoring Lake lasted for 59–97 d after the ice melt and increased the upward latent and sensible surface heat fluxes up to ∼ 80 and ∼ 50 W m−2, respectively. Herewith, the phenomenon of under-ice solar heating may have a significant effect on the land–atmosphere interaction on regional scales and has to be accounted for in coupled climate models.
The forcing data of the two lakes and the MODIS LST data of Ngoring Lake can be obtained from the website https://nimbus.igb-berlin.de/index.php/s/Moqxgn29DbNFyr8 (Wang, 2022). Lake temperature data of Ngoring Lake in 2015 and 2016 were uploaded to Zenodo by Georgiy Kirillin (https://doi.org/10.5281/zenodo.4750910; Kirillin et al., 2021b). The latest version of LAKE model source code is available at Zenodo: https://doi.org/10.5281/zenodo.6353238 (Stepanenko, 2022).
MW and LW conceived the study. MW performed the modeling with contributions from VS, LW, and ZL. YZ, RN, and LY processed some data. MW, LW, ML, and GK analyzed the model output. MW wrote the paper, with contributions from all co-authors.
The contact author has declared that none of the authors has any competing interests.
Publisher’s note: Copernicus Publications remains neutral with regard to jurisdictional claims in published maps and institutional affiliations.
We are grateful to the field team for their invaluable help in field campaigns. We are grateful to the National Aeronautics and Space Administration (NASA) for providing the MODIS LST product and the European Union's Copernicus Climate Change Service for providing the ERA5-Land data.
This research has been supported by the National Key Research and Development Program of China (grant no. 2019YFE0197600), the National Natural Science Foundation of China (grant no. 42275044), the CAS “Light of West China” program (grant no. E129030101), and the National Natural Science Foundation of China (grant no. 41975081). Victor Stepanenko was supported by the Russian Ministry of Science and Higher Education, agreement no. 075-15-2019-1621. Publisher’s note: the article processing charges for this publication were not paid by a Russian or Belarusian institution.
This paper was edited by Homa Kheyrollah Pour and reviewed by two anonymous referees.
Bai, Q. X., Li, R. L., Li, Z. J., Leppäranta, M., Arvola, L., and Li, M.: Time-series analyses of water temperature and dissolved oxygen concentration in Lake Valkea-Kotinen (Finland) during ice season, Ecol. Inform., 36, 181–189, https://doi.org/10.1016/j.ecoinf.2015.06.009, 2016.
Brown, L. C. and Duguay, C. R.: The fate of lake ice in the North American Arctic, The Cryosphere, 5, 869–892, https://doi.org/10.5194/tc-5-869-2011, 2011.
Cao, X. W., Lu, P., Leppäranta, M., Arvola, L., Huotari, J., Shi, X. H., Li, G. Y., and Li, Z. J.: Solar radiation transfer for an ice-covered lake in the central Asian arid climate zone, Inland Waters, 11, 89–103, https://doi.org/10.1080/20442041.2020.1790274, 2020.
Dai, Y. J., Wei, N., Huang, A. N., Zhu, S. G., Shangguan, W., Yuan, H., Zhang, S. P., and Liu, S. F.: The lake scheme of the Common Land Model and its performance evaluation, Chinese Sci. Bull., 63, 3002–3021, https://doi.org/10.1360/n972018-00609, 2018 (in Chinese).
Dauginis, A. A. and Brown, L. C.: Recent changes in pan-Arctic sea ice, lake ice, and snow-on/off timing, The Cryosphere, 15, 4781–4805, https://doi.org/10.5194/tc-15-4781-2021, 2021.
Dokulil, M. T.: Predicting summer surface water temperatures for large Austrian lakes in 2050 under climate change scenarios, Hydrobiologia, 731, 19–29, https://doi.org/10.1007/s10750-013-1550-5, 2013.
Donlon, C. J., Minnett, P. J., Gentemann, C., Nightingale, T. J., Barton, I. J., Ward, B., and Murray, M. J.: Toward improved validation of satellite sea surface skin temperature measurements for climate research, J. Climate, 15, 353–369, https://doi.org/10.1175/1520-0442(2002)015<0353:TIVOSS>2.0.CO;2, 2002.
Efremova, T., Palshin, N., and Zdorovennov, R.: Long-term characteristics of ice phenology in Karelian lakes, Est. J. Earth Sci., 62, 33–41, https://doi.org/10.3176/earth.2013.04, 2013.
Fang, N., Yang, K., Lazhu, Chen, Y. Y., Wang, J. B., and Zhu, L. P.: Research on the application of WRF-lake Modeling at Nam Co Lake on the Qinghai-Tibetan Plateau, Plateau Meteorology, 36, 610–618, 2017.
Fang, X. and Stefan, H. G.: Long-term lake water temperature and ice cover simulations/measurements, Cold. Reg. Sci. Technol., 24, 289–304, 1996.
Gan, G. J. and Liu, Y. B.: Heat storage effect on evaporation estimates of China's largest freshwater lake, J. Geophys. Res.-Atmos., 125, e2019JD032334, https://doi.org/10.1029/2019jd032334, 2020.
Grant, L.,Vanderkelen, I., Gudmundsson, L., Tan, Z., Perroud, M., Stepanenko, V., Debolskiy, A. V., Droppers, B., Janssen, A. B., Woolway, R. I., Choulga, M., Balsamo, G., Kirillin, G., Schewe, J., Zhao, F., Valle, I. V., Golub, M., Pierson, D., Marcé, R., Seneviratne, S. I., and Thiery, W.: Attribution of global lake systems change to anthropogenic forcing, Nat. Geosci., 14, 849–854, https://doi.org/10.1038/s41561-021-00833-x, 2021.
Guseva, S., Stepanenko, V., Shurpali, N., Biasi, C., Marushchak, M. E., and Lind, S. E.: Numerical simulation of methane emission from Subarctic Lake in Komi Republic (Russia), Geography, Environment, Sustainability, 9, 58–74, https://doi.org/10.15356/2071-9388_02v09_2016_05, 2016.
Hardenbicker, P., Viergutz, C., Becker, A., Kirchesch, V., Nilson, E., and Fischer, H.: Water temperature increases in the river Rhine in response to climate change, Reg. Environ. Change, 17, 299–308, https://doi.org/10.1007/s10113-016-1006-3, 2016.
Heiskanen, J. J., Mammarella, I., Ojala, A., Stepanenko, V., Erkkilä, K. M., Miettinen, H., Sandström, H., Eugster, W., Leppäranta, M., Järvinen, H., Vesala, T., and Nordbo, A.: Effects of water clarity on lake stratification and lake-atmosphere heat exchange, J. Geophys. Res.-Atmos., 120, 7412–7428, https://doi.org/10.1002/2014jd022938, 2015.
Hersbach, H., Bell, B., Berrisford, P., Hirahara, S., Horányi, A., Muñoz-Sabater, J., Nicolas, J., Peubey, C., Radu, R., Schepers, D., Simmons, A., Soci, C., Abdalla, S., Abellan, X., Balsamo, G., Bechtold, P., Biavati, G., Bidlot, J., Bonavita, M., Chiara, G., Dahlgren, P., Dee, D., Diamantakis, M., Dragani, R., Flemming, J., Forbes, R., Fuentes, M., Geer, A., Haimberger, L., Healy, S., Hogan, R. J., Hólm, E., Janisková, M., Keeley, S., Laloyaux, P., Lopez, P., Lupu, C., Radnoti, G., Rosnay, P., Rozum, I., Vamborg, F., Villaume, S., and Thépaut, J.-N.: The ERA5 global reanalysis, Q. J. Roy. Meteor. Soc., 146, 1999–2049, https://doi.org/10.1002/qj.3803, 2020.
Huang, A. N., Lazhu, Wang, J. B., Dai, Y. J., Yang, K., Wei, N., Wen, L. J., Wu, Y., Zhu, X. Y., Zhang, X. D., and Cai, S. X.: Evaluating and improving the performance of three 1-D lake models in a large deep lake of the central Tibetan Plateau, J. Geophys. Res.-Atmos., 124, 3143–3167, https://doi.org/10.1029/2018JD029610, 2019.
Kirillin, G. B., Leppäranta, M., Terzhevik, A., Granin, N., Bernhardt, J., Engelhardt, C., Efremova, T., Golosov, S., Palshin, N., Sherstyankin, P., Zdorovennova, G., and Zdorovennov, R: Physics of seasonally ice-covered lakes: a review, Aquat. Sci., 74, 659–682, https://doi.org/10.1007/s00027-012-0279-y, 2012.
Kirillin, G. B., Forrest, A. L., Graves, K. E., Fischer, A., Engelhardt, C., and Laval, B. E.: Axisymmetric circulation driven by marginal heating in ice-covered lakes, Geophys. Res. Lett., 42, 2893–2900, https://doi.org/10.1002/2014gl062180, 2015.
Kirillin, G., Wen, L., and Shatwell, T.: Seasonal thermal regime and climatic trends in lakes of the Tibetan highlands, Hydrol. Earth Syst. Sci., 21, 1895–1909, https://doi.org/10.5194/hess-21-1895-2017, 2017.
Kirillin, G., Aslamov, I., Leppäranta, M., and Lindgren, E.: Turbulent mixing and heat fluxes under lake ice: the role of seiche oscillations, Hydrol. Earth Syst. Sci., 22, 6493–6504, https://doi.org/10.5194/hess-22-6493-2018, 2018.
Kirillin, G., Aslamov, I., Kozlov, V., Zdorovennov, R., and Granin, N.: Turbulence in the stratified boundary layer under ice: observations from Lake Baikal and a new similarity model, Hydrol. Earth Syst. Sci., 24, 1691–1708, https://doi.org/10.5194/hess-24-1691-2020, 2020.
Kirillin, G. B., Shatwell, T., and Wen, L. J.: Ice-covered lakes of Tibetan Plateau as solar heat collectors, Geophys. Res. Lett., 48, e2021GL093429, https://doi.org/10.1029/2021gl093429, 2021a.
Kirillin, G., Shatwell, T., and Wen, L.: Data on under-ice temperatures and solar radiation in Lake Ngoring (Qinghai-Tibet), Zenodo [data set], https://doi.org/10.5281/zenodo.4750910, 2021b.
Lazhu, Yang, K., Wang, J. B., Lei, Y. B., Chen, Y. Y., Zhu, L. P., Ding, B. H., and Qin, J.: Quantifying evaporation and its decadal change for Lake Nam Co, central Tibetan Plateau, J. Geophys. Res., 121, 7578–7591, https://doi.org/10.1002/2015jd024523, 2016.
Lazhu, Yang, K., Hou, J. Z., Wang, J. B., Lei, Y. B., Zhu, L. P., Chen, Y. Y., Wang, M. D., and He, X. G.: A new finding on the prevalence of rapid water warming durinig lake ice melting on the Tibetan Plateau, Sci. Bull., 66, 2358–2361, https://doi.org/10.1016/j.scib.2021.07.022, 2021.
Lei, R. B., Leppäranta, M., Erm, A., Jaatinen, E., and Pärn, O.: Field investigations of apparent optical properties of ice cover in Finnish and Estonian lakes in winter 2009, Est. J. Earth Sci., 60, 50–64, https://doi.org/10.3176/earth.2011.1.05, 2011.
Leppäranta, M.: Freezing of lakes and the evolution of their ice cover, Springer, Berlin, Heidelberg, https://doi.org/10.1007/978-3-642-29081-7, 2015.
Leppäranta, M., Lindgren, E., and Shirasawa, K.: The heat budget of Lake Kilpisjärvi in the Arctic tundra, Hydrol. Res., 48, 969–980, https://doi.org/10.2166/nh.2016.171, 2017.
Leppäranta, M., Lindgren, E., Wen, L. J., and Kirillin, G.: Ice cover decay and heat balance in Lake Kilpisjärvi in Arctic tundra, J. Limnol., 78, 163–175, https://doi.org/10.4081/jlimnol.2019.1879, 2019.
Li, G. C., Liu, Z. G., Zhang, M., Li, J., Pi, K., Xiong, Y., and Xu, J.: A preliminary study of effects of warming on the nutrients dynamic in sediment of hypereutrophic shallow lake, Acta Ecologica Sinica, 35, 4016–4025, https://doi.org/10.5846/stxb201309102244, 2015.
Li, Z. G., Lyu, S. H., Ao, Y. H., Wen, L. J., Zhao, L., and Wang, S. Y.: Long-term energy flux and radiation balance observations over Lake Ngoring, Tibetan Plateau, Atmos. Res., 155, 13–25, https://doi.org/10.1016/j.atmosres.2014.11.019, 2015.
Li, Z. G., Ao, Y. H., Lyu, S. H., Lang, J. H., Wen, L. J., Stepanenko, V., Meng, X. H., and Zhao, L.: Investigation of the ice surface albedo in the Tibetan Plateau lakes based on the field observation and MODIS products, J. Glaciol., 64, 506–516, https://doi.org/10.1017/jog.2018.35, 2018.
Li, Z. G., Lyu, S. H., Wen, L. J., Zhao, L., Ao, Y. H., and Meng, X. H.: Study of freeze-thaw cycle and key radiation transfer parameters in a Tibetan Plateau lake using LAKE2.0 model and field observations, J. Glaciol., 67, 91–106, https://doi.org/10.1017/jog.2020.87, 2020.
Muñoz-Sabater, J., Dutra, E., Agustí-Panareda, A., Albergel, C., Arduini, G., Balsamo, G., Boussetta, S., Choulga, M., Harrigan, S., Hersbach, H., Martens, B., Miralles, D. G., Piles, M., Rodríguez-Fernández, N. J., Zsoter, E., Buontempo, C., and Thépaut, J.-N.: ERA5-Land: a state-of-the-art global reanalysis dataset for land applications, Earth Syst. Sci. Data, 13, 4349–4383, https://doi.org/10.5194/essd-13-4349-2021, 2021.
Nordbo, A., Launiainen, S., Mammarella, I., Leppäranta, M., Huotari, J., Ojala, A., and Vesala, T.: Long-term energy flux measurements and energy balance over a small boreal lake using eddy covariance technique, J. Geophys. Res.-Atmos., 116, D02119, https://doi.org/10.1029/2010jd014542, 2011.
Ramp, C., Delarue, J., Palsboll, P. J., Sears, R., and Hammond, P. S.: Adapting to a warmer ocean–seasonal shift of baleen whale movements over three decades, PLoS One, 10, e0121374, https://doi.org/10.1371/journal.pone.0121374, 2015.
Rösner, R. R., Müller-Navarra, D. C., and Zorita, E.: Trend analysis of weekly temperatures and oxygen concentrations during summer stratification in Lake Plußsee: A long-term study, Limnol. Oceanogr., 57, 1479–1491, https://doi.org/10.4319/lo.2012.57.5.1479, 2012.
Shang, Y. X., Song, K. S., Jiang, P., Ma, J. H., Wen, Z. D., and Zhao, Y.: Optical absorption properties and diffuse attenuation of photosynthetic active radiation for inland waters across the Tibetan Plateau, Journal of Lake Sciences, 30, 802–811, https://doi.org/10.18307/2018.0322, 2018.
Sharma, S., Blagrave, K., Magnuson, J. J., O'Reilly, C. M., Oliver, S., Batt, R. D., Magee, M. R., Winslow, L., and Woolway, R. I.: Widespread loss of lake ice around the Northern Hemisphere in a warming world, Nat. Clim. Change, 9, 227–231, https://doi.org/10.1038/s41558-018-0393-5, 2019.
Sharma, S., Meyer, M. F., Culpepper, J., Yang, X., Hampton, S., Berger, S. A., Brousil, M. R., Fradkin, S. C., Higgins, S. N., Jankowski, K. J., Kirillin, G., Smits, A. P., Whitaker, E. C., Yousef, F., and Zhang, S.: Integrating perspectives to understand lake ice dynamics in a changing world, J. Geophys. Res.-Biogeo., 125, e2020JG005799, https://doi.org/10.1029/2020jg005799, 2020.
Shen, D. F., Li, S. J., Jiang, Y. J., and Chen, W.: Water environment characteristics and regional climate response of typical lakes in Yellow River headwater area, J. Arid Environ., 26, 91–97, https://doi.org/10.13448/j.cnki.jalre.2012.07.030, 2012.
Song, X. Y., Wen, L. J., Li, M. S., Du, J., Su, D. S., Yin, S. C., and Lv, Z.: Comparative study on applicability of different lake models to typical lakes in Qinghai-Tibetan Plateau, Plateau Meteorology, 39, 213–225, 2020.
Stepanenko, V.: LAKE (2.0), Zenodo [data set], https://doi.org/10.5281/zenodo.6353238, 2022.
Stepanenko, V. and Lykossov, V. N.: Numerical modeling of heat and moisture transfer processes in a system lake soil, Russ. Meteorol. Hydrol., 3, 95–104, 2005.
Stepanenko, V., Mammarella, I., Ojala, A., Miettinen, H., Lykosov, V., and Vesala, T.: LAKE 2.0: a model for temperature, methane, carbon dioxide and oxygen dynamics in lakes, Geosci. Model Dev., 9, 1977–2006, https://doi.org/10.5194/gmd-9-1977-2016, 2016.
Stepanenko, V., Machul'skaya, E. E., Glagolev, M. V., and Lykossov, V. N.: Numerical modeling of methane emissions from lakes in the permafrost zone, Izv. Atmos. Ocean. Phy.+, 47, 252–264, https://doi.org/10.1134/s0001433811020113, 2011.
Stepanenko, V., Repina, I. A., Ganbat, G., and Davaa, G.: Numerical simulation of ice cover of saline lakes, Izv. Atmos. Ocean. Phy.+, 55, 129–138, https://doi.org/10.1134/s0001433819010092, 2019.
Tavares, M., Cunha, A., Motta-Marques, D., Ruhoff, A., Cavalcanti, J., Fragoso, C., Martín Bravo, J., Munar, A., Fan, F., and Rodrigues, L.: Comparison of methods to estimate Lake-Surface-Water temperature using Landsat 7 ETM+ and MODIS imagery: Case study of a large shallow subtropical lake in Southern Brazil, Water, 11, 168, https://doi.org/10.3390/w11010168, 2019.
Tolonen, A.: Application of a bioenergetics model for analysis of growth and food consumption of subarctic whitefish Coregonus lavaretus (L.) in Lake Kilpisjärvi, Finnish Lapland, Hydrobiologia, 390, 153–169, https://doi.org/10.1023/A:1003525008870, 1998.
Wan, W., Long, D., Hong, Y., Ma, Y. Z., Yuan, Y., Xiao, P. F., Duan, H. T., Han, Z. Y., and Gu, X. F.: A lake data set for the Tibetan Plateau from the 1960s, 2005, and 2014, Sci. Data., 3, 160039, https://doi.org/10.1038/sdata.2016.39, 2016.
Wan, Z., Zhang, Y., Zhang, Q., and Li, Z. L.: Quality assessment and validation of the MODIS global land surface temperature, Int. J. Remote Sens., 25, 261–274, https://doi.org/10.1080/0143116031000116417, 2004.
Wang, M. D., Hou, J. Z., and Lei, Y. B.: Classification of Tibetan lakes based on variations in seasonal lake water temperature, Chinese Sci. Bull., 59, 4847–4855, https://doi.org/10.1007/s11434-014-0588-8, 2014.
Wang, M. X.: TC-data-Mechanisms and effects of under-ice warming water in Ngoring Lake of Qinghai-Tibet Plateau, IGB IceTMP [data set], https://nimbus.igb-berlin.de/index.php/s/Moqxgn29DbNFyr8, last access: 27 August 2022.
Wang, M. X., Wen, L. J., Li, Z. G., and Su, D. S.: Study on the warming characteristics during the ice-covered period of Ngoring Lake in the Qinghai-Xizang Plateau, Plateau Meteorology, 40, 965–976, 2021.
Weitere, M., Vohmann, A., Schulz, N., Linn, C., Dietrich, D., and Arndt, H.: Linking environmental warming to the fitness of the invasive clamCorbicula fluminea, Global Change Biol., 15, 2838–2851, https://doi.org/10.1111/j.1365-2486.2009.01925.x, 2010.
Wen, L. J., Lyu, S. H., Kirillin, G., Li, Z. G., and Zhao, L.: Air–lake boundary layer and performance of a simple lake parameterization scheme over the Tibetan highlands, Tellus A, 68, 31091, https://doi.org/10.3402/tellusa.v68.31091, 2016.
Wen, L. J., Wang, C., Li, Z. G., Zhao, L., Lyu, S. H., and Chen, S. Q.: Thermal responses of the largest freshwater lake in the Tibetan Plateau and its nearby saline lake to climate change, Remote Sens., 14, 1774, https://doi.org/10.3390/rs14081774, 2022.
Wu, Y., Huang, A. N., Lu, Y. Y., Lazhu, Yang, X. Y., Qiu, B., Zhang, Z. Q., and Zhang, X. D.: Numerical study of the thermal structure and circulation in a large and deep dimictic lake over Tibetan Plateau, J. Geophys. Res.-Oceans, 126, e2021JC017517, https://doi.org/10.1029/2021jc017517, 2021.
Yang, B., Wells, M. G., McMeans, B. C., Dugan, H. A., Rusak, J. A., Weyhenmeyer, G. A., Brentrup, J. A., Hrycik, A. R., Laas, A., Pilla, R. M., Austin, J. A., Blanchfield, P. J., Carey, C. C., Guzzo, M. M., Lottig, N. R., MacKay, M. D., Middel, T. A., Pierson, D. C., Wang, J., and Young, J. D.: A new thermal categorization of ice-covered lakes, Geophys. Res. Lett., 48, e2020GL091374, https://doi.org/10.1029/2020gl091374, 2021.
Zhang, G. Q., Luo, W., Chen, W. F., and Zheng, G. X.: A robust but variable lake expansion on the Tibetan Plateau, Sci. Bull., 64, 1306–1309, https://doi.org/10.1016/j.scib.2019.07.018, 2019.
Zolfaghari, K., Duguay, C. R., and Kheyrollah Pour, H.: Satellite-derived light extinction coefficient and its impact on thermal structure simulations in a 1-D lake model, Hydrol. Earth Syst. Sci., 21, 377–391, https://doi.org/10.5194/hess-21-377-2017, 2017.
- Abstract
- Introduction
- Study area and data
- Methods
- Characteristic analysis of water temperature and local climate in two lakes
- Simulation setup
- Simulation results
- Conclusions
- Data availability
- Author contributions
- Competing interests
- Disclaimer
- Acknowledgements
- Financial support
- Review statement
- References