the Creative Commons Attribution 4.0 License.
the Creative Commons Attribution 4.0 License.
 | 08 Sep 2022
Molecular biomarkers in Batagay megaslump permafrost deposits reveal clear differences in organic matter preservation between glacial and interglacial periods
Loeka L. Jongejans
Kai Mangelsdorf
Cornelia Karger
Thomas Opel
Sebastian Wetterich
Jérémy Courtin
Hanno Meyer
Alexander I. Kizyakov
Guido Grosse
Andrei G. Shepelev
Igor I. Syromyatnikov
Alexander N. Fedorov
The Batagay megaslump, a permafrost thaw feature in north-eastern Siberia, provides access to ancient permafrost up to ∼650 kyr old. We aimed to assess the permafrost-locked organic matter (OM) quality and to deduce palaeo-environmental information on glacial–interglacial timescales. We sampled five stratigraphic units exposed on the 55 m high slump headwall and analysed lipid biomarkers (alkanes, fatty acids and alcohols). Our findings revealed similar biogeochemical signatures for the glacial periods: the lower ice complex (Marine Isotope Stage (MIS) 16 or earlier), the lower sand unit (sometime between MIS 16–6) and the upper ice complex (MIS 4–2). The OM in these units has a terrestrial character, and microbial activity was likely limited. Contrarily, the n-alkane and fatty acid distributions differed for the units from interglacial periods: the woody layer (MIS 5), separating the lower sand unit and the upper ice complex, and the Holocene cover (MIS 1), on top of the upper ice complex. The woody layer, marking a permafrost degradation disconformity, contained markers of terrestrial origin (sterols) and high microbial decomposition (iso- and anteiso-fatty acids). In the Holocene cover, biomarkers pointed to wet depositional conditions and we identified branched and cyclic alkanes, which are likely of microbial origin. Higher OM decomposition characterised the interglacial periods. As climate warming will continue permafrost degradation in the Batagay megaslump and in other areas, large amounts of deeply buried ancient OM with variable composition and degradability are mobilised, likely significantly enhancing greenhouse gas emissions from permafrost regions.
- Article
(9558 KB) - Full-text XML
-
Supplement
(1312 KB) - BibTeX
- EndNote


Rapid warming of the terrestrial Arctic leads to widespread permafrost thaw. This can mobilise organic matter (OM) and results in greenhouse gas release, which contributes to the permafrost–carbon climate feedback (Schuur et al., 2015). The global permafrost region contains roughly half of the world's soil carbon (3350 Gt) and, in addition, a large deep permafrost carbon pool (>3 m), which is often not accounted for and whose amount is uncertain (∼500 Gt) (Strauss et al., 2021). While it was estimated that gradual permafrost thaw might contribute up to 208 Gt carbon into the atmosphere until 2300 (McGuire et al., 2018), abrupt permafrost thaw processes, such as the formation of retrogressive thaw slumps and thermokarst development, could contribute an additional 80±19 Gt of carbon released into the atmosphere (Turetsky et al., 2020). Abrupt thaw processes occur on local to regional scales and are difficult to capture, which is why they have not yet been implemented in climate models.
Retrogressive thaw slumps are a result of slope failure following the thaw of ice-rich permafrost. They develop rapidly and can displace large quantities of ice and/or water, sediments and OM (Lewkowicz, 1987; Lantuit and Pollard, 2005; Tanski et al., 2017). Thaw slumps typically consist of a nearly vertical headwall, a slump floor and a lobe and are often situated along rivers or coasts. Triggers for the formation include lateral or thermal erosion by water (Kokelj et al., 2013); active layer detachment following heavy rainfall (Lacelle et al., 2010); and human activity such as road construction, mining or deforestation. Once initiated, thaw slumps can develop very rapidly due to the constant removal of thawed material by meltwater streams, changes in the vegetation and snow cover, and the albedo leading to further intense permafrost degradation.
The Batagay megaslump in East Siberia is the largest known retrogressive thaw slump on Earth (roughly 1.8 km long and 0.9 km wide in 2019) that developed over the last ∼5 decades (Kunitsky et al., 2013). The megaslump provides access to ancient permafrost deposits, with stratigraphical discordances, including the second-oldest directly dated permafrost in the Northern Hemisphere (Murton et al., 2022). This makes the large slump headwall an ideal target for palaeo-environmental studies, including cryostratigraphy, sedimentology and chronology (Ashastina et al., 2017; Murton et al., 2017, 2022); ground ice stable isotopes (Opel et al., 2019; Vasil'chuk et al., 2020); pollen and plant macro-remains (Ashastina et al., 2018) and ancient DNA (Courtin et al., 2022).
The study of lipid biomarkers has been proven useful in previous work to characterise permafrost OM and carbon cycling as well as tracing permafrost thaw (Zech et al., 2010; Strauss et al., 2015; Elvert et al., 2016; Stapel et al., 2016; Jongejans et al., 2018, 2020; Martens et al., 2020; Bröder et al., 2021; Yao et al., 2021). With the present study we aim (1) to explore the source and preservation of biomarkers in permafrost on geologic timescales during several glacial and interglacial periods and (2) to deduce the past floral and microbial sources of the still preserved OM in order to characterise palaeo-environments of OM deposition. To our knowledge, we present the first OM signatures, i.e. biomarkers preserved in ancient permafrost since about 650 ka.
The Batagay megaslump (67.58∘ N, 134.77∘ E) close to the village of Batagay is located in the Yana Uplands, part of the Yana-Oymyakon mountain region (interior Yakutia; Fig. 1a). This region is characterised by the most continental climatic conditions of the Northern Hemisphere, manifesting in an extreme climate with a mean winter (December to February) temperature of −40.0 ∘C, a mean summer (July to August) temperature of 13.7 ∘C and a mean annual temperature of −12.4 ∘C (period 1988–2017) (Murton et al., 2022). For the same time period, mean annual precipitation was 203 mm, with mean summer precipitation of 106 mm. Since the mid-20th century, both temperature and precipitation have significantly increased. The permafrost in this region is continuous and ∼200 to 500 m thick with mean annual ground temperatures of −8.0 to −5.5 ∘C (Murton et al., 2022). The seasonally thawed uppermost (active) layer is between 0.2 and 1.2 m thick, depending on vegetation type (Murton et al., 2022). The modern vegetation is dominated by open larch forest (Larix gmelinii), and Siberian dwarf pines (Pinus pumila) and birch trees (Betula exilis, B. divaricata and sparse B. pendula) are common. The ground is covered by a thick layer of lichens and mosses, and almost no grasses and herbs are present (Ashastina et al., 2018; Murton et al., 2022).
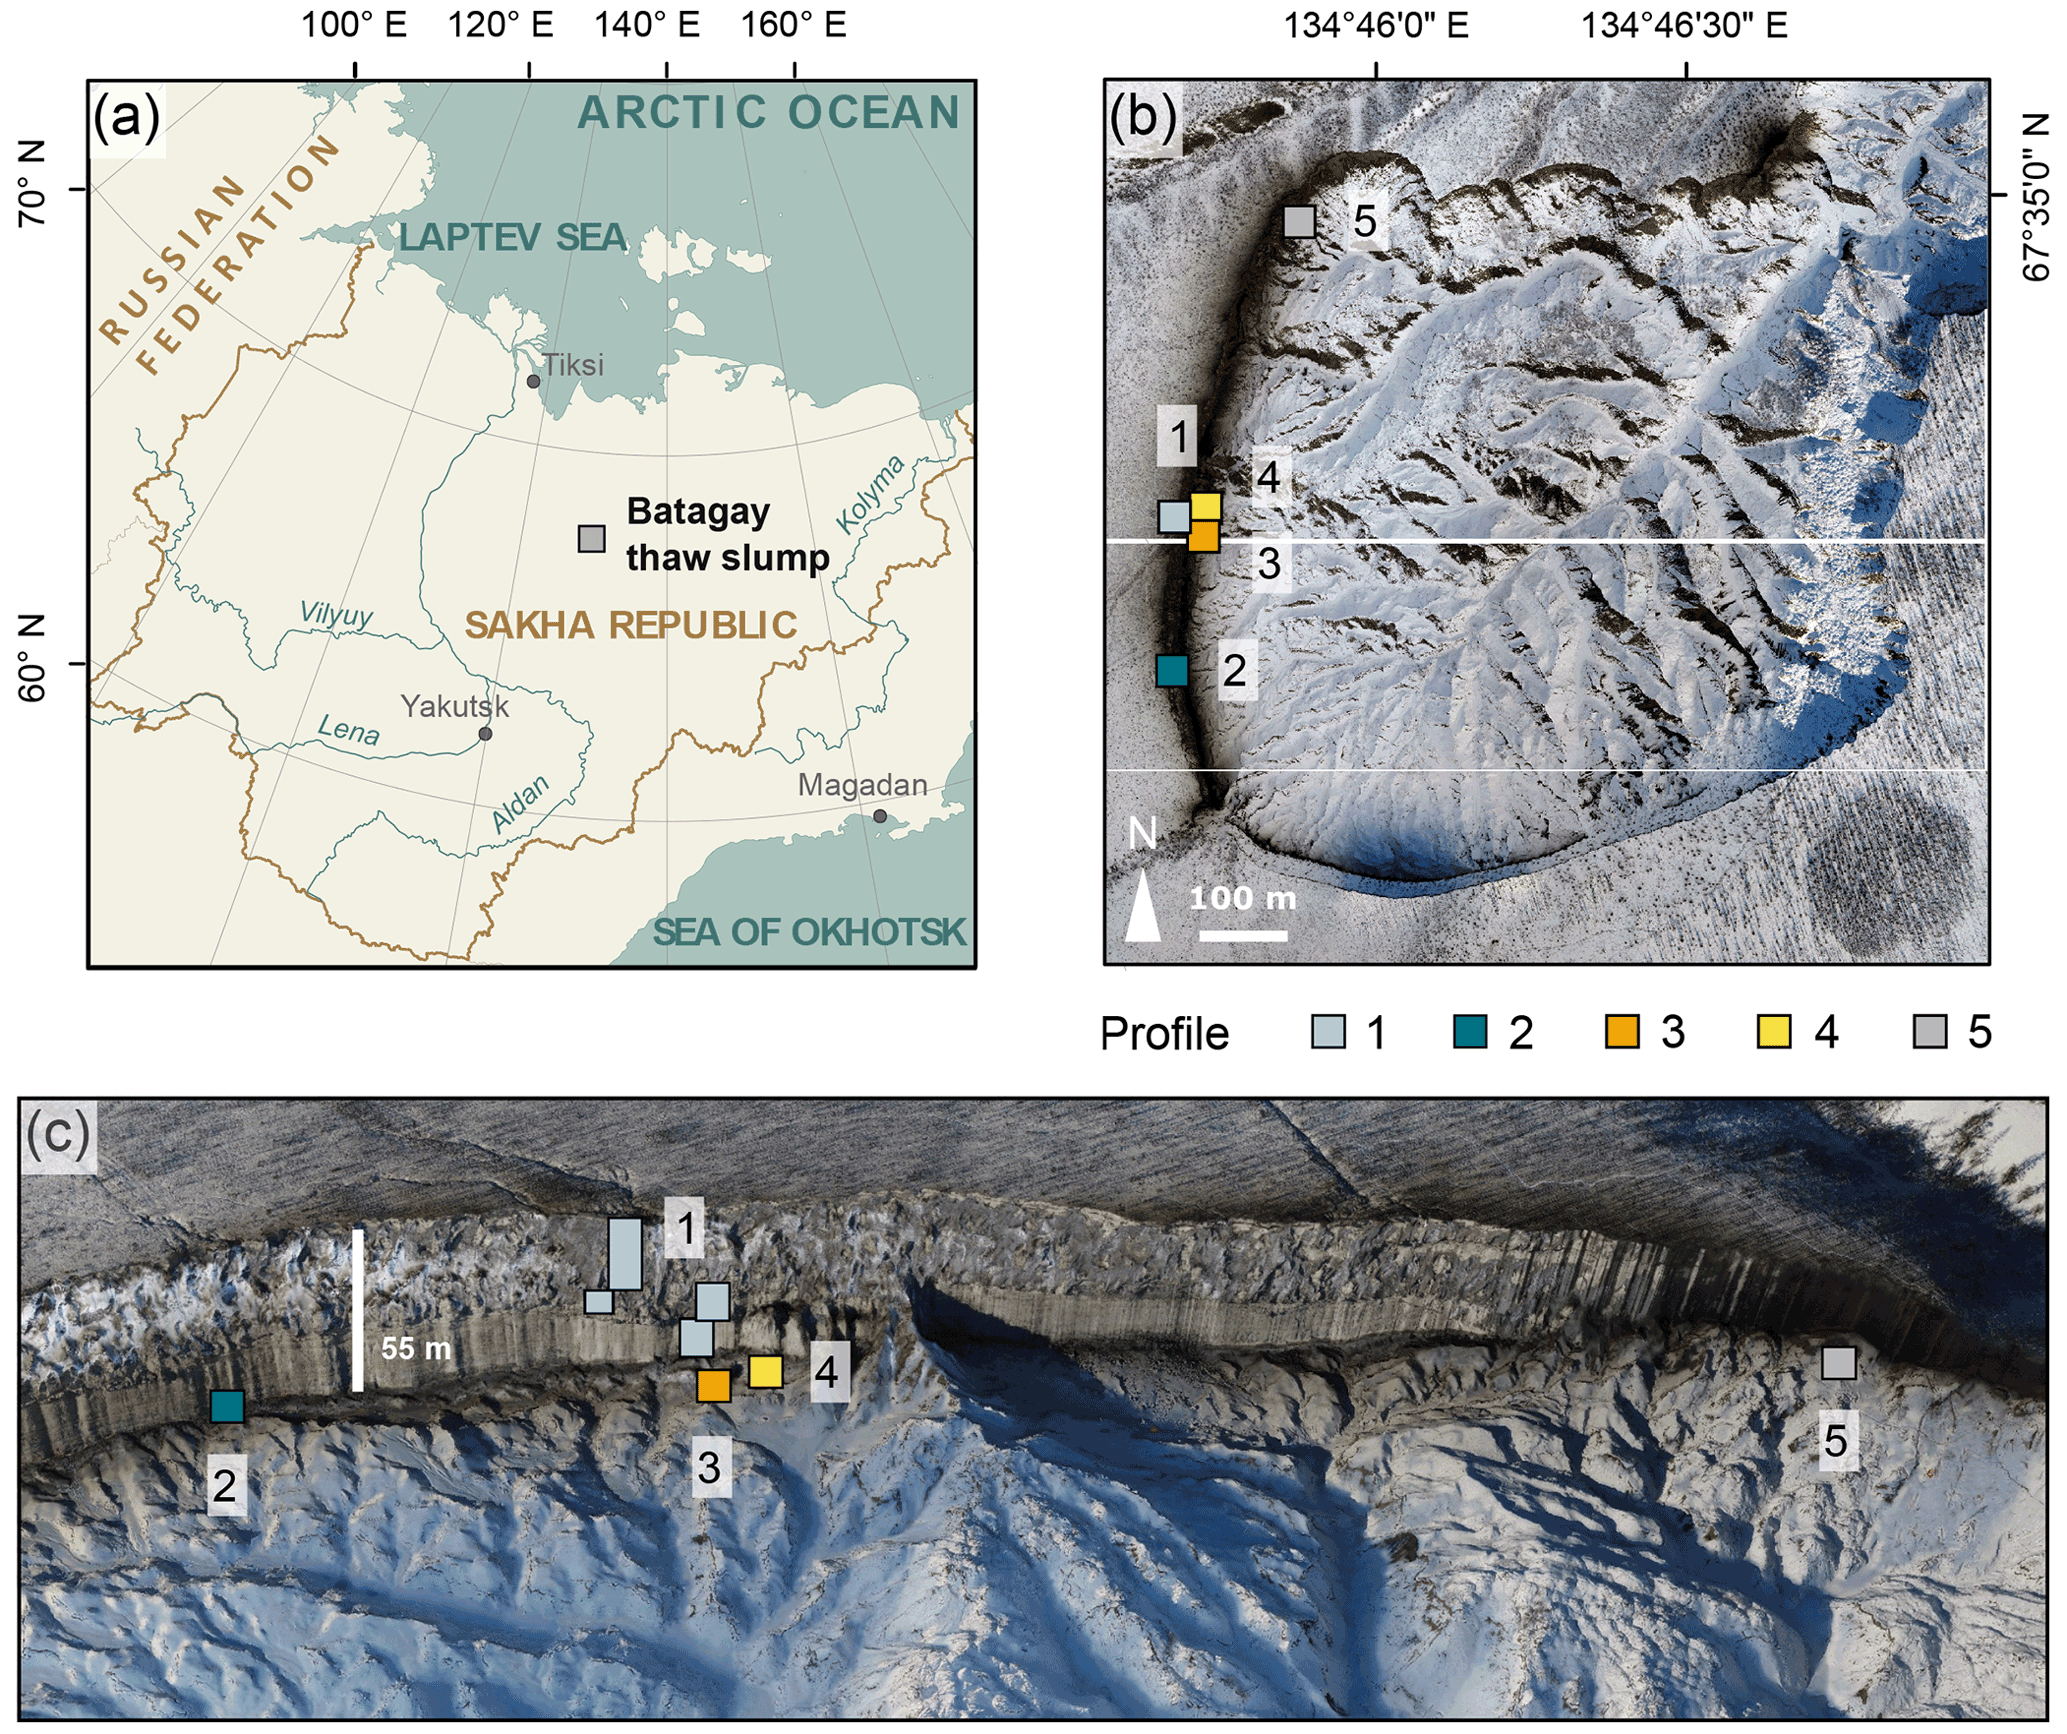
Figure 1Location of the Batagay thaw slump. (a) Overview of Yakutia (Republic of Sakha) and location of the Batagay thaw slump (grey square); (b) aerial view of slump with sampling locations profiles 1 to 5; (c) front view of the east-facing headwall. Sources: (a) Esri, (b, c) photos from the spring expedition to Batagay in 2019.
The Batagay megaslump is located on an east-facing hillslope and has developed after anthropogenic disturbance of the protective vegetation cover in the middle of the 20th century (Kunitsky et al., 2013; Savvinov et al., 2018). A gully formed in the 1960s that grew progressively wider and deeper and developed into a retrogressive thaw slump. In spring 2019, the slump diameter, which was determined using a UAV survey (Jongejans et al., 2021b), was about 890 m. Grow rates are fast with spatially and temporally varying headwall retreat rates of 7 to up to 30 m yr−1 (Kunitsky et al., 2013; Günther et al., 2015; Vadakkedath et al., 2020). The ∼55 m high headwall and the slopes of the slump provide access to stratigraphically discontinuous ancient permafrost deposits since the Middle Pleistocene (Murton et al., 2022). The headwall consists of six stratigraphical units from the bottom to the top: the lower ice complex (Marine Isotope Stage (MIS) 16 or earlier), the lower sand unit (sometime between MIS 16 and 6); the woody layer (MIS 5), which was present as lenses up to 3 m thick; the upper ice complex (MIS 4–2), also called Yedoma; the upper sand unit (MIS 3–2); and the Holocene cover on top (MIS 1) (Ashastina et al., 2017; Murton et al., 2022). It should be noted that there are large hiatuses (marked by erosional surfaces below and above the lower sand unit) and dating uncertainties in the chronostratigraphy (Murton et al., 2022). While the ancient permafrost buried deep in the ground has survived multiple interglacials, the region has been subject to repeated permafrost thaw and sediment removal by thermo-erosional processes, amplified in recent decades.
3.1 Sample collection
The slump headwall was sampled during a spring expedition to Batagay in March and April 2019 (Fig. 1b and c) (Jongejans et al., 2021b). The samples were taken by rappelling with a rope from the top of the slump headwall to each sample location and then using a hole saw (diameter 57 mm, 40 mm deep) mounted on a handheld power drill to sample small horizontal cores of frozen sediments exposed in the headwall. Sample depth is given in metres below the surface (m b.s.) (Fig. S1 in the Supplement). At each sampled depth, three cores were taken next to each other for biomarker, sedimentological and ancient DNA analyses. Sampling resolution was 0.5 m in the top 10 m and 1 m below. Due to the presence of large ice wedges, profile 1 consisted of four sub-profiles (Figs. 1c and A1). Using a hammer, axe and chainsaw, more profiles were sampled at the lower part of the headwall from the slump bottom (profile 2; Fig. A2), as well as at two large permafrost blocks at the slump bottom that had fallen from the headwall (profiles 3 and 4; Figs. A3 and A4, respectively), and at a baidzherakh (thermokarst mound) in the north of the slump (profile 5) (Figs. 1b and c and A5). All samples were stored in sterilised glass jars and kept frozen until laboratory analyses at Alfred Wegener Institute (AWI) Potsdam. A total of 30 samples (19 from profile 1; 5 from profile 2; and 2 each from profiles 3, 4 and 5) were selected for biomarker analysis. With these profiles, we covered five of the six stratigraphical units (all but the upper sand unit, which is not exposed in the central headwall). As we have no detailed sample depth information from the blocks and the baidzherakh, we report the results according to the respective stratigraphic units.
3.2 Laboratory analyses
The samples were freeze-dried, and after homogenisation of the samples, the total carbon (TC), the total organic carbon (TOC; vario TOC cube elemental analyser) and the total nitrogen (TN) content were measured (rapid MAX N exceed elemental analyser) and expressed in weight percent (wt %).
Samples were treated for biomarker analysis as described by Jongejans et al. (2021a): after extraction of the OM (Dionex ASE 350) and removal of asphaltenes, four internal standards were added and the extracts were separated by medium-pressure liquid chromatography (MPLC; Margot Köhnen-Willsch Chromatography, Jülich) into aliphatic, aromatic and polar NSO (nitrogen, sulfur and oxygen-containing) fractions (for details see Radke et al., 1980). We selected 10 samples for further separation of the NSO fraction into an acid and neutral polar fraction using a KOH-impregnated silica gel column (Schulte et al., 2000). This sample selection was based on the biogeochemical parameters, as well as to cover the entire profile.
We measured alkanes, fatty acids (FAs) and alcohols using a TRACE 1310 gas chromatograph coupled to a TSQ 9000 mass spectrometer (Thermo Scientific), following the same method and settings as described in Jongejans et al. (2021a). Prior to the measurements, the fatty acid fraction was methylated using diazomethane and the alcohol fraction was trimethylsilylated using N-methyl-N-(trimethylsilyl)trifluoroacetamide (MSTFA). We quantified the compounds relative to the internal standards from full-scan mass spectra ( 50–600 Da, 2.5 scans s−1) using the software Xcalibur.
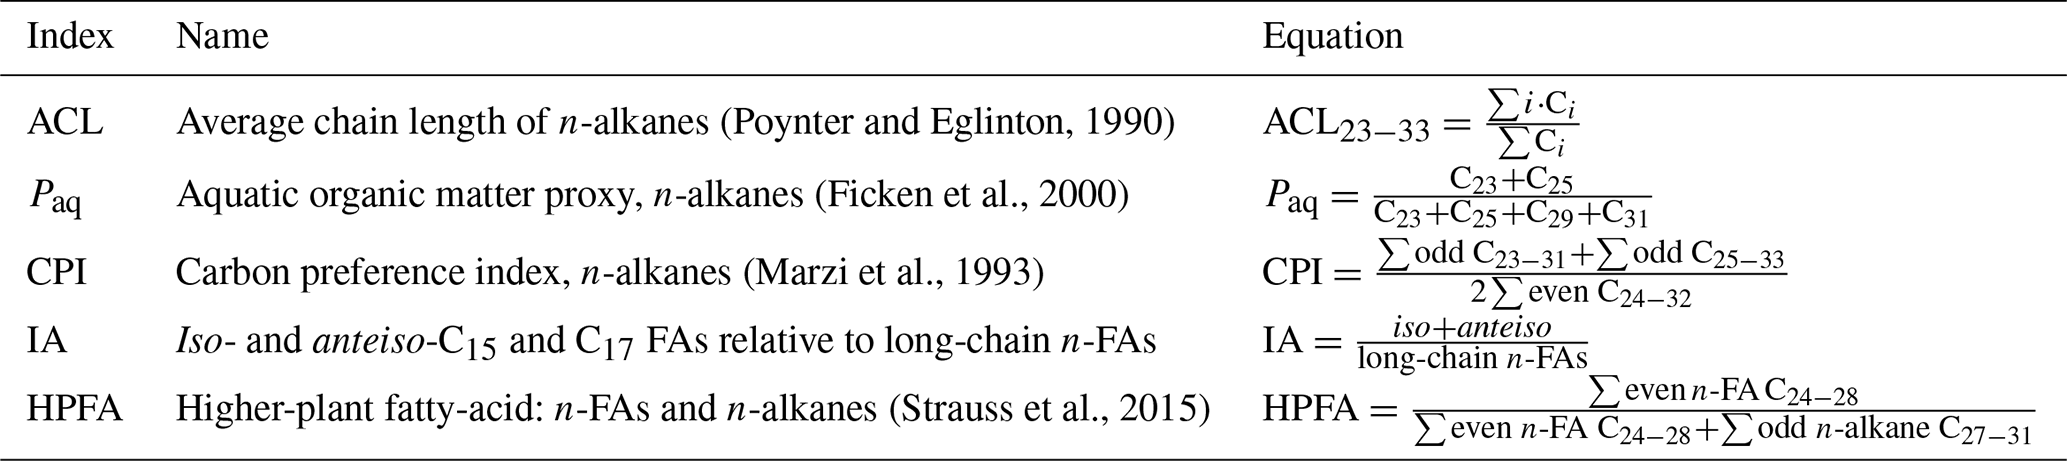
We calculated indices from the n-alkane and n-FA concentrations (Table 1) to obtain insights into OM origin and preservation: the average chain length (ACL), the proxy for aquatic OM (Paq), the carbon preference index (CPI), the ratio of iso- and anteiso-branched relative to long-chain n-FAs (IA), and the higher-plant fatty acid (HPFA) index. The ACL can be used as an indicator of OM source, where long-chain n-alkanes (>25) are mostly produced by terrestrial higher plants (Poynter and Eglinton, 1990; Ficken et al., 1998; Zech et al., 2010). Variations in the ACL can be caused by different plant type material and climatic-induced changes in the environmental conditions. For example, different temperature and wetness conditions as well as the length of the vegetation period can influence the long-chain n-alkane distribution (e.g. Sachse et al., 2006). Paq shows the share of OM derived from aquatic plants, which are thought to contain more C23 and C25 n-alkanes – compared to terrestrial plants which generally have longer chains (Ficken et al., 2000). In addition, Sphagnum mosses are also dominated by n-C23 and n-C25. The CPI expresses the ratio of the odd-over-even n-alkane chains and decreases with OM decomposition (Marzi et al., 1993). We calculated the IA using the iso- and anteiso-branched FAs C15 and C17 representing bacterial biomass relative to long-chain n-FAs representing the terrestrial OM. This ratio is thought to reflect changes in the microbial abundance (and presumably activity) with respect to the terrestrial background biomass, where a higher ratio may correspond to microbial membrane adaptation with respect to warmer environmental conditions (Rilfors et al., 1978; Stapel et al., 2016). Finally, the HPFA index was used to indicate the level of OM degradation: due to the presence of the polar carboxyl group, FAs are more vulnerable to biological and chemical degradation (Killops and Killops, 2013) compared to the respective n-alkanes, leading to decreased HPFA values with decomposition.
Table 1Abbreviations and equations of calculated indices from n-alkane and n-fatty acid (n-FA) concentrations.
4.1 Detected biomolecules
We measured hydrocarbons in 30 samples (Jongejans et al. (2022a). These compounds comprised short-chain (n-C17 to n-C20) and long-chain (n-C20 to n-C33) n-alkanes, alkylcyclohexanes (C17 to C25), alkylcyclopentanes (even carbon numbered from C18 to C24), and methylalkanes (C19 to C25), as well as diethylalkanes and ethyl-methylalkanes (C19 to C25) (Fig. S2 in the Supplement). The concentrations of the branched (methylalkanes, diethylalkanes and ethyl-methylalkanes) and cyclic (alkylcyclohexanes and alkylcyclopentanes) alkanes strongly correlate with each other (correlation coefficient r 0.97 to 0.99, p<0.01; Table S1 in the Supplement).
Additionally, we measured FA concentrations of 10 samples (Jongejans et al., 2022b). However, the acid fraction of the uppermost sample (0.2 m) likely contained plastic contamination, and coelutions with FAs prevented the quantification of FAs in this sample. Overall, normal FAs (n-C12 to n-C34), iso-branched FAs (iso-C14 to iso-C17), anteiso-branched FAs (ai-C15 to ai-C17), saturated branched FAs (10-Me16, 10-Me17, 10-Me18, 12-Me18), monounsaturated FAs (16:1ω7, 16:1ω5, 18:1ω9, 18:1ω7, 19:1, 20:1ω9), a polyunsaturated FA (18:2ω6-9), FAs with a cyclopropyl ring (cycl-17:0, cycl-19:0), hydroxyl FAs (22-OH, 24-OH) and phytanic acid were found. In the neutral polar fraction, a homologous series of n-alcohols as well as sterols and triterpenoids were detected.
4.2 Lower ice complex
This lowermost exposed sediment sequence consisted mostly of sandy silt to silty sand. The lower ice complex (profile 2, 53.1–52.0 ) contained partly truncated ice wedges and composite wedges. A reddish erosional layer containing gravel marked the top of the lower ice complex. In places, a similar layer cuts through the lower ice complex at an angle. Here, we found pool ice and wooden remains. The TOC (0.69 wt %–0.83 wt %) and the TN (0.10 wt %–0.11 wt %) were very low in this unit (Figs. 2 and S1), and the ratio ranged from 6.4 to 7.5 (Jongejans et al., 2022c). The concentrations of short n-alkanes (47–75 µg g−1 TOC), long n-alkanes (213–405 µg g−1 TOC), and branched and cyclic alkanes (46–161 µg g−1 TOC) were also quite low in this unit. The ACL ranged between 28.5 and 29.2 and the Paq from 0.14 to 0.23. The CPI varied between 6.4 and 7.6. The main FAs were the n-FAs. The short- and long-chain n-FA concentrations were 163 and 610 µg g−1 TOC in this unit, respectively (Fig. 3). The IA index was very low (0.03), and the HPFA index was comparably high (0.67).
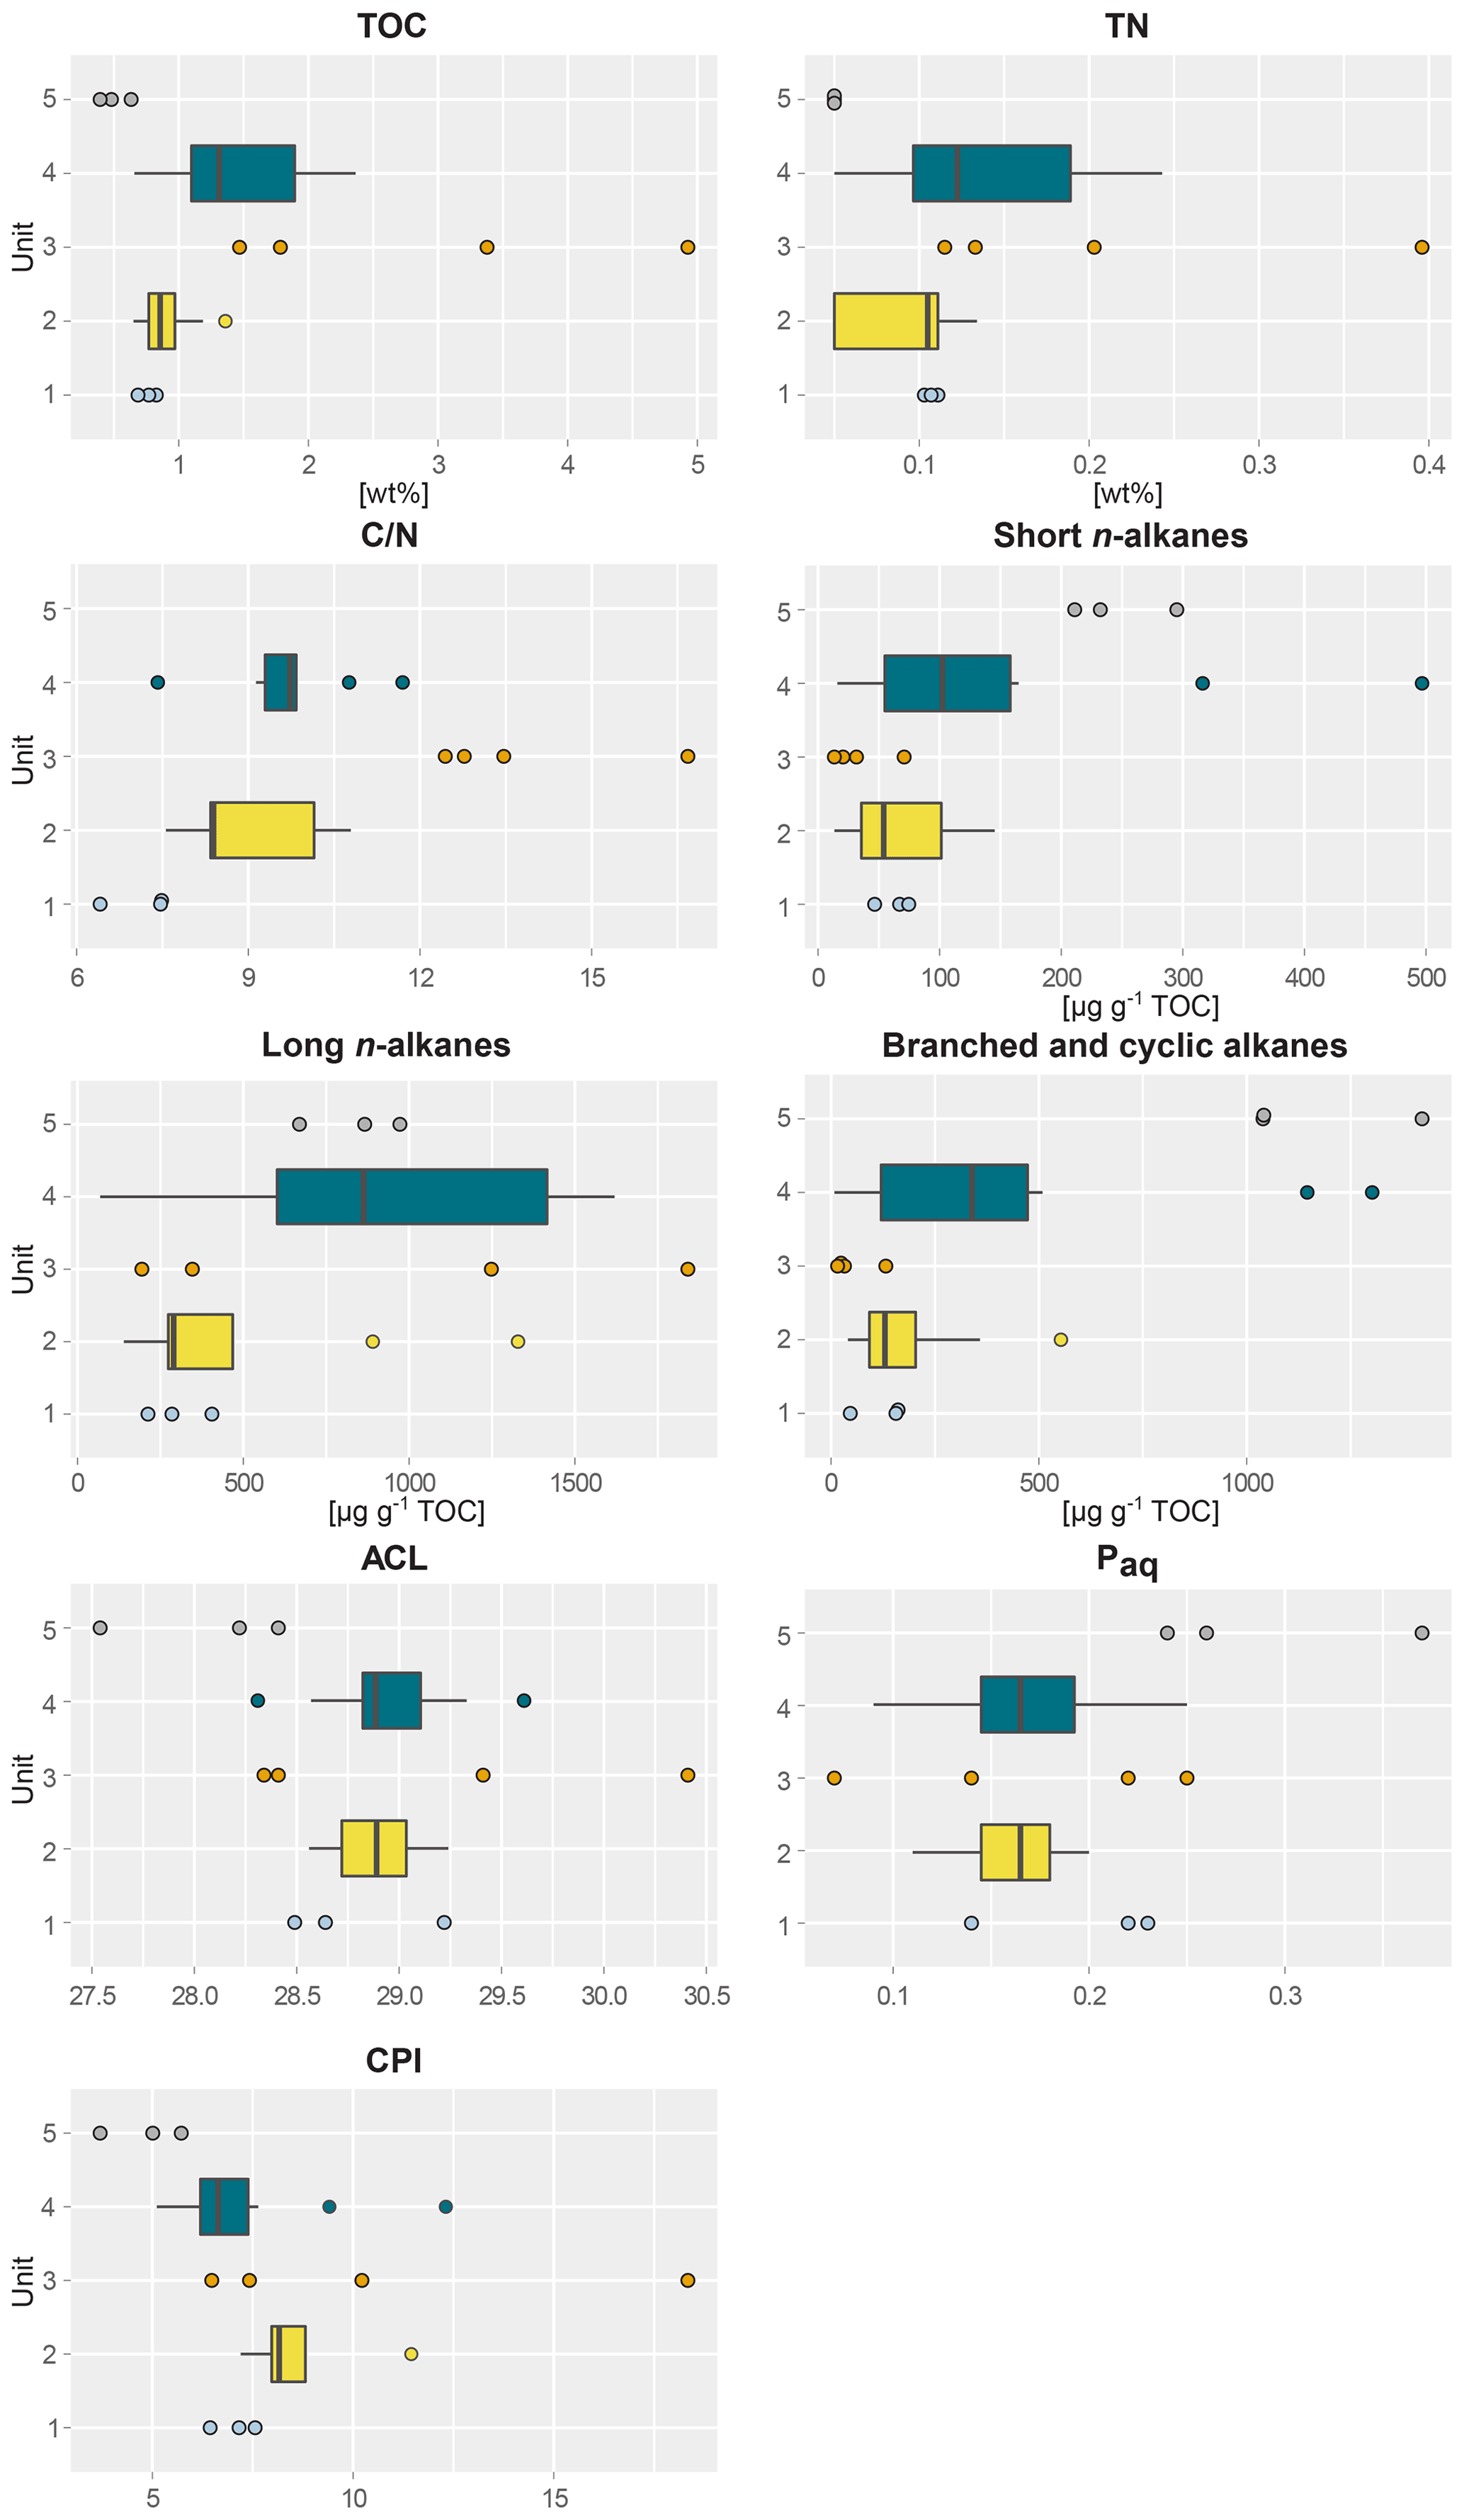
Figure 2Boxplots of biogeochemical and alkane parameters of sediment samples taken from five different profile units; (1) lower ice complex (n=3), (2) lower sand unit (n=12), (3) woody layer (n=4), (4) upper ice complex (n=8) and (5) Holocene cover (n=3) of the main headwall of the Batagay megaslump. From left to right and top to bottom: total organic carbon content (TOC); total nitrogen content (TN); carbon-to-nitrogen ratio (); short-chain n-alkane concentration; long-chain n-alkane concentration; concentration of branched, cyclic and methylalkanes combined; average chain length of n-alkanes (ACL); aquatic organic matter proxy Paq; and carbon preference index (CPI). For units with fewer than five samples, beeswarm plots are shown instead of boxplots.
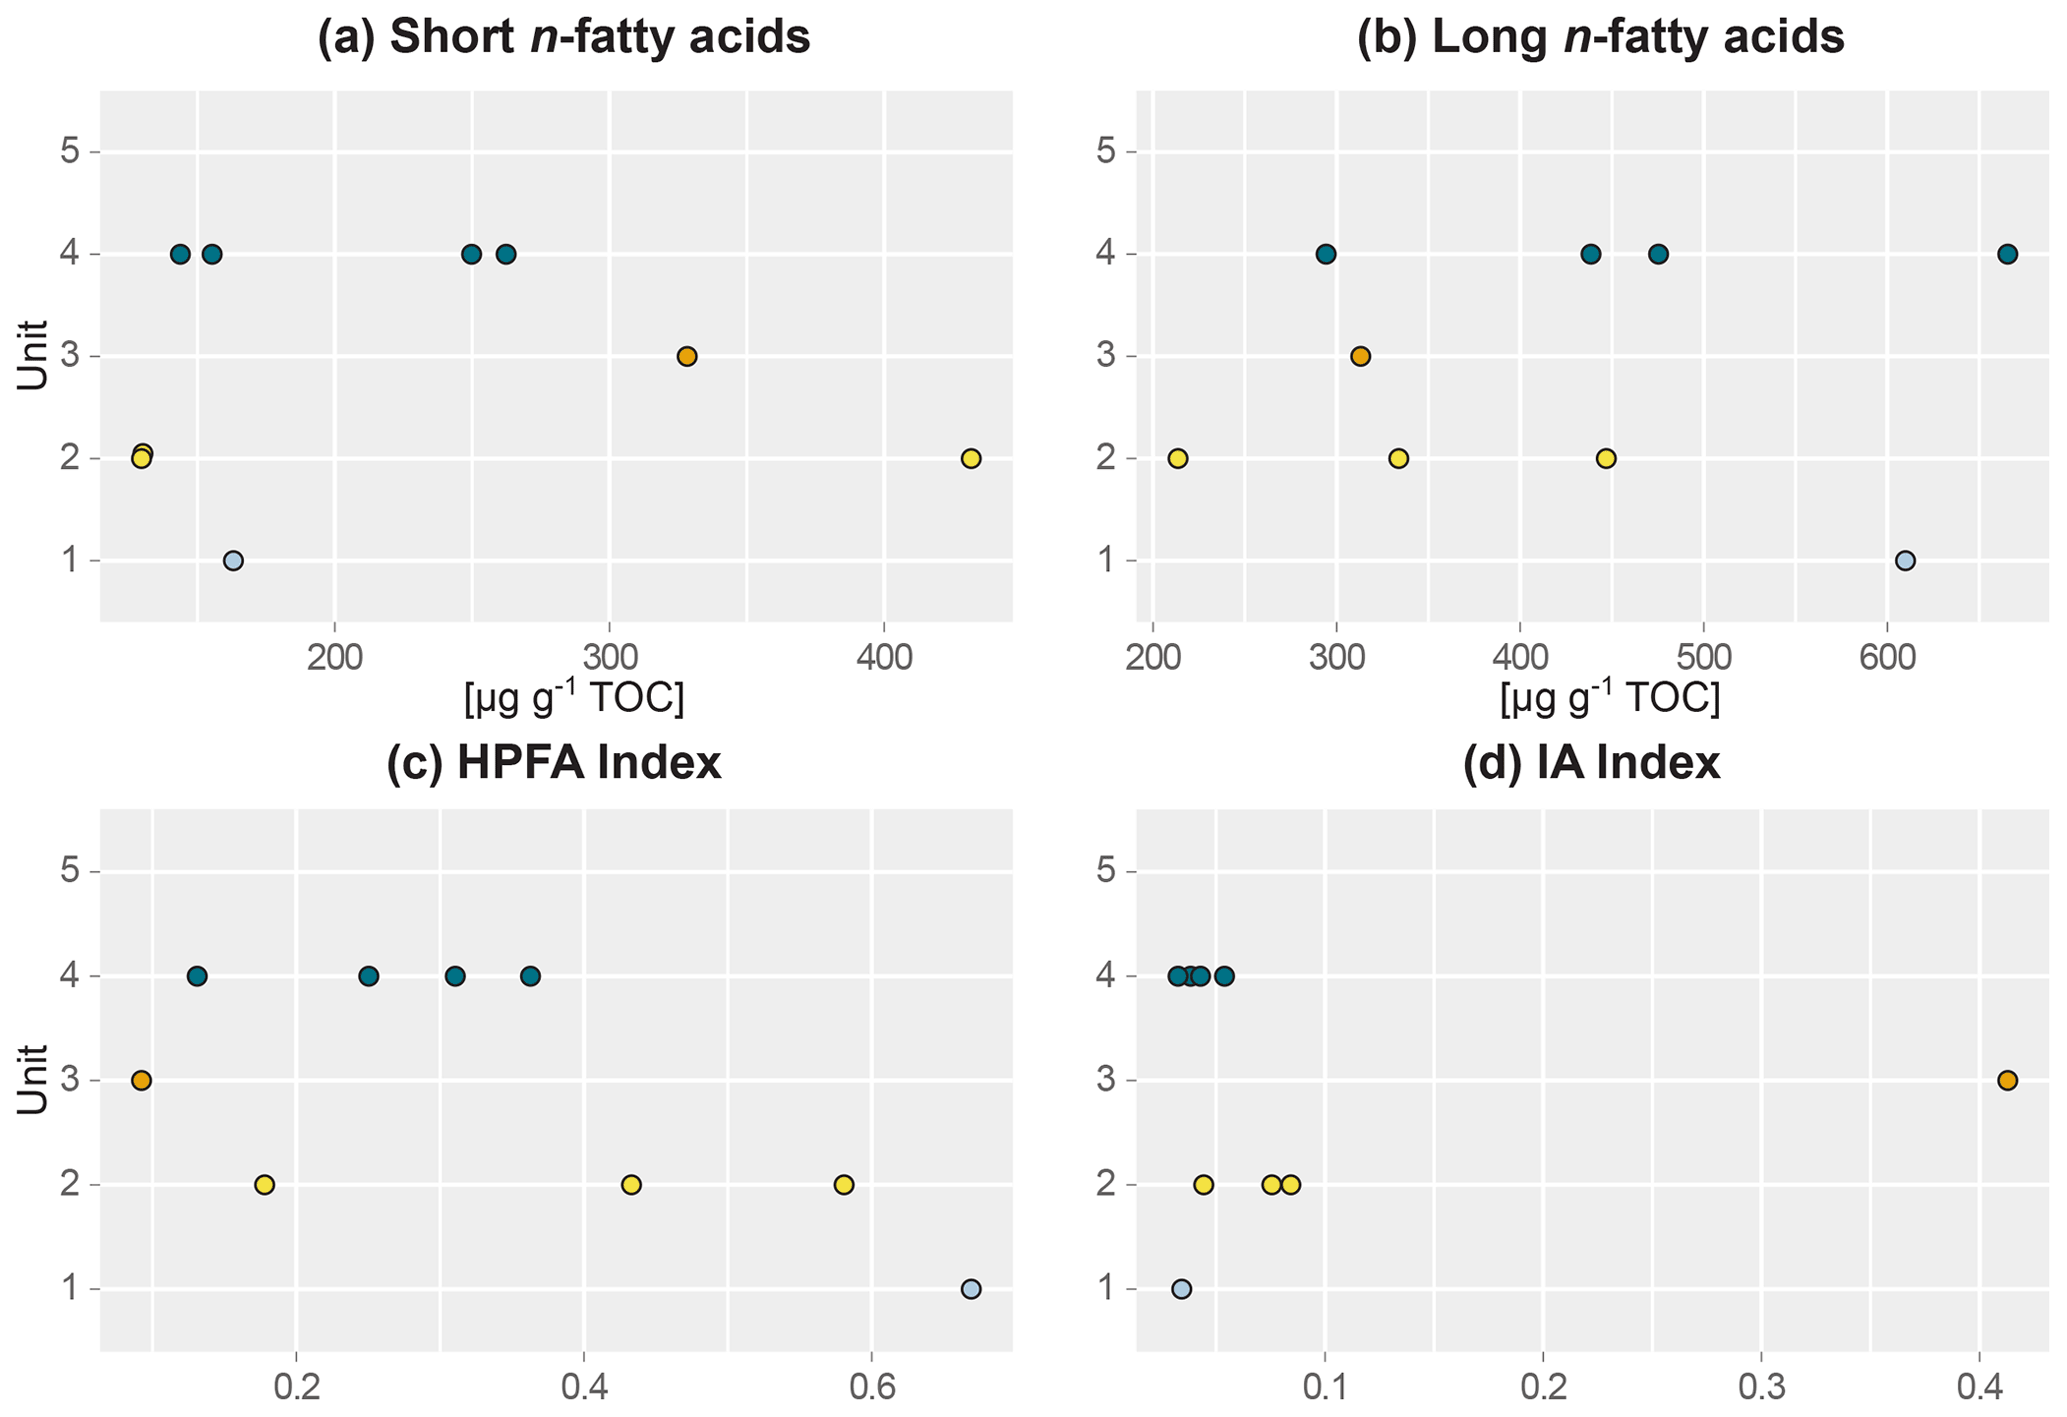
Figure 3Beeswarm plots of fatty acid concentrations of sediment samples of main headwall. (a) Short-chain n-fatty acid (n-FA) concentration, (b) long-chain n-FA concentration, (c) higher-plant fatty acid (HPFA) index, and (d) ratio of iso- and anteiso-FA C15 and C17 relative to long-chain FAs (IA index). Units: (1) lower ice complex (n=1), (2) lower sand unit (n=3), (3) woody layer (n=1), (4) upper ice complex (n=4).
4.3 Lower sand unit
The lower sand unit (profile 2, 51.5–51.0 m b.s.; profile 1, 49.4–38.4 m b.s.; one sample of profile 4) was characterised by narrow chimney-like composite ice–sand wedges. The TOC was higher (0.65 wt % to 1.36 wt %) compared to the lower ice complex, and the TN was comparably low (<0.10 wt %–0.13 wt %). The ratio ranged from 7.6 to 10.8; it could only be calculated for the samples with a TOC and TN content above the detection limit. The alkane concentrations ranged between 13 and 145 µg g−1 TOC for the short n-alkanes, 140 and 1329 µg g−1 TOC for the long n-alkanes, and 41 and 553 µg g−1 TOC for the branched and cyclic alkanes. The ACL and Paq ranged from 28.6 to 29.2 and 0.11 to 0.20, respectively. The CPI ranged between 7.2 and 11.5. The concentrations of short-chain n-FAs spanned a large range from 130 to 432 µg g−1 TOC, and the long n-FAs ranged from 214 to 447 µg g−1 TOC. The IA was at the low end (0.04 to 0.08), and the HPFA index was between 0.18 and 0.58.
4.4 Woody layer
The woody layer (profile 1 33.5–31.7 m b.s.; one sample each of profiles 3 and 4) was present in lenses up to 3 m thick. This debris layer was abundant in organic remains, peat lenses, roots and wood. The TOC (1.47 wt % to 4.93 wt %) and TN (0.12 wt % to 0.40 wt %), as well as the ratio (12.4 to 16.7), were highest in this unit. Here, the short n-alkanes and branched and cyclic alkanes were scarce (13–71 and 16–132 µg g−1 TOC, respectively; Fig. S2), but the long-chain n-alkanes covered a large range (194–1841 µg g−1 TOC). The ACL (28.3–30.4) had its maximum in this unit and the Paq (0.07–0.25) its minimum (both at 31.7 m b.s. in profile 1). The CPI was moderate to high (6.5 to 18.3). In this unit, we analysed the neutral fraction of one sample: the sample at 31.7 m b.s. from profile 1. In this sample, the iso- and anteiso-FAs (as well as the unsaturated FAs) were most abundant (Fig. S3 in the Supplement) and, therefore, the IA value was the highest (0.41). The FA concentrations were 328 µg g−1 TOC for the short-chain and 313 µg g−1 TOC for the long-chain n-FAs. The HPFA index was very low (0.09). Furthermore, we found many different sterols and triterpenoids in this sample (Table 2). The gas chromatogram and molecular structures can be found in the Supplement (Figs. S4 and S5). In the samples from the other units (n=9), we found only the sterols campesterol and β-sitosterol.
Table 2Identified sterols and triterpenoids in sediments in the woody layer at 31.7 m b.s. (profile 1) of the Batagay megaslump. Bold characteristic fragments represent the most intense fragment (base peak) in the mass spectra. The GC-MS chromatogram and the chemical structures of the compounds are shown in the Supplement (Figs. S4 and S5, respectively).
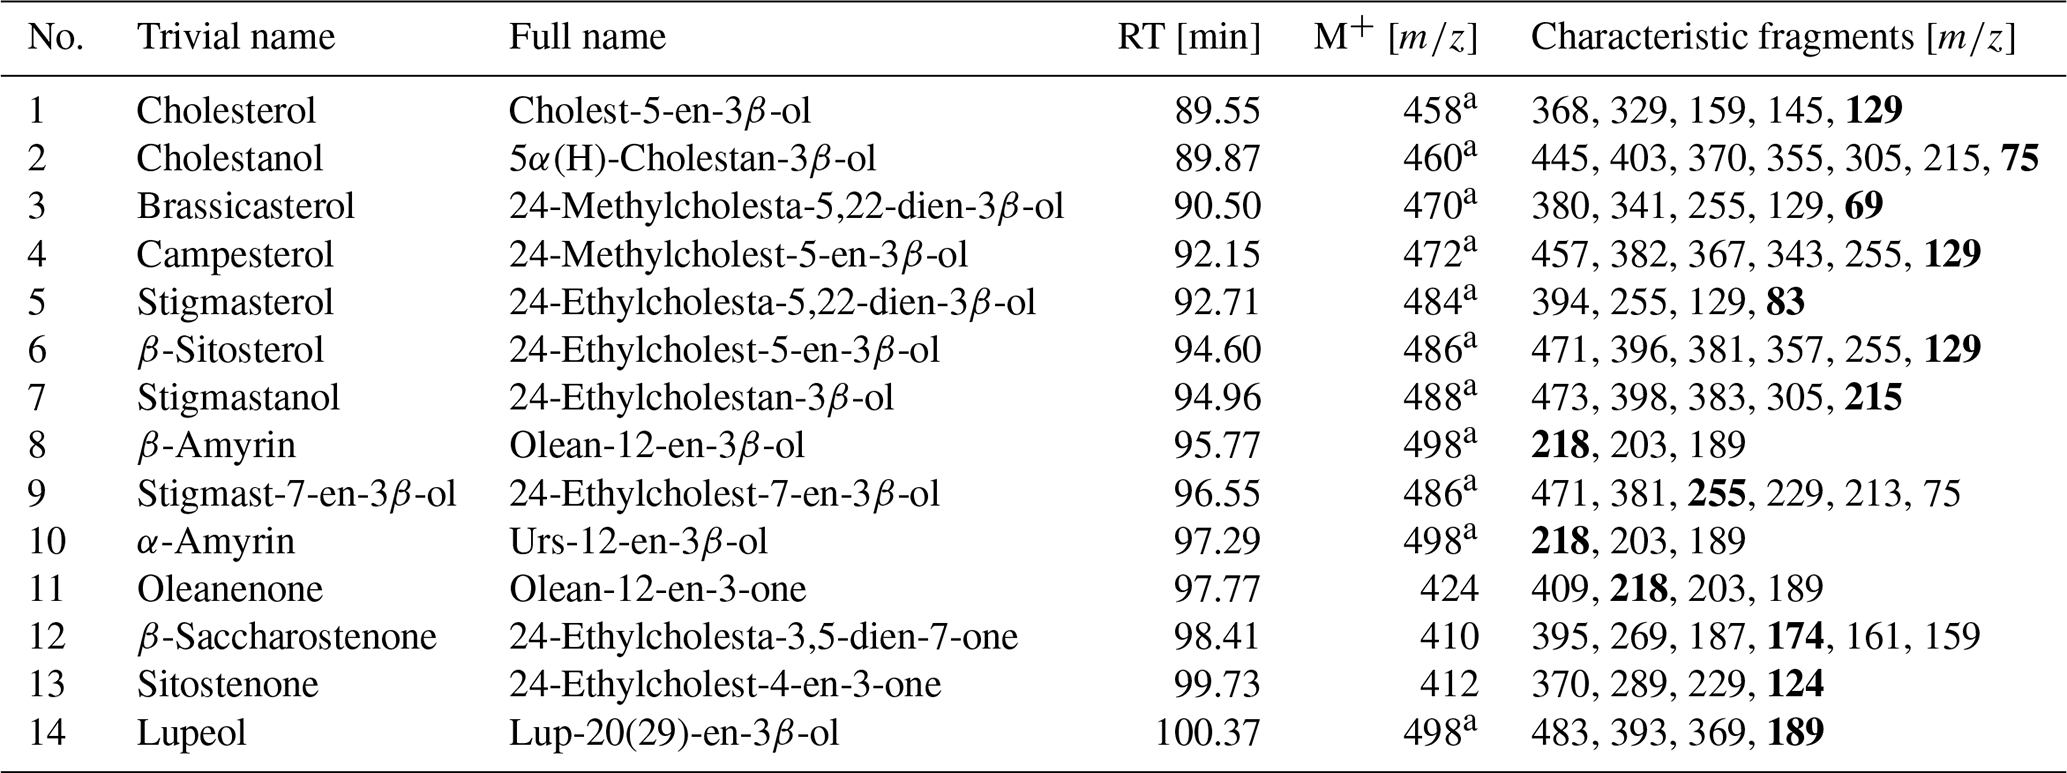
RT: gas chromatography–mass spectrometry (GC-MS) retention time. M+: molecular ion. a As trimethylsilyl derivative.
4.5 Upper ice complex – Yedoma
The upper ice complex (profile 1, 30.7–4.2 m b.s.; one sample of profile 3; profile 5) contained large (up to a few metres wide) syngenetic ice wedges. The TOC (0.66 wt %–2.36 wt %) and TN (<0.10 wt %–0.24 wt %) contents were moderately high compared to the other units. The values (7.4–11.7) were very similar to those of the lower sand unit. Alkane concentrations spanned a wide range in the upper ice complex: 16–497 µg g−1 TOC for the short-chain n-alkanes, 68–1620 µg g−1 TOC for the long n-alkanes, and 8–1302 µg g−1 TOC for the branched and cyclic alkanes. The ACL and Paq spanned quite a wide range (28.6 to 29.2 and 0.11 to 0.20, respectively). The CPI was low to moderate in this unit (5.11 to 12.3). The n-FA concentrations were also quite variable with the short-chain n-FAs ranging between 144 and 262 µg g−1 TOC and the long-chain n-FAs between 294 and 666 µg g−1 TOC. The IA index was very low (0.03 to 0.05) and the HPFA index low to medium (0.13 to 0.36).
4.6 Holocene cover
The Holocene cover unit (profile 1, 2.0–0.2 m b.s.) seemed quite organic-rich and contained a variety of cryostructures (e.g. massive, porphyric, basal, belt-like and layered). Nevertheless, the TOC (0.39 wt % to 0.63 wt %) and TN (<0.10 wt %) values were very low. Due to the TN values below the detection limit, we could not calculate the values of this unit. Especially the branched and cyclic alkanes were very abundant (790–1422 µg g−1 TOC), whereas the short- (211–295 µg g−1 TOC) and long-chain (669–972 µg g−1 TOC) n-alkanes were moderately high. The ACL (27.5–28.4) was lowest in this unit and the Paq the highest (0.24–0.37) in all profiles. The CPI was also the lowest and ranged from 3.7 to 5.7.
Variations in the TOC contents and fossil biomolecule concentrations along the sedimentary succession provide insights into quantitative differences in the buried OM deposited over time. These differences are mainly caused by changes in the depositional regime (e.g. water availability, temperature, accumulation rates), the associated bioproductivity (autochthonous signal) and transport processes of the OM (allochthonous signal) following different climatic periods (e.g. glacial and interglacial periods). Additionally, qualitative variations in the fossil biomolecules can give insight into different OM sources such as the biomarker indices ACL and Paq. Indicative biomarkers are a useful tool in these old sediments as they are generally very well preserved in sediments, even on geological timescales, compared to for example sugars, proteins and DNA.
5.1 Biogeochemical legacy of glacial periods
In the Batagay dataset, we found generally only minor variations in the biogeochemical and biomarker parameters for the lower ice complex, lower sand unit and upper ice complex. This suggests that the OM signal representing permafrost deposits since about 650 ka is qualitatively similar, suggesting that vegetation patterns might have been similar over time in glacial periods. These observations fit well with the palaeo-vegetation records of Ashastina et al. (2018). They found that meadow–steppe vegetation persisted throughout most of the reconstructed period (i.e. lower sand unit and upper ice complex) and argued that fossil plant macro-remains mirror mostly changes in the relative abundance of plant communities rather than complete changes in plant species compositions over time (Ashastina et al., 2018). Such relative quantitative variations in the vegetation might be responsible for the observed variability in individual biomolecule markers (e.g. n-alkanes and FAs). For the MIS 3 and MIS 2 deposits, Courtin et al. (2022) confirmed the open steppe–tundra landscape by sedimentary DNA analyses; they revealed that herb communities dominated the glacial vegetation, and they found traces of megaherbivores corresponding to this landscape.
The generally higher ACL (>28) and lower Paq in these units indicate a higher-plant and less aquatic or mossy character of the OM in these deposits. This corroborates the strong continentality and dry conditions, especially during the cold stages, as found by isotopic and palaeo-ecological analyses (Ashastina et al., 2018; Opel et al., 2019). The relatively low IA index presumably points to lower microbial activity during the glacial periods.
Cryostratigraphic observations and isotopic findings suggest that the lower ice complex sediments might have been deposited under relatively wet conditions, providing enough snowmelt water to form huge ice wedges (Opel et al., 2019). These findings suggest that these sediments were deposited during a glacial period. In contrast, shotgun DNA analyses from sediments taken in 2017 from the upper part of the lower ice complex just below the erosional surface (sample B17-D3) point to an interglacial origin of the deposited OM (Courtin et al., 2022). Courtin et al. (2022) suggested that the environment was characterised by forested vegetation but that there were also more open, herb-dominated areas with large herbivores. Pollen findings (Andrei A. Andreev, unpublished data) of the same samples from the lower ice complex at its transition into the above-lying erosional surface point to woodland and steppe vegetation, characteristic of an interglacial period that might have induced thermo-erosion and permafrost thaw that partly degraded the lower ice complex from above. In the sediments above the erosional surface, in the lower sand unit (sample B17-D5), Courtin et al. (2022) detected small mammals and forest-specific insect families supporting dense forest vegetation. Furthermore, they found signs of strong microbial activity related to soil decomposition such as members of the fungus Pseudogymnoascus, which are related to decaying roots or plants, and aerobic bacteria (Nocardioidaceae and Clostridia) which are considered to be consumers of OM. In contrast to this transition layer, the samples of the underlying lower ice complex taken in 2019 cover the entire exposed sequence, and our biochemical and biomarker results do not differ for the lower ice complex, the lower sand unit and the upper ice complex. Therefore, we assume that all three sequences formed during glacial periods. Moreover, we found relatively low values for the IA index in the lower ice complex deposits, suggesting low microbial activity. Possibly the samples from the lower ice complex (2017 and 2019) represent a transition from a glacial to an interglacial period, the latter of which is represented in the erosional surface topping the lower ice complex. Apart from the erosional surface above the lower ice complex (Fig. 4 from Opel et al., 2019), there were signs of erosion events within the lower ice complex as indicated by pockets of wooden remains (Jongejans et al., 2021b). In any case, the complicated permafrost formation and degradation history might also explain the mixed signal in the OM: the ratio and HPFA index show opposite results for the lower ice complex. The high HPFA index might be influenced by the high long-n-FA concentration. The low could point to the deposition of older transported OM. The CPI was strongly correlated with the ACL (r 0.74, p<0.01) and Paq (r −0.70, p<0.01) across all units (Table S2 in the Supplement). This suggests that the CPI is highly influenced by the OM source, and therefore, its use as an OM quality indicator might be restricted. However, general CPI values above 5 might indicate that the OM is still of relatively good quality. A deeper insight into the quality might be provided by the FA concentrations as they are indicators for more labile biomolecules. The FA data show quite variable values within the individual glacial periods (Fig. 3). In addition to a mixed OM source, this might also indicate a heterogeneous level of OM decomposition, which is also supported by variable HPFA values. Thus, the data point to an overall variable OM quality in the glacial deposits.
The occurrence of narrow composite sand–ice wedges in the lower sand unit compared to the large ice wedges in both ice complex units suggests very high accumulation rates in the lower sand unit. Furthermore, there was likely more snowmelt water available during the ice complex formation that allowed the formation of huge ice wedges as present in the lower and the upper ice complex units. Nevertheless, these changes in available winter moisture are not reflected in the biomarker record of, for example, the ACL and Paq values.
5.2 Biogeochemical legacy of interglacial periods
In contrast, the woody layer and the Holocene cover differ in their biogeochemical and biomarker parameters from the other stratigraphic units. Compared to the glacial units, we found not only distinct differences in the n-alkane and FA distribution for the Holocene cover and the woody layer but also some specific biomarkers in these sediments such as branched and cyclic alkanes, stenols, stanols, and pentacyclic triterpenoids. We discuss the characteristics of the OM in these sediments and the sources and implications of these compounds in the woody layer and the Holocene cover below.
The woody layer samples show wide variability among all determined biogeochemical and biomolecular parameters, indicating a layer of high inhomogeneity. Ashastina et al. (2017) found high TOC and values, as well as low δ13C values for the woody layer. Similarly, we found variable but overall higher TOC contents in these sediments, pointing to high OM accumulation in this layer, and, compared to the other units, a higher and ACL23−33 suggesting a strong higher-plant contribution in the deposited OM. However, a variable input of aquatic or mossy organic biomass is indicated by the Paq index. The higher OM accumulation could result from higher productivity as is typical of warmer conditions during interglacial periods. However, the fact that the woody layer marks a disconformity related to massive permafrost degradation and erosion suggests that the OM can also stem from remobilisation of older material, redistribution and accumulation in erosional forms.
The sediments of the woody layer had a distinctly different n-alkane and FA distribution compared to the other studied sediment units. The woody layer almost completely lacked the short n-alkanes and branched and cyclic alkanes, and the high ACL and low Paq suggest drier conditions (Ficken et al., 1998, 2000). Apart from the distinct n-alkane and FA distribution, the sediments from the woody layer (sample at 31.7 m in profile 1) also contained specific stenols, stanols and pentacyclic triterpenoids (Table 2). While it is thought that C27 and C28 sterols dominate in algae and zooplankton, C29 sterols are generally abundant in vascular plants (Volkman, 1986). Furthermore, many of the compounds identified in the Batagay sediments were found to be typical of higher land plants: campesterol, stigmasterol, β-sitosterol, stigmastanol, β-amyrin, α-amyrin, oleanenone and lupeol (Brassell et al., 1983; Peters et al., 2005; Killops and Killops, 2013). The presence of these markers points to a strong terrestrial signal of OM, which is partly corroborated by the high ACL and lower Paq values in the woody layer sediments. These findings match those of Ashastina et al. (2017), who found no aquatic or wetland plants for this unit but only terrestrial plant remains.
The woody layer accumulated in an erosional gully, which is indicated by the presence of organic-rich lenses and abundant trash wood in the headwall. Similar “forest beds” that were associated with the Last Interglacial were found in non-glaciated Yukon and Alaska (Hamilton and Brigham-Grette, 1991; Reyes et al., 2010). In the woody layer, a mixture of different autochthonous and allochthonous organic biomass was transported and accumulated. Thermo-erosional processes such as the formation of gullies (the combined mechanical and thermal action of moving water) (van Everdingen, 2005) are associated with running or standing water that can transport sediments and organic remains. However, aquatic markers are only present in minor abundance but might be represented by short-chain FAs and sterols such as brassicasterol (Killops and Killops, 2013). In addition, Ashastina et al. (2018) reconstructed dry conditions during the Last Interglacial with a herb-rich light coniferous taiga and a pronounced plant litter cover. They argued that this could be related to the low ice content of the underlying lower sand unit, providing little meltwater from thawing permafrost. Furthermore, they found that plant and insect species composition pointed to frequent fire disturbances in the Last Interglacial. The high abundance of iso- and anteiso-FAs (IA index) as well as high quantities of branched and unsaturated short-chain FAs (Fig. S3) suggests increased microbial activity for this interval (Stapel et al., 2016). Together with the very low HPFA index, this indicates an increased level of microbial transformation of the OM and thus a lower quality of the OM in the woody layer.
In the Holocene cover sediments, the relatively low ACL and high Paq values suggest an increasing number of aquatic plants formed under wet conditions or mosses (Ficken et al., 1998, 2000). In the sediments of the Holocene cover and some samples from the upper ice complex, the short n-alkanes were abundant. Especially in these sediments, we found the presence of branched and cyclic alkanes. The branched alkanes, among which are the diethylalkanes and the ethyl-methylalkanes, have one or two quaternary carbon atoms (branched aliphatic alkanes with a quaternary substituted carbon atom – BAQCs). Kenig et al. (2005) argued that the BAQCs are widespread in sediments and sedimentary rocks due to their low biodegradability but have not been identified often or have been misidentified before. The source of these, as well as of the cyclic alkanes (alkylcyclohexanes and alkylcyclopentanes) and methylalkanes, has been a topic of debate (e.g. Shiea et al., 1990; Greenwood et al., 2004; Kenig et al., 2005). The strong positive correlation (r>0.97) between the concentrations of the BAQCs and cyclic alkanes suggests similar sources for these compounds. Previous studies have also found the co-occurrence of these compounds (e.g. Ogihara and Ishiwatari, 1998; Kenig et al., 2005). Several studies have proposed a microbial origin, such as cyanobacteria (Shiea et al., 1990), non-photosynthetic sulfidic oxidising bacteria (Kenig et al., 2003), thermophilic acidophilic bacteria (Ogihara and Ishiwatari, 1998), or microbes exploiting redox gradients or involved in either the sulfur or the nitrogen cycle (Greenwood et al., 2004). Zhang et al. (2014) suggested that the long-chain cyclic alkanes could be produced by the reduction of FAs. Cyanobacteria could have been present in polygonal ponds, running water or even liquid pore water. However, we did not find a correlation with concentrations of certain FAs that are major components produced by cyanobacteria such as 16:0, 16:1ω7 and 18:1ω9 (Piorreck et al., 1984). Nevertheless, these FAs are not very specific and thus can be a signal of different sources preventing a direct correlation to the alkylated and cyclic alkanes. Plastic contamination was also proposed as the source of BAQCs by Brocks et al. (2008), but we would expect that previous studies where sediment samples were prepared in a similar way would have found these compounds as well (e.g. Strauss et al., 2015; Jongejans et al., 2018, 2020, 2021a). Further, petroleum contamination can be ruled out as we did not find corresponding oil-related geothermally transformed compounds such as hopanes and steranes. Further research is needed to be able to reduce the number of possible sources. Generally, we assume a microbial origin for the branched and cyclic alkanes. This is corroborated by the strong positive correlation between the branched and cyclic alkanes and the short n-alkanes (r 0.90, p<0.01). Also, even though the correlation was not significant when looking at the complete sample set, higher concentrations of branched and cyclic alkanes did match lower ACL and higher Paq values. These findings suggest that these alkanes are also produced under relatively warm and wet conditions, which fits the Holocene origin of these samples very well. The low TOC contents and lowest CPI values suggest a higher degradation level and thus lower quality for the Holocene OM. Our findings point to drier conditions during the Last Interglacial compared to the Holocene, as well as more bioproductivity and microbial degradation, indicating higher temperatures. This fits nicely the findings of Kienast et al. (2008).
Altogether, it would be expected that there is a distinct difference between the upper ice complex and the Holocene cover. Still, it is likely that the uppermost part of the upper ice complex was degraded during the Holocene. This might have led to a rather gradual transition of the biogeochemical and biomarker parameters within the Holocene cover sediments and into the upper ice complex.
5.3 Modern organic matter mobilisation in the Batagay megaslump
Using satellite imagery, Vadakkedath et al. (2020) analysed the expansion of the thaw slump for the past 3 decades (1991–2018) and found increasing expansion rates over time with a mean of 2.6 ha yr−1. This means that an enormous quantity of sediments and OM is mobilised every year. Following the thaw of the ice-rich sediments (especially of the lower and upper ice complex units), the mobilised material can be transported by the meltwater rapidly downslope through a gully network into the Batagay River and further into the Yana River. The OM in these sediments can be decomposed by microbes upon thaw, leading to greenhouse gas emission from the sediments directly (Vonk et al., 2013) or from rivers.
Intense permafrost thaw occurred during interglacials, and we found stratigraphic discordances above the lower ice complex, the lower sand unit and the lower ice complex. Nevertheless, the presence of large ice wedges in the lower and the upper ice complex and composite wedges in the lower sand unit shows that the sediments that are still exposed in the Batagay megaslump were affected only in their upper parts and remained largely undisturbed. Hence, OM decomposition was presumably limited. Previous studies have shown the high lability of OM in permafrost and especially in the MIS 4–2 Yedoma Ice Complex sediments (Vonk et al., 2013; Jongejans et al., 2021a). Although the biomarkers indicate variable OM quality for the different sedimentary intervals, we expect that a large amount of biodegradable OM is still mobilised from the Batagay thaw slump every thawing season. From the glacial and Holocene deposits, mostly mineral OM is mobilised, whereas from the woody layer, well-preserved OM including wooden remains and detritus is mobilised which can be readily decomposed upon thaw. The increased formation of retrogressive thaw slumps that has been observed over the past decades in many Arctic regions (e.g. Lacelle et al., 2010; Lewkowicz and Way, 2019) is likely to continue with ongoing climate warming, and the mobilisation of large quantities of previously frozen sediments and OM likely will lead to higher greenhouse gas release from thawing permafrost (Bröder et al., 2021; Mann et al., 2022; Yao et al., 2021).
Multiple studies have pointed to accelerating rapid degradation of ice-rich permafrost landscapes by thaw slumping, including not only regions with buried glacial ice but also regions with large syngenetic Yedoma ice wedges (Lantz and Kokelj, 2008; Lacelle et al., 2010; Kokelj et al., 2017; Lewkowicz and Way, 2019; Runge et al., 2022). In their study of thaw slumps in north-western Canada, Lacelle et al. (2015) found 189 active slumps of which 10 exceeded 20 ha. However, recent remote sensing work on thaw slumps (e.g. Kokelj et al., 2015; Runge et al., 2022) has suggested that megaslumps (up to 52 ha or larger) have been rather rare so far. Therefore, at this point the Batagay thaw slump is very unique in its size and is the largest such feature as far as we know. As the initial disturbance of the Batagay megaslump is possibly anthropogenic, it represents an outstanding example of rapid permafrost thaw that is promoted but was not originally caused by Arctic warming.
Biogeochemical analyses provide valuable information on palaeo-environments. Here, for the first time ancient permafrost that formed about 650 kyr ago in NE Siberia was studied for carbon and nitrogen contents and lipid biomarker characteristics. Our findings show that there was no substantial vegetation change of the prevailing meadow steppe over large glacial periods during MIS 16, sometime between MIS 16 and MIS 6, and MIS 4–2, which are represented in the exposed strata of the Batagay megaslump by the lower ice complex, lower sand unit and the upper ice complex, respectively. The interglacial woody layer (MIS 5), a layer of eroded and accumulated material, showed a high content of higher-plant OM and strong microbial decomposition. In the Holocene cover, we found relatively wet depositional conditions. For the interglacial periods, the biomolecule inventory indicates a higher microbial OM transformation and thus a decreased OM quality. In contrast, in the glacial periods a variable but overall higher OM quality is suggested by the biomolecules compared to the interglacial periods. Thus, microbial decomposition was likely limited during the glacial periods. Therefore, a substantial amount of less decomposed OM is mobilised in the Batagay thaw slump every year, in particular since the thaw slump process allows access to deeply buried OM. Our biomarker analyses of ancient permafrost sediments contribute to a better understanding of how OM is incorporated and preserved in permafrost deposits during glacial and interglacial periods. Furthermore, they help to improve our comprehension of possible consequences resulting from future permafrost thaw and OM mobilisation.
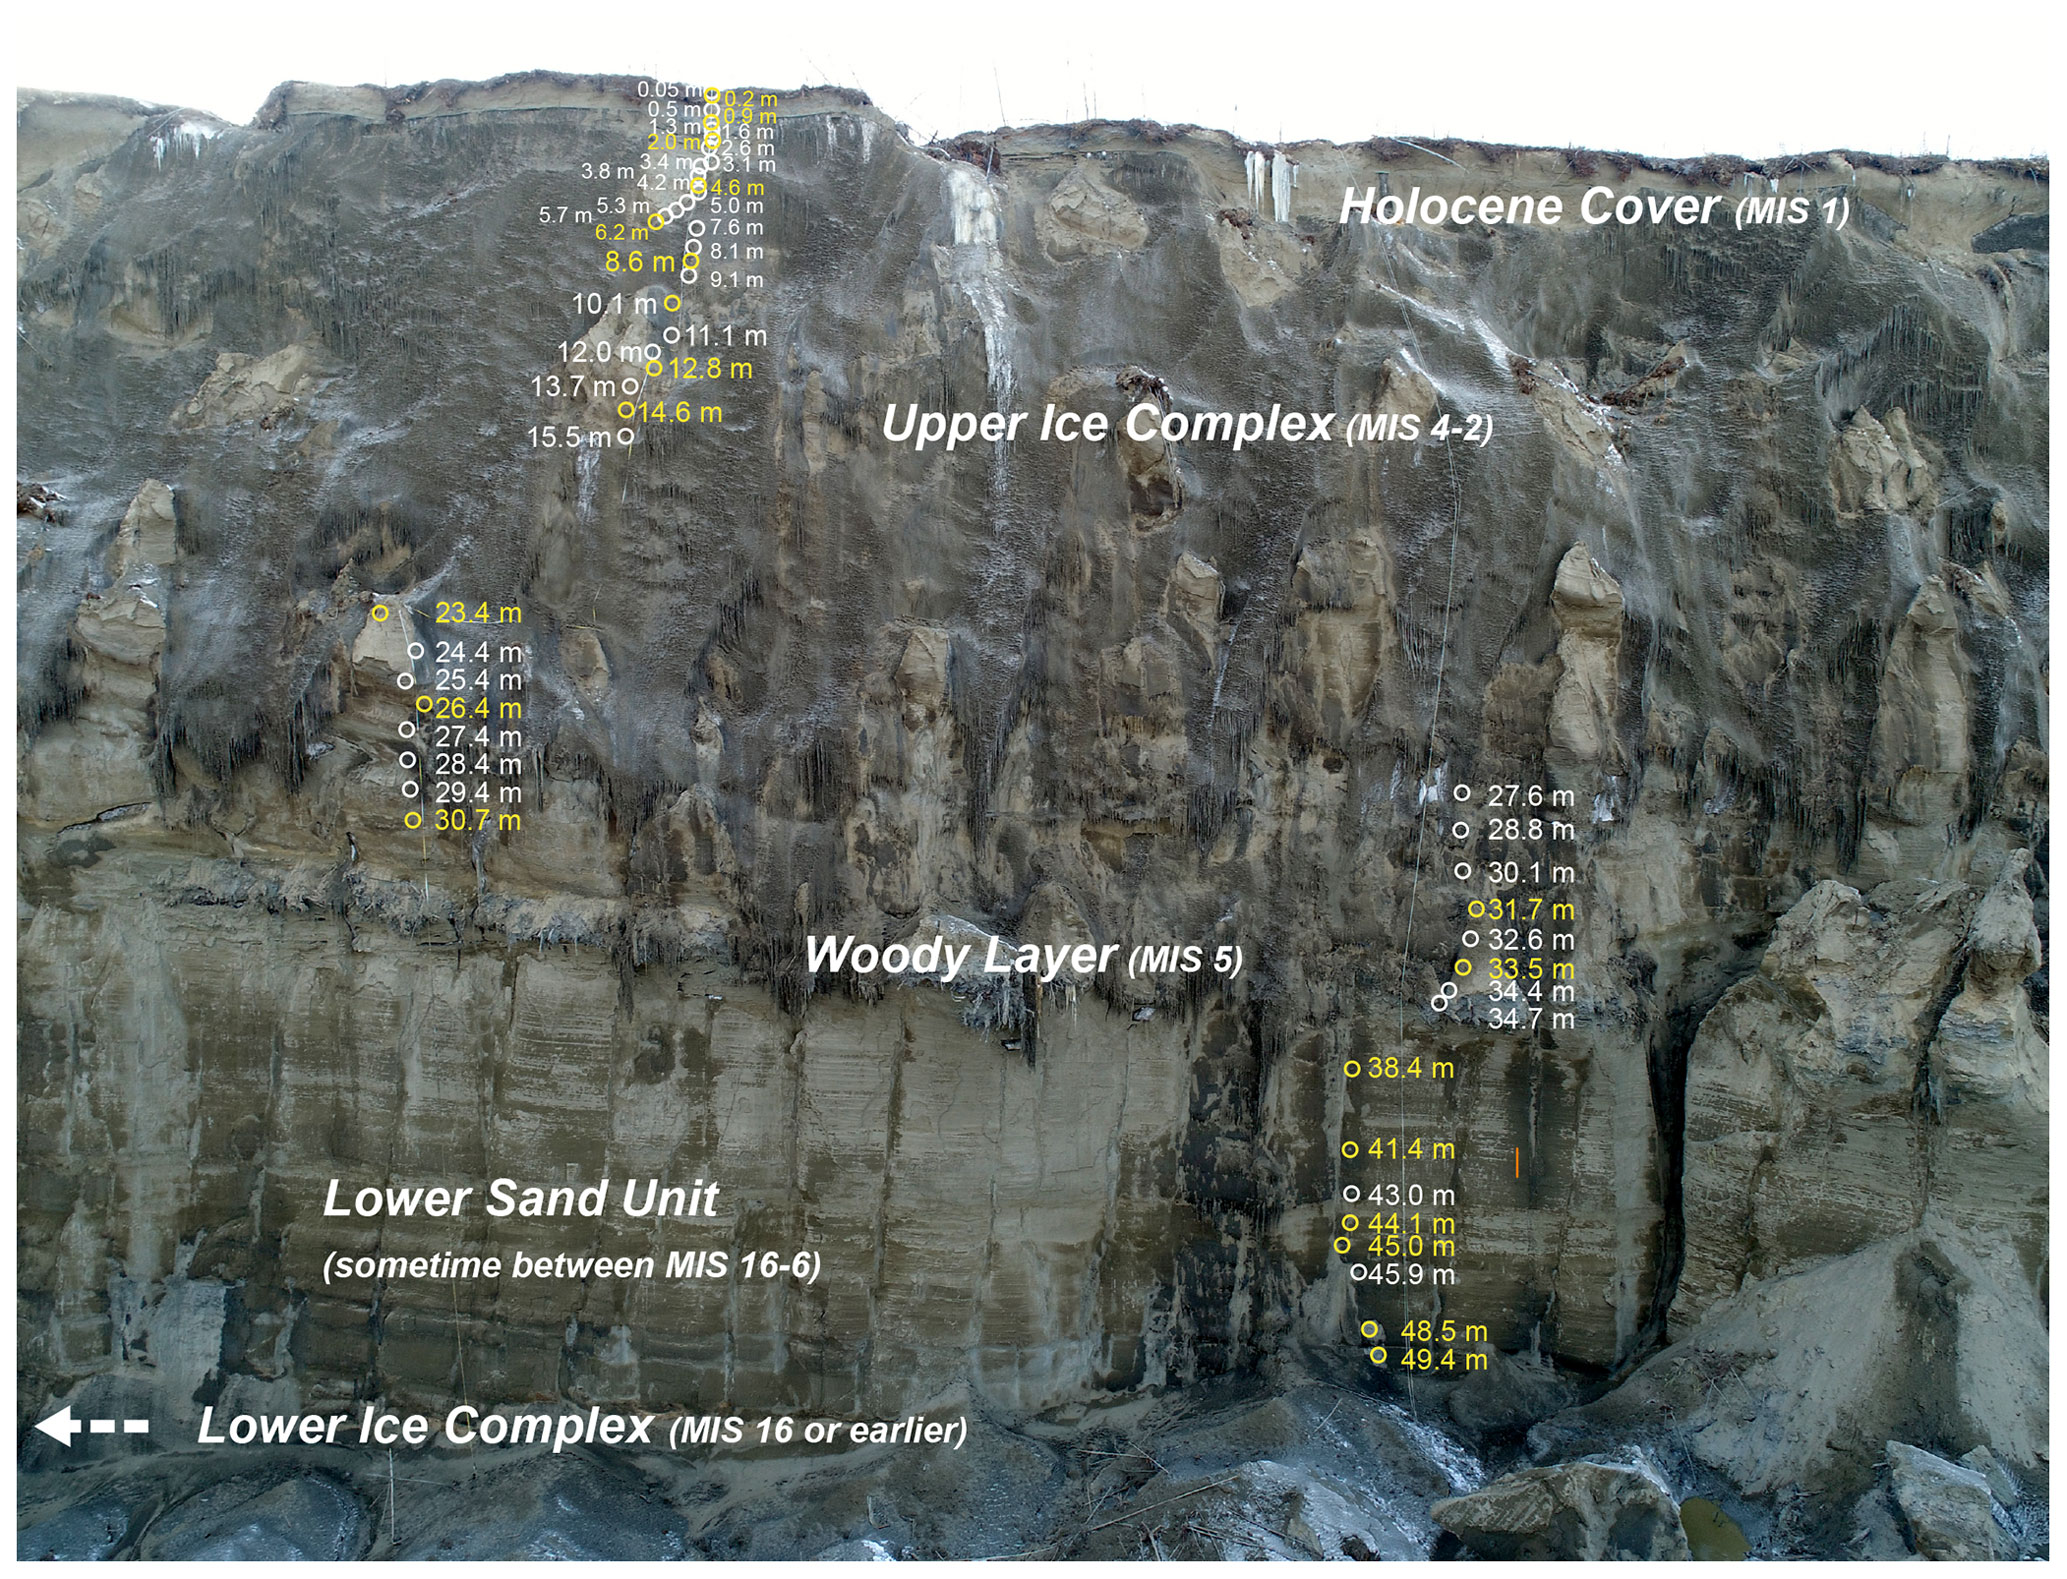
Figure A1Sediment profile B19-P1 (67.58004∘ N, 134.76130∘ E) at the west wall of the Batagay thaw slump. Positions of sediment samples for biomarker analyses (yellow circles) and other samples (white circles) are indicated. Stratigraphical units: lower ice complex, lower sand unit, woody layer, upper ice complex and Holocene cover. MIS: Marine Isotope Stage. Depth in metres below surface. The headwall is ∼55 m high. Source: photo from the spring expedition to Batagay in 2019.
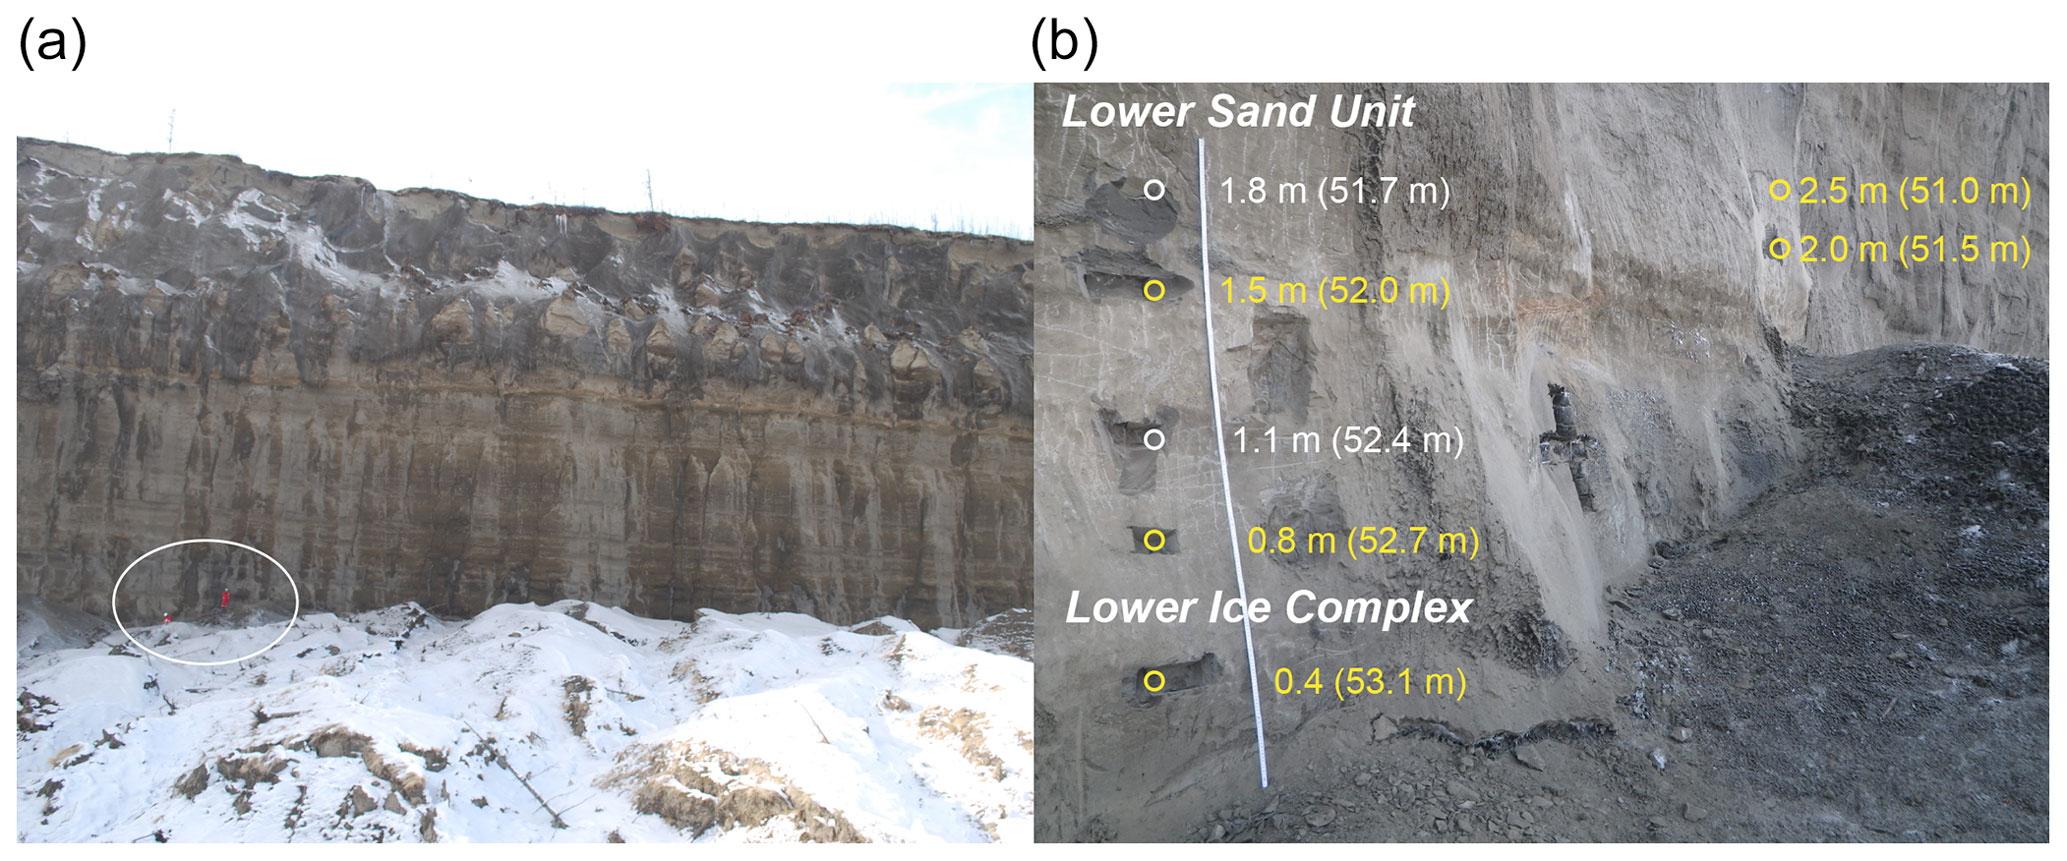
Figure A2Sediment profile B19-02 (67.57845∘ N, 134.76131∘ E). (a) Position of profile on the west wall (white circle). (b) Headwall profile with positions of sediment samples for biomarker analyses (yellow circles) and other samples (white circles) indicated. Depth in metres above slump bottom and approximate depth in metres below surface respective to B19-P1 in brackets. Figures A2 to A5 are adapted from Jongejans et al. (2021b); stratigraphic units are as in Fig. A1.
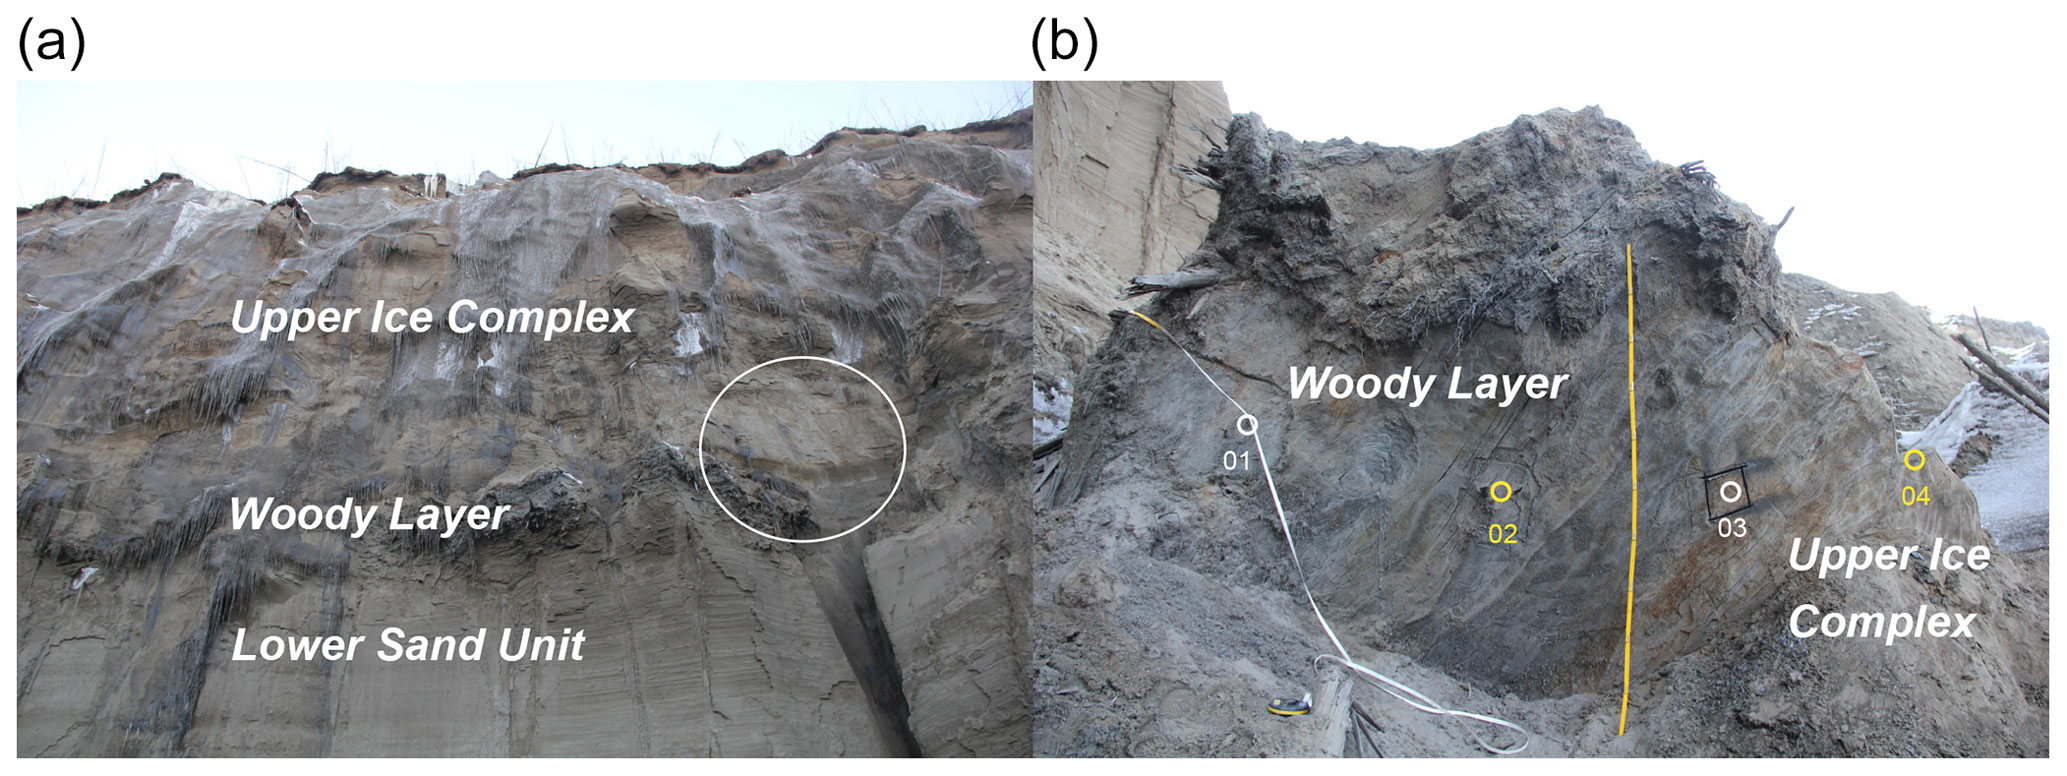
Figure A3Sediment profile B19-03 (67.58004∘ N, 134.76130∘ E). (a) Approximate position where the block has fallen from (white circle). (b) Block in the slump floor with position of sediment samples for biomarker analyses (yellow circles) and other samples (white circles) indicated.
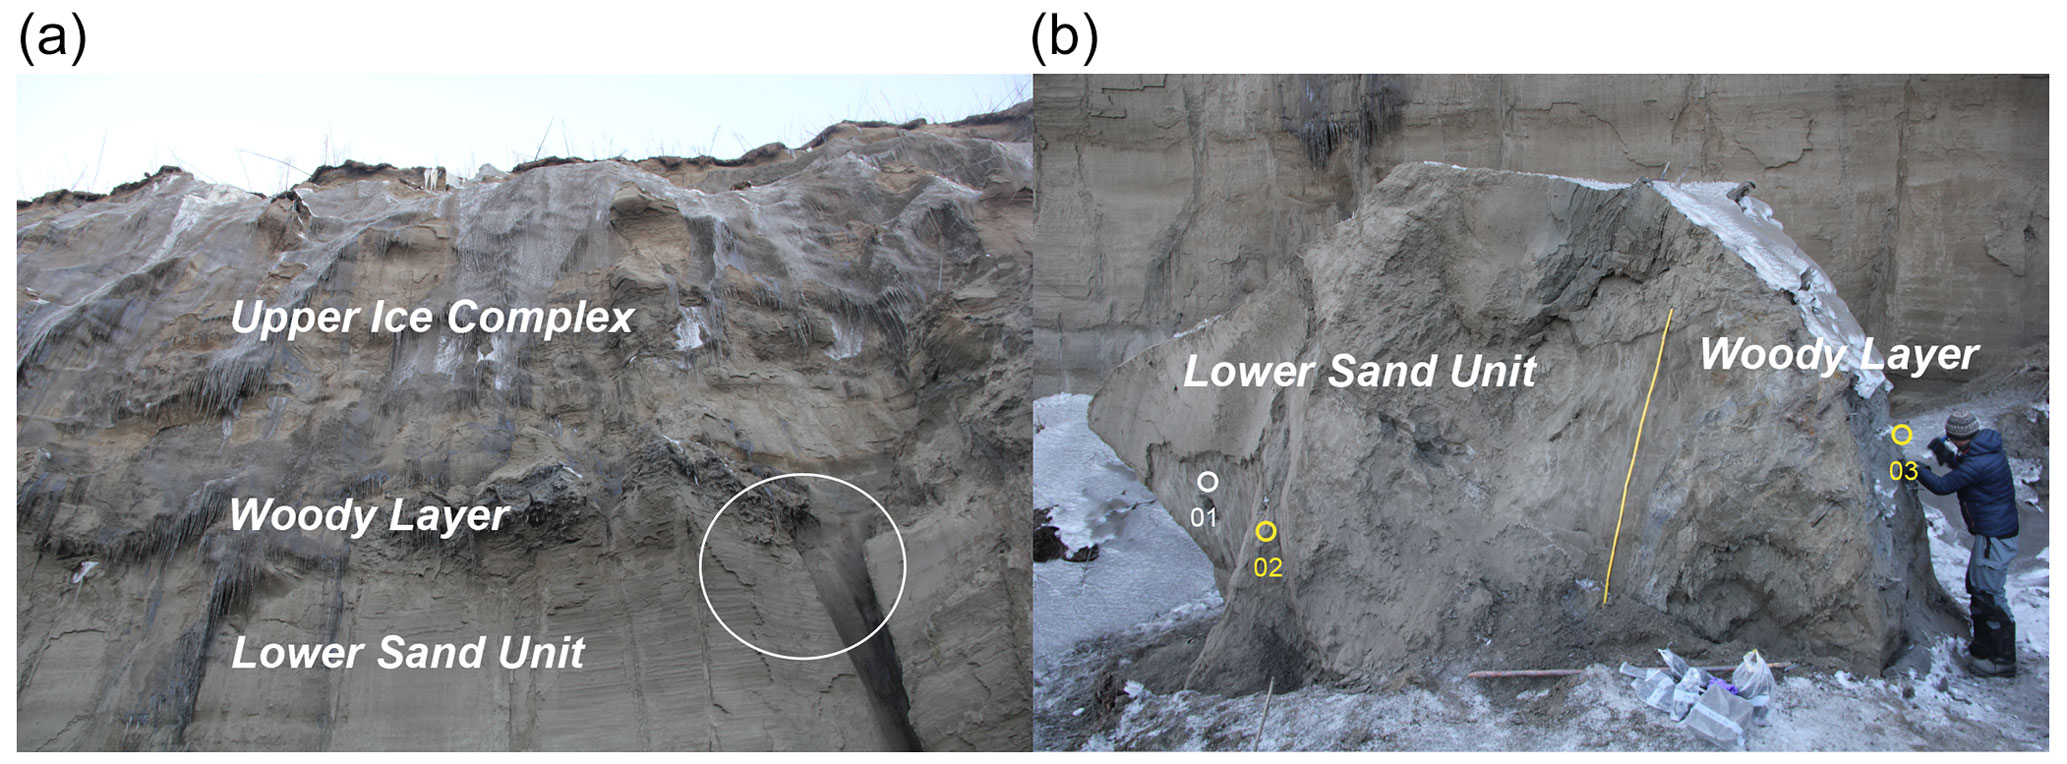
Figure A4Sediment profile B19-04 (67.58004∘ N, 134.76130∘ E). (a) Approximate position where the block has fallen from (white circle). (b) Block in the slump floor with position of sediment samples for biomarker analyses (yellow circles) and other samples (white circles) indicated.
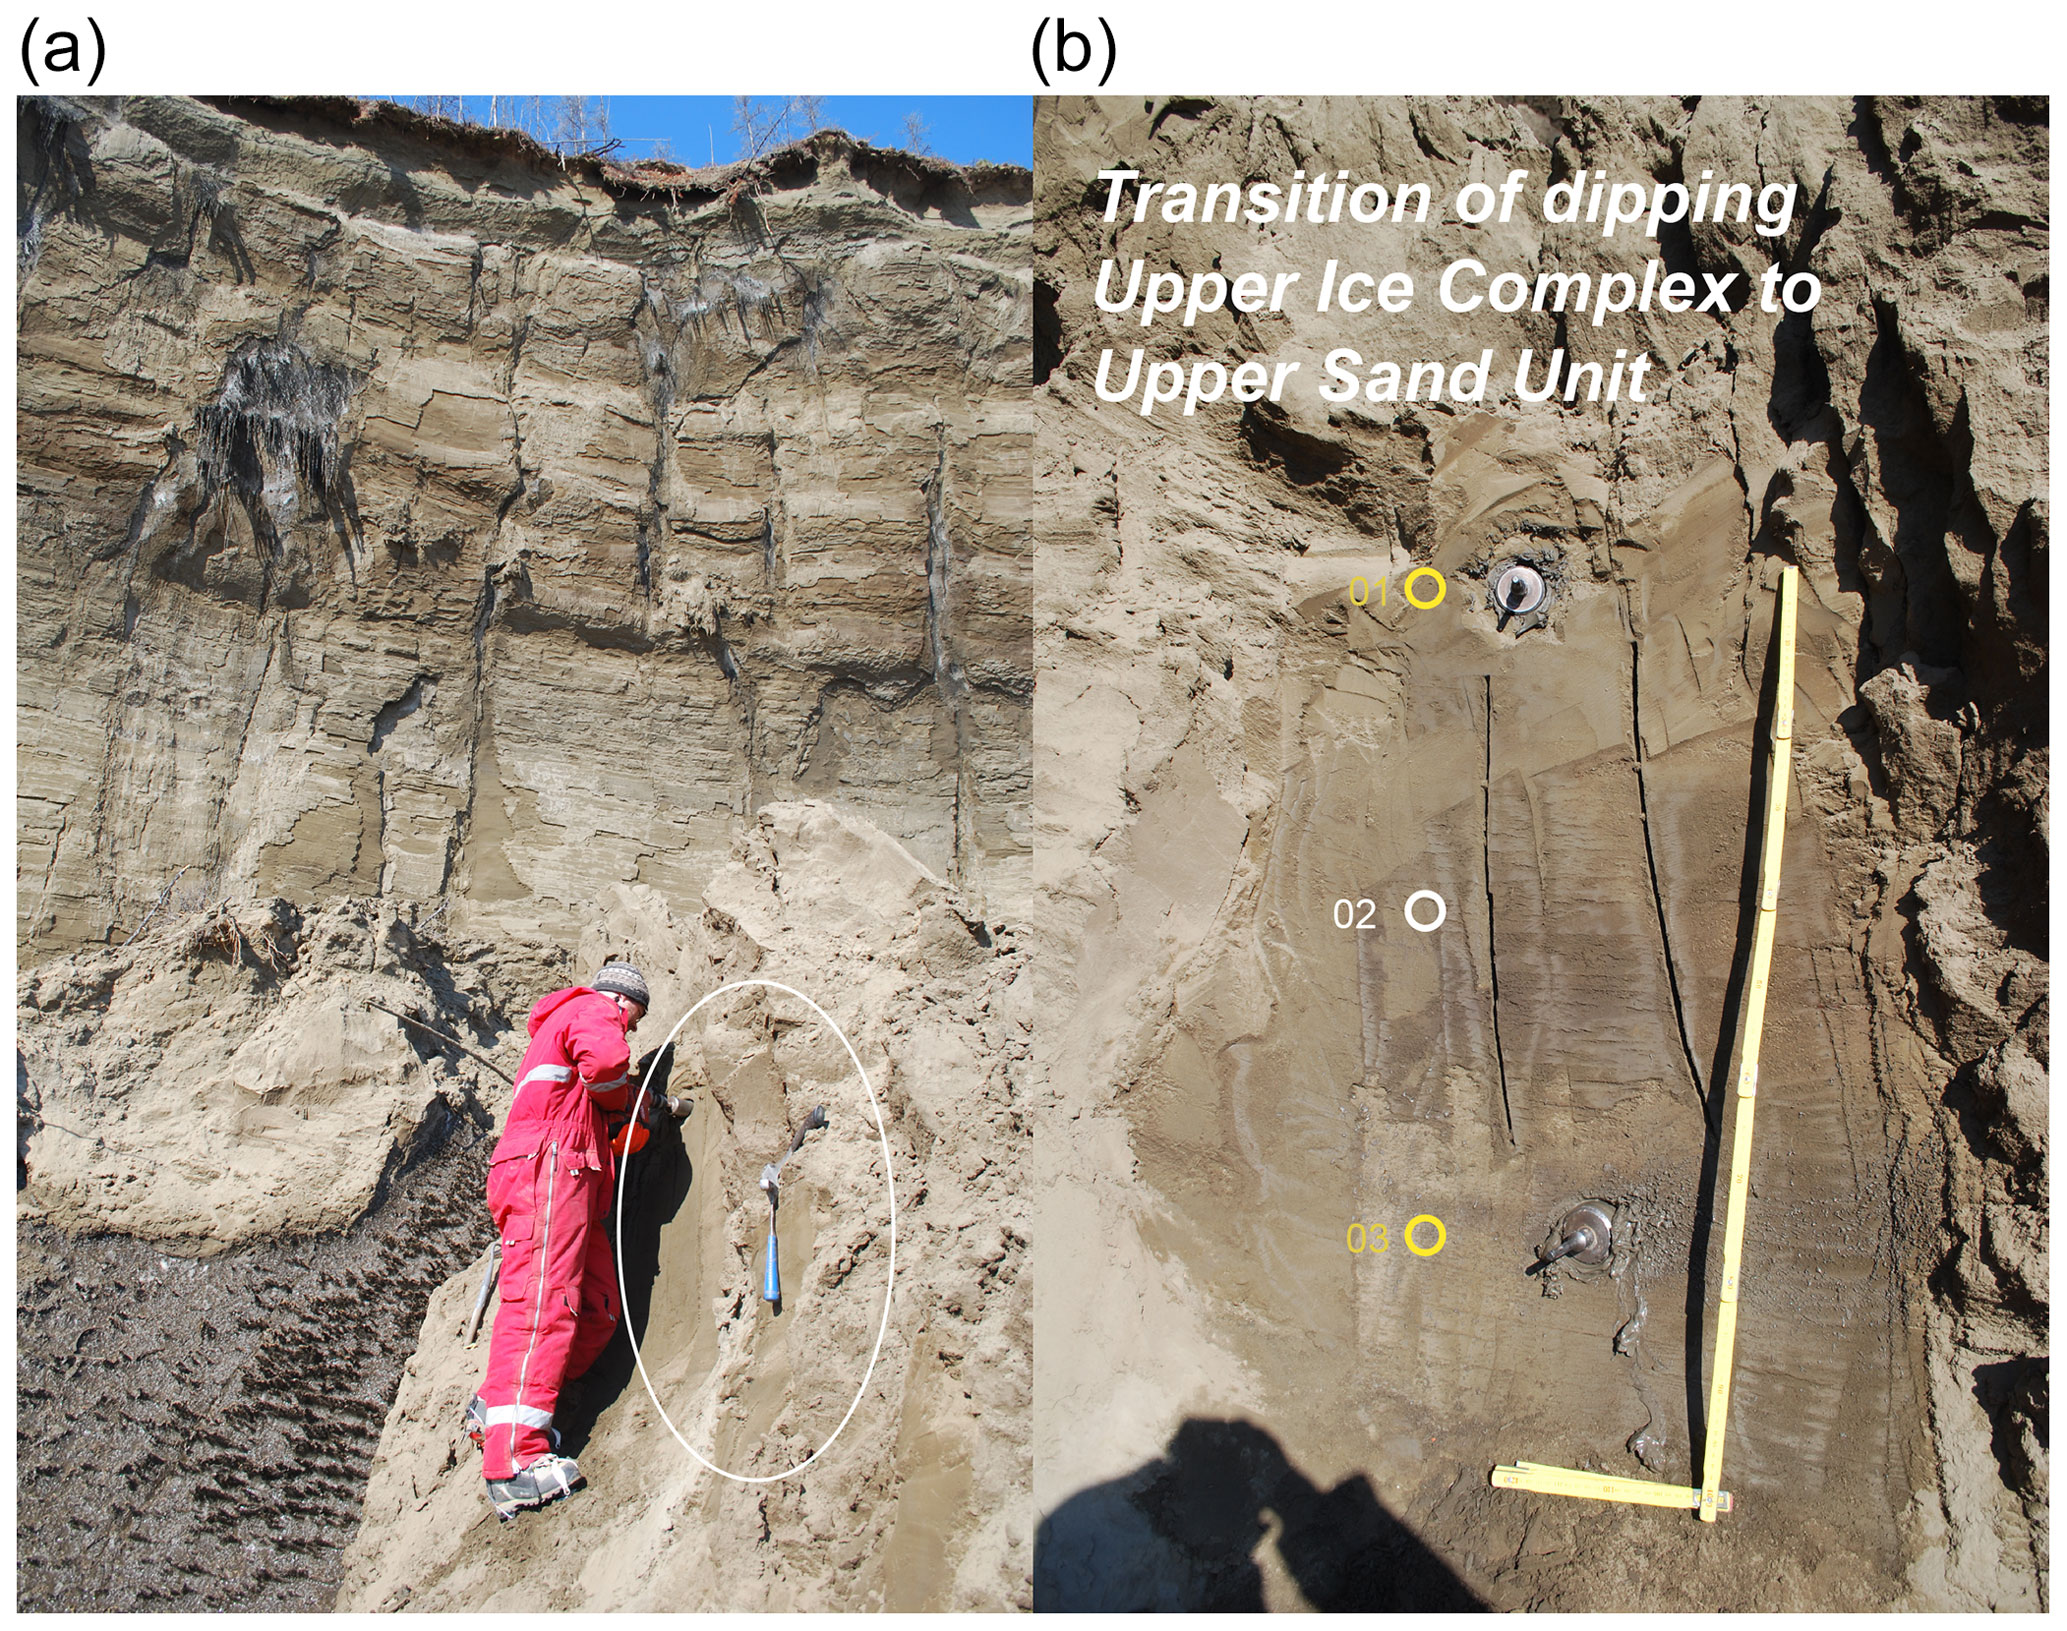
Figure A5Sediment profile B19-05 (67.58300∘ N, 134.76437∘ E). (a) Position of profile on the baidzherakh at the slump floor (white circle). (b) Baidzherakh profile with position of sediment samples for biomarker analyses (yellow circles) and other samples (white circles) indicated.
The alkane and fatty acid data as well as the biogeochemical data (TC, TOC, TN) are freely accessible in the PANGAEA (https://www.pangaea.de/, last access: 31 August 2022) data repository (Jongejans et al., 2022a, b, c).
The supplement related to this article is available online at: https://doi.org/10.5194/tc-16-3601-2022-supplement.
LJ and JS were responsible for the conceptualisation of the research. Fieldwork was carried out by LJ, TO, JC, HM, SW, AK, AS and IS. Data acquisition and analysis were carried out by LJ, KM, CK and JS. LJ wrote the original draft; all authors contributed to the review and editing of the manuscript.
The contact author has declared that none of the authors has any competing interests.
Publisher's note: Copernicus Publications remains neutral with regard to jurisdictional claims in published maps and institutional affiliations.
We would like to thank Dmitry Ukhin for his support in sample collection and Ilya Kozhenikov and Stepan Vasiliev from the Melnikov Permafrost Institute SB RAS Yakutsk for their logistical support during the fieldwork. We thank Justin Lindemann, Angélique Opitz and Jonas Sernau (AWI) and Anke Sobotta (GFZ) for their assistance in the laboratory. We thank AWI logistics for their help in the fieldwork logistics.
This research has been supported by the Deutsche Bundesstiftung Umwelt (PhD Scholarship); the Leverhulme Trust (grant no. RPG-2020-334); the Lomonosov Moscow State University (grant no. 121051100164-0); and the Alfred Wegener Institute, Helmholtz Centre for Polar and Marine Research (baseline funding).
The article processing charges for this open-access publication were covered by the Alfred Wegener Institute, Helmholtz Centre for Polar and Marine Research (AWI).
This paper was edited by Florent Dominé and reviewed by Jack Hutchings and two anonymous referees.
Ashastina, K., Schirrmeister, L., Fuchs, M., and Kienast, F.: Palaeoclimate characteristics in interior Siberia of MIS 6–2: first insights from the Batagay permafrost mega-thaw slump in the Yana Highlands, Clim. Past, 13, 795–818, https://doi.org/10.5194/cp-13-795-2017, 2017.
Ashastina, K., Kuzmina, S., Rudaya, N., Troeva, E., Schoch, W. H., Römermann, C., Reinecke, J., Otte, V., Savvinov, G., Wesche, K., and Kienast, F.: Woodlands and steppes: Pleistocene vegetation in Yakutia's most continental part recorded in the Batagay permafrost sequence, Quaternary Sci. Rev., 196, 38–61, https://doi.org/10.1016/j.quascirev.2018.07.032, 2018.
Brassell, S. C., Eglinton, G., and Maxwell, J. R.: The geochemistry of terpenoids and steroids, Portland Press Ltd., https://doi.org/10.1042/bst0110575, 1983.
Brocks, J. J., Grosjean, E., and Logan, G. A.: Assessing biomarker syngeneity using branched alkanes with quaternary carbon (BAQCs) and other plastic contaminants, Geochim. Cosmochim. Ac., 72, 871–888, https://doi.org/10.1016/j.gca.2007.11.028, 2008.
Bröder, L., Keskitalo, K., Zolkos, S., Shakil, S., Tank, S. E., Kokelj, S. V., Tesi, T., Dongen, B. E. V., Haghipour, N., Eglinton, T. I., and Vonk, J. E.: Preferential export of permafrost-derived organic matter as retrogressive thaw slumping intensifies, Environ. Res. Lett., 16, 054059, https://doi.org/10.1088/1748-9326/abee4b, 2021.
Courtin, J., Perfumo, A., Andreev, A. A., Opel, T., Stoof-Leichsenring, K. R., Edwards, M. E., Murton, J. B., and Herzschuh, U.: Pleistocene glacial and interglacial ecosystems inferred from ancient DNA analyses of permafrost sediments from Batagay megaslump, East Siberia, Environmental DNA, online first, 1–19, https://doi.org/10.1002/edn3.336, 2022.
Elvert, M., Pohlman, J. W., Becker, K. W., Gaglioti, B., Hinrichs, K.-U., and Wooller, M. J.: Methane turnover and environmental change from Holocene lipid biomarker records in a thermokarst lake in Arctic Alaska, Holocene, 26, 1766–1777, 2016.
Ficken, K. J., Barber, K. E., and Eglinton, G.: Lipid biomarker, δ13C and plant macrofossil stratigraphy of a Scottish montane peat bog over the last two millennia, Org. Geochem., 28, 217–237, https://doi.org/10.1016/S0146-6380(97)00126-5, 1998.
Ficken, K. J., Li, B., Swain, D., and Eglinton, G.: An n-alkane proxy for the sedimentary input of submerged/floating freshwater aquatic macrophytes, Org. Geochem., 31, 745–749, https://doi.org/10.1016/S0146-6380(00)00081-4, 2000.
Greenwood, P. F., Arouri, K. R., Logan, G. A., and Summons, R. E.: Abundance and geochemical significance of C2n dialkylalkanes and highly branched C3n alkanes in diverse Meso-and Neoproterozoic sediments, Org. Geochem., 35, 331–346, https://doi.org/10.1016/j.orggeochem.2003.10.013, 2004.
Günther, F., Grosse, G., Wetterich, S., Jones, B. M., Kunitsky, V. V., Kienast, F., and Schirrmeister, L.: The Batagay mega thaw slump, Yana Uplands, Yakutia, Russia: permafrost thaw dynamics on decadal time scale, TERRA NOSTRA-Schriften der GeoUnion Alfred-Wegener-Stiftung, hdl:10013/epic.45563, 2015.
Hamilton, T. D. and Brigham-Grette, J.: The last interglaciation in Alaska: Stratigraphy and paleoecology of potential sites, Quatern. Int., 10–12, 49–71, https://doi.org/10.1016/1040-6182(91)90040-U, 1991.
Jongejans, L. L., Strauss, J., Lenz, J., Peterse, F., Mangelsdorf, K., Fuchs, M., and Grosse, G.: Organic matter characteristics in yedoma and thermokarst deposits on Baldwin Peninsula, west Alaska, Biogeosciences, 15, 6033–6048, https://doi.org/10.5194/bg-15-6033-2018, 2018.
Jongejans, L. L., Mangelsdorf, K., Schirrmeister, L., Grigoriev, M. N., Maksimov, G. M., Biskaborn, B. K., Grosse, G., and Strauss, J.: n-Alkane Characteristics of Thawed Permafrost Deposits Below a Thermokarst Lake on Bykovsky Peninsula, Northeastern Siberia, Front. Environ. Sci., 8, 118, https://doi.org/10.3389/fenvs.2020.00118, 2020.
Jongejans, L.L., Liebner, S., Knoblauch, K., Mangelsdorf, K., Ulrich, M., Grosse, G., Tanski, G., Fedorov, A. N., Konstantinov, P., Windirsch, T., Wiedmann, J., and Strauss, J.: Greenhouse gas production and lipid biomarker distribution in Yedoma and Alas thermokarst lake sediments in Eastern Siberia, Glob. Change Biol., 27, 2822–2839, https://doi.org/10.1111/gcb.15566, 2021a.
Jongejans, L. L., Opel, T., Courtin, J., Meyer, H., Kizyakov, A. I., Syromyatnikov, I., Shepelev, A., and Wetterich, S.: Batagay Spring 2019, in: Russian-German Cooperation: Expeditions to Siberia in 2019, vol. 749, Alfred Wegener Institute for Polar and Marine Research, https://doi.org/10.48433/BzPM_0749_2021, 2021b.
Jongejans, L. L., Mangelsdorf, K., Karger, C., and Strauss, J.: Alkane distribution in ancient permafrost deposits at the Batagay Megaslump, East Siberia, PANGAEA [data set], 2022a.
Jongejans, L. L., Mangelsdorf, K., Karger, C., and Strauss, J.: Fatty acid distribution in ancient permafrost deposits at the Batagay Megaslump, East Siberia, PANGAEA [data set], 2022b.
Jongejans, L. L., Mangelsdorf, K., Karger, C. and Strauss, J.: Total (organic) carbon and nitrogen content in ancient permafrost deposits at the Batagay Megaslump, East Siberia, PANGAEA [data set], 2022c.
Kenig, F., Simons, D.-J. H., Crich, D., Cowen, J. P., Ventura, G. T., Rehbein-Khalily, T., Brown, T. C., and Anderson, K. B.: Branched aliphatic alkanes with quaternary substituted carbon atoms in modern and ancient geologic samples, P. Natl. Acad. Sci. USA, 100, 12554–12558, https://doi.org/10.1073/pnas.1735581100, 2003.
Kenig, F., Simons, D.-J. H., Crich, D., Cowen, J. P., Ventura, G. T., and Rehbein-Khalily, T.: Structure and distribution of branched aliphatic alkanes with quaternary carbon atoms in Cenomanian and Turonian black shales of Pasquia Hills (Saskatchewan, Canada), Org. Geochem., 36, 117–138, https://doi.org/10.1016/j.orggeochem.2004.06.014, 2005.
Kienast, F., Tarasov, P., Schirrmeister, L., Grosse, G., and Andreev, A. A.: Continental climate in the East Siberian Arctic during the last interglacial: Implications from palaeobotanical records, Global Planet. Change, 60, 535–562, https://doi.org/10.1016/j.gloplacha.2007.07.004, 2008.
Killops, S. D. and Killops, V. J.: 5.1.2 General differences between major groups of organisms, in: Introduction to Organic Geochemistry, Wiley, Somerset, 167, ISBN 978-1-118-69720-7, 2013.
Kokelj, S. V., Lacelle, D., Lantz, T. C., Tunnicliffe, J., Malone, L., Clark, I. D., and Chin, K. S.: Thawing of massive ground ice in mega slumps drives increases in stream sediment and solute flux across a range of watershed scales, J. Geophys. Res.-Earth, 118, 681–692, https://doi.org/10.1002/jgrf.20063, 2013.
Kokelj, S. V., Tunnicliffe, J., Lacelle, D., Lantz, T. C., Chin, K. S., and Fraser, R.: Increased precipitation drives mega slump development and destabilization of ice-rich permafrost terrain, northwestern Canada, Global Planet. Change, 129, 56–68, https://doi.org/10.1016/j.gloplacha.2015.02.008, 2015.
Kokelj, S. V., Lantz, T. C., Tunnicliffe, J., Segal, R., and Lacelle, D.: Climate-driven thaw of permafrost preserved glacial landscapes, northwestern Canada, Geology, 45, 371–374, https://doi.org/10.1130/G38626.1, 2017.
Kunitsky, V. V., Syromyatnikov, I., Schirrmeister, L., Skachov, Y. B., Grosse, G., Wetterich, S., and Grigoriev, M. N.: Ice-rich Permafrost and thermal denudation in the Batagay area (Yana Upland, East Siberia), Earth Cryosphere (Kriosfera Zemli), 17, 56–58, 2013.
Lacelle, D., Bjornson, J., and Lauriol, B.: Climatic and geomorphic factors affecting contemporary (1950–2004) activity of retrogressive thaw slumps on the Aklavik Plateau, Richardson Mountains, NWT, Canada, Permafrost Periglac., 21, 1–15, 2010.
Lacelle, D., Brooker, A., Fraser, R. H., and Kokelj, S. V.: Distribution and growth of thaw slumps in the Richardson Mountains–Peel Plateau region, northwestern Canada, Geomorphology, 235, 40–51, https://doi.org/10.1016/j.geomorph.2015.01.024, 2015.
Lantuit, H. and Pollard, W. H.: Temporal stereophotogrammetric analysis of retrogressive thaw slumps on Herschel Island, Yukon Territory, Nat. Hazards Earth Syst. Sci., 5, 413–423, https://doi.org/10.5194/nhess-5-413-2005, 2005.
Lantz, T. C. and Kokelj, S. V.: Increasing rates of retrogressive thaw slump activity in the Mackenzie Delta region, N. W. T., Canada, Geophys. Res. Lett., 35, L06502, https://doi.org/10.1029/2007GL032433, 2008.
Lewkowicz, A. G.: Headwall retreat of ground-ice slumps, Banks Island, Northwest Territories, Can. J. Earth Sci., 24, 1077–1085, https://doi.org/10.1139/e87-105, 1987.
Lewkowicz, A. G. and Way, R. G.: Extremes of summer climate trigger thousands of thermokarst landslides in a High Arctic environment, Nat. Commun., 10, 1329, https://doi.org/10.1038/s41467-019-09314-7, 2019.
Mann, P. J., Strauss, J., Palmtag, J., Dowdy, K., Ogneva, O., Fuchs, M., Bedington, M., Torres, R., Polimene, L., Overduin, P., Mollenhauer, G., Grosse, G., Rachold, V., Sobczak, W. V., Spencer, R. G. M., and Juhls, B.: Degrading permafrost river catchments and their impact on Arctic Ocean nearshore processes, Ambio, 51, 439–455, https://doi.org/10.1007/s13280-021-01666-z, 2022.
Martens, J., Wild, B., Muschitiello, F., O'Regan, M., Jakobsson, M., Semiletov, I., Dudarev, O., and Gustafsson, Ö.: Remobilization of dormant carbon from Siberian-Arctic permafrost during three past warming events, Science Advances, 6, 6546–6562, https://doi.org/10.1126/sciadv.abb6546, 2020.
Marzi, R., Torkelson, B. E., and Olson, R. K.: A revised carbon preference index, Org. Geochem., 20, 1303–1306, https://doi.org/10.1016/0146-6380(93)90016-5, 1993.
McGuire, A. D., Lawrence, D. M., Koven, C., Clein, J. S., Burke, E., Chen, G., Jafarov, E., MacDougall, A. H., Marchenko, S., Nicolsky, D., Peng, S., Rinke, A., Ciais, P., Gouttevin, I., Hayes, D. J., Ji, D., Krinner, G., Moore, J. C., Romanovsky, V., Schädel, C., Schaefer, K., Schuur, E. A. G., and Zhuang, Q.: Dependence of the evolution of carbon dynamics in the northern permafrost region on the trajectory of climate change, P. Natl. Acad. Sci. USA, 115, 3882–3887, https://doi.org/10.1073/pnas.1719903115, 2018.
Murton, J. B., Edwards, M. E., Lozhkin, A. V., Anderson, P. M., Savvinov, G. N., Bakulina, N., Bondarenko, O. V., Cherepanova, M. V., Danilov, P. P., Boeskorov, V., Goslar, T., Grigoriev, S., Gubin, S. V., Korzun, J. A., Lupachev, A. V., Tikhonov, A., Tsygankova, V. I., Vasilieva, G. V., and Zanina, O. G.: Preliminary paleoenvironmental analysis of permafrost deposits at Batagaika megaslump, Yana Uplands, northeast Siberia, Quaternary Res., 87, 314–330, https://doi.org/10.1017/qua.2016.15, 2017.
Murton, J. B., Opel, T., Toms, P., Blinov, A., Fuchs, M., Wood, J., Gärtner, A., Merchel, S., Rugel, G., Savvinov, G., and Wetterich, S.: A multimethod dating study of ancient permafrost, Batagay megaslump, east Siberia, Quaternary Res., 105, 1–22, https://doi.org/10.1017/qua.2021.27, 2022.
Ogihara, S. and Ishiwatari, R.: Unusual distribution of hydrocarbons in a hydrothermally altered phosphorite nodule from Kusu Basin, northern Kyushu, Japan, Org. Geochem., 29, 155–161, https://doi.org/10.1016/S0146-6380(98)00052-7, 1998.
Opel, T., Murton, J. B., Wetterich, S., Meyer, H., Ashastina, K., Günther, F., Grotheer, H., Mollenhauer, G., Danilov, P. P., Boeskorov, V., Savvinov, G. N., and Schirrmeister, L.: Past climate and continentality inferred from ice wedges at Batagay megaslump in the Northern Hemisphere's most continental region, Yana Highlands, interior Yakutia, Clim. Past, 15, 1443–1461, https://doi.org/10.5194/cp-15-1443-2019, 2019.
Peters, K. E., Walters, C. C., and Moldowan, J. M.: The biomarker guide, 1, Biomarkers and isotopes in the environment and human history, 2nd edn., Cambridge University Press, ISBN 9780521781589, 2005.
Piorreck, M., Baasch, K.-H., and Pohl, P.: Biomass production, total protein, chlorophylls, lipids and fatty acids of freshwater green and blue-green algae under different nitrogen regimes, Phytochemistry, 23, 207–216, https://doi.org/10.1016/S0031-9422(00)80304-0, 1984.
Poynter, J. and Eglinton, G.: 14. Molecular composition of three sediments from hole 717c: The Bengal fan, in: Proceedings of the Ocean Drilling Program: Scientific results, Ocean Drilling Program, College Station, TX, 155–161, 1990.
Radke, M., Willsch, H., and Welte, D. H.: Preparative hydrocarbon group type determination by automated medium pressure liquid chromatography, Anal. Chem., 52, 406–411, https://doi.org/10.1021/ac50053a009, 1980.
Reyes, A. V., Froese, D. G., and Jensen, B. J. L.: Permafrost response to last interglacial warming: field evidence from non-glaciated Yukon and Alaska, Quaternary Sci. Rev., 29, 3256–3274, https://doi.org/10.1016/j.quascirev.2010.07.013, 2010.
Rilfors, L., Wieslander, A., and Stahl, S.: Lipid and protein composition of membranes of Bacillus megaterium variants in the temperature range 5 to 70 ∘C, J. Bacteriol. Res., 135, 1043–1052, 1978.
Runge, A., Nitze, I., and Grosse, G.: Remote sensing annual dynamics of rapid permafrost thaw disturbances with LandTrendr, Remote Sens. Environ., 268, 112752, https://doi.org/10.1016/j.rse.2021.112752, 2022.
Sachse, D., Radke, J., and Gleixner, G.: δD values of individual n-alkanes from terrestrial plants along a climatic gradient – Implications for the sedimentary biomarker record, Org. Geochem., 37, 469–483, https://doi.org/10.1016/j.orggeochem.2005.12.003, 2006.
Savvinov, G., Danilov, P., Petrov, A., Makarov, V., Boeskorov, V., and Grigoriev, S.: Environmental problems of the Verkhoyansky Region, Vestnik of North-Eastern Federal University, Series Earth Sciences, 68, https://doi.org/10.25587/SVFU.2018.68.21798, 2018 (in Russian).
Schulte, S., Mangelsdorf, K., and Rullkötter, J.: Organic matter preservation on the Pakistan continental margin as revealed by biomarker geochemistry, Org. Geochem., 31, 1005–1022, https://doi.org/10.1016/S0146-6380(00)00108-X, 2000.
Schuur, E. A. G., McGuire, A. D., Schädel, C., Grosse, G., Harden, J. W., Hayes, D. J., Hugelius, G., Koven, C. D., Kuhry, P., Lawrence, D. M., Natali, S. M., Olefeldt, D., Romanovsky, V. E., Schaefer, K., Turetsky, M. R., Treat, C. C., and Vonk, J. E.: Climate change and the permafrost carbon feedback, Nature, 520, 171–179, https://doi.org/10.1038/nature14338, 2015.
Shiea, J., Brassell, S. C., and Ward, D. M.: Mid-chain branched mono- and dimethyl alkanes in hot spring cyanobacterial mats: A direct biogenic source for branched alkanes in ancient sediments?, Org. Geochem., 15, 223–231, https://doi.org/10.1016/0146-6380(90)90001-G, 1990.
Stapel, J. G., Schirrmeister, L., Overduin, P. P., Wetterich, S., Strauss, J., Horsfield, B., and Mangelsdorf, K.: Microbial lipid signatures and substrate potential of organic matter in permafrost deposits: Implications for future greenhouse gas production, J. Geophys. Res.-Biogeo., 121, 2652–2666, https://doi.org/10.1002/2016JG003483, 2016.
Strauss, J., Schirrmeister, L., Mangelsdorf, K., Eichhorn, L., Wetterich, S., and Herzschuh, U.: Organic-matter quality of deep permafrost carbon – a study from Arctic Siberia, Biogeosciences, 12, 2227–2245, https://doi.org/10.5194/bg-12-2227-2015, 2015.
Strauss, J., Abbott, B. W., Hugelius, G., Schuur, E. A. G., Treat, C. C., Fuchs, M., Schädel, C., Ulrich, M., Turetsky, M., Keuschnig, M., Biasi, C., Yang, Y., and Grosse, G.: Permafrost, in: Recarbonizing global soils: A technical manual of recommended management practices. Volume 2: Hot spots and bright spots of soil organic carbon, FAO, Rome, Italy, https://doi.org/10.4060/cb6378en, 2021.
Tanski, G., Lantuit, H., Ruttor, S., Knoblauch, C., Radosavljevic, B., Strauss, J., Wolter, J., Irrgang, A. M., Ramage, J., and Fritz, M.: Transformation of terrestrial organic matter along thermokarst-affected permafrost coasts in the Arctic, Sci. Total Environ., 581–582, 434–447, https://doi.org/10.1016/j.scitotenv.2016.12.152, 2017.
Turetsky, M. R., Abbott, B. W., Jones, M. C., Anthony, K. W., Olefeldt, D., Schuur, E. A. G., Grosse, G., Kuhry, P., Hugelius, G., Koven, C., Lawrence, D. M., Gibson, C., Sannel, A. B. K., and McGuire, A. D.: Carbon release through abrupt permafrost thaw, Nat. Geosci., 13, 138–143, https://doi.org/10.1038/s41561-019-0526-0, 2020.
Vadakkedath, V., Zawadzki, J., and Przeździecki, K.: Multisensory satellite observations of the expansion of the Batagaika crater and succession of vegetation in its interior from 1991 to 2018, Environ. Earth Sci., 79, 150, https://doi.org/10.1007/s12665-020-8895-7, 2020.
van Everdingen, R. O. (Ed.): Multi-language glossary of permafrost and related ground-ice terms, NSIDC, https://nsidc.org/learn/cryosphere-glossary (last access: 13 December 2021), 2005.
Vasil'chuk, Yu. K., Vasil'chuk, J. Yu., Budantseva, N. A., and Vasil'chuk, A. C.: New AMS Dates of Organic Microinclusions in Ice Wedges from the Lower Part of Batagay Yedoma, Yakutia, Dokl. Earth Sci., 490, 100–103, https://doi.org/10.1134/S1028334X20020154, 2020.
Volkman, J. K.: A review of sterol markers for marine and terrigenous organic matter, Org. Geochem., 9, 83–99, 1986.
Vonk, J. E., Mann, P. J., Davydov, S., Davydova, A., Spencer, R. G. M., Schade, J., Sobczak, W. V., Zimov, N., Zimov, S., Bulygina, E., Eglinton, T. I., and Holmes, R. M.: High biolability of ancient permafrost carbon upon thaw, Geophys. Res. Lett., 40, 2689–2693, https://doi.org/10.1002/grl.50348, 2013.
Yao, Y., Huang, Y., Zhao, J., Wang, L., Ran, Y., Liu, W., and Cheng, H.: Permafrost thaw induced abrupt changes in hydrology and carbon cycling in Lake Wudalianchi, northeastern China, Geology, 49, 1117–1121, 2021.
Zech, M., Buggle, B., Leiber, K., Marković, S., Glaser, B., Hambach, U., Huwe, B., Stevens, T., Sümegi, P., Wiesenberg, G., and Zöller, L.: Reconstructing Quaternary vegetation history in the Carpathian Basin, SE-Europe, using n-alkane biomarkers as molecular fossils: Problems and possible solutions, potential and limitations, E&G Quaternary Sci. J., 58, 148–155, https://doi.org/10.3285/eg.58.2.03, 2010.
Zhang, Y., Su, Y., Liu, Z., Chen, X., Yu, J., Di, X., and Jin, M.: Long-chain branched/cyclic alkanes in recent sediment of Lake Fuxian and their environmental implications, Sci. Bull., 59, 1139–1150, https://doi.org/10.1007/s11434-014-0159-z, 2014.