the Creative Commons Attribution 4.0 License.
the Creative Commons Attribution 4.0 License.
 | 29 Aug 2022
Using snow depth observations to provide insight into the quality of snowpack simulations for regional-scale avalanche forecasting
Pascal Haegeli
The combination of numerical weather prediction and snowpack models has potential to provide valuable information about snow avalanche conditions in remote areas. However, the output of snowpack models is sensitive to precipitation inputs, which can be difficult to verify in mountainous regions. To examine how existing observation networks can help interpret the accuracy of snowpack models, we compared snow depths predicted by a weather–snowpack model chain with data from automated weather stations and manual observations. Data from the 2020–2021 winter were compiled for 21 avalanche forecast regions across western Canada covering a range of climates and observation networks. To perform regional-scale comparisons, SNOWPACK model simulations were run at select grid points from the High-Resolution Deterministic Prediction System (HRDPS) numerical weather prediction model to represent conditions at treeline elevations, and observed snow depths were upscaled to the same locations. Snow depths in the Coast Mountain range were systematically overpredicted by the model, while snow depths in many parts of the interior Rocky Mountain range were underpredicted. These discrepancies had a greater impact on simulated snowpack conditions in the interior ranges, where faceting was more sensitive to snow depth. To put the comparisons in context, the quality of the upscaled observations was assessed by checking whether snow depth changes during stormy periods were consistent with the forecast avalanche hazard. While some regions had high-quality observations, other regions were poorly represented by available observations, suggesting in some situations modelled snow depths could be more reliable than observations. The analysis provides insights into the potential for validating weather and snowpack models with readily available observations, as well as for how avalanche forecasters can better interpret the accuracy of snowpack simulations.
- Article
(7607 KB) - Full-text XML
- BibTeX
- EndNote


Numerical weather prediction (NWP) models provide valuable information to avalanche forecasters, as avalanche conditions are heavily influenced by the evolution of weather patterns. With years of operational experience, forecasters develop a grounded understanding of how well specific NWP models predict weather in their local mountains. Predicting snowpack conditions in a similar way may be possible by forcing snowpack evolution models such as SNOWPACK or Crocus with output from NWP models (Morin et al., 2020). However, developing operational trust and understanding in snowpack models is difficult due to the complexity and spatial variability of mountain snowpacks.
Efforts to verify snowpack models have faced challenges due to various sources of uncertainty in the models, the verification data, and their spatial representativeness (Morin et al., 2020). Snowpack models have been evaluated with different types of verification data including avalanche hazard assessments (Bellaire et al., 2017; Giraud et al., 1987), snowpack stability (Reuter et al., 2015; Schweizer et al., 2006), snow profile stratigraphy observations (Bellaire and Jamieson, 2013; Brun et al., 1992; Calonne et al., 2020; Durand et al., 1999; Lehning et al., 2002; Viallon-Galinier et al., 2020), satellite-retrieved optical properties (Charrois et al., 2016; Cluzet et al., 2020), and snow depth and snow water equivalent observations (Bellaire et al., 2011; Durand et al., 2009; Lafaysse et al., 2013; Schmid et al., 2014). Many of these datasets have limited application for real-time monitoring because they are point-scale observations and require dedicated data collection campaigns. Quéno et al. (2016) and Vionnet et al. (2019) performed regional-scale comparisons of modelled snow depths with spatially distributed point observations, and Winstral et al. (2018) and Cluzet et al. (2022) have recently developed systems to assimilate snow depth observations into snowpack models. Real-time model verification systems would be valuable for avalanche forecasters learning how to interpret snowpack model output.
Several types of data streams are available to avalanche forecasters, including manual observations of weather, snowpack, and avalanches from field observers and continuous data from automated weather stations and avalanche detection networks. While each of these data streams could be used to verify aspects of snowpack models, all observation networks are limited in their spatial–temporal coverage and their representativeness of regional-scale avalanche conditions. Lundquist et al. (2020) identify similar challenges with observation networks for applications such as mountain hydrology and ecology and therefore conclude that in many contexts the skill in modelling mountain precipitation is now comparable to observation networks. The quality and density of avalanche-related observations vary by region, but it could be misleading to assume available field observations are more representative of regional-scale conditions than models in contexts where observations are sparse or irregular.
While snowpack models are sensitive to all weather input variables, precipitation is consistently identified as the main driver of uncertainty in the simulated stratigraphy (Raleigh et al., 2015; Richter et al., 2020). Observations of winter precipitation are available from different types of measurements including cumulative precipitation from rain gauges, snow water equivalent from snow pillows, and snow depth from acoustic sensors or manual probing (Wang et al., 2017). Of these, snow depth observations are typically the most abundant and representative type of precipitation observation available in most avalanche forecast regions and accordingly could be a relatively simple data stream to perform operational verification.
In this study, snow depths from a NWP and snowpack model chain are compared to snow depth observations compiled from existing networks across western Canada. The objective was to investigate how these observations could help avalanche forecasters interpret the accuracy of snowpack models at regional scales. This included assessing the reliability of the observations, comparing modelled and observed snow depths across space and time, and investigating the impacts of incorrect snow depths on the resulting snowpack stratigraphy. The results provide insights into how avalanche forecasters can better interpret the accuracy of snowpack simulations in data-sparse regions and highlight the potential for snow depth observations to verify and improve NWP and snowpack models in mountainous terrain.
The three key datasets for this study were snowpack simulations, snow depth observations, and avalanche hazard assessments. This section outlines how each of these datasets were compiled to evaluate regional-scale snowpack simulations across western Canada for the 2020–2021 winter season. The analysis was restricted to a 4-month period when regular manual observations and hazard assessments were available (December 1 to March 31), which limits the scope of the study to the snow accumulation period when avalanche forecasters are primarily interested in dry snow avalanches.
2.1 Study area
Data were compiled for 21 public avalanche forecast regions in British Columbia, Alberta, and Yukon (Fig. 1a). The regions were grouped into three mountain ranges based on their predominant snow climate characteristics – the maritime Coast Mountains, the transitional Columbia Mountains, and the continental Rocky Mountains (Shandro and Haegeli, 2018). To collect data that were representative of avalanche conditions in these regions, we focused the analysis on conditions near treeline elevations. Avalanche forecasters classify terrain into alpine, treeline, and below treeline bands based on terrain and vegetation characteristics. The snowpack at treeline tends to be sheltered from the wind and therefore more homogenous than in the alpine.
Since there are no strict definitions for the boundaries of the vegetation bands, we derived an objective reference for treeline elevations from a digital elevation model and land cover classification data. First, pixels with any type of forested land cover were identified from the 30 m resolution 2015 land cover of North America (North American Land Change Monitoring System, 2015), and the elevation of these pixels was extracted from a 30 arcsec resolution global digital elevation model (Danielson and Gesch, 2011). The elevations were aggregated on a 10 km × 10 km grid to determine the maximum elevation of forested terrain within each grid cell, as well as the maximum elevation of all terrain within the cell. Local estimates of treeline elevation were taken from any cell where the maximum elevation was at least 250 m above the maximum forest elevation, as these cells likely contained high alpine terrain where trees would not grow. The local treeline estimates were interpolated across the entire study area with a thin spline regression to estimate the upper extent of forested terrain. The resulting elevations ranged from 545 m in the northwestern regions to 2025 m in the southeastern regions (Fig. 1b). Feedback from avalanche forecasters suggested the elevations derived from this method roughly aligned with their understanding of vegetation bands in western Canada.
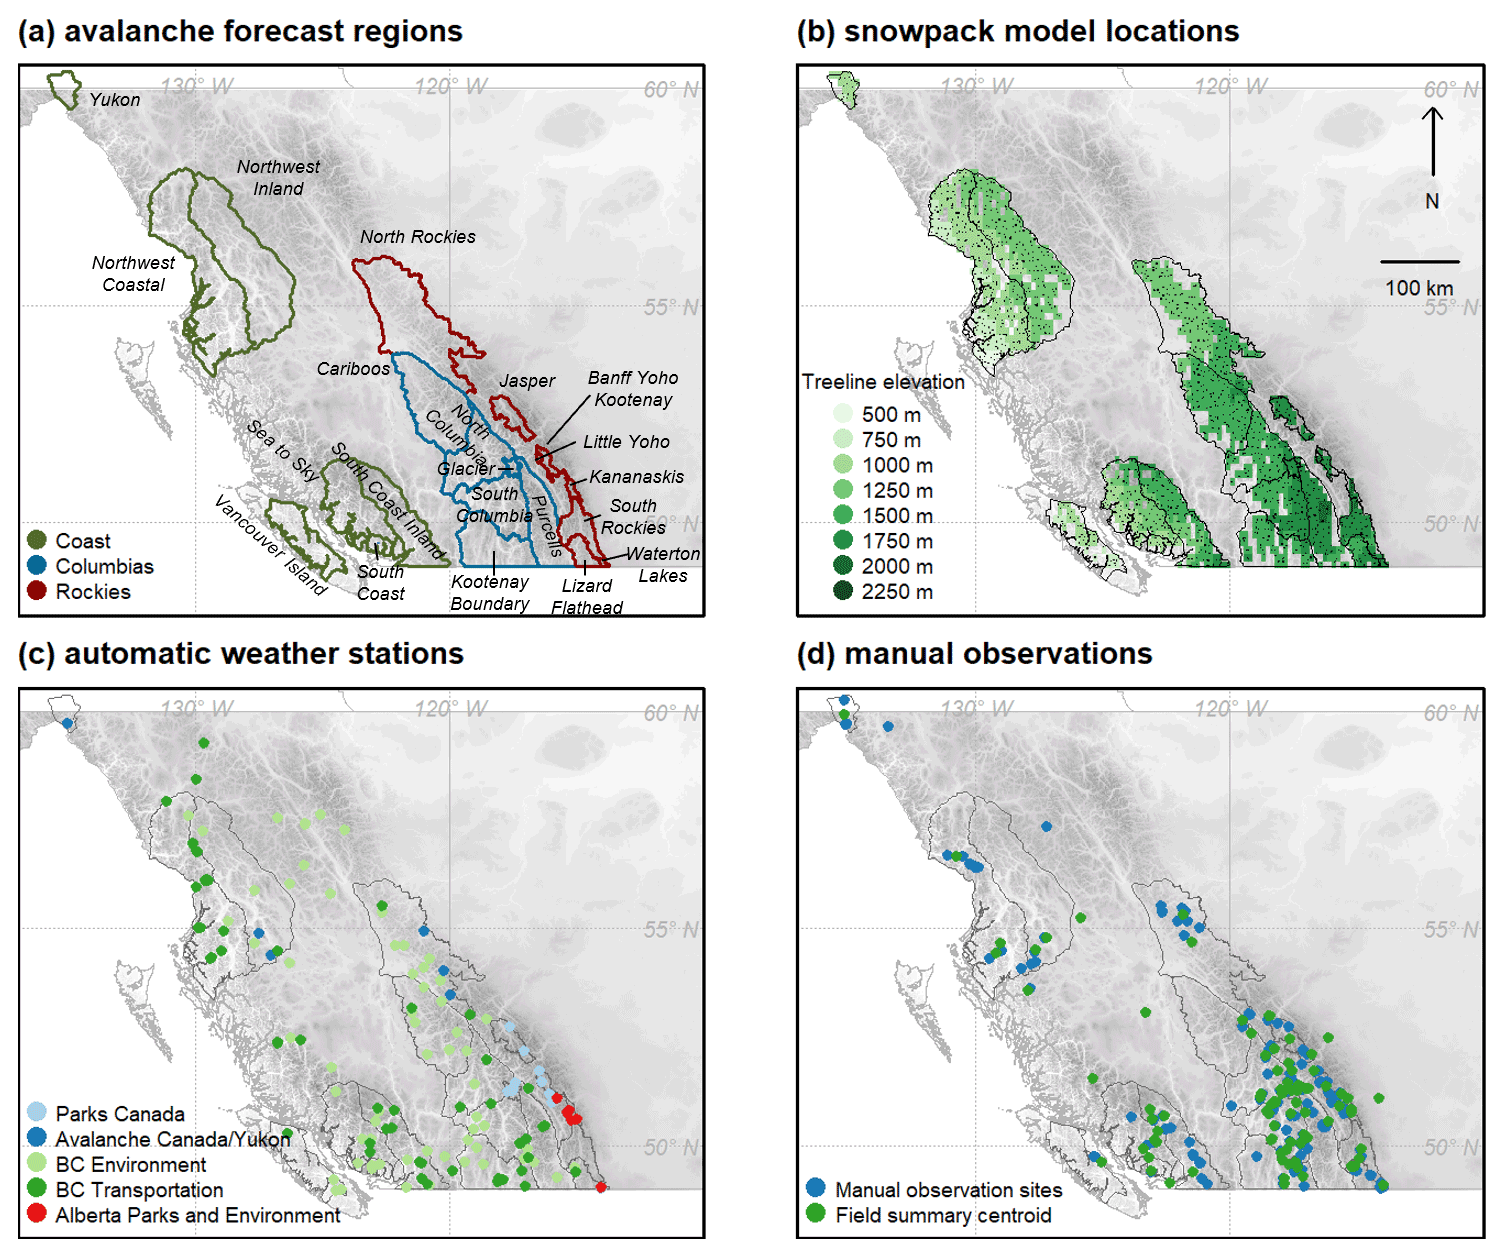
Figure 1Location of (a) avalanche forecast regions, (b) snowpack model grid points for each 10 km × 10 km grid cell colour-coded by local treeline elevation, (c) automatic weather stations, and (d) manual observations and field summaries.
2.2 Snowpack simulations
Snowpack simulations were produced by forcing SNOWPACK (Lehning et al., 1999) with output from the High-Resolution Deterministic Prediction System (HRDPS), an operational NWP model run by the Canadian Meteorological Centre on a 2.5 km horizontal grid (Milbrandt et al., 2016). Simulations were configured to represent treeline snowpack conditions across the 21 avalanche forecast regions.
A subset of grid points were sampled to represent regional-scale conditions rather than running SNOWPACK at all available grid points. First, only grid points within 100 vertical metres of the local treeline elevation were considered. Then the forecast regions were split into 10 km × 10 km grid cells and one grid point was selected for each cell by choosing the point with the median accumulated precipitation over the study period. Selecting one point for each 10 km × 10 km grid cell was found to effectively reduce redundant information, while selecting the point with median accumulated precipitation smoothed out small-scale orographic effects resolved by the model. Grid cells without treeline elevation terrain were omitted, resulting in a total of 1260 NWP grid points covering the study area (Fig. 1b).
Snowpack simulations were produced for these 1260 grid points by concatenating forecasts from each operational run of the HRDPS, starting on 1 September 2020. The HRDPS is initialized every 6 h, and SNOWPACK was forced with data from the 6 to 12 predictive hours from each run. Inputs to SNOWPACK included hourly accumulated precipitation, air temperature and relative humidity at 2 m above ground, wind speed at 10 m above ground, and incoming longwave and shortwave radiation fluxes at the surface. SNOWPACK version 3.6 was configured with default settings for flat-field profiles and with snow transport by wind disabled. The height of snowpack (HS), hereafter referred to as snow depth, was output each day at 00:00 UTC (16:00/17:00 local time).
2.3 Snow depth observations
Snow depth observations were compiled from three sources: automated weather stations, manual observations, and field summaries. The following sections describe how daily values of snow depth (HS) were obtained from each source.
2.3.1 Automated weather stations
Weather data were queried from an Avalanche Canada database that aggregates automated weather stations (AWSs) deemed relevant for operational avalanche forecasting (Fig. 1c). Of the 238 stations in this database, 110 were equipped with ultrasonic snow depth sensors and were within 500 vertical metres of treeline elevation. These stations were operated by various agencies including Parks Canada (14 stations), British Columbia Ministry of Transportation and Infrastructure (25 stations), British Columbia Ministry of Environment (59 stations), Alberta Environment and Parks (6 stations), Avalanche Canada (4 stations), and the Yukon Avalanche Association (2 stations). While some networks already applied quality control to the data, an additional spike removal filter was applied to remove observations where HS increased or decreased more than 10 cm in 1 h. HS values were extracted at 00:00 UTC each day. The number of daily observations fluctuated due to sensor and transmission errors, resulting in a median of 100 observations per day.
2.3.2 Manual observations
Avalanche safety operations report manual weather observations on the Canadian Avalanche Association's Information Exchange (InfoEx). Weather observations consist of manual measurements taken at fixed instrumented study plots following standards published by the Canadian Avalanche Association (2016) where snow depth is measured on a permanent stake. While observations are typically made twice per day, only afternoon observations were included in this study to be consistent with the timing of the other data sources. Over the entire study period, 94 operations reported observations from 194 different study plots with known geographic coordinates and elevations (Fig. 1d). The number of reports submitted fluctuated over the study period, with a median of 71 observations per day.
2.3.3 Field summaries
Avalanche operations also report field weather summaries to the InfoEx, which are distinct from weather observations made at fixed study plots. Field weather summaries summarize the range of conditions encountered in a broad geographic area while travelling in the mountains (Canadian Avalanche Association, 2016). Field summaries include subjective and spatially broader estimates of HS that are relevant for assessing avalanche hazard in that area, often based on several measurements made throughout the day. The geographic extent of these observations is less precise than manual observations, which are defined by polygons covering their operating areas and with elevation ranges that typically span treeline elevation. Figure 1d shows the polygon centroids for 98 operations that reported field summaries over the study period. Fewer operations submit field summaries than manual observations, resulting in a median of 18 observations per day.
2.4 Avalanche hazard assessments
Avalanche hazard assessments were compiled to assess how well-modelled and observed data captured impactful snowfall events. Daily forecasts were compiled for all 21 forecast regions over the study period. Forecasts were published following the workflow described by the conceptual model of avalanche hazard (Statham et al., 2018) and include a nowcast assessment of current danger ratings and avalanche problems. To quantify regional-scale snowfall events, days with storm slab avalanche problems at treeline were identified. Storm slab problems have the most direct link with new snow under the North American avalanche problem definitions (Statham et al., 2018), and Horton et al. (2020b) showed a strong statistical relationship between storm slab problems and new snow depths. Two components from the hazard assessments were extracted to characterize snowfall events: the presence of a storm slab avalanche problem at treeline (a binary value of absent or present) and the danger rating at treeline on days with storm slab problems (ordinal values of 1 – low, 2 – moderate, 3 – considerable, 4 – high, and 5 – extreme). The number of days with storm slab problems over the study period ranged from six for the Kananaskis region to 73 for the Northwest Coastal region.
This section describes how the datasets were prepared and analysed to answer three questions.
-
How reliable were the observations for regional-scale assessments?
-
How did modelled and observed snow depths compare across space and time?
-
How do snow depth discrepancies impact the interpretation of snowpack stratigraphy?
Figure 2 summarizes the methods used to answer these questions. First, the observed snow depths were upscaled to a regional scale to match the scale and extent of the model data (Sect. 3.1). Then daily snow depth changes were calculated for both datasets (Sect. 3.2), and the reliability of the upscaled observations was assessed with two methods: first, from the uncertainty in the upscaling method, and, second, by fitting regression models to see whether avalanche conditions were better explained by snow depth changes from the modelled or observation data (Sect. 3.3). Snow depths were compared across space and time with basic statistical measures (Sect. 3.4). Finally, to investigate the impact on snowpack stratigraphy, two sets of simulated snow profiles were compared: one produced with the original NWP model data and the second with adjusted precipitation inputs (Sect. 3.5).
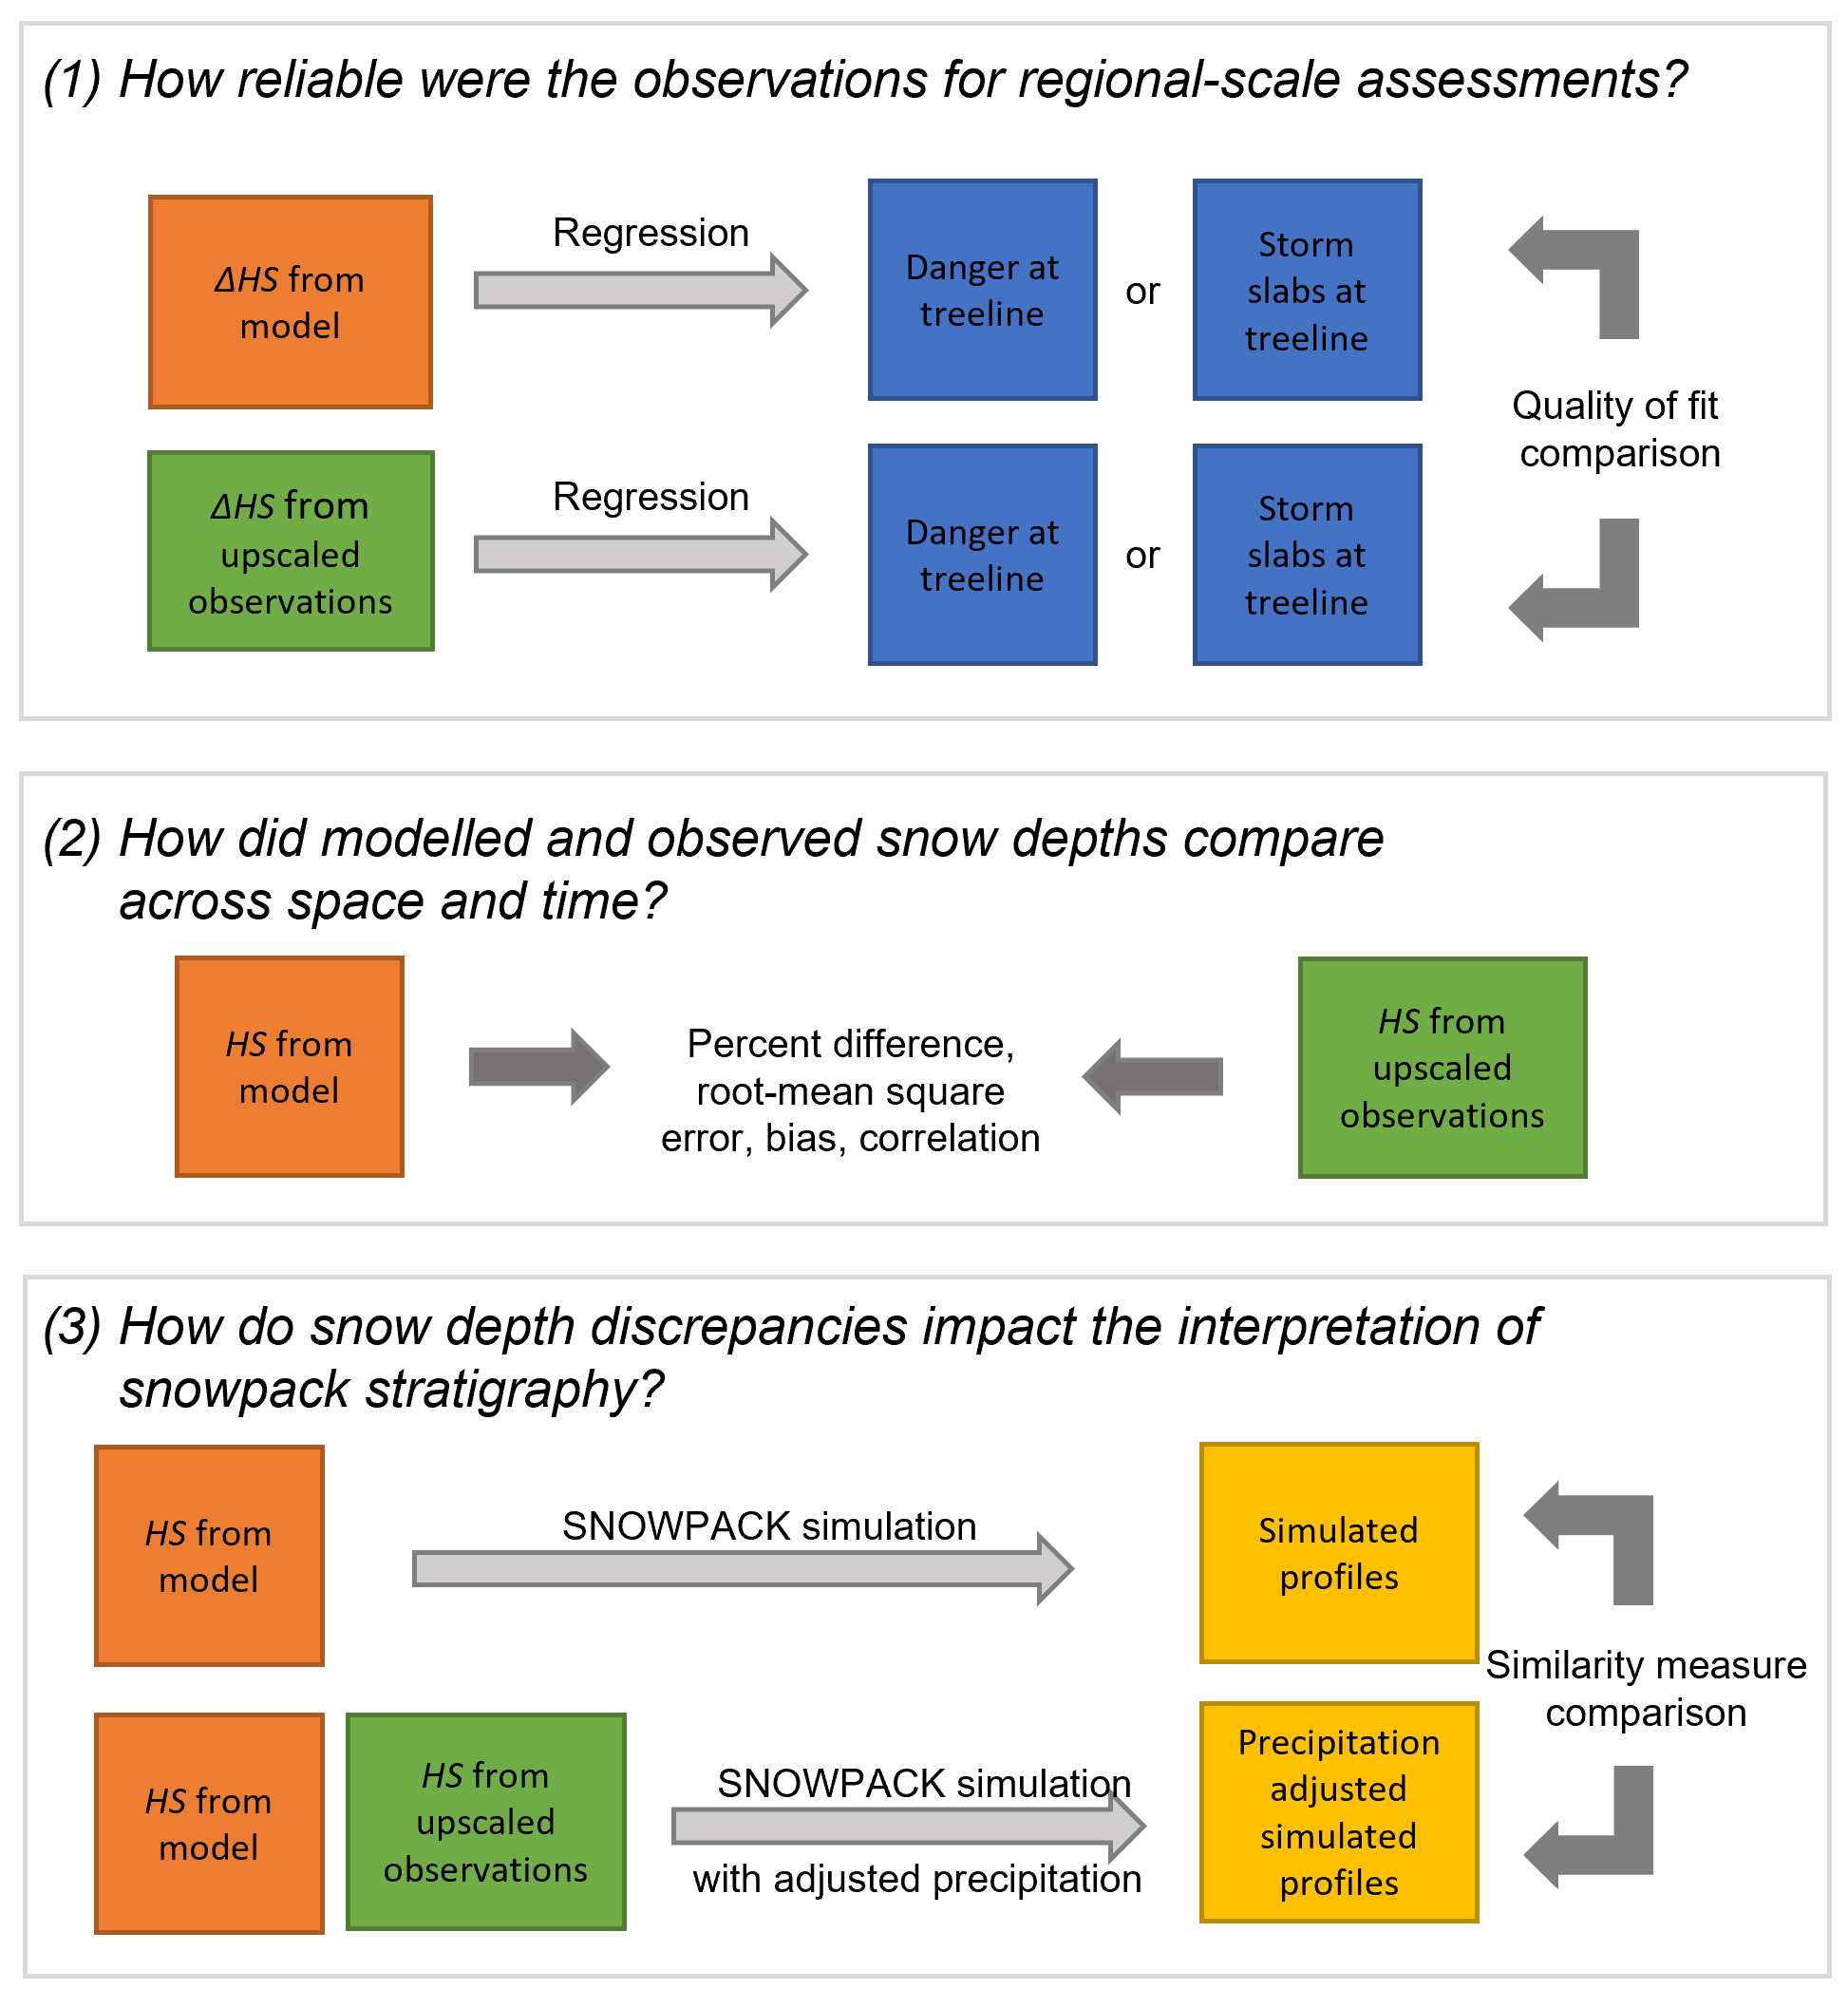
Figure 2Methods used to analyse the reliability of the observations at regional scales, compare modelled and observed snow depths, and measure the impact of snow depth discrepancies on snowpack simulations.
3.1 Upscaling observations to regional scale
Observed snow depths were upscaled to a regional scale in two steps: first a lapse rate adjustment was applied to estimate the observed value at the local treeline elevation, and then a spatial interpolation was applied to predict treeline elevation snow depths across the entire study area. The interpolation was not designed to capture fine-scale patterns across terrain but rather aggregate available observations in an analogous way to how human forecasters interpret point observations in regional hazard assessments.
Elevation adjustments were applied to the AWSs and manual observations to account for differences between the observation elevation (zobs) and the local treeline elevation (ztreeline). Field summaries were not adjusted as their elevations were unknown but typically already represent conditions at treeline elevations (Canadian Avalanche Association, 2016). HS was lapse rate adjusted with the exponential precipitation-adjustment factor proposed by Thornton et al. (1997), which is commonly applied in hydrological models (e.g., Liston and Elder, 2006; Schirmer and Jamieson, 2015):
where HStreeline is the adjusted snow depth at treeline derived from the original observed depth HSobs. A lapse rate factor of 0.35 was suggested for winter months in the western USA by Thornton et al. (1997). Since the observations were restricted to those within 500 vertical metres of treeline, the original snow depths were multiplied by factors ranging from 0.70 to 1.42.
Spatial interpolations were applied to the treeline corrected HS observations with simple kriging. The gstat package for R was used to fit a unique variogram model for HS on each day of the study period to describe the structure of the spatial correlation (Pebesma, 2004). Given the sparsity of observations, the best fitting of three possible variogram models was chosen (spherical, exponential, and pure nugget), where the best fit was chosen according gstat's default method of weighting residuals (i.e., number of pairs in a bin divided by the square of the bin's distance). Simple kriging was applied with the best variogram model to predict HS at all 1260 model grid points for each day of the study period. Each prediction combined all available observations from AWSs, manual observations, and field summaries.
The kriging predictions also provided an estimate of prediction variance (), which was used to estimate the uncertainty in the upscaled observations. Relative kriging standard deviation (RKSD) was defined at the square root of the prediction variance divided by the predicted height:
The RKSD is a relative measure where small values suggest the interpolation error was small relative to the predicted snow depth and large values suggest the error was large relative to the predicted snow depth.
3.2 Calculating daily snow depth changes
To identify snowfall events, daily snow depth changes (ΔHS) were calculated by subtracting HS on consecutive days (e.g., Quéno et al., 2016; Vionnet et al., 2019). The objective was to identify snowfall events large enough to impact avalanche conditions, and so negative values of ΔHS were set to zero. For the model data ΔHS was calculated at each grid point for every day of the study period. For the observation data ΔHS was calculated from the original observations for all cases where HS was observed at the same location on consecutive days, and then the same upscaling methods were applied to estimate upscaled ΔHS values at treeline elevations on the same spatial grid as the model data.
3.3 Regression models relating snow depth change to avalanche conditions
To assess the reliability of the modelled and observed data to represent regional-scale conditions, regression models were fit to predict forecast avalanche conditions from snow depth changes. Snowfall has been shown to be a strong predictor of avalanche hazard, as Schirmer et al. (2009) found 3 d accumulations of new snow to be a strong predictor of avalanche danger and Horton et al. (2020b) found 3 d snow accumulations to have a strong influence on the presence of storm slab avalanche problems. Therefore, for this analysis we assumed increases in snow depth should be proportional to the likelihood of storm slab avalanche problems and the likelihood of increased avalanche danger. To test this assumption, regression models were fit to predict (1) the presence of storm slab problems and (2) the danger rating using the 3 d snow depth change (ΔHS(3d)) as the single predictor. The 3 d snow depth change was calculated by summing ΔHS with a 3 d moving window over the study period.
For each forecast region, a univariate logistic regression model was fit to predict the probability of a storm slab avalanche problem being present based on ΔHS(3d) from model data at grid points in the region, and an analogous logistic regression model was fit using ΔHS(3d) from upscaled observation data at the same locations. The goodness of fit of the two models was compared with McFadden's pseudo-R2 measure (an analogous value to the coefficient of determination that can be applied to general linear models) to assess whether the modelled or upscaled observations explained storm slab presence better in each forecast region.
A similar approach was used to fit ordinal regression models in each forecast region to predict the probability of the danger rating increasing with ΔHS(3d). These models were restricted to days when storm slab avalanche problems were present, as the danger would more likely be driven by other factors on days without storm slab problems. The ordinal regression models were fit using the cumulative link model from the ordinal package for R (Christensen, 2019). Again, McFadden's pseudo-R2 measure was used to determine which dataset provided a better explanation of danger ratings in each region.
3.4 Comparing snow depths
The continuous snow depth data from the model and upscaled observations allowed plotting spatial comparison on maps and temporal comparisons on time series. Snow depths were compared with basic quantitative metrics, including the percent difference to provide a relative measure of the differences, root mean square error to assess the magnitude of the differences, bias to assess the prevailing direction of the differences, and Spearman rank-order correlation coefficient to determine whether a set of modelled and upscaled observation data increased at the same locations or times. These statistics are defined as follows:
where HSmod is the modelled snow depth, HSobs is the snow depth from upscaled observations, and n is the number of observation pairs. The Spearman rank-ordered correlation coefficient is defined as the Pearson correlation between the rank values of HSmod and HSobs rather than the correlation between the values themselves.
3.5 Adjusting precipitation inputs of the simulated snow profiles
To illustrate the impact snow depth discrepancies could have on how forecasters interpret the simulated snowpack structure, a sample of locations were chosen to compare the snowpack simulations with the original NWP model inputs and profiles with adjusted precipitation inputs. One representative location was chosen for each region by selecting the grid point that most frequently had the median modelled snow depth over the study period. A precipitation-adjustment factor (k) was calculated for each location according to
based on the modelled and upscaled HS at that location over the study period. Averaging the factor provided a rough approximation of the potential magnitude and direction of precipitation biases at that location. The hourly precipitation inputs at each grid point location were multiplied by k, and SNOWPACK was re-run to produce a second set of profiles. This method assumes the main driver of snow depth differences was biased precipitation inputs. While precipitation biases play an important role in these difference, errors in modelled snow depth are influenced by many processes in snowpack models including the parameterization of snow density (Helfricht et al., 2018), handling of precipitation type, and simulating settlement processes. While this simple precipitation-adjustment method is not the state of the art in data assimilation (Cluzet et al., 2022; Winstral et al., 2018), it provides a simple approach to analyse the impact of precipitation errors in different regions.
The original and precipitation-adjusted profile simulations were compared numerically by applying the similarity measure introduced by Herla et al. (2021). The similarity measure performs a pairwise comparison of two profiles from a perspective of stratigraphy features relevant to avalanche hazard. To calculate the similarity measure, the algorithm first aligns each layer with dynamic time warping, where the deposition date, grain type, and hardness are used to match layers in the two profiles. After alignment, the algorithm compares the similarity of the grain type and hardness of aligned layers, while putting more weight on weak layers, melt–freeze crusts, and new snow layers. The similarity measure ranges from 0 to 1, where 0 corresponds to highly dissimilar profiles and 1 corresponds to identical profiles. The similarity value of the original and precipitation-adjusted profiles was computed for each day of the study period to quantify the impact adjusting precipitation inputs had on the interpretation of avalanche hazard conditions.
4.1 Reliability of snow depth observations for regional-scale assessments
Snow depths were upscaled with greater confidence in areas with dense observation networks, such as the southern end of the Coast range and the central Columbia range (Fig. 3). In these areas, the average RKSD of the snow depths was 20 %–30 % of the total estimated snow depth, while areas with lowest confidence had RKSD values up to 40 %–60 % of the snow depth. The median RKSD for all grid points over the study period was 34 %, suggesting the aggregation of snow depths from available observations had considerable uncertainty across many forecast regions.

Figure 3The average relative kriging standard deviation (RKSD) over the study period shows areas with relatively high or low confidence in upscaling observed snow depths to regional scales.
Table 1Comparison of regression models predicting the presence of storm slab avalanche problems and danger ratings with modelled data versus upscaled observation data. McFadden's pseudo-R2 values are listed for each model to compare their goodness of fit. The model with the better fit for each region is identified with an asterisks.
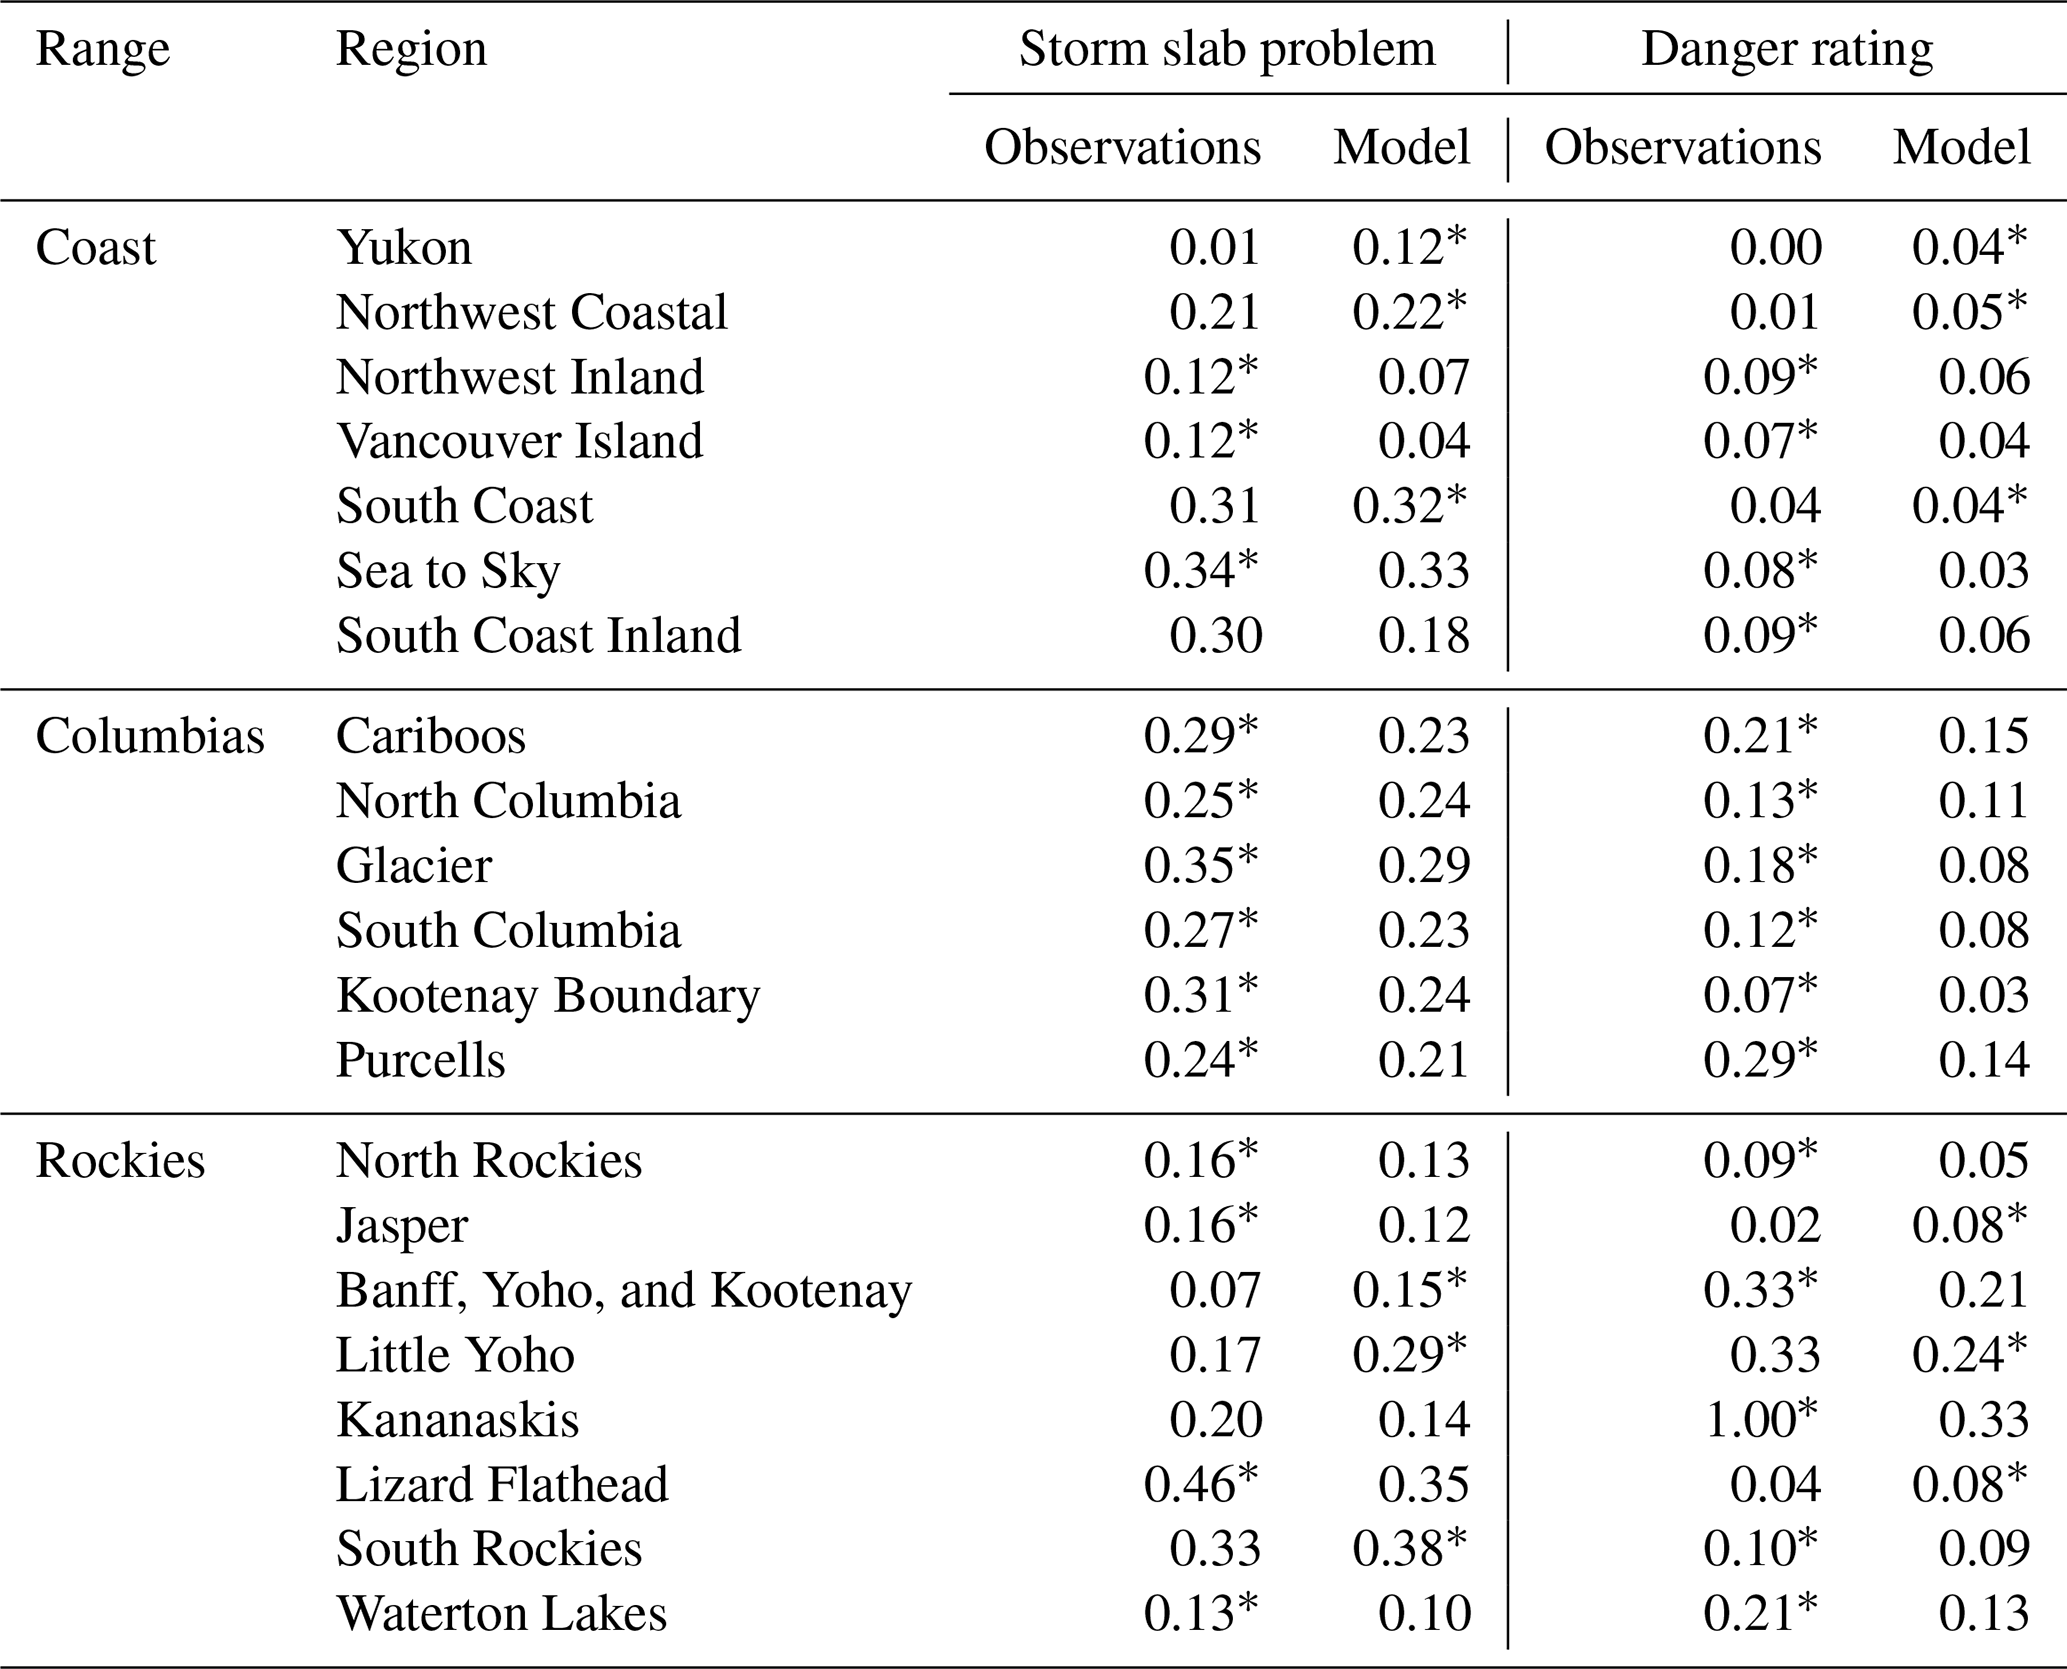
Predicting avalanche conditions with snow depth changes over 3 d periods yielded relatively comparable results with model and upscaled observation data (Table 1). In the Columbia regions the observation data consistently explained the presence of storm slab avalanche problems and danger ratings better than modelled data. However, in several of the Coast and Rockies regions the modelled data explained avalanche conditions better than the observation data, and in many regions the McFadden pseudo-R2 values were comparable in magnitude.
In the interior, the regions where avalanche conditions were predicted better with upscaled observations were typically the regions with smaller RKSD values (e.g., Glacier and South Columbia), suggesting the observations were relatively consistent and representative of avalanche conditions. However, the South Coast region also had areas with relatively small RKSD, yet avalanche conditions were predicted better with modelled snow depth changes, suggesting that even though the observation networks were relatively consistent they may have been less representative of conditions in avalanche terrain.
4.2 Comparing modelled and observed snow depths
4.2.1 Regional-scale spatial patterns
Snow depths on 31 March 2021 are mapped in Fig. 4 to illustrate regional-scale patterns by the end of the winter season. Observed snow depths were relatively deep along western parts of the Coast range as well as the central parts of the Columbias (i.e., greater than 250 cm). Shallower snow depths were observed on the eastern side of the Coast range, the perimeters of the Columbias, and throughout most of the Rockies (Fig. 4a–b). Modelled snow depths had similar regional-scale patterns, but with more extreme differences between the deep and shallow snowpack areas within each region (Fig. 4c). For example, the snow depths from upscaled observations ranged from 114 to 399 cm across the entire study area, while modelled snow depths ranged from 50 to 939 cm. Despite the different ranges, the median snow depths were similar with values of 227 and 259 cm for the observed and modelled data, respectively.
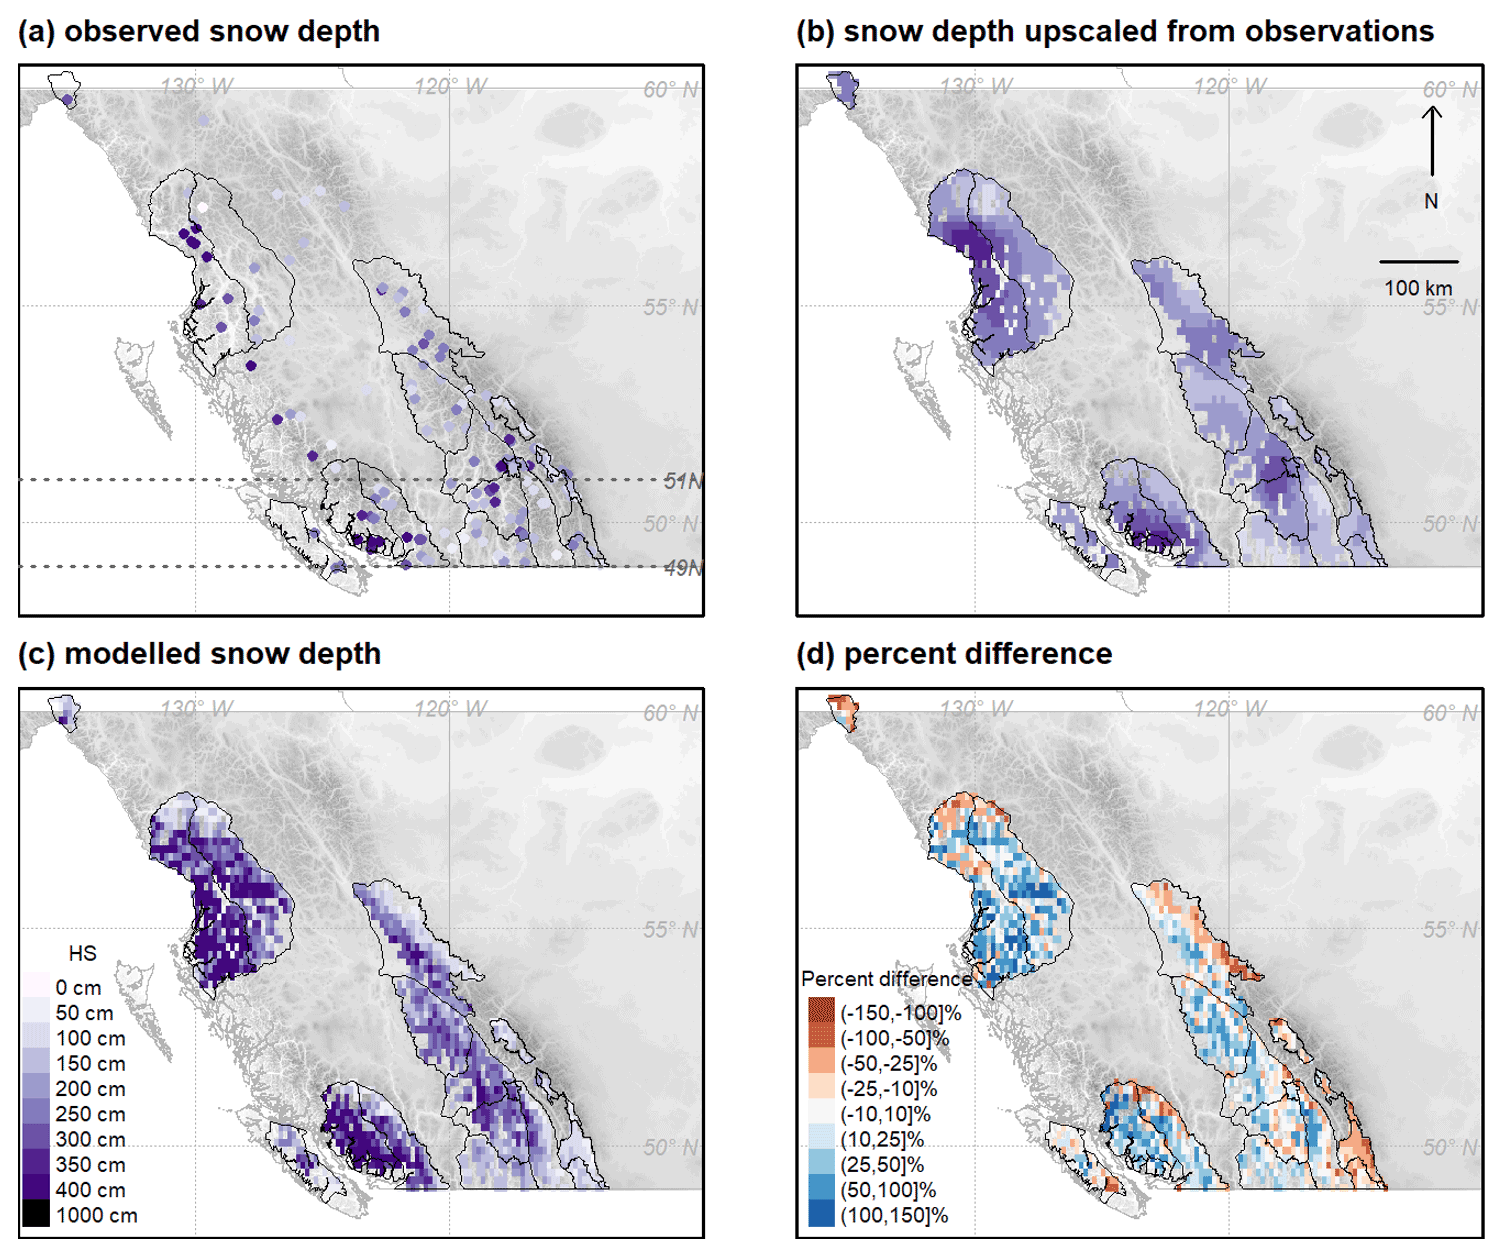
Figure 4Comparison of observed and modelled snow depths on 31 March 2021 with (a) original snow depths from 176 observations, (b) the observed snow depths upscaled to treeline elevations at 1260 model grid points, (c) the modelled snow depth at the same grid points, and (d) the percent difference between the snow depths from model and upscaled observation data (positive values indicate modelled depths were greater than upscaled observations). Panel (a) shows the latitudinal transect between 49 and 51∘ N used in Fig. 5.
Table 2Statistics comparing snow depths from model and upscaled observation data within each forecast region on 31 March 2021.
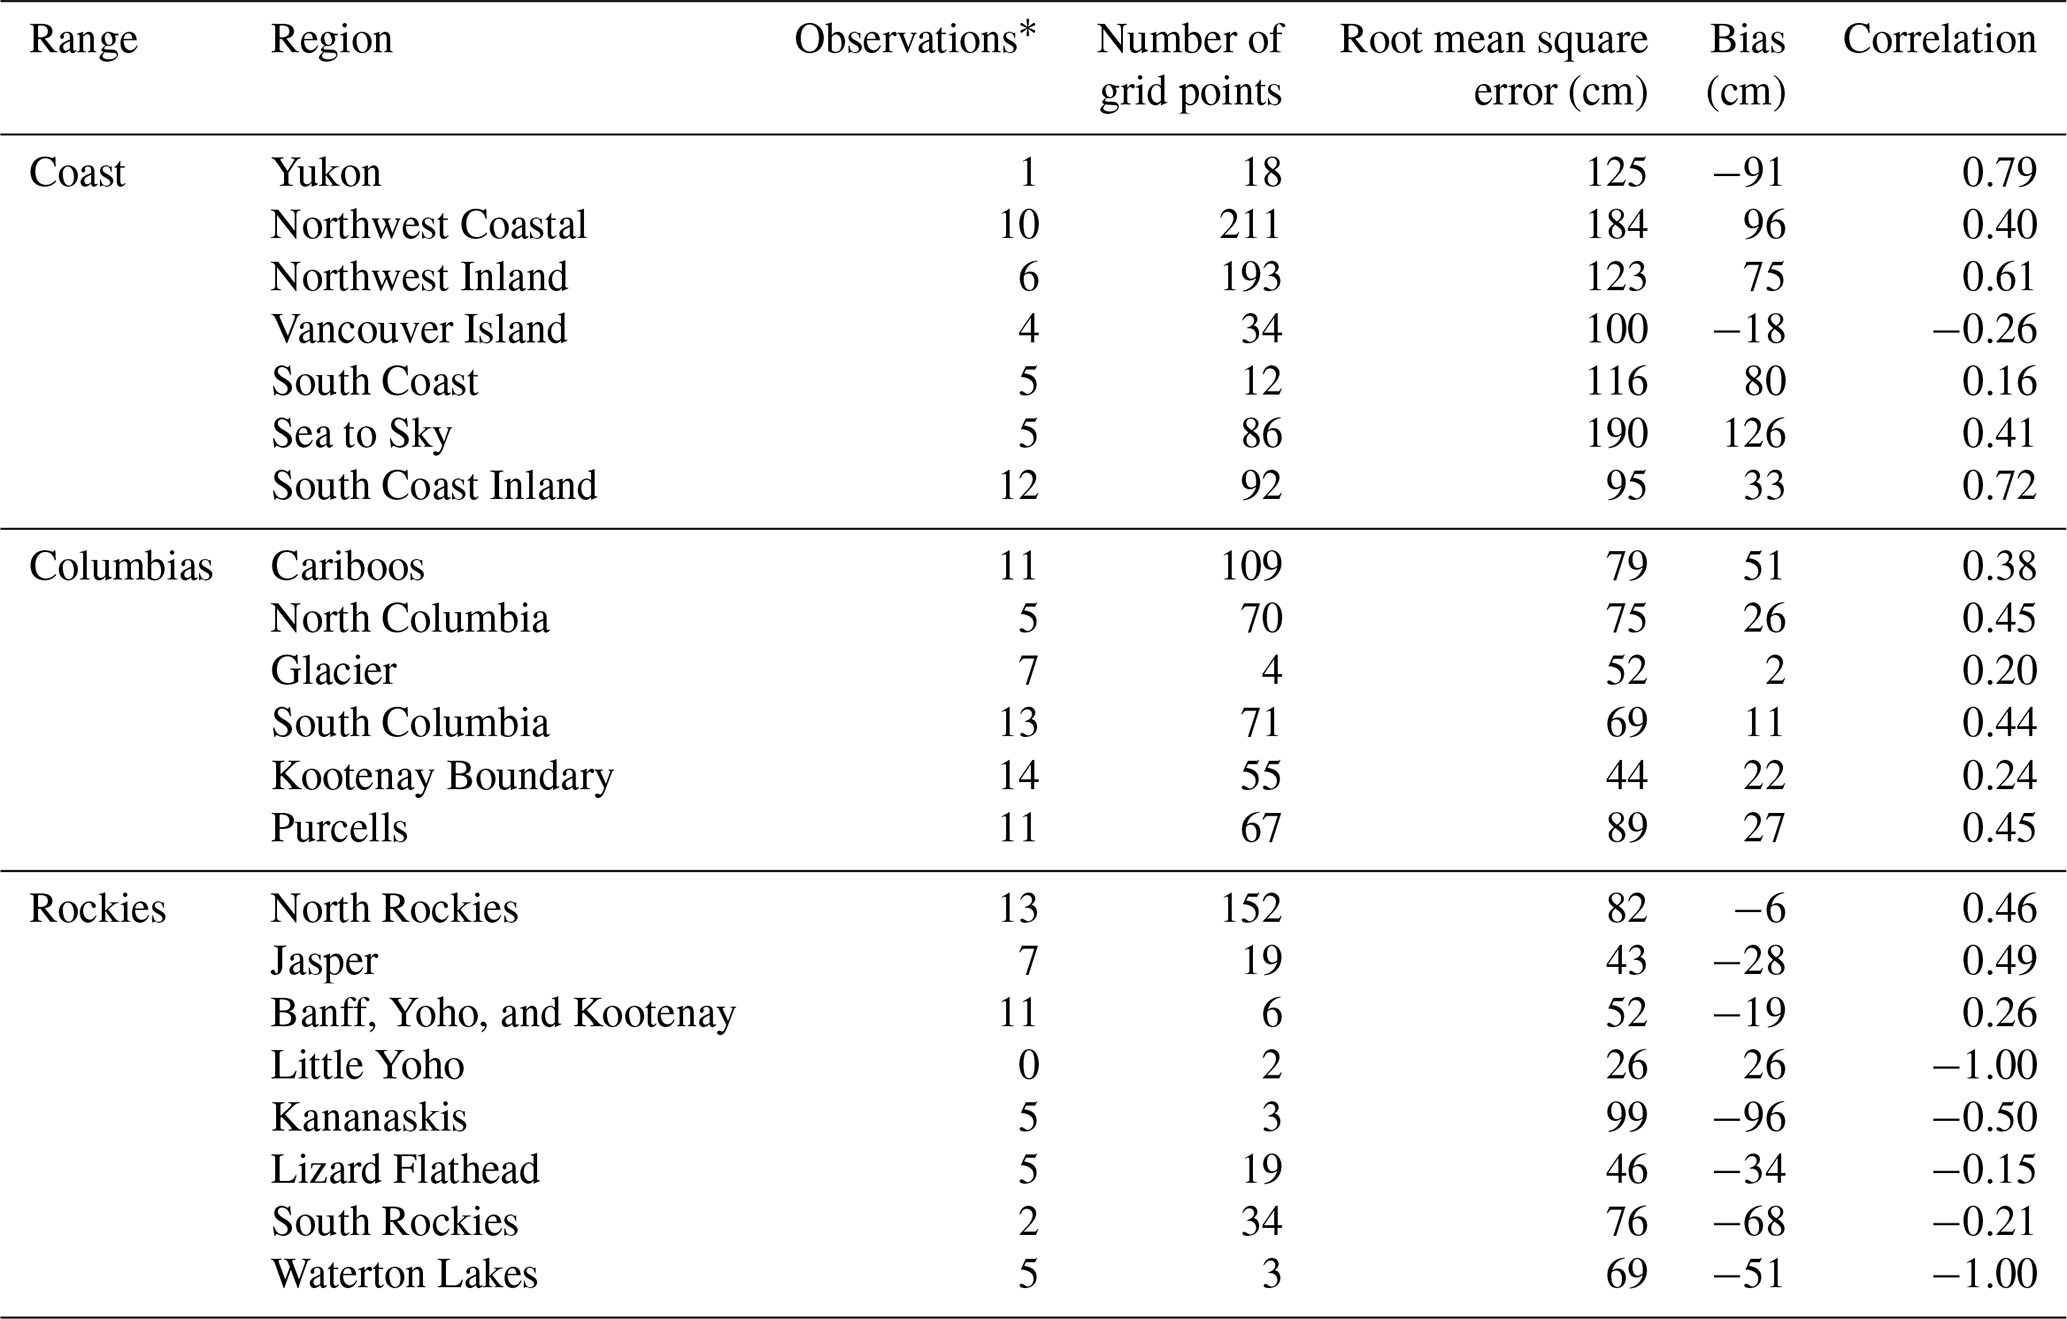
* Number of point observations in forecast region prior to upscaling; however, the upscaling includes observations from neighbouring areas.
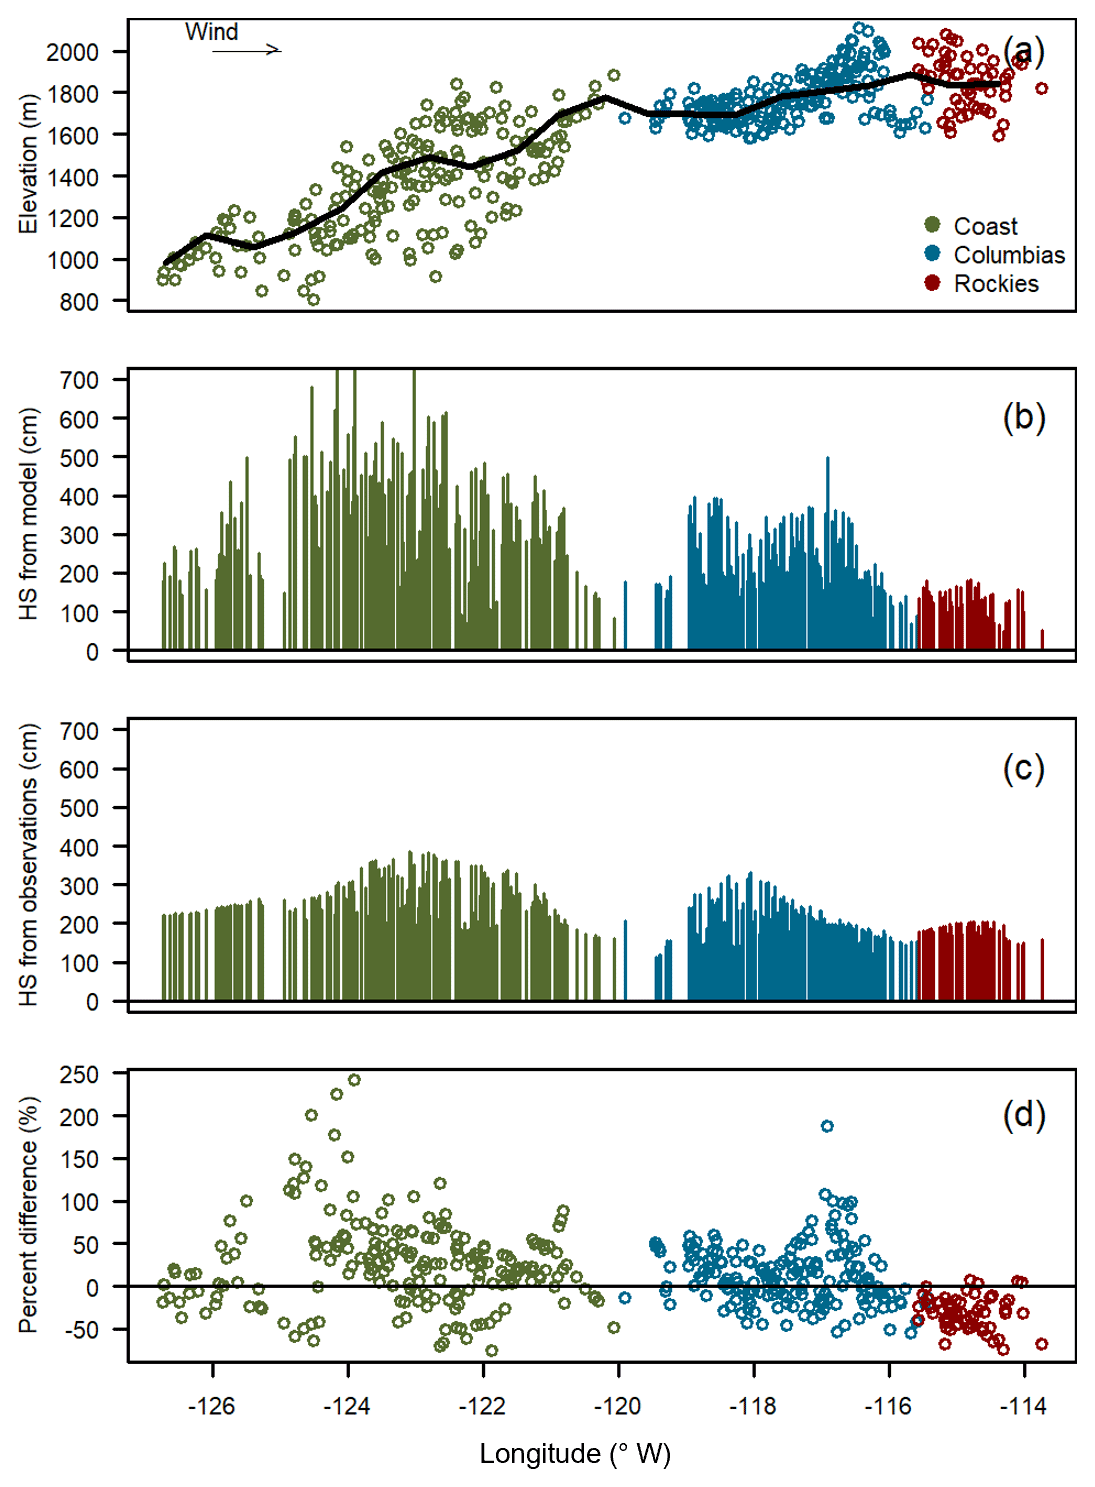
Figure 5Latitudinal cross section between 49 and 51∘ N of (a) the elevation of treeline grid points with the black line showing the moving average, (b) modelled snow depth at treeline grid points, (c) snow depths from upscaled observations at the same grid points, and (d) percent difference between model and upscaled observation snow depths.
The percent difference between snow depths from model and upscaled observation data shows where regional-scale discrepancies were most pronounced (Fig. 4d). Modelled snow depths were substantially greater than observations in most parts of the Coast range, especially on the western (upslope) side of the range. With large snow depths in the Coast range, the root mean square errors were relatively large and exceeded 100 cm in many regions (Table 2), and the average snow depth biases were positive, except for the Yukon and Vancouver Island regions. Positive snow depth correlations for most regions in the Coast range suggest there was moderate agreement on the location of the relatively deeper and shallower areas at a sub-regional scale, except for the Vancouver Island and South Coast regions, where weak or negative correlations suggest the model and observation data disagreed on the location of deeper areas.
In the Columbias, snow depths from the model and upscaled observation data were relatively similar (Fig. 4d), although the modelled depths were substantially higher than observations in the western Purcell and central Cariboo regions. The root mean square error for regions in the Columbias ranged from 44 to 89 cm (Table 2), with relatively smaller biases than the other ranges. Positive correlations between 0.20 and 0.45 suggest the model and observation data had moderate agreement in where the relatively deeper and shallower snowpacks existed throughout the range.
In the Rockies, there was reasonable agreement between snow depths in the central regions of Banff, Yoho, and Kootenay and Jasper, but modelled depths were substantially lower than upscaled observations in the southern and northern parts of the range (Fig. 4d). Negative biases existed in all regions except Little Yoho (Table 2), highlighting how modelled depths were systematically lower than observed depths in the Rockies. While the regions in the southern Rockies had fewer grid points to compute correlations, their negative values mean the model and observation data disagreed on where the relatively deeper and shallower snowpacks existed.
To further illustrate the predominant spatial patterns across the three major mountain ranges, snow depths are plotted along a latitudinal cross section between 49 and 51∘ N (Fig. 5). The western (windward) side of the Coast range had substantially larger modelled snow depths than upscaled observations, while there was reasonable agreement along the highest terrain and the leeward side of the Coast range. In the Columbias, the windward side had the greatest observed snow depths, which were slightly larger than modelled; however, modelled depths were greater than observed over the highest terrain in the eastern side of the Columbias. In the Rockies, there was minimal variation between the windward and leeward sides for both the modelled and observed snow depths.
4.2.2 Temporal patterns
Time series of snow depths show the agreement between model and observation data over the course of the 2020–2021 winter (Fig. 6). Some regions such as the South Coast Inland, Glacier, and Banff, Yoho, and Kootenay had relatively consistent agreement over the season, while other regions had major discrepancies. Discrepancies arose from both systematic biases that persisted for the duration of the season and from differences originating from specific events. For example, systematic biases are evident in the Sea to Sky region, where modelled depths were consistently greater than upscaled observations, and in the Kananaskis region, where modelled depths were consistently lower. Examples of specific events causing discrepancies include Vancouver Island, where the observed depths increased in early January without a corresponding increase in modelled depths, and in the Yukon region, where changes in modelled and observed depths occurred at different times throughout the season.
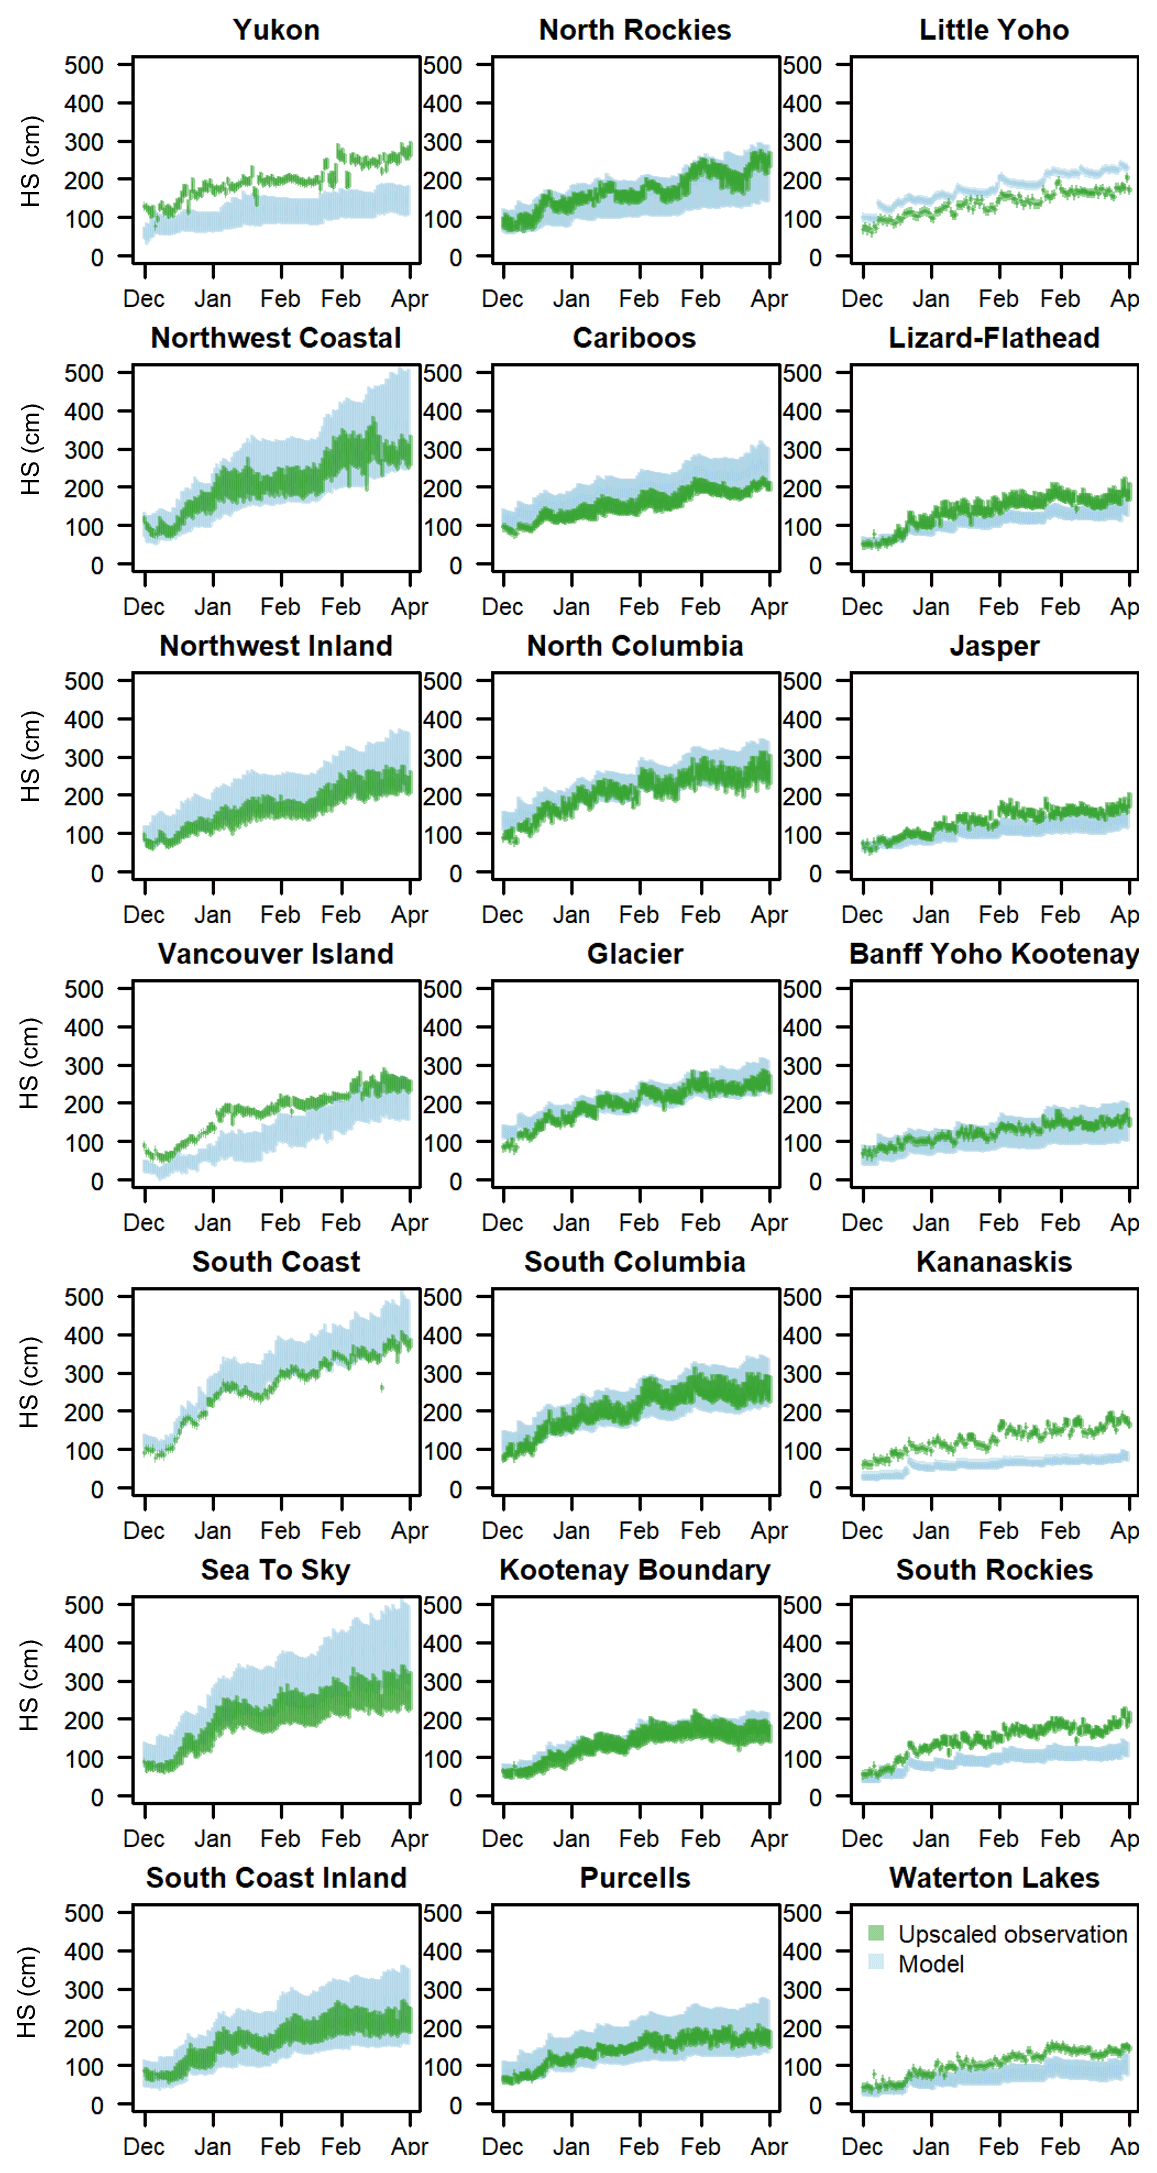
Figure 6Interquartile range of snow depths for each avalanche forecast region throughout the study period from model (blue) and upscaled observation (green) data.
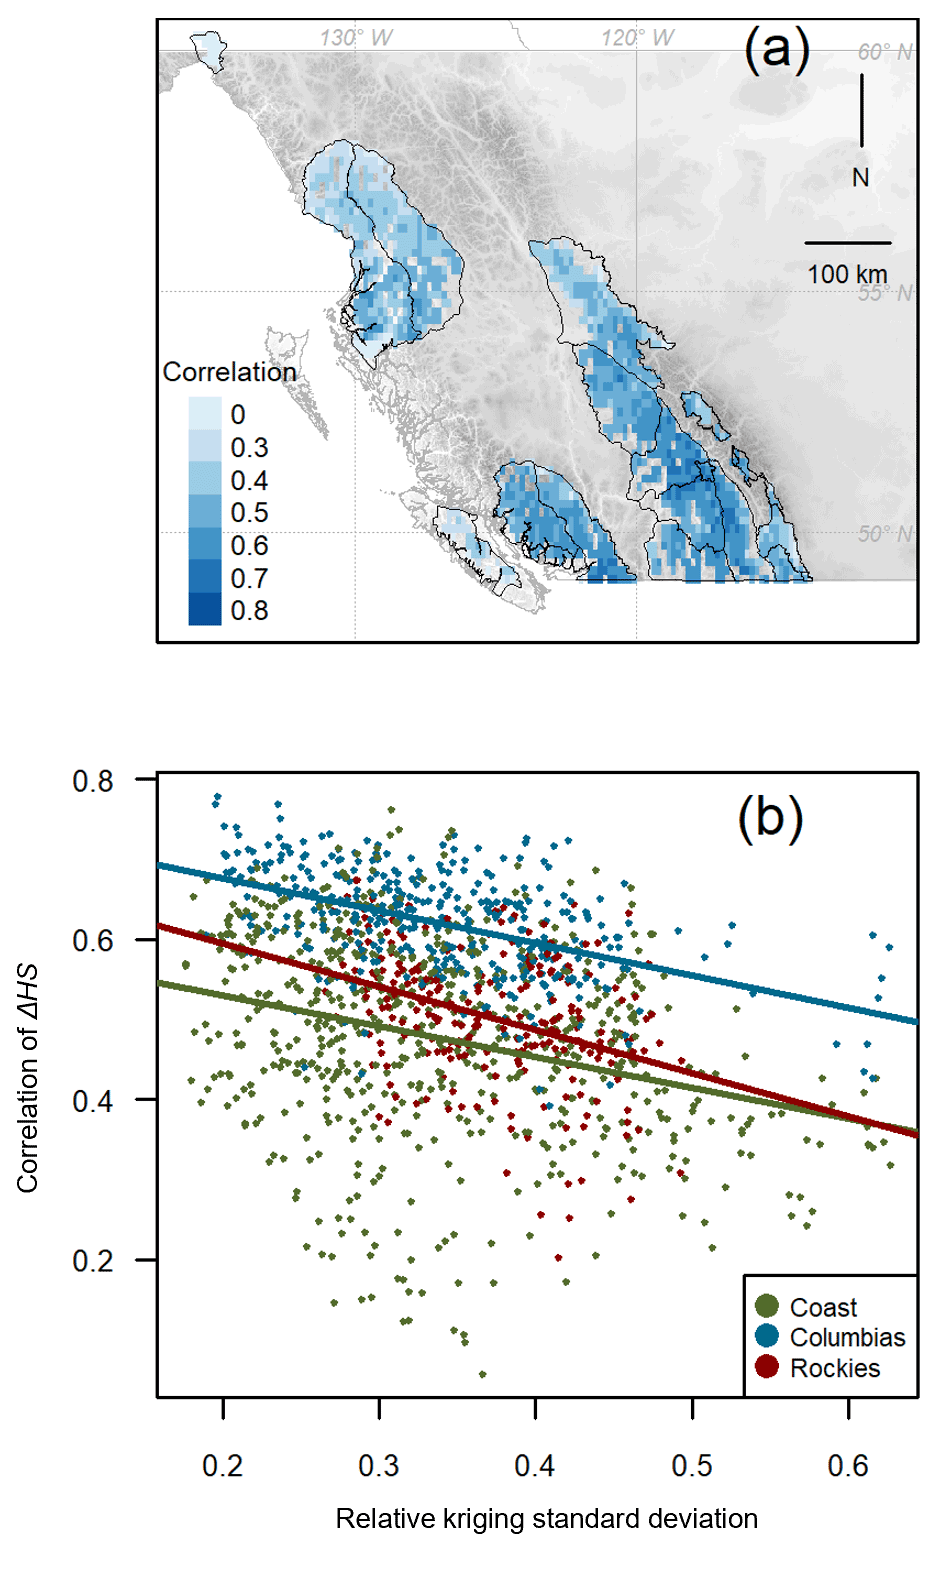
Figure 7Correlation between daily change in snow depth ΔHS from model and upscaled observation data over the study period (a) mapped across the study area and (b) plotted against the average relative kriging standard deviation representing the uncertainty in the upscaled observations. Simple regression lines are fitted for each mountain range to show poorer ΔHS correlations when upscaled observations had greater uncertainty.
Agreement in the timing of new snow was measured with the correlation between daily snow height changes ΔHS from the model and upscaled observation data (Fig. 7a). The median correlation for all grid points was 0.54 but ranged from 0.06 to 0.78. Correlations were strongest in the southern Coast range, the central Columbias, and the central Rockies and relatively weaker in the northern Coast range and southern Rockies. The correlation was generally weaker in areas with larger RKSD (Fig. 7b), suggesting disagreements were not only influenced by model errors but also by uncertainty in the upscaled observations.
4.3 Impact on modelled snowpack structure
4.3.1 Regional-scale snowpack patterns with NWP forcings
Snow profile simulations from each forecast region illustrate typical climatic patterns across western Canada (Fig. 8). Grain types are colour-coded following the suggestions of Horton et al. (2020a) rather than Fierz et al. (2009) to better highlight features relevant to avalanche conditions (i.e., new snow and weak layers). The maritime climate in the Coast range resulted in thick layers of new snow, rounded grains, and melt forms. Profiles in the Columbias had typical transitional snowpacks with thick layers of rounded grains interspersed with thin layers of persistent grain types. The continental Rockies had the thinnest snowpacks and were largely composed of faceted grain types.
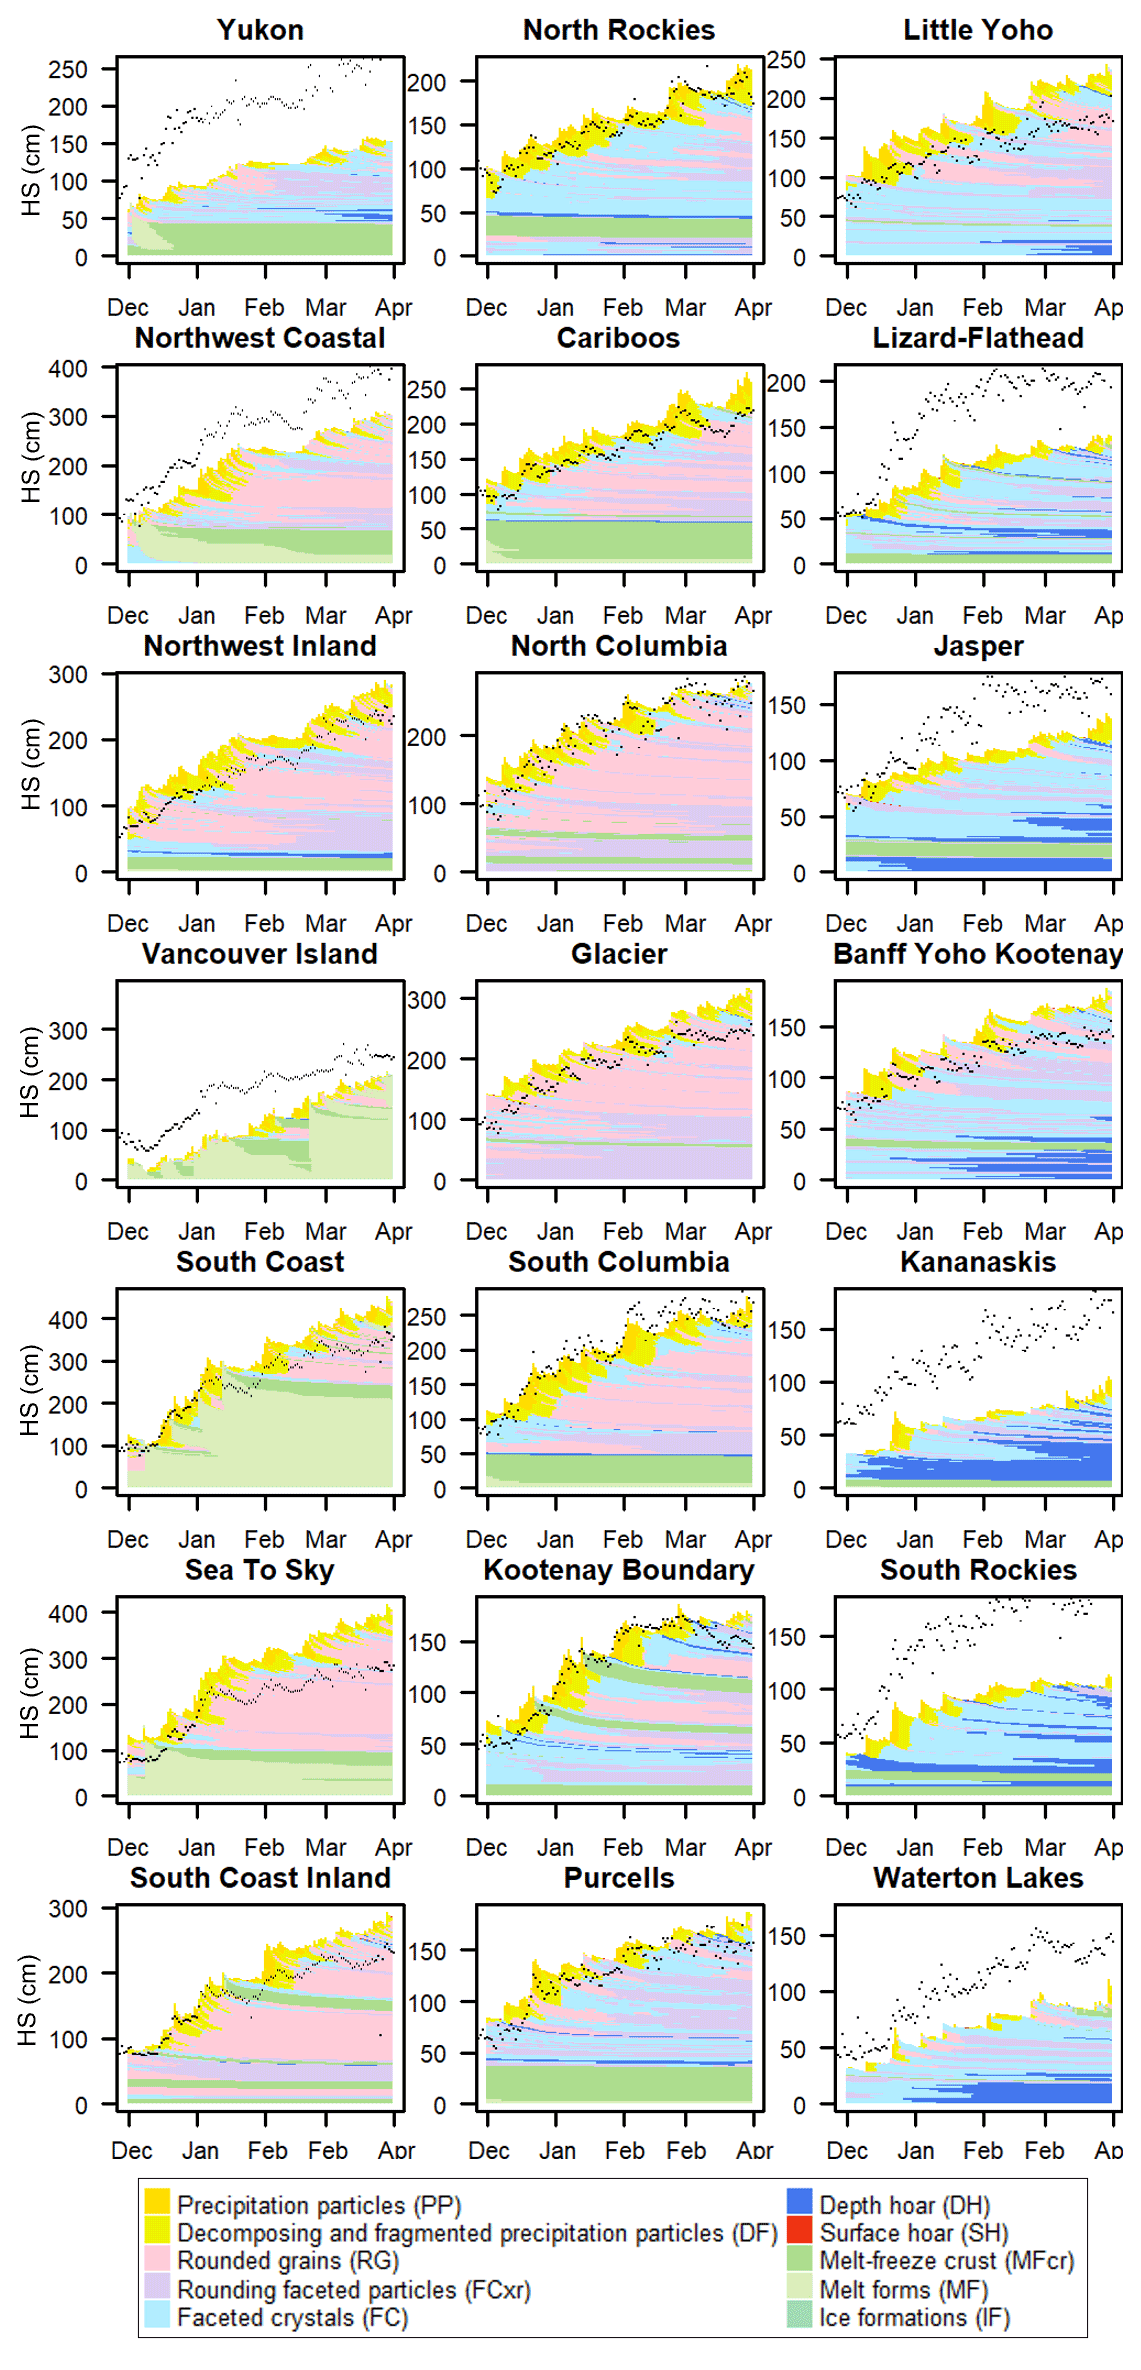
Figure 8Simulated snowpack structure at a representative location in each forecast region with the snow depths from upscaled observations shown with black squares. Snowpack layers are colour-coded by grain type following Horton et al. (2020a).
Overlaying the snow depth from upscaled observations on each simulated profile shows how well the snow depths agreed over time. The modelled stratigraphy was likely simulated better at locations where the modelled snow depth closely agreed with upscaled observations (e.g., South Columbia), although matching snow depths is not sufficient to guarantee accurate stratigraphy. Many simulated profiles had large discrepancies with the upscaled observations, in which case it is less clear whether the model was erroneous or the upscaled observations were not representative for that location.
4.3.2 Impact of adjusting precipitation inputs
The precipitation-adjustment factors (k) calculated by comparing the modelled snow depths to upscaled observations at the locations in Fig. 8 ranged from 0.72 for the Sea to Sky location (where observed depths were much smaller than modelled depths) to 1.91 for the Kananaskis location (where observed depths were much greater). Adjusting precipitation inputs by these factors resulted in a variety of impacts on the simulated snowpack structure. Profiles are compared for one location in each mountain range in Fig. 9, including an example with a large reduction of precipitation for the Sea to Sky profile in the Coast range (k = 0.72), a small reduction in precipitation for the North Columbia profile in the Columbias (k = 0.94), and a large increase in precipitation for the Kananaskis profile in the Rockies (k = 1.91). Profiles for the remaining regions are shown in Appendix A.
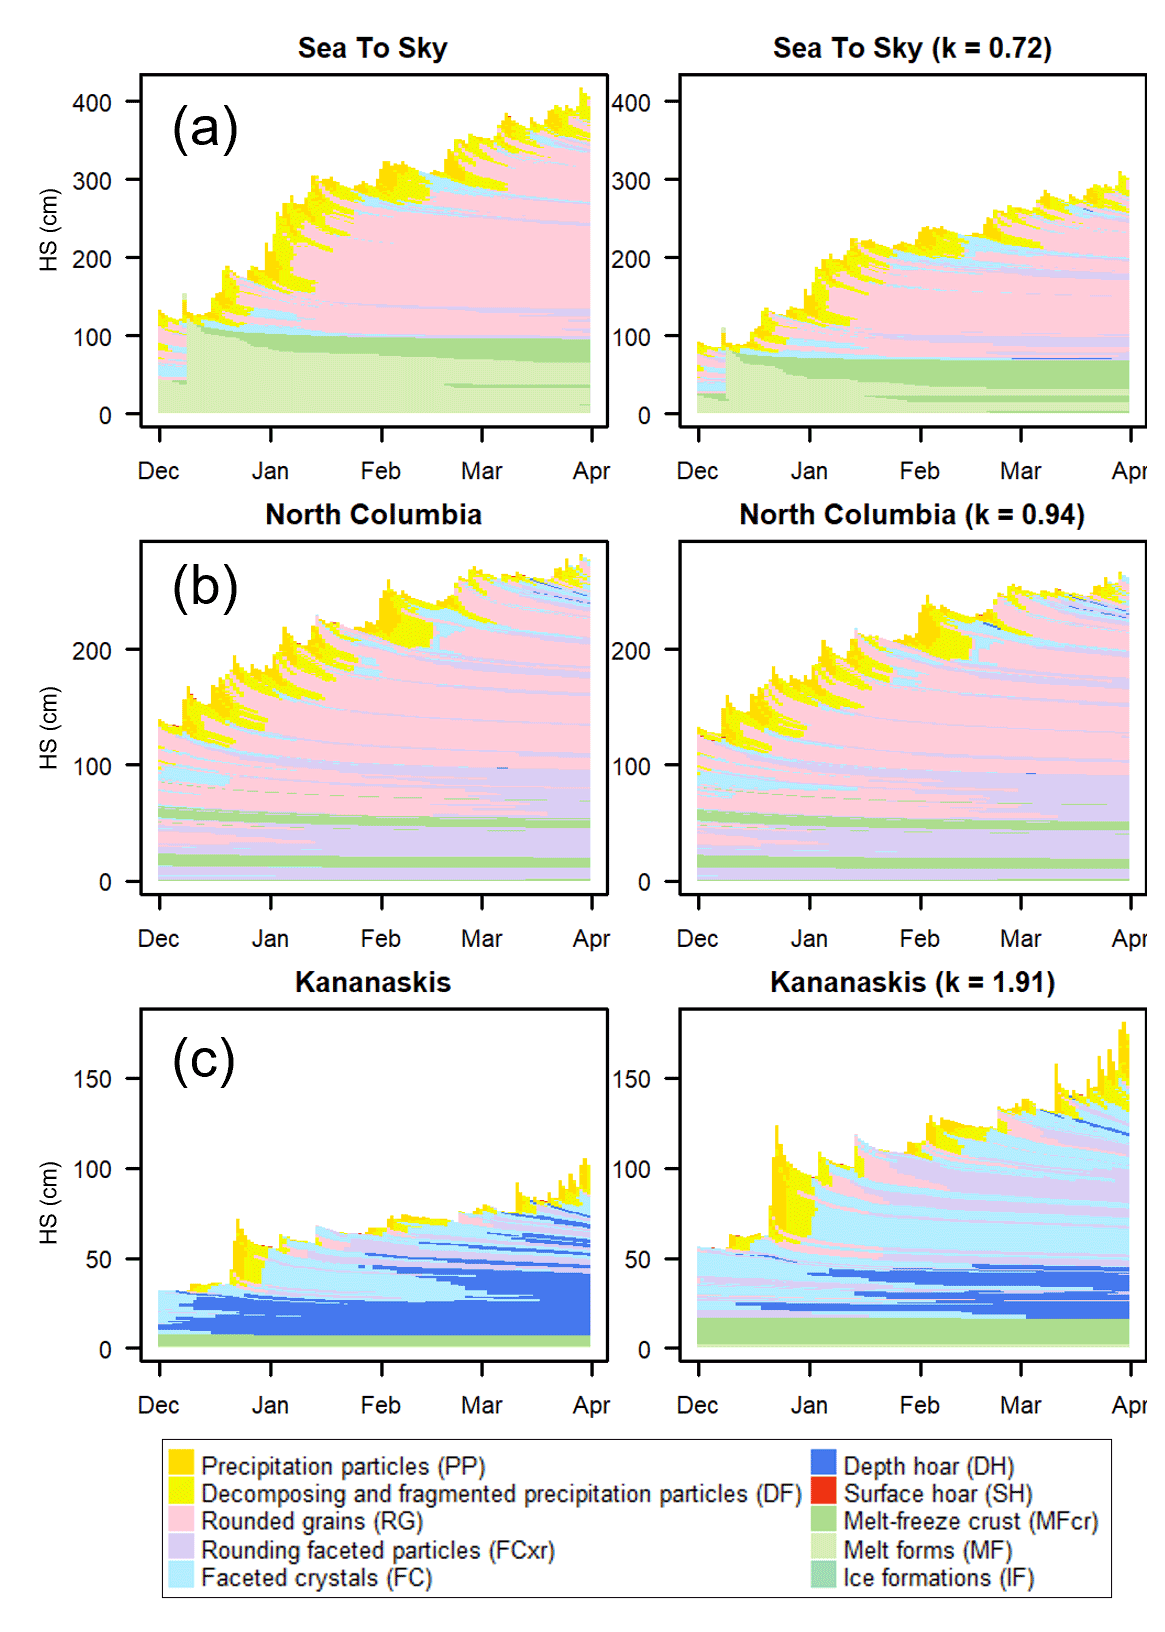
Figure 9Timelines of simulated snowpack structure before and after precipitation adjustments at locations in (a) the Sea to Sky region where modelled snow depths were much larger than upscaled observations, (b) the North Columbia region where the modelled and upscaled observation snow depths closely agreed, and (c) the Kananaskis region where modelled snow depths were much smaller than upscaled observations. Snowpack layers are colour-coded by grain type following Horton et al. (2020a).
The adjusted Sea to Sky profile contained similar snowpack features to the original profile (Fig. 9a), despite a dramatic reduction in the amount of precipitation. Similar layers of rounded grains and the same prominent weak layers existed in both profiles. The average similarity value of the two sets of profiles was 0.79, suggesting the profiles were relatively similar in terms of features important to avalanche hazard. The similarity measure had a statistically significant decrease over the course of the season, meaning differences compounded over time. The adjusted North Columbia profile had minimal differences from the original profile after adjusting the precipitation by a factor of 0.94 (Fig. 9b), with an average similarity value of 0.91 that did not change significantly over time. The adjusted Kananaskis profile, however, had a dramatically different snowpack structure after increasing precipitation by a factor of 1.91 (Fig. 9c). The original profile was primarily composed of a thick depth hoar layer and small amounts of new snow above it, which after adjustment was stretched into thicker layers of faceted crystals, rounding faceted particles, and a few thin well-defined depth hoar layers. The average similarity value of 0.50 suggests the profiles were substantially different in terms of avalanche hazard considerations, and the similarity values suggest a statistically significant decrease over the course of the season.
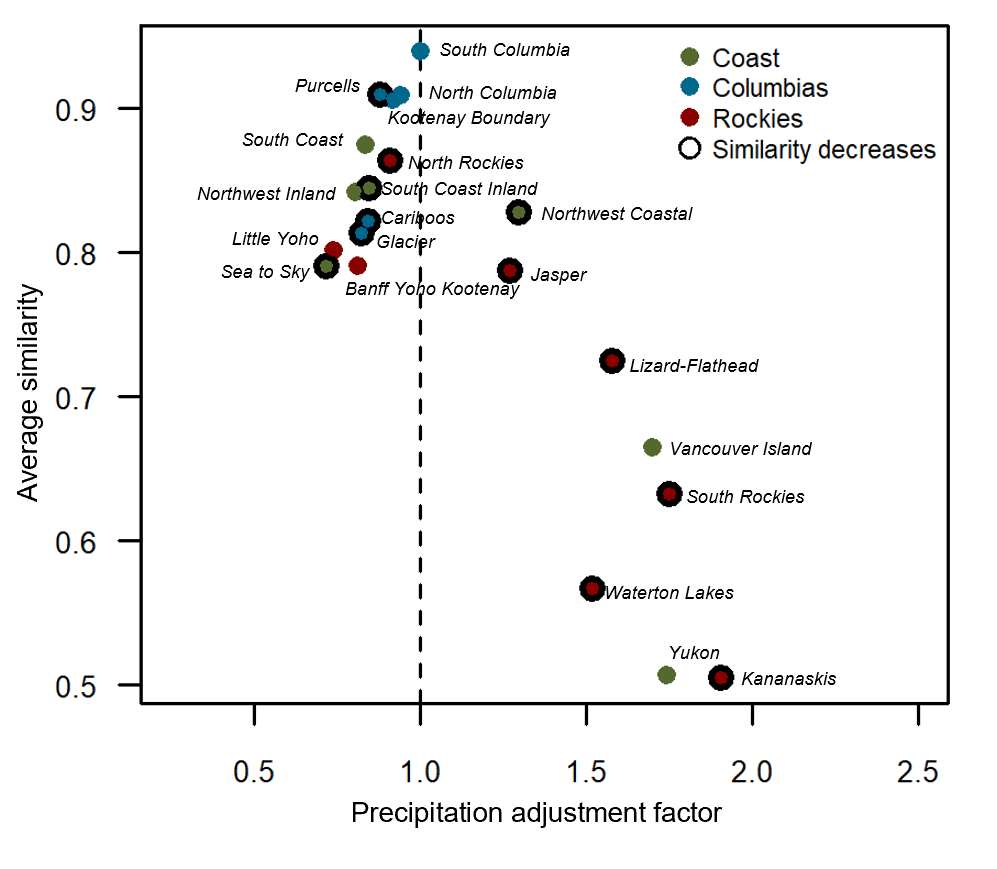
Figure 10Average similarity in snowpack structure between original and precipitation-adjusted snow profiles at locations in each forecast region. The similarity is plotted against the magnitude of the precipitation-adjustment factor. Locations where the similarity has a statistically significant decrease over time are outlined with black circles.
The similarity between the original and precipitation-adjusted profiles is shown for all 21 regions in Fig. 10. The similarity values ranged from 0.50 for the Kananaskis profiles to 0.94 for the South Columbia profiles, with a median value of 0.81. Small precipitation adjustments generally resulted in profiles that were similar to the original profiles from an avalanche hazard perspective, as was the case for the North Columbia profile, while large changes in precipitation resulted in more substantial structural changes. The impacts of precipitation adjustments were most dramatic for profiles in the Rockies, as 7 of the 10 locations with the lowest similarity values were in the Rockies (all with values less than 0.8). All profiles in the Columbias had similarity values greater than 0.8, suggesting precipitation adjustments had relatively smaller impacts on simulated avalanche conditions. Profiles in the Coast range had a wide range of similarity values. The similarity values became statistically lower over the course of the season in three of seven Coast profiles, three of six Columbias profiles, and six of eight Rockies profiles, suggesting the impact of precipitation adjustments became more compounded over time in colder continental climates.
5.1 Implications for weather forecasting
Lundquist et al. (2020) argue the increasing skill in modelling mountain precipitation relative to traditional observation networks warrants new multi-disciplinary methods for evaluating models. Avalanche safety operations spend considerable effort collecting weather observations at high elevations, which could be a valuable addition to verify weather forecasts and improve analysis products which primarily rely on low-elevation precipitation measurements (e.g., Roy et al., 2018). Our analysis of upscaled snow depth observations revealed patterns in how the HRDPS weather model performed in remote regions of western Canada, such as the systematic overprediction of precipitation on the windward side of the Coast range (Fig. 5). This specific bias likely originated from the NWP model's handling of hydrometeor drift and spillover in complex terrain (Mo et al., 2019), which could be better calibrated with avalanche weather observations. An additional analysis (not shown) using snow water equivalent and precipitation measurements from the same observation networks was not as clear, likely because fewer sites measure these variables.
This study highlights several shortcomings of resolving regional-scale conditions with the mountain observation networks in western Canada. For example, many areas had sparse and intermittent observations that resulted in large uncertainties when upscaling snow depths to regional scales (Fig. 3). Evaluating model performance in these areas should be done with caution, as the classic interpretations of the verification metrics may be less meaningful (e.g., Table 2).
The regression models highlight that in many regions snow depth changes from the model data could explain regional avalanche conditions with comparable skill to the upscaled observations (Table 1), with the main exceptions being small data-rich regions like Glacier. However, avalanche conditions in some of the large heavy snowfall regions in the Coast range were better explained by modelled snow depth changes than by upscaled observations. This could be caused by forecasters putting more weight on weather forecasts in these regions but could also be caused by shortcomings of the observation networks in these harsh coastal environments. While these regression models were limited by human assessment errors and by oversimplifying the factors influencing avalanche hazard, they provide a simple example of how model weather data can be comparable to observation data in some regional-scale contexts.
5.2 Implications for snowpack modelling
Given precipitation has been shown to be a primary source of uncertainty in snowpack simulations (Raleigh et al., 2015; Richter et al., 2020), meaningful methods to identify and correct erroneous precipitation inputs could dramatically improve the quality of snowpack models. However, this study highlights large gaps and uncertainties in many observation networks that warrant careful approaches when evaluating snowpack models, especially at regional scales.
Adjusting precipitation inputs illustrated how precipitation input errors could impact the simulated snowpack structure from an avalanche hazard perspective. The greatest change was observed in the continental Rockies regions (Fig. 10). In cold climates, changes in snow depths would have a greater impact on temperature gradients in the snowpack and, as a result, the formation of weak faceted layers. Increasing precipitation could result in substantially fewer faceted layers and a less hazardous snowpack structure, while decreasing precipitation could result in substantially more faceted layers and a more dangerous structure. Locations in the Coast range, on the other hand, exhibited fewer differences in their snowpack structure after precipitation adjustments. Changing snow depths in maritime climates has less impact on the temperature gradients, and as a result the precipitation-adjusted profiles resembled a stretched or compressed version of the original profiles, usually containing the same weak layers and crusts.
The precipitation-adjustment method applied in this study is likely insufficient for an operational model system, as it assumes a constant bias over time and oversimplifies the causes of snow depth errors. More advanced data assimilation methods have recently been suggested for snowpack models (Largeron et al., 2020), including methods presented by Winstral et al. (2018) and Cluzet et al. (2022) that use similar snow observation networks in Europe. Cluzet et al. (2022) found assimilating snow depth observations improved simulations in areas of France with relatively sparse observations but that the density of snow observations was correlated with the density of precipitation observations. For large regions in western Canada, sparse and inconsistent observations would pose a challenge to implementing data assimilation methods, especially considering snow depth changes over short timescales were poorly resolved with the upscaled observations (Fig. 7).
5.3 Implications for avalanche forecasting
This study found moderate to strong agreement between modelled and observed snow depths in many situations across western Canada. In cases with strong agreement, the simulated snowpack structure can be interpreted by forecasters with a higher degree of confidence. In situations where the modelled and observed snow depths differ, the simulated snowpack structure must be evaluated more critically. Considerations should include the representativeness of local observations, whether the NWP model has a known precipitation bias in that region, and the sensitivity of the snowpack structure to precipitation errors in that climate.
Assessing the quality of the upscaled snow depth observations identified areas where forecasters deal with sparse and uncertain observations (Fig. 3). Snowpack models could be particularly valuable in these regions, but to interpret the models it would help to collect targeted snow depth information from automated weather stations, field observers, crowd sourcing platforms (e.g., Community Snow Observations), and satellite-derived snow cover products.
This study focused on regional-scale patterns to provide a general understanding of model performance; however, snowpack models also have potential to simulate finer-scale spatial patterns. While such patterns are relevant to avalanche forecasters, they become even more difficult to verify with sparse observations. Therefore, we suggest snowpack models forced with NWP models should first be understood at coarse regional scales. For example, the correlations in Table 2 indicate how well the model and upscaled observation data agreed on the location of deep and shallow snowpack areas at a sub-regional scale. Sub-regional patterns resolved by snowpack models could be meaningful in regions where these correlations were strong, but further investigation would be necessary in regions with weak correlations to determine whether the patterns suggested by the model are reliable.
Exploring applications at finer scales could be considered in areas with high-quality observations and strong agreement between modelled and observed snow depths. Aggregating observations across a common reference treeline elevation provided a consistent approach for regional-scale comparisons; however, more precise aggregations such as sub-grid parametrization of sky view factor (Helbig and van Herwijnen, 2017) would be required for verifying snow depth at smaller scales. The comparisons presented in this study were also point-wise, where modelled and upscaled observations were compared at the same location, but spatial verification techniques such as neighbourhood and feature-oriented approaches could also be meaningful to understand patterns relevant to forecasters (Gilleland et al., 2009).
Forcing snowpack models with high-resolution NWP models is a promising method to support avalanche forecasting. However, in many situations there are limited observation data available for verification. Furthermore, the skill in modelling mountain precipitation continues to improve to the point where it rivals observation networks in many contexts. Aggregating snow depth observations from networks of automated weather stations and manual observations from professional avalanche observers can provide insights into model performance at coarse spatial and temporal scales.
Applying this approach over a winter season across the diverse mountain climates of western Canada provided several insights about using snowpack models for avalanche forecasting. First, the quality and density of weather observations should be considered when verifying NWP and snowpack models. The number and consistency of observations in some areas resulted in relatively large uncertainties when upscaling snow depths to regional scales, and in almost half of the forecast regions, the forecast avalanche conditions were explained with modelled snow depth changes better than with snow depth changes from upscaled observations. Despite limitations in the observation data, the comparison of modelled and observed snow depths strongly suggested an overprediction of precipitation in the maritime Coast range and an underprediction in many parts of the continental Rockies. The agreement in snow depth was strongest in the transitional Columbia range, which also had the highest density of quality observations. The potential impacts of snow depth discrepancies were illustrated by comparing the snow profiles produced from the original NWP model data with profiles produced with adjusted precipitation inputs. Precipitation adjustments had the most dramatic effect in cold continental climates where the snow depths heavily influenced the degree of faceting. In warmer maritime climates, adjusting precipitation inputs often resulted in stretched or compressed profiles with similar snowpack structure.
These results also highlight how meteorologists and NWP model developers could benefit from the observation networks of avalanche safety operations. Snow depth observations could be a particularly valuable data stream to understand and evaluate NWP model performance in remote mountainous areas. From an avalanche forecasting perspective, this study highlights how limitations in observation networks pose a challenge to verifying snowpack models, as well as how these limitations need to be carefully considered when interpreting simulated profiles. This provides a starting point for future research into how operational snowpack model systems could perform real-time verification and assimilation with available snow observations.
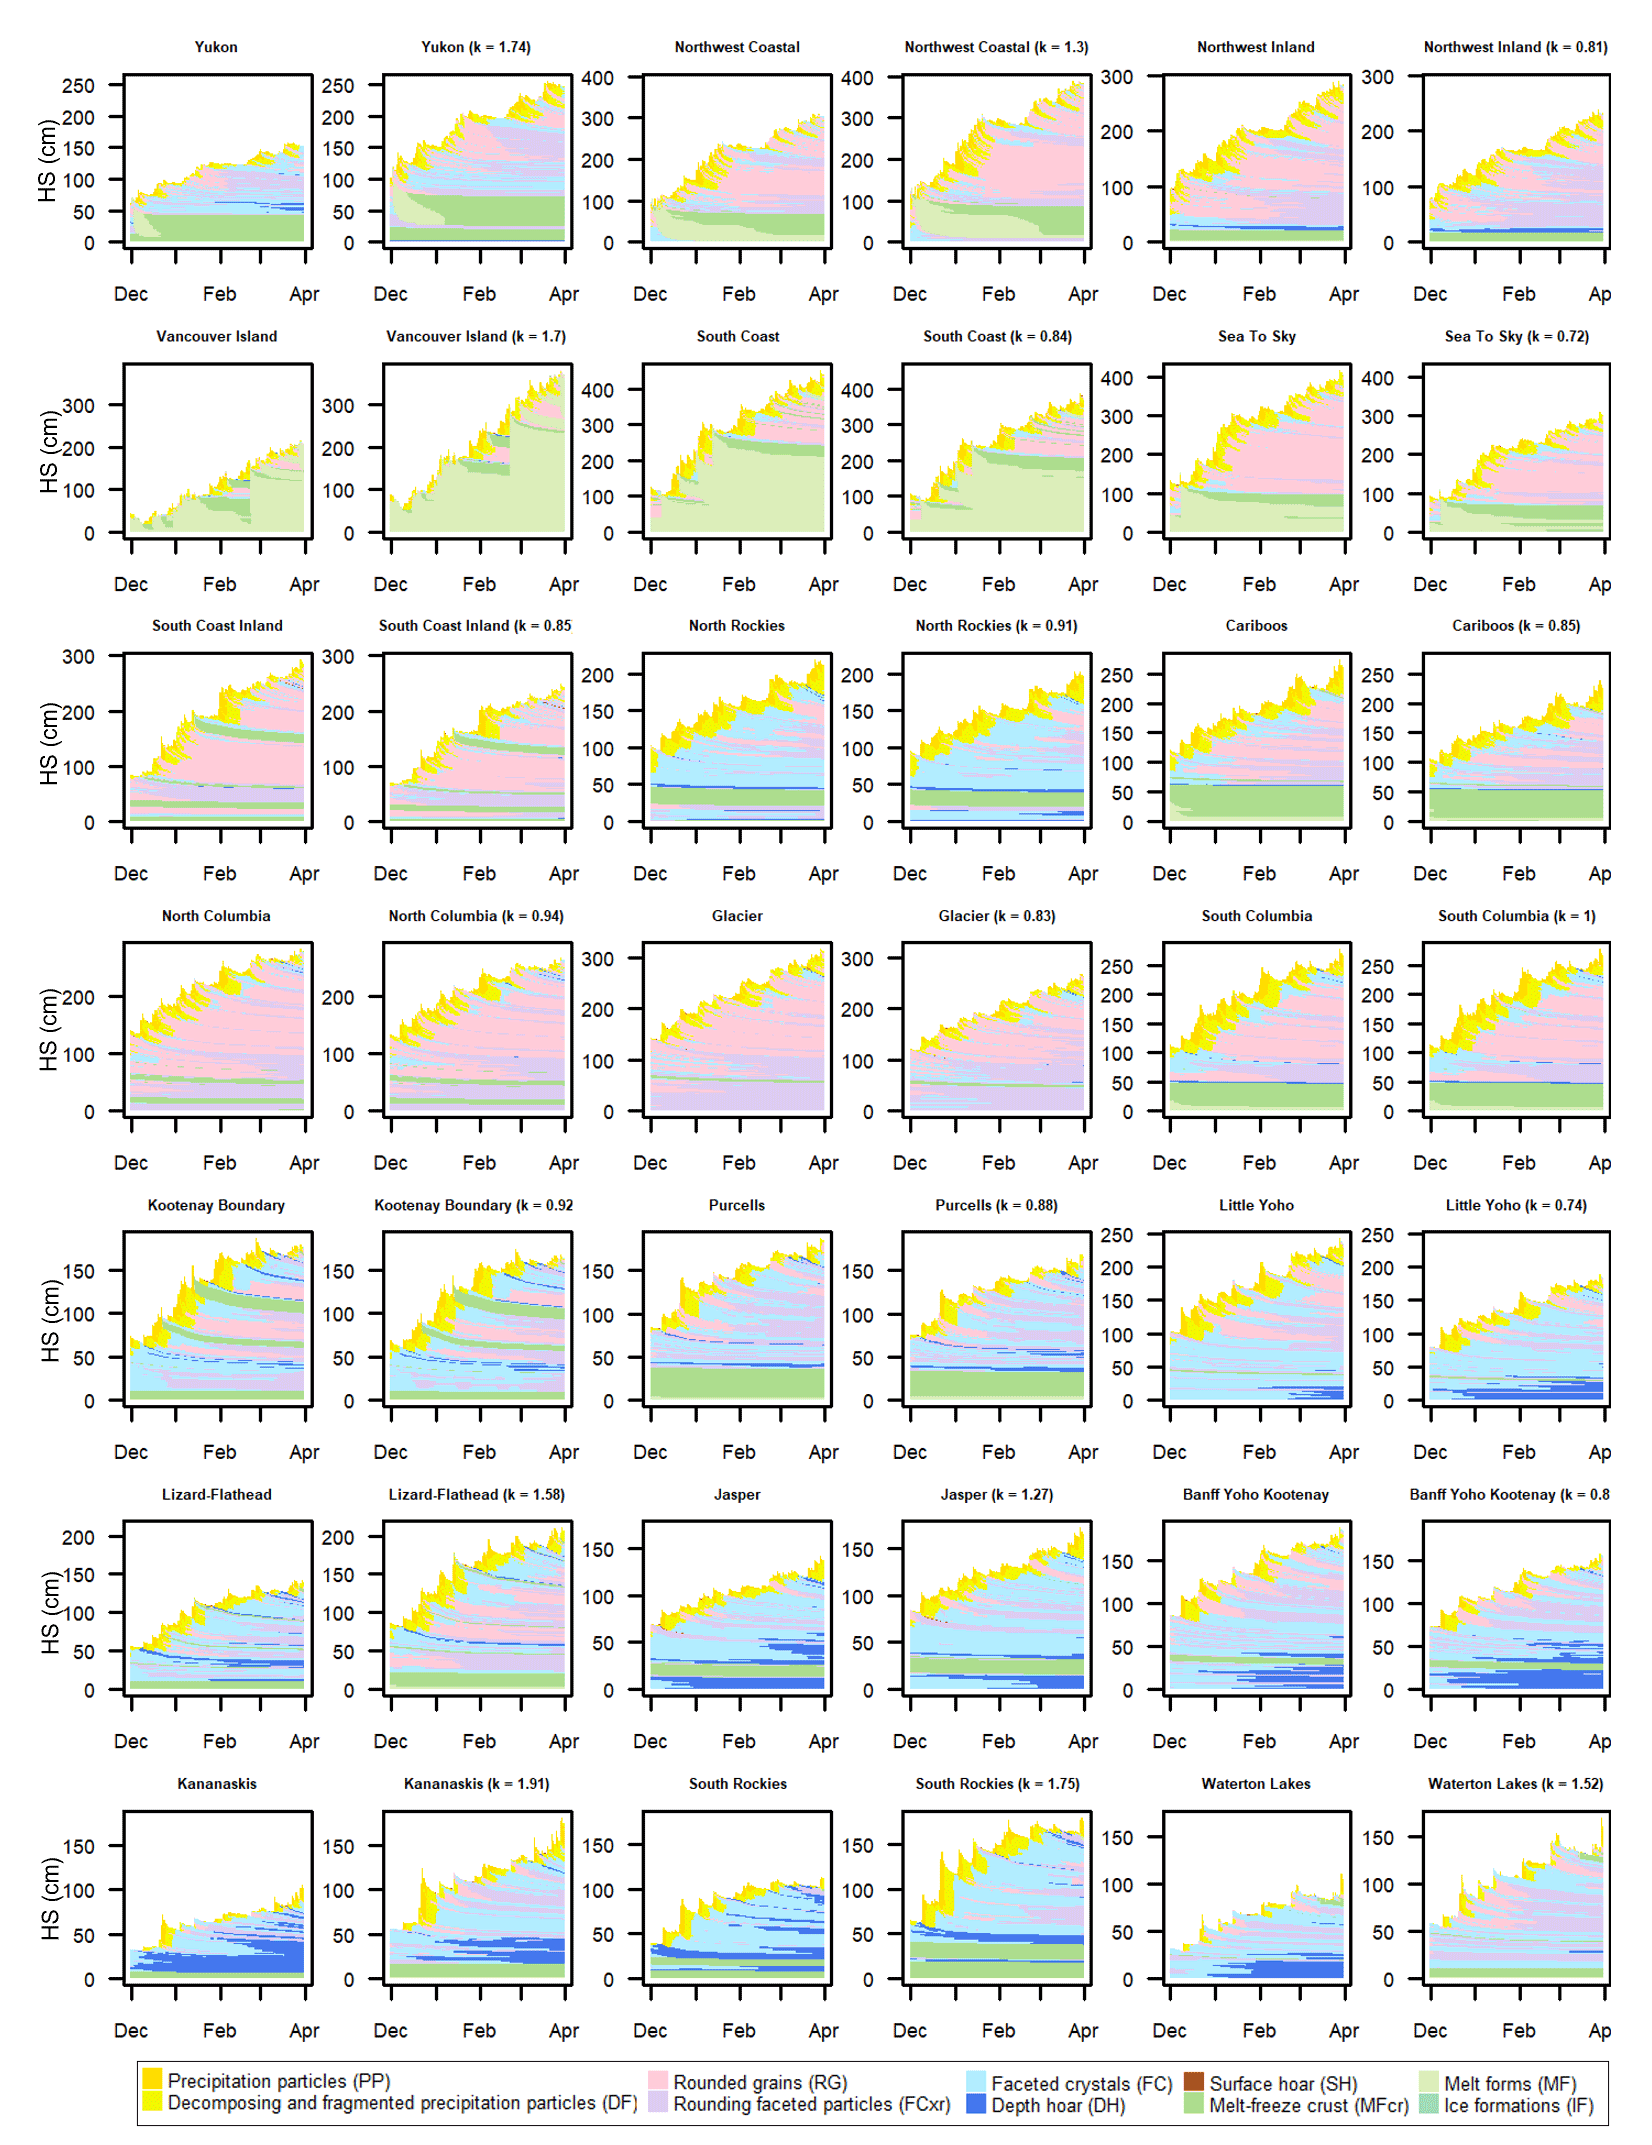
Figure A1Timelines of simulated snowpack structure before and after precipitation adjustments. Two profile timelines are shown for each forecast region, with the original profiles to the left and the precipitation-adjusted profiles to the right. The precipitation-adjustment factors (k) are shown in the title of the adjusted profiles. Snowpack layers are colour-coded by grain type following Horton et al. (2020a).
Code and data are publicly available on the Open Science Framework at https://doi.org/10.17605/OSF.IO/A5PEK (Horton and Haegeli, 2022).
Both authors conceptualized the research, with SH leading the analysis and writing and PH providing supervision.
The contact author has declared that neither of the authors has any competing interests.
Publisher’s note: Copernicus Publications remains neutral with regard to jurisdictional claims in published maps and institutional affiliations.
We thank Avalanche Canada, the Canadian Avalanche Association, and InfoEx subscribers for sharing datasets. Patrick Mair, Florian Herla, and Stan Nowak provided valuable input on data analysis and visualization methods. We also thank the reviewers for their constructive feedback.
This research has been supported by Mitacs (grant no. IT14451).
This paper was edited by Jürg Schweizer and reviewed by Matthieu Lafaysse and Sascha Bellaire.
Bellaire, S. and Jamieson, B.: Forecasting the formation of critical snow layers using a coupled snow cover and weather model, Cold Reg. Sci. Technol., 94, 37–44, https://doi.org/10.1016/j.coldregions.2013.06.007, 2013. a
Bellaire, S., Jamieson, J. B., and Fierz, C.: Forcing the snow-cover model SNOWPACK with forecasted weather data, The Cryosphere, 5, 1115–1125, https://doi.org/10.5194/tc-5-1115-2011, 2011. a
Bellaire, S., van Herwijnen, A., Mitterer, C., and Schweizer, J.: On forecasting wet-snow avalanche activity using simulated snow cover data, Cold Reg. Sci. Technol., 144, 28–38, https://doi.org/10.1016/j.coldregions.2017.09.013, 2017. a
Brun, E., David, P., Sudul, M., and Brunot, G.: A numerical model to simulate snow-cover stratigraphy for operational avalanche forecasting, J. Glaciol., 38, 13–22, https://doi.org/10.3189/S0022143000009552, 1992. a
Calonne, N., Richter, B., Löwe, H., Cetti, C., ter Schure, J., Van Herwijnen, A., Fierz, C., Jaggi, M., and Schneebeli, M.: The RHOSSA campaign: multi-resolution monitoring of the seasonal evolution of the structure and mechanical stability of an alpine snowpack, The Cryosphere, 14, 1829–1848, https://doi.org/10.5194/tc-14-1829-2020, 2020. a
Canadian Avalanche Association: Observation Guidelines and Recording Standards for Weather, Snowpack, and Avalanches, Canadian Avalanche Association, Revelstoke, BC, http://cdn.ymaws.com/www.avalancheassociation.ca/resource/resmgr/standards_docs/OGRS2016web.pdf (last access: 23 August 2022), 2016. a, b, c
Charrois, L., Cosme, E., Dumont, M., Lafaysse, M., Morin, S., Libois, Q., and Picard, G.: On the assimilation of optical reflectances and snow depth observations into a detailed snowpack model, The Cryosphere, 10, 1021–1038, https://doi.org/10.5194/tc-10-1021-2016, 2016. a
Christensen, R.: ordinal – Regression Models for Ordinal Data, r package version 2019.12-10, The Comprehensive R Archive Network [code], https://CRAN.R-project.org/package=ordinal (last access: 23 August 2022), 2019. a
Cluzet, B., Revuelto, J., Lafaysse, M., Tuzet, F., Cosme, E., Picard, G., Arnaud, L., and Dumont, M.: Towards the assimilation of satellite reflectance into semi-distributed ensemble snowpack simulations, Cold Reg. Sci. Technol., 170, 102918, https://doi.org/10.1016/j.coldregions.2019.102918, 2020. a
Cluzet, B., Lafaysse, M., Deschamps-Berger, C., Vernay, M., and Dumont, M.: Propagating information from snow observations with CrocO ensemble data assimilation system: a 10-years case study over a snow depth observation network, The Cryosphere, 16, 1281–1298, https://doi.org/10.5194/tc-16-1281-2022, 2022. a, b, c, d
Danielson, J. and Gesch, D.: Global multi-resolution terrain elevation data 2010 (GMTED2010), 2011-1073, US Department of the Interior, US Geological Survey Washington, DC, USA, https://doi.org/10.3133/ofr20111073, 2011. a
Durand, Y., Giraud, G., Brun, E., Mérindol, L., and Martin, E.: A computer-based system simulating snowpack structures as a tool for regional avalanche forecasting, J. Glaciol., 45, 469–484, https://doi.org/10.3189/S0022143000001337, 1999. a
Durand, Y., Laternser, M., Giraud, G., Etchevers, P., Lesaffre, B., and Mérindol, L.: Reanalysis of 44 yr of climate in the French Alps (1958–2002): methodology, model validation, climatology, and trends for air temperature and precipitation, J. Appl. Meteorol. Clim., 48, 429–449, https://doi.org/10.1175/2008JAMC1808.1, 2009. a
Fierz, C., Armstrong, R., Durand, Y., Etchevers, P., Greene, E., McClung, D., Nishimura, K., Satyawali, P., and Sokratov, S.: The International Classification for Seasonal Snow on the Ground, IHP-VII Tech. Doc. Hyrdol. No. 83, IACS Contrib. No. 1, UNESCO-IHP, Paris, 2009. a
Gilleland, E., Ahijevych, D., Brown, B., Casati, B., and Ebert, E.: Intercomparison of spatial forecast verification methods, Weather Forecast., 24, 1416–1430, https://doi.org/10.1175/2009WAF2222269.1, 2009. a
Giraud, G., Lafeuille, J., and Pahaut, E.: Evaluation de la qualité de la prévision du risque d'avalanche, Int. Ass. Hydrol. Sci. Publ/, 162, 583–591, 1987. a
Helbig, N. and van Herwijnen, A.: Subgrid parameterization for snow depth over mountainous terrain from flat field snow depth, Water Resour. Res., 53, 1444–1456, https://doi.org/10.1002/2016WR019872, 2017. a
Helfricht, K., Hartl, L., Koch, R., Marty, C., and Olefs, M.: Obtaining sub-daily new snow density from automated measurements in high mountain regions, Hydrol. Earth Syst. Sci., 22, 2655–2668, https://doi.org/10.5194/hess-22-2655-2018, 2018. a
Herla, F., Horton, S., Mair, P., and Haegeli, P.: Snow profile alignment and similarity assessment for aggregating, clustering, and evaluating snowpack model output for avalanche forecasting, Geosci. Model Dev., 14, 239–258, https://doi.org/10.5194/gmd-14-239-2021, 2021. a
Horton, S. and Haegeli, P.: Using snow depth observations to provide insight into the quality of snowpack simulations for regional-scale avalanche forecasting, OSF [code and data set], https://doi.org/10.17605/OSF.IO/A5PEK, 2022. a
Horton, S., Nowak, S., and Haegeli, P.: Enhancing the operational value of snowpack models with visualization design principles, Nat. Hazards Earth Syst. Sci., 20, 1557–1572, https://doi.org/10.5194/nhess-20-1557-2020, 2020a. a
Horton, S., Towell, M., and Haegeli, P.: Examining the operational use of avalanche problems with decision trees and model-generated weather and snowpack variables, Nat. Hazards Earth Syst. Sci., 20, 3551–3576, https://doi.org/10.5194/nhess-20-3551-2020, 2020. a, b
Lafaysse, M., Morin, S., Coléou, C., Vernay, M., Serça, D., Besson, F., Willemet, J.-M., Giraud, G., and Durand, Y.: Towards a new chain of models for avalanche hazard forecasting in French mountain ranges, including low altitude mountains, in: Proc. Int. Snow Sci. Workshop, Grenoble, France, 7–11 October, 162–166, 2013. a
Largeron, C., Dumont, M., Morin, S., Boone, A., Lafaysse, M., Metref, S., Cosme, E., Jonas, T., Winstral, A., and Margulis, S. A.: Toward Snow Cover Estimation in Mountainous Areas Using Modern Data Assimilation Methods: A Review, Front. Earth Sci., 8, 325, https://doi.org/10.3389/feart.2020.00325, 2020. a
Lehning, M., Bartelt, P., Brown, B., Russi, T., Stöckli, U., and Zimmerli, M.: Snowpack model calculations for avalanche warning based upon a new network of weather and snow stations, Cold Reg. Sci. Technol., 30, 145–157, https://doi.org/10.1016/S0165-232X(02)00073-3, 1999. a
Lehning, M., Bartelt, P., Brown, B., Fierz, C., and Satyawali, P.: A physical SNOWPACK model for the Swiss avalanche warning: Part II. Snow microstructure, Cold Reg. Sci. Technol., 35, 147–167, 2002. a
Liston, G. and Elder, K.: A meteorological distribution system for high-resolution terrestrial modeling (MicroMet), J. Hydrometeor., 7, 217–234, https://doi.org/10.1175/JHM486.1, 2006. a
Lundquist, J., Hughes, M., Gutmann, E., and Kapnick, S.: Our Skill in Modeling Mountain Rain and Snow is Bypassing the Skill of Our Observational Networks, B. Am. Meteorol. Soc., 100, 2473–2490, https://doi.org/10.1175/bams-d-19-0001.1, 2020. a, b
Milbrandt, J., Bélair, S., Faucher, M., Vallée, M., Carrera, M. L., and Glazer, A.: The Pan-Canadian High Resolution (2.5 km) Deterministic Prediction System, Weather Forecast., 31, 1791–1816, https://doi.org/10.1175/waf-d-16-0035.1, 2016. a
Mo, R., Brugman, M., Milbrandt, J., Goosen, J., Geng, Q., Emond, C., Bau, J., and Erfani, A.: Impacts of hydrometeor drift on orographic precipitation: Two case studies of landfalling atmospheric rivers in British Columbia, Canada, Weather Forecast., 34, 1211–1237, https://doi.org/10.1175/WAF-D-18-0176.1, 2019. a
Morin, S., Horton, S., Techel, F., Bavay, M., Coléou, C., Fierz, C., Gobiet, A., Hagenmuller, P., Lafaysse, M., Ližar, M., Mitterer, C., Monti, F., Müller, K., Olefs, M., Snook, J., van Herwijnen, A., and Vionnet, V.: Application of physical snowpack models in support of operational avalanche hazard forecasting: A status report on current implementations and prospects for the future, Cold Reg. Sci. Technol., 170, 102910, https://doi.org/10.1016/j.coldregions.2019.102910, 2020. a, b
North American Land Change Monitoring System: Land Cover 30m, 2015 (Landsat and RapidEye), http://www.cec.org/north-american-environmental-atlas/land-cover-30m-2015-landsat-and-rapideye (last access: 15 August 2021), 2015. a
Pebesma, E.: Multivariable geostatistics in S: the gstat package, Comput. Geosci., 30, 683–691, https://doi.org/10.1016/j.cageo.2004.03.012, 2004. a
Quéno, L., Vionnet, V., Dombrowski-Etchevers, I., Lafaysse, M., Dumont, M., and Karbou, F.: Snowpack modelling in the Pyrenees driven by kilometric-resolution meteorological forecasts, The Cryosphere, 10, 1571–1589, https://doi.org/10.5194/tc-10-1571-2016, 2016. a, b
Raleigh, M. S., Lundquist, J. D., and Clark, M. P.: Exploring the impact of forcing error characteristics on physically based snow simulations within a global sensitivity analysis framework, Hydrol. Earth Syst. Sci., 19, 3153–3179, https://doi.org/10.5194/hess-19-3153-2015, 2015. a, b
Reuter, B., Schweizer, J., and van Herwijnen, A.: A process-based approach to estimate point snow instability, The Cryosphere, 9, 837–847, https://doi.org/10.5194/tc-9-837-2015, 2015. a
Richter, B., van Herwijnen, A., Rotach, M. W., and Schweizer, J.: Sensitivity of modeled snow stability data to meteorological input uncertainty, Nat. Hazards Earth Syst. Sci., 20, 2873–2888, https://doi.org/10.5194/nhess-20-2873-2020, 2020. a, b
Roy, G., Stadnyk, T., Koenig, K., Gasset, N., and Mahidjiba, A.: Ten Years of Science Based on the Canadian Precipitation Analysis: A CaPA System Overview and Literature Review AU – Fortin, V, Atmos. Ocean., 56, 178–196, https://doi.org/10.1080/07055900.2018.1474728, 2018. a
Schirmer, M. and Jamieson, B.: Verification of analysed and forecasted winter precipitation in complex terrain, The Cryosphere, 9, 587–601, https://doi.org/10.5194/tc-9-587-2015, 2015. a
Schirmer, M., Lehning, M., and Schweizer, J.: Statistical forecasting of regional avalanche danger using simulated snow-cover data, J. Glaciol., 55, 761–768, https://doi.org/10.3189/002214309790152429, 2009. a
Schmid, L., Heilig, A., Mitterer, C., Schweizer, J., Maurer, H., Okorn, R., and Eisen, O.: Continuous snowpack monitoring using upward-looking ground-penetrating radar technology, J. Glaciol., 60, 509–525, https://doi.org/10.3189/2014JoG13J084, 2014. a
Schweizer, J., Bellaire, S., Fierz, C., Lehning, M., and Pielmeier, C.: Evaluating and improving the stability predictions of the snow cover model SNOWPACK, Cold Reg. Sci. Technol., 46, 52–59, https://doi.org/10.1016/j.coldregions.2006.05.007, 2006. a
Shandro, B. and Haegeli, P.: Characterizing the nature and variability of avalanche hazard in western Canada, Nat. Hazards Earth Syst. Sci., 18, 1141–1158, https://doi.org/10.5194/nhess-18-1141-2018, 2018. a
Statham, G., Haegeli, P., Greene, E., Birkeland, K., Israelson, C., Tremper, B., Stethem, C., McMahon, B., White, B., and Kelly, J.: A conceptual model of avalanche hazard, Nat. Hazards, 90, 663–691, https://doi.org/10.1007/s11069-017-3070-5, 2018. a, b
Thornton, P., Running, S., and White, M.: Generating surfaces of daily meteorological variables over large regions of complex terrain, J. Hydrol., 190, 214–251, https://doi.org/10.1016/S0022-1694(96)03128-9, 1997. a, b
Viallon-Galinier, L., Hagenmuller, P., and Lafaysse, M.: Forcing and evaluating detailed snow cover models with stratigraphy observations, Cold Reg. Sci. Technol., 180, 103163, https://doi.org/10.1016/j.coldregions.2020.103163, 2020. a
Vionnet, V., Six, D., Auger, L., Dumont, M., Lafaysse, M., Quéno, L., Réveillet, M., Dombrowski-Etchevers, I., Thibert, R., and Vincent, C.: Sub-kilometer precipitation datasets for snowpack and glacier modeling in alpine terrain, Front. Earth Sci., 7, 182, https://doi.org/10.3389/feart.2019.00182, 2019. a, b
Wang, X. L., Xu, H., Qian, B., Feng, Y., and Mekis, E.: Adjusted daily rainfall and snowfall data for Canada, Atmos. Ocean., 55, 155–168, https://doi.org/10.1080/07055900.2017.1342163, 2017. a
Winstral, A., Magnusson, J., Schirmer, M., and Jonas, T.: The Bias Detecting Ensemble: A New and Efficient Technique for Dynamically Incorporating Observations into Physics-based, Multi-layer, Snow Models, Water Resour. Res., 55, 613–631, https://doi.org/10.1029/2018WR024521, 2018. a, b, c