the Creative Commons Attribution 4.0 License.
the Creative Commons Attribution 4.0 License.
 | 25 Jan 2022
Dam type and lake location characterize ice-marginal lake area change in Alaska and NW Canada between 1984 and 2019
Daniel McGrath
William Armstrong
Scott W. McCoy
Ice-marginal lakes impact glacier mass balance, water resources, and ecosystem dynamics and can produce catastrophic glacial lake outburst floods (GLOFs) via sudden drainage. Multitemporal inventories of ice-marginal lakes are a critical first step in understanding the drivers of historic change, predicting future lake evolution, and assessing GLOF hazards. Here, we use Landsat-era satellite imagery and supervised classification to semi-automatically delineate lake outlines for four ∼5-year time periods between 1984 and 2019 in Alaska and northwest Canada. Overall, ice-marginal lakes in the region have grown in total number (+183 lakes, 38 % increase) and area (+483 km2, 59 % increase) between the time periods of 1984–1988 and 2016–2019. However, changes in lake numbers and area were notably unsteady and nonuniform. We demonstrate that lake area changes are connected to dam type (moraine, bedrock, ice, or supraglacial) and topological position (proglacial, detached, unconnected, ice, or supraglacial), with important differences in lake behavior between the sub-groups. In strong contrast to all other dam types, ice-dammed lakes decreased in number (six fewer, 9 % decrease) and area (−51 km2, 40 % decrease), while moraine-dammed lakes increased (56 more, 26 % and +479 km2, 87 % increase for number and area, respectively) at a faster rate than the average when considering all dam types together. Proglacial lakes experienced the largest area changes and rate of change out of any lake position throughout the period of study and moraine-dammed lakes which experienced the largest increases are associated with clean-ice glaciers (<19 % debris cover). By tracking individual lakes through time and categorizing lakes by dam type, subregion, and topological position, we are able to parse trends that would otherwise be aliased if these characteristics were not considered. This work highlights the importance of such lake characterization when performing ice-marginal lake inventories and provides insight into the physical processes driving recent ice-marginal lake evolution.
- Article
(14848 KB) - Full-text XML
-
Supplement
(4046 KB) - BibTeX
- EndNote


Ice-marginal lakes are located adjacent to glaciers, commonly forming at glacier termini, tributary junctions, along glacier margins, or where glacially eroded bedrock or sediment creates topographic depressions (overdeepenings; Carrivick and Tweed, 2013; Cook and Quincey, 2015). These lakes can impact human societies in a multitude of ways, ranging from water resources (Immerzeel et al., 2020) and tourist attractions (Wang and Zhou, 2019; Welling et al., 2020) to destructive and lethal hazards (Carrivick and Tweed, 2016; Cook et al., 2016; Emmer, 2017). Formation or drainage of lakes can impact ecosystem dynamics by providing or removing a source of stored freshwater, altering the sediment flux within a basin, creating new habitat (e.g., Milner et al., 2008), or altering downstream flow characteristics (Tweed and Carrivick, 2015; Jacquet et al., 2017). Glacial lake outburst floods (GLOFs; when a lake dam fails or is overtopped; Clague and Evans, 2000) from ice-marginal lakes can have massive impacts on downstream river channel morphology and sediment supply (e.g., Jacquet et al., 2017), disrupt ecosystems (e.g., Meerhoff et al., 2018), destroy infrastructure, and cause the loss of human lives (e.g., Carrivick and Tweed, 2016). Time-varying inventories of ice-marginal lakes are a critical first step in predicting future lake evolution and assessing GLOF hazards.
Global (Shugar et al., 2020) and regional (Wang et al., 2013; Carrivick and Quincey, 2014; Glasser et al., 2016; Nie et al., 2017; Song et al., 2017; Emmer et al., 2020) lake inventories document recent increases in ice-marginal lakes; however, many studies report solely on the change in total frequency and cumulative area of lakes within the study region, or consider only one type of lake (e.g., moraine-dammed or ice-dammed). By not accounting for individual lake characteristics and individual lake changes through time, important trends could be aliased and limit the understanding of processes controlling area change. For example, if a subset of lakes grow while other lakes drain, the positive and negative growth will offset one another, and the overall lake frequency and area change would be small and therefore misleading. Alternatively, if a few large lakes dominate the documented area change for a region, applying the regionally averaged lake growth to all lakes would overestimate growth, therefore preventing an accurate physical understanding of this change. In addition, the ecological consequences of lake changes may differ based on where lake growth occurs: a change from no lake to a 1 km2 lake could have larger ecological and hazard implications than a large lake (e.g., >10 km2) expanding by a few square kilometers (Dorava and Milner, 2000). Cumulative regional studies provide a first-order estimate of regional changes; however, individual lake change must be analyzed to develop a process-based understanding of area change in order to predict future lake growth and watershed-scale impacts.
Recent studies parse lakes by characteristics which predict lake behavior, such as dam type and evolution phase (Emmer et al., 2015, 2020), or the spatial relationship to their source glacier (e.g., proglacial, supraglacial, unconnected, detached; Nie et al., 2017; Rounce et al., 2017; Chen et al., 2021). In the Himalaya, proglacial lakes (located at the glacier terminus, in contact with ice) contributed to 83 % of the total lake area increase from 1990 to 2015, while only composing 55 % of the lake population (Nie et al., 2017). In this same region, supraglacial lakes (located on debris-covered glacier surfaces) experienced the greatest percent increase in area (367 %) since 1990, though they only constitute 1.2 % of total lake area in 2015 (Nie et al., 2017). Himalayan proglacial lakes tend to be persistent and contribute the most to regional area growth, whereas supraglacial lakes are small and experience large spatiotemporal variation in area and location (Nie et al., 2017; Rounce et al., 2017; Chen et al., 2021). In the Cordillera Blanca of Peru, many lakes shifted from proglacial to detached (no longer in contact with ice), and the dominant dam type for proglacial lakes shifted from moraine-dammed in 1948 to bedrock-dammed in 2017 (Emmer et al., 2020). In both the Himalaya and the Cordillera Blanca, dam type and lake position help characterize lake behavior; this variability would be lost if only cumulative changes were reported. These studies support the inclusion of dam type and topological position (used throughout to indicate spatial relationship of lakes to their source glacier) in comprehensive regional ice-marginal lake studies.
Alaska's large glacier extent (86 723 km2; second largest area outside the ice sheets; Fig. 1; Kienholz et al., 2015; Zemp et al., 2019) and recent retreat (Larsen et al., 2015) allow for the presence of many ice-marginal lakes, while a wide range of climate zones (maritime, transitional, continental, and Arctic; Miller et al., 1999), glacier morphologies (valleys, cirques, debris, ice fields), and bedrock lithologies/surficial deposits (Wilson et al., 2015) lead to a variety of lake characteristics (e.g., dam type and topological position; Fig. 1). Two unique aspects of the Alaska region are the numerous large, low-elevation coastal lakes (e.g., Bear Glacier Lake, Malaspina Lake, Grand Plateau Glacier Lake) and that lakes tend to be larger than ice-marginal lakes found around the world (e.g., high-mountain Asia, central Europe, and Alaska have median lake areas of 0.11, 0.11, and 0.17 km2, respectively; Shugar et al., 2020). In addition, the lakes in this region are quite dynamic, as both the largest number and highest frequency of recorded GLOFs globally have occurred here, accounting for 25 % of all recorded historical events (Carrivick and Tweed, 2016).

Figure 1Distribution of glaciers as mapped by the Randolph Glacier Inventory (RGI Consortium, 2017) and subregions used to separate glaciated areas in Alaska and NW Canada (basemap provided by ESRI, 2009). Total glacier area (km2) and percent debris cover (percent of glacier surface covered by debris; Herreid and Pellicciotti, 2020) are displayed for each subregion.
Previous studies of glacial lakes in Alaska have examined ice-dammed lakes (Post and Mayo, 1971; Wolfe et al., 2014), a subset of ice-marginal lakes (Field et al., 2021), individual case studies (e.g., Sturm and Benson, 1985; Anderson et al., 2003; Pelto et al., 2013; Kienholz et al., 2020), or as a regional subset within a global study (Shugar et al., 2020). These studies are limited in their ability to comprehensively characterize regional trends for all lakes. Glaciers in this region are losing mass on the order of −75 Gt yr−1 (Larsen et al., 2015; Zemp et al., 2019), which represents the largest mass change and one of the highest specific mass changes for any region of the world. This change underscores the need for a time-varying lake inventory, given that ice-marginal lakes with different dam types and topological positions respond differently to glacier mass loss (e.g., Field et al., 2021).
The aims of the current study are to systematically take inventory of and characterize all ice-marginal lakes in Alaska using Landsat satellite imagery between 1984 and 2019. We aim to (i) characterize ice-marginal lakes and decadal-scale lake area change in Alaska; (ii) determine whether factors such as dam type, topological position, and region can characterize area change; and (iii) explore the interplay between the spatial distribution of lakes and regional characteristics such as glacier area, glacier complexity, and debris cover.
2.1 Imagery and datasets
Cloud-free mosaics were compiled in Google Earth Engine (GEE), an open-source, web-based remote sensing platform. Landsat 5 Thematic Mapper (TM), Landsat 7 Thematic Mapper Plus (ETM+), and Landsat 8 Operational Land Imager (OLI) surface reflectance Tier 1 images were used to create 5-year composites (Table 1). Intervals were selected based on available imagery and to capture average lake outlines for a 5-year period within each decade (1980s to 2010s). Few images are available for the late 1980s to early 1990s, and therefore this time period was excluded. Imagery was limited to a 10 km buffer around the Randolph Glacier Inventory, which was created with source imagery for glacier outlines mostly from 2004 to 2010 for Region 01 (RGI v6.0; RGI Consortium, 2017; Wang et al., 2012; Kienholz et al., 2015; Zhang et al., 2018). For each pixel within the region of interest, the mosaicking algorithm calculates the median value of all cloud-free pixels between 1 July and 31 September for each year within the given time period (Fig. S1 in the Supplement). The 5-year mosaics minimize the impact of frequent cloud cover in Alaska, which complicates region-wide assessments on shorter timescales. In theory, 5-year composites allow for an average shoreline delineation, capturing longer-term trends rather than seasonal variation. However, ice-dammed lakes are known to fill and drain on sub-annual (e.g., Lago Cachet Dos; Jacquet et al., 2017) to annual (e.g., Hidden Creek Lake; Anderson et al., 2003) timescales, so a lake may be characterized as persistent (present at every time step) even though it has undergone multiple fill–drain cycles between composites. Owing to this limitation, our focus here is on decadal changes in lake number and area, not sub-annual lake dynamics relevant for GLOF frequency.
Table 1Dataset and the resolution of the dataset used for each time step.
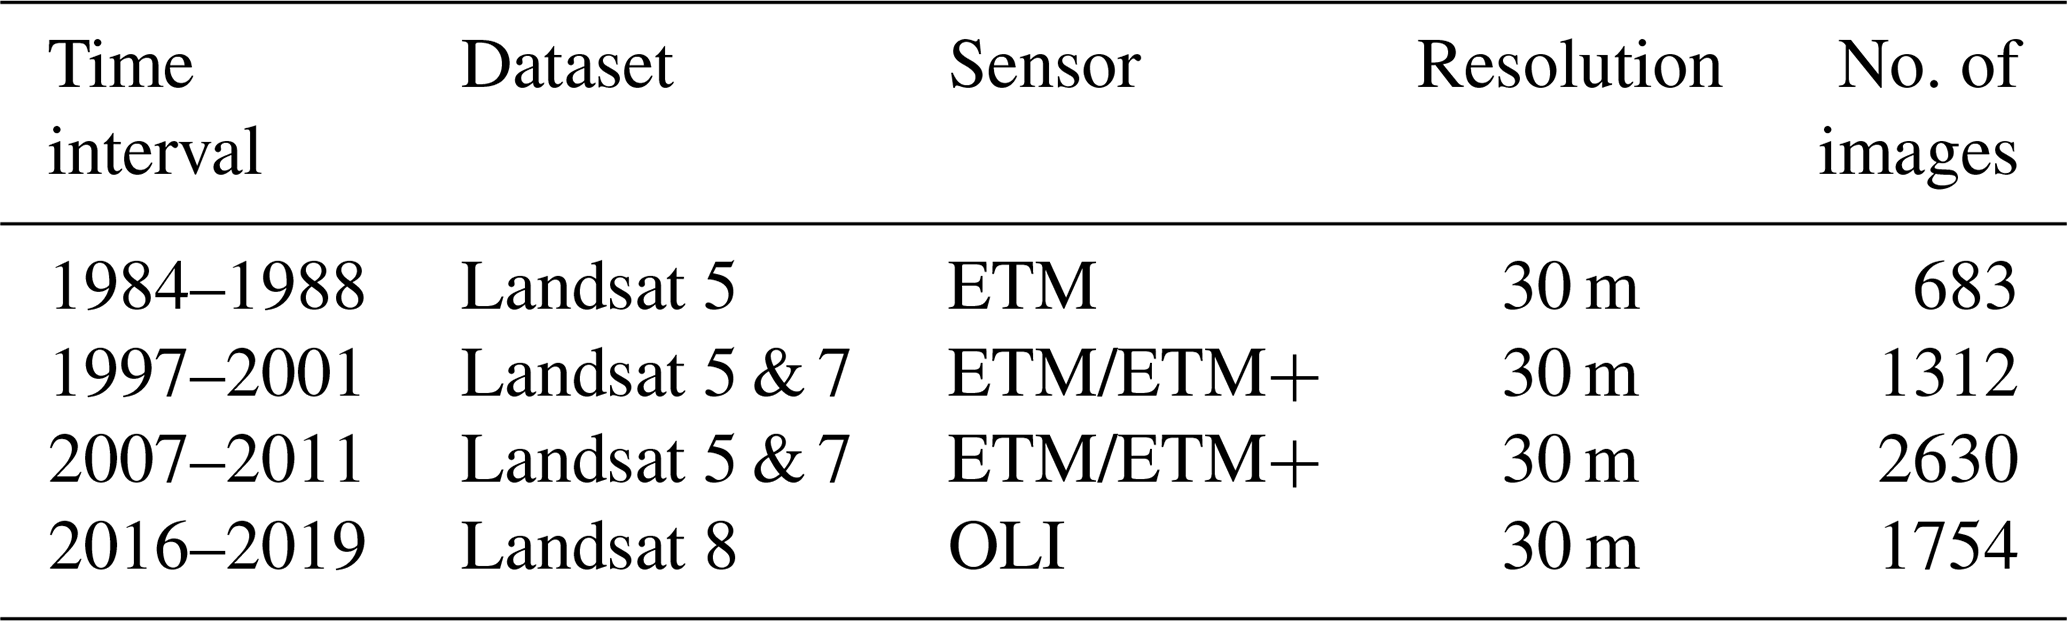
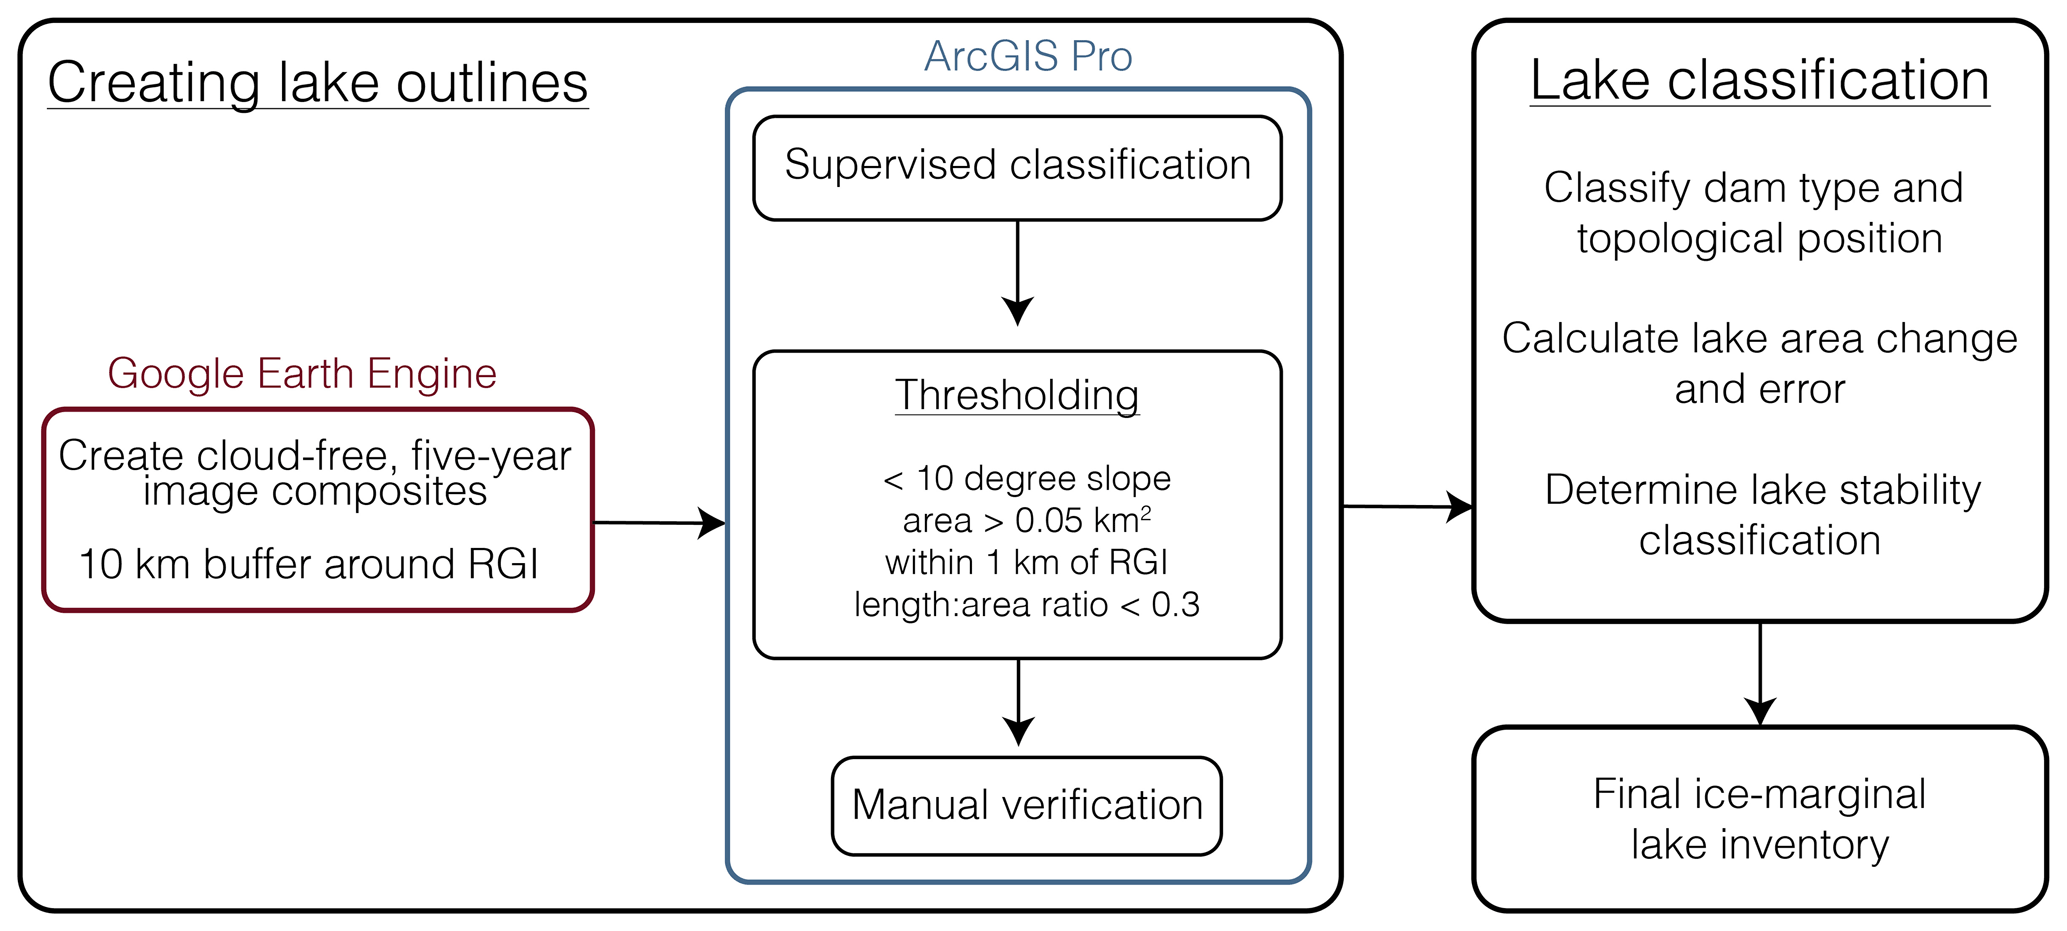
Figure 2General workflow for creating the ice-marginal lake inventory for the time periods 1984–1988, 1997–2001, 2007–2011, and 2016–2019.
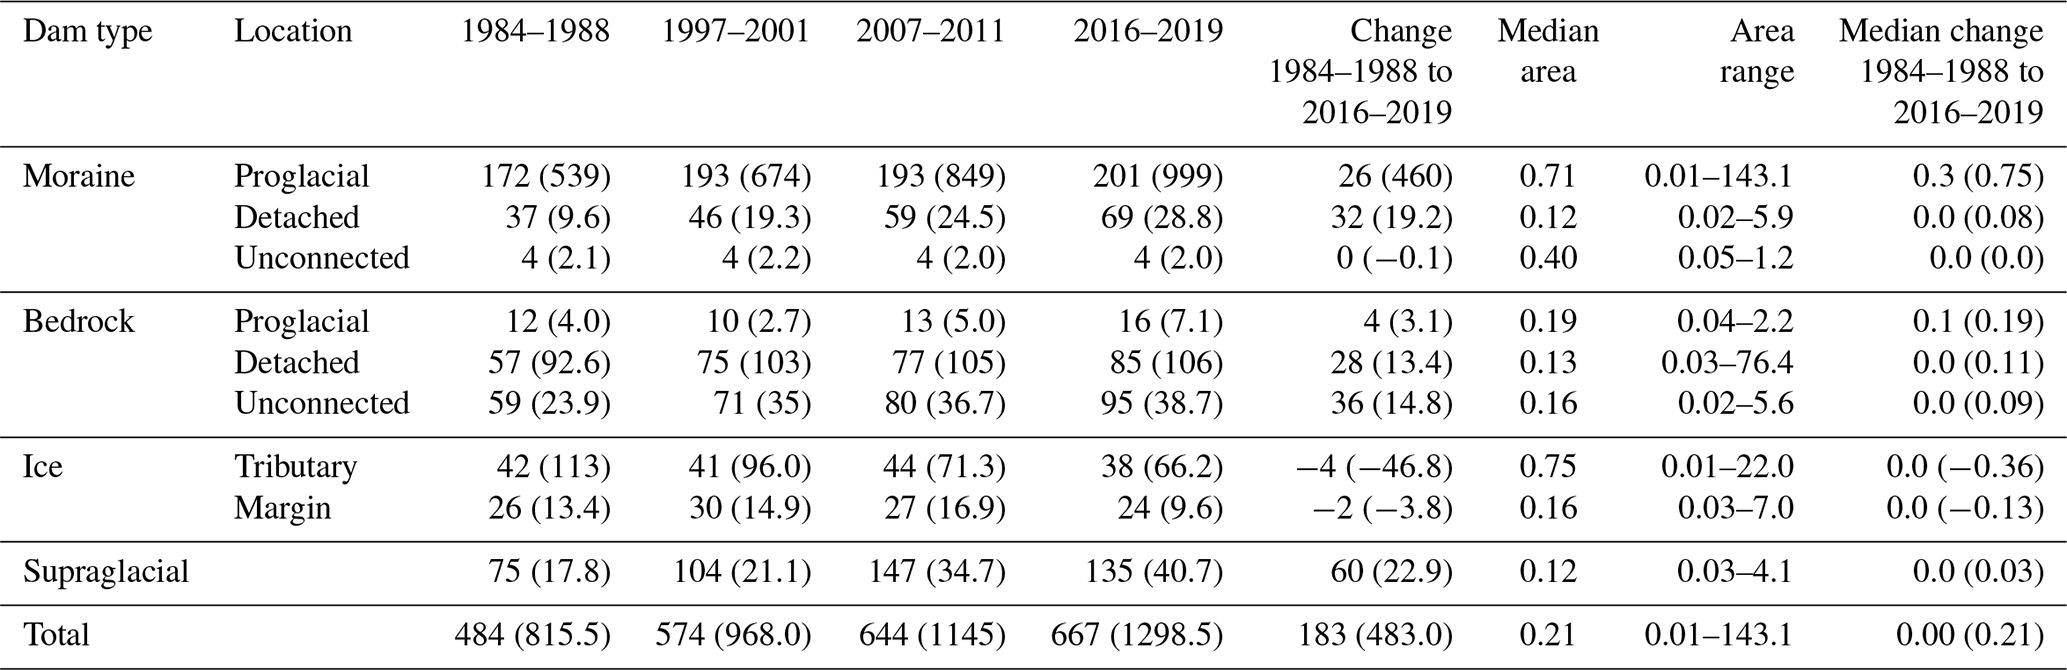
Table 2Count (area, km2) of glacial lakes by dam type and location between 1984 and 2019, as well as median area (km2), range of areas (km2), and median area change (km2) for all lakes. Median area change for lakes with detectable change (km2) is in the parentheses.
2.2 Generating lake inventories 1984–2019
Image composites were classified in ArcGIS Pro using an object-based supervised classification (support vector machine; Fig. 2). Manual training samples were selected for snow, ice, water, bedrock, supraglacial debris, and vegetation for each individual time step as snow, ice, and water can vary from year to year. To reduce false positives from mountain shadows, which have a similar spectral signal as water (Fig. S3), a slope threshold of 10∘ was implemented (Zhang et al., 2018; Shugar et al., 2020; Chen et al., 2021). We used a digital elevation model (DEM) composed of the national elevation dataset (NED; 10 m resolution) and Worldview-derived DEMs (resampled to 10 m resolution; DEMs created by the Polar Geospatial Center from DigitalGlobe, Inc. imagery). A minimum area threshold of 0.05 km2 (∼55 pixels) excludes pixel-level noise and small lakes with minimal hydrological impact and GLOF potential (Carrivick and Quincey, 2014; How et al., 2021). Lakes with margins entirely outside a 1 km buffer from the RGI were eliminated to minimize the inclusion of lakes disconnected from a glacial system (Shugar et al., 2020). Wet, supraglacial debris bands are often misclassified as lakes, likely due to the presence of supraglacial water and therefore similar spectral properties (Fig. S4). A length-to-area threshold of 0.3 was implemented to remove these long and thin features with atypical lake shape. For this study, any lake within 1 km of the RGI was considered an ice-marginal lake, acknowledging that some low-lying lakes (e.g., Vitus Lake) may have tidal influence. Lakes which are within 1 km of the RGI and unconnected to a glacial system are noted (Sect. 2.3.2) and treated separately (Table 2).
All lake outlines were visually inspected, and, if necessary, the lake margins were manually adjusted to produce a final delineation (Fig. S2). Lakes were added or excluded based on visual inspection and consideration of all four time steps together; lakes < 0.05 km2 were manually added back in if the lake grew in subsequent years to minimize false signals of lake formation. Lakes which coalesced or separated over time were given the same lake ID to minimize misclassification of a lake forming or draining. Every lake in each time step was then classified by (i) dam type (Sect. 2.3.1), (ii) topological position (Sect. 2.3.2), and (iii) stability (Sect. 2.3.3).
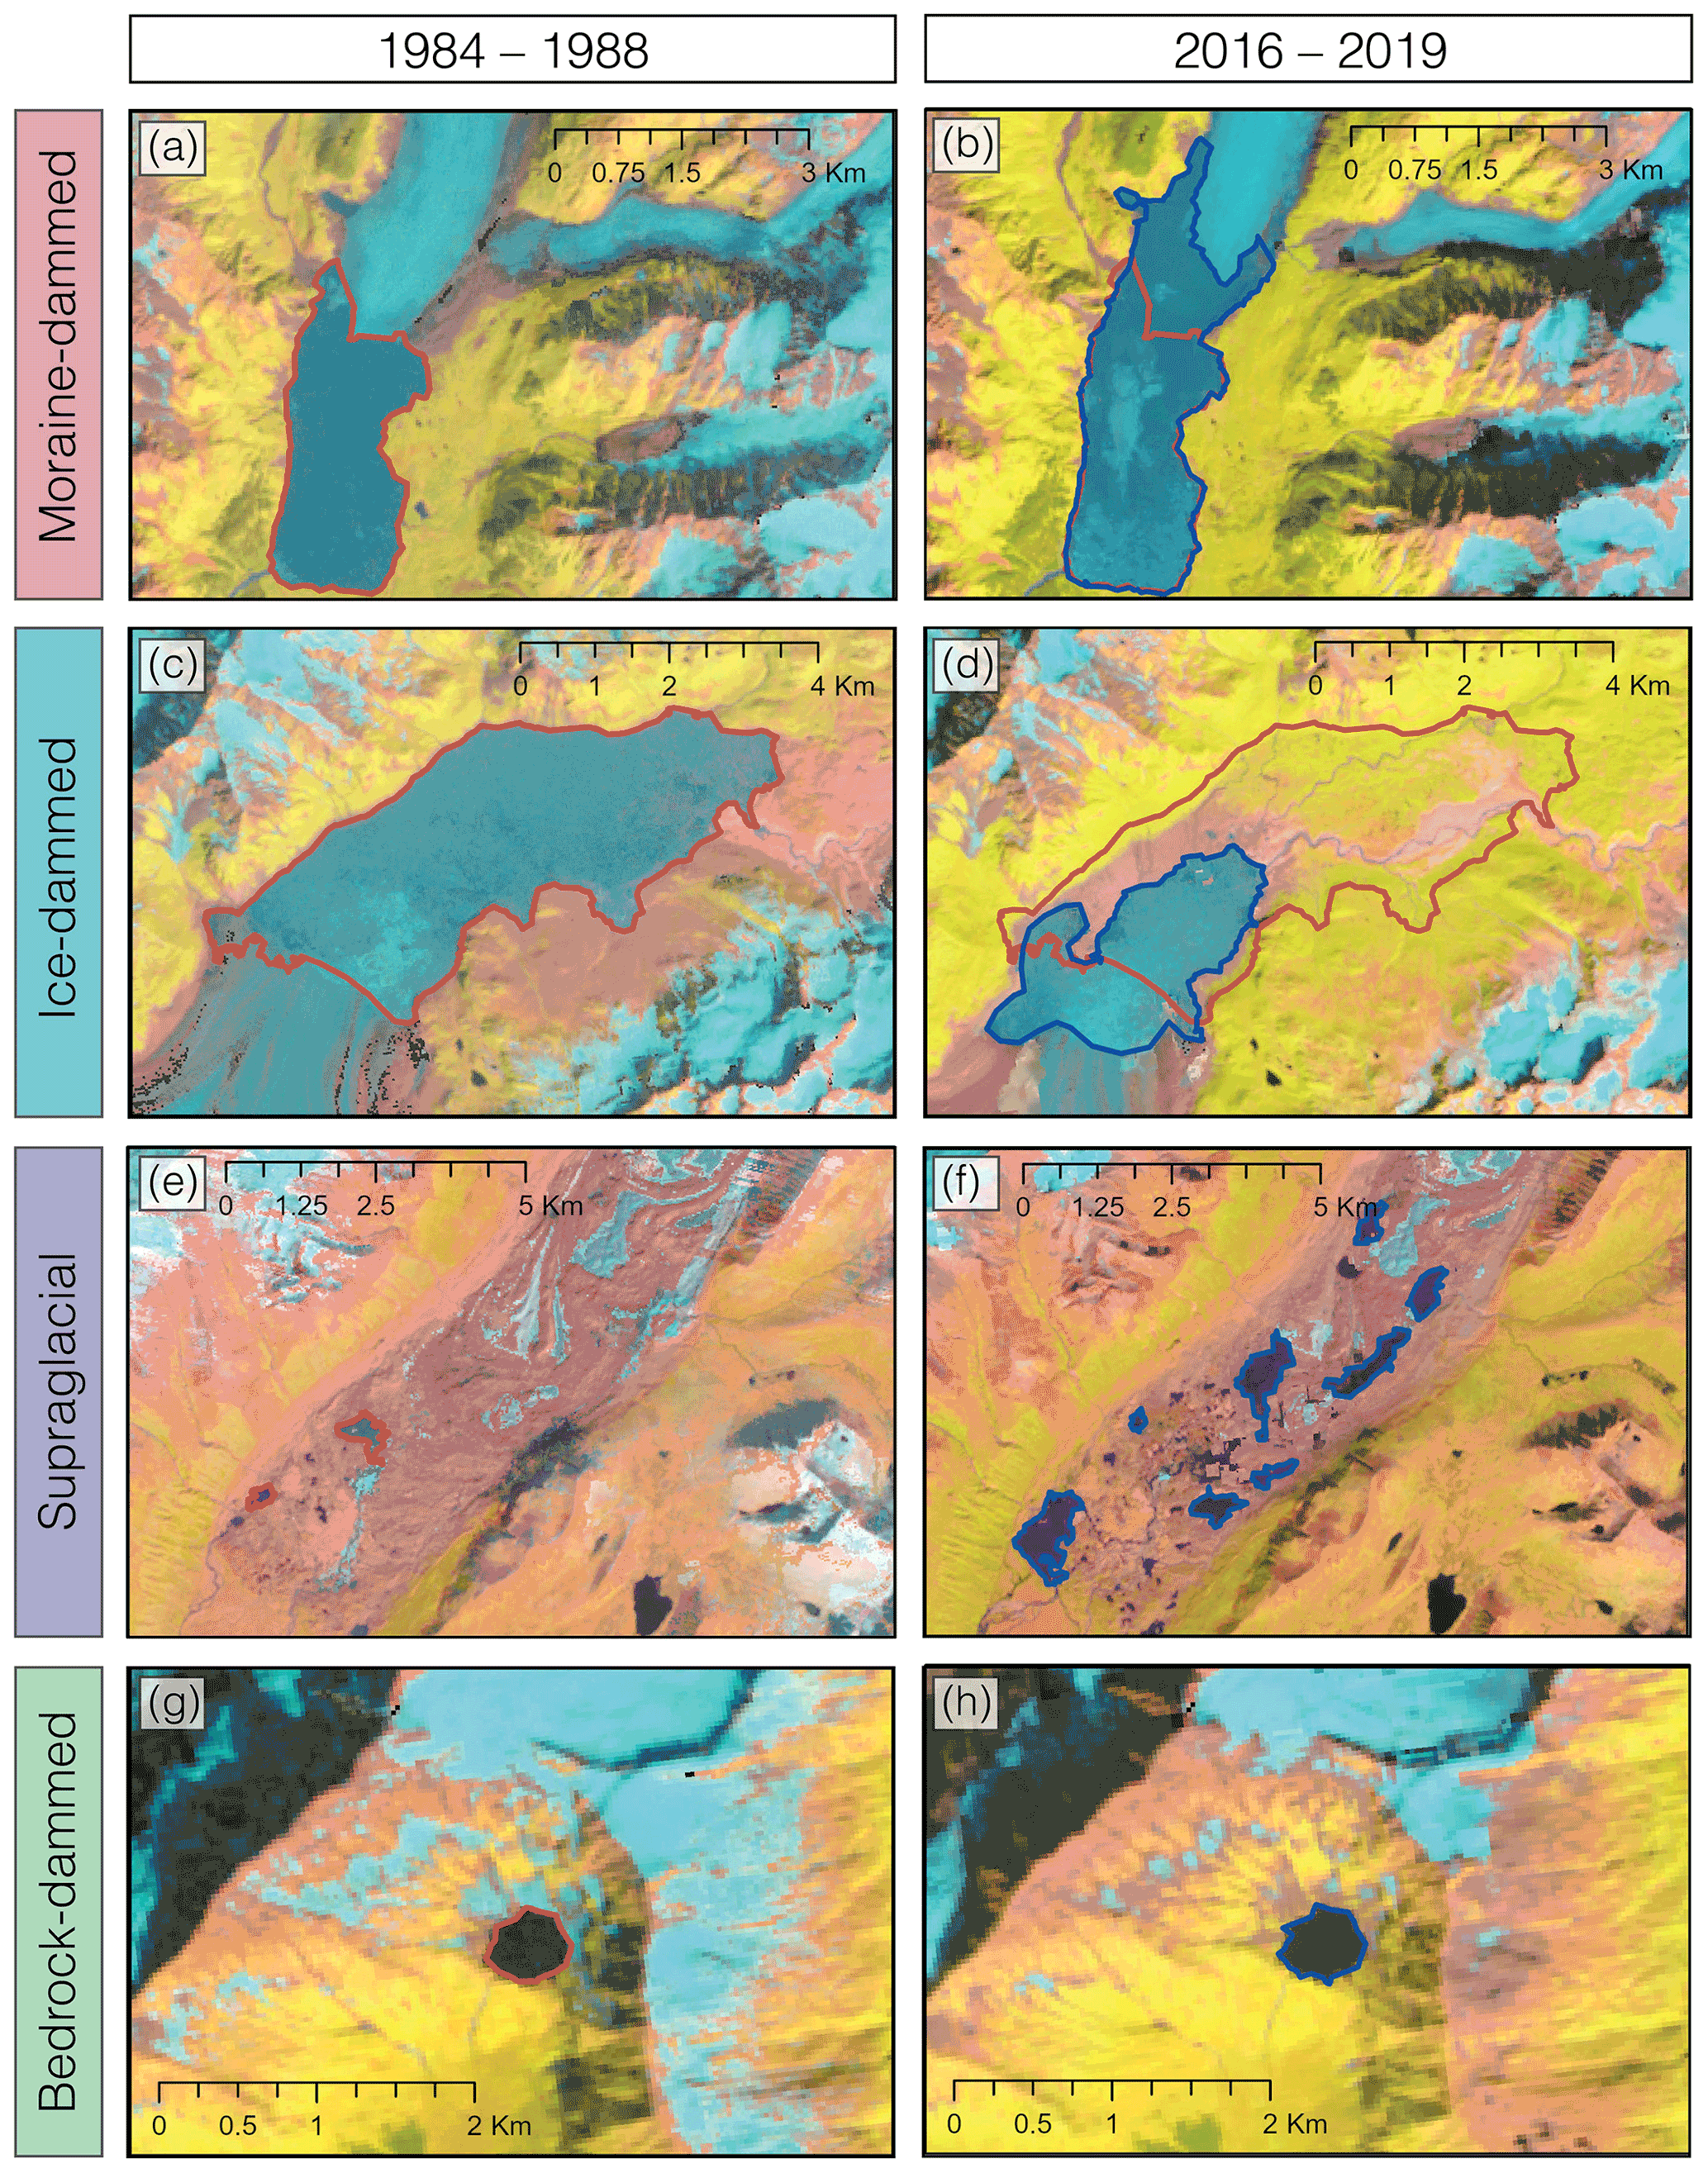
Figure 3Examples of typical lake behavior for each dam type – moraine (a, b), ice (c, d), supraglacial (e, f), and bedrock (g, h) – and changes in lake area from 1984–1988 (a, c, e, g; red) and 2016–2019 (b, d, f, h; blue). False color images using Landsat bands for shortwave infrared (SWIR), near infrared (NIR), and red.
2.3 Lake characteristics
2.3.1 Dam type classification
Using a combination of DEMs and high-resolution satellite imagery (i.e., Maxar Technologies in Google Earth), each lake's dam type was visually interpreted and manually classified (Buckel et al., 2018). Four different dam types were identified in this study (Fig. 3).
- i.
Moraine-dammed lakes are most frequently located at the glacier terminus, impounded behind a terminal or lateral moraine (Otto, 2019).
- ii.
Ice-dammed lakes are located along glacier margins or within tributary valleys and blocked by a glacier.
- iii.
Supraglacial lakes are found on the surface of the glacier, often dammed by glacier surface topography (ice or debris) within the ablation zone. For this study, we only observe supraglacial lakes within debris cover.
- iv.
Bedrock-dammed lakes are frequently located in cirques with minimal remaining glacial ice, or in other overdeepenings created from glacial erosion (Otto, 2019).
2.3.2 Topological position
In addition to dam type, all glacial lakes were classified based on their spatial relationship to their source glacier (Nie et al., 2017; Rounce et al., 2017) into one of the following categories:
- i.
proglacial – lakes at the terminus of the glacier, in contact with the ice,
- ii.
supraglacial – lakes on the surface of the glacier, most commonly within debris,
- iii.
detached – lakes fed by glaciers but not in contact with ice,
- iv.
unconnected – detached lakes not fed by glaciers,
- v.
ice – ice-dammed lakes located at ice margins or in tributary valleys.
2.3.3 Lake stability classification
Lake stability simply refers to whether or not a lake is present, rather than the stability of the lake shoreline. Five stability classifications are identified within this dataset:
- i.
forms – lakes which appear after 1984–1988 and are present in every mosaic through 2016–2019;
- ii.
forms–drains – lakes which form after 1984–1988 and drain by 2016–2019;
- iii.
drains – lakes which were present in 1984–1988 and disappear by 2016–2019;
- iv.
drains–refills – lakes which are present in 1984–1988, are not present for one or two time steps, and then reappear by 2016–2019;
- v.
persistent – lakes which are present in all four time steps.
2.3.4 Lake area change
Absolute area change (ΔA) was calculated for all lakes present in the latest time step (2016–2019), taken as the difference between the last (2016–2019) and first (2007–2011, 1997–2001, or 1984–1988) outline for each lake. For lakes which first appear in the 2016–2019 composite, ΔA is equal to lake area in 2016–2019. Rate of change (square kilometers per decade, calculated between the midpoint of each interval) was also calculated to minimize bias of longer-standing lakes having a larger area change. Rate of change per time step was also calculated to compare rates of area change over time.
2.3.5 Error
Error in lake delineation was calculated assuming an error of ±1 pixel for the entirety of each lake perimeter (Chen et al., 2021):
where P is the perimeter of the lake (km), R is the pixel resolution of the imagery (0.030 km for Landsat), and the resulting error (E) is in square kilometers. This error calculation is more generous than numerous lake inventories which assume ±0.5 pixel error (e.g., Fujita et al., 2009; Salerno et al., 2012; Zhang et al., 2015; Nie et al., 2017; Rounce et al., 2017; Wang et al., 2020). Error for the difference in areas was calculated using the theory of propagation of uncorrelated error:
where Ex and Ey are the error for the first and second lake outlines, respectively. Lakes where the area difference was greater than Ediff were determined to have detectable area change.
3.1 Lake evolution 1984–1988 to 2016–2019
The overall number of lakes in the Alaska region increased from 484 in 1984–1988 to 667 in 2016–2019, and total area grew from 815.5 km2 in 1984–1988 to 1298.5 km2 in 2016–2019 (Fig. 4). The distribution of lakes of each dam type has remained fairly consistent over time, with 40 %–44 % of all lakes being moraine-dammed, 26 %–30 % being bedrock-dammed, 9 %–14 % being ice-dammed, and 16 %–23 % being supraglacial. However, the contribution of each dam type to the total lake area has changed. The contribution of ice-dammed lakes decreased (16 % in 1984–1988 to 6 % in 2016–2019), while moraine-dammed lakes increased (67 % in 1984–1988 to 79 % in 2016–2019). While supraglacial lakes have increased in number over time, their contribution to total lake area has remained consistently around 2 %–3 %. Supraglacial lakes accounted for 20 % of lakes by number in 2016–2019, though they only contributed to 3 % of the total area. Conversely, moraine-dammed lakes composed 41 % of all lakes yet contributed to 79 % of the total area.
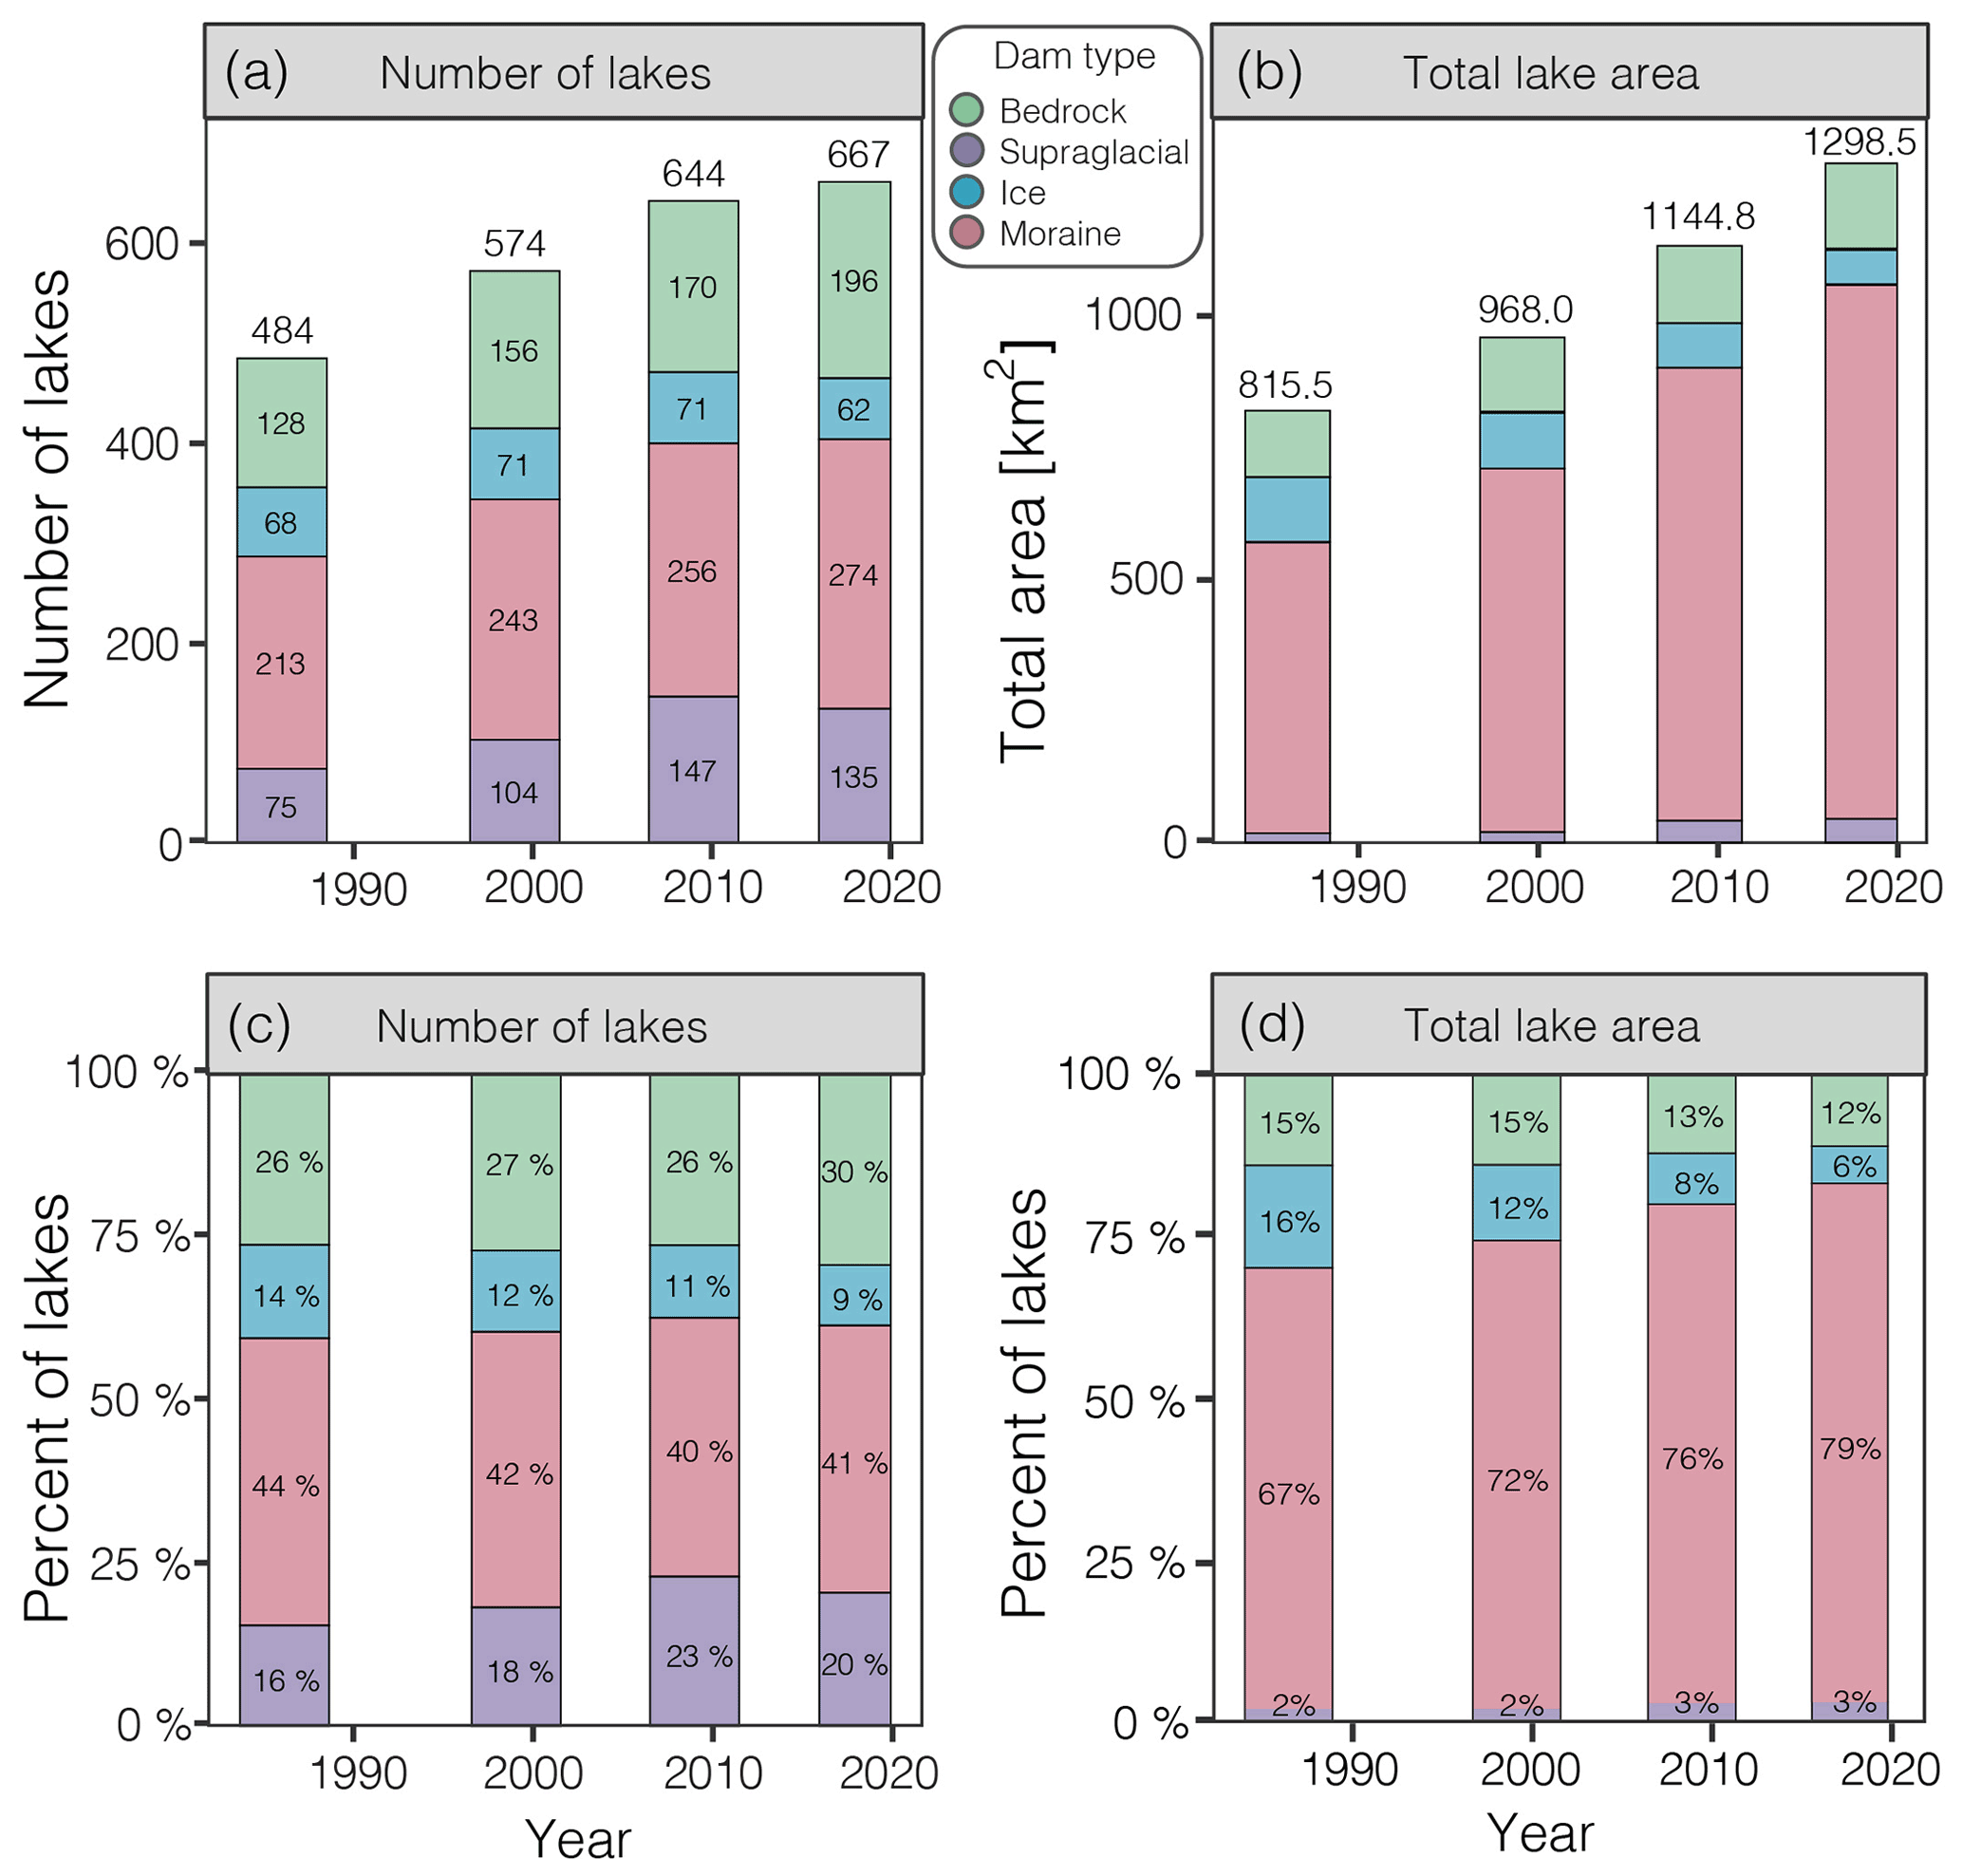
Figure 4Time evolution of ice-marginal lakes in terms of (a) unscaled number of lakes, (b) unscaled lake area, (c) number of lakes scaled by total number of lakes in that time step (percent), and (d) lake area scaled by the total lake area in that time step (percent). Lakes are colored by lake dam type (legend between panels a and b). Bar widths correspond to imagery time intervals.
Lake stability describes whether a lake is persistent or whether it formed or drained during any of the four time intervals used for analysis. Lakes that appear in all four time intervals (“persistent lakes”) dominate both the number and area of bedrock-, ice-, and moraine-dammed lakes (Fig. 5). Supraglacial lakes are the least stable, as this class is dominated by non-persistent lakes. Changes in the number of persistent lakes from interval to interval is due to lakes either splitting or merging. The rate of formation of new bedrock and moraine-dammed lakes appears relatively constant over time, with ∼10–30 new lakes of each dam type first appearing in each time interval.

Figure 5Number of lakes (a) and total area (b) of each dam type through time. The number of lakes in blue indicates the total number of lakes in that time period that were not present in 1984–1988; the number of lakes in red indicates the number of lakes present in that time period which drain in a subsequent time period. Light red indicates lakes which form after 1984–1988 but drain before 2016–2019. Bar widths correspond to imagery time intervals.
Moraine-dammed lakes added 56 lakes (+26 %) and grew by 479 km2 (+87 %) from 1984–1988 to 2016–2019, while bedrock-dammed lakes added 68 lakes (+53 %) and grew by 31.8 km2 (+26 %; Fig. 5). Though they added a similar number of lakes, moraine-dammed lakes increased in total area more rapidly than bedrock-dammed lakes, primarily through the growth of pre-existing lakes.
While bedrock and moraine-dammed lakes steadily increased in lake frequency and area, supraglacial lakes exhibited more variability. This class increased by 72 lakes from 1984–1988 to 2007–2011, yet lost 12 lakes from 2007–2011 to 2016–2019, resulting in an overall increase of 60 lakes (80 % increase). Despite varying frequency, supraglacial lakes grew in total area between each time period, resulting in a total increase of 22.8 km2 (+127 %) from 1984–1988 to 2016–2019. Supraglacial lakes had the largest percent increase in area; however, they contributed the least (2 %–3 %) to total lake area across different dam types.
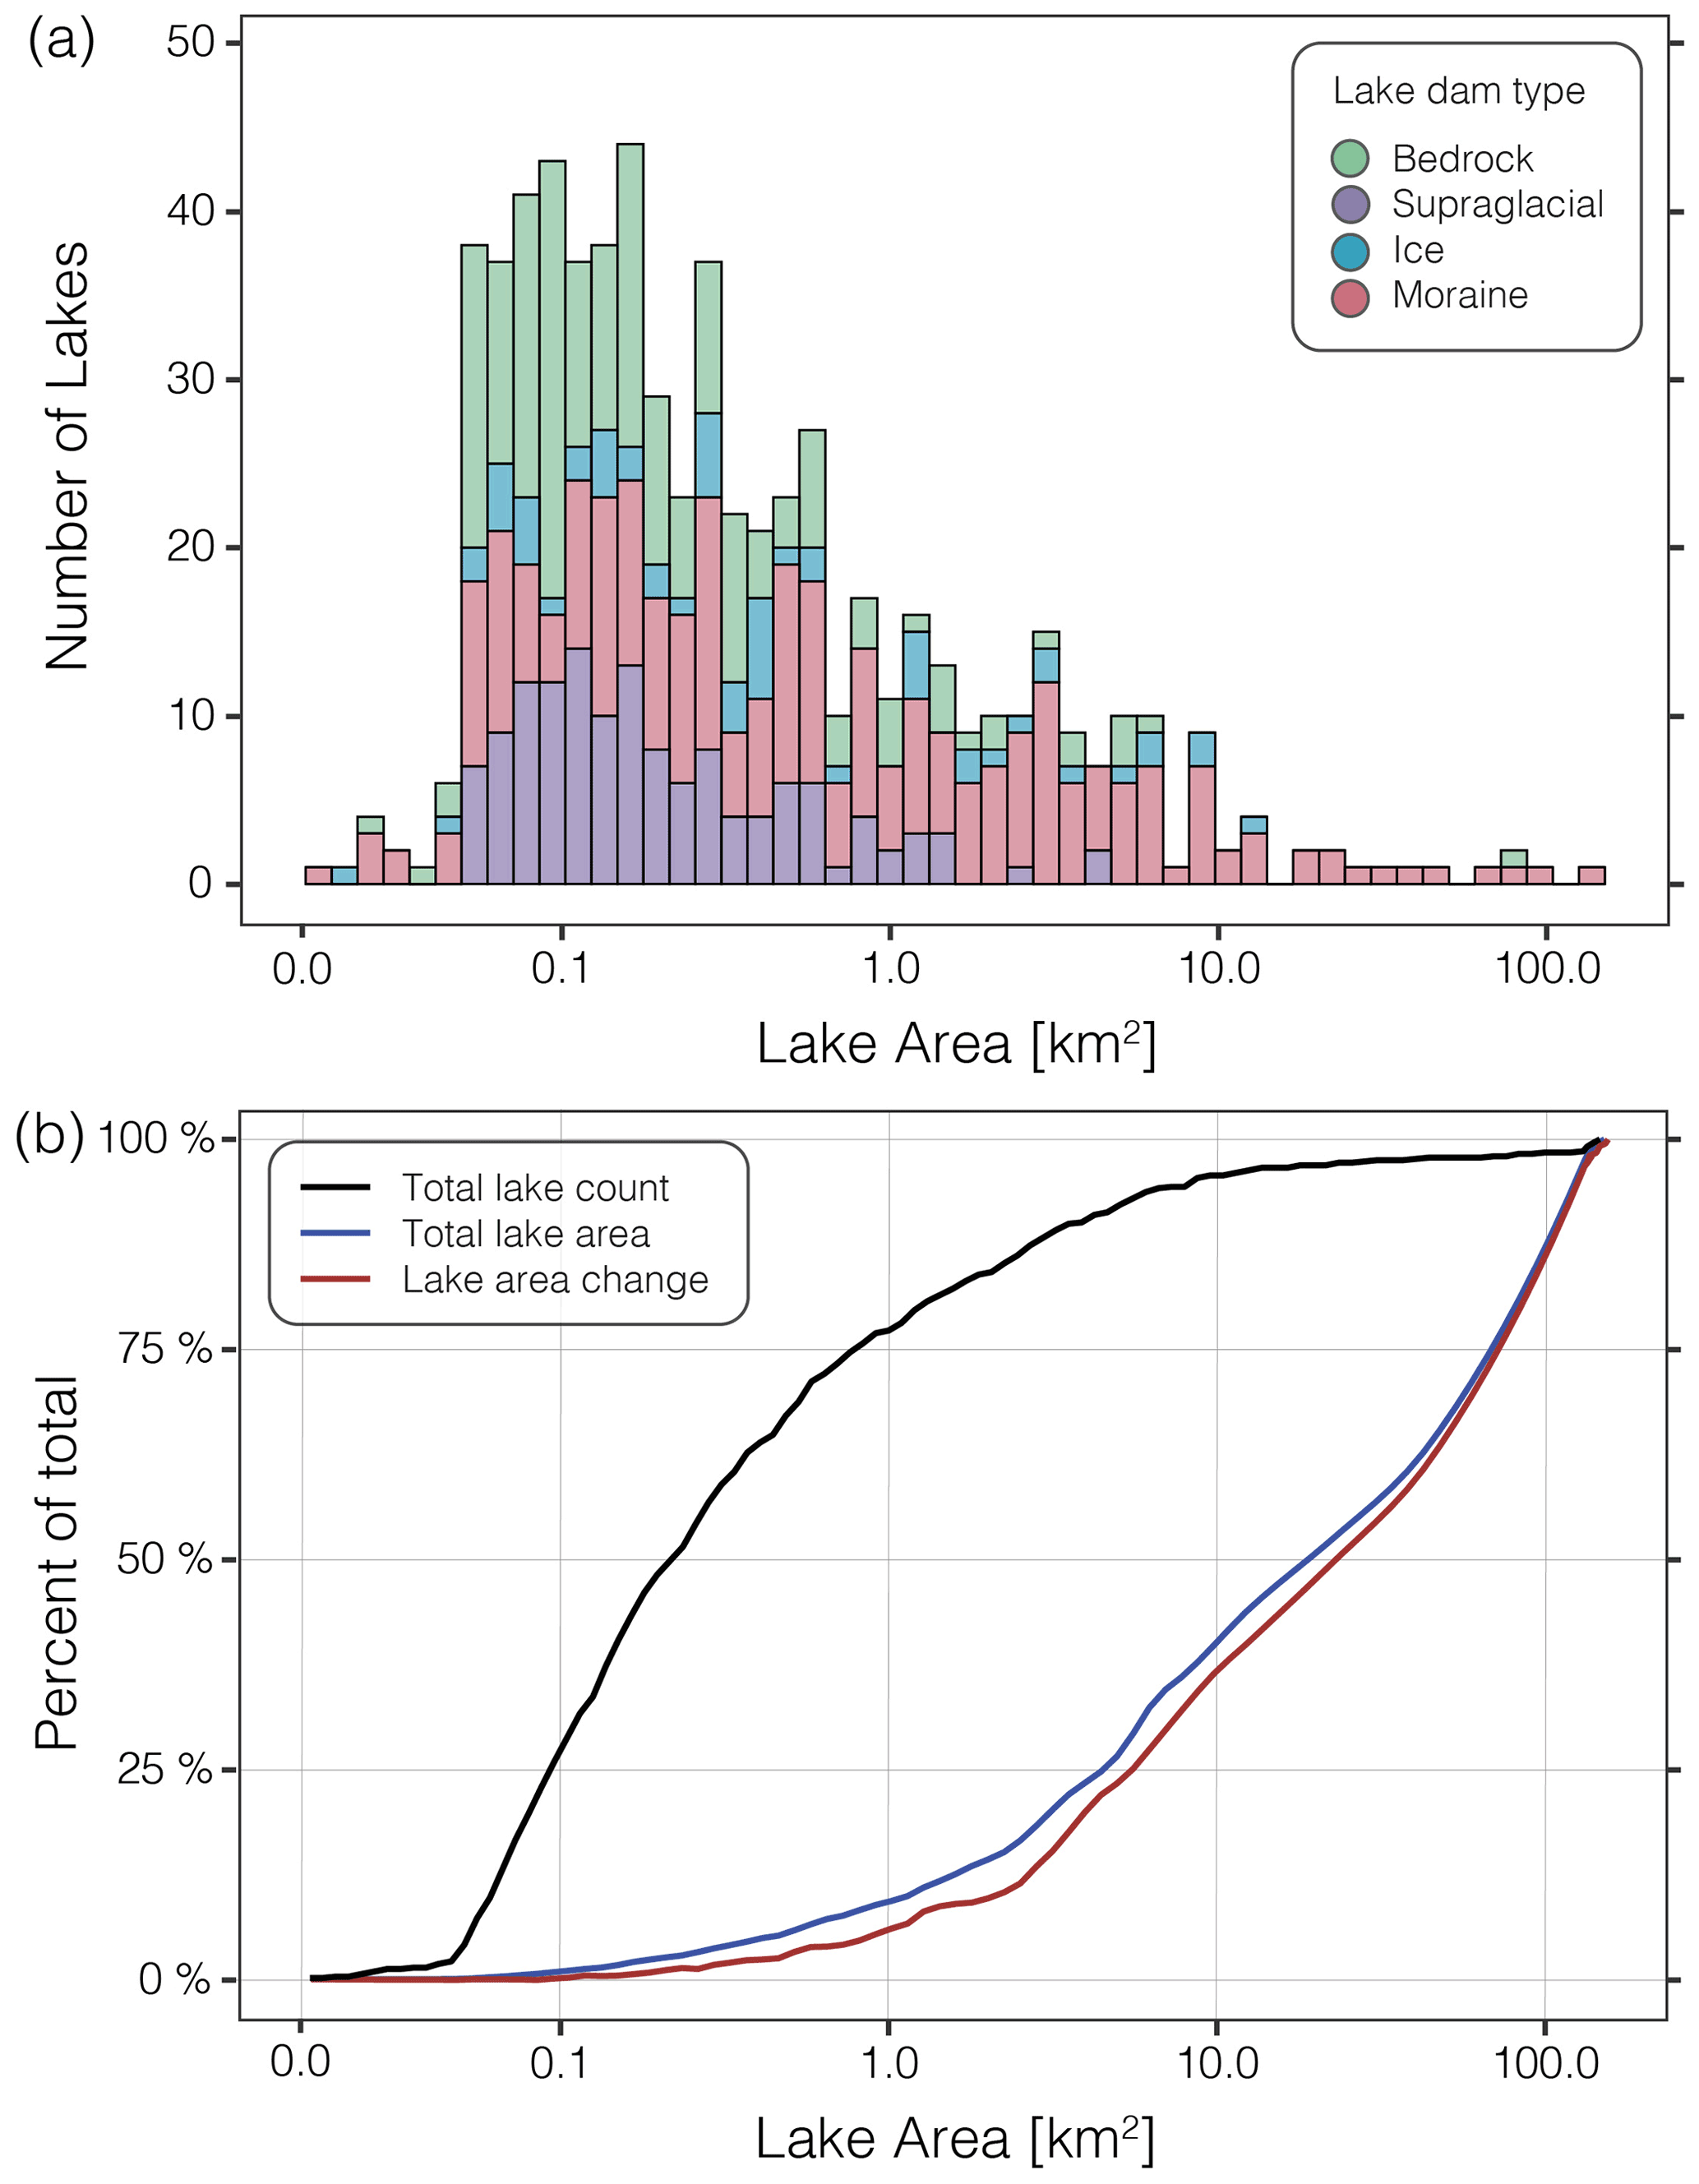
Figure 6Distribution of lake area frequency in 2016–2019 by lake area (colored by dam type; a) and cumulative distribution function of total lake number, total lake area, and total lake area change (1984–1988 to 2016–2019; b). Note that the x axis is logarithmic.
Ice-dammed lakes are the only dam type with decreasing number and area, losing six lakes (−9 %) and 51 km2 (−40 %) overall from 1984–1988 to 2016–2019. However, a total of 20 individual lakes drained and 17 formed throughout this time period, with an additional three lakes merging, resulting in an overall loss of six lakes.
Lake frequency, dam type, and area change distribution vary with lake area (Fig. 6). The majority of lakes (77 %) in the region are less than 1 km2, but collectively they constitute only 9 % of total lake area. Lakes greater than 1 km2 thus constitute >90 % of the total lake area and are dominated (69 %) by moraine dams. The lake area change distribution by lake area from 1984–1988 to 2016–2019 closely reflects the total lake area distribution, with lakes greater than 1 km2 experiencing 94 % of the total lake area change. In particular, there are 19 lakes (17 moraine-dammed, 1 bedrock-dammed, and 1 ice-dammed; see Table S1 in the Supplement), each with individual areas greater than 10 km2, that constitute 60 % of the total lake area and area growth. Of these 19 lakes, 14 occupy piedmont lobe depressions (defined here as a basin which is not constrained by valley walls), and about half are found within a coastal plain environment, with four lakes located within 2 m of sea level. Lake basin geometry and elevation have previously been linked to lake area change in Alaska, with low-elevation lakes growing the most rapidly (Field et al., 2021). Excluding lakes greater than 10 km2, the total lake area in the Alaska region grew by 42 % (compared to the 59 % area increase when considering all lakes).
3.2 Individual lake area evolution
From 1984–1988 to 2016–2019, 791 distinct lakes were identified, 667 of which were still present in 2016–2019. Of the 124 lakes which drained, 97 (78 %) were supraglacial, 20 (16 %) were ice-dammed, and 7 (6 %) were moraine-dammed. Absolute area change was calculated for each individual lake, with drained lakes considered to have an area of 0 km2 after drainage (Fig. 7). Detectable change (error < area change) occurred for 334 of the total 791 lakes (44 %). Within each dam type, 63 % of moraine-dammed, 45 % of ice-dammed, 39 % of supraglacial, and 24 % of bedrock-dammed lakes experienced detectable change.

Figure 7Smoothed density distribution (normalized to 1 for each dam type) of absolute lake area change for all lakes (dark curves) compared to that for only lakes with detectable change (light curves) for each dam type, with number of lakes (n) and median lake area change (M). Note that the x axis has been limited to −2 and 2 km2. For the full distribution, see Fig. S5.
The median area change for lakes of all dam types with detectable change (n=344) is 0.05 km2 between 1984–1988 and 2016–2019 (Fig. 7). Considering only lakes with detectable change, the median change for moraine-dammed lakes (n=166) is 0.13 km2, −0.06 km2 for ice-dammed lakes (n=42), 0.03 km2 for supraglacial lakes (n=93), and 0.02 km2 for bedrock-dammed lakes (n=46). Median change values remain relatively stable even when lakes > 10 km2 are excluded from analysis (Fig. S6).
Proglacial lakes (moraine- and bedrock-dammed) experienced the largest median detectable change (0.14 km2), while ice-dammed lakes are the only dam type to experience negative median detectable change (−0.06 km2; Table 2; Fig. S7). Unconnected and detached lakes have a median change of 0.02 km2 for lakes with a detectable change. Proglacial moraine-dammed lakes have a wider distribution and higher median change than detached or unconnected moraine-dammed lakes (Table 2). Proglacial moraine-dammed lakes also have a wider distribution and higher median change than proglacial bedrock-dammed lakes.
Rate of area change (square kilometers per decade) follows a similar distribution to absolute area change (Fig. S8). The median change rate for lakes of all dam types with detectable change (n=344) is 0.02 km2 per decade. When considering all lakes within each dam type, moraine-dammed lakes are the only dam type with a change rate greater than zero (0.05 km2 per decade). Supraglacial and bedrock-dammed lakes experience very small changes on a decadal scale, with a median change rate of 0 for all lakes as well as the subset of detectable lakes. Ice-dammed lakes with detectable change experienced a median change rate of −0.02 km2 per decade.
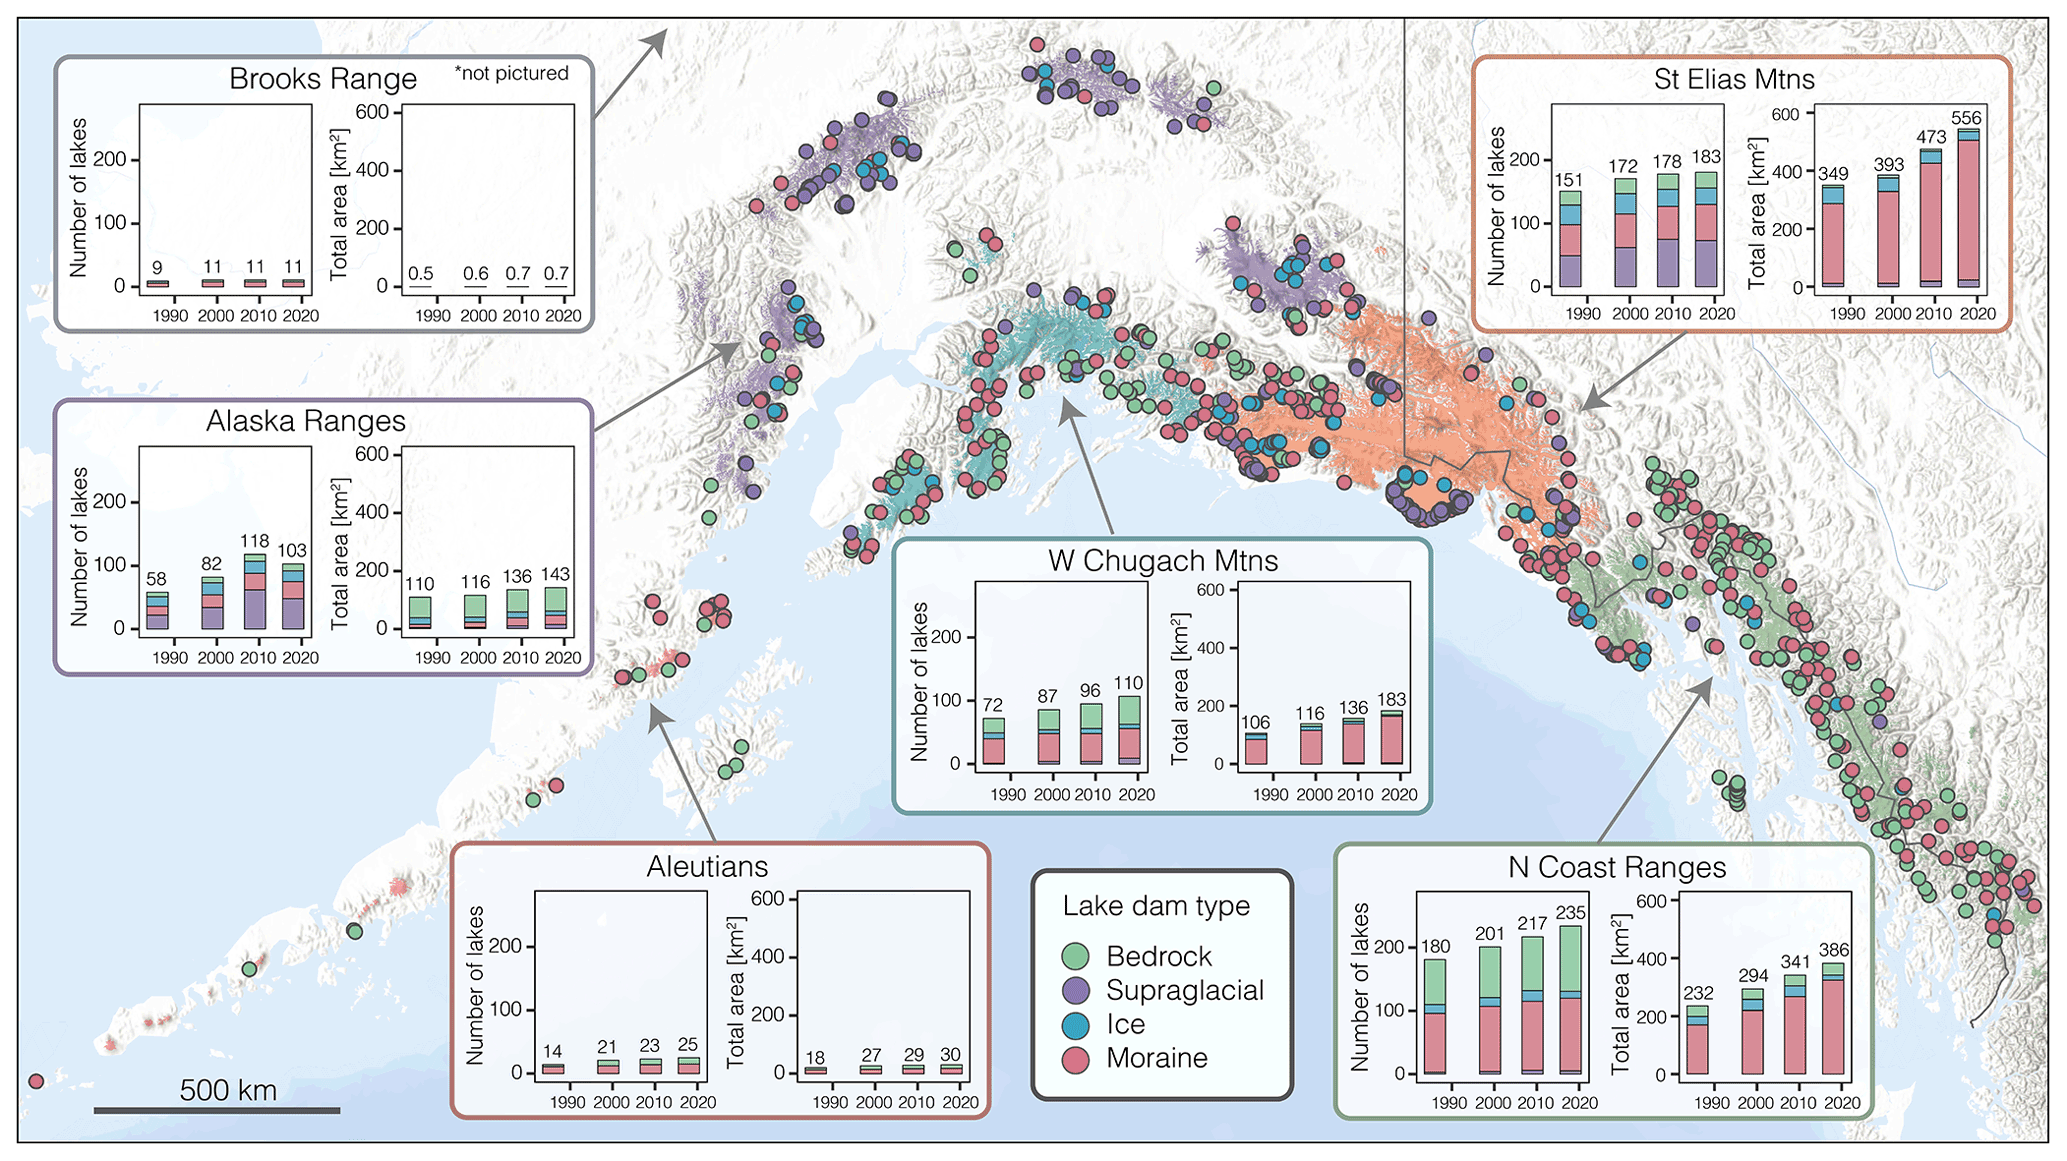
Table 3Number of lakes, glacierized area, debris-covered area, percent debris cover, normalized lake frequency, normalized lake area, normalized lake area change, and specific glacier mass balance (from Jakob et al., 2021) per subregion.
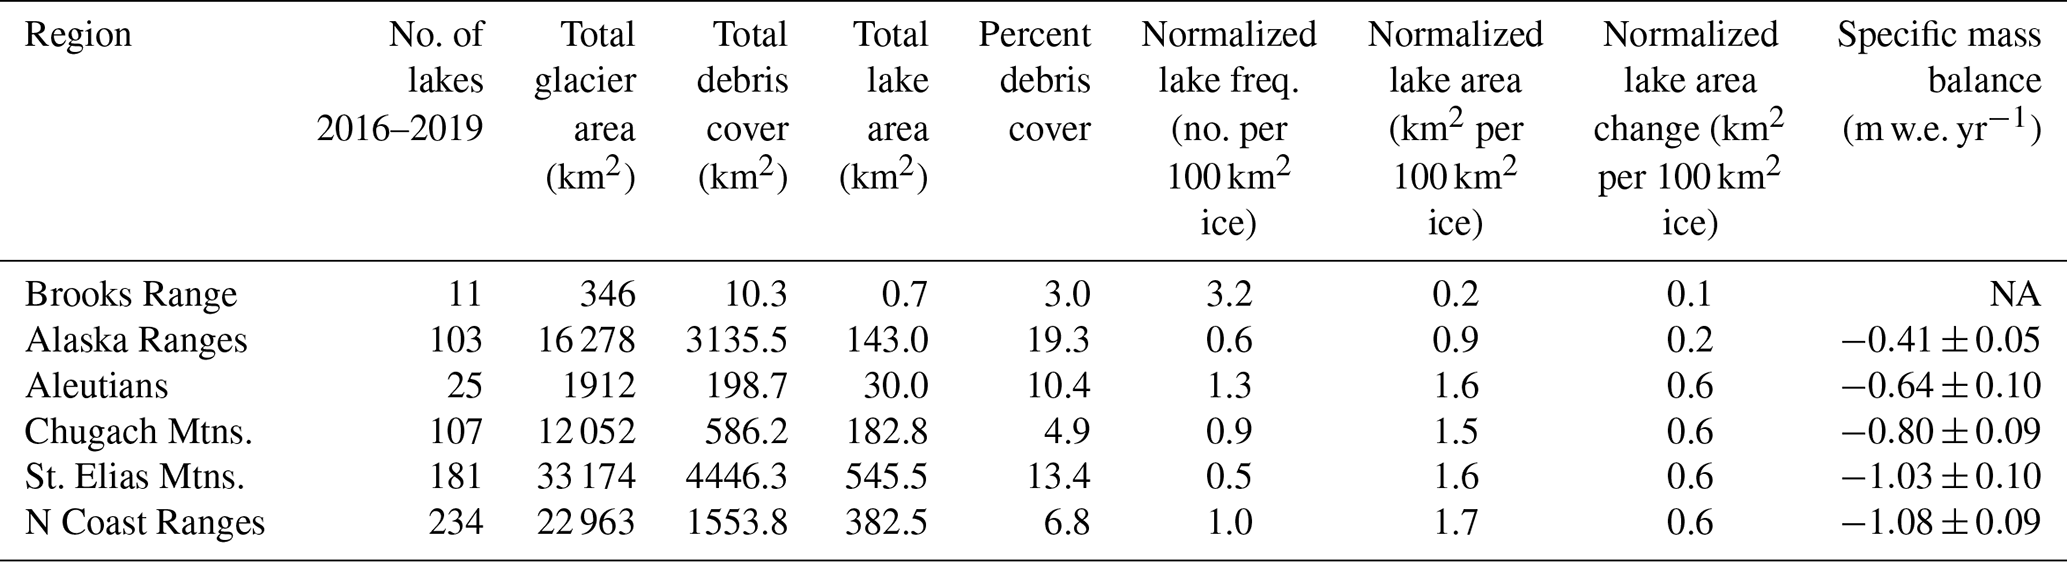
NA stands for not available.
3.3 Regional lake distribution
Distribution of lake dam type and total lake area varies spatially by subregion (Table 3; Fig. 8), though median lake area change does not vary substantially when considering all lakes with detectable change per region (ranges from 0.04–0.06 km2). Ice-dammed lakes occur most frequently in the St. Elias Mountains (n=26 in 2016–2019) and least frequently in the western Chugach Mountains (n=6 in 2016–2019), Brooks Range (n=0), and the Aleutians (n=0). The N Coast Ranges are dominated by moraine- and bedrock-dammed lakes, whereas the Alaska Ranges and St. Elias Mountains are dominated in number by supraglacial lakes. Supraglacial lakes occur in the regions with the highest debris cover (19 % of glacier area in the Alaska Ranges and 13 % in the St. Elias Mountains; Herreid and Pellicciotti, 2020). However, supraglacial lakes contribute little to the total lake area. The number of lakes within a region does not directly predict lake area; the N Coast Ranges host the highest number of lakes (n=234, 382.5 km2), yet the St. Elias Mountains have the greatest total lake area (n=181, 545.5 km2).
Persistent lakes dominate the total area for each subregion, likely because new lakes tend to be small. The N Coast Ranges have the most persistent lakes (n=175 in 2016–2019), with 57 lakes forming, yet contributing little to the total area (Fig. S9). Changes in persistent lake numbers between time steps is due to lakes splitting or coalescing through time. The Alaska Ranges and St. Elias Mountains have the largest number of lakes that ultimately drain, likely due to the high frequency of supraglacial lakes in these regions and their spatial and temporal heterogeneity.
Our inventory of ice-marginal lakes in Alaska from 1984 to 2019 demonstrates that lake area changes vary based on lake dam type and a lake's topological position. By tracking individual lakes through time and categorizing lakes by dam type, region, and spatial relationship to their source glacier, we are able to identify trends that would otherwise be overlooked if lakes within Alaska were considered as a whole.
Overall, ice-marginal lakes in Alaska have grown in both number and area between 1984 and 2019, following the trend in both regional (Wang et al., 2013; Carrivick and Quincey, 2014; Nie et al., 2017; Song et al., 2017; Emmer et al., 2020) and global (Shugar et al., 2020) studies. However, ice-dammed lakes have decreased in number and area, whereas moraine-dammed lakes have increased at a faster rate than the average when considering all dam types together. By examining individual lakes, we identify that the majority (56 %) of lakes have not experienced a detectable area change over the period of study and that 19 large (>10 km2), primarily moraine-dammed lakes contributed to 60 % of total area growth. Analyzing all dam types together would fail to identify decreases in number and area of ice-dammed lakes, underestimate the increases in proglacial moraine-dammed lakes, and likely overestimate the importance of the appearance of small supraglacial lakes.
4.1 Alaska's ice-marginal lakes
Lake position and dam type, which are often linked, provide a simple, physically based metric for parsing ice-marginal lakes in Alaska. The majority of moraine-dammed lakes are proglacial, located behind a Little Ice Age (LIA; ∼1250–1850 AD) moraine at the front of a retreating glacier (e.g., Wiles et al., 1999; Santos and Córdova, 2009; Solomina et al., 2015, 2016). They tend to be associated with clean-ice glaciers (82 %), defined by Brun et al. (2019) as <19 % debris cover (Fig. 9). The growth rate of moraine-dammed lakes appears to be coupled to the amount of debris cover, as the lakes with the largest area increase are associated with clean-ice glaciers, with the exception of Vitus Lake at Bering Glacier (Fig. 9). Moraine-dammed lakes occur with both large and small glaciers, as most temperate glaciers can form a moraine during a period of advancement (e.g., the LIA), as long as sediment supply to the terminus is high. Basin geometry and glacier hypsometry likely play a large role in determining the lake expansion rate and maximum lake area, as the underlying bed slope influences how quickly the glacier retreats (depending on glacier mass balance; see Sect. 4.5). For example, large coastal proglacial lakes can fill piedmont lobe basins (such as Vitus Lake, Malaspina Lake, and Grand Plateau Glacier Lake), which accommodate larger lake expansion than proglacial lakes confined to smaller, steeper valleys (Field et al., 2021). Basin geometry also determines the maximum lake level and the point at which the glacier detaches from the lake.

Figure 9Percent glacier debris cover vs. lake area change (km2) for lakes associated with glaciers > 2 km2. Each dot represents an individual lake. The dashed line is at 19 %, above which is considered debris-covered ice and below is considered clean ice (Brun et al., 2019).
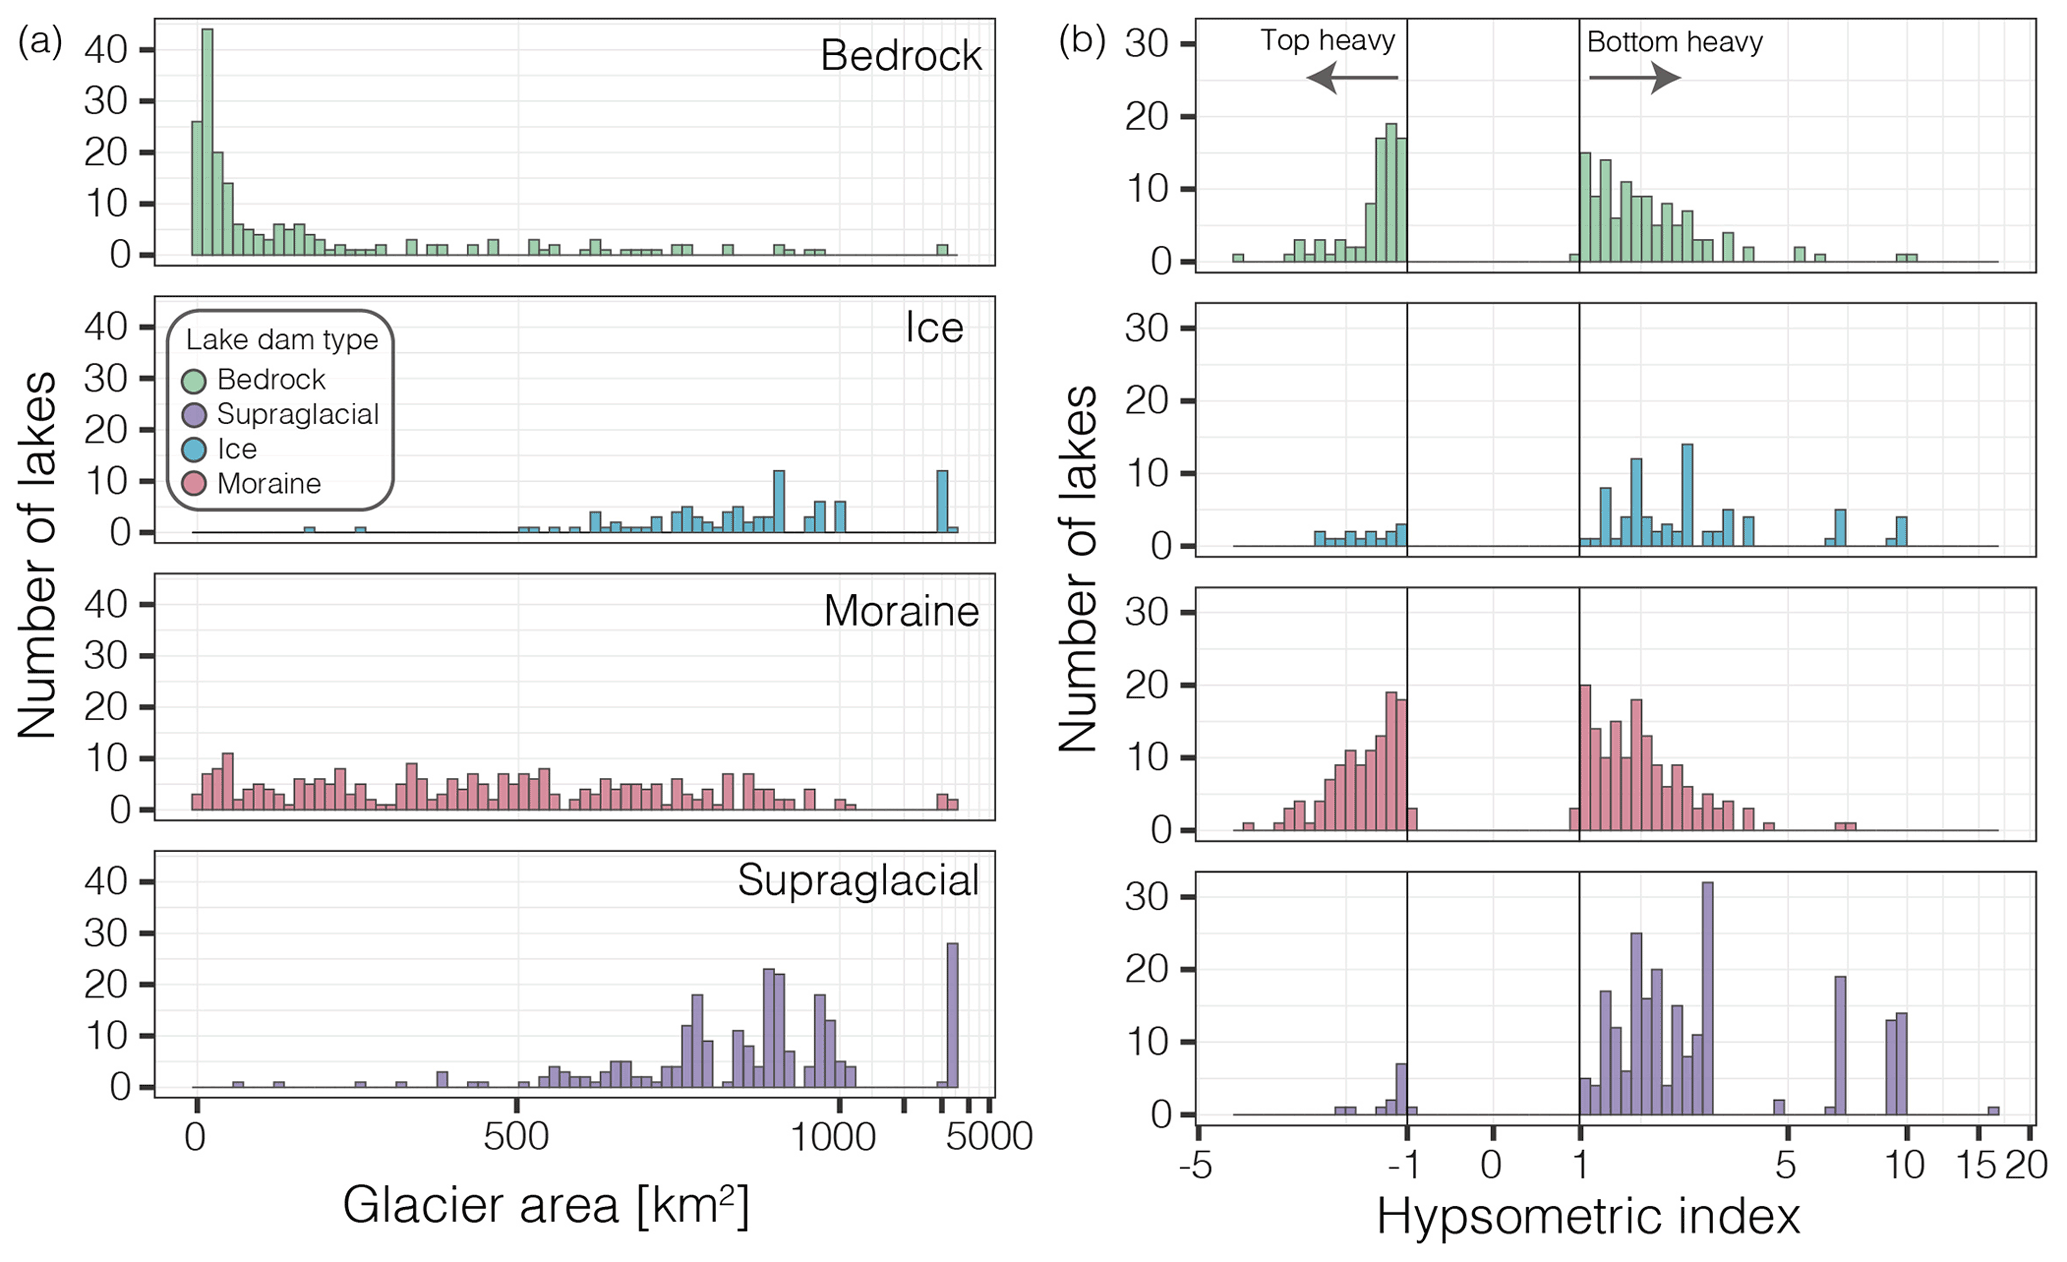
Figure 10Histogram of number of lakes and associated glacier area, separated by dam type (a), and histogram showing number of lakes within each hypsometric index (HI) bin, separated by dam type (b). Hypsometric index was calculated by McGrath et al. (2017). HI values greater than 1 indicate a bottom-heavy glacier, and HI values less than −1 indicate a top-heavy glacier. Note the logarithmic x-axis scales.
Ice-dammed lakes are primarily located next to clean-ice glaciers (65 %), with larger, lower slope areas and positive hypsometric indices (bottom-heavy; Fig. 10), such as are found adjacent to Brady Glacier (Capps et al., 2011; Pelto et al., 2013). The largest lakes occur in tributary valleys, dammed by main branch ice, while many small lakes are found in pockets between glacier margins and valley walls. The decrease in ice-dammed lake number and area is likely due to the down-wasting of glacier surfaces (e.g., Larsen et al., 2015; Jakob et al., 2021), decreasing the height of the ice dam and therefore decreasing maximum area (and volume) of the lake (e.g., Kienholz et al., 2020). The formation of new conduits alongside or beneath the glacier could also be influencing ice-dammed lake drainage (e.g., Tulsequah Glacier; Neal, 2007; Post and Mayo, 1971). Previous work documented ice thinning as the primary factor in the loss of an ice dam for 82 % of lakes lost from land-terminating glaciers and 62 % of loss from lake-terminating glaciers between 1971 and 2008 (Wolfe et al., 2014).
An overwhelming majority (>80 %) of bedrock-dammed lakes are associated with clean-ice glaciers less than 10 km2 in area (Figs. 9 and 10). These types of lakes generally form within cirques, where a small glacier has retreated and exposed an overdeepening. Bedrock-dammed lakes can indicate an advanced stage of lake development (Emmer et al., 2020), such as is found in parts of the N Coast Ranges. Most bedrock-dammed lakes (>90 %) are either detached or unconnected, with minimal influence from ice–water contact. The small changes in area of unconnected bedrock-dammed lakes could be due to changes in the regional water balance rather than glacier dynamics.
Supraglacial lakes generally form on low-sloped debris-covered tongues of glaciers (Reynolds, 2000), where thin debris enhances melt and thick debris insulates ice and reduces surface melt (Östrem, 1959), often leading to heterogeneous surficial topography. Debris cover tends to reduce ice discharge and surface melt, leading to longer glaciers (Anderson and Anderson, 2016). The inventoried supraglacial lakes in Alaska follow these trends, with their distribution strongly skewed towards flat, bottom-heavy glaciers, as is characteristic of debris-covered glaciers (Reynolds, 2000). These lakes can occur on glaciers with any amount of debris cover, though they have the highest concentration (64 %) out of any lake dam type on glaciers with >19 % debris cover (Fig. 9). A majority of supraglacial lakes are located on a few large, heavily debris-covered glaciers. For example, 95 % of supraglacial lakes in the St. Elias Mountain region are located on two large piedmont glaciers (Malaspina and Bering glaciers). Although these lakes are abundant, they exhibit high spatiotemporal variability and contribute minimally to total lake area (2 %–3 %; Fig. 5).
Although additional factors are required to comprehensively assess GLOF hazards, a lake inventory that captures area and dam type provides a foundation for this type of assessment, as dam type influences stability, lake volume scales with area (e.g., Huggel et al., 2002; Cook and Quincey, 2015), and peak flood discharge scales with volume (e.g., Walder and Costa, 1996; Veh et al., 2020). Ice-dammed lakes are known to undergo multiple fill–drain cycles with the capability of producing multiple GLOFs (e.g., Anderson et al., 2003; Jacquet et al., 2017), whereas moraine-dammed lakes tend to only GLOF once, as their dam is typically compromised in the process. The observed decrease in number and area of ice-dammed lakes in Alaska suggests an overall decrease in GLOF hazards from these types of lakes, although the specifics of remaining lakes need to be evaluated individually (e.g., Suicide Basin, Kienholz et al., 2020; Tulsequah Glacier, Neal, 2007; Bear Glacier, Wilcox et al., 2014). The increase in number and area of moraine-dammed lakes provides a greater number of potential source lakes and a larger potential flood volume; however, factors such as surrounding slope stability (e.g., landslides, rockfalls, permafrost), moraine geometry and stability (e.g., slope, presence of an ice core), and downstream impacts must be evaluated first to determine GLOF potential and hazard (e.g., Worni et al., 2013; Rounce et al., 2017). As the nature of the dam type influences lake stability, the opposing trends of ice-dammed and moraine-dammed lakes complicate a region-wide assessment of changing GLOF hazards in the Alaska region.
4.2 Regional trends
The Alaska region of the RGI is separated into six second-order regions (see Fig. 8), used here as subregions for analysis. Lakes are most numerous in the N Coast Ranges (35 % of all lakes) and St. Elias Mountains (27 %), though these ranges also have the largest glacier area (24 % and 41 % of total ice in Alaska, respectively). Normalized lake frequency (number of lakes per 100 km2 of glaciers) is highest in the Brooks Range, though it has the lowest normalized lake area (lake area per 100 km2 of glaciers; 0.2) as total lake area sums to just 0.7 km2 (Table 3). We interpret these normalized lake statistics as reflecting the late stage of ice-marginal lake development, minimal LIA glacier advance, and the relatively small glacier extent in the Brooks Range even during the Last Glacial Maximum (Kaufman and Manley, 2004). Normalized lake area is highest in the N Coast Ranges (1.7 km2 per 100 km2 of glaciers) due to the abundance of smaller glaciers and many proglacial lakes. The St. Elias Mountains have the largest total lake area; however, it also contains large ice fields, which results in a similar normalized lake area as the Aleutians and the Chugach Mountains (1.5–1.6 km2 per 100 km2 of glaciers). This suggests that the area of ice-marginal lakes scales with glacier area in the coastal ranges (i.e., excluding the Brooks Range and Alaska Ranges), with normalized lake area ranging from 1.5 to 1.7.
Accounting for lake area change, the Brooks Range and Alaska Ranges have a small normalized lake area change (0.1–0.2; lake area change between 1984 and 2019 per 100 km2 of glaciers). The Chugach, Aleutians, St. Elias, and N Coast Ranges, however, each have a higher normalized lake area change (0.6). These numbers suggest a dichotomy in which coastal glacier–lake systems are changing faster than those in more interior settings, in agreement with recent work investigating physical controls on ice-marginal lake area change (Field et al., 2021). The Alaska Ranges have the highest percent debris cover (19 %), which could be a factor in the low normalized lake area and normalized lake area change seen in this region. Supraglacial lakes are the most abundant dam type in the Alaska Ranges (47 % in 2016–2019), characterized by small areas and area changes (Table 2).
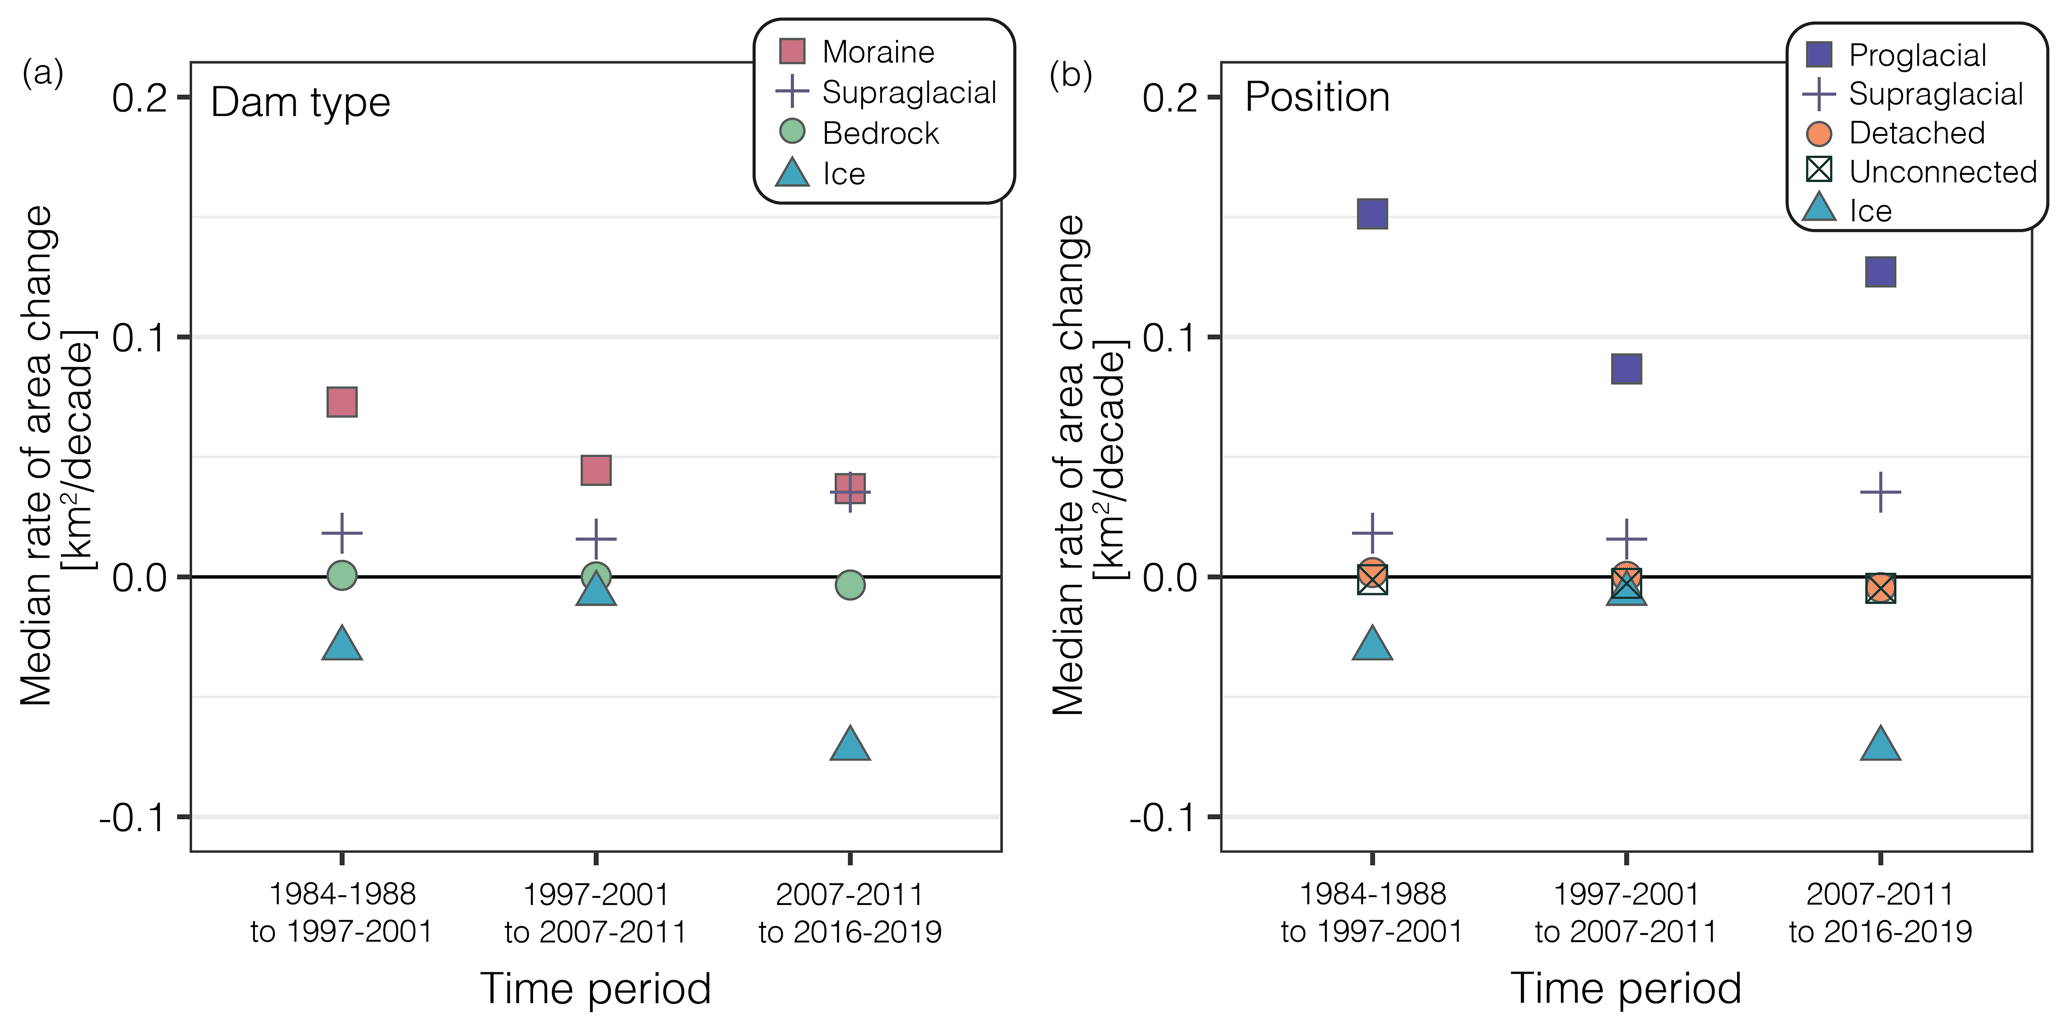
Figure 11Median rate of area change between each time step, categorized by dam type (a) and topological position (b).
4.3 Temporal trends
Rate of lake area change (square kilometers per decade) through time indicates whether ice-marginal lake evolution has remained constant between different time periods, or whether the lakes have experienced periods of accelerated or decelerated change. Bedrock-dammed lakes experienced little variation in rate of area change throughout the period of study (Fig. 11), with a rate that hovers around zero, likely due to the fact that a majority (>90 %) of bedrock-dammed lakes are either detached from their associated glacier or unconnected to any glacier. Ice-dammed lakes consistently experienced a negative median rate of area change, with the most negative rate of growth between 2007–2011 and 2016–2019. This implies drainage of ice-dammed lakes may be accelerating, which could be due to an increased rate of glacier thinning since 2013–2014 (Jakob et al., 2021), though this link requires further investigation. Supraglacial lakes exhibit the opposite trend, growing at a faster rate after 2007–2011 than they did prior. Moraine-dammed lakes experienced the largest median rate of change between 1984–1988 and 1997–2001. A decreasing median rate of change for moraine-dammed lakes yet large total area growth is likely due to the growth of a few large outlier lakes whose influence is minimized by comparing median rather than mean rates of change. Proglacial lakes experienced the overall largest rate of growth, even when compared to all moraine-dammed lakes, suggesting that topological position, rather than strictly dam type, is a better indicator for rate of ice-marginal lake area change. Together, these data suggest the ice-marginal lakes of Alaska and northwestern Canada could be undergoing a transition, with an increased role of supraglacial lakes driving regional lake area expansion.
4.4 Comparison to other regions
Alaska’s glaciers cover a large spatial extent, spanning different climatic, geologic, and glacial environments (Sect. 1). This makes the region particularly unique in relation to other glacierized regions, though the best analogue region depends on which Alaskan mountain range is considered. The heavily debris-covered areas (e.g., Alaska Ranges) have similar debris cover to the Himalaya, areas with clean-ice valley glaciers (e.g., N Coast Ranges) could behave similar to the Peruvian Andes, and the large and complex glaciers/ice fields (e.g., St. Elias Mountains) have similar glacier and lake dynamics as the Patagonian ice fields. Dynamics within these Alaska subregions could shed light on ice-marginal lake behavior in comparable mountain ranges, and vice versa.
Many studies on ice-marginal lakes concentrate on high-mountain Asia (e.g., Nie et al., 2017; Zhang et al., 2018; Veh et al., 2020; Wang et al., 2020; Chen et al., 2021), a region with abundant proglacial and supraglacial lakes, though high-mountain Asian lakes tend to be smaller than Alaskan lakes (median lake area of 0.11 and 0.17 km2, respectively; Shugar et al., 2020). The Alaska and the Himalaya regions (RGI regions 14 and 15) have a similar percent debris cover (∼15 %), though Alaska contains larger glacier and debris-covered areas (Herreid and Pellicciotti, 2020). Herreid and Pellicciotti (2020) calculated a debris stage for each RGI region from 0 to 1, where 1 indicates the ablation zone is entirely covered in debris. Debris stage is slightly higher in the Himalaya (∼0.6–0.7) than Alaska (∼0.5), though Alaska has a higher debris expansion potential (Herreid and Pellicciotti, 2020). This suggests that if debris cover expands in Alaska, these areas could become more similar to the heavily debris-covered areas in the Himalaya. Supraglacial lakes in the Himalaya vary considerably in location, shape, and size, appearing, disappearing, and coalescing through time (Benn et al., 2001; Gardelle et al., 2011; Nie et al., 2017), behavior exhibited in Alaska as well. These similarities indicate that supraglacial lakes within these two regions have similar characteristics and that understanding one region could aid in understanding the other.
Glacierized mountain ranges around the world exhibit varying stages of glacial retreat. The Peruvian Andes are considered to be in a late stage of glacier retreat with little potential for further lake expansion, as ice generally remains in steep, high-elevation parts of the study area (Emmer et al., 2020). In Peru, glaciers have retreated far off their LIA moraines, such that the majority of proglacial lakes shifted from moraine-dammed in 1948 to bedrock-dammed in 2017 as glaciers retreated and exposed bedrock overdeepened (Colonia et al., 2017; Emmer et al., 2020). Though ice remains in many main valleys in the N Coast Ranges, glaciers are smaller, steeper, cleaner, and less complex than other subregions in Alaska, apart from the Juneau Icefield. Though lakes in the N Coast Ranges are on average larger than those found in the low-latitude Andes (median lake area of 0.21 and 0.12 km2, respectively; Shugar et al., 2020), the abundance of moraine-dammed proglacial lakes and increasing proportion of bedrock-dammed lakes (39 % in 1984–1988 to 44 % in 2016–2019) suggest the N Coast Ranges could follow a similar trajectory as the Cordillera Blanca, producing a shift in dominant dam type from moraine to bedrock in the future.
Ice-marginal lake increases have been documented throughout the world, though characteristics such as dam type, lake location, and associated glacier behavior vary widely. Examining ice-marginal lake behavior at different stages in various mountain ranges can help predict how these lakes might evolve in the future, though such analysis is outside the scope of this study.
4.5 Feedbacks on glacier mass balance
Lake geometry likely dictates the impact a proglacial lake has on glacier mass balance. Large, deep lakes can impede a glacier from reaching equilibrium by holding the terminus at lake elevation until it has retreated out of the lake basin (Larsen et al., 2015). Ice–water contact can also enhance calving, resulting in mass loss and lake expansion through terminus retreat (Carrivick and Tweed, 2013). Larsen et al. (2015) found that lake-terminating glaciers in Alaska have a more negative median mass balance in coastal regions where large proglacial lakes have developed. Lake-terminating glaciers also experienced more rapid thinning near their terminus than land-terminating glaciers and appear to be less directly coupled to climate variations (Larsen et al., 2015). In the Himalaya, lake-terminating glaciers have been linked with increased glacier mass loss through enhanced terminal retreat and surface lowering (King et al., 2019; Maurer et al., 2019) and center flow line velocities that are more than twice that of glaciers which terminate on land (Pronk et al., 2021). We therefore expect that as glaciers continue to retreat in Alaska, proglacial lake presence, formation, or detachment will influence glacier mass balance, increasing thinning and glacier velocity where lakes are present, though variations in thinning have been observed (e.g., the Juneau and Stikine ice fields; Melkonian et al., 2014, 2016).
Regional glacier thinning and mass loss rates appear to mimic lake area change in parts of Alaska. The N Coast Ranges and St. Elias Mountains are thinning ( and m yr−1, respectively) and losing mass ( and m w.e. yr−1) at a greater rate than other subregions from 2011–2019 (Jakob et al., 2021). These regions also experienced the largest normalized lake area growth (see Sect. 4.2). The high thinning rate in the Aleutians ( m yr−1) does not appear to be reflected in the low normalized lake area growth documented in our survey. This is likely due to the fact that 60 % of lakes in the Aleutians subregion are either detached or unconnected and therefore not directly influenced by glacier dynamics. The Alaska Ranges are thinning ( m yr−1) and losing mass ( m w.e. yr−1) at the lowest average rates per region (Jakob et al., 2021) likely due to extensive debris cover, which is accompanied by the lowest normalized lake area change outside the Brooks Range.
4.6 Future change in ice-marginal lakes
As global temperatures continue to rise and glaciers thin and retreat (Zemp et al., 2019), Alaska’s glaciated landscape will change, as will the nature of ice-marginal lakes. Alaskan glaciers have retreated off their LIA moraines, and therefore it is unlikely that new moraine-dammed lakes will form without a sustained period of glacial advance or surge. However, proglacial lake expansion is expected to continue as glacier retreat accommodates lake growth, dependent on basin geometry. Using the Cordillera Blanca as an analogue for later stages of lake development (Emmer et al., 2020), we hypothesize a future shift in new proglacial lakes to mostly bedrock dammed lakes, as glaciers retreat into higher, steeper terrain (e.g., Linsbauer et al., 2016; Furian et al., 2021), though it is uncertain how long the present stage of moraine-dammed lake growth will persist before glaciers leave their terminal overdeepenings. Alaska’s glacier complexity and relative abundance of ice-dammed lakes pose an interesting question as to whether these lakes will continue to drain as they have since 1970 (Wolfe et al., 2014) or whether new ice-dammed lakes will form if tributary valley ice retreats faster than main branch ice, such as has occurred in Suicide Basin since 2011 (Kienholz et al., 2020). Modeling basin geometry and future ice extent would provide insight into where ice-marginal lakes in Alaska are likely to form in the future.
4.7 Inventory challenges
Two primary challenges were encountered while creating the inventory, which should be understood before using this dataset or applying its findings. Due to the use of spectrally based supervised classification for lake identification, only lakes that have the spectral characteristics of water appear within our inventory. This limitation results in the exclusion of some ice-dammed lakes which are iceberg-filled or lake basins which appear dry in the 5-year mosaics due to a lake that is more often drained than filled. Therefore, this inventory is a clear minimum of ice-marginal lakes, with several known omitted lakes. Known lakes which were not identified in our inventory include Suicide Basin, Valdez Lake, Snow Lake, Lake Linda, and Summit Lake, all of which are ice-dammed. These lakes, which have experienced multiple drainage events (e.g., Jones and Wolken, 2019; Kienholz et al., 2020), are important for individual GLOF hazard assessments, though they have little impact (0.4 % of total lake area) on our assessment of regional decadal-scale lake area trends by dam type.
Dam type classification was performed using manual visual interpretation for all lakes, with the most likely dam type identified in cases that are uncertain due to poor image resolution and/or possible mixed dam types (i.e., bedrock with moraine material; Emmer, 2017). A shift in dam type (e.g., ice-dammed to bedrock-dammed) was also documented for a few lakes, particularly where a lake becomes bedrock dammed after the loss of an ice dam (e.g., Terentiev Lake which was formerly dammed by Columbia Glacier). These lakes were classified by their most recent dam type when performing analysis on change over time. The small number of cases of transitioning dam types suggests this process is not particularly important for understanding the regional-scale behavior of Alaska ice-marginal lakes discussed here.
As the second largest glacierized region outside the ice sheets, characterizing Alaska’s ice-marginal lakes and their evolution has important implications for glacier mass balance, ecosystem dynamics, and GLOF hazards. Varying topographic settings (valleys, cirques, debris, ice fields) and a wide range of glacier complexities allow for an abundance of ice-marginal lakes of varying dam type and position. Overall, ice-marginal lakes in Alaska have grown in both number (+183 lakes, 38 % increase) and area (+483 km2, 59 % increase) between 1984–1988 and 2016–2019, though 56 % of inventoried lakes did not experience detectable change. We demonstrate that lakes with different dam types and positions relative to their source glacier behave differently. Moraine-dammed proglacial lakes experienced the largest growth likely due to clean-ice glacier retreat, while ice-dammed lakes experienced an overall loss in both number and area, likely due to thinning or disappearance of ice dams. Our study highlights the value of parsing ice-marginal lakes by dam type and location in comprehensive ice-marginal lake studies to clarify important lake dynamics that are obscured by coarser regional averages. A clear understanding of which lakes are growing, and which are shrinking, as quantified here in a classified multitemporal ice-marginal lake inventory is a crucial first step to understanding the drivers of historic change, predicting future lake evolution, and assessing GLOF hazard potential in icy mountainous regions.
The lake inventory is available for download at Rick and McGrath (2021) (https://doi.org/10.18739/A2MK6591G). Additional code and data are available on request.
The supplement related to this article is available online at: https://doi.org/10.5194/tc-16-297-2022-supplement.
DM and BR designed the study. BR performed the inventory, analyzed the data, and prepared the manuscript. DM, WA, and SWM contributed to data interpretation and provided manuscript comments and revisions.
The contact author has declared that neither they nor their co-authors have any competing interests.
Publisher's note: Copernicus Publications remains neutral with regard to jurisdictional claims in published maps and institutional affiliations.
DEMs were provided by the Polar Geospatial Center under NSF-OPP awards 1043681, 1559691, and 1542736. We appreciate the productive discussions and method considerations from Anton Hengst. We also thank Freddy Tremblay for digitizing the Post and Mayo (1971) ice-dammed lake outlines. Thank you to Adam Emmer and Mauri Pelto for constructive and insightful reviews that helped improve the paper.
This research has been supported by the National Science Foundation Graduate Research Fellowship (grant no. 006784-00002).
This paper was edited by Homa Kheyrollah Pour and reviewed by Adam Emmer and Mauri Pelto.
Anderson, L. S. and Anderson, R. S.: Modeling debris-covered glaciers: Response to steady debris deposition, The Cryosphere, 10, 1105–1124, https://doi.org/10.5194/tc-10-1105-2016, 2016. a
Anderson, S. P., Walder, J. S., Anderson, R. S., Kraal, E. R., Cunico, M., Fountain, A. G., and Trabant, D. C.: Integrated hydrologic and hydrochemical observations of Hidden Creek Lake jokulhlaup, Kennicott Glacier, Alaska, J. Geophys. Res., 108, 1–19, https://doi.org/10.1029/2002JF000004, 2003. a, b, c
Benn, D. I., Wiseman, S., and Hands, K. A.: Growth and drainage of supraglacial lakes on debrismantled Ngozumpa Glacier, Khumbu Himal, Nepal, J. Glaciol., 47, 626–638, https://doi.org/10.3189/172756501781831729, 2001. a
Brun, F., Wagnon, P., Berthier, E., Jomelli, V., Maharjan, S. B., Shrestha, F., and Kraaijenbrink, P. D.: Heterogeneous Influence of Glacier Morphology on the Mass Balance Variability in High Mountain Asia, J. Geophys. Res.-Earth, 124, 1331–1345, https://doi.org/10.1029/2018JF004838, 2019. a, b
Buckel, J., Otto, J. C., Prasicek, G., and Keuschnig, M.: Glacial lakes in Austria – Distribution and formation since the Little Ice Age, Global Planet. Change, 164, 39–51, https://doi.org/10.1016/j.gloplacha.2018.03.003, 2018. a
Capps, D. M., Wiles, G. C., Clague, J. J., and Luckman, B. H.: Tree-ring dating of the nineteenth-century advance of Brady Glacier and the evolution of two ice-marginal lakes, Alaska, Holocene, 21, 641–649, https://doi.org/10.1177/0959683610391315, 2011. a
Carrivick, J. L. and Quincey, D. J.: Progressive increase in number and volume of ice-marginal lakes on the western margin of the Greenland Ice Sheet, Global Planet. Change, 116, 156–163, https://doi.org/10.1016/j.gloplacha.2014.02.009, 2014. a, b, c
Carrivick, J. L. and Tweed, F. S.: Proglacial lakes: character, behaviour and geological importance, Quart. Sci. Rev., 78, 34–52, https://doi.org/10.1016/j.quascirev.2013.07.028, 2013. a, b
Carrivick, J. L. and Tweed, F. S.: A global assessment of the societal impacts of glacier outburst floods, Global Planet. Change, 144, 1–16, 2016. a, b, c
Chen, F., Zhang, M., Guo, H., Allen, S., Kargel, J. S., Haritashya, U. K., and Watson, C. S.: Annual 30 m dataset for glacial lakes in High Mountain Asia from 2008 to 2017, Earth Syst. Sci. Data, 13, 741–766, https://doi.org/10.5194/essd-13-741-2021, 2021. a, b, c, d, e
Clague, J. J. and Evans, S. G.: A review of catastrophic drainage of moraine-dammed lakes in British Columbia, Quaternary Sci. Rev., 19, 1763–1783, https://doi.org/10.1016/S0277-3791(00)00090-1, 2000. a
Colonia, D., Torres, J., Haeberli, W., Schauwecker, S., Braendle, E., Giraldez, C., and Cochachin, A.: Compiling an Inventory of Glacier-Bed Overdeepenings and Potential New Lakes in De-Glaciating Areas of the Peruvian Andes: Approach, First Results, and Perspectives for Adaptation to Climate Change, Water, 9, 336, https://doi.org/10.3390/w9050336, 2017. a
Cook, S. J. and Quincey, D. J.: Estimating the volume of Alpine glacial lakes, Earth Surf. Dynam., 3, 559–575, https://doi.org/10.5194/esurf-3-559-2015, 2015. a, b
Cook, S. J., Kougkoulos, I., Edwards, L. A., Dortch, J., and Hoffmann, D.: Glacier change and glacial lake outburst flood risk in the Bolivian Andes, The Cryosphere, 10, 2399–2413, https://doi.org/10.5194/tc-10-2399-2016, 2016. a
Dorava, J. M. and Milner, A. M.: Role of lake regulation on glacier fed rivers in enhancing salmon productivity: The Cook Inlet watershed south central Alaska, USA, Hydrol. Process., 14, 3149–3159, https://doi.org/10.1002/1099-1085(200011/12)14:16/17<3149::AID-HYP139>3.0.CO;2-Y, 2000. a
Emmer, A.: Glacier Retreat and Glacial Lake Outburst Floods (GLOFs), in: Oxford Research Encyclopedia of Natural Hazard Science, 1–37, https://doi.org/10.1093/acrefore/9780199389407.013.275, 2017. a, b
Emmer, A., Merkl, S., and Mergili, M.: Spatiotemporal patterns of high-mountain lakes and related hazards in western Austria, Geomorphology, 246, 602–616, https://doi.org/10.1016/j.geomorph.2015.06.032, 2015. a
Emmer, A., Harrison, S., Mergili, M., Allen, S., Frey, H., and Huggel, C.: 70 years of lake evolution and glacial lake outburst floods in the Cordillera Blanca (Peru) and implications for the future, Geomorphology, 365, 107178, https://doi.org/10.1016/j.geomorph.2020.107178, 2020. a, b, c, d, e, f, g, h
ESRI: Terrain [basemap], World Terrain Map, available at: https://www.arcgis.com/home/item.html?id=c61ad8ab017d49e1a82f580ee1298931 (last access: 23 January 2022), 2009. a, b
Field, H. R., Armstrong, W. H., and Huss, M.: Gulf of Alaska ice-marginal lake area change over the Landsat record and potential physical controls, The Cryosphere, 15, 3255–3278, https://doi.org/10.5194/tc-15-3255-2021, 2021. a, b, c, d, e
Fujita, K., Sakai, A., Nuimura, T., Yamaguchi, S., and Sharma, R. R.: Recent changes in Imja Glacial Lake and its damming moraine in the Nepal Himalaya revealed by in situ surveys and multi-temporal ASTER imagery, Environ. Res. Lett., 4, 045205, https://doi.org/10.1088/1748-9326/4/4/045205, 2009. a
Furian, W., Loibl, D., and Schneider, C.: Future glacial lakes in High Mountain Asia: An inventory and assessment of hazard potential from surrounding slopes, J. Glaciol., 67, 653–670, https://doi.org/10.1017/jog.2021.18, 2021. a
Gardelle, J., Arnaud, Y., and Berthier, E.: Contrasted evolution of glacial lakes along the Hindu Kush Himalaya mountain range between 1990 and 2009, Global Planet. Change, 75, 47–55, https://doi.org/10.1016/j.gloplacha.2010.10.003, 2011. a
Glasser, N. F., Holt, T. O., Evans, Z. D., Davies, B. J., Pelto, M., and Harrison, S.: Recent spatial and temporal variations in debris cover on Patagonian glaciers, Geomorphology, 273, 202–216, https://doi.org/10.1016/j.geomorph.2016.07.036, 2016. a
Herreid, S. and Pellicciotti, F.: The state of rock debris covering Earth's glaciers, Nat. Geosci., 13, 621–627, https://doi.org/10.1038/s41561-020-0615-0, 2020. a, b, c, d
How, P., Messerli, A., Mätzler, E., Santoro, M., Wiesmann, A., Caduff, R., Langley, K., Bojesen, M. H., Paul, F., Kääb, A., and Carrivick, J. L.: Greenland-wide inventory of ice marginal lakes using a multi-method approach, Scient. Rep., 11, 1–13, https://doi.org/10.1038/s41598-021-83509-1, 2021. a
Huggel, C., Kääb, A., Haeberli, W., and Teysseire, P.: Remote sensing based assessment of hazards from glacier lake outbursts: A case study in the Swiss Alps, Can. Geotech. J., 39, 3160330, https://doi.org/10.1139/t01-099, 2002. a
Immerzeel, W. W., Lutz, A. F., Andrade, M., Bahl, A., Biemans, H., Bolch, T., Hyde, S., Brumby, S., Davies, B. J., Elmore, A. C., Emmer, A., Feng, M., Fernández, A., Haritashya, U., Kargel, J. S., Koppes, M., Kraaijenbrink, P. D., Kulkarni, A. V., Mayewski, P. A., Nepal, S., Pacheco, P., Painter, T. H., Pellicciotti, F., Rajaram, H., Rupper, S., Sinisalo, A., Shrestha, A. B., Viviroli, D., Wada, Y., Xiao, C., Yao, T., and Baillie, J. E.: Importance and vulnerability of the world’s water towers, Nature, 577, 364–369, https://doi.org/10.1038/s41586-019-1822-y, 2020. a
Jacquet, J., McCoy, S., McGrath, D., Nimick, D. A., Fahey, M., O'Kuinghttons, J., Friesen, B. A., and Leidich, J.: Hydrologic and geomorphic changes resulting from episodic glacial lake outburst floods: Rio Colonia, Patagonia, Chile, Geophys. Res. Lett., 44, 854–864, https://doi.org/10.1002/2016GL071374, 2017. a, b, c, d
Jakob, L., Gourmelen, N., Ewart, M., and Plummer, S.: Spatially and temporally resolved ice loss in High Mountain Asia and the Gulf of Alaska observed by CryoSat-2 swath altimetry between 2010 and 2019, The Cryosphere, 15, 1845–1862, https://doi.org/10.5194/tc-15-1845-2021, 2021. a, b, c, d
Jones, K. W. and Wolken, G. J.: Valdez glacier ice-dammed lake: June 2018 glaical lake outburst flood, Report 2019-4, State of Alaska Department of Natural Resources Division of Geological & Geophysical Surveys, p. 6, https://doi.org/10.14509/30175, 2019. a
Kaufman, D. S. and Manley, W. F.: Pleistocene Maximum and Late Wisconsinan glacier extents across Alaska, U.S.A., Dev. Quatern. Sci., 2, 9–27, https://doi.org/10.1016/S1571-0866(04)80182-9, 2004. a
Kienholz, C., Herreid, S., Rich, J. L., Arendt, A. A., Hock, R., and Burgess, E. W.: Derivation and analysis of a complete modern-date glacier inventory for Alaska and northwest Canada, J. Glaciol., 61, 403–420, https://doi.org/10.3189/2015JoG14J230, 2015. a, b
Kienholz, C., Pierce, J., Hood, E., Amundson, J. M., Wolken, G. J., Jacobs, A., Hart, S., Wikstrom Jones, K., Abdel-Fattah, D., Johnson, C., and Conaway, J. S.: Deglacierization of a Marginal Basin and Implications for Outburst Floods, Mendenhall Glacier, Alaska, Front. Earth Sci., 8, 1–21, https://doi.org/10.3389/feart.2020.00137, 2020. a, b, c, d, e
King, O., Bhattacharya, A., Bhambri, R., and Bolch, T.: Glacial lakes exacerbate Himalayan glacier mass loss, Scient. Rep., 9, 1–9, https://doi.org/10.1038/s41598-019-53733-x, 2019. a
Larsen, C. F., Burgess, E., Arendt, A. A., O'Neel, S., Johnson, A. J., and Kienholz, C.: Surface melt dominates Alaska glacier mass balance, Geophys. Res. Lett., 42, 5902–5908, https://doi.org/10.1002/2015GL064349, 2015. a, b, c, d, e, f
Linsbauer, A., Frey, H., Haeberli, W., Machguth, H., Azam, M. F., and Allen, S.: Modelling glacier-bed overdeepenings and possible future lakes for the glaciers in the Himalaya–Karakoram region, Ann. Glaciol., 57, 119–130, https://doi.org/10.3189/2016AoG71A627, 2016. a
Maurer, J. M., Schaefer, J. M., Rupper, S., and Corley, A.: Acceleration of ice loss across the Himalayas over the past 40 years, Sci. Adv., 5, eaav7266, https://doi.org/10.1126/sciadv.aav7266, 2019. a
McGrath, D., Sass, L., Neel, S. O., Arendt, A., and Kienholz, C.: Hypsometric control on glacier mass balance sensitivity in Alaska and northwest Canada, Earth's Future, 5, 324–336, https://doi.org/10.1002/eft2.193, 2017. a
Meerhoff, E., Castro, L. R., Tapia, F. J., and Pérez-Santos, I.: Hydrographic and Biological Impacts of a Glacial Lake Outburst Flood (GLOF) in a Patagonian Fjord, Estuar. Coast., 42, 132–143, https://doi.org/10.1007/s12237-018-0449-9, 2018. a
Melkonian, A. K., Willis, M. J., and Pritchard, M. E.: Satellite-derived volume loss rates and glacier speeds for the Juneau Icefield, Alaska, J. Glaciol., 60, 743–760, https://doi.org/10.3189/2014JoG13J181, 2014. a
Melkonian, A. K., Willis, M. J., and Pritchard, M. E.: Stikine icefield mass loss between 2000 and 2013/2014, Front. Earth Sci., 4, 1–12, https://doi.org/10.3389/feart.2016.00089, 2016. a
Miller, J. A., Whitehead, R. L., Gingerich, S. B., Oki, D. S., and Olcott, P. G.: Ground Water Atlas of the United States – Segment 13 – Alaska, Hawaii, Puerto Rico and the U.S. Virgin Islands, USGS Hydrologic Atlas 730-N, USGS, https://doi.org/10.3133/ha730N, 1999. a
Milner, A. M., Robertson, A. L., Monaghan, K. A., Veal, A. J., and Flory, E. A.: Colonization and development of an Alaskan stream community over 28 years, Front. Ecol. Environ., 6, 413–419, https://doi.org/10.1890/060149, 2008. a
Neal, E. G.: Hydrology and glacier-lake outburst floods (1987–2004) and water quality (1998–2003) of the Taku River near Juneau, Alaska, US Geological Scientific Investigations Report, 1–38, available at: https://pubs.usgs.gov/sir/2007/5027/pdf/sir20075027.pdf (last access: 18 October 2021), 2007. a, b
Nie, Y., Sheng, Y., Liu, Q., Liu, L., Liu, S., Zhang, Y., and Song, C.: A regional-scale assessment of Himalayan glacial lake changes using satellite observations from 1990 to 2015, Remote Sens. Environ., 189, 1–13, https://doi.org/10.1016/j.rse.2016.11.008, 2017. a, b, c, d, e, f, g, h, i, j
Östrem, G.: Ice Melting under a Thin Layer of Moraine, and the Existence of Ice Cores in Moraine Ridges, Geograf. Ann., 41, 228–230, https://doi.org/10.1080/20014422.1959.11907953, 1959. a
Otto, J.-C.: Proglacial Lakes in High Mountain Environments: Landform and Sediment Dynamics in Recently Deglaciated Alpine Landscapes, in: Geography of the Physical Environment, edited by: Heckmann, T. and Morche, D., Springer Nature, Switzerland, https://doi.org/10.1007/978-3-319-94184-4, 2019. a, b
Pelto, M., Capps, D., Clague, J. J., and Pelto, B.: Rising ELA and expanding proglacial lakes indicate impending rapid retreat of Brady Glacier, Alaska, Hydrol. Process., 27, 3075–3082, https://doi.org/10.1002/hyp.9913, 2013. a, b
Post, A. and Mayo, L. R.: Glacier Dammed Lakes and Outburst Floods in Alaska, Hydrologic Investigations Atlas HA-455, USGS, available at: https://irma.nps.gov/DataStore/DownloadFile/489929 (last access: 27 August 2021), 1971. a, b
Pronk, J. B., Bolch, T., King, O., Wouters, B., and Benn, D. I.: Contrasting surface velocities between lake- and land-terminating glaciers in the Himalayan region, The Cryosphere, 15, 5577–5599, https://doi.org/10.5194/tc-15-5577-2021, 2021. a
Reynolds, J. M.: On the formation of supraglacial lakes on debris-covered glaciers, IAHS-AISH Publication, 153–161, available at: http://hydrologie.org/redbooks/a264/iahs_264_0153.pdf (last access: 14 May 2021), 2000. a, b
RGI Consortium: Randolph Glacier Inventory – A Dataset of Global Glacier Outlines: Version 6.0: Technical Report, Global Land Ice Measurements from Space, Digital Media, Colorado, USA, https://doi.org/10.7265/N5-RGI-60, 2017. a, b
Rick, B. and McGrath, D.: Multi-decadal Glacial Lake Inventory in the Alaska Region between 1984 and 2019, Arctic Data Center [data set], https://doi.org/10.18739/A2MK6591G, 2021. a
Rounce, D. R., Watson, C. S., and McKinney, D. C.: Identification of Hazard and Risk for Glacial Lakes in the Nepal Himalaya Using Satellite Imagery from 2000–2015, Remote Sens., 9, 654, https://doi.org/10.3390/rs9070654, 2017. a, b, c, d, e
Salerno, F., Thakuri, S., D'Agata, C., Smiraglia, C., Manfredi, E. C., Viviano, G., and Tartari, G.: Glacial lake distribution in the Mount Everest region: Uncertainty of measurement and conditions of formation, Global Planet. Change, 92-93, 30–39, https://doi.org/10.1016/j.gloplacha.2012.04.001, 2012. a
Santos, J. and Córdova, C.: Little Ice Age glacial geomorphology and sedimentology of Portage Glacier, South-Central Alaska, Finisterra, 44, 95–108, https://doi.org/10.18055/finis1380, 2009. a
Shugar, D. H., Burr, A., Haritashya, U. K., Kargel, J. S., Watson, C. S., Kennedy, M. C., Bevington, A. R., Betts, R. A., Harrison, S., and Strattman, K.: Rapid worldwide growth of glacial lakes since 1990, Nat. Clim. Change, 10, 939–945, https://doi.org/10.1038/s41558-020-0855-4, 2020. a, b, c, d, e, f, g
Solomina, O. N., Bradley, R. S., Hodgson, D. A., Ivy-Ochs, S., Jomelli, V., Mackintosh, A. N., Nesje, A., Owen, L. A., Wanner, H., Wiles, G. C., and Young, N. E.: Holocene glacier fluctuations, Quaternary Sci. Rev., 111, 9–34, https://doi.org/10.1016/j.quascirev.2014.11.018, 2015. a
Solomina, O. N., Bradley, R. S., Jomelli, V., Geirsdottir, A., Kaufman, D. S., Koch, J., McKay, N. P., Masiokas, M., Miller, G., Nesje, A., Nicolussi, K., Owen, L. A., Putnam, A. E., Wanner, H., Wiles, G., and Yang, B.: Glacier fluctuations during the past 2000 years, Quaternary Sci. Rev., 149, 61–90, https://doi.org/10.1016/j.quascirev.2016.04.008, 2016. a
Song, C., Sheng, Y., Wang, J., Ke, L., Madson, A., and Nie, Y.: Heterogeneous glacial lake changes and links of lake expansions to the rapid thinning of adjacent glacier termini in the Himalayas, Geomorphology, 280, 30–38, https://doi.org/10.1016/j.geomorph.2016.12.002, 2017. a, b
Sturm, M., and Benson, C.: A History of Jökulhlaups from Strandline Lake, Alaska, U.S.A., J. Glaciol., 31, 272–280, https://doi.org/10.3189/S0022143000006602, 1985. a
Tweed, F. S. and Carrivick, J. L.: Deglaciation and proglacial lakes, Geol. Today, 31, 96–102, 2015. a
Veh, G., Korup, O., and Walz, A.: Hazard from Himalayan glacier lake outburst floods, P. Natl. Acad. Sci. USA, 117, 907–912, https://doi.org/10.1073/pnas.1914898117, 2020. a, b
Walder, J. S. and Costa, J. E.: Outburst floods from glacier-dammed lakes: The effect of mode of lake drainage on flood magnitude, Earth Surf. Proc. Land., 21, 701–723, https://doi.org/10.1002/(SICI)1096-9837(199608)21:8<701::AID-ESP615>3.0.CO;2-2, 1996. a
Wang, S. J. and Zhou, L. Y.: Integrated impacts of climate change on glacier tourism, Adv. Clim. Change Res., 10, 71–79, https://doi.org/10.1016/j.accre.2019.06.006, 2019. a
Wang, X., Liu, S., Ding, Y., Guo, W., Jiang, Z., Lin, J., and Han, Y.: An approach for estimating the breach probabilities of moraine-dammed lakes in the Chinese Himalayas using remote-sensing data, Nat. Hazards Earth Syst. Sci., 12, 3109–3122, https://doi.org/10.5194/nhess-12-3109-2012, 2012. a
Wang, X., Ding, Y., Liu, S., and Jiang, L.: Changes of glacial lakes and implications in Tian Shan, central Asia, based on remote sensing data from 1990 to 2010, Environ. Res. Lett., 8, 044052, https://doi.org/10.1088/1748-9326/8/4/044052, 2013. a, b
Wang, X., Guo, X., Yang, C., Liu, Q., Wei, J., Zhang, Y., Liu, S., Zhang, Y., Jiang, Z., and Tang, Z.: Glacial lake inventory of high-mountain Asia in 1990 and 2018 derived from Landsat images, Earth Syst. Sci. Data, 12, 2169–2182, https://doi.org/10.5194/essd-12-2169-2020, 2020. a, b
Welling, J., Árnason, T., and Ólafsdóttir, R.: Implications of climate change on nature-based tourism demand: A segmentation analysis of glacier site visitors in southeast Iceland, Sustainability, 12, 5338, https://doi.org/10.3390/su12135338, 2020. a
Wilcox, A. C., Wade, A. A., and Evans, E. G.: Drainage events from a glacier-dammed lake, Bear Glacier, Alaska: Remote sensing and field observations, Geomorphology, 220, 41–49, https://doi.org/10.1016/j.geomorph.2014.05.025, 2014. a
Wiles, G. C., Barclay, D. J., and Calkin, P. E.: Tree-ring-dated `Little Ice Age' histories of maritime glaciers from western Prince William Sound, Alaska, Holocene, 9, 163–173, https://doi.org/10.1191/095968399671927145, 1999. a
Wilson, F., Hults, C., Mull, C., and Karl, S.: Geologic map of Alaska, Tech. rep., Reston, VA, https://doi.org/10.3133/sim3340, 2015. a
Wolfe, D. F. G., Kargel, J. S., and Leonard, G. J.: Glacier-dammed ice-marginal lakes of Alaska, https://doi.org/10.1007/978-3-540-79818-7, 2014. a, b, c
Worni, R., Huggel, C., and Stoffel, M.: Glacial lakes in the Indian Himalayas – From an area-wide glacial lake inventory to on-site and modeling based risk assessment of critical glacial lakes, Sci. Total Environ., 468–469, S71–S84, https://doi.org/10.1016/j.scitotenv.2012.11.043, 2013. a
Zemp, M., Huss, M., Thibert, E., Eckert, N., Mcnabb, R., Huber, J., Barandun, M., Machguth, H., Nussbaumer, S. U., Thomson, L., Paul, F., Maussion, F., Kutuzov, S., Cogley, J. G., Asia, C., Zealand, N., Canada, W., and Zealand, N.: Global glacier mass changes and their contributions to sea-level rise from 1961 to 2016, Nature, 568, 382–386, https://doi.org/10.1038/s41586-019-1071-0, 2019. a, b, c
Zhang, G., Yao, T., Xie, H., Wang, W., and Yang, W.: An inventory of glacial lakes in the Third Pole region and their changes in response to global warming, Global Planet. Change, 131, 148–157, https://doi.org/10.1016/j.gloplacha.2015.05.013, 2015. a
Zhang, M.-M., Chen, F., and Tian, B.-S.: An automated method for glacial lake mapping in High Mountain Asia using Landsat 8 imagery, J. Mount. Sci., 15, 13–24, https://doi.org/10.1007/s11629-017-4518-5, 2018. a, b, c