the Creative Commons Attribution 4.0 License.
the Creative Commons Attribution 4.0 License.
 | 20 Jul 2022
Physical and mechanical properties of winter first-year ice in the Antarctic marginal ice zone along the Good Hope Line
Sebastian Skatulla
Riesna R. Audh
Andrea Cook
Ehlke Hepworth
Siobhan Johnson
Doru C. Lupascu
Keith MacHutchon
Rutger Marquart
Tommy Mielke
Emmanuel Omatuku
Felix Paul
Tokoloho Rampai
Jörg Schröder
Carina Schwarz
Marcello Vichi
As part of the 2019 Southern oCean seAsonal Experiment (SCALE) Winter Cruise of the South African icebreaker SA Agulhas II, first-year ice was sampled at the advancing outer edge of the Antarctic marginal ice zone along a 150 km Good Hope Line transect. Ice cores were extracted from four solitary pancake ice floes of 1.83–2.95 m diameter and 0.37–0.45 m thickness as well as a 12×4 m pancake ice floe of 0.31–0.76 m thickness that was part of a larger consolidated pack ice domain. The ice cores were subsequently analysed for temperature, salinity, texture, anisotropic elastic properties and compressive strength. All ice cores from both solitary pancake ice floes and consolidated pack ice exhibited predominantly granular textures. The vertical distributions of salinity, brine volume and mechanical properties were significantly different for the two ice types. High salinity values of 12.6±4.9 PSU were found at the topmost layer of the solitary pancake ice floes but not for the consolidated pack ice. The uniaxial compressive strengths for pancake ice and consolidated pack ice were determined as 2.3±0.5 and 4.1±0.9 MPa, respectively. Young's and shear moduli in the longitudinal core direction of solitary pancake ice were obtained as 3.7±2.0 and 1.3±0.7 GPa, respectively, and of consolidated pack ice as 6.4±1.6 and 2.3±0.6 GPa, respectively. Comparing Young's and shear moduli measured in longitudinal and transverse core directions, a clear directional dependency was found, in particular for the consolidated pack ice.
- Article
(10315 KB) - Full-text XML
- BibTeX
- EndNote


The seasonal sea ice advance and retreat in the Antarctic marginal ice zone (MIZ) of the Southern Ocean (SO) are heavily influenced by harsh atmospheric and oceanic conditions. Accordingly, the sea ice dynamics in this region is characterized by high temporal and spatial fluctuations and still elude reliable prediction by current climate models (Hobbs et al., 2016). Due to the limited in situ data from the Antarctic region throughout the year, well-established sea ice rheology models such as those of Hibler (1979) and Wang and Shen (2010) are phenomenological approaches considering effective properties of spatially variable ice concentration and empirically derived thickness and mechanical properties. In particular in the Antarctic MIZ, however, the actual sea ice properties and the scale dependency of sea ice deformation are linked to the specific ice types (e.g. consolidated pack ice, solitary pancake ice floes and fluid-like grease ice), varying ice concentration, leads with open water, etc. (Dansereau et al., 2016; Rampal et al., 2008; Weiss and Dansereau, 2017). Moreover, the heterogeneous and highly dynamic sea ice composition is affected by a range of mechanical phenomena in combination such as floe collision dynamics, form drag of interstitial grease ice on pancake ice floes and skin drag, which can only be accurately resolved by small-scale models (Alberello et al., 2019; Herman et al., 2019; Kohout et al., 2011; Marquart et al., 2021; Rogers et al., 2016). In this sense, large-scale models are not directly informed by the underlying mechanisms and phenomena defining sea ice behaviour, and the model parameters have little physical meaning. Therefore, a generalization of these models to sea ice conditions other than those for which they were fitted to is problematic (Squire, 2018).
Clearly, more investigation of early-stage ice formation in the Antarctic MIZ is necessary to elucidate the seasonal evolution of the ice morphology and to link the physical and mechanical properties from the sub-millimetre to kilometre scale as this stage also defines the ice properties later at the consolidated and melting stages. In order to acquire an in-depth understanding of sea ice characteristics and improve forecasting of sea ice trends, short term and long term, remote observational sea ice data and their reanalysis products need to be cross-referenced with in situ observations comprising the actual degree of ice consolidation, thickness, floe size, material composition and texture. In particular, the mechanics of sea ice in terms of deformation, fracture and faulting is linked to a range of spatial and temporal scales (Weiss and Dansereau, 2017).
On a smaller scale of less than 10 km, ice strength is distinctly heterogeneous and anisotropic due to the occurrence of leads (Hutchings and Hibler, 2008). Also, the distribution of floe characteristics such as size, shape, thickness and concentration becomes significant, in particular in the marginal ice zone (Hutchings et al., 2012; Bennetts et al., 2017; Roach et al., 2018; Marquart et al., 2021). Owing to the rough sea states in the winter SO delaying sea ice consolidation and rafting effects, sea ice composition is vertically changing in terms of grain size, crystallographic texture and fabrics as well as porosity (Timco and Weeks, 2010; Dempsey and Langhorne, 2012). On the metre scale and smaller, the mechanical behaviour of sea ice comprises elastic, inelastic, brittle and viscous material characteristics which are directly related to its grain and pore structure, brine inclusions as well as the generally temperature-dependent and strain-rate-dependent material response (Mellor, 1986; Schulson et al., 2006). Short-term and seasonal atmospheric temperature fluctuations, precipitation and associated brine drainage processes are continuously altering sea ice composition and properties (Wells et al., 2011; Galley et al., 2015; Thomas et al., 2020). Accordingly, the mechanical ice properties need to be put into context with ice salinity, temperature, density, porosity and type as well as crystal size and orientation (Nakawo and Sinha, 1981; Kovacs, 1996; Timco and Weeks, 2010). As previously mentioned, in situ data of Antarctic sea ice properties are generally scarce, especially during the winter season due to the challenging access to this region. With regards to physical properties of Antarctic winter sea ice, its salinity (Doble et al., 2003; Eicken, 1992; Tison et al., 2020), density (Urabe and Inoue, 1988b) and texture (Jeffries et al., 1997, 2001; Lange and Eicken, 1991; Tison et al., 2017, 2020) have been studied. However, with regards to its mechanical properties including elasticity and strength as well as their directional dependency, a complete lack of data is found, except for in the case of uniaxial compression strength of Antarctic land-fast ice (Urabe and Inoue, 1988b). Accurate knowledge of mechanical ice properties is important to parameterize realistic small-scale sea ice dynamics models with respect to aspects concerning, for example, the influence of pancake ice floe deformation on the inelastic collision restitution (Herman et al., 2019), ridging (Yiew et al., 2017) and fracture (Weiss, 2013) as well as on the wave-induced flexural break-up of consolidated pack ice (Passerotti et al., 2022). These mechanical phenomena are strongly linked to sea ice formation and retreat, sea ice drift, and wave attenuation in the Antarctic MIZ (Alberello et al., 2020; Eayrs et al., 2019; Kohout et al., 2014; Rogers et al., 2016; Smith and Thomson, 2019).
This paper will report on the sampling and testing of winter first-year ice at the edge of the Antarctic marginal ice zone along the Good Hope Line during the 2019 SCALE (Southern oCean seAsonal Experiment, http://scale.org.za/, last access: 8 July 2021) Winter Cruise. It is the first winter expedition dedicated to MIZ measurements in the eastern Weddell Sea region since the earlier observations in the late 1980s, early 1990s and 2013 (e.g. Lange et al., 1989; Eicken et al., 1994; Kivimaa and Kosloff, 1994; Haas et al., 1992; Doble et al., 2001; Tison et al., 2017). The focus is on the physical and mechanical properties of sea ice in the MIZ from the edge into more consolidated pack ice conditions. The properties determined include sea ice texture, temperature, bulk salinity, bulk density, elastic properties and uniaxial compressive strength as well as snow thickness and salinity.
The plan of this paper is as follows: Sect. 2 elaborates on sampling and testing methods, Sect. 3 describes and discusses physical and mechanical data obtained, and a summary of the findings is provided in Sect. 4.
2.1 Sample collection
The 2019 SCALE Winter Cruise started with the SA Agulhas II departing from Cape Town on 18 July 2019 and sailing directly south to the Antarctic MIZ.

Figure 1Map with the two ice stations MIZ1D and MIZ3A indicated by green- and red-coloured circles, respectively. The ship entered the MIZ from the westernmost course and exited from the easternmost course. The sea ice concentration chart was obtained from the University of Hamburg AMSR2 ASI processing for 26 July 2019, with concentration values in percent [%]. The small map inlet shows the route from Cape Town to the study area highlighted in blue colour.
The ship entered the ice on 26 July 2019 at 13:00 UTC and exited on 28 July 2019 at 20:30 UTC. An overview of the MIZ stations is shown in Fig. 1 with the naming convention and corresponding coordinates listed in Table 1. The station plan was designed to resolve the evolution of sea ice features from the open ocean into more consolidated sea ice conditions. Due to contingency and time optimization, the sequence of stations did not follow the original design. The naming convention was extended to preserve the original geographic distribution of MIZ1X being at the edge with the open ocean and MIZ3X in consolidated pack ice. Stations were therefore turned into clusters, where overboard ice coring, pancake ice collection, grease ice sampling, buoy deployment, environmental measurements and ocean sampling took place. Additional biogeochemical sampling was performed at MIZ2X, which is, however, not part of this work.
A complete set of sea ice observations were made every hour from the bridge, commencing on 26 July 2019 at 13:00 UTC and ending on 28 July 2019 at 20:30 UTC when entering and exiting the ice, respectively. Observations were collected according to the Antarctic Sea-ice Processes and Climate (ASPeCt) protocol for estimating ice concentration, ice type, floe size and thickness, cloud cover, visibility, weather, and air and sea surface temperature. The initially higher-frequency observations were eventually combined into the hourly frequency required by ASPeCt (Hepworth et al., 2020).
The first ice floes were observed in the early afternoon of 26 July 2019. Sea ice features rapidly varied, and large expanses of consolidated pack ice were found at the latitude of MIZ3. Ice navigation and planning were assisted by (i) ice edge charting based on satellite data and reanalysis products by the South African Weather Service (SAWS) (de Vos et al., 2021) and (ii) a prototype remote sensing product describing multi-year ice concentration and other sea ice types developed by the University of Bremen (Spreen et al., 2008). The latter distinguishes the different ice types (young ice, first-year ice and multi-year ice) based on a combination of passive microwave and scatterometer data using an algorithm developed by Environment Canada's Ice Concentration Extractor (ECICE) (Shokr and Agnew, 2013) and corrections by Ye et al. (2015). Figure 2 shows that the southernmost ice station was expected to be predominantly in first-year ice (FYI) conditions, which was confirmed on site. The MIZ with unconsolidated ice conditions, composed of pancake ice floes of about 1 to 5 m diameter, likely extended for about 200 km southward as indicated by the young ice (YI) map features in Fig. 2. With reference to WMO (code 3739) ice age ID 5 applied for the southernmost ice station and ice age ID 3 for the most northerly station.
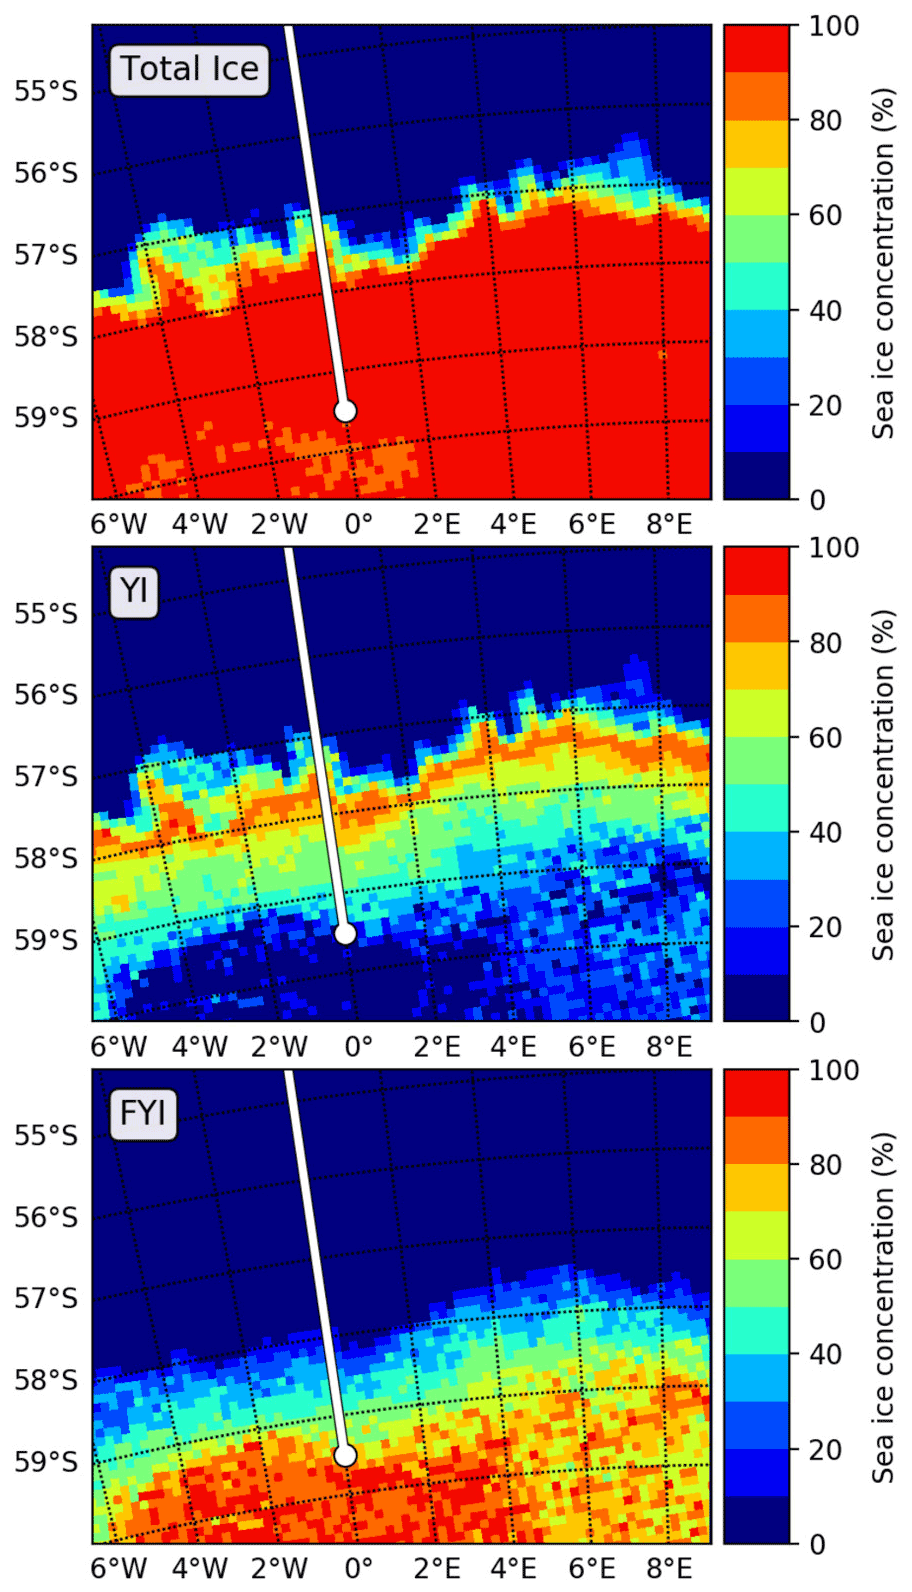
Figure 2Sea ice type concentration data provided by the University of Bremen. Daily concentration of total ice, young ice (YI) and first-year ice (FYI) on 24 July 2019 prior to the ship entering the MIZ. The cruise plan and the southernmost station (MIZ3A) are also shown. Data are available at https://seaice.uni-bremen.de/sea-ice-concentration/amsre-amsr2/ (last access: 24 July 2019).
Fieldwork operations involving ice core sampling took place on the southward-bound leg at the most southerly station, MIZ3A (as shown in Fig. 1), on 27 July 2019 between 10:00–16:00 UTC. Operations took place during daylight in harsh conditions. The air temperature was −17 ∘C and the wind speed 20 m s−1, according to the on-board equipment of the South African Weather Services. Large first-year floes, ranging between 500–2000 m in diameter, completely covered the ocean, each one composed of cemented pancake ice floes of smaller sizes. The coring and temperature measurement of cores were performed on a single pancake ice floe, about 12×4 m in dimensions and part of a larger consolidated pack ice domain located off the starboard bow as shown in Fig. 3. All cores were extracted in the vertical direction, perpendicular to the ice floe surface.
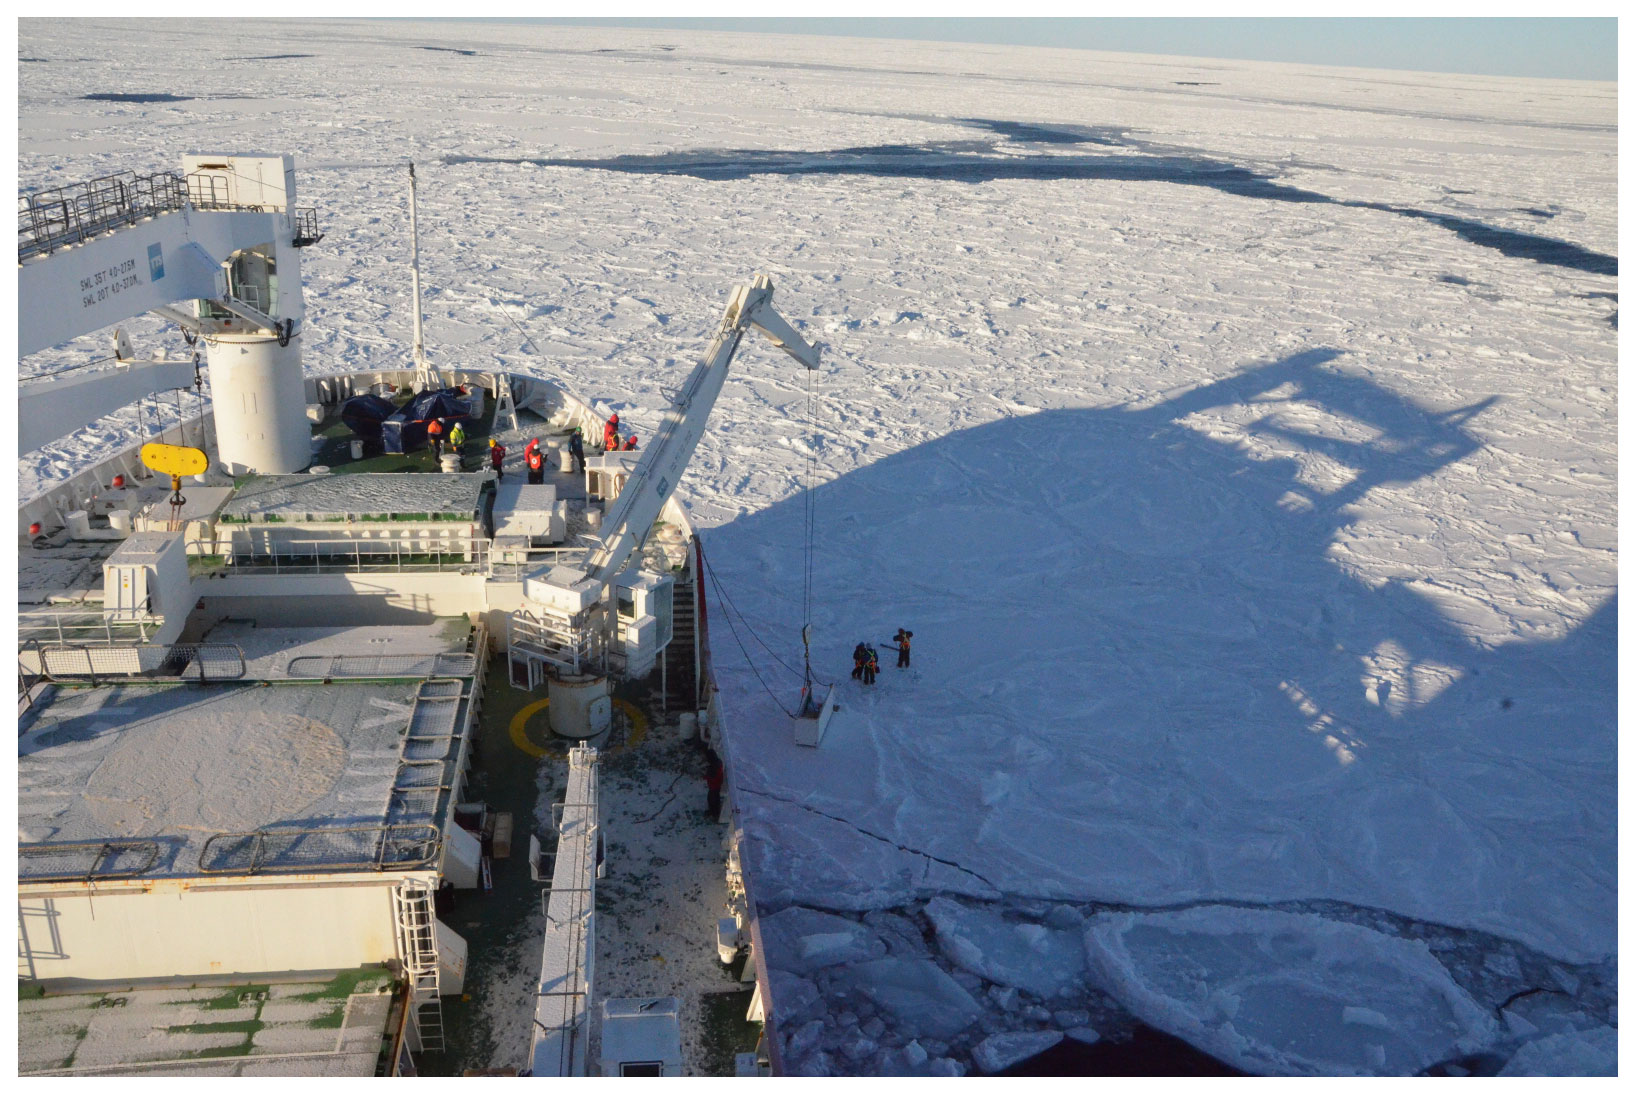
Figure 3Coring field at MIZ3A showing the cemented pancakes with sizes varying between 3 and 15 m.
A total of 26 cores were collected using a 1 m long and 9 cm diameter Kovacs Mark II barrel operated with an electric drill. Each core was dedicated to a specific type of testing, with the core IDs and corresponding names found in Appendix A1 in Table A1. The length of the cores is representative of the pack ice thickness. Three of them were immediately processed after coring to determine the vertical temperature distribution. For this purpose, the cores were placed on a plastic rail with markings for drill points 5 cm apart from each other. The temperature probe was put into pre-drilled holes using a cordless drill, and the temperature readings were recorded. For temperature measurements, the Testo GMH 3750-GE logger (±0.03∘ system accuracy) with high-precision Pt100 penetration probes GTF 401 DIN (±0.03∘ accuracy) were utilized (Testo, Titisee-Neustadt, Germany). All readings were completed within 4 min of coring. After sea ice core collection, a 3D-printed Niskin bottle was deployed through two core cavities to retrieve samples of the water at the ice–ocean interface. The Niskin 3D deployment yielded two water samples of approximately 700 mL each, from which the boundary layer salinity of the ocean was determined by an 8410A Portasal salinometer (±0.003 PSU system accuracy) at room temperature. All 26 cores were put in plastic sleeves, sealed and horizontally stored in crates with a 5 cm styrofoam insulation for up to 2 h at environmental temperatures until being taken aboard for further processing in the glaciological cold laboratory or stored in the ship's freezer. The temperature in the laboratory was kept at −10 ∘C, and the ship's freezer was maintained at −25 ∘C. The cores were continuously kept in a horizontal position during transport and storage to minimize further brine drainage. Keeping the lab temperature on the ship at −10 ∘C has been considered a good compromise by the authors so that the large number of ice samples could be processed as quickly as possible. During processing of ice specimens in the cold laboratory, no noticeable brine loss occurred.
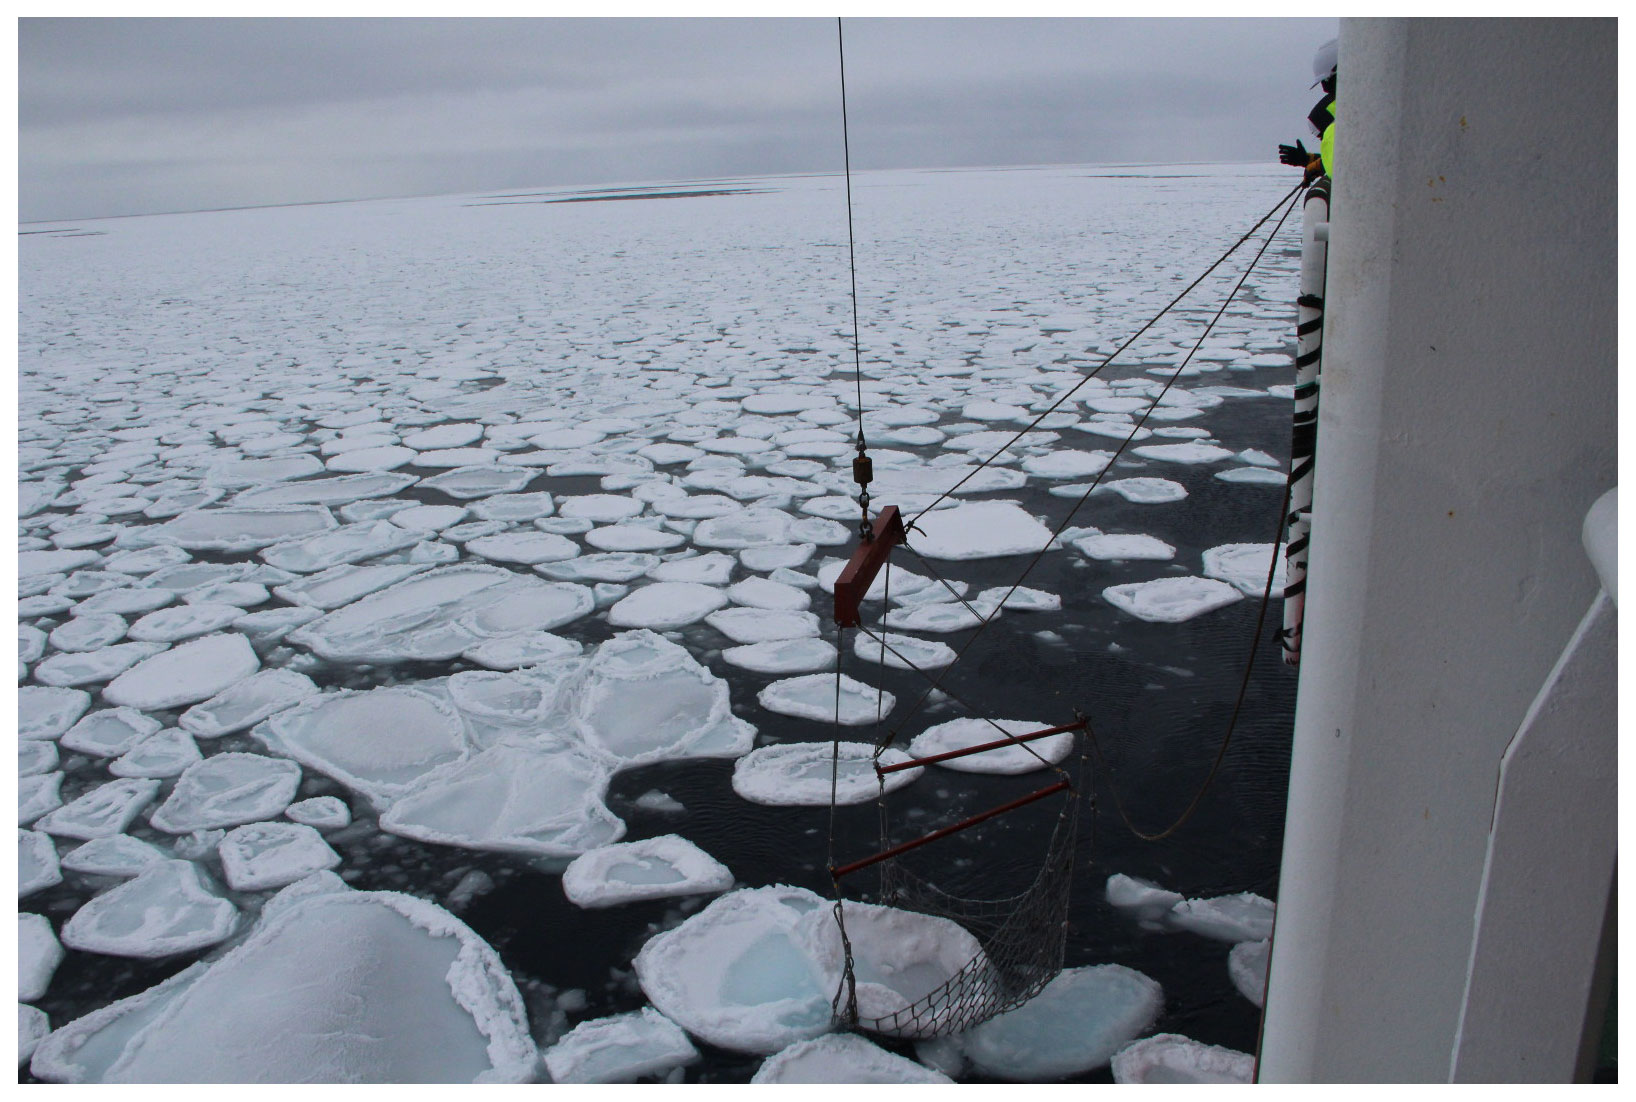
Figure 4Sampling of solitary pancake ice floes with diameters of about 2.5 m using the ship's crane.
The collection of solitary pancake ice floes took place on the northward-bound leg at the second most northerly station, MIZ1D, on 28 July 2019 between 10:45–16:00 UTC. Station MIZ1D was characterized by 80 % of the ocean surface covered by pancake ice floes of about 1–3 m diameter as shown in Fig. 4. The relatively warm air temperature and lower wind speed were recorded as −8 ∘C and 12 m s−1, respectively, and a dampened swell was observed. The calm ocean and wind conditions allowed for the quick selection and isolation of pancake ice floes. The pancakes were collected from the ocean using the helideck crane and a custom-made 5×5 m heavy-duty net held by a spreader beam construction designed for a maximum payload of 3.5 t.
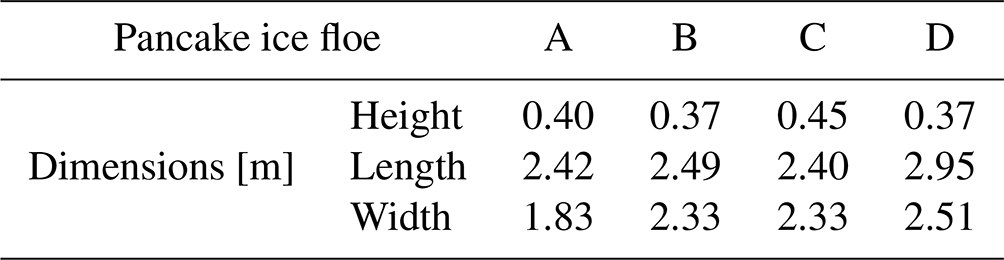
Four pancake ice floes, labelled A to D, were collected and placed onto individual wooden grids as depicted in Fig. 5 to ease coring and prevent contamination by the ship deck. Details on the different pancake dimensions are given in Table 2.

Figure 5Pancake ice floes placed on wooden grids on the ship's helideck: Pancake A (top left panel), Pancake B (top right panel), Pancake C (bottom left panel) and Pancake D (bottom right panel) shattered into six large pieces during removal from the net.
All four pancakes had rafted edges, were snow-covered and did not have a visibly discoloured biologically active layer. The depth and temperature of the snow layer were taken before each pancake was manoeuvred out of the net, which are found in Table 2. During the pancake ice floe lifting, the 3D-printed Niskin bottle was again deployed from the helideck to retrieve water samples from which the ice–ocean boundary layer salinity was determined. In addition, interstitial frazil ice was collected and its viscosity was measured; further details are found in Paul et al. (2021).
Subsequently, between 17 and 23 cores were obtained from each pancake ice floe. The corresponding coring layout with core IDs and corresponding names can be found in Appendix A2 in Fig. A1 and Tables A2–A5. As for the pack ice, all cores were extracted in the vertical direction, perpendicular to the ice floe surface. As such, the length of the cores is representative of the pancake ice floe thickness (depth). For each floe, three cores were tested to determine the vertical temperature profile immediately after the floe had been offloaded. All cores were subsequently transferred either to the cold laboratory for further processing and testing or to the ship's freezer.
2.2 Testing of physical and mechanical properties
The ice cores used to profile the vertical temperature distribution in consolidated pack ice and pancake ice were subsequently cut with a stainless steel bandsaw into segments close to 10 cm length and allowed to melt in Ziploc bags in a refrigerator at 5 ∘C. Once melted, the volume of the samples was measured using a graduated beaker, and the bulk salinity was obtained by means of an 8410A Portasal salinometer at room temperature. On-deck-sampled pancake ice was processed within 30 min and overboard-sampled consolidated pack ice within 2.5 h of core extraction.
As the working conditions in the cold laboratory aboard the ship were challenging due to the significant swell at the edge of the Antarctic MIZ, it was decided to compute the brine volume distributions in pancake ice and consolidated pack ice only based on the obtained temperature and salinity data via the empirical relations by Frankenstein and Garner (1967):
where Vb denotes brine volume [‰], Ssi [PSU] the bulk salinity and T [∘C] the absolute value of the temperature. The more accurate relation by Cox and Weeks (1983) additionally requires accurate enough ice density measurements, which were difficult to obtain aboard the ship.
The sampled pancake and consolidated pack ice was studied with respect to crystal structure, stratigraphy and texture. For this purpose, one ice core in consolidated conditions and four further pancake ice cores were investigated. The ice cores were visually inspected during extraction to record obvious physical features such as thickness of snow topping, layering in the texture of the ice and the presence of possible defects such as cracks. The cores were then taken directly to the ship's storage facility and analysed back at the University of Cape Town, approximately 6 months after collection while being stored at −20 ∘C. The cores were first cut into 10 cm segments, and longitudinal sections with thicknesses on the order of 8 mm were then cut from the centre of these segments with a stainless steel bandsaw at −10 ∘C laboratory temperature. These 8 mm thick sections were further cut using a thermal macrotome to create thin sections of 1 mm thickness and subsequently viewed through cross-polarized sheets and photographed. The thermal macrotome used was constructed by the authors to produce thin sections for cross-polarization viewing. This device uses the concept of heat being passed through a nickel–chrome wire that slices a section of sea ice. This device is able to cut ice core sections to a thickness of 1 mm or less. The cross-polarized photographs were subsequently analysed for their respective ice textures and crystal sizes. From these images, stratigraphy diagrams were composed for easy visual comparison between cores and the average crystal sizes measured using the scale on the photographs. An average of 20 random crystals per texture layer were selected for measurement in a photograph, and the average size and standard deviation were calculated. Furthermore, a 95th-percentile confidence interval test was performed over the data collected for each texture for statistical comparison.
The testing of anisotropic elastic material properties of sea ice was conducted in the ship's cold laboratory at −10 ∘C within a few hours of collection. Since the mechanical behaviour of sea ice is rate-dependent, the dynamic Young's modulus is typically determined measuring the speed of ultrasonic waves, a pressure and a shear wave, travelling through the ice to exclude viscous strain in the deformation response (Timco and Weeks, 2010). The P- and S-wave signals are initiated by a pair of transducers put on opposite surfaces of a specimen. Young's and the shear moduli can then be calculated on the basis of the specimen's length (the distance between the transducers) and its bulk density as well as the speed of transmission of the P and S waves in accordance with the following formulae (Snyder et al., 2015):
where Ei and Gi denote the dynamic Young's and shear moduli, respectively, associated with the material direction xi; ρ the bulk density of ice; and cp the transmission speed of the P wave and cs the transmission speed of the S wave, both measured along direction xi.
The 9 cm diameter cores ranging between 30–45 cm in length were first visually inspected in the laboratory to identify any internal cracking or other defects that could affect the ultrasound testing results. Subsequently, it was planned how to segment the cores into specimen lengths as close to 10 cm as possible for testing; see Fig. B1 in Appendix B. At this stage, consideration was given to already-existing segmentation due to fracturing that occurred at the time of core extraction. The cores were then cut into the planned segments along the entire length using a stainless steel bandsaw, providing clean parallel surfaces at the end faces on either side for the subsequent ultrasound measurements in the longitudinal ice core direction. For measurements in the transverse core direction, each segment was again cut in the longitudinal direction on two parallel opposite sides, providing the required flat surfaces to apply the transducers. These two surfaces were 7.2±0.8 and 7.1±1.3 cm apart from each other for pancake and consolidated pack ice specimens, respectively. In order to determine the bulk density of the 43 specimens, their dimensions and weight were first measured in the cold laboratory at −10 ∘C, the latter using a handheld scale. The ultrasound testing was carried out less than 2 h after core extraction using a Proceq Pundit PL-200 testing kit (Screening Eagle Technologies, Schwerzenbach, Switzerland) with 250 kHz P- and S-wave transducers, assuming that the mechanical properties of the ice cores had not significantly changed by that time (Pustogvar and Kulyakhtin, 2016). A low-temperature silicon grease applied to the transducer faces ensured the best possible contact with the ice specimens for the transfer of P and S waves across the interface. Three separate tests were carried out for each specimen and direction.
The compressive strengths of the ice samples were determined using the GCTS PLT-2W wireless unconfined compression testing device (GCTS Testing Systems, Tempe, Arizona, USA). It has a virtually infinite stiffness by automatically correcting for the frame deformation based on the location of the top cross head and as a function of the axial load. Samples with a height of up to 13.5 cm can be accommodated. There are no constraints induced by the platens to avoid a triaxial state of stress. The cores were cut via a stainless steel bandsaw into multiple 13.5 cm long segments and immediately tested. In the interest of time to minimize brine drainage and alterations to ice composition, it was deliberately decided not to reduce the sample's diameter required for the optimal diameter : length ratio of 1:2.5 (Schulson and Duval, 2009). In total, 27 compression testing specimens were obtained from 12 pancake ice and 3 pack ice cores. Specimen dimensions and names are displayed in Appendix B in Fig. B2. The specimen naming convention is derived from the core names with an additional numbered postfix (S1–S6) indicating the consecutive specimen segmentation sequence starting from the top of the core. The compression testing commenced less than 2 h after core extraction. The uniaxial compression load was manually applied to the sample by a handpump with an approximate strain rate of to s−1.
An estimate of error in the measurement and registration of temperature, salinity, density, elastic properties and compression strength is less than 9 %, which for each case is significantly less than errors introduced by the variation in the ice structure and properties.
3.1 Temperature, salinity, porosity and density
The vertical temperature profiles for consolidated pack ice and pancake ice floes A, B and D illustrated in Fig. 6 exhibit a typical linear distribution with depth (Nakawo and Sinha, 1981; Petrich and Eicken, 2017). The temperature gradient of the first is considerably larger due to the lower atmospheric temperature on the day of sampling and testing. However, for pancake ice floe C, the temperature distribution is nearly constant and rather high temperature values were recorded, in particular toward the top core sections. Accordingly, its consistency was reported to be rather soft and poorly consolidated except for at the very top. A significant influence of the snow cover on this disparity can be ruled out as only minor snow cover was found as listed in Table 3 and shows only small variations between all four pancakes. The substantially increased temperatures and porous texture of pancake ice floe C are exhibited in particular in top and middle core sections; a potential explanation could therefore be overwashing that occurred during collection and subsequent vertical drainage. This is also further substantiated by the temperature measurements of the thin snow layers covering the four pancake ice floes performed on deck giving ∘C, which indicates overwashing as temperature should be closer to the measured atmospheric temperature of −8 ∘C. Furthermore, the snow temperatures do not link to their respective pancake ice floe temperature profiles, except pancake ice floe C. It has been reported from ice-floe-mounted SIMBA measurements of storm-caused ice floe flooding events that subsequent significant heat propagation occurred, increasing ice temperature from initially −8.5 ∘C at the top surface by about 3 ∘C down to 70 cm depth (Provost et al., 2017).
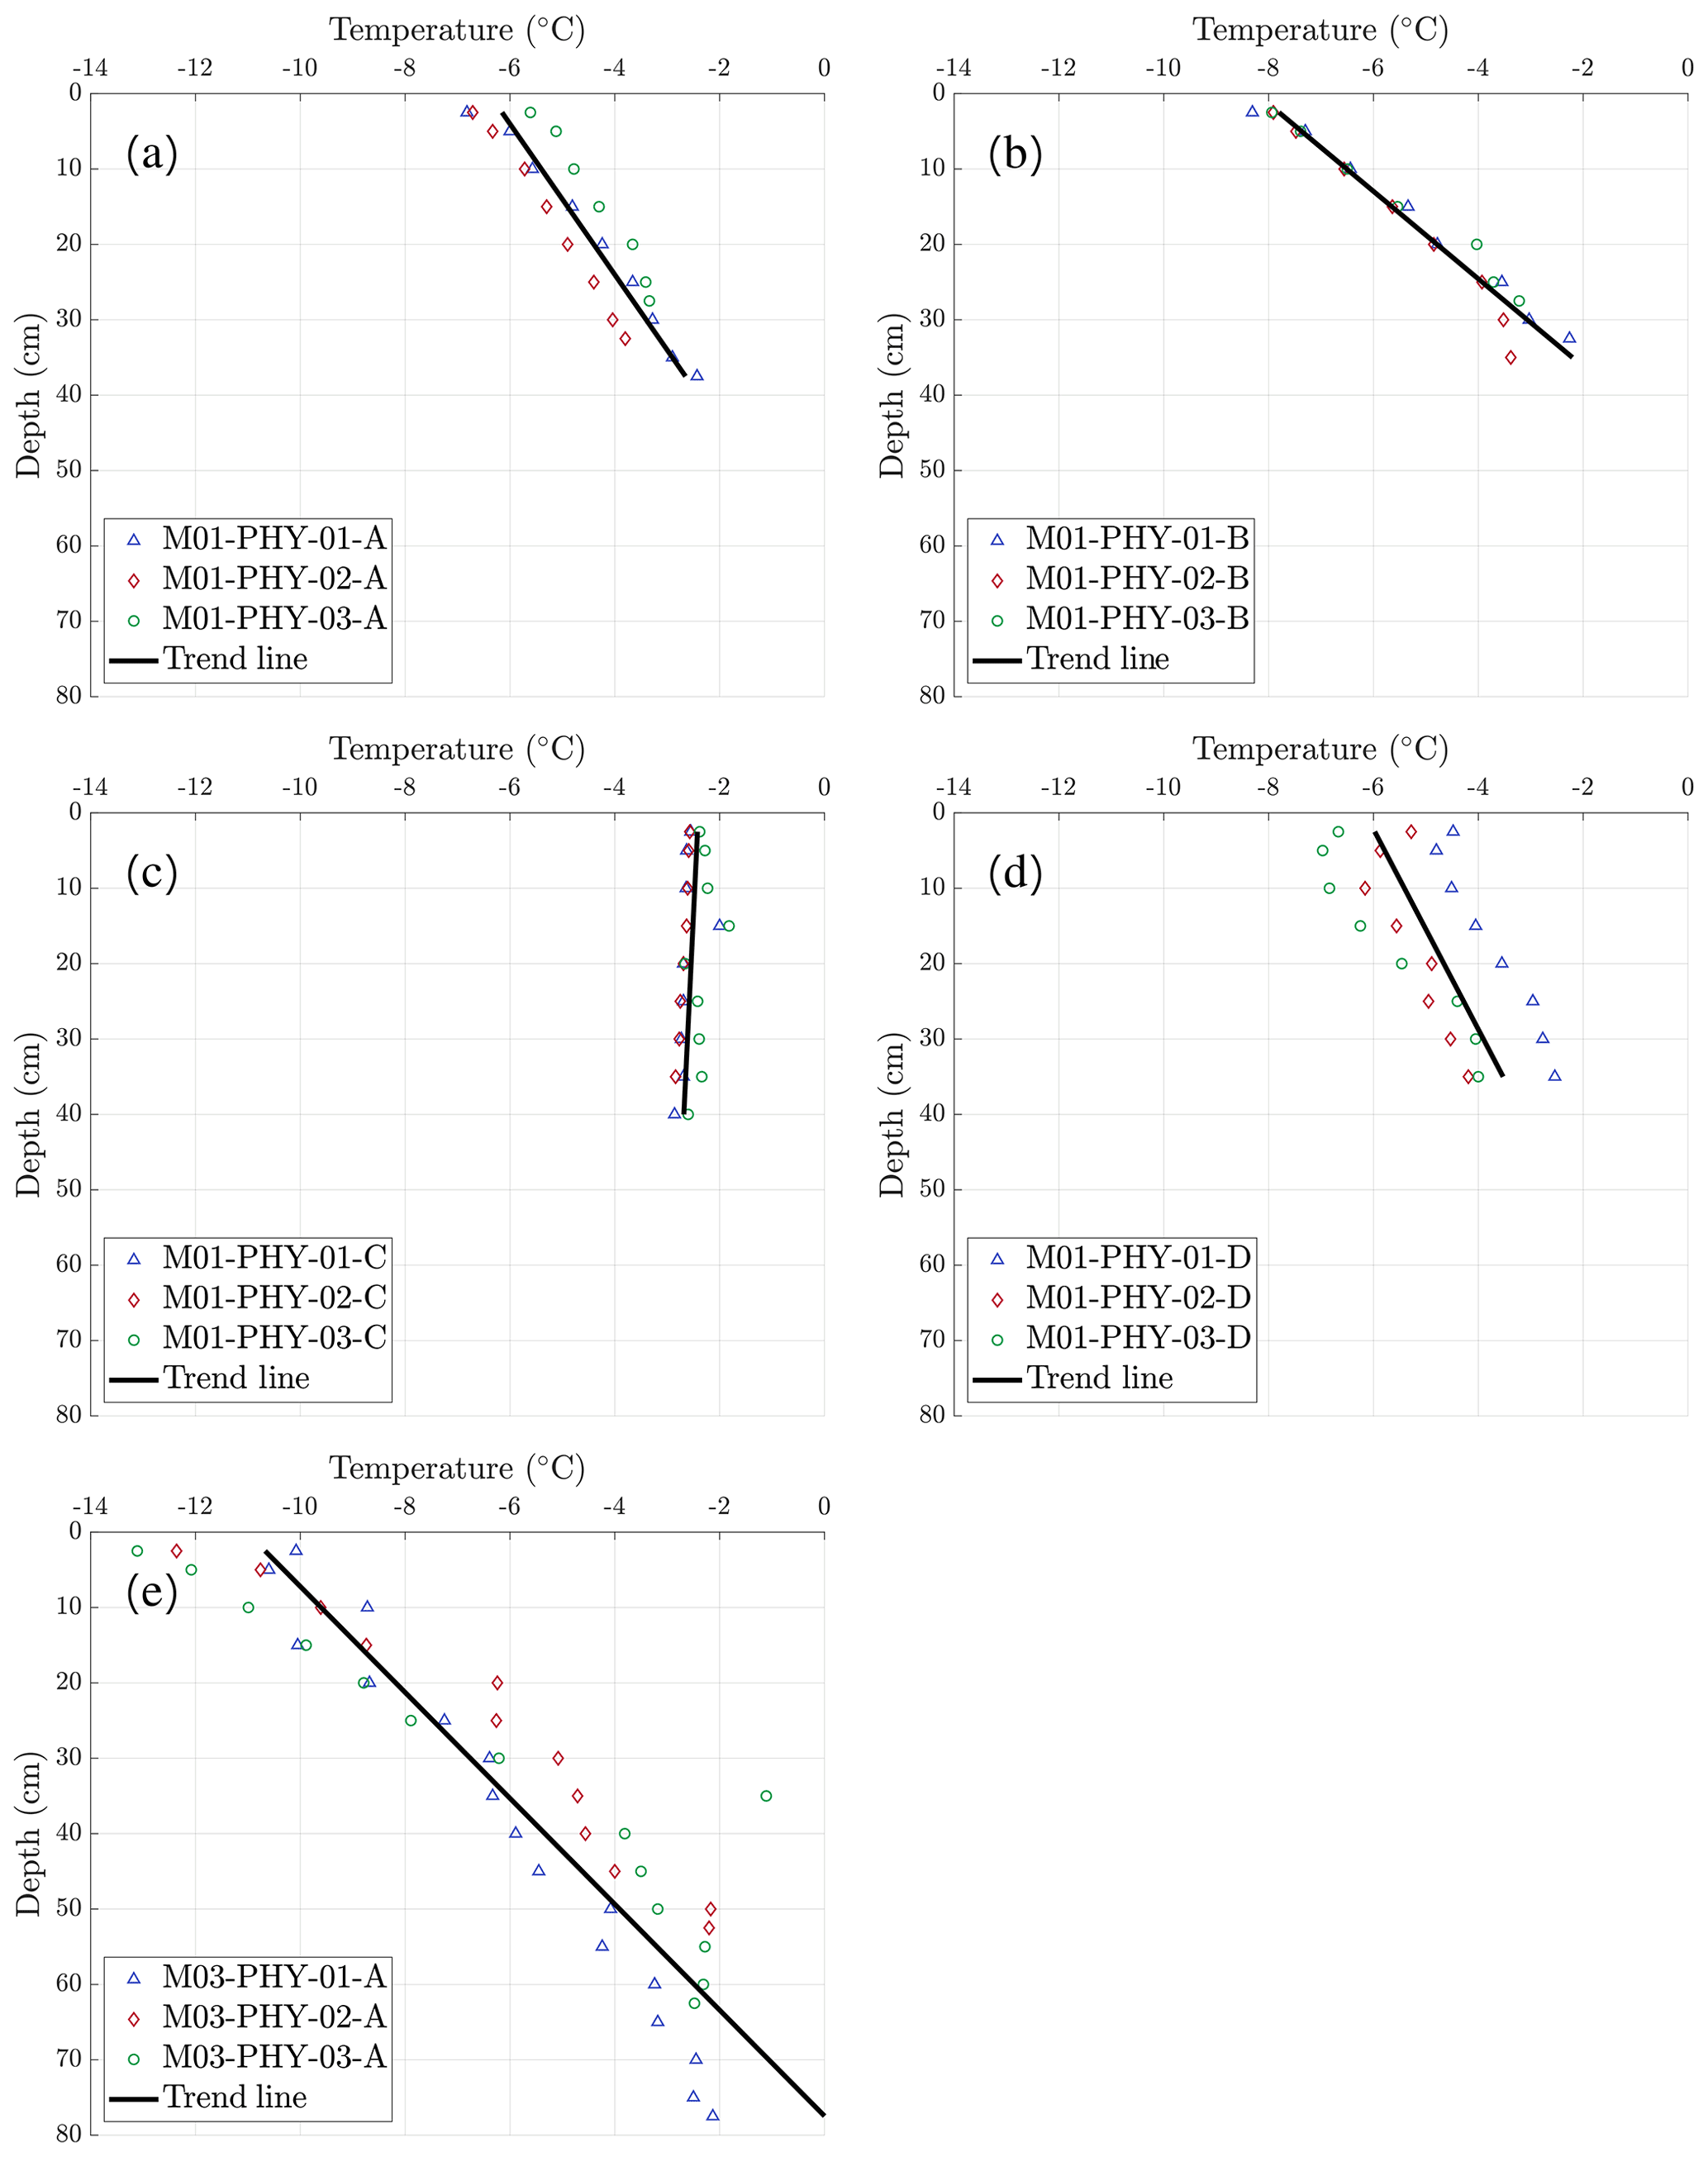
Figure 6Plots of temperature over sea ice depth for the four pancake ice floes (cores M01-PHY-01-A, M01-PHY-01-B, M01-PHY-01-C, M01-PHY-01-D, M01-PHY-02-A, M01-PHY-02-B, M01-PHY-02-C, M01-PHY-02-D, M01-PHY-03-A, M01-PHY-03-B, M01-PHY-03-C, M01-PHY-03-D) and for the consolidated pack ice (cores M03-PHY-01-A, M03-PHY-02-A and M03-PHY-03-A), respectively.
The boundary layer salinity of the ocean was determined as 33.29 and 34.11 PSU at MIZ3A and MIZ1D, respectively. The vertical salinity profile for the pancake ice floes depicted in Fig. 7 exhibits significantly higher values at the top of pancake ice floes with 12.6±4.9 PSU than below with 5.8±1.1 PSU. Comparable characteristics in terms of depth evolution and magnitude of salinity have been reported in the Weddell Sea by Eicken (1992), Doble et al. (2003) and Tison et al. (2017). The high salinity of the topmost core section is generally attributed to the high initial growth rate and lower permeability of fine-grained granular ice (Nakawo and Sinha, 1981). This can be confirmed by the stratigraphy of the cores of pancake ice floes A, B and C, which are entirely composed of granular ice as shown in Fig. 10. The obtained values compare to in situ data of congealed grease ice in an artificial lead by Smedsrud and Skogseth (2006). On the other hand, in situ experiments in the Arctic by Notz and Worster (2008) demonstrated that initially high salinity values at the topmost parts giving the characteristic C shape vanish due to gravity drainage within 48 h if the frazil ice layer is thin. This would explain the generally low salinity values at the top of the sampled consolidated pack ice of 4.4–7.4 PSU, where the topmost granular layer is only about 5 cm thick as shown in Fig. 10 and is immediately followed by a columnar layer.
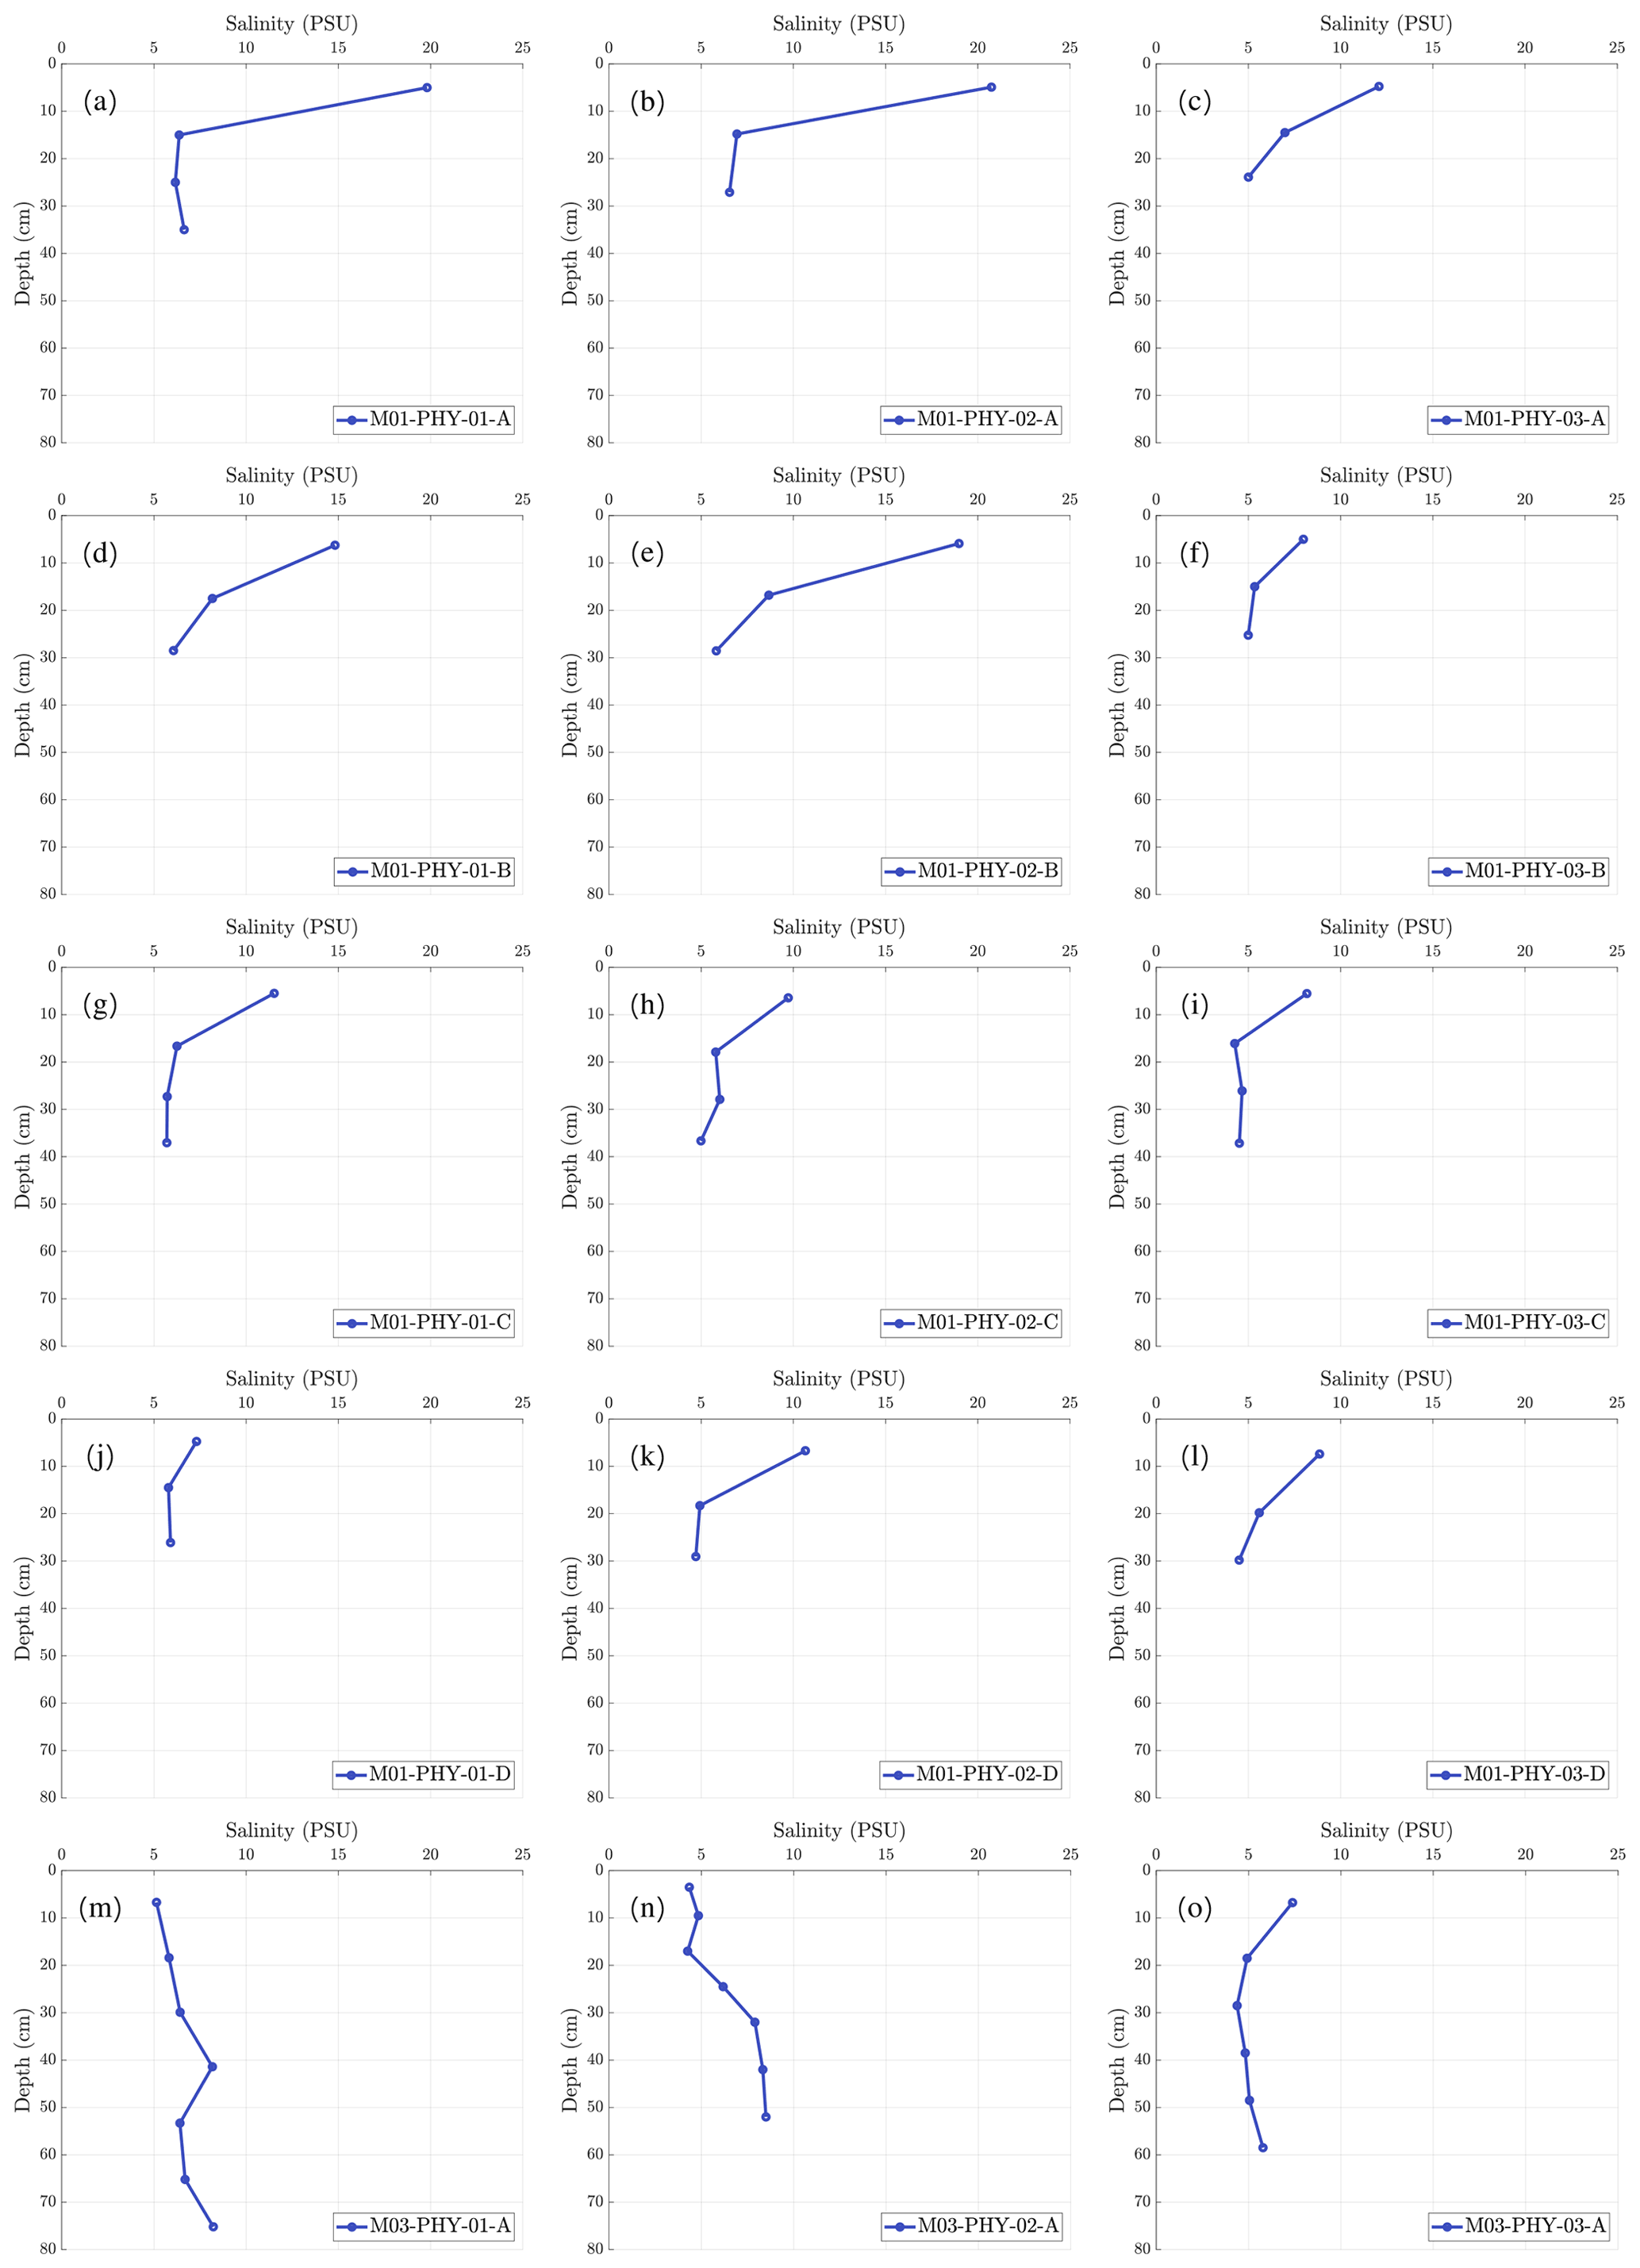
Figure 7Plots of salinity over sea ice depth for the four pancake ice floes (cores M01-PHY-01-A, M01-PHY-01-B, M01-PHY-01-C, M01-PHY-01-D, M01-PHY-02-A, M01-PHY-02-B, M01-PHY-02-C, M01-PHY-02-D, M01-PHY-03-A, M01-PHY-03-B, M01-PHY-03-C, M01-PHY-03-D) and for the consolidated pack ice (cores M03-PHY-01-A, M03-PHY-02-A and M03-PHY-03-A).
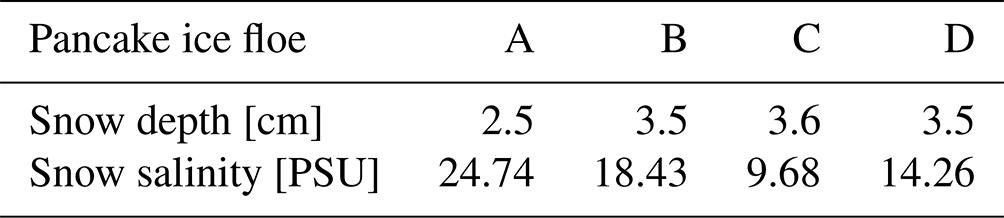
The snow depth and salinity measurements of the pancake ice floes are listed in Table 3. The snow salinity is noticeably higher than the salinity found at the topmost core sections of pancake ice floe A, B and D, pointing at surface flooding, which was also found for East Antarctic sea ice (Massom et al., 1998). For floe C the salinity measurements in snow and underlying ice are of a similar magnitude. The latter might be connected to significant overwashing and drainage that occurred during floe collection as mentioned before.
Figure 8Brine volume as a percentage of the total volume as a function of depth for pancake ice floes and consolidated pack ice at stations MIZ1D and MIZ3A, respectively. The shading indicates the 90th-percentile confidence intervals.
Due to brine drainage, the computed brine volume in consolidated pack ice is generally lower than in pancake ice (Notz and Worster, 2008), which is confirmed by the computed brine volume data illustrated in Fig. 8. The pancake ice brine volumes obtained are above the permeability threshold of 5 %, which has also been found by Tison et al. (2017) in the MIZ of the Weddell Sea. As the measured salinity in consolidated pack ice is fairly constant with 6.0±1.5 PSU, the brine volume increases with temperature and depth (r=0.866, n=20, p<0.001). The opposite is found for pancake ice where the brine volume clearly decreases with depth (, n=40, p=0.016) as the salinity values at the topmost sections are significantly higher compared to the lower sections. However, it should be noted that significant brine loss has been observed during sampling, in particular, when the pancake ice floes were lifted out of the ocean and placed on the deck of the ship. As such the actual salinity and relative brine volume of the sampled pancake ice would be higher and the actual bulk density lower than reported in Figs. 7–9, in particular for the bottom of the ice. This aspect has also been observed by Eicken (1992). Using the empirical relation by Frankenstein and Garner (1967) (Eq. 1), only the uncertainty in salinity measurements negatively impacts on the accuracy of the relative brine volume computation as the temperature measurements reflect in situ conditions.
Figure 9Bulk density as a function of depth for pancake ice floes and consolidated pack ice at stations MIZ1D (cores M01-US-01-A, M01-US-01-B, M01-US-01-C, M01-US-01-D, M01-US-02-A, M01-US-02-B, M01-US-02-C, M01-US-02-D) and MIZ3A (cores M03-US-01-A and M03-US-02-A), respectively. The shading indicates the 90th-percentile confidence intervals.
Determining sea ice density in the field aboard a ship is generally less accurate than under controlled laboratory conditions on land due to a higher degree of measuring errors with regards to specimen dimensions and weight. Considering that the density values for pancake ice illustrated in Fig. 9 are with 879±53.5 kg m−3 noticeably lower than that of pure ice, a significant air volume fraction is indicated, which can be partly attributed to prior brine loss that occurred during ice sampling as previously mentioned. For the consolidated pack ice, measurement errors and a small sample size in combination yield a bulk density trend line which is not plausible for the top parts as it would correspond to very high salinity values which have not been observed. There is no significant correlation between density and depth for pancake ice (, n=32, p=0.576) and pack ice (, n=11, p=0.192).
3.2 Texture and fabrics
Three different ice textures can be identified in the cores, namely granular, transitional and columnar. Granular textures, associated with the initially formed frazil ice and also meteoric ice (Massom et al., 1998), have the smallest crystal grain sizes (Eicken, 1998). Granular ice of meteoric origin is due to snow deposited on pancake ice floes mixing with ocean water through percolation for sufficiently heavy snow loading or overwashing; the latter is a common phenomenon in the Ross, Amundsen, Bellingshausen and Weddell seas (Eicken et al., 1995; Jeffries et al., 1994; Sturm et al., 1998). The proportion of snow ice is significant in particular in Antarctic sea ice due to abundance of precipitation and severe sea states (Bromwich et al., 2004; Jeffries et al., 2001; Lange et al., 1990; Worby et al., 1998). Columnar ice textures display large, elongated crystals, while transitional textures display a mixture of granular and columnar textures; thus the defining features of transitional ice are small crystals that are beginning to elongate and lengthen into the distinctly columnar ice.
A summary of the fraction of ice textures found to be present in each core along with their respective crystal sizes is found in Table 4, while the stratigraphy diagrams are illustrated in Fig. 10. The stratigraphy diagrams are a summary showing the vertical layering of the ice textures within the sampled sea ice.
Table 4Summary of the sea ice core textures. μ specifies the 95th-percentile confidence intervals.
The pancake ice floes A, B and C are completely comprised of granular ice as shown in Fig. 10, which is expected of young pancake ice found at the edge of the Antarctic marginal ice zone where frazil ice generation is prevalent due to the harsh sea states in winter (Lange and Eicken, 1991). It is known from in situ observations in the Arctic that the grease ice layer thickness can reach more than 40 cm before congealing under turbulent and dynamic conditions characterized by convective overturning and wind-driven frazil accumulation (Smedsrud and Skogseth, 2006).
Pancake ice floe D also displays transitional ice textures, indicating the beginning of downward freezing due to calmer sea state and wind conditions (Weeks and Ackley, 1982). The variability in the pancake ice floes is hard to quantify with regards to their internal composition due to their young age. The size range of the granular crystals varies, with pancake ice floes A and C being statistically dissimilar.
Figure 10Stratigraphy diagrams for consolidated pack ice core M03-CP-01-A (WMIZ 3) and pancake ice cores M01-CP-01-A (WMIZ 1-A), M01-CP-01-B (WMIZ 1-B), M01-CP-01-C (WMIZ 1-C) and M01-CP-01-D (WMIZ 1-D).
The consolidated pack ice core clearly indicates the presence of different layers and is found to be made up of 84 % granular crystals. Predominantly granular sea ice textures are characteristic for the Weddell Sea region as reported in the literature (see, for example, Lange and Eicken, 1991; Tison et al., 2017). As previously mentioned, this is generally indicative of fairly turbulent ice growth conditions leading to significant frazil ice generation. Small bands of columnar and transitional ice textures were found sandwiched between granular ice, which is typical of young ice grown in a highly dynamic ocean environment where regularly occurring atmospheric storms can interrupt steady growth of the ice, causing ice crystals and grain structures to vary in type, size and orientation during the growth period of the ice (Lange and Eicken, 1991; Carnat et al., 2013; Shokr and Sinha, 2015).
3.3 Elastic properties
In order to allow for the direct comparison of ice stiffness and strength with relative brine volume, the latter is recomputed via Eq. (1) using the actual ice temperature of a constant −10 ∘C when being processed in the cold laboratory instead of the in situ-measured temperature distribution. The resulting relative brine distribution with depth is depicted in Fig. 11. The uniform temperature distribution over depth does not affect the general trend of porosity over depth when compared with Fig. 8. However, it yields noticeably lower porosity values for pancake ice at the top and for consolidated pack ice at the bottom.

Figure 11Brine volume for a uniform ice temperature of −10 ∘C as a percentage of the total volume as a function of depth for pancake ice floes (, n=40, p<0.001) and consolidated pack ice (r=0.508, n=20, p=0.022) at stations MIZ1D and MIZ3A, respectively. The shading indicates the 90th-percentile confidence intervals.
The vertical distributions of dynamic Young's and shear moduli measurements over depth for consolidated pack ice and pancake ice are shown in Figs. 12 and 13, respectively. For the pancake ice, there is no significant correlation between Young's modulus and depth in the longitudinal direction (r=0.120, n=32, p=0.513) and in the transverse direction (r=0.078, n=32, p=0.673). Equally, there is no significant positive correlation between the shear modulus and depth in the longitudinal direction r=0.115, n=32, p=0.531) and in the transverse direction (r=0.045, n=32, p=0.809). For consolidated pack ice, there is no significant negative correlation between Young's modulus and depth in the longitudinal direction (, n=11, p=0.207); however, there is a significant correlation in the transverse direction (, n=11, p=0.024). Similarly, there is no significant correlation between the shear modulus and depth in the longitudinal direction (, n=11, p=0.192), but there is a significant correlation in the transverse direction (, n=11, p=0.026). As the brine volume increases with depth for consolidated pack ice as shown in Fig. 11, the correlation for Young's modulus over depth is in line with what has been reported in the literature; see for example Langleben and Pounder (1963), Mellor (1986), and Moslet (2007).

Figure 12Longitudinal and transverse Young's modulus for pancake ice cores M01-US-01-A, M01-US-01-B, M01-US-01-C, M01-US-01-D, M01-US-02-A, M01-US-02-B, M01-US-02-C and M01-US-02-D as well as consolidated pack ice cores M03-US-01-A and M03-US-02-A as a function of depth from the top of the ice. The shading indicates the 90th-percentile confidence intervals.
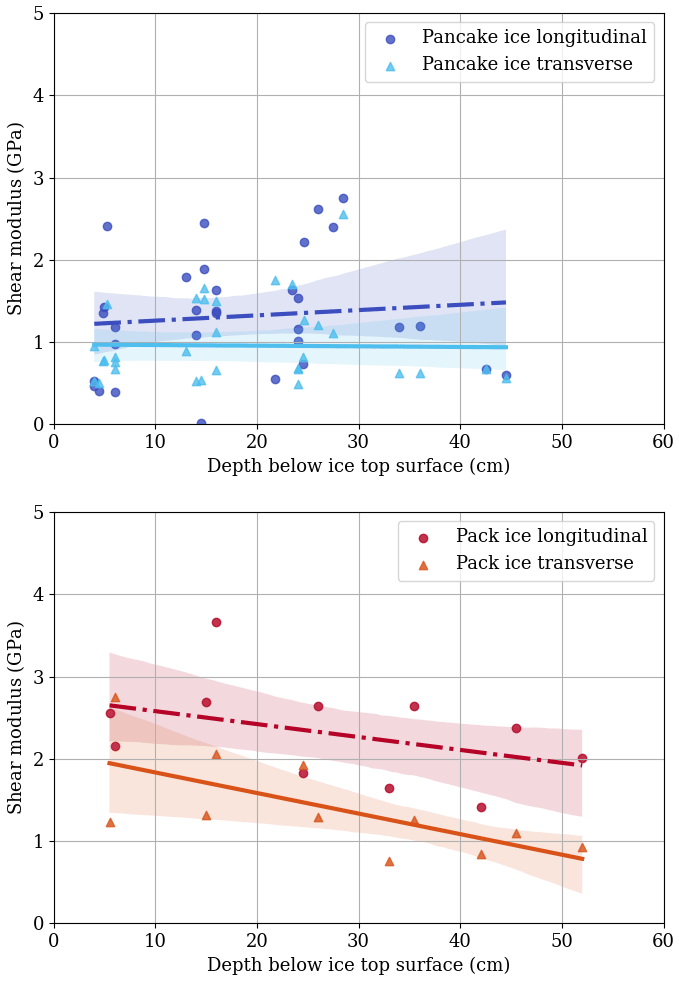
Figure 13Longitudinal and transverse shear modulus for pancake ice cores M01-US-01-A, M01-US-01-B, M01-US-01-C, M01-US-01-D, M01-US-02-A, M01-US-02-B, M01-US-02-C and M01-US-02-D as well as consolidated pack ice cores M03-US-01-A and M03-US-02-A as a function of depth from the top of the ice. The shading indicates the 90th-percentile confidence intervals.
With substantially lower brine values as shown in Fig. 11, the elastic properties found for consolidated pack ice exhibit higher values than for pancake ice, in particular for the upper core sections, with values in the longitudinal direction of 6.4±1.6 and 2.3±0.6 GPa for Young's and shear moduli, respectively, as opposed to 3.7±2.0 and 1.3±0.7 GPa, respectively. Also, the textural differences between both ice types can be expected to contribute to this discrepancy. The stratigraphical data found for consolidated pack ice (Fig. 10) indicate granular layers intermixed with transitional and columnar layers located in the upper half of the core, whereas pancake ice is almost exclusively granular. The dynamic Young's and shear moduli for both ice types are generally lower than reported in the literature for columnar first-year ice at low brine volumes given as 9.0–9.5 GPa (Mellor, 1986) and 3.0–3.5 GPa (Snyder et al., 2015), respectively. For the consolidated pack ice, this is most likely due to the high granular ice content as temperature and salinity values are comparable.
In the sea ice studies by Sinha (1984) and Nanthikesan and Sunder (1994) based on the experiments by Dantl (1969) as well as Gammon et al. (1983), polycrystalline sea ice is found to exhibit only a very slight directional dependency in terms of elastic material properties. In contrast, the results shown in Figs. 12 and 13 indicate a significant difference in elastic moduli measured in longitudinal and transverse core directions, in particular for the consolidated pack ice where the latter was determined as 3.8±1.5 and 1.4±0.6 GPa for Young's and shear moduli, respectively. Based on the previous studies mentioned before, the finding of directional dependence of elastic properties at this magnitude is unprecedented, in particular considering the predominantly granular ice composition. The pore and channel structure might be of influence, which, for consolidated pack ice, can be expected to increase with depth, leading to the formation of predominantly vertically aligned brine channels which potentially alter the directional dependency of elastic ice properties with depth.
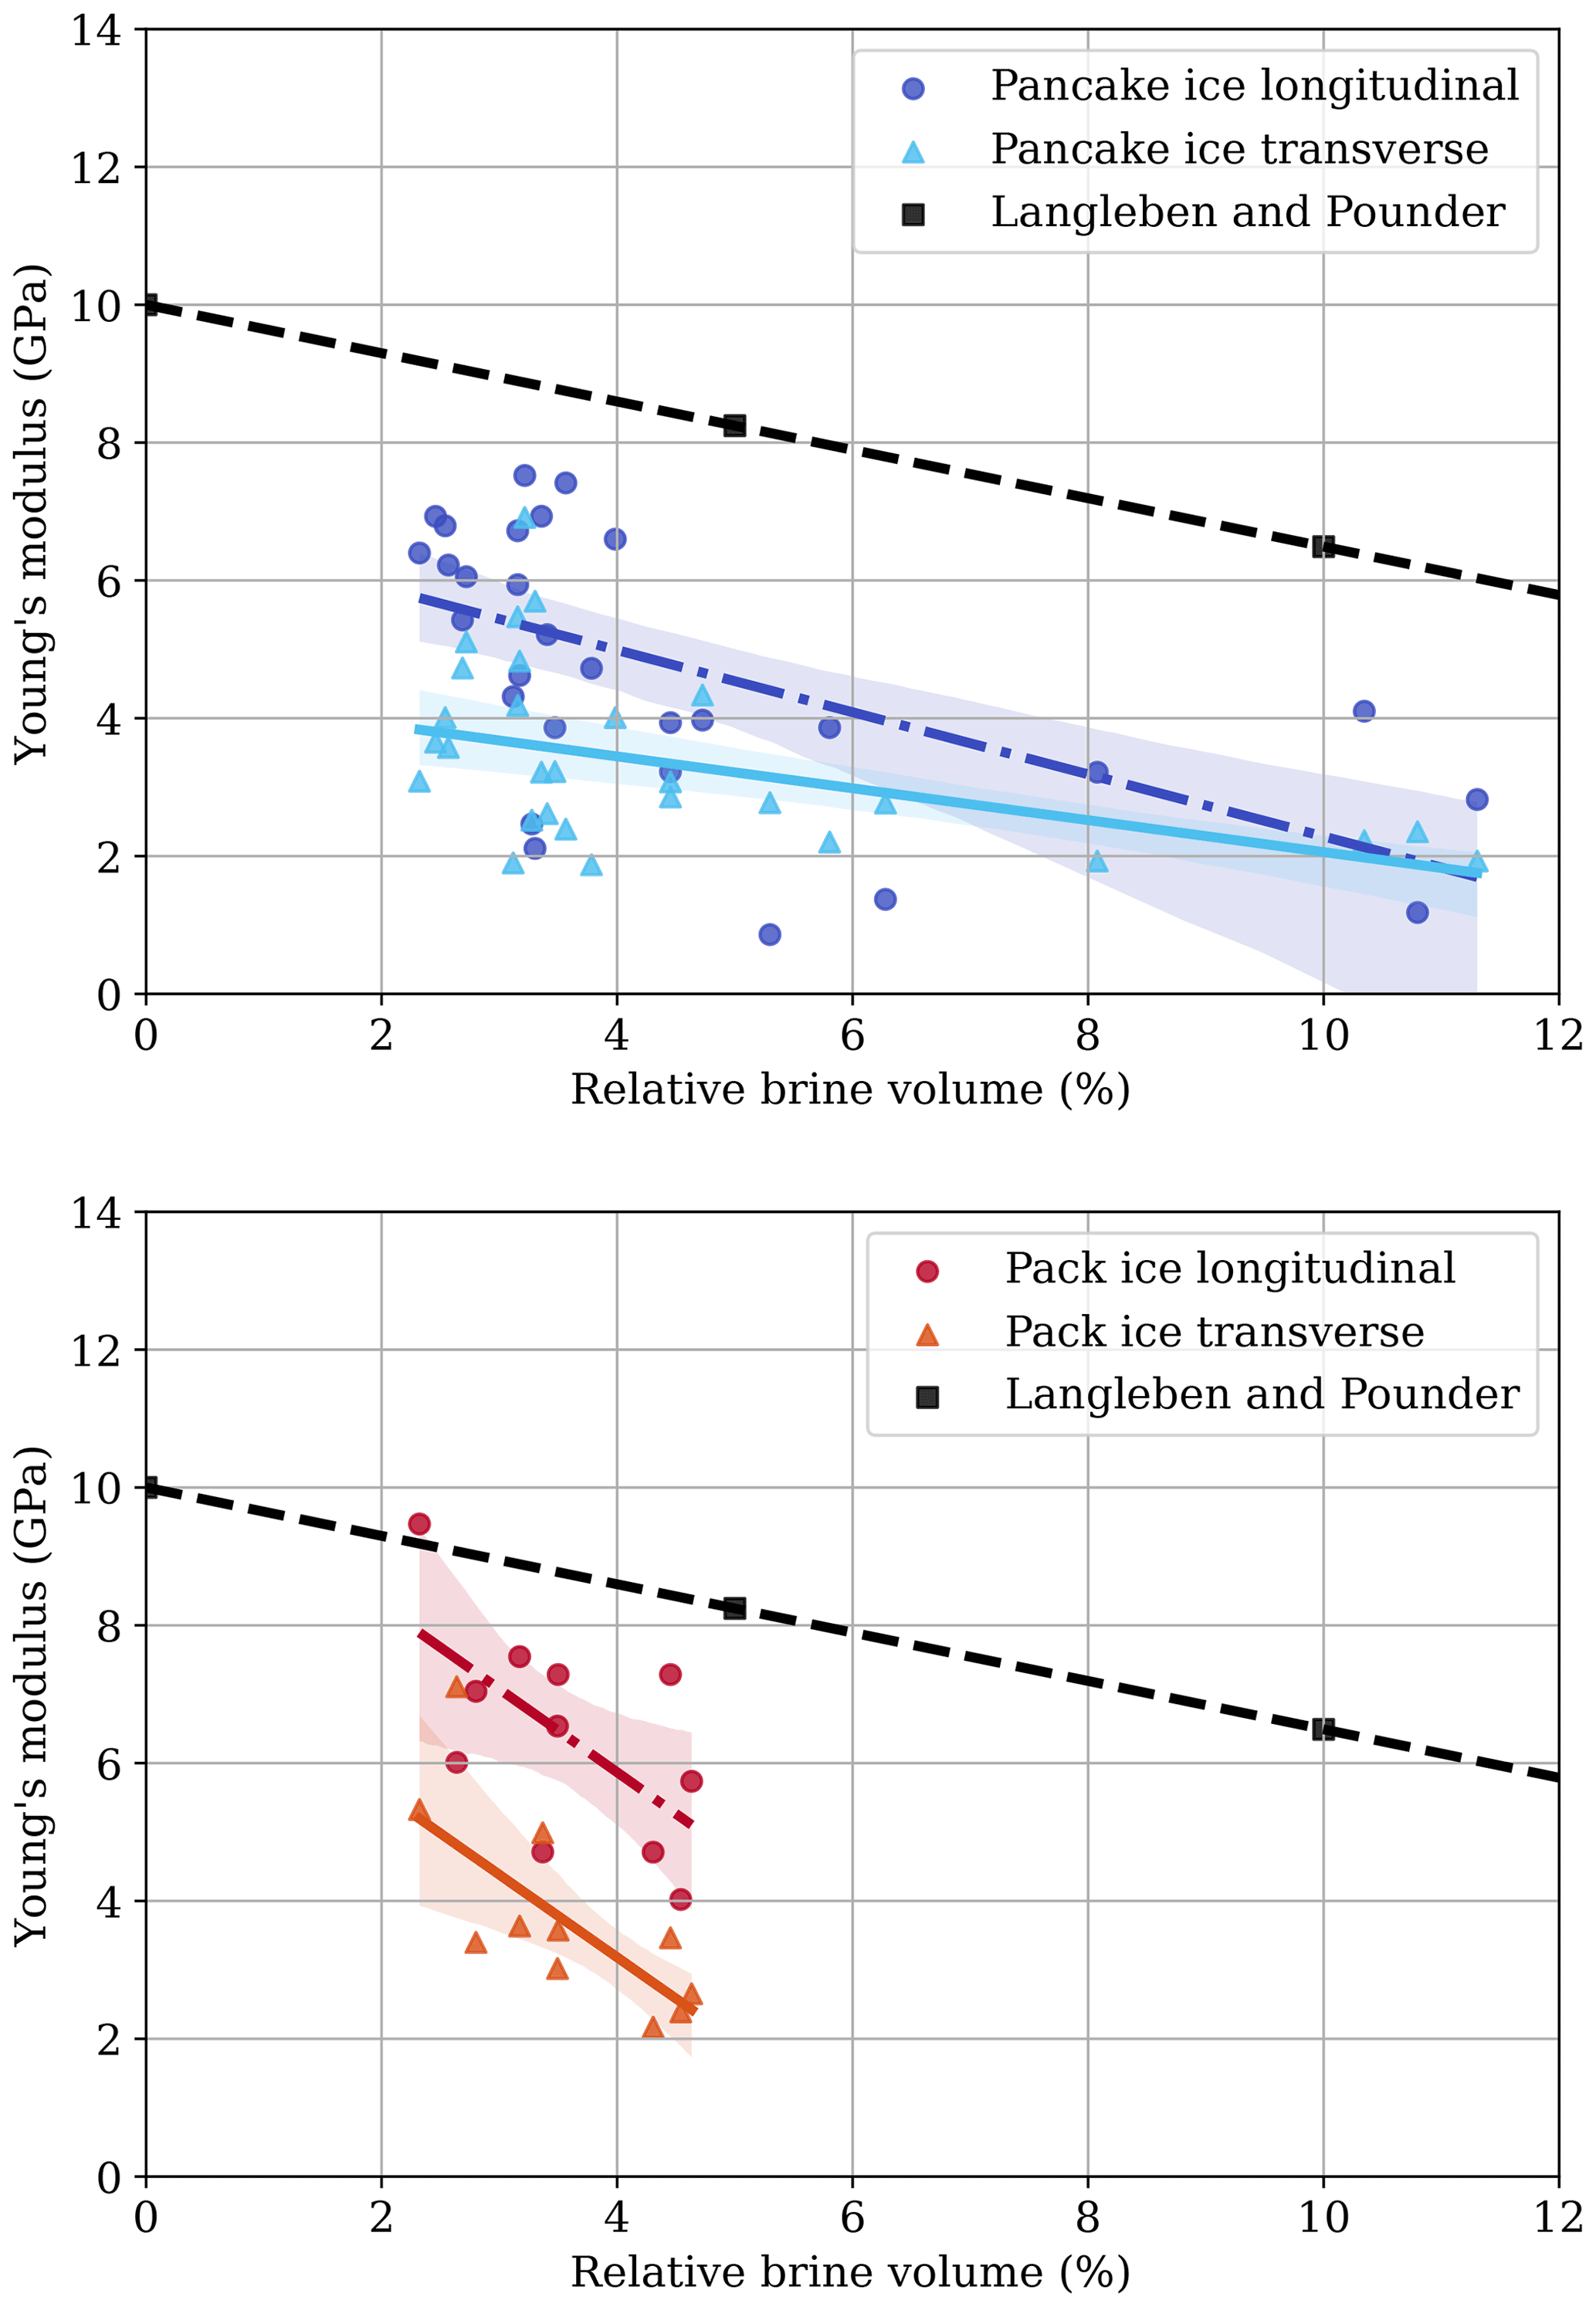
Figure 14Longitudinal and transverse Young's modulus for pancake ice cores M01-US-01-A, M01-US-01-B, M01-US-01-C, M01-US-01-D, M01-US-02-A, M01-US-02-B, M01-US-02-C and M01-US-02-D as well as consolidated pack ice cores M03-US-01-A and M03-US-02-A as a function of the percentage porosity of the total volume. The shading indicates the 90th-percentile confidence intervals. “Langleben and Pounder” refers to Langleben and Pounder (1963).
Combining brine volume and Young's modulus datasets presented in Figs. 11–13, the dependency of Young's modulus on the relative brine volume is obtained as shown in Fig. 14. There is a significant correlation between Young's modulus and brine volume for pancake ice in the longitudinal direction (, n=29, p=0.001) and in the transverse direction (, n=29, p=0.007). For consolidated pack ice, there is also a significant correlation between Young's modulus and brine volume in the longitudinal direction (, n=11, p=0.053) and in the transverse direction (, n=11, p=0.009). A remarkable aspect of the obtained data is the noticeable directional dependency of the stiffness–porosity relation as Young's modulus, in particular in the transverse direction, follows distinctly lower trend lines in terms of magnitude than predicted by the relation found by Langleben and Pounder (1963) for Arctic columnar ice, indicated by the dashed black line in Fig. 14 and expressed as
where Vb [%] denotes the brine volume. A closer match with the curve by Langleben and Pounder (1963) could be expected for the stiffness–porosity data in the longitudinal direction for the pancake floe ice if no brine loss had occurred during sampling. However, the brine loss for the consolidated pack ice was less substantial. As such, textural differences between the sampled predominantly granular Antarctic sea ice and the columnar Arctic sea ice appear to be of significance.
3.4 Compressive strength
Compressive strength of Antarctic sea ice, specifically in winter, has only been studied by Urabe and Inoue (1988a), but the testing was done after a long storage time at −20 ∘C. In contrast, the compressive stress–time plots for the 15 cores displayed in Fig. 15 were obtained in situ within 2 h of collection. The uniaxial compressive strengths for pancake ice and consolidated pack ice were determined as 2.3±0.5 and 4.1±0.9 MPa, respectively. All tests shown in Fig. 15 are characterized by ductile failure behaviour with initial strain hardening and significant strain softening after the peak stress was reached. For columnar ice, Kuehn and Schulson (1994) found the ductile–brittle failure transition at a strain rate of s−1. However, it was stated to be 1 order of magnitude higher for granular ice, which can be confirmed by our results that were obtained at a strain rate of s−1.
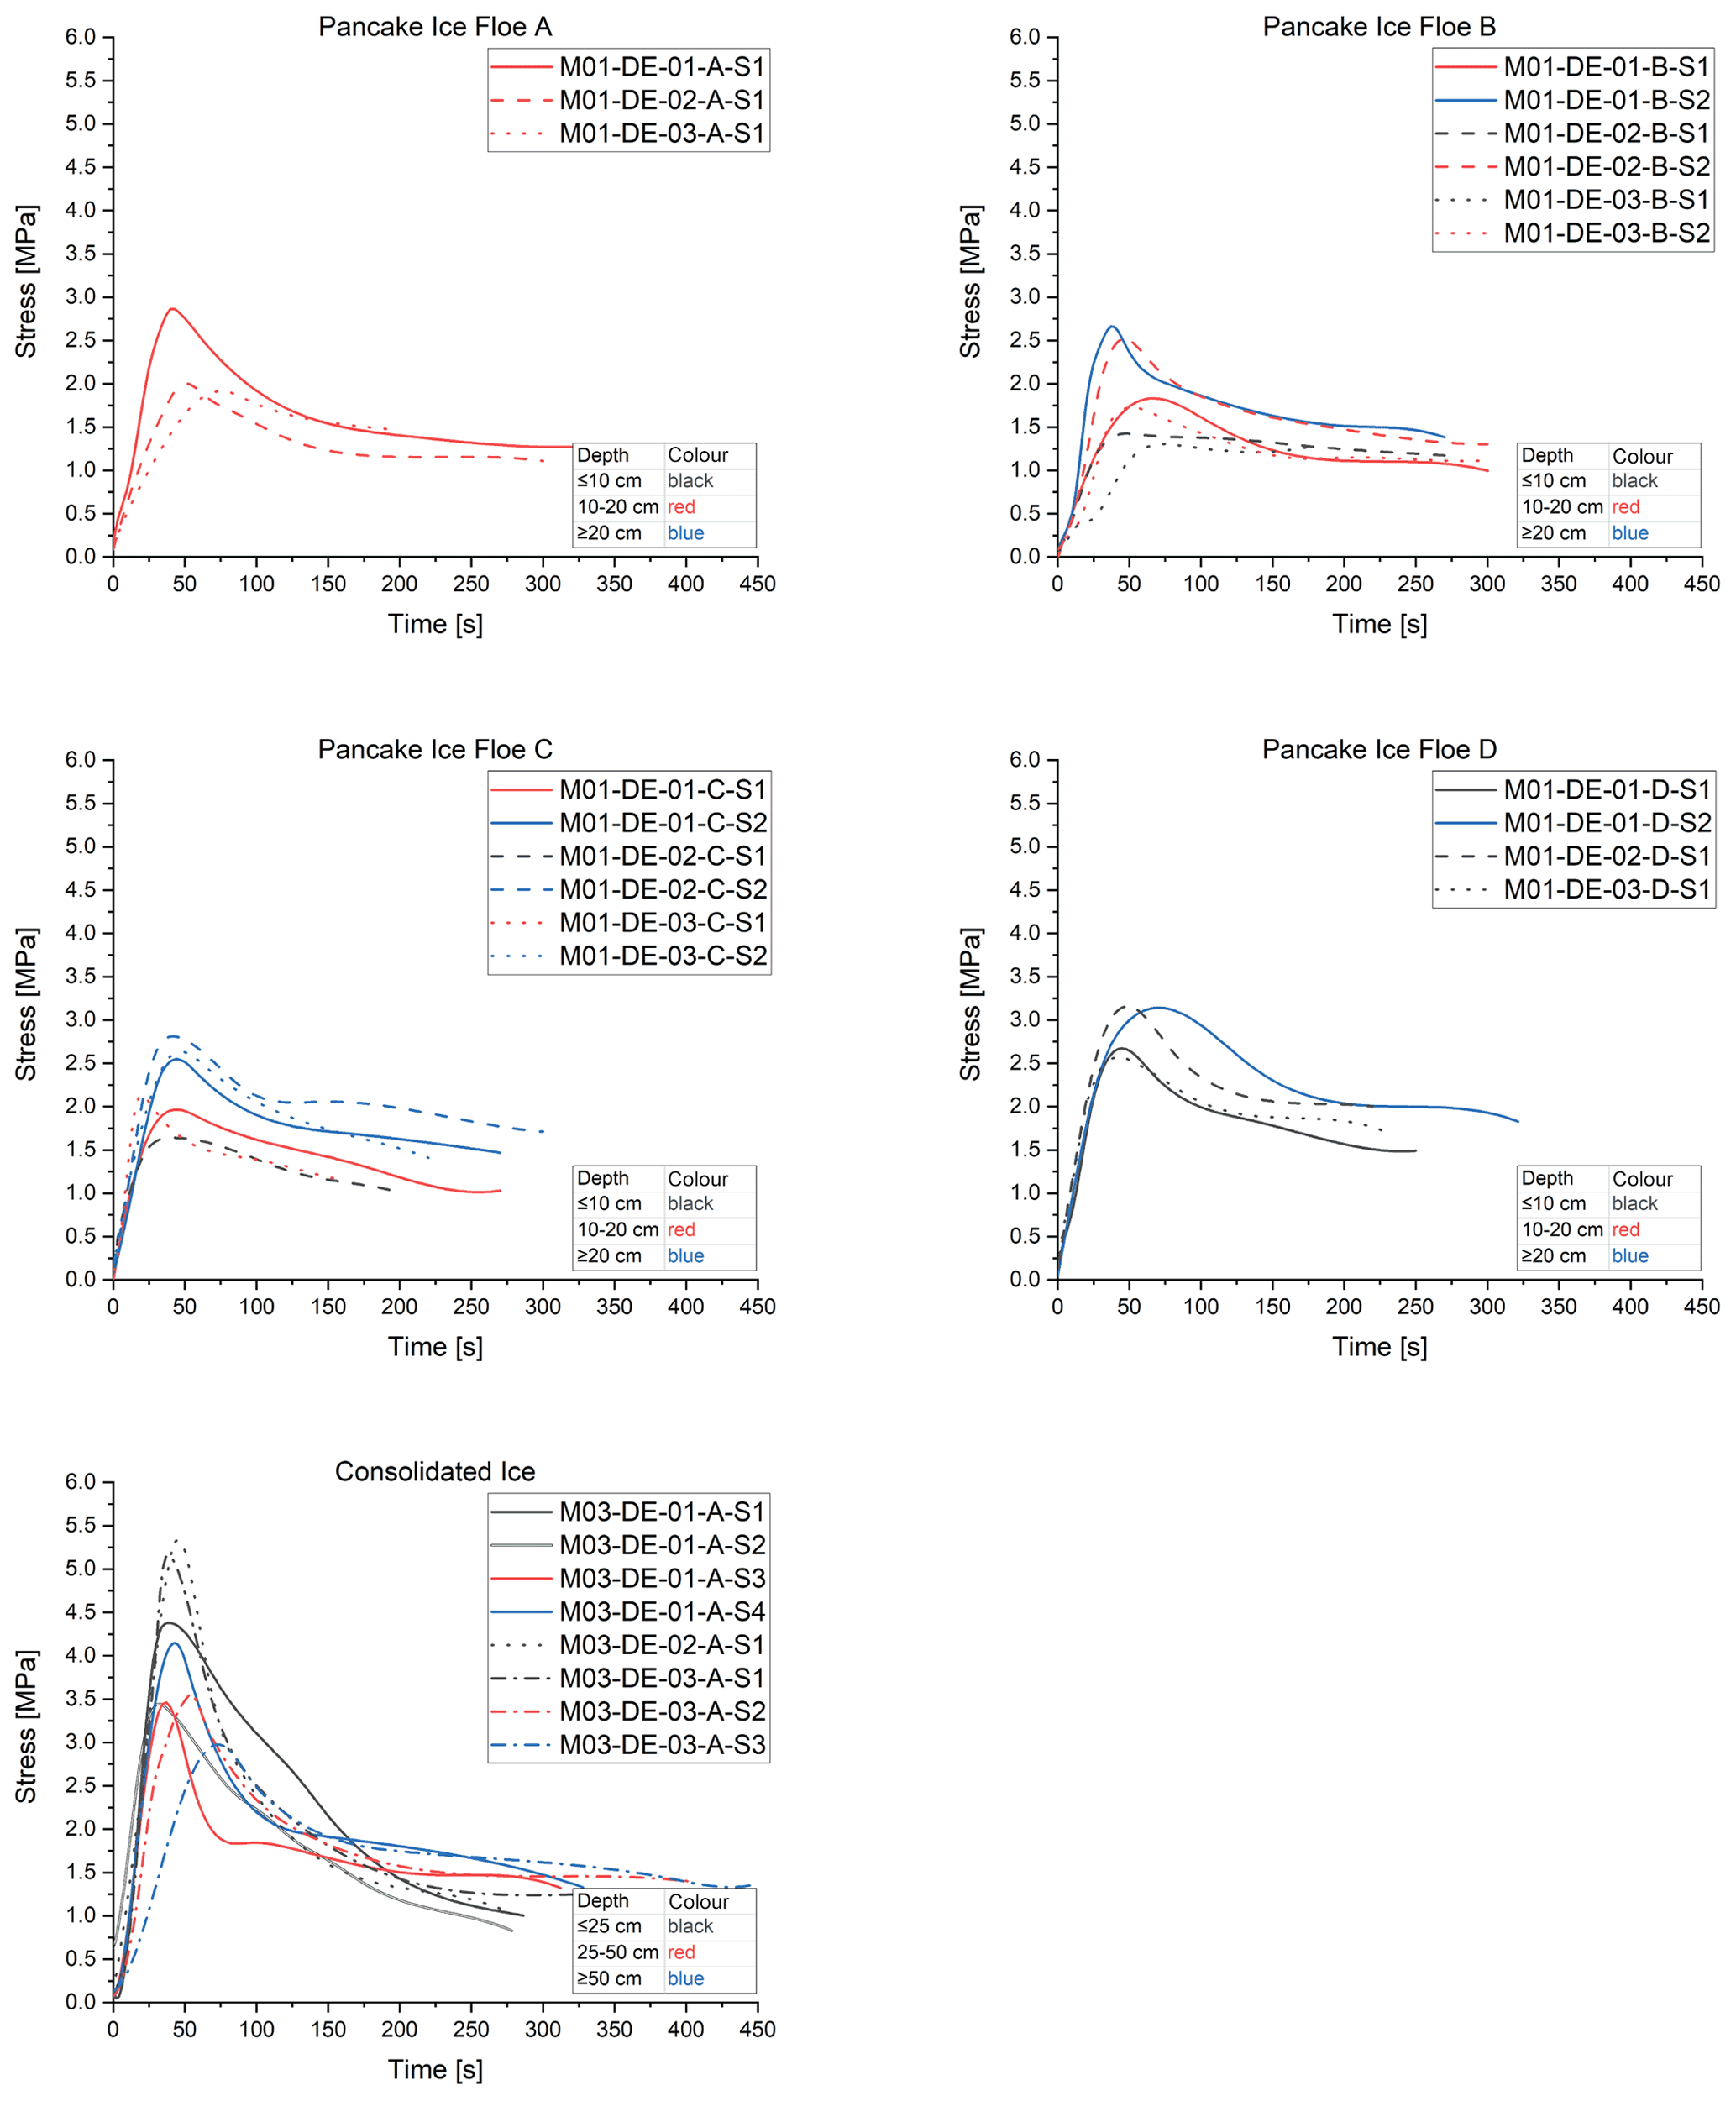
Figure 15Stress–time plots of uniaxial compression test results for all specimens, the respective pancake ice floes and consolidated pack ice. The colour coding refers to the sample depth in centimetres along the core length measured at the sample centre and the line style to the specific core.
The Antarctic sea ice compressive strength results by Urabe and Inoue (1988a) of about 8.5 MPa for vertical tested samples at a strain rate of around s−1 are higher than our strength measurements for consolidated pack ice. However, they tested land-fast sea ice. The compression strength data by Kivimaa and Kosloff (1994) obtained in the Weddell Sea in situ in spring are in the range from 1.2 to 4.5 MPa at a strain rate of s−1, which, despite the brittle failure regime, is lower than the consolidated pack ice data obtained in this study.
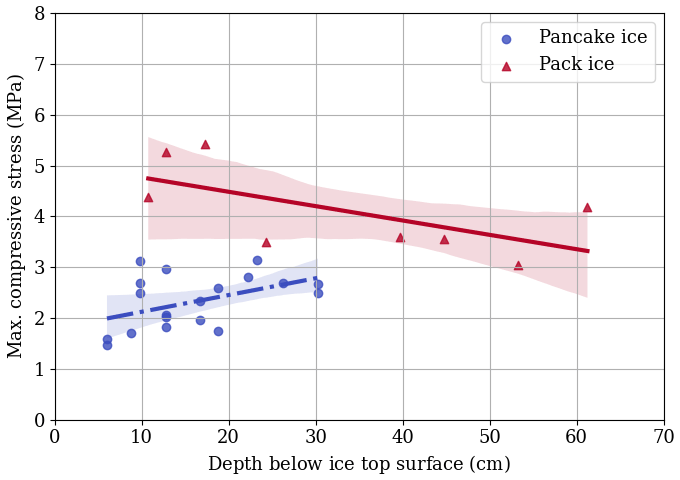
Figure 16Maximum uniaxial compressive stress for pancake and pack ice over depth with the 90th-percentile confidence intervals indicated.
It is known from the literature that an increase in ice temperature results in a lower compressive strength due to increasing porosity (Han et al., 2015; Kermani et al., 2007; Moslet, 2007). This linkage can be confirmed for the tested consolidated pack ice considering the depth evolution of both the increasing relative brine volume illustrated in Fig. 11 and the decreasing maximum stress (, n=8, p=0.093) depicted in Fig. 16. Similarly, for the tested pancake ice, the relative brine volume decreases with depth, whereas the maximum uniaxial compressive stress increases (, n=19, p=0.052). The increase in pancake ice compressive strength over depth can be fitted by the following linear trend line:
where d denotes the depth in metres. This discrepancy between the tested consolidated pack and pancake ice can be explained by the high salinity values and brine volumes at the top of the pancake ice floes, which show the opposite trend compared with the consolidated pack ice as illustrated in Fig. 11. Kovacs (1997) proposed a relation based on the total porosity and strain rate to estimate the compressive strength of Arctic first-year sea ice. Figure 17 compares this relation with the measured compressive strength of pancake ice and consolidated pack ice, making use of the porosity data given in Fig. 11. The compressive strength clearly shows lower magnitudes than expected by the relation derived by Kovacs (1997), in particular for the pancake ice samples. This can be partly attributed to the previously mentioned brine loss at sampling, which has been more significant for the pancake ice floes than for consolidated pack ice. However, differences between Arctic and Antarctic ice compositions in terms of texture and fabrics might also play a role, warranting further studies in this regard.

Sinha (1984) reported an increasing ice strength with depth in horizontally tested hummock ice of an old floe. Kivimaa and Kosloff (1994) as well as Urabe and Inoue (1988a) found that the maximum compressive strength was reached in a middle layer of the ice sheet. In the study by Frederking and Timco (1983), a difference was also observed between the top layer and bottom layer, where the latter exhibits a larger strength magnitude. This is in contrast to our findings regarding consolidated pack ice, which is strongest at the top and exhibits decreasing strength toward the middle layer due to the increasing brine volume with depth.
Both the consolidated pack ice and the pancake ice investigated in this study are relatively young first-year ice and were collected in the Antarctic MIZ during the winter season when sea ice was advancing and was exposed to high temperature gradients. In this sense, their measured strength properties are not directly comparable to those mentioned before.
The collected datasets of young first-year ice combined physical, textural and mechanical in situ test results of solitary pancake ice floes and consolidated pack ice representing a vertical 150 km transect into the advancing Antarctic marginal ice zone along the Good Hope Line. Of particular interest was elucidating the transition between both ice types within the MIZ in terms of their differences in mechanical stiffness and strength properties as linked to physical and textural characteristics at early-stage ice formation.
Both ice types exhibited a characteristic linear temperature profile with depth and had predominantly granular textures, for pancake ice almost exclusively, due to the highly dynamic ocean environment. Pancake ice floe C, however, had an almost constant and fairly high temperature distribution, which was attributed to overwashing during collection and subsequent vertical drainage. The pancake ice salinity profile exhibited very high magnitudes at the topmost sections and in the snow cover. Accordingly, overwashing and flooding events are a reasonable explanation for the generally high pancake ice salinity at the topmost sections, in particular, as the consolidated pack ice had a very low salinity value at the top that slightly increased toward the bottom, where recent flooding events can be excluded. Due to the relatively high porosity and brine loss that occurred during sampling of pancake floe ice, the recorded bulk salinity, relative brine volume and density can be assumed to be lower than they were in situ. Discrepancies with regards to in situ conditions can therefore also be expected for the physical and mechanical pancake ice properties as obtained at −10 ∘C in the cold laboratory aboard the ship. Although these differences do not affect the general depth trends of ice porosity and mechanical properties, they highlight the need to develop new effective methods facilitating testing in situ and minimizing methodological errors.
The dynamic Young's and shear moduli measured for consolidated pack ice were substantially lower than reported in the literature for first-year ice. The elastic properties of pancake ice were even lower in magnitude due to the high brine volume content and higher temperatures. A similar trend could be observed for the uniaxial compression strength, which was found to be lower than reported by the only available source in the literature for winter Antarctic sea ice, albeit land-fast (Urabe and Inoue, 1988a). For pancake ice, the uniaxial compression strength linearly increased with depth as opposed to the consolidated pack ice, which decreased with depth as typically reported in the literature (Han et al., 2015; Kermani et al., 2007).
Besides brine loss, the predominantly granular ice textures of the sampled Antarctic pancake and consolidated pack ice are most likely responsible for the obtained elastic and uniaxial strength properties being distinctly lower than reported in the literature for columnar Arctic winter sea ice. In particular, the failure modes for columnar and granular ice are different, with more of a buckling nature for the former and shear failure for the latter as linked to the largest defect in statistical fracture mechanics. Lastly, the depth variation in mechanical properties is usually not accounted for in the literature.
A distinct directional dependency of the elastic moduli in vertical and horizontal directions, respectively, has been found, in particular for consolidated pack ice. Interestingly, the elastic anisotropy of sea ice has not received much attention in the literature and has been considered of minor significance. Clearly, besides temperature, internal ice composition and age have an at least equal influence on sea ice stiffness and strength. In particular, the remarkable vertical strength and stiffness profiles of pancake ice floes cannot be exclusively explained by temperature data but need to include salinity, brine volume and textural information as well. As such, an ambiguity arises if mechanical properties are solely related to ice porosity.
In summary, there is a complete lack of data concerning the mechanical behaviour of winter young and first-year sea ice in the Antarctic. The physical and mechanical sea ice properties obtained for young mostly granular Antarctic first-year ice exhibited distinct differences from measurements made on predominantly columnar Arctic sea ice in terms of compression strength, stiffness and directional dependency of elastic moduli, warranting further studies to elucidate the influence of environmental conditions characteristic of the Antarctic marginal ice zone on the interrelation of textural and physical with mechanical sea ice properties. Furthermore, the obtained data indicate a high variability which needs to be confirmed regionally and season-specifically. Small-scale sea ice dynamics models can further help to advance understanding of the seasonal cycle of sea ice growth and retreat as linked mechanical phenomena such as inelastic collision and fracture of ice floes, but they rely on the accurate parameterization of the mechanical sea ice parameters in particular.
A1 Consolidated pack ice data
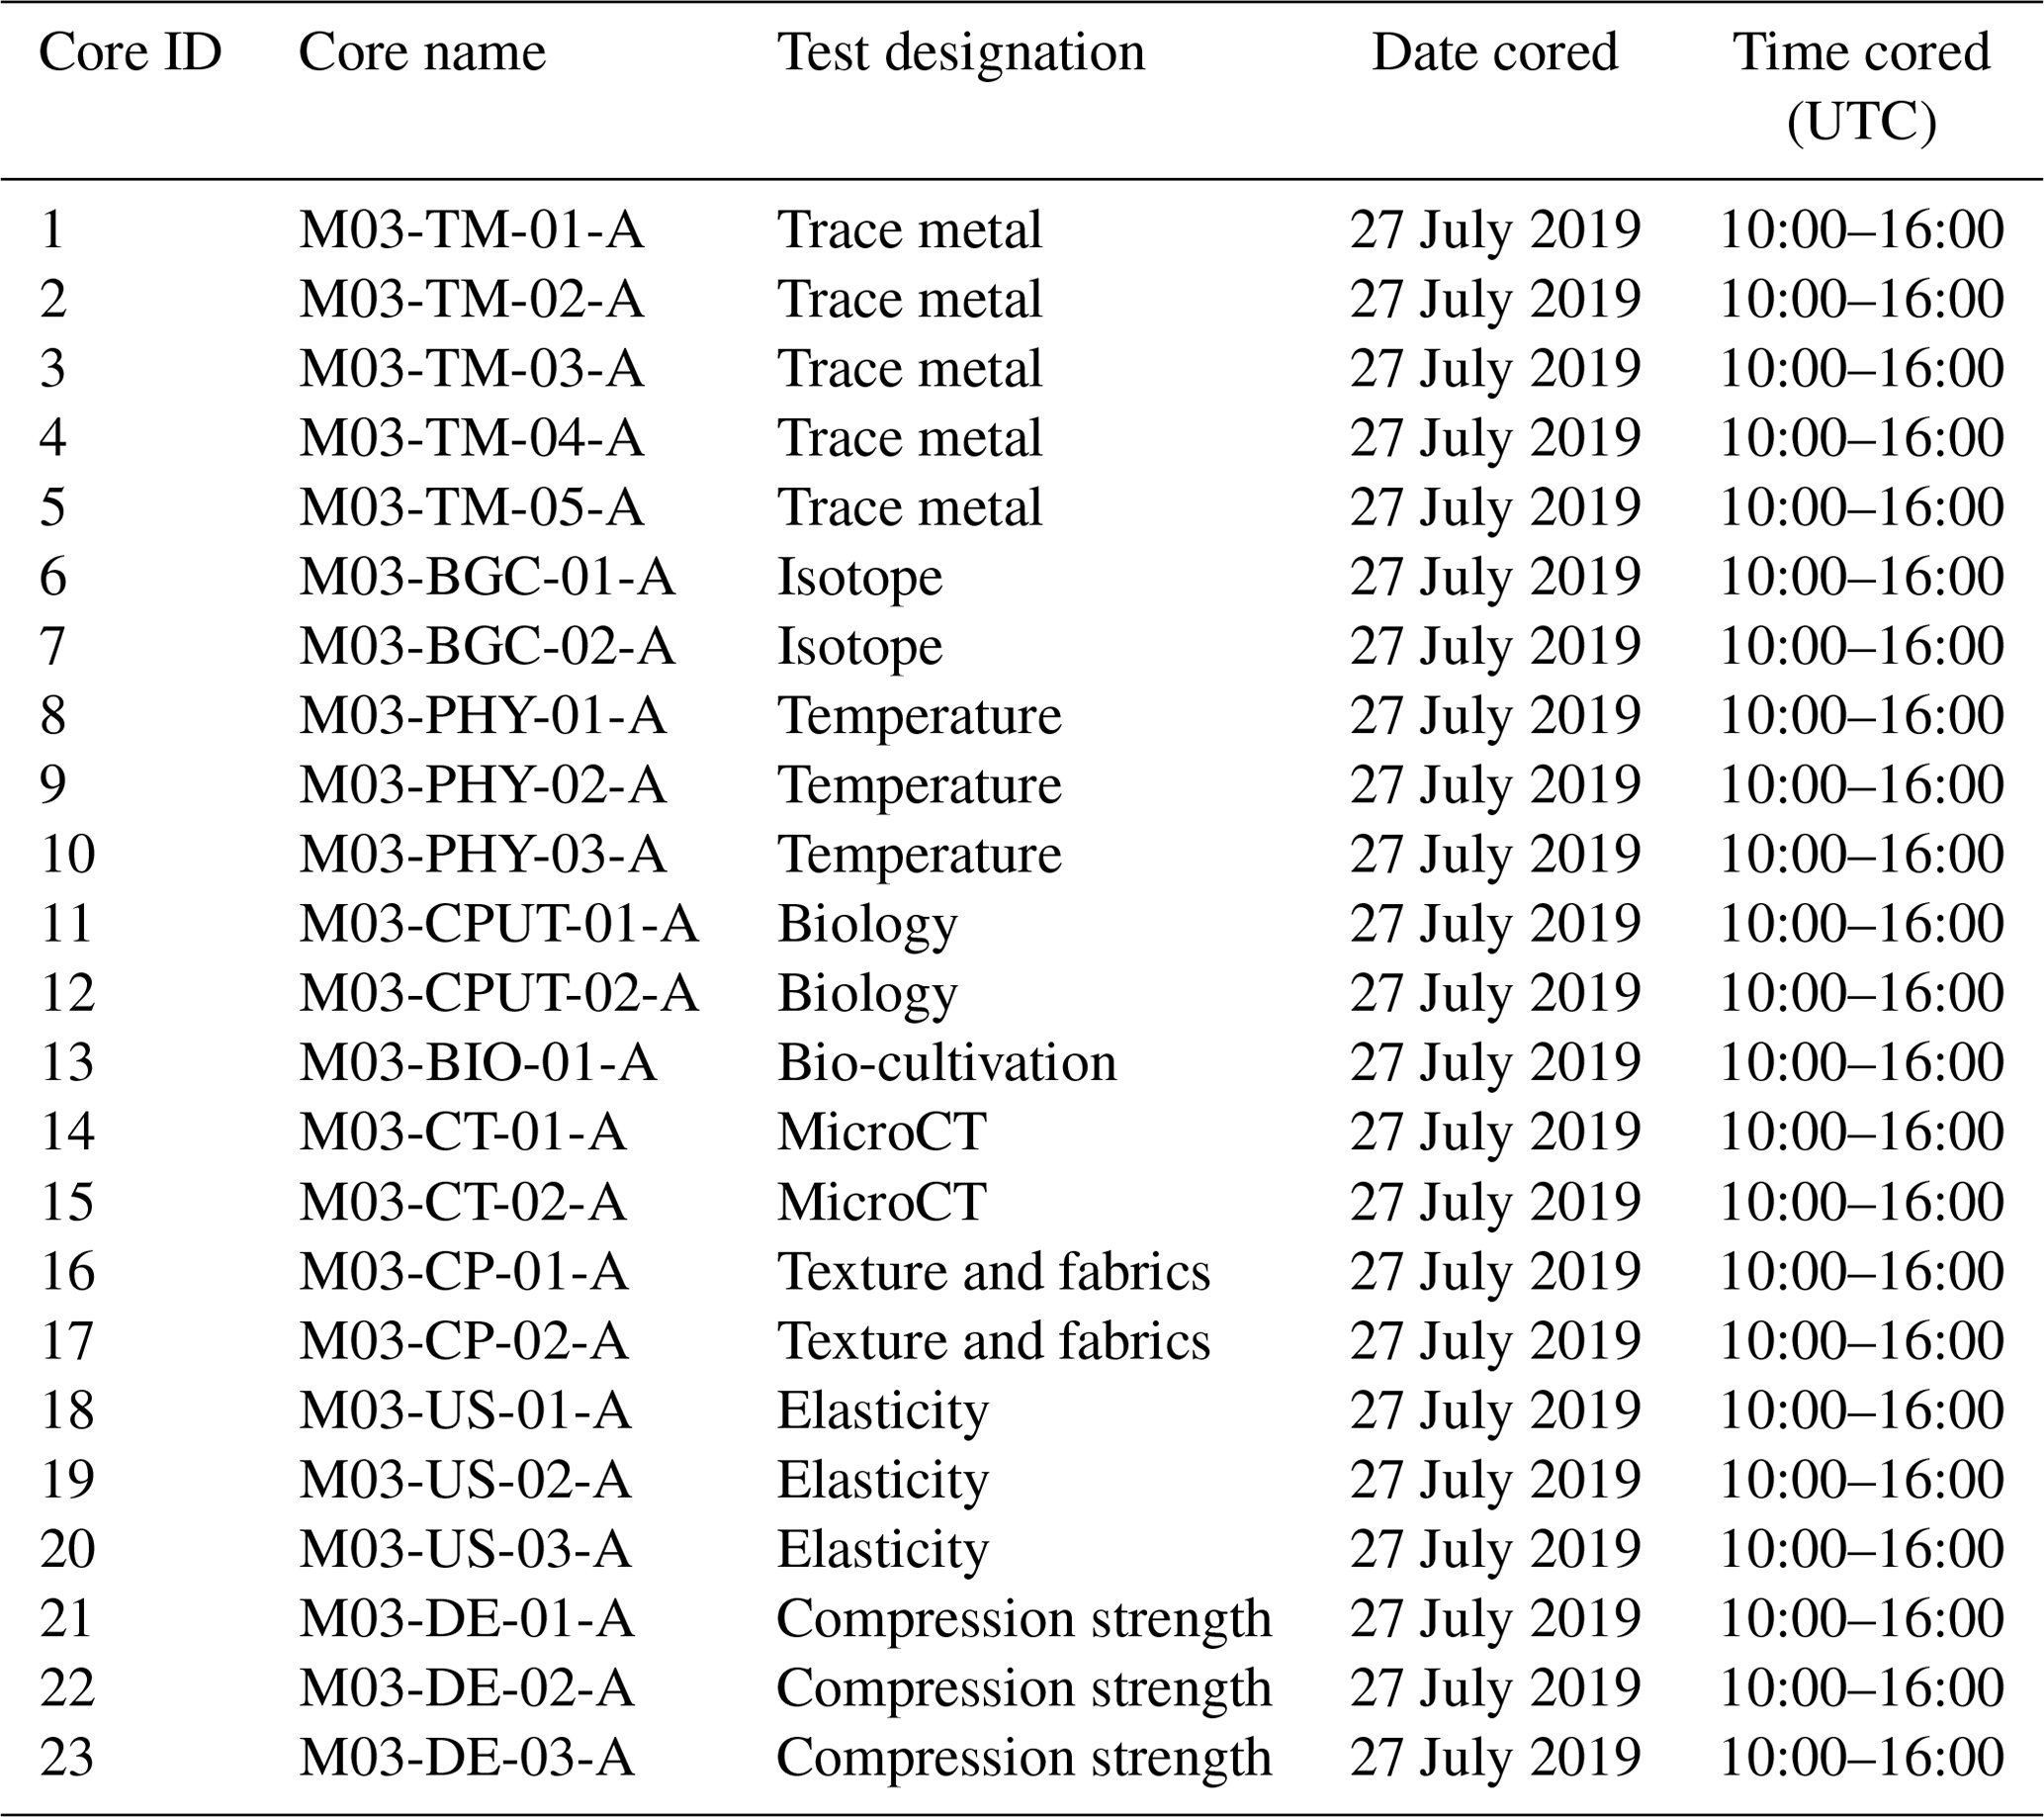
Table A1Overview of pack ice core IDs, corresponding core names, testing designation, and date and time when cored.
A2 Pancake ice cores
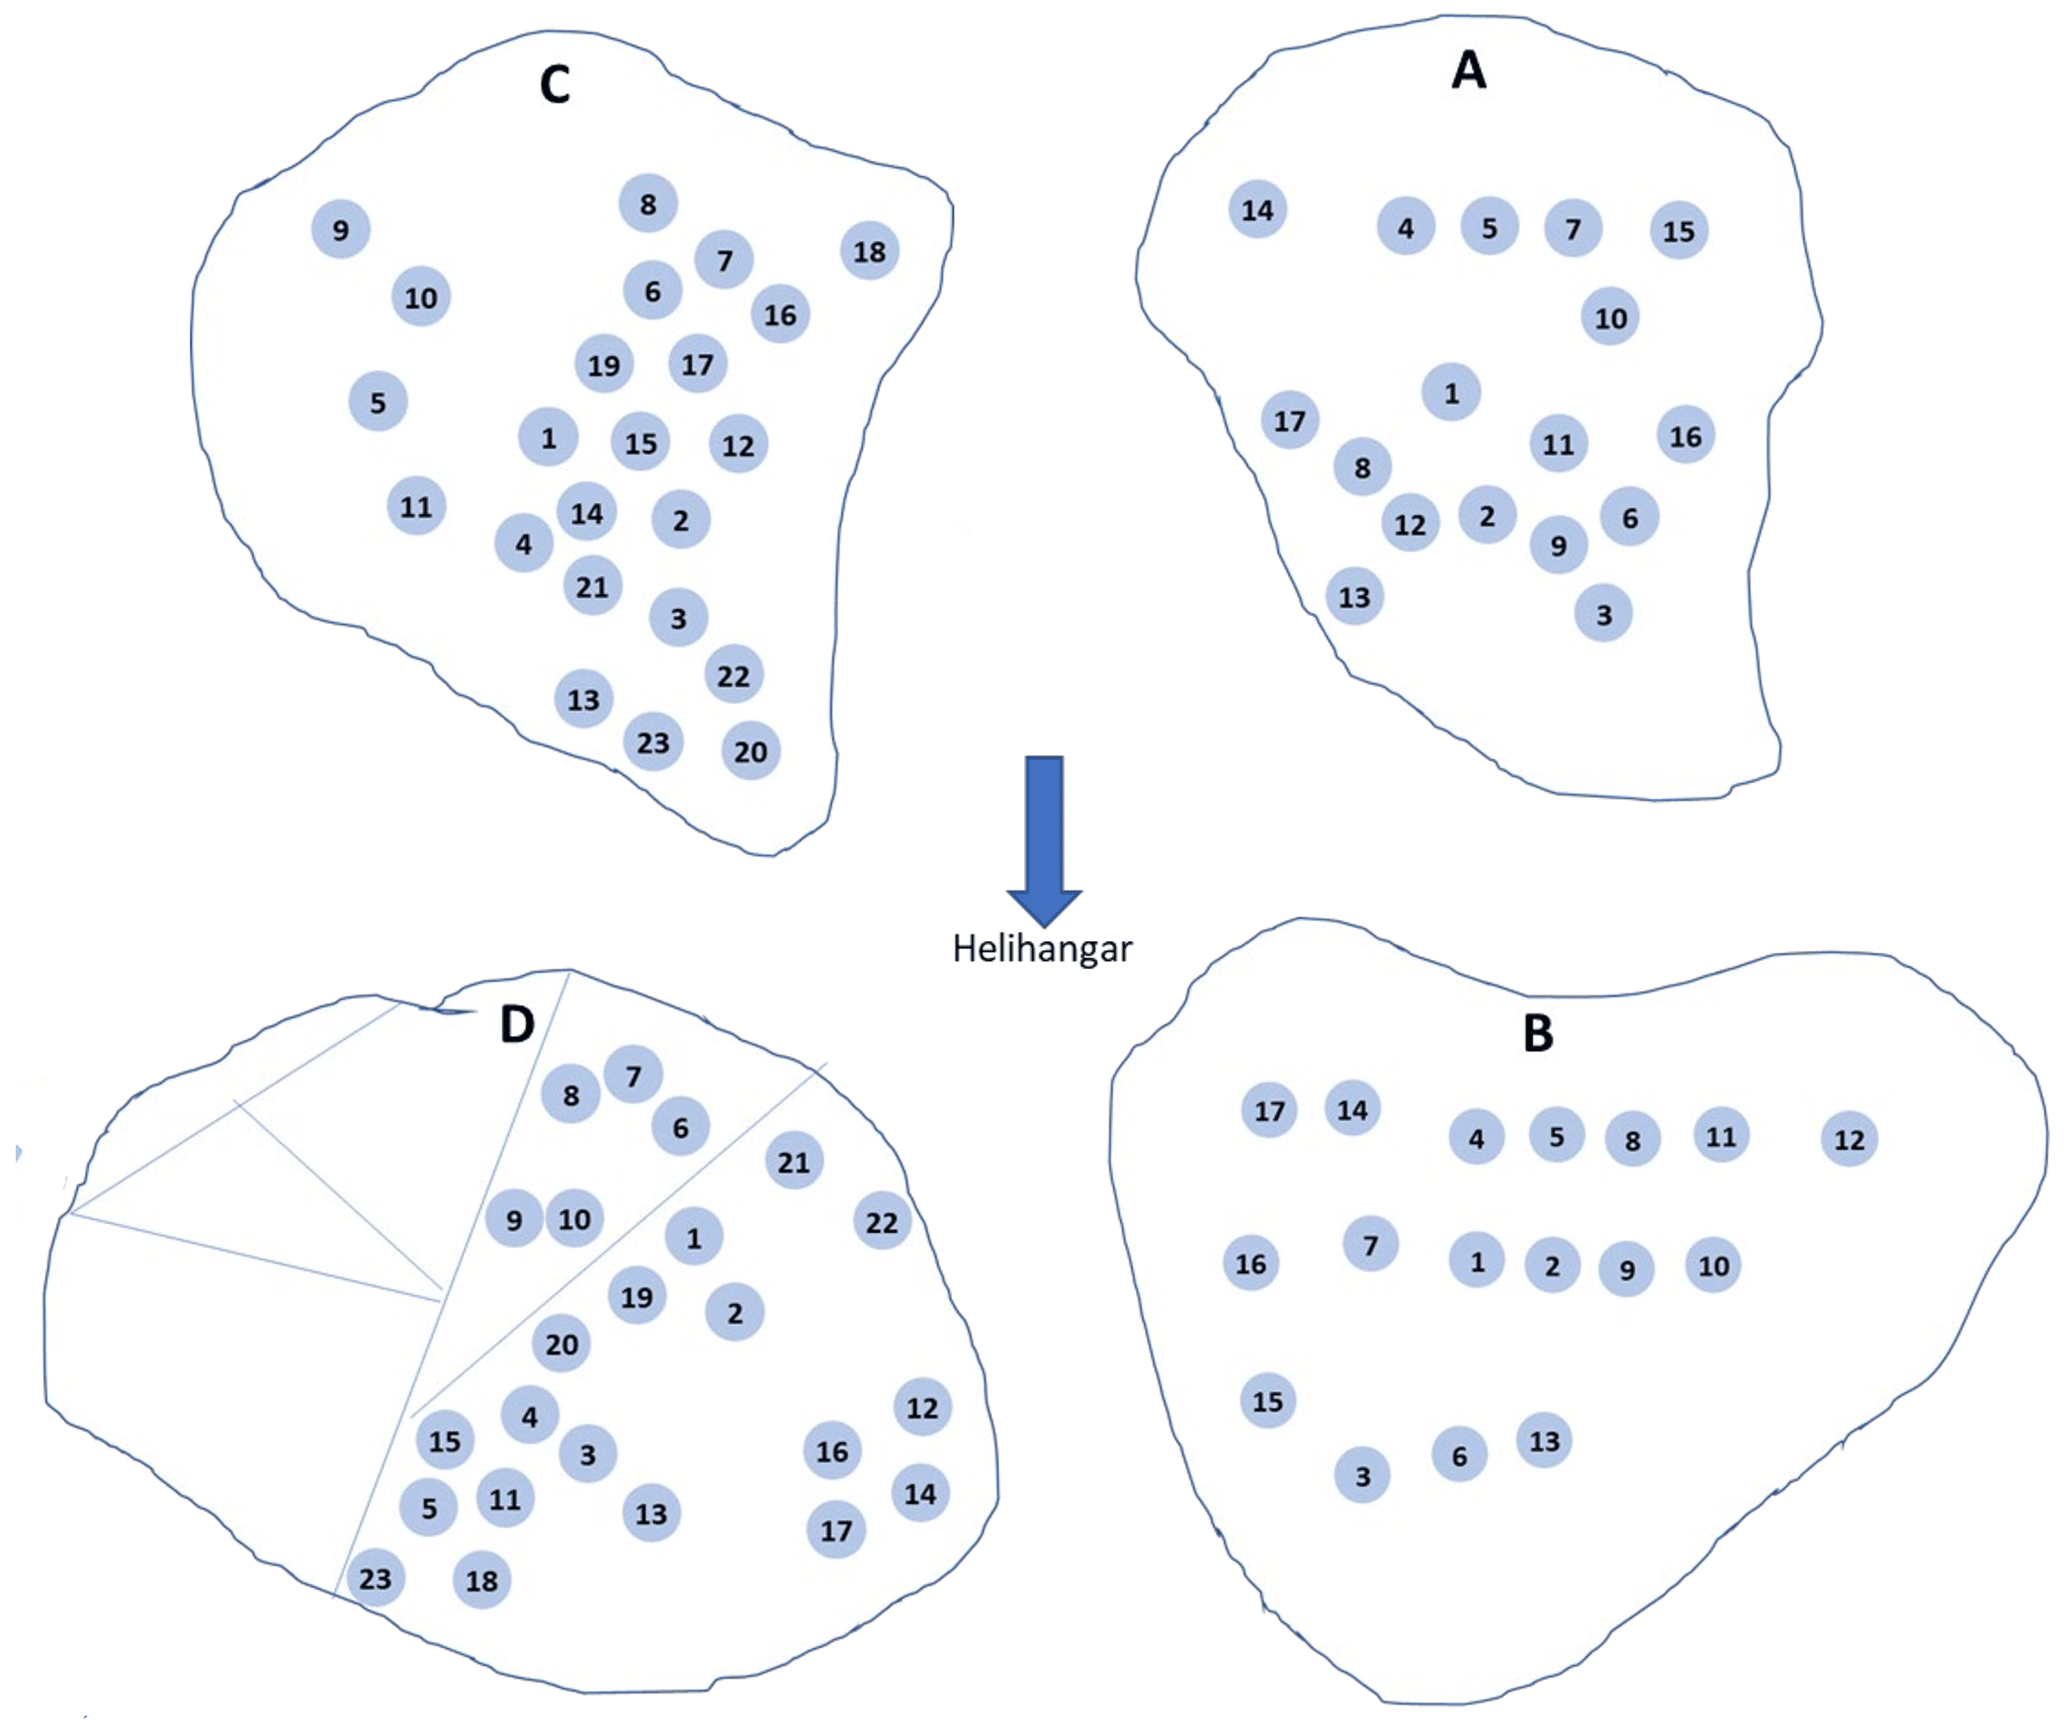
Table A2Overview of core IDs of Pancake A, corresponding core names, testing designation, and date and time when cored.
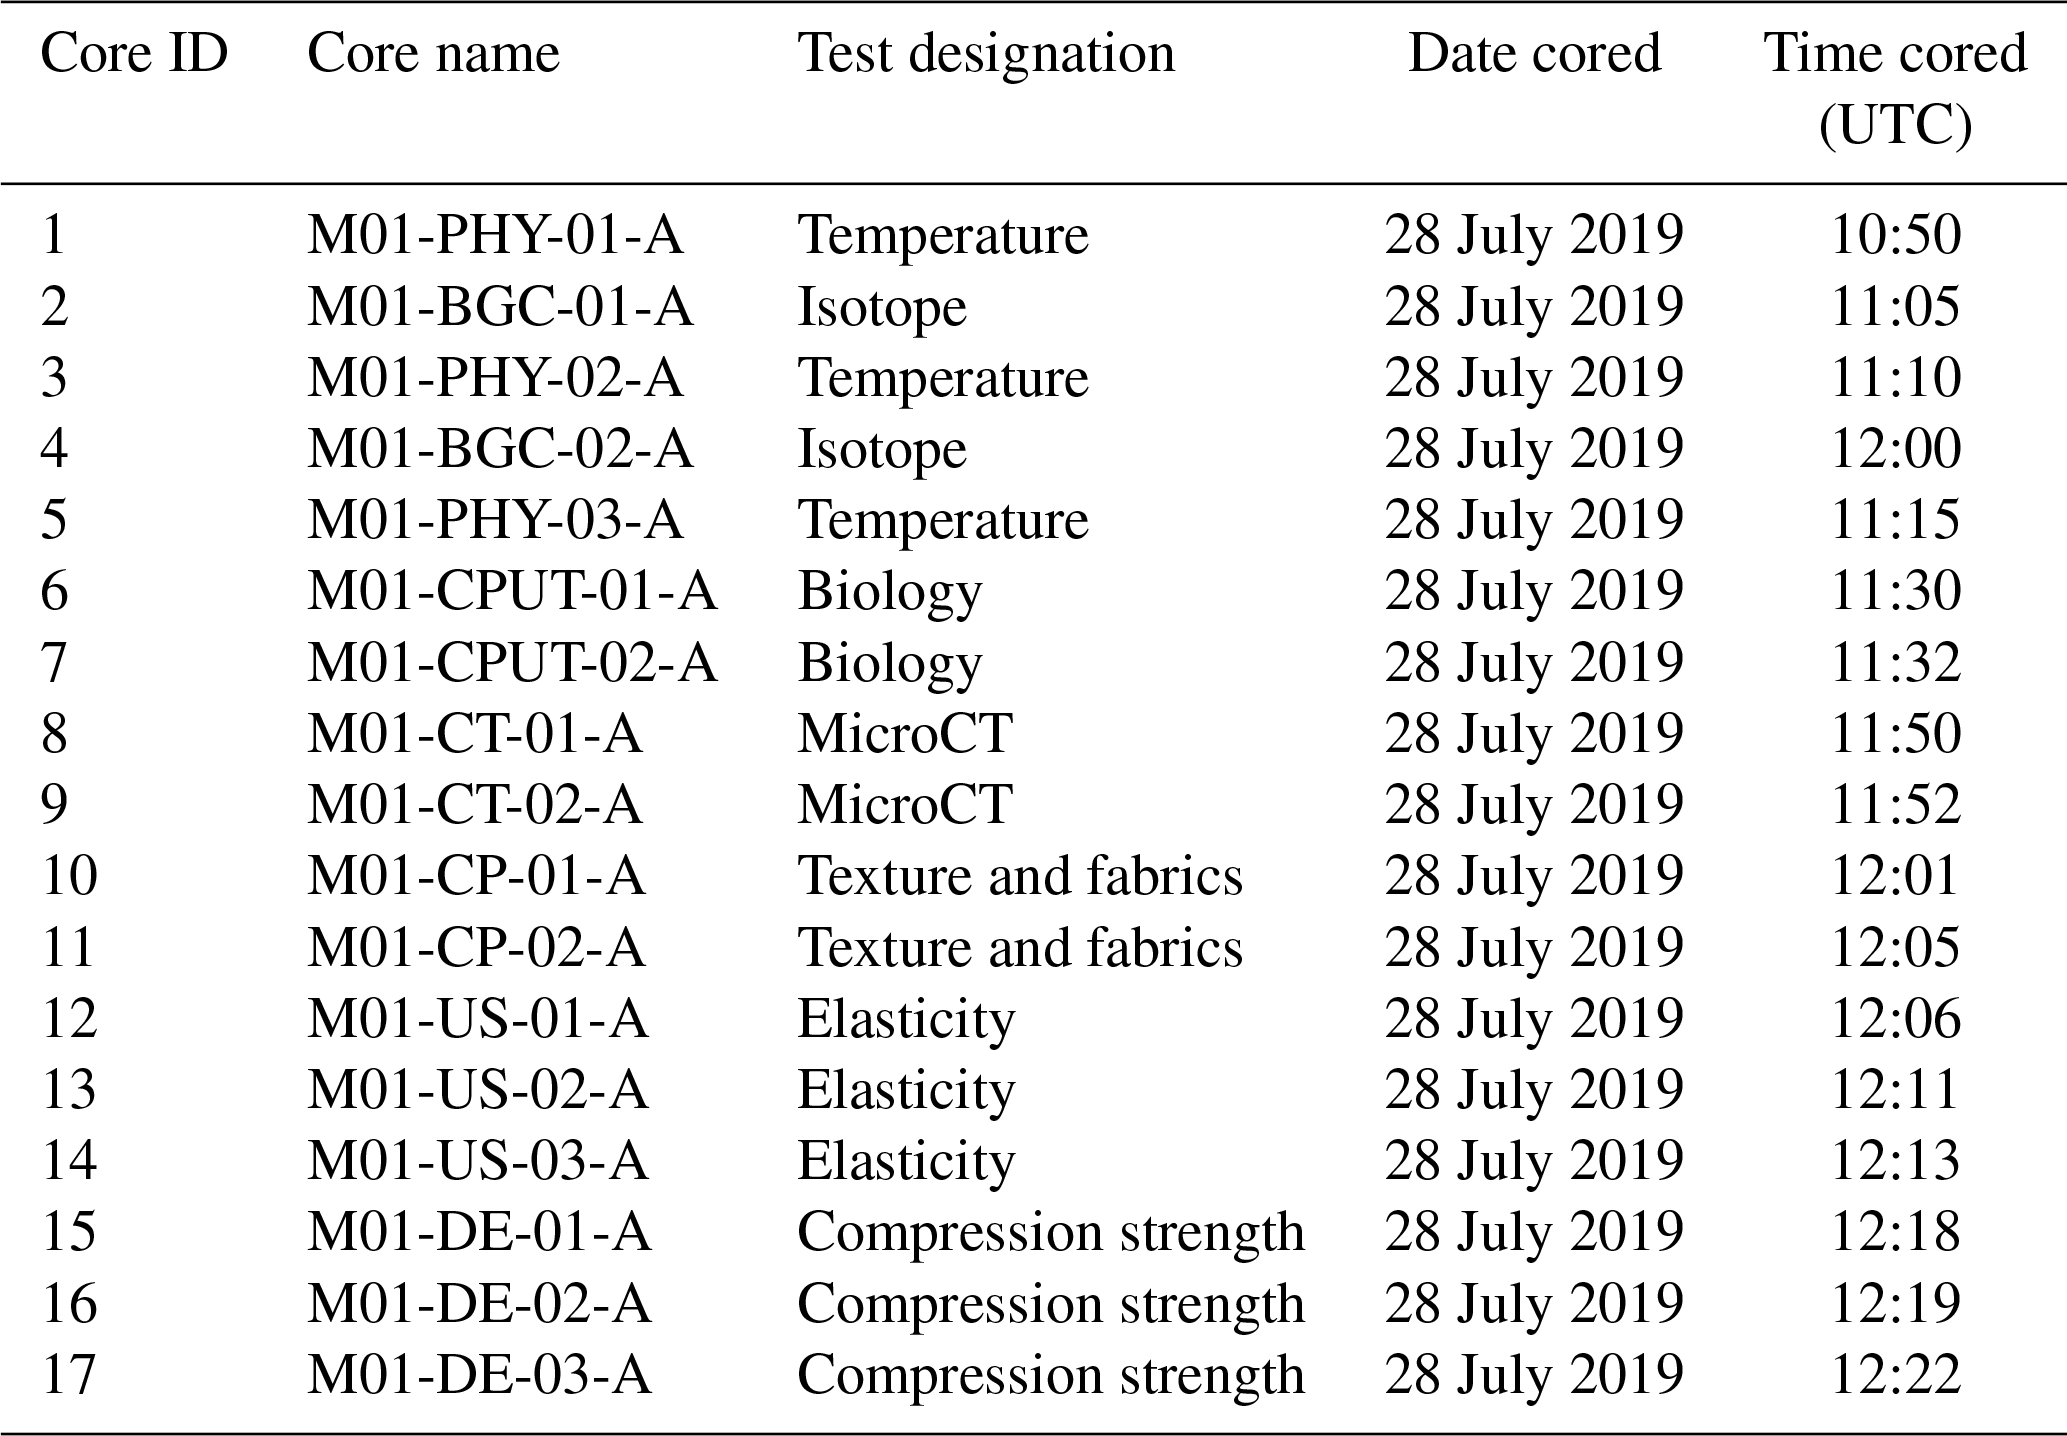
Table A3Overview of core IDs of Pancake B, corresponding core names, testing designation, and date and time when cored.

Table A4Overview of core IDs of Pancake C, corresponding core names, testing designation, and date and time when cored.

Table A5Overview of core IDs of Pancake D, corresponding core names, testing designation, and date and time when cored.
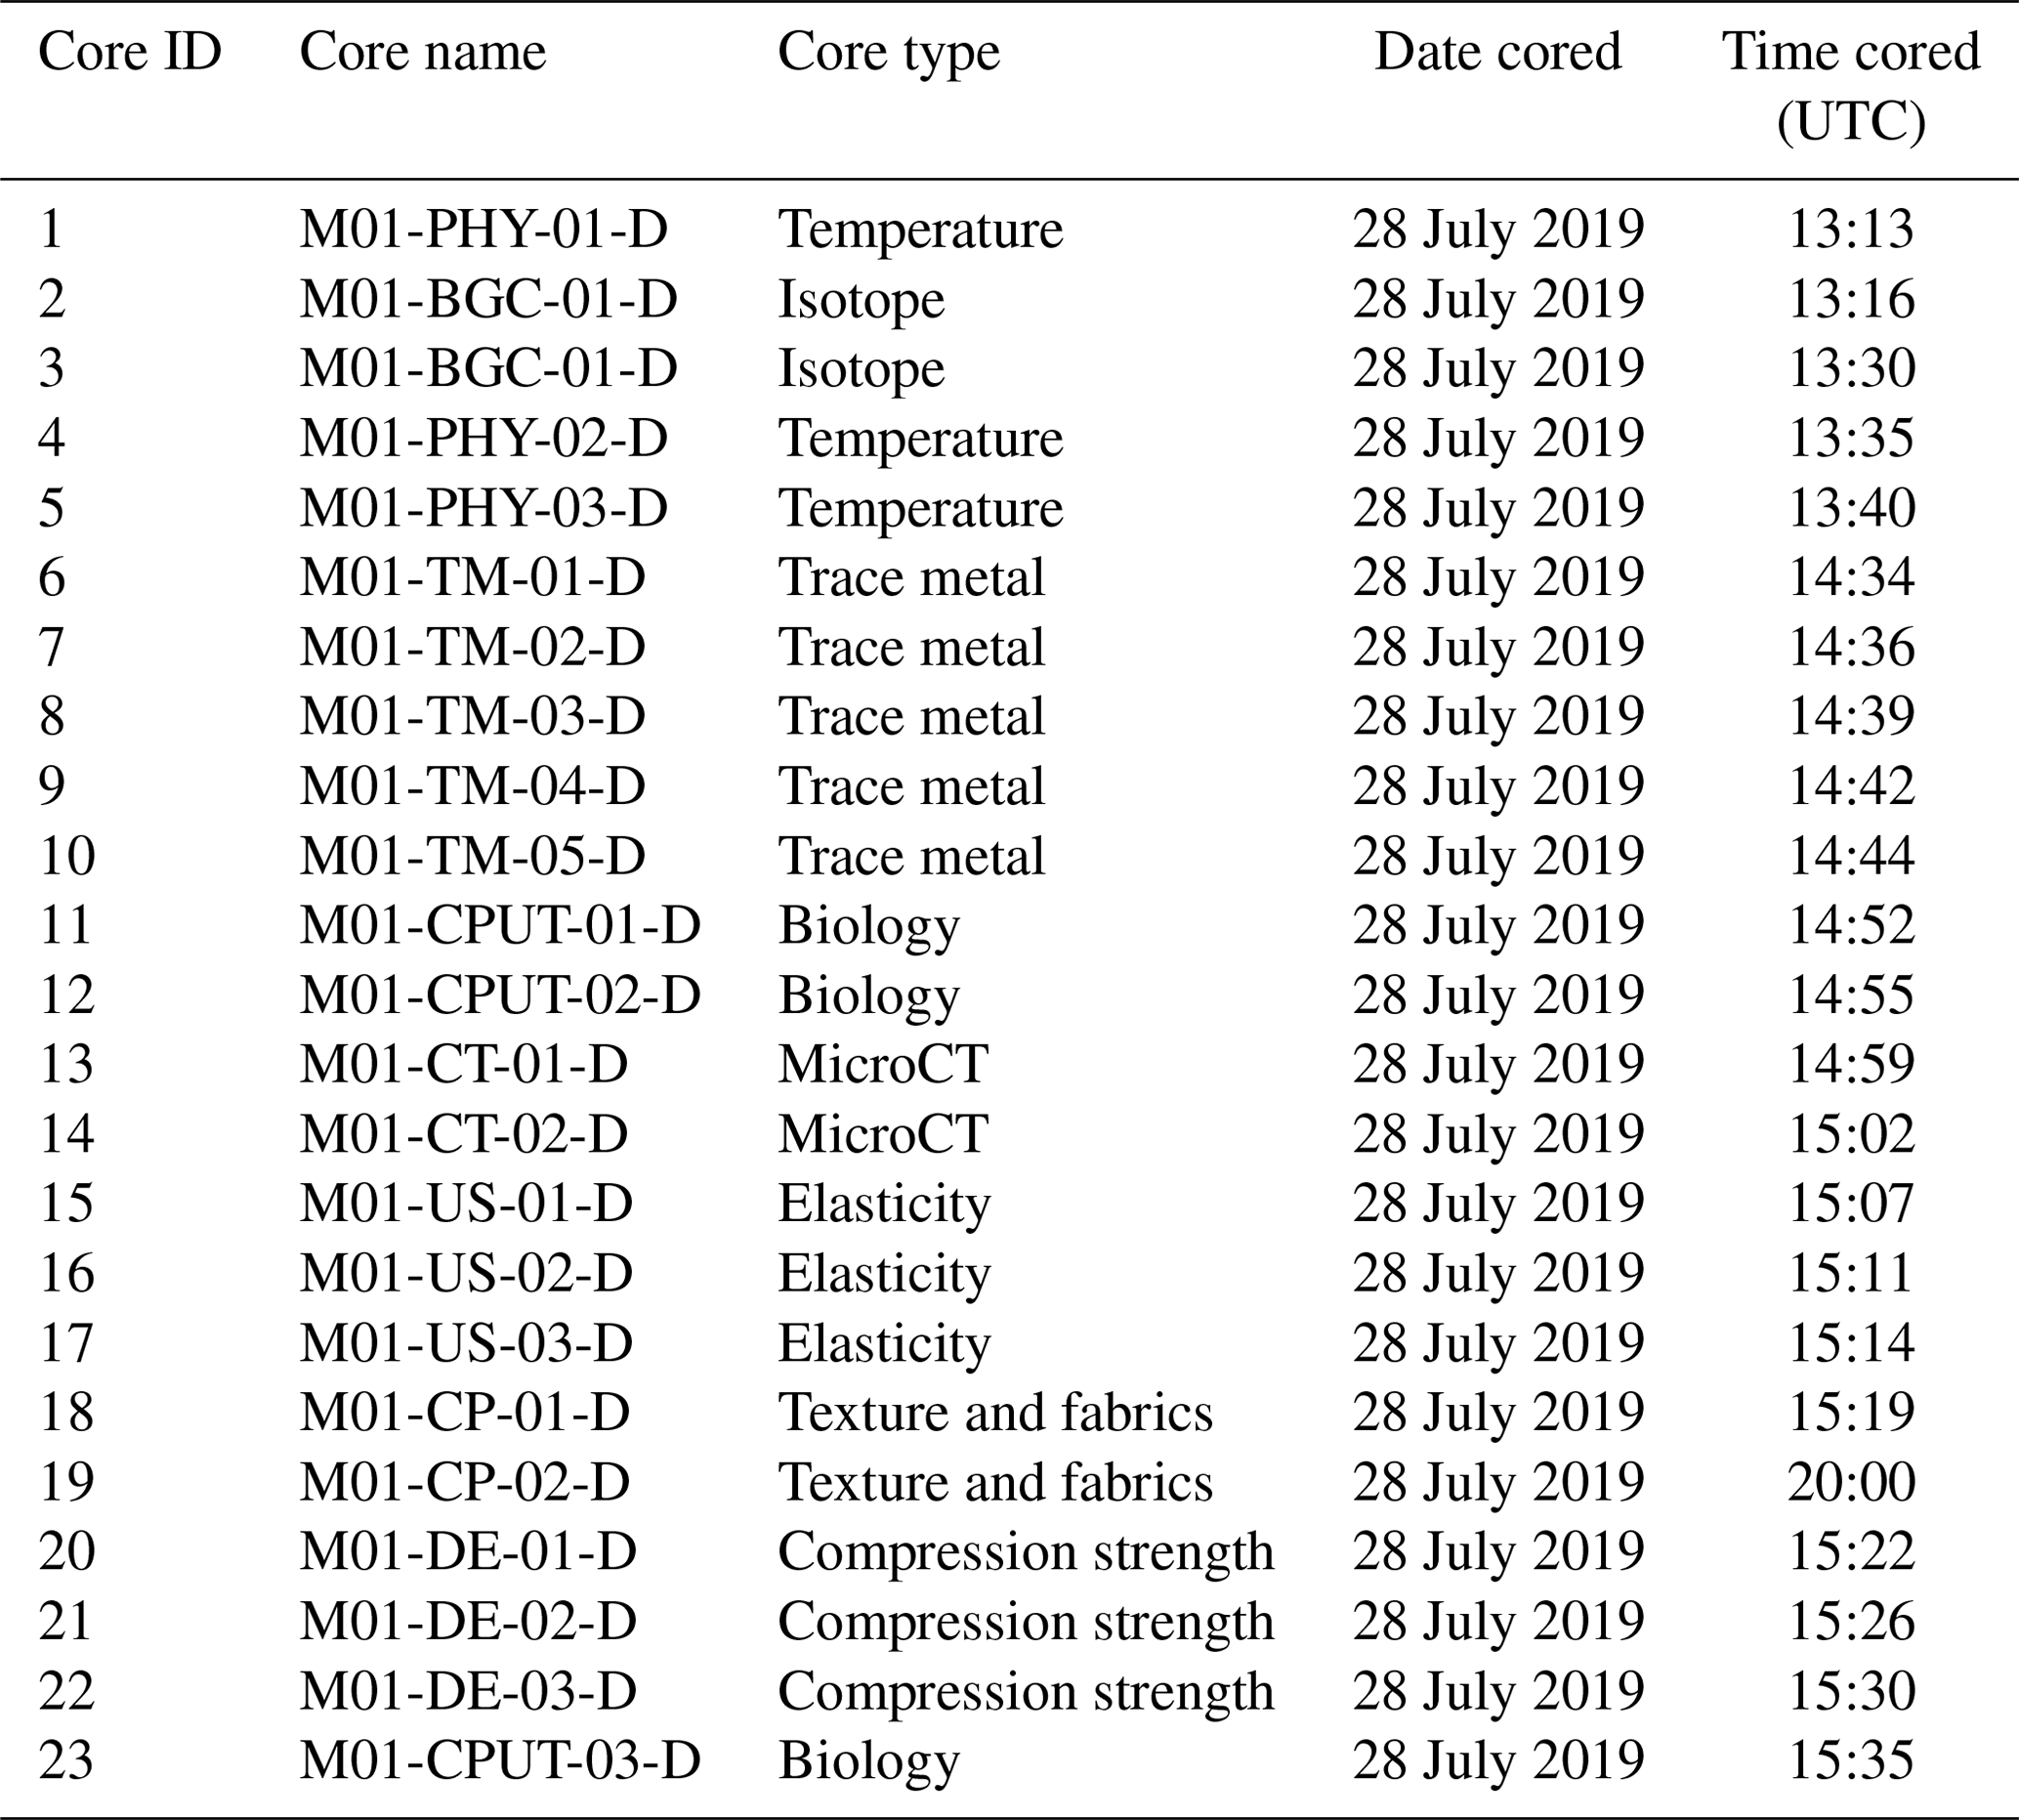
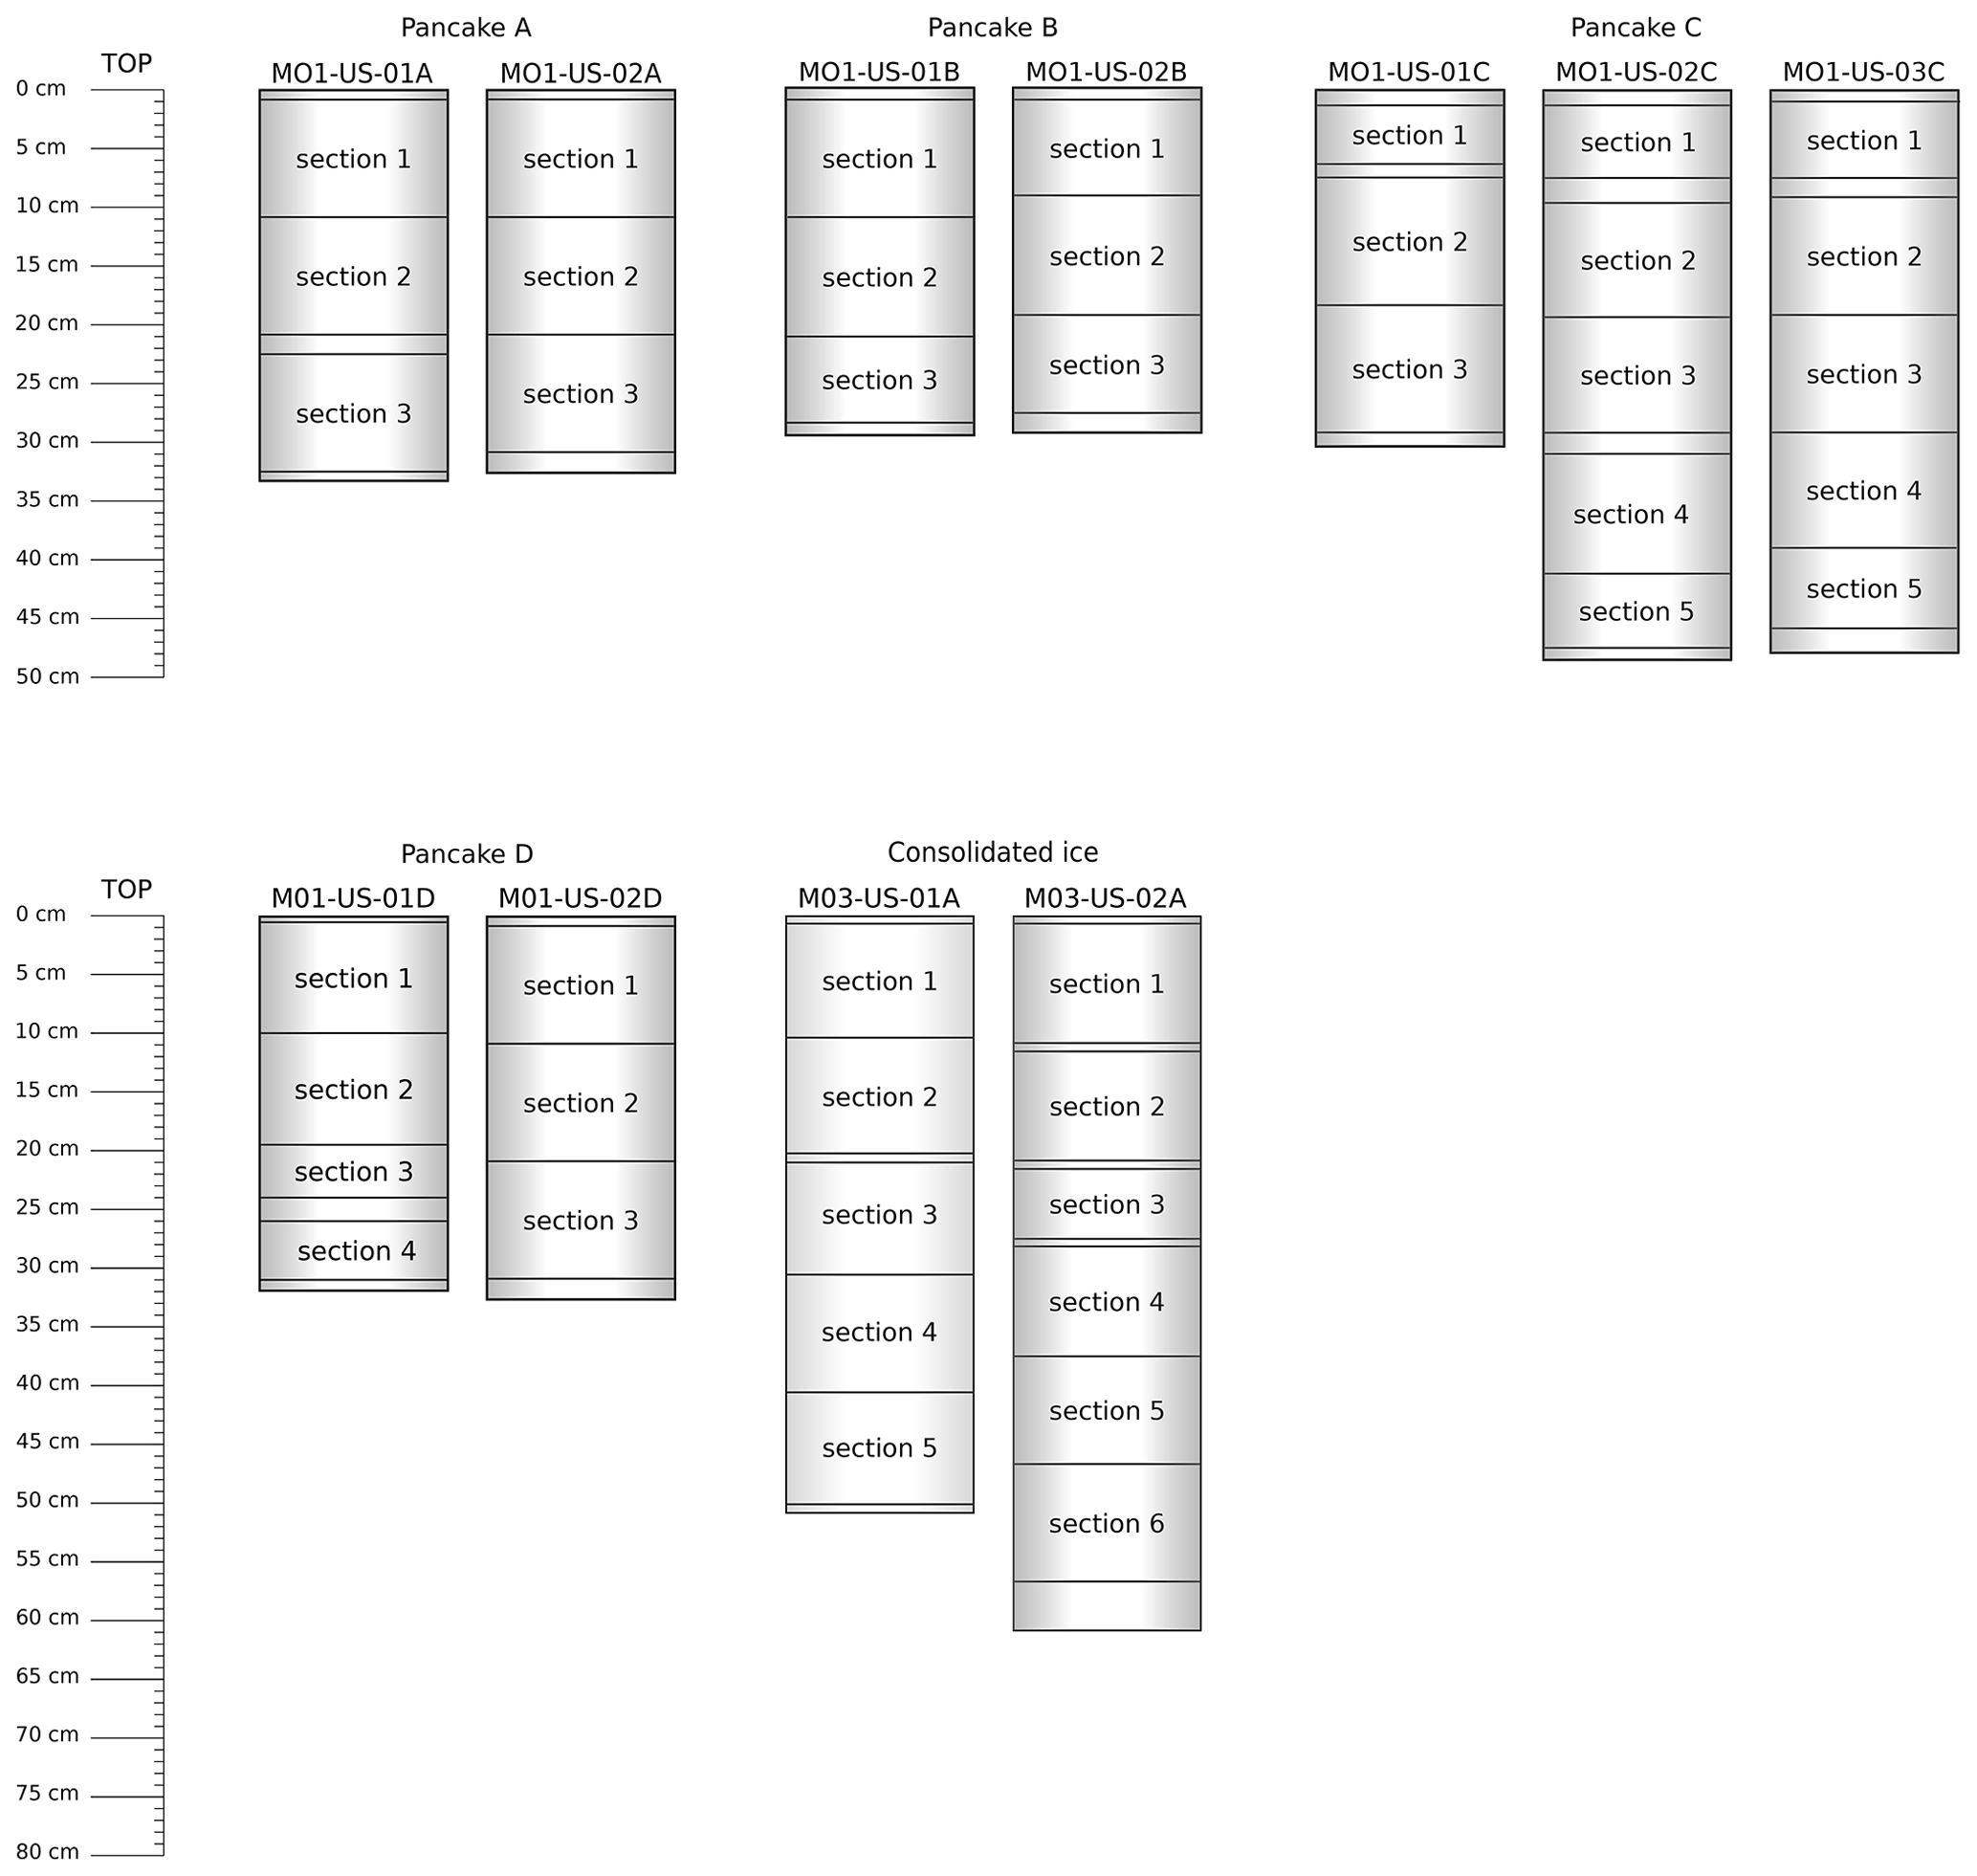
Figure B1Schematic of the segmentation of seven pancake ice and two pack ice cores subjected to ultrasound testing with section dimensions and corresponding section numbering.
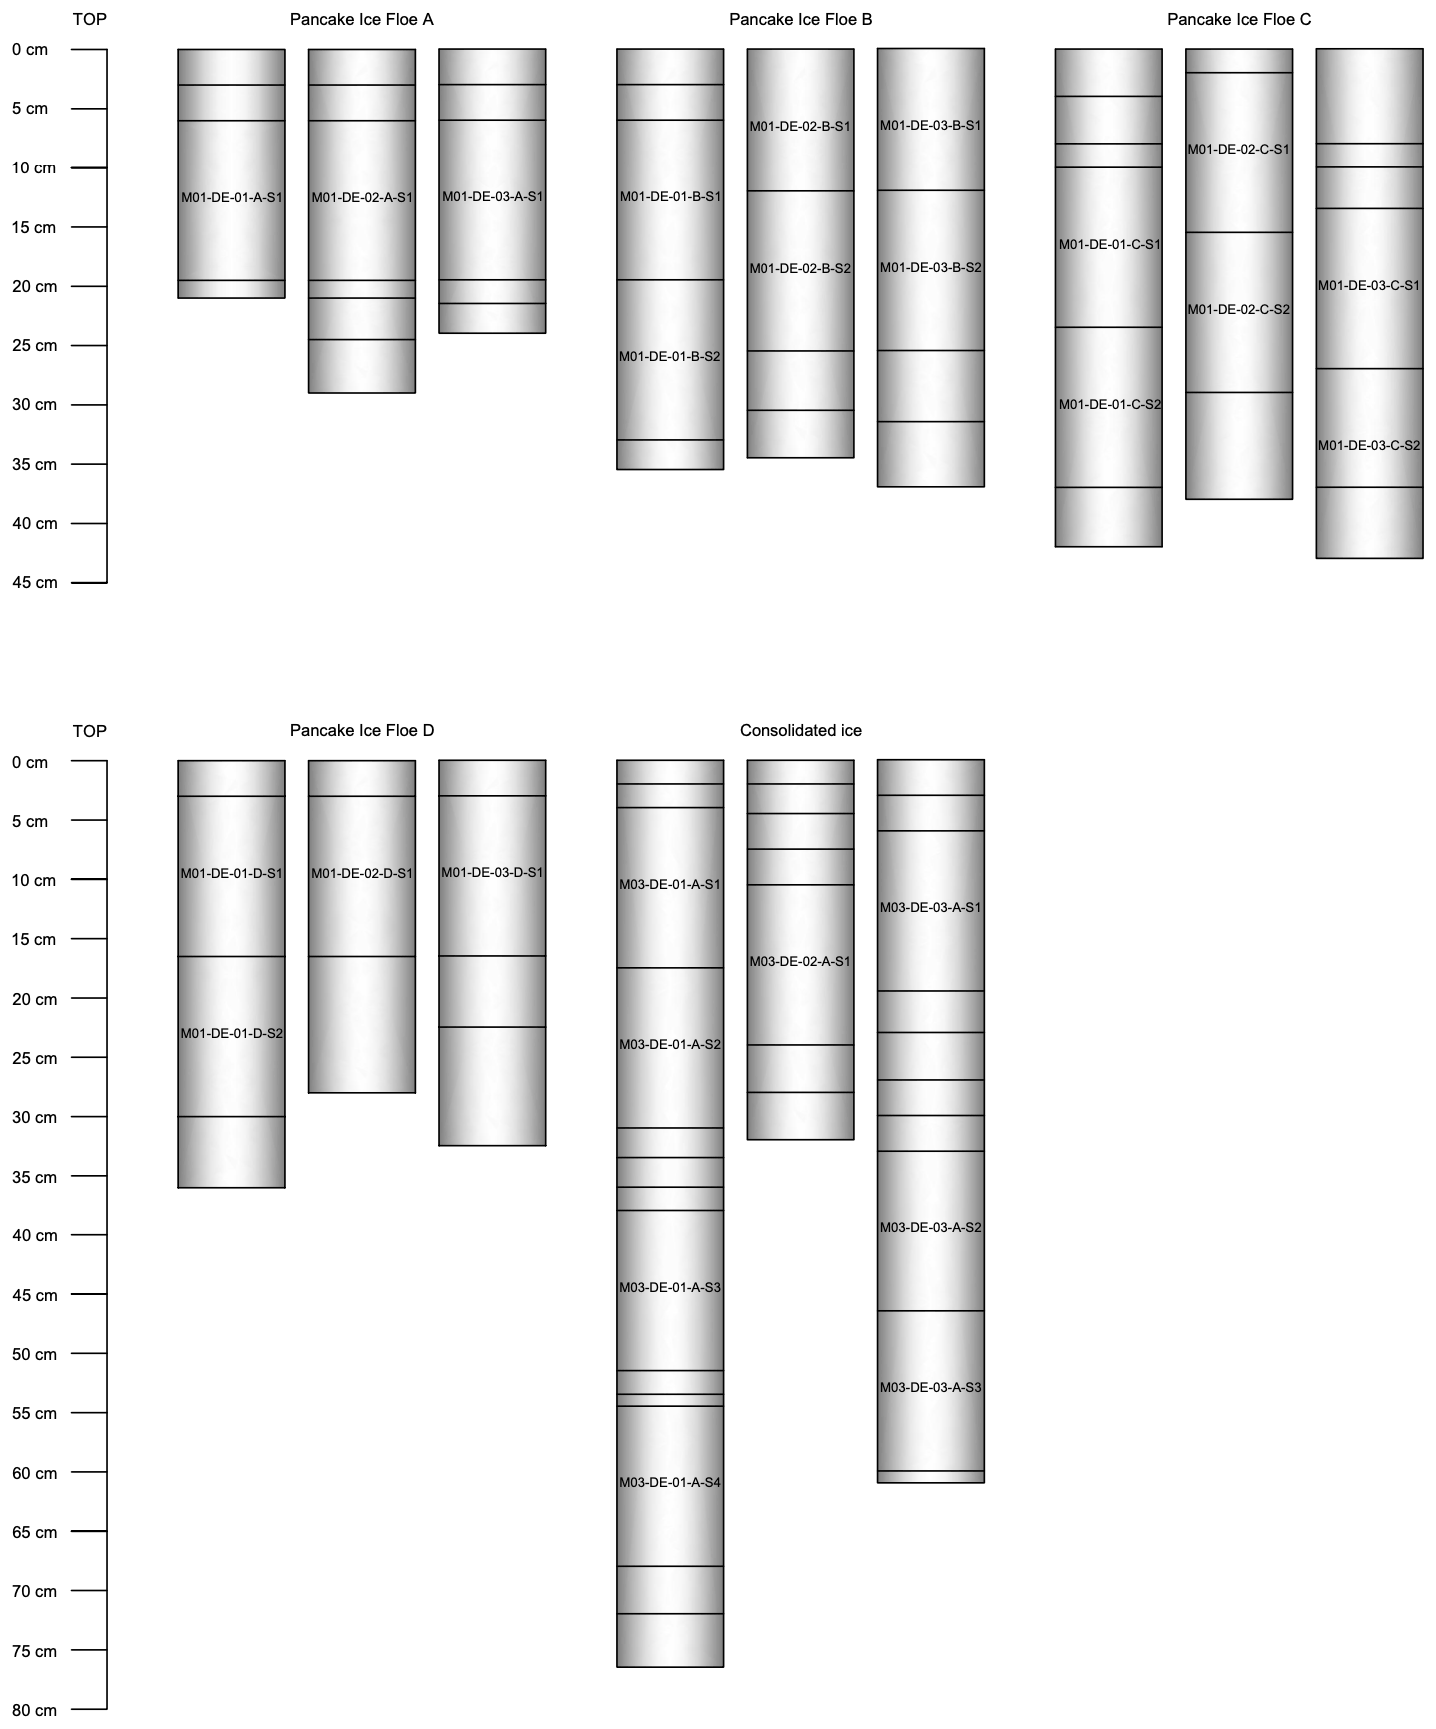
Figure B2Schematic of the segmentation of 12 pancake ice and 3 pack ice cores subjected to compression testing with sample dimensions and corresponding core names.
All experimental data that are part of this paper have been made available via a publicly accessible data repository: https://doi.org/10.25375/uct.14900361 (Skatulla et al., 2021).
Conceptualization was by SS, DCL, KM, TM and MV. Morphological analysis methodology was developed by SJ and TR; ultrasound testing methodology by SS, KM and RM; and uniaxial compression testing methodology by DCL, TM and FP. Investigation and data curation were by SS, RRA, AC, EH, SJ, KM, RM, TM, EM, FP, TR and CS. Formal analysis was by SS, RRA, AC, SJ, DCL, KM, RM, TM and FP. Funding acquisition was by SS, DCL, JS and MV. The original draft was written by SS with assistance from all co-authors.
The contact author has declared that none of the authors has any competing interests.
Opinions expressed and conclusions arrived at are those of the authors and are not necessarily to be attributed to the NRF.
Publisher's note: Copernicus Publications remains neutral with regard to jurisdictional claims in published maps and institutional affiliations.
Sebastian Skatulla, Riesna R. Audh, Andrea Cook, Ehlke Hepworth, Rutger Marquart, Emmanuel Omatuku, Tokoloho Rampai and Marcello Vichi acknowledge support from the South African National Antarctic Programme (SANAP).
This research has been supported by the National Research Foundation of South Africa (NRF) (grant nos. 104839, 105858 and 118745).
This paper was edited by Ted Maksym and reviewed by Ted Maksym and one anonymous referee.
Alberello, A., Onorato, M., Bennetts, L., Vichi, M., Eayrs, C., MacHutchon, K., and Toffoli, A.: Brief communication: Pancake ice floe size distribution during the winter expansion of the Antarctic marginal ice zone, The Cryosphere, 13, 41–48, https://doi.org/10.5194/tc-13-41-2019, 2019. a
Alberello, A., Bennetts, L., Heil, P., Eayrs, C., Vichi, M., MacHutchon, K., Onorato, M., and Toffoli, A.: Drift of pancake ice floes in the winter Antarctic marginal ice zone during polar cyclones, J. Geophys. Res.-Oceans, 125, e2019JC015418, https://doi.org/10.1029/2019JC015418, 2020. a
Bennetts, L. G., O'Farrell, S., and Uotila, P.: Brief communication: Impacts of ocean-wave-induced breakup of Antarctic sea ice via thermodynamics in a stand-alone version of the CICE sea-ice model, The Cryosphere, 11, 1035–1040, https://doi.org/10.5194/tc-11-1035-2017, 2017. a
Bromwich, D. H., Guo, Z., Bai, L., and Chen, Q.-S.: Modeled Antarctic precipitation. Part I: Spatial and temporal variability, J. Climate, 17, 427–447, 2004. a
Carnat, G., Papakyriakou, T., Geilfus, N.-X., Brabant, F., Delille, B., Vancoppenolle, M., Gilson, G., Zhou, J., and Tison, J.-L.: Investigations on physical and textural properties of Arctic first-year sea ice in the Amundsen Gulf, Canada, November 2007–June 2008 (IPY-CFL system study), J. Glaciol., 59, 819–837, 2013. a
Cox, G. F. and Weeks, W. F.: Equations for determining the gas and brine volumes in sea-ice samples, J. Glaciol., 29, 306–316, 1983. a
Dansereau, V., Weiss, J., Saramito, P., and Lattes, P.: A Maxwell elasto-brittle rheology for sea ice modelling, The Cryosphere, 10, 1339–1359, https://doi.org/10.5194/tc-10-1339-2016, 2016. a
Dantl, G.: Elastic moduli of ice, in: Physics of ice: Proceedings of the International Symposium on Physics of Ice, 9–14 September 1968, Munich, Germany, edited by: Riehl, N., Bullemer, B., and Engelhart, H., 223–230, 1969. a
Dempsey, D. and Langhorne, P.: Geometric properties of platelet ice crystals, Cold Reg. Sci. Technol., 78, 1–13, 2012. a
de Vos, M., Barnes, M., Biddle, L. C., Swart, S., Ramjukadh, C.-L., and Vichi, M.: Evaluating numerical and free-drift forecasts of sea ice drift during a Southern Ocean research expedition: An operational perspective, J. Operat. Oceanogr., 1–17, https://doi.org/10.1080/1755876X.2021.1883293, 2021. a
Doble, M., Coon, M., and Peppe, O.: Study of the winter Antarctic marginal ice zone, Ber. Polar Meeresforsch., 402, 158–161, 2001. a
Doble, M. J., Coon, M. D., and Wadhams, P.: Pancake ice formation in the Weddell Sea, J. Geophys. Res.-Oceans, 108, https://doi.org/10.1029/2002JC001373, 2003. a, b
Eayrs, C., Holland, D., Francis, D., Wagner, T., Kumar, R., and Li, X.: Understanding the Seasonal Cycle of Antarctic Sea Ice Extent in the Context of Longer-Term Variability, Rev. Geophys., 57, 1037–1064, 2019. a
Eicken, H.: Salinity profiles of Antarctic sea ice: Field data and model results, J. Geophys. Res.- Oceans, 97, 15545–15557, 1992. a, b, c
Eicken, H.: Deriving modes and rates of ice growth in the Weddell Sea from microstructural, salinity and stable-isotope data, Antarctic Sea Ice: Physical Processes, Interactions and Variability, Antarct. Res. Ser., 74, 89–122, 1998. a
Eicken, H., Lange, M. A., and Wadhams, P.: Characteristics and distribution patterns of snow and meteoric ice in the Weddell Sea and their contribution to the mass balance of sea ice, in: Annales Geophysicae, vol. 12, Springer, 80–93, https://doi.org/10.1007/s00585-994-0080-x, 1994. a
Eicken, H., Fischer, H., and Lemke, P.: Effects of the snow cover on Antarctic sea ice and potential modulation of its response to climate change, Ann. Glaciol., 21, 369–376, 1995. a
Frankenstein, G. and Garner, R.: Equations for determining the brine volume of sea ice from −0.5∘ to −22.9 ∘C, J. Glaciol., 6, 943–944, 1967. a, b
Frederking, R. and Timco, G.: Uniaxial compressive strength and deformation of Beaufort sea ice, in: The Seventh International Conference on Port and Ocean Engineering under Arctic Conditions, Helsinki, Finland, 5–9 April 1983, ISBN 951-38-1872-1, ISSN 0357-9387, 89–98, 1983. a
Galley, R., Else, B., Geilfus, N.-X., Hare, A., Isleifson, D., Barber, D., and Rysgaard, S.: Imaged brine inclusions in young sea ice – Shape, distribution and formation timing, Cold Reg. Sci. Technol., 111, 39–48, 2015. a
Gammon, P., Kiefte, H., Clouter, M., and Denner, W.: Elastic constants of artificial and natural ice samples by Brillouin spectroscopy, J. Glaciol., 29, 433–460, 1983. a
Haas, C., Vieho, T., and Eicken, H.: Sea-ice conditions during the Winter Weddell Gyre Study 1992, ANT X/4, with RV “Polarstern”: Ship observations and AVHRR satellite imagery, Berichte aus dem Fachbereich Physik, Alfred Wegener Institute für Polar und Meeresforschung, 34, 1992. a
Han, H., Li, Z., Huang, W., Lu, P., and Lei, R.: The uniaxial compressive strength of the Arctic summer sea ice, Acta Oceanol. Sin., 34, 129–136, https://doi.org/10.1007/s13131-015-0598-7, 2015. a, b
Hepworth, E., Vichi, M., van Zuydam, A., Taylor, N. C., Bossau, J., Engelbrecht, M., and Aarskog, T.: Sea Ice Observations in the Antarctic Marginal Ice Zone during Winter 2019, PANGEA [data set], https://doi.org/10.1594/PANGAEA.921759, 2020. a
Herman, A., Cheng, S., and Shen, H. H.: Wave energy attenuation in fields of colliding ice floes – Part 1: Discrete-element modelling of dissipation due to ice–water drag, The Cryosphere, 13, 2887–2900, https://doi.org/10.5194/tc-13-2887-2019, 2019. a, b
Hibler III, W.: A dynamic thermodynamic sea ice model, J. Phys. Oceanogr., 9, 815–846, 1979. a
Hobbs, W. R., Massom, R., Stammerjohn, S., Reid, P., Williams, G., and Meier, W.: A review of recent changes in Southern Ocean sea ice, their drivers and forcings, Global Planet. Change, 143, 228–250, 2016. a
Hutchings, J. and Hibler III, W.: Small-scale sea ice deformation in the Beaufort Sea seasonal ice zone, J. Geophys. Res.-Oceans, 113, https://doi.org/10.1029/2006JC003971, 2008. a
Hutchings, J., Heil, P., Steer, A., and Hibler III, W.: Subsynoptic scale spatial variability of sea ice deformation in the western Weddell Sea during early summer, J. Geophys. Res.-Oceans, 117, https://doi.org/10.1029/2011JC006961, 2012. a
Jeffries, M., Morris, K., Weeks, W., and Worby, A.: Seasonal variations in the properties and structural composition of sea ice and snow cover in the Bellingshausen and Amundsen Seas, Antarctica, J. Glaciol., 43, 138–151, 1997. a
Jeffries, M. O., Shaw, R. A., Morris, K., Veazey, A. L., and Krouse, H. R.: Crystal structure, stable isotopes (δ18O), and development of sea ice in the Ross, Amundsen, and Bellingshausen seas, Antarctica, J. Geophys. Res.-Oceans, 99, 985–995, 1994. a
Jeffries, M. O., Krouse, H. R., Hurst-Cushing, B., and Maksym, T.: Snow-ice accretion and snow-cover depletion on Antarctic first-year sea-ice floes, Ann. Glaciol., 33, 51–60, 2001. a, b
Kermani, M., Farzaneh, M., and Gagnon, R.: Compressive strength of atmospheric ice, Cold Reg. Sci. Technol., 49, 195–205, https://doi.org/10.1016/j.coldregions.2007.05.003, 2007. a, b
Kivimaa, S. and Kosloff, P.: Compressive Strength And Structure Of Sea Ice In The Weddell Sea, Antarctica, Built Environ. 5, 331–342, 1994. a, b, c
Kohout, A., Williams, M., Dean, S., and Meylan, M.: Storm-induced sea-ice breakup and the implications for ice extent, Nature, 509, 604–607, 2014. a
Kohout, A. L., Meylan, M. H., and Plew, D. R.: Wave attenuation in a marginal ice zone due to the bottom roughness of ice floes, Ann. Glaciol., 52, 118–122, 2011. a
Kovacs, A.: Sea ice. Part II, Estimating the full-scale tensile, flexural and compressive strength of first-year ice, CRREL Report 96-11, Cold Regions Research and Engineering Laboratory (U.S.) and Engineer Research and Development Center (U.S.), http://hdl.handle.net/11681/9221 (last access: 8 July 2021), 1996. a
Kovacs, A.: Estimating the full-scale flexural and compressive strength of first-year sea ice, J. Geophys. Res.-Oceans, 102, 8681–8689, https://doi.org/10.1029/96JC02738, 1997. a, b, c
Kuehn, G. A. and Schulson, E. M.: The mechanical properties of saline ice under uniaxial compression, Ann. Glaciol., 19, 39–48, 1994. a
Lange, M. and Eicken, H.: Textural characteristics of sea ice and the major mechanisms of ice growth in the Weddell Sea, Ann. Glaciol., 15, 210–215, 1991. a, b, c, d
Lange, M., Schlosser, P., Ackley, S., Wadhams, P., and Dieckmann, G.: 18O concentrations in sea ice of the Weddell Sea, Antarctica, J. Glaciol., 36, 315–323, 1990. a
Lange, M. A., Ackley, S. F., Wadhams, P., Dieckmann, G., and Eicken, H.: Development of sea ice in the Weddell Sea, Ann. Glaciol., 12, 92–96, 1989. a
Langleben, M. P. and Pounder, E. R.: Elastic parameters of sea ice, Ice and snow; properties, processes, and applications, in: Ice and snow; properties, processes, and applications: proceedings of a conference held at the Massachusetts Institute of Technology, edited by: Kingery, W. E., 12–16 February 1962, 69–78, 1963. a, b, c, d
Marquart, R., Bogaers, A., Skatulla, S., Alberello, A., Toffoli, A., Schwarz, C., and Vichi, M.: A computational fluid dynamics model for the small-scale dynamics of wave, ice floe and interstitial grease ice interaction, Fluids, 6, 176, https://doi.org/10.3390/fluids6050176, 2021. a, b
Massom, R., Lytle, V., Worby, A., and Allison, I.: Winter snow cover variability on East Antarctic sea ice, J. Geophys. Res.-Oceans, 103, 24837–24855, 1998. a, b
Mellor, M.: Mechanical behavior of sea ice, in: The geophysics of sea ice, Springer, 165–281, https://doi.org/10.1007/978-1-4899-5352-0_3, 1986. a, b, c
Moslet, P.: Field testing of uniaxial compression strength of columnar sea ice, Cold Reg. Sci. Technol., 48, 1–14, 2007. a, b
Nakawo, M. and Sinha, N. K.: Growth rate and salinity profile of first-year sea ice in the high Arctic, J. Glaciol., 27, 315–330, 1981. a, b, c
Nanthikesan, S. and Sunder, S. S.: Anisotropic elasticity of polycrystalline ice Ih, Cold Reg. Sci. Technol., 22, 149–169, 1994. a
Notz, D. and Worster, M. G.: In situ measurements of the evolution of young sea ice, J. Geophys. Res.-Oceans, 113, https://doi.org/10.1029/2007JC004333, 2008. a, b
Passerotti, G., Bennetts, L. G., von Bock und Polach, F., Alberello, A., Puolakka, O., Dolatshah, A., Monbaliu, J., and Toffoli, A.: Interactions between irregular wave fields and sea ice: A physical model for wave attenuation and ice breakup in an ice tank, J. Phys. Oceanogr., 52, 1431–1446, https://doi.org/10.1175/JPO-D-21-0238.1, 2022. a
Paul, F., Mielke, T., Nisters, C., Schröder, J., Rampai, T., Skatulla, S., Audh, R., Hepworth, E., Vichi, M., and Lupascu, D. C.: Brief communication: Grease Ice in the Antarctic Marginal Ice Zone, J. Mar. Sci. Eng., 9, 647, https://doi.org/10.3390/jmse9060647, 2021. a
Petrich, C. and Eicken, H.: Overview of sea ice growth and properties, in: Sea ice, edited by Thomas, D. N., John Wiley & Sons, Ltd, Chichester, UK, 1–41, ISBN-13 978-1118778388, ISBN-10 1118778383, 2017. a
Provost, C., Sennéchael, N., Miguet, J., Itkin, P., Rösel, A., Koenig, Z., Villacieros-Robineau, N., and Granskog, M. A.: Observations of flooding and snow-ice formation in a thinner Arctic sea-ice regime during the N-ICE2015 campaign: Influence of basal ice melt and storms, J. Geophys. Res.-Oceans, 122, 7115–7134, 2017. a
Pustogvar, A. and Kulyakhtin, A.: Sea ice density measurements. Methods and uncertainties, Cold Reg. Sci. Technol., 131, 46–52, https://doi.org/10.1016/j.coldregions.2016.09.001, 2016. a
Rampal, P., Weiss, J., Marsan, D., Lindsay, R., and Stern, H.: Scaling properties of sea ice deformation from buoy dispersion analysis, J. Geophys. Res.-Oceans, 113, https://doi.org/10.1029/2007JC004143, 2008. a
Roach, L. A., Horvat, C., Dean, S. M., and Bitz, C. M.: An emergent sea ice floe size distribution in a global coupled ocean-sea ice model, J. Geophys. Res.-Oceans, 123, 4322–4337, 2018. a
Rogers, W. E., Thomson, J., Shen, H. H., Doble, M. J., Wadhams, P., and Cheng, S.: Dissipation of wind waves by pancake and frazil ice in the autumn Beaufort Sea, J. Geophys. Res.-Oceans, 121, 7991–8007, 2016. a, b
Schulson, E., Fortt, A., Iliescu, D., and Renshaw, C.: Failure envelope of first-year Arctic sea ice: The role of friction in compressive fracture, J. Geophys. Res.-Oceans, 111, https://doi.org/10.1029/2005JC003235, 2006. a
Schulson, E. M. and Duval, P.: Creep and Fracture of Ice, Cambridge University Press, Cambridge, https://doi.org/10.1017/CBO9780511581397, 2009. a
Shokr, M. and Agnew, T. A.: Validation and potential applications of Environment Canada Ice Concentration Extractor (ECICE) algorithm to Arctic ice by combining AMSR-E and QuikSCAT observations, Remote Sens. Environ., 128, 315–332, 2013. a
Shokr, M. and Sinha, N.: Sea ice: physics and remote sensing, John Wiley & Sons, ISBN-13 978-1119027898. ISBN-10 1119027896, 2015. a
Sinha, N. K.: Uniaxial compressive strength of first-year and multi-year sea ice, Can. J. Civ. Eng., 11, 82–91, https://doi.org/10.1139/l84-010, 1984. a, b
Skatulla, S., Audh, R. R., Cook, A., Hepworth, E., Johnson, S., Lupascu, D. C., MacHutchon, K., Marquart, R., Mielke, T., Omatuku, E., Paul, F., Rampai, T., Schwarz, C., Schröder, J., and Vichi, M.: Physical and mechanical results for sea ice data – SCALE Winter Cruise 2019, SA Agulhas II, University of Cape Town [data set], https://doi.org/10.25375/uct.14900361.v1, 2021. a
Smedsrud, L. H. and Skogseth, R.: Field measurements of Arctic grease ice properties and processes, Cold Reg. Sci. Technol., 44, 171–183, 2006. a, b
Smith, M. and Thomson, J.: Pancake sea ice kinematics and dynamics using shipboard stereo video, Ann. Glaciol., 61, 1–11, https://doi.org/10.1017/aog.2019.35, 2019. a
Snyder, S. A., Schulson, E. M., and Renshaw, C. E.: The role of damage and recrystallization in the elastic properties of columnar ice, J. Glaciol., 61, 461–480, https://doi.org/10.3189/2015JoG14J225, 2015. a, b
Spreen, G., Kaleschke, L., and Heygster, G.: Sea ice remote sensing using AMSR-E 89-GHz channels, J. Geophys. Res.-Oceans, 113, https://doi.org/10.1029/2005JC003384, 2008. a
Squire, V. A.: A fresh look at how ocean waves and sea ice interact, Philos. T. Roy. Soc.. A, 376, 20170342, https://doi.org/10.1098/rsta.2017.0342, 2018. a
Sturm, M., Morris, K., and Massom, R.: The winter snow cover of the West Antarctic pack ice: its spatial and temporal variability, Antarctic sea ice: physical processes, interactions and variability, American Geophysical Union, edited by: Jeffries, M. O., USA, ISBN 9780875909028, 74, 1–18, https://doi.org/10.1029/AR074p0001, 1998. a
Thomas, M., Vancoppenolle, M., France, J., Sturges, W., Bakker, D. C., Kaiser, J., and von Glasow, R.: Tracer measurements in growing sea ice support convective gravity drainage parameterizations, J. Geophys. Res.-Oceans, 125, e2019JC015791 https://doi.org/10.1029/2019JC015791, 2020. a
Timco, G. and Weeks, W.: A review of the engineering properties of sea ice, Cold Reg. Sci. Technol., 60, 107–129, 2010. a, b, c
Tison, J.-L., Schwegmann, S., Dieckmann, G., Rintala, J.-M., Meyer, H., Moreau, S., Vancoppenolle, M., Nomura, D., Engberg, S., Blomster, L., and Hendricks, S.: Biogeochemical impact of snow cover and cyclonic intrusions on the winter Weddell Sea ice pack, J. Geophys. Res.-Oceans, 122, 9548–9571, 2017. a, b, c, d, e
Tison, J.-L., Maksym, T., Fraser, A. D., Corkill, M., Kimura, N., Nosaka, Y., Nomura, D., Vancoppenolle, M., Ackley, S., Stammerjohn, S., and Wauthy, S.: Physical and biological properties of early winter Antarctic sea ice in the Ross Sea, Ann. Glaciol., 61, 241–259, 2020. a, b
Urabe, N. and Inoue, M.: Mechanical Properties of Antarctic Sea Ice, J. Offshore Mech. Arct. Eng., 110, 403–408, https://doi.org/10.1115/1.3257079, 1988a. a, b, c, d
Urabe, N. and Inoue, M.: Mechanical properties of Antarctic sea ice, J. Offshore Mech. Arct. Eng., 110, 403–408, 1988b. a, b
Wang, R. and Shen, H. H.: Gravity waves propagating into an ice-covered ocean: A viscoelastic model, J. Geophys. Res.-Oceans, 115, https://doi.org/10.1029/2009JC005591, 2010. a
Weeks, W. F. and Ackley, S. F.: The growth, structure, and properties of sea ice, in: CRREL Monograph 82-1, CRREL, 1–130, https://apps.dtic.mil/sti/pdfs/ADA123762.pdf (last access: 8 July 2021), 1982. a
Weiss, J.: Drift, deformation, and fracture of sea ice: a perspective across scales, in: vol. 83, Springer, ISBN-13 978-9400762015, ISBN-10 9400762011, 2013. a
Weiss, J. and Dansereau, V.: Linking scales in sea ice mechanics, Philos. T. Roy. Soc. A, 375, 20150352, https://doi.org//10.1098/rsta.2015.0352, 2017. a, b
Wells, A., Wettlaufer, J., and Orszag, S.: Brine fluxes from growing sea ice, Geophys. Res. Lett., 38, https://doi.org/10.1029/2010GL046288, 2011. a
Worby, A., Massom, R., Allison, I., Lytle, V., and Heil, P.: East Antarctic sea ice: A review of its structure, properties and drift, Antarctic sea ice: physical processes, interactions and variability, 74, 41–67, 1998. a
Ye, Y., Heygster, G., and Shokr, M.: Improving multiyear ice concentration estimates with reanalysis air temperatures, IEEE T. Geosci. Remote, 54, 2602–2614, 2015. a
Yiew, L. J., Bennetts, L., Meylan, M., Thomas, G., and French, B.: Wave-induced collisions of thin floating disks, Phys. Fluids, 29, 127102, https://doi.org/10.1063/1.5003310, 2017. a
- Abstract
- Introduction
- Materials and methods
- Results and discussion
- Conclusions
- Appendix A: Pancake and consolidated pack ice core lists
- Appendix B: Core segmentation for elasticity and uniaxial compression strength testing
- Data availability
- Author contributions
- Competing interests
- Disclaimer
- Acknowledgements
- Financial support
- Review statement
- References