the Creative Commons Attribution 4.0 License.
the Creative Commons Attribution 4.0 License.
 | 24 Jun 2022
Climate warming shortens ice durations and alters freeze and break-up patterns in Swedish water bodies
Sofia Hallerbäck
Laurie S. Huning
Charlotte Love
Magnus Persson
Katarina Stensen
David Gustafsson
Amir AghaKouchak
Increasing air temperatures reduce the duration of ice cover on lakes and rivers, threatening to alter their water quality, ecology, biodiversity, and physical, economical and recreational function. Using a unique in situ record of freeze and break-up dates, including records dating back to the beginning of the 18th century, we analyze changes in ice duration (i.e., first freeze to last break-up), freeze and break-up patterns across Sweden. Results indicate a significant trend in shorter ice duration (62 %), later freeze (36 %) and earlier break-up (58 %) dates from 1913–2014. In the latter 3 decades (1985–2014), the mean observed ice durations have decreased by about 11 d in northern (above 60∘ N) and 28 d in southern Sweden relative to the earlier three decades. In the same period, the average freeze date occurred about 10 d later and break-up date about 17 d earlier in southern Sweden. The rate of change is roughly twice as large in southern Sweden as in the northern part. Sweden has experienced an increase in occurrence of years with an extremely short ice cover duration (i.e., less than 50 d), which occurred about 8 times more often in southern Sweden than previously observed. Our analysis indicates that even a 1 ∘C increase in air temperatures in southern (northern) Sweden results in a mean decrease of ice duration of 22.5 (±7.6) d. Given that warming is expected to continue across Sweden during the 21st century, we expect increasingly significant impacts on ice cover duration and hence, ecology, water quality, transportation, and recreational activities in the region.
- Article
(7148 KB) - Full-text XML
-
Supplement
(1743 KB) - BibTeX
- EndNote


The world's freshwater systems are critically important for all humans and they have experienced significant environmental changes due to human activities and anthropogenic climate change (Dudgeon et al., 2006; Vörösmarty et al., 2010). In the Arctic regions climate change is amplified, mainly due to temperature feedbacks and change in surface albedo (Pithan and Mauritsen, 2014). A global mean temperature increase of +2 ∘C from the “pre-industrial” level would result in a higher mean temperature increase in Scandinavia (Vautard et al., 2014). As temperatures are projected to continue to rise, they are expected to cause major physical, ecological, social, and economic changes (Parmesan and Yohe, 2003).
One impact of global warming is the reduction in ice cover duration of freshwater systems, often associated with both a later freeze and an earlier break-up of the ice cover (Duguay et al., 2003). Previous studies showed that ice duration of inland waters is strongly correlated with and driven by air temperature and solar radiation (Sharma et al., 2019; Kropácek et al., 2013; Duguay et al., 2015; Livingstone and Adrian, 2009). Analyses from different parts of the world indicate that the duration of ice cover on lakes and rivers is sensitive to climatic change and variability (Prowse et al., 2011; Benson et al., 2012; Beltaos and Prowse, 2009; Takács, 2011; Latifovic and Pouliot, 2007; Magnuson et al., 2000). Decreased ice cover duration and earlier ice break-up have critical ecological consequences, influencing the timing of photosynthesis (Quayle et al., 2002; Leppäranta et al., 2012), productivity and biodiversity of phytoplankton, and the occurrence of fish kill (Leppäranta et al., 2003; Watz et al., 2016), as well as shaping the vegetation of flowing waters (Lind et al., 2014). Changes in ice duration modulate the energy and moisture exchange over the water surface (Duguay et al., 2003) and the timing of vertical mixing and stratification in lakes (Bengtsson, 2011).
In Sweden, lakes cover about 9 % of the total land area (Henestål et al., 2015) and surface water provides 50 % of its drinking water (Rosborg and Kozisek, 2019). In many high-latitude regions, including parts of Sweden, ice cover is also an important part of transportation and communication (Jeffries et al., 2012; Knoll et al., 2019). The Swedish Transport Administration, Trafikverket, has expressed concerns regarding the stability and duration of ice roads (i.e., frozen water bodies) and has requested that further research be conducted on this topic. The mean temperatures of winter months in Sweden are expect to increase more than in the summer months, with models predicting that a global mean temperature increase of +2 ∘C from pre-industrial would result in an increase of mean winter temperature of +1.5 ∘C in the south to +3 ∘C in the north of Sweden compared to mean the temperatures from 1971–2000 (Vautard et al., 2014). Thus, reliable information about the rate of change in ice cover duration, which we investigate here, is needed to advise policy and decision makers, inform impact and adaptation activities, and understand potential impacts on recreational activities (e.g., ice fishing, ice boating, skiing, spiritual ceremonies, and ice skating) (Knoll et al., 2019).
Previous studies have examined the timing of ice cover on lakes and rivers in Sweden. For instance, Eklund (1999) provided an overview of ice data up to 1999, and described methods of ice cover observation. Weyhenmeyer et al. (2004) also analyzed ice break-up data across Sweden and identified regional differences in the timing and length of ice cover across the country's water bodies. They concluded that cooler regions (i.e., northern Sweden) are less sensitive to increasing air temperature than temperate regions (i.e., southern Sweden) in terms of earlier break-up of ice cover. Comparing the colder time period of 1961–1990 to the warmer period of 1991–2002 (by 0.8 ∘C), they observed that ice break-up occurred 17 d earlier in the southern region during the latter period, but only 4 d earlier in the northern region. Hence, they concluded that increasing air temperature can drastically shift the timing of lake ice break-up in the warmer and southern regions of Sweden, while it is less drastic in the northern parts. Since a long time series of lake ice observations can serve as a proxy for climate change and provide a convenient climate index (Duguay et al., 2003), we extend these previous studies using more recent observations, longer records of ice duration, break-up, and freeze data, and more observation sites across the whole of Sweden.
Weyhenmeyer et al. (2011) investigated the ice phenology from 1213 lakes and 236 rivers in 12 different countries, including Sweden. They found a stronger decrease in ice duration across regions with shorter durations and air temperatures below 0 ∘C, such as southern Sweden below 61∘ N. They suggested that 3.7 % of the world's lakes larger than 0.1 km2 are at risk of becoming open-water systems in the near future. Sharma et al. (2019) estimated that the number of lakes with intermittent winter ice cover are increasing, from currently 14 800 lakes in the Northern Hemisphere to 35 300 with 2 ∘C warming and 230 400 with 8 ∘C, impacting up to about 400 million and 650 million people, respectively.
In this study, we characterize the ice cover duration using in situ observations, from the Swedish Meteorological and Hydrological Institute, of ice cover freeze and break-up from 752 lake and river observation sites in Sweden (see the Methods and data section) to better understand the relationship between temperature variability and ice duration and associated trends. We quantify temporal and regional shifts in the distributions of ice freeze and break-up dates and ice durations across Sweden since they remain poorly understood. Compared with earlier studies (e.g., Weyhenmayer et al., 2004), we use more recent and updated observations on ice duration, break-up and freeze dates and their probability distributions, and quantify the sensitivity of ice properties to a unit degree of temperature change.
2.1 Ice data observations, monitoring, and uncertainty
We used ice data records obtained mainly from the Swedish Meteorological and Hydrological Institute (SMHI), which include freeze and break-up dates. In total, the dataset includes observations from 752 observations sites, consisting of 677 (∼ 90 %) lakes and 75 (∼ 10 %) rivers. Observations span from 1700–2014; however, the coverage and locations vary over time. Observation sites from 1871 can be seen in Fig. 1. The number of observations from 1860–2014 are presented in Fig. 2.
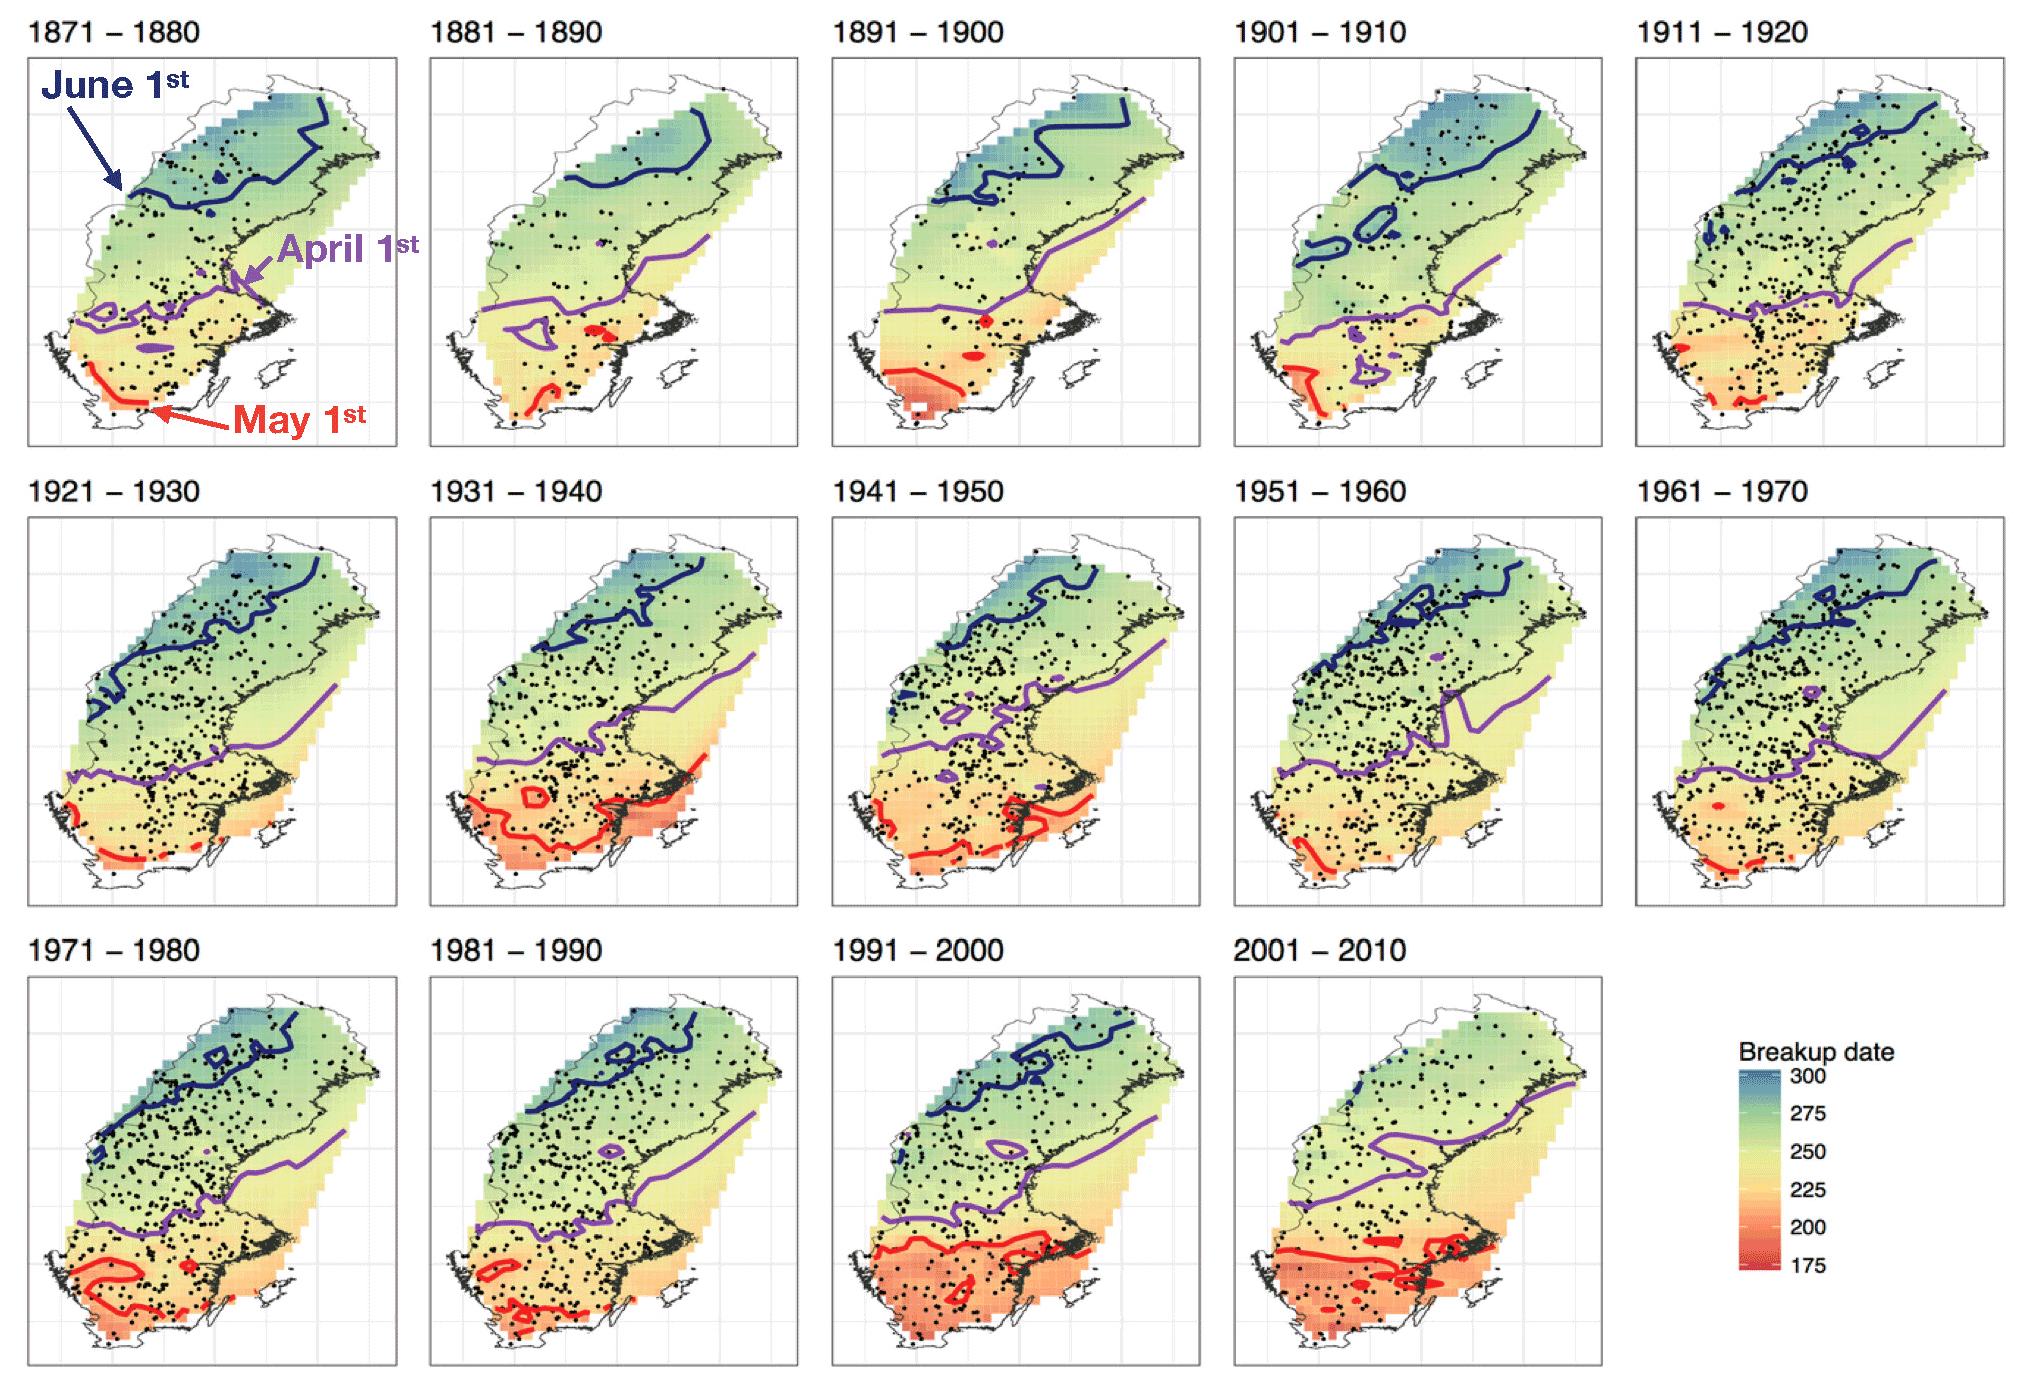
Figure 1Mean ice break-up date in Sweden over 10-year periods from 1871 to 2010. The gray line represents the outline of Sweden. Shading represents the number of days after 31 August when ice break-up occurs. The blue, purple, and red contour lines represent a break-up date by the 1 June, 1 May, and 1 April, respectively. Black dots indicate the observation sites for each 10-year period.
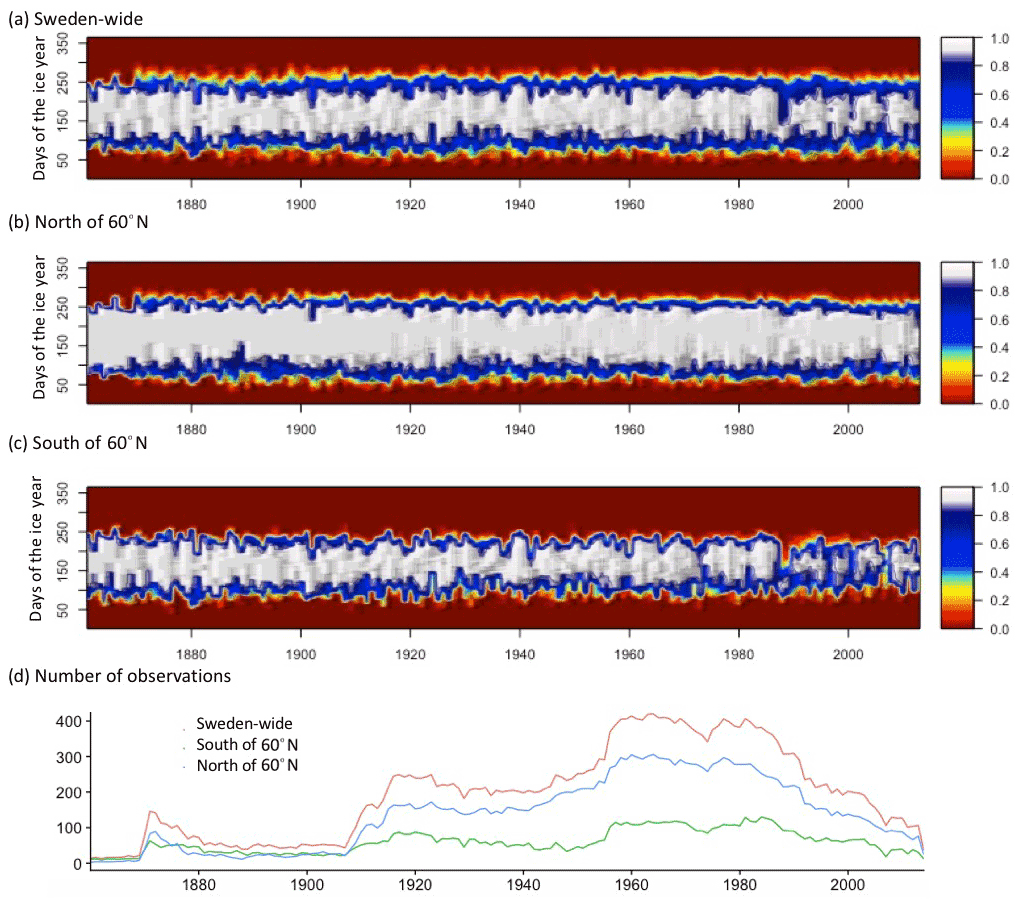
Figure 2Fraction of the total number of observed lakes and rivers with ice cover each day of the ice year (September–August) for all observed water bodies from (a) the entirety of Sweden and (b) north and (c) south of 60∘ N in Sweden from 1860–2014. White-gray coloring represents days with 90 %–100 % (i.e., 0.9–1.0) of lake-ice area covered. Panel (d) displays the number of observations each year.
Since 1870 lake ice was observed systematically and manually from the shore by an observer responsible for monitoring that lake or the part or bay of the large lake (Eklund, 1999). Some records date back even longer and come for example from records taken from boats. While most observations used here were provided by SMHI, Torne River observations were made by the Finnish Environmental Institute (SYKE). The “freeze date” is defined as the first date after which the whole lake, except for small segments, is ice covered for a minimum of 3 consecutive days (Eklund, 1999). Moreover, the “break-up date” is the day the entire lake becomes free of ice, except for small parts of ice close to the shore and around obstacles (Eklund, 1999).
In this study, we define ice duration as the number of days between the first freeze date and the last break-up date. The ice year is defined from 1 September to 31 August. The date 1 September was selected for practical reasons after finding very few observations of freeze dates prior to or break-up dates after it. Lakes and rivers may have multiple freeze and break-up dates during a winter period. For consistency, here we use the first freeze and last break-up dates for data analysis. Moreover, we do not separate years with no ice cover from years with no data, since no records exist for years without ice cover. The observations include lakes, and some rives with a variety of sizes. For big lakes, such as Vänern (5650 km2) or Mälaren (1072 km2), a smaller somewhat separated part, often a bay, is observed.
One source of uncertainty is that the lengths of ice records vary significantly. Selecting a common period of overlap would lead to elimination of significant observations. To address this issue and to utilize all the observations, we have used different time periods for different statistical analyses. Depending on the method, we designed the periods such that we can incorporate as much of the data as possible in our analysis. Other potential sources of uncertainties include human error in observations and later manual digitalization. The SMHI notes that the definition of freeze and break-up during observations and digitalization of the data might not have always been consistent.
2.2 Statistical tests, trends, and spatial analyses
We analyzed the mean break-up dates over 10-year intervals from 1871 to 2010 (Fig. 1) using all observations over the time period, and implemented bivariate interpolation into a grid for irregularly spaced input data. Bilinear interpolation is applied using algorithms from the R package “Akima” and “interp” function (Akima et al., 2016). The mean value was used for observations sites with more than 1 year of data (duplicates). As a result, each observation site is only represented once; however, the mean value used can be a combination of 1–10 years of data for that point.
Records were tested for statistically significant trends from 1913 to 2014 for ice duration, freeze and/or break-up dates. A significance level of 95 % was used to evaluate trends in the ice phenology variables (freeze date, break-up date, and ice duration). The Mann-Kendall R package “Kendall” (McLeod, 2011) was used to perform the trend tests (Kendall, 1938). Observation points with at least 81 years of recorded data from the 101-year time period (maximum of 20 % missing data) were used in the analysis.
Moreover, we used ordinary least squares via the lm() function in the R package “stats” to compute the slope of the best linear fit for the temperature and ice variables. The slopes serve as a measure of the change in the number of days (of ice duration, freeze date, or break-up date) per 1 ∘C temperature increase (Fig. 6).
3.1 Earlier ice break-up since the end of the 19th century
We analyze all break-up date observations from 1871 onward, since systematic observations started in 1870 (Eklund, 1999). Figure 1 presents the mean break-up dates from 1871 to 2010. We generated the maps shown in Fig. 1 by bilinearly interpolating the data gathered by the Swedish Meteorological and Hydrological Institute (SMHI) across the country. As time progresses in Fig. 1, the area with break-up dates after June decreases (blue contour), and the areas of break-up prior to April (purple contour) and May (red contour) move northward. From 1871 to 1930 and 1951 to 1970 the geographical mean break-up pattern is similar, while the years 1931 to 1950 display a larger area with break-up before April. Ice break-up prior to June even extends into the northwest mountain areas of Sweden during 2001–2010. The largest differences in break-up dates are found in the later period of 1991 to 2010. In the last time period (2001–2010), the ice break-up generally occurred prior to the first day of June even in the northern part of Sweden. Figure 1 also presents where observations were recorded over each decade. Note that there is a change in the number of observation points (Fig. 2). There are less observations in the first four decades and a decreasing number of records during the last two decades (see Fig. 2d).
Furthermore, we analyze all water bodies with observations of freeze and subsequent break-up dates in Sweden. For each day of the ice year (September–August) from 1860–2014, Fig. 2 shows the fraction of observed water bodies across Sweden that are ice covered. In other words, the fraction represents the total number of ice observations for that specific day divided by the total number of observations available for that year. To better understand the relative fraction of ice-covered water bodies for a given year, which ranges from zero (days with no observed ice cover) to unity (days where all observed sites were ice covered), Fig. 2d quantifies the number of available observations used per year. Figure 2 further demonstrates that a decrease in ice cover duration has occurred since the 1860s. Moreover, since the late 1980s, there is a noticeable increase in interannual variability and years with extremely short ice cover duration, especially in southern Sweden (see Fig. 2), which we further investigate below.
The Torne River and Västeråsfjärden have the longest record of break-up dates in the data provided to us by SMHI. The Torne River, located on the Sweden-Finland border (see Fig. S6 in the Supplement), have observations dating back to the 18th century (Johansson, 1932; Kajander, 1995; Korhonen, 2006, Sharma et al., 2016). The data include 291 years of break-up dates (1700–2009, except 1770–1789), recorded for the downstream portion of the Torne River, close to city of Haparanda. We find a significant trend in earlier ice break-up, using the Mann-Kendall trend test with a 99 % significance level (p≪0.01). In addition, we consider the Västeråsfjärden, which is a waterway in the northwest part of the brackish lake Mälaren outside the city of Västerås, just below 60∘ N in Sweden (See Fig. S6). Despite 38 years of missing data, with the longest consecutive period of missing data being the 10-year period from 1974–1985, the Västeråsfjärden has long-term records with 234 years of break-up data (1711–2012) and 69 years of freeze data (1870–1986). The lake displays a significant trend in later freeze (p-value < 0.002); however, we do not find a significant trend in earlier break-up. See Fig. S1 for break-up observations from Västeråsfjärden and Torne River.
3.2 Significantly reduced ice duration from 1913–2014
Now we characterize the water bodies with minimal missing data by analyzing trends in the observed ice duration and freeze and break-up dates (i.e., ice phenology variables) from 1913–2014 using the Mann-Kendall trend test (Kendall, 1938; McLeod, 2011) at a 95 % significance level (Fig. 3). Lakes and rivers with a maximum of 20 % missing observations were included in the trend analysis of ice duration (40 water bodies), freeze date (47 water bodies) and break-up date (57 water bodies). Since the Mann-Kendall trend test is sensitive to missing data, and using a dataset with missing data is a source of uncertainty, we excluded many observations sites in this analysis to have higher confidence in the presented results. The time period was chosen to be able to look at long-term trends and include lakes and rivers across the entire Sweden. A longer time period would result in less water bodies or more missing data.
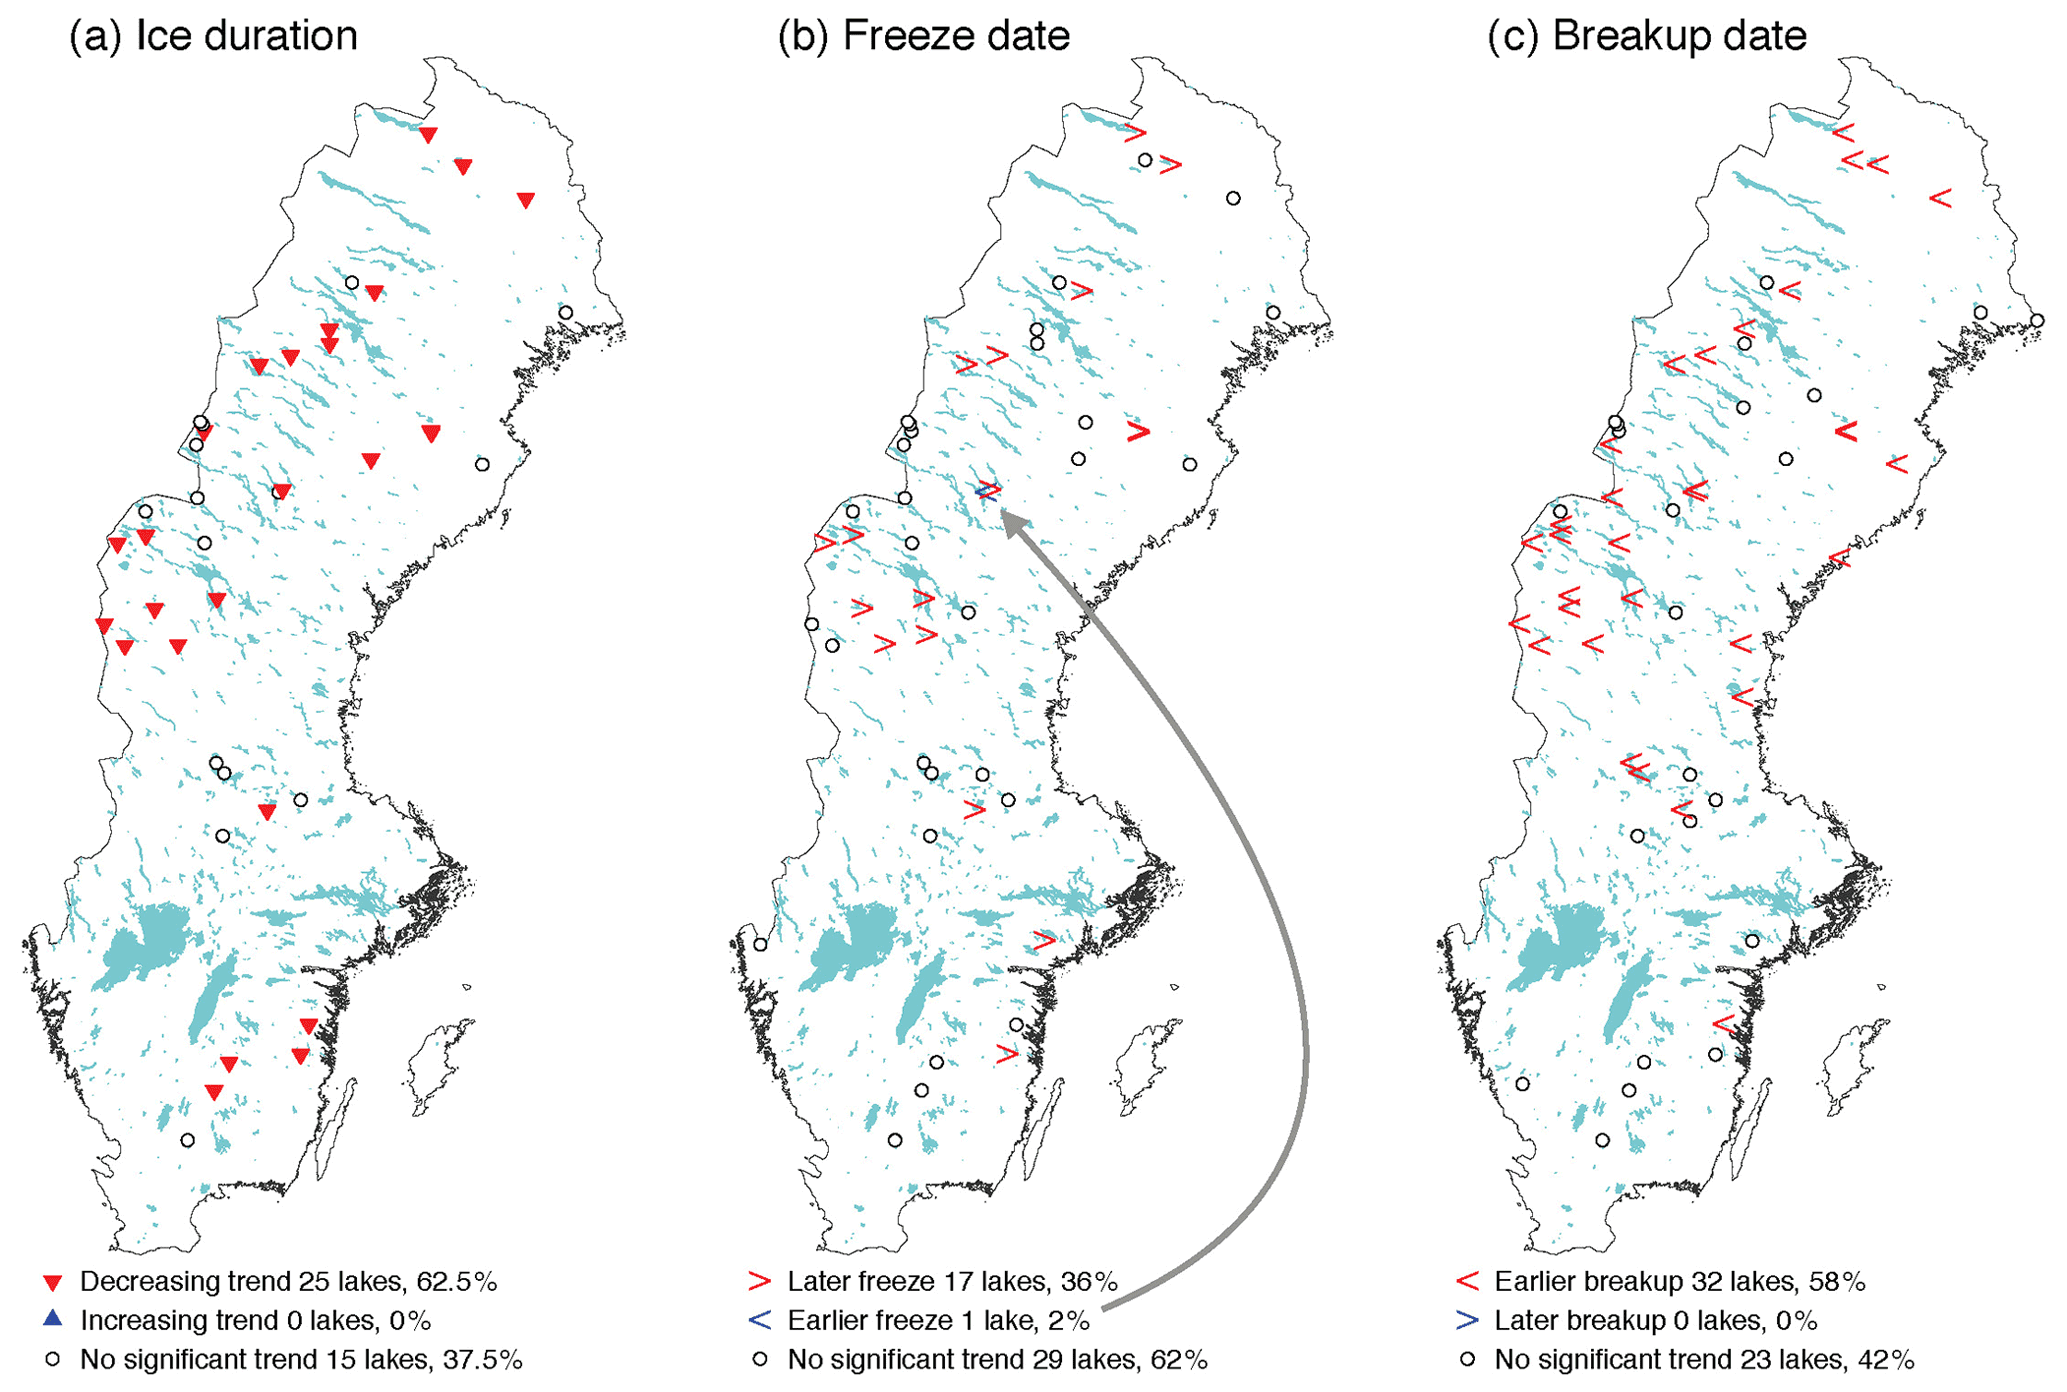
Figure 3Trends in (a) ice duration, (b) freeze date, and (c) break-up date during 1913–2014. The number of water bodies and the corresponding percentages of observation locations with statistically significant (p<0.05) or insignificant trends are indicated.
A significantly decreasing trend in ice cover duration was found for 24 of the 40 (62.5 %) water bodies (Fig. 3a). A significant trend in later freeze date was seen in 17 out of 47 (36 %) water bodies (Fig. 3b) and an earlier break-up was observed in 32 out of 55 (58 %) water bodies (Fig. 3c). The majority of water bodies with records of ice data from 1913–2014 show a significant trend in decreasing ice duration and earlier break-up. Only one lake exhibits a trend in earlier freeze, Lake Flåsjön (blue chevron in Fig. 3b).Of the water bodies 40 displayed a significant trend in at least 1 of the ice variables associated with a warmer climate, i.e., decreasing ice cover duration (Fig. 3a), later freeze (Fig. 3b), or earlier break-up (Fig. 3c). Sites with a significant trend were located both in southern (latitudes <60∘ N) and northern Sweden, and included lakes of a variety of sizes. A total of 14 water bodies showed a significant trend in all 3 ice variables associated with a warmer climate and of these sites all except 1 are located above 60∘ N (i.e., northern Sweden). Hence, our findings indicate that the ice duration is shrinking over most of our study sites in Sweden mainly driven by an earlier ice break-up and in some cases later freeze date. For the lakes represented in Fig. 3, linear regression analysis show that ice duration from 1913–2014 has decreased at −1.8 d per decade. In the same period, the freeze date occurred 0.8 d later per decade whereas the break-up date was observed 0.9 d earlier per decade.
3.3 Changes in timing of ice cover, 1985–2014 compared to 1955–1984
Figure 4 compares the distributions of observed ice duration, freeze and break-up dates for the periods 1955–1984 and 1985–2014. The analysis includes all observed sites with a maximum of 20 % missing data in the 30-year periods. The Mann-Whitney-Wilcoxon test shows a significant difference in the two samples at a 0.05 significance level for all analyzed groups in Fig. 4 (Bauer, 1972; Hollander and Wolfe, 1973). Figure 4a and d demonstrate that the ice duration has decreased over the last 30 years, with a mean decrease of about 11 and 28 d in northern and southern Sweden, respectively. The shift in the mean ice duration is larger in southern Sweden compared to the northern region. Although shorter ice durations are more common in both regions during 1985–2014 than 1955–1985, the shape of the ice duration distribution between the two time periods also more greatly differs in southern Sweden. Over the more recent 30-year period in southern Sweden, the mean freeze date occurred 10 d later (Fig. 4e), while the mean break-up date occurred 17 d earlier (Fig. 4f) than previously observed. Considering the same time periods, the shifts in the mean timing of freeze and break-up are smaller in northern Sweden, with the mean freeze date observed about 4 d later (Fig. 4b), and the mean break-up date occurring 5 d earlier (Fig. 4c) in the last 30 years. Comparing the mean temperature of the two time periods using SMHI homogenized data, the mean temperature of the later period (1985–2014) is about 0.85 ∘C warmer than during the earlier period (1955–1984).
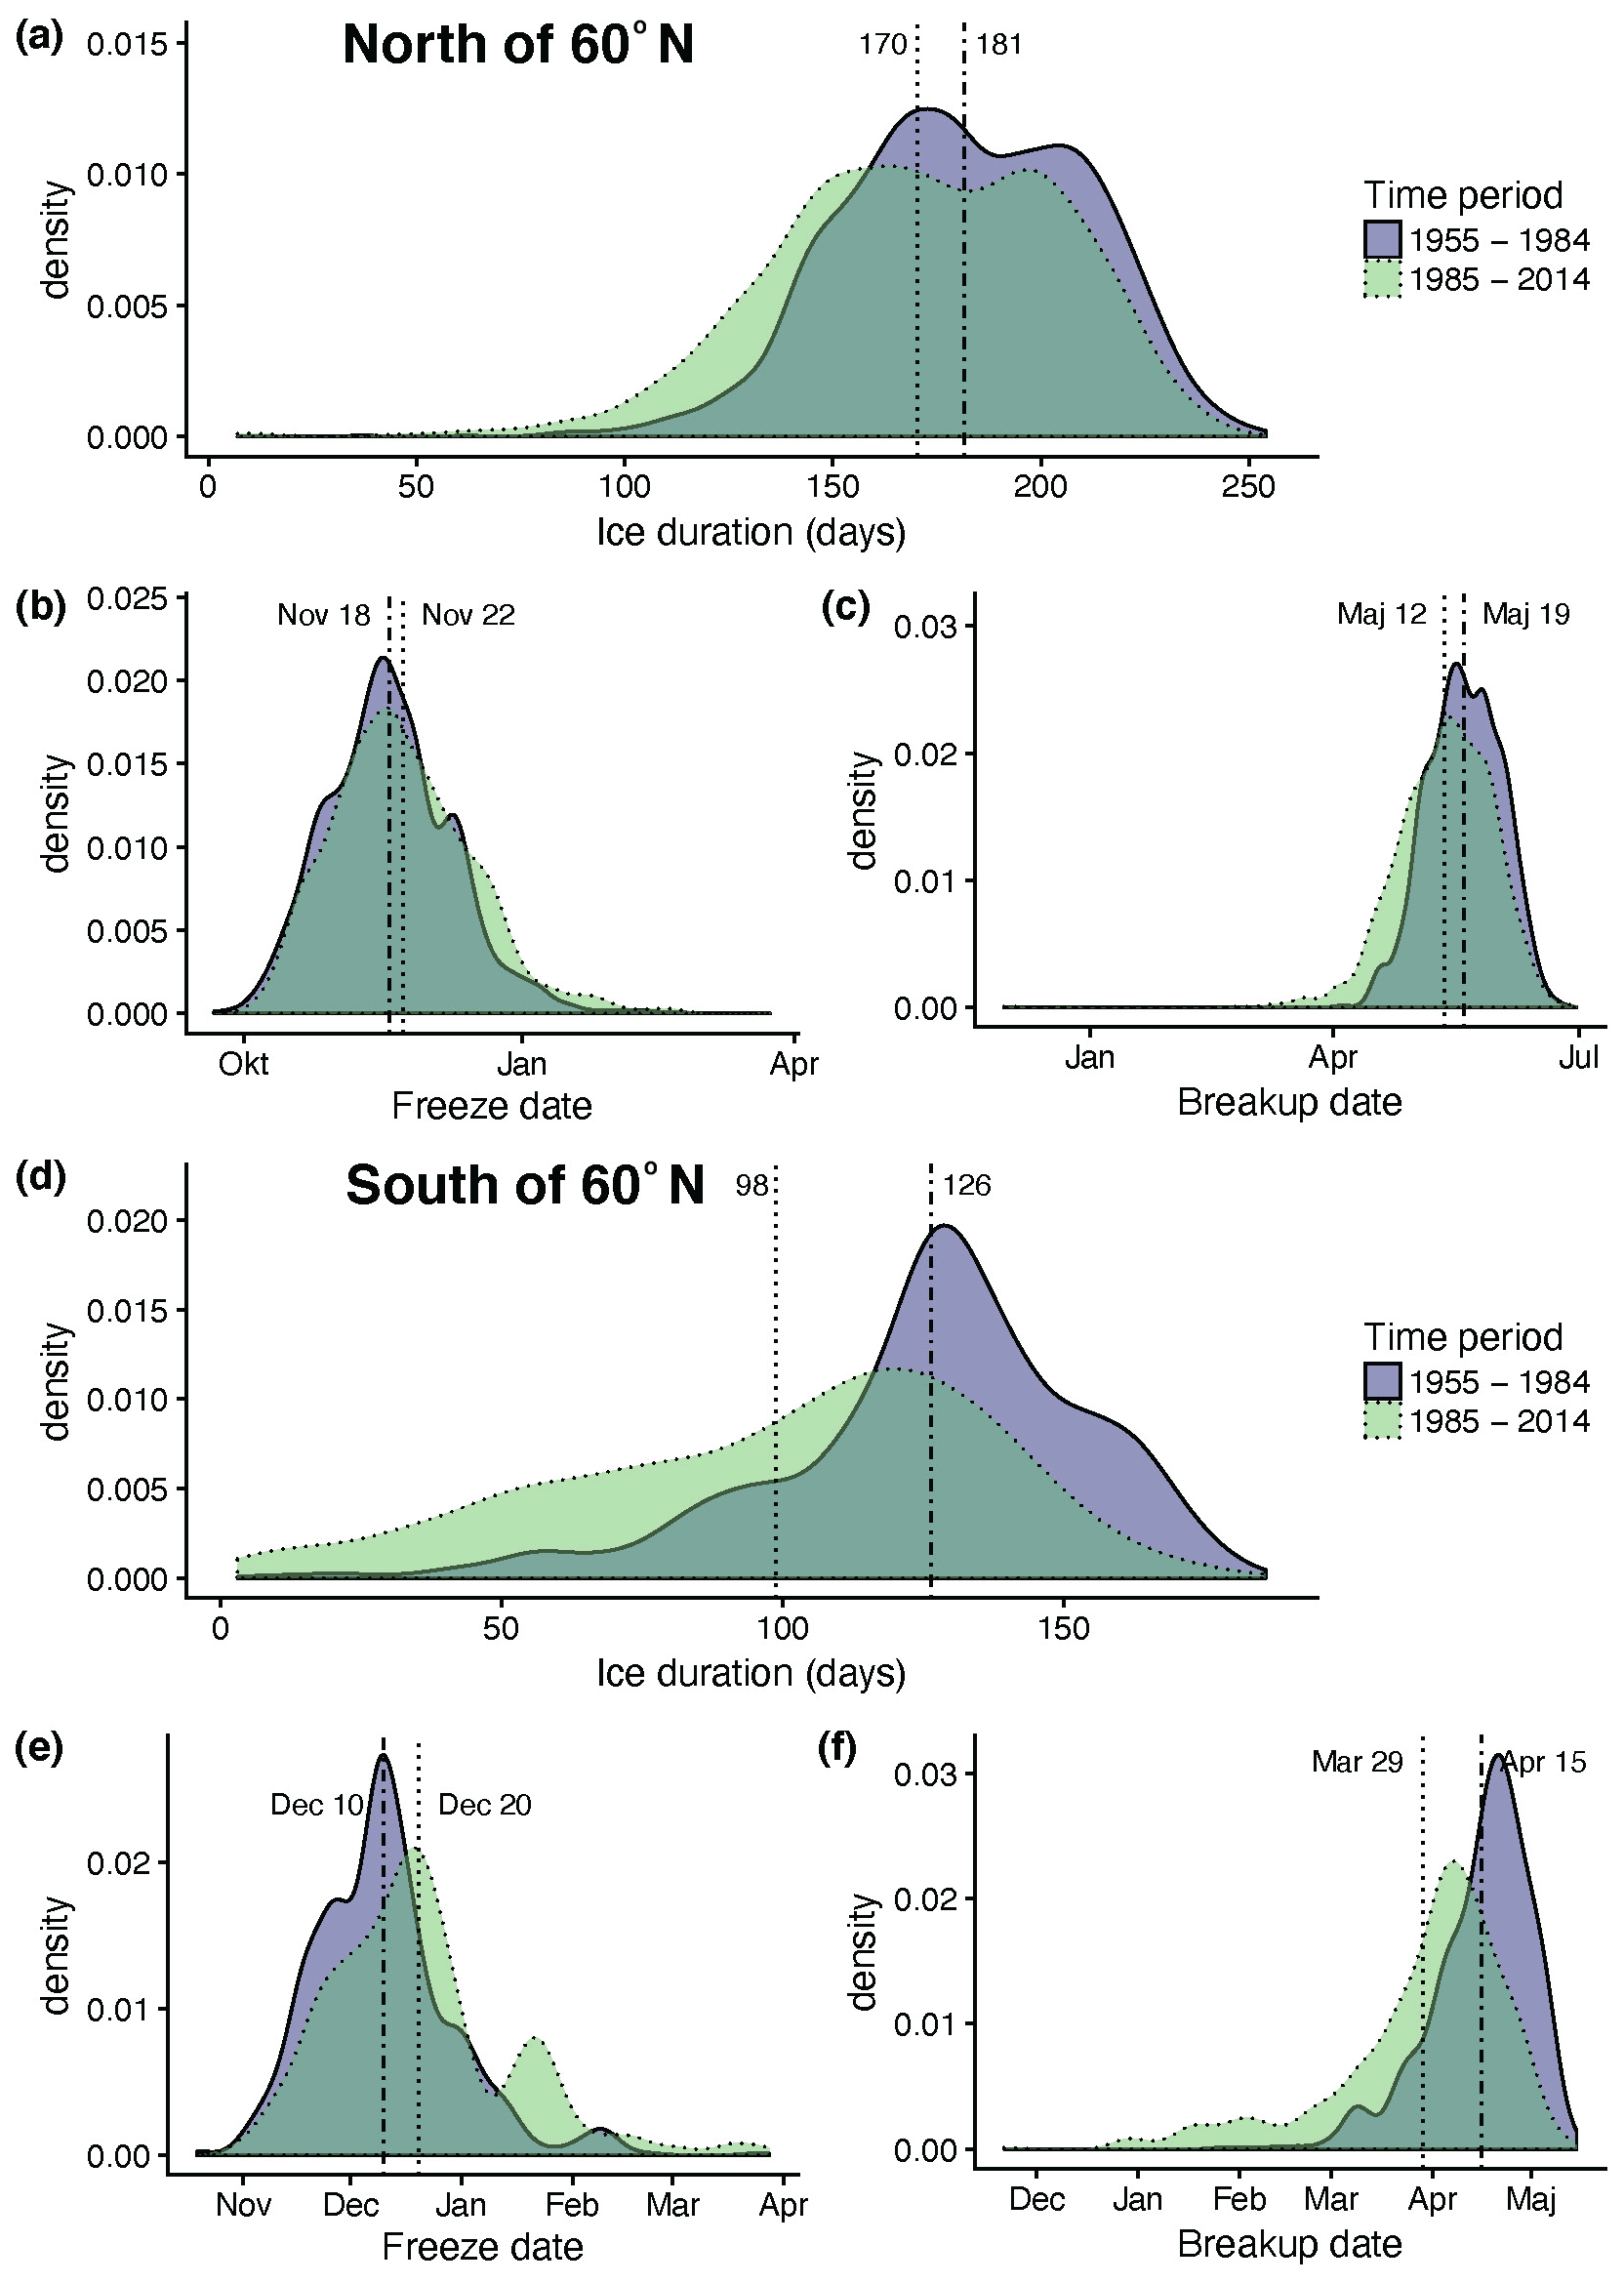
Figure 4Probability density functions for ice duration (a, d) and freeze (b, e) and break-up dates (c, f) from northern (a–c) and southern (d–f) Sweden during 1955–1984 and 1985–2014. Vertical lines represent mean values, where dot-dashed and dotted lines represent the former and latter 30-year periods, respectively.
Changes in the timing of ice cover have shifted the mean duration, resulting from an increase in extremely short durations (Fig. 4). Figure 4d indicates that during 1985–2014 southern Sweden experienced a 750 % increase in the number of years with less than 50 d of ice cover relative to the previous 30 years. In northern Sweden (Fig. 4a), an increase of 300 % was observed in the number of years with an ice cover duration of less than 100 d. Hence, Fig. 4 highlights differences in the ice duration distributions related to the geographical locations of the observations (i.e., northern vs. southern Sweden), as well as the freeze date and the morphological aspects.
An increase in the interannual variability of ice cover duration could be an early warning sign of ecological regime shift (Carpenter et al., 2011). Magnuson et al. (1997) demonstrated that such an increase in interannual variability and more frequent, extremely short durations of lake ice cover have occurred since the 1950s across Canada, the USA, Finland, Switzerland, Russia, and Japan. We also find an increase in interannual variability across Swedish lakes and rivers. The observations in Fig. 4 can be related to changes in both mean and variance described by Benson et al. (2012). We acknowledge that missing data could result in different water bodies being represented differently in the two time periods; however, we do not expect this to be a major source of uncertainty.
3.4 Historical change in ice duration per 1 ∘C of warming
To better understand the drivers of variability in the ice cover durations observed above, Fig. 5 characterizes the relationship between the local mean annual air temperatures (September–August) and ice durations using air temperature observations from the Climatic Research Unit (CRU) version 3.23 (Harris et al., 2013). A warmer mean annual air temperature corresponds to a shorter ice duration (Fig. 5). These relationships are also considered with respect to latitude (Fig. 5a) (719 water bodies) as well as mean depth (Fig. 5b), volume (Fig. 5c) and area (Fig. 5d) (464 lakes). In Sweden, the climate is much colder in the northern regions compared to the southern regions (Fig. 5a). The most northern lakes are frozen for a longer period than southern lakes in Sweden. In fact, some southern lakes might not freeze at all in the winter. This results in latitude being the overall dominant factor compared to the size (depth, volume and area) of the lake. Larger water bodies (volume, depth, or area) generally have shorter ice durations compared to smaller ones. Larger water volumes in lakes, for instance, often result in a later freeze date and therefore contribute to a shorter ice duration. The break-up date, however, is not as sensitive to the size of the lake.
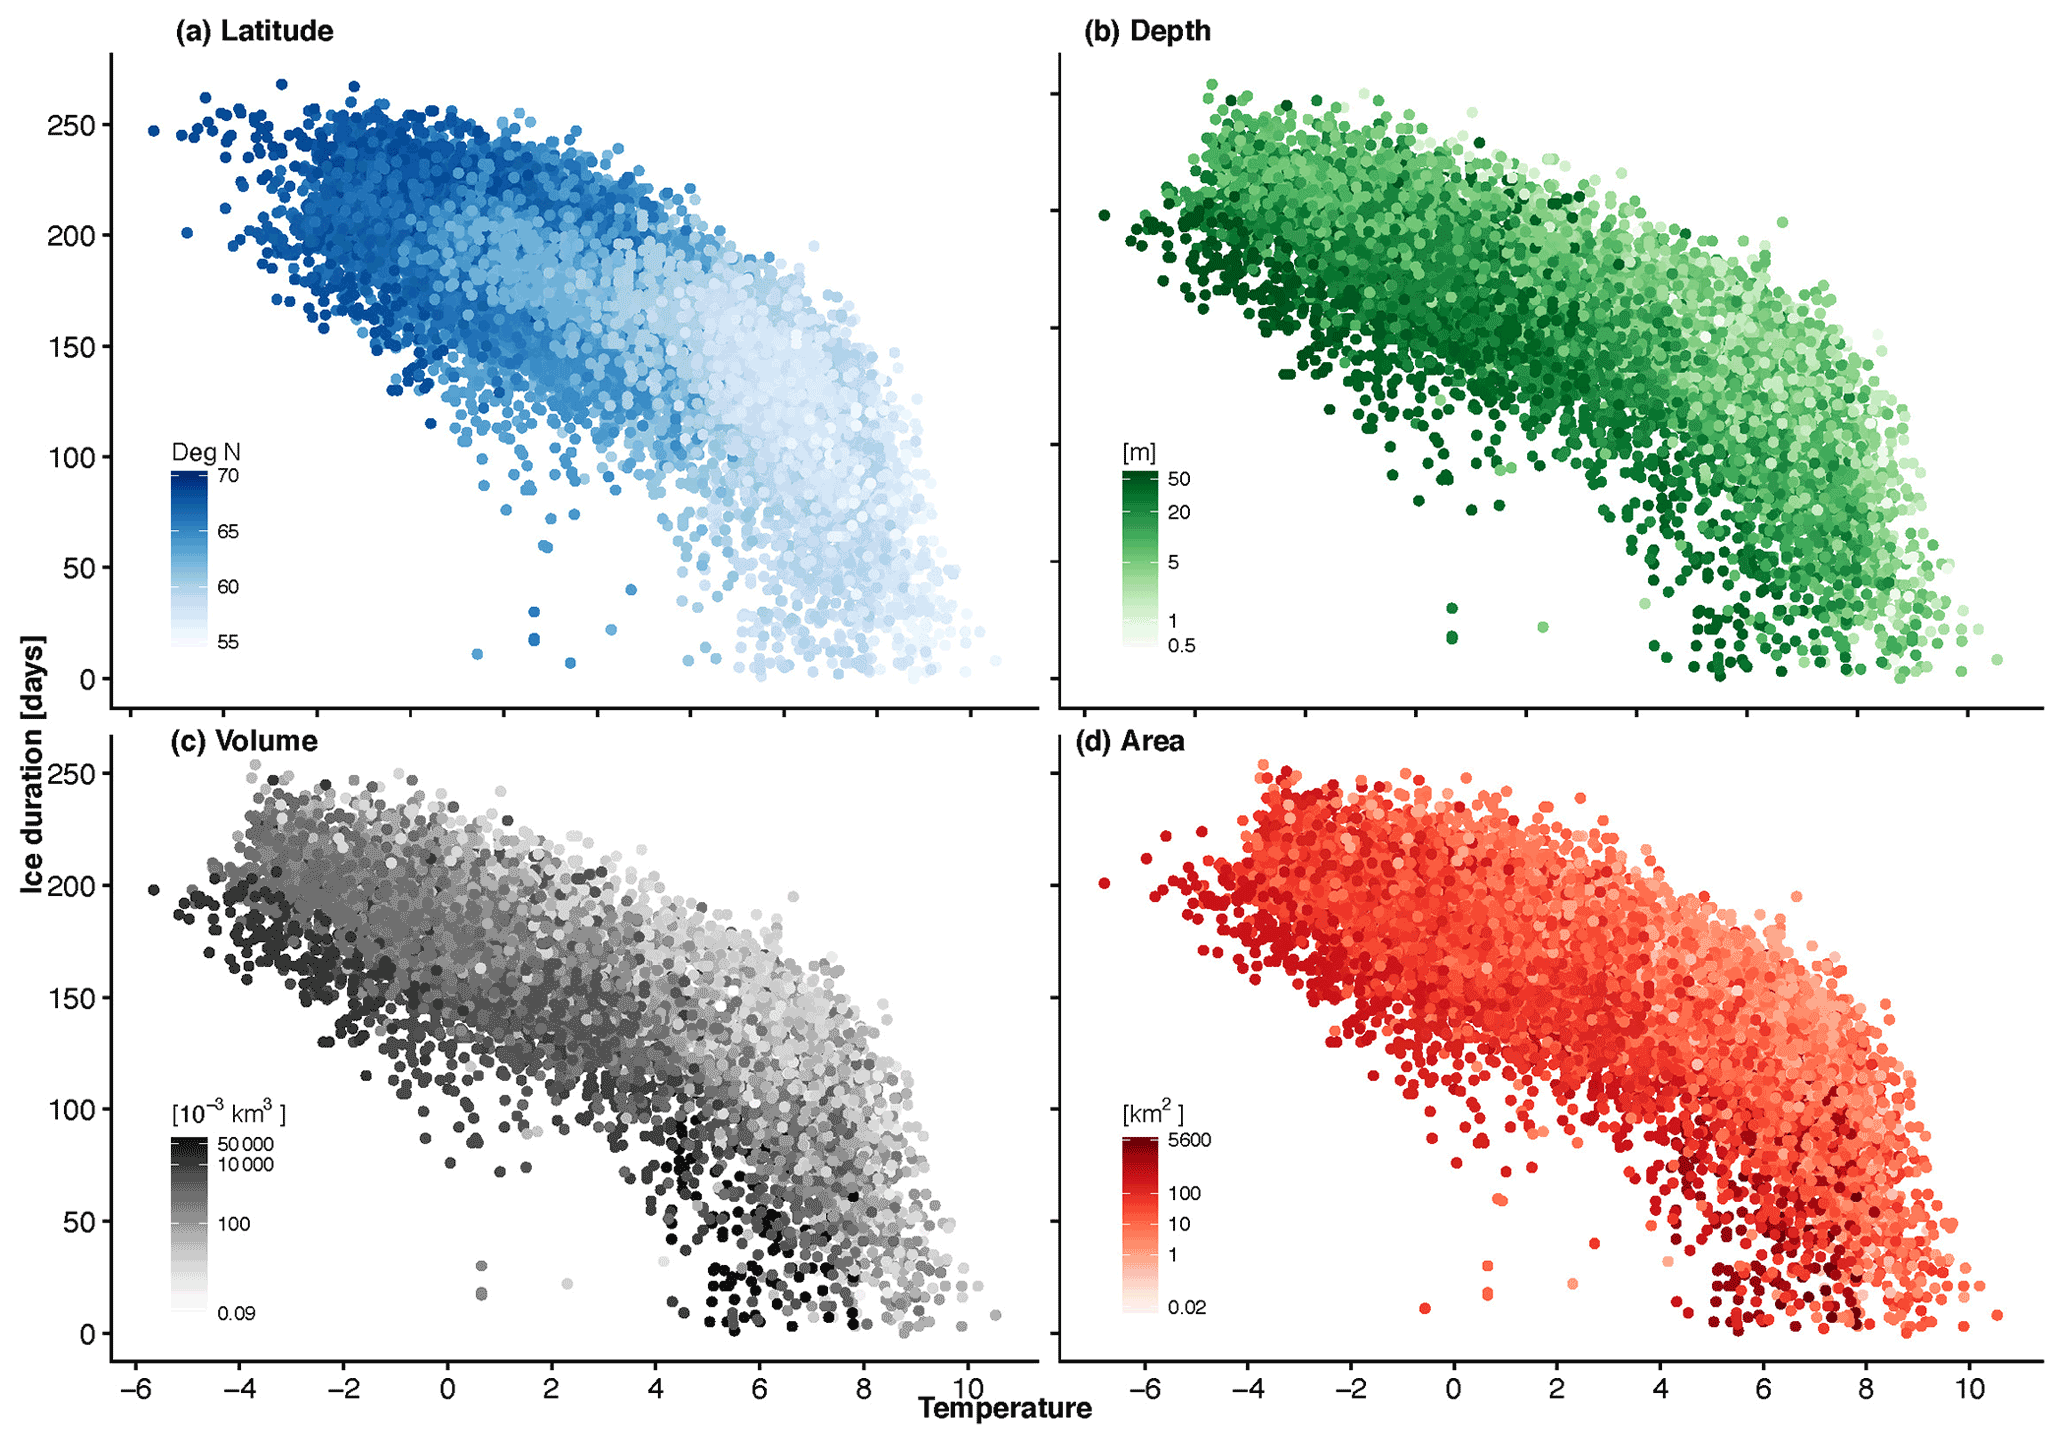
Figure 5Ice duration (days) versus mean annual air temperature (September–August) (in degrees Celsius). Colors indicate the water body (a) latitude, (b) mean depth, (c) volume, and (d) area.
We also quantified the change in ice cover duration relative to air temperature for 464 lake water bodies using temperature and ice data from 1901–2014 (Fig. 6). We applied linear regression to obtain the rate of change in ice duration for each lake relative to a historical air temperature. The results indicated that an increase in air temperature is related to a reduced ice duration (Fig. 6a), a later freeze date (Fig. 6b) and an earlier break-up date (Fig. 6c). For lakes with a lower latitude (southern Sweden) we see more sensibility per 1 ∘C increase than at higher latitudes. In southern Sweden (below 60∘ N), mean ice duration decreases by 22.5 d per 1 ∘C increase, with the mean break-up date occurring 11.2 d earlier, and the mean freeze date occurring 8.1 d later. In northern Sweden, the shift per 1 ∘C increase is smaller, with mean values for ice cover duration decreasing by 7.6 d, the freeze date occurring 3.6 d later, and the break-up date occurring 4.4 d earlier per 1 ∘C of warming (see also Figs. S4 and S5 for more information on break-up date and freeze temperature relationships).
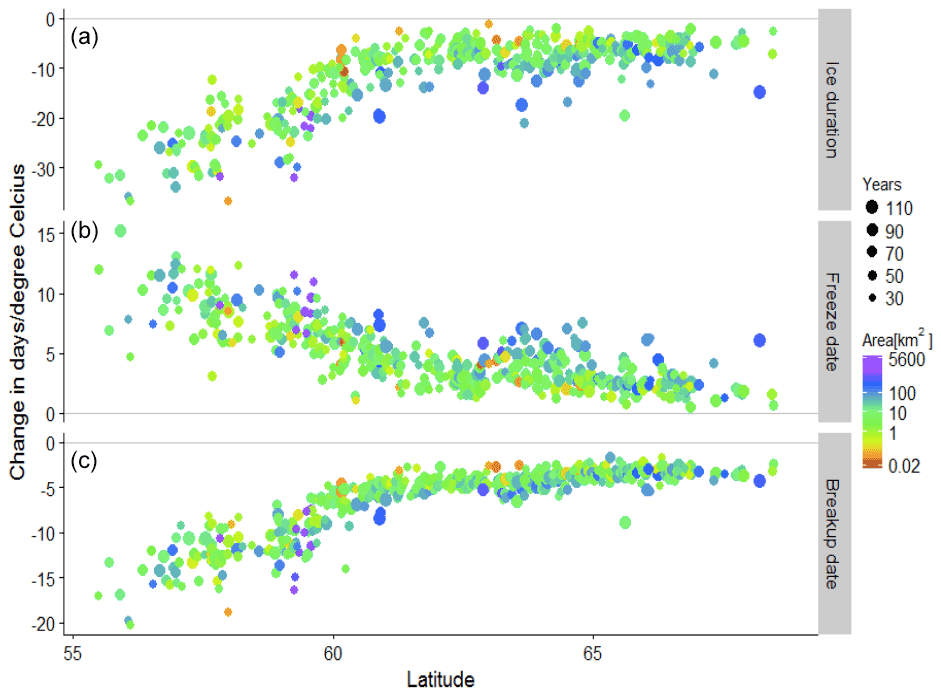
Figure 6Change (in days per 1 ∘C increase in air temperature) in (a) ice duration relative to annual mean temperature, (b) freeze date relative to mean temperature from October–December, and (c) break-up date relative to mean temperature from March–May based on the linear regression of air temperature and observation date each year for each lake. For the freeze and break-up, negative (positive) values represent earlier (later) dates with increasing temperature. Marker colors represent the area of the lake, while marker sizes denote the number of years with both lake ice and temperature observations.
We show that for many water bodies in Sweden, freeze dates are occurring later in the season while break-up dates are occurring earlier (Figs. 1–4). As a result, the ice cover duration has decreased in many of the observed lakes (Figs. 2–4). Moreover, we find an increase in the number of years with extremely short ice cover duration (Fig. 4), especially in the last 30 years (i.e., 1985–2014) in southern Sweden (latitudes < 60∘ N). The break-up date is similar for lakes in similar geographic regions and is not dependent on the size of the lake (Eklund, 1999). As shown in Fig. 1, earlier ice break-up was observed over all of Sweden.
Earlier ice break-up affects the productivity and biodiversity of phytoplankton (Leppäranta et al., 2003), reduces winter-dependent zooplankton species, and decreases fish production while increasing winter fish deaths (Watz et al., 2015; Leppäranta et al., 2003). Moreover, with a decrease in ice duration, the photosynthesis in the lakes and rivers extends longer into the fall season and starts sooner in the spring. Longer durations without ice cover have a larger impact on the mixing patterns of the lake. Moreover, the depth of the mixing layer is related to light availability, phytoplankton density, and the carbon to nutrient ratio of phytoplankton, as well as zooplankton biomass, which may have effects on higher trophic levels (Berger et al., 2006).
We demonstrate that ice cover duration has decreased in Sweden, and thereby the periods with suitable conditions for the use of frozen rivers and lakes as ice roads in northern Sweden have decreased by approximately 7 d of ice cover per 1 ∘C of air temperature increase. Here, we investigate changes in the ice cover duration from first complete ice cover to complete break-up; however, further investigation of changes in ice thickness would be beneficial for assessing the safety of transportation over ice as well as the occurrence of multiple ice periods. Similarly, while the season for ice-related recreational activities will shorten, again other factors such as ice thickness should be taken into account for the safety of individuals partaking in activities on frozen water bodies.
In Sweden, a more drastic shift in ice break-up dates is expected with increasing air temperature in temperate regions (average air temperatures of 5–7 ∘C) compared to colder regions (−2–2 ∘C) (Weyhenmeyer et al., 2004). Our results reveal that drastic changes in southern Sweden appear to already be occurring (Fig. 4). Similar results were also found in Finland, with a larger change in southern compared to northern Finland (Korhonen, 2006). Weyhenmeyer et al. (2004) found that the nonlinear relationship between break-up date and the mean annual temperature across Sweden can be represented using an arc cosine function. They also analyzed the amplitude of annual air temperature cycles as a proxy for solar radiation, concluding that in climate regions with larger temperature differences between winter and summer months, the sensitivity of ice duration to temperature changes is smaller than in regions with a smaller annual air temperature amplitude (difference from maximum to minimum temperature). Thus, lakes and rivers in the southern part of Sweden are more vulnerable to increasing temperature than regions with a larger temperature difference between summer and winter months.
During the period of 1959–2014, southern Sweden exhibited a large rate of change in ice duration according to the studies found and referenced herein (Table S1 in the Supplement). According to SMHI harmonized temperature data, the mean change in air temperature in Sweden was about +0.09 ∘C per decade from 1901–2014 (Alexandersson and Moberg, 1997; Moberg and Alexandersson, 1997; Moberg and Bergström 1997). Here we observed 1.9 d per decade less ice duration during the same period. For comparison with previous studies, Table S1 summarizes the changes in ice duration, freeze date and break-up date from previous studies on inland ice cover (Magnuson et al., 2000; Benson et al., 2012; Takács, 2011; Latifovic and Pouliot, 2007; Jensen et al., 2007; Hodgkins, 2013). For the most part, our updated rates indicate a more rapid change in ice properties in recent years. For example, in our analysis for the period 1959–2014, the corresponding rates of change for later freeze (+2 d per decade) and earlier break-up dates (−2.9 d per decade) across Sweden are 3 and 4 times faster, respectively, than those reported in Magnuson et al. (2000) for lakes across the Northern Hemisphere from 1846–1995 (Table S1).
Moreover, air temperatures at high latitudes are increasing more rapidly than the global mean temperature, making studies related to lake and river ice increasingly more important. Historical data and model predictions indicate that the average temperature of cold days has increased more than the mean temperature in eastern and northern Europe (Vautard et al., 2014; Kjellström, 2004). Hence, the winter temperatures of this region are likely to be more affected by climate change than the annual mean temperature. Sharma et al. (2021) suggested that rapid changes in northern ice pattern can be due to the polar amplification (Post et al., 2018). More research in this area is warranted to quantify or isolate the effects of polar amplification and investigate other potential drivers, such as oceanic and atmospheric circulation patterns (Korhonen, 2019).
Future research is needed to assess the influence of reduced ice cover duration on the lake and river water quality and ecology including potential eutrophication, acidification, regulation, and flow pattern changes. The consequences of the release of nutrients and oxygen-demanding substances cannot yet be forecast for ice covered lakes (Bengtsson, 2011). Given the significant changes in ice cover duration that we characterized across Sweden, incorporating ice cover into the overall picture of impacts on freshwater resources may be helpful for improving the understanding of variability within freshwater systems.
Finally, we acknowledge that regulation of lakes and rivers may also influence the trend in freeze and break-up dates, potentially leading to either an earlier or later freeze date than would naturally occur. Although, hydroelectric power plants expanded in Sweden in the period of 1950–1970, regulation is typically constant over time once it is established
We used the air temperature data from the Climatic Research Unit (CRU) v 3.23 (Harris et al., 2013) to assess the relationship between temperature and all of the freeze date, break-up date, and ice duration observations (Figs. 5 and 6). The spatial resolution of the CRU monthly mean air temperature data is 0.5 × 0.5∘ and the temporal coverage is 1901–2014. The average air temperature for the ice year was derived using the average of the monthly mean values from September to August.
We coupled the ice data record with information from Swedish Water Archive (SMHI, 2012) to derive information about the water body (such as location, areal extent, depth etc.). The geographic location and shape of the lakes was used to extract corresponding data from the lakes, using the shape files from SVAR (Swedish Water Archive 2012, SMHI). For larger lakes overlapping several CRU grid cells, we used the average temperature value of those cells to represent the air temperature over the lake (Figs. 5 and 6). Our analysis includes all ice observations within the time period, where large lakes with multiple observations and lakes with more observations are more frequently represented than others (Figs. 5 and 6).
In Figs. 5 and 6, ice duration was coupled with mean annual temperature from September to August. The mean correlation of ice duration and air temperature (September–August) was . Freeze date was coupled with mean temperatures from October to December, and break-up dates with mean temperatures from March to May. The break-up date has a stronger mean correlation with temperature (, temperatures March–May) compared to the freeze date (, temperatures October–December).
The ice freeze and break-up observations are available from the Swedish Meteorological and Hydrological Institute (SMHI) (https://vattenwebb.smhi.se/station/, SMHI, 2016) Air temperature data are available from the Climatic Research Unit (CRU) (Harris et al., 2013). Lake and river information are available from the Swedish Water Archive (SVAR) at SMHI (https://www.smhi.se/data/hydrologi/svenskt-vattenarkiv, SMHI, 2012).
The supplement related to this article is available online at: https://doi.org/10.5194/tc-16-2493-2022-supplement.
SH and AA conceived the study. KS and DG provided the data and offered insights into the observations and lake ice processes. SH conducted the data analysis and prepared the first draft. LSH, MP, AA, KS, and CL provided comments on the first draft. All authors read the manuscript and contributed to the discussion.
The contact author has declared that neither they nor their co-authors have any competing interests.
Publisher’s note: Copernicus Publications remains neutral with regard to jurisdictional claims in published maps and institutional affiliations.
This study was conducted at the University of California, Irvine, in collaboration with the California State University, Long Beach, and the Swedish Meteorological and Hydrological Institute (SMHI) and Lund University. We especially want to thank all who have contributed to the collection and curation of in situ ice cover observations over the years. Also, we want to acknowledge previous work by Eklund (1999) which is the basis of the data set used in this analysis. The study was a part of the master thesis by Sofia Hallerbäck.
The US authors were partially supported by the NOAA MAPP program. Sofia Hallerbäck was also partially supported by WSP Sweden and a scholarship of the Fredrika Bremer Association.
This paper was edited by Homa Kheyrollah Pour and reviewed by Faranak Tootoonchi and Laura Rontu.
Akima, H., Petzold, T., and Maeshler, M.: Interpolation of Irregularly and Regularly Spaced Data, Version 0.6–2, CRAN [code], https://cran.r-project.org/package=akima (last access: 1 September 2020), 16 December 2016.
Alexandersson, H. and Moberg, A.: Homogenization of Swedish Temperature Data. Part I: Homogeneity Test for Linear Trends, Int. J. Climatol., 17, 25–34, https://doi.org/10.1002/(SICI)1097-0088(199701)17:1<25::AID-JOC103>3.0.CO;2-J, 1997.
Bauer, D.: Constructing confidence sets using rank statistics, J. Am. Stat. Assoc., 67, 687–690, 1972.
Berger, S. A., Diehl, S., Kunz, T. J., Albrecht, D., Oucible, A. M., and Ritzer, S.: Light Supply, Plankton Biomass, and Seston Stoichiometry in a Gradient of Lake Mixing Depths, Limnol. Oceanogr., 51, 1898–1905, 2006.
Benson, B. J., Magnuson, J. J., Jensen, O. P., Card, V. M., Hodgkins, G., Korhonen, J., Livingstone, D. M., Stewart, K. M., Weyhenmeyer, G. A., and Granin, N. G.: Extreme Events, Trends, and Variability in Northern Hemisphere Lake-Ice Phenology (1855–2005), Climatic Change, 112, 299–323, 2012.
Beltaos, S. and Prowse, T.: River-Ice Hydrology in a Shrinking Cryosphere, Hydrol. Process., 23, 122–144, 2009.
Bengtsson, L.: Ice-Covered Lakes: Environment and Climate – Required Research, Hydrol. Process., 25, 2767–2769, 2011.
Eklund, A.: Isläggning Och Islossning i Svenska Sjöar, Hydrologi 81, Swedish Meteorological and Hydrological Institute, ISSN 0283-7722, 1999 (in Swedish).
Carpenter, S. R., Cole, J. J., Pace, M. L., Batt, R., Brock, W. A., Cline, T., Coloso, J., Hodgsonj, R., Kitchelld, F., Seekelll Smithand, A., Weidel, B.: Early Warnings of Regime Shifts: a Whole-Ecosystem Experiment, Science, 332, 1079–1082, https://doi.org/10.1126/science.1203672, 2011.
Dudgeon, D., Arthington, A. H., Gessner, M. O., Kawabata, Z.-I., Knowler, D. J., Lévêque, C., Naiman, R. J., Preur-Richard, A-H., Soto D, Stiassny, M., and Sullivan, C.: Freshwater Biodiversity: Importance, Threats, Status and Conservation Challenges, Biol. Rev., 81, 163–182, 2006.
Duguay, C. R., Flato, G. M., Jeffries, M. O., Ménard, P., Morris, K., and Rouse, W. R.: Ice-Cover Variability on Shallow Lakes at High Latitudes: Model Simulations and Observations, Hydrol. Process., 17, 3465–3483, 2003.
Duguay, C. R., Bernier, M., Gauthier, Y., and Kouraev, A.: Remote Sensing of Lake and River Ice, in: Remote Sensing of the Cryosphere, edited by: Tedesco, M., John Wiley & Sons, Ltd, 273–305, https://doi.org/10.1002/9781118368909.ch12, 2015.
Harris, I. P. D. J., Jones, P. D., Osborn, T. J., and Lister, D. H.: Updated High-Resolution Grids of Monthly Climatic Observations – the CRU TS3.10 Dataset, Int. J. Climatol., 34, 623–642, https://doi.org/10.1002/joc.3711, 2013.
Hodgkins, G. A.: The Importance of Record Length in Estimating the Magnitude of Climatic Changes: an Example Using 175 Years of Lake Ice-out Dates in New England, Climatic Change, 119, 705–718, 2013.
Hollander, M. and Wolfe, D.: Nonparametric Statistical Methods, edited by: Goldstein, H., Johnstone, I., Molenberghs, G., Scott, D., Smith, A., Tsay, R., and Weisberg, S., John Wiley & Sons, New York, 27–33 (one-sample), 68–75 (two-sample), 1973.
Jeffries, M. O., Morris, K., and Duguay, C. R.: Floating Ice: Lake Ice and River Ice, Satellite Image Atlas of Glaciers of the World-State of the Earth's Cryosphere at the Beginning of the 21st Century: Glaciers, Global Snow Cover, Floating Ice, and Permafrost and Periglacial Environments, US Geological Survey Professional Paper, 2012.
Jensen, O. P., Benson, B. J., Magnuson, J. J., Card, V. M., Futter, M. N., Soranno, P. A., and Stewart, K. M.: Spatial Analysis of Ice Phenology Trends across the Laurentian Great Lakes Region during a Recent Warming Period, Limnol. Oceanogr., 52, 2013–2026, 2007.
Johansson, O. V.: Isförhållandena vid Uleåborg och Torne älv. Bidrag till kännedom af Finlands natur och folk, Utgifna af Finska Vetenskap-Societen H. 84, No. 3, 1932 (in Swedish).
Kajander, J.: Cryophenological records from Tornio, Mimeograph Series of the National Board of Waters and the Environment 552, National Board of Waters and the Environment, Helsinki, 1995.
Kendall, M. G.: A New Measure of Rank Correlation, Biometrika 30, JSTOR, 30, 81–93, https://doi.org/10.2307/2332226, 1938.
Kjellström, E.: Recent and Future Signatures of Climate Change in Europe, AMBIO, 33, 193–198, 2004.
Knoll, L. B., Sharma, S., Denfeld, B. A., Flaim, G., Hori, Y., Magnuson, J. J., Straile, D., and Weyhenmeyer, G. A.: Consequences of lake and river ice loss on cultural ecosystem services, Limnol. Oceanogr. Lett., 4, 119–131, https://doi.org/10.1002/lol2.10116, 2019.
Korhonen, J.: Long-term changes in lake ice cover in Finland, Hydrol. Res., 37, 347–363, 2006.
Korhonen, J.: Long-term changes and variability of the winter and spring season hydrological regime in Finland, Helsingin yliopisto, http://urn.fi/URN:ISBN:978-951-51-2800-3, last access: 22 February 2019.
Kropáček, J., Maussion, F., Chen, F., Hoerz, S., and Hochschild, V.: Analysis of ice phenology of lakes on the Tibetan Plateau from MODIS data, The Cryosphere, 7, 287–301, https://doi.org/10.5194/tc-7-287-2013, 2013.
Latifovic, R. and Pouliot, D.: Analysis of Climate Change Impacts on Lake Ice Phenology in Canada Using the Historical Satellite Data Record, Remote Sens. Environ., 106, 492–507, 2007.
Leppäranta, M., Reinart, A., Erm, A., Arst, H., Hussainov, M., and Sipelgas, L.: Investigation of Ice and Water Properties and under-Ice Light Fields in Fresh and Brackish Water Bodies, Hydrol. Res., 34, 245–266, 2003.
Leppäranta, M., Heini, A., Jaatinen, E., and Arvola, L.: The Influence of Ice Season on the Physical and Ecological Conditions in Lake Vanajanselka, Southern Finland, Water Qual. Res. J., 47, 287–299, 2012.
Lind, L., Nilsson, C., Polvi, L. E., and Weber, C.: The Role of Ice Dynamics in Shaping Vegetation in Flowing Waters, Biol. Rev., 89, 791–804, 2014.
Livingstone, D. M. and Adrian, R.: Modeling the Duration of Intermittent Ice Cover on a Lake for Climate-Change Studies, Limnol. Oceanogr., 54, 1709–1722, 2009.
Magnuson, J. J., Webster, K. E., Assel, R. A., Bowser, C. J., Dillon, P. J., Eaton, J. G., Evans, H. E., Fee, E., Hall, R., Mortsch, L., Schindler, D., and Quinn, F.: Potential Effects of Climate Changes on Aquatic Systems: Laurentian Great Lakes and Precambrian Shield Region, Hydrol. Process., 11, 825–871, 1997.
Magnuson, J. J., Robertson, D. M., Benson, B. J., Wynne, R. H., Livingstone, D. M., Arai, T., Assel, R. A., Barry, R., Card, V., Kuusisto, E., Granin, N., Prowse, T., Stewart K., and Vuglinski, V.: Historical Trends in Lake and River Ice Cover in the Northern Hemisphere, Science, 289, 1743–1746, https://doi.org/10.1126/science.289.5485.1743, 2000.
McLeod, A. I.: Kendall: Kendall Rank Correlation and Mann–Kendall Trend Test, Version 2.2.1, CRAN [code], https://CRAN.R-project.org/package=Kendall (last access: 1 September 2020), 2011.
Moberg, A. and Alexandersson, H.: Homogenization of Swedish Temperature data. PART II: Homogenized Gridded Air Temperature Compared with a Subset of Global Gridded Air Temperature since 1861, Int. J. Climatol., 17, 35–54, https://doi.org/10.1002/(SICI)1097-0088(199701)17:1<35::AID-JOC104>3.0.CO;2-F, 1997.
Moberg, A. and Bergström, H.: Homogenization of Swedish temperature data. Part III: the long temperature records from Uppsala and Stockholm, Int. J. Climatol., 17: 667–699, https://doi.org/10.1002/(SICI)1097-0088(19970615)17:7<667::AID-JOC115>3.0.CO;2-J, 1997.
Parmesan, C. and Yohe, G.: A globally coherent fingerprint of climate change impacts across natural systems, Nature, 421, p. 37, 2003.
Pithan, F. and Mauritsen, T.: Arctic amplification dominated by temperature feedbacks in contemporary climate models, Nat. Geosci., 7, p. 181, 2014.
Post, E., Steinman, B. A., and Mann, M. E.: Acceleration of phenological advance and warming with latitude over the past century, Sci. Rep.-UK, 8, 1–8, 2018.
Prowse, T., Alfredsen, K., Beltaos, S., Bonsal, B., Duguay, C., Korhola, A., McNamara, J., Pienitz, R., Vincent, W., Vuglinsky V, and Weyhenmeyer, G.: Past and Future Changes in Arctic Lake and River Ice, AMBIO, 40, 53–62, https://doi.org/10.1007/s13280-011-0216-7, 2011.
Quayle, W. C., Peck, L. S., Peat, H., Ellis-Evans, J. C., and Harrigan, P. R.: Extreme Responses to Climate Change in Antarctic Lakes, Science, 295, 645–645, 2002.
Rosborg, I. and Kozisek, F.: Drinking Water Minerals and Mineral Balance, Edn. 2, Springer Nature Switzerland AG 2019, 175 p., https://doi.org/10.1007/978-3-030-18034-8, 2019.
Sharma, S., Magnuson, J. J., Batt, R. D., Winslow, L. A., Korhonen, J., and Aono, Y.: Direct Observations of Ice Seasonality Reveal Changes in Climate over the Past 320–570 Years, Sci. Rep.-UK, 6, 25061, https://doi.org/10.1038/srep25061, 2016.
Sharma, S., Blagrave, K., Magnuson, J. J., O'Reilly, C. M., Oliver, S., Batt, R. D., Magee, M. R., Straile, D., Weyhenmeyer, G. A., Winslow, L., and Woolway, R. I.: Widespread loss of lake ice around the Northern Hemisphere in a warming world, Nat. Clim. Change, 9, p. 227, 2019.
Sharma, S., Richardson, D. C., Woolway, R. I., Imrit, M. A., Bouffard, D., Blagrave, K., Daly, J., Filazzola, A., Granin, N., Korhonen, J., Magnuson, J., Marszelewski, W., S. Matsuzaki, S.-I., Perry, W., Robertson, D. M., Rudstam, L. G., Weyhenmeyer, G. A., and Yao, H.: Loss of ice cover, shifting phenology, and more extreme events in Northern Hemisphere lakes, J. Geophys. Res.-Biogeo., 126, e2021JG006348, https://doi.org/10.1029/2021JG006348, 2021.
Swedish Metrological and Hydrological Institute (SMHI): SVAR, Svenskt vattenarktiv, SMHI [data set], https://www.smhi.se/data/hydrologi/svenskt-vattenarkiv (last access: 1 February 2016), 2012.
Swedish Metrological and Hydrological institute (SMHI): Isläggning och Islossning, SMHI [data set], https://vattenwebb.smhi.se/station/, last access: 1 February 2016.
Takács, K.: Changes in River Ice Regime of the River Danube, Regulation 1900, In Proceedings of XXVth Conference of the Danubian Countries, 16, ISBN 9789635111510, 2011.
Vautard, R., Gobiet, A., Sobolowski, S., Kjellström, E., Stegehuis, A., Watkiss, P., Mendlik, T., Landgren, O., Nikulin, G., Teichmann, C., and and Jacob, D.: The European climate under a 2 ∘C global warming, Environ. Res. Lett., 9, 034006, https://doi.org/10.1088/1748-9326/9/3/034006, 2014.
Vörösmarty, C. J., McIntyre, P. B., Gessner, M. O., Dudgeon, D., Prusevich, A., Green, P., Glidden, S., Bunn, S. E., Sullivan, C. A., Reidy Liermann, C., and Davies, P. M.: Global Threats to Human Water Security and River Biodiversity, Nature, 467, 555–561, 2010.
Watz, J., Bergman, E., Calles, O., Enefalk, Å., Gustafsson, S., Hagelin, A., Nilsson, A. P., Norrgård, J., Nyqvist, D., Österling, M., Piccolo, J., Schneider, L., Greenberg, L., and Jonsson, B.: Ice Cover Alters the Behavior and Stress Level of Brown Trout Salmo Trutta, Behav. Ecol., 26, 820–827, https://doi.org/10.1093/beheco/arv019, 2015.
Watz, J., Bergman, E., Piccolo, J. J., and Greenberg, L.: Ice Cover Affects the Growth of a Stream-Dwelling Fish, Springer, Oecologia, 181, 299–311, https://doi.org/10.1007/s00442-016-3555-z, 2016.
Weyhenmeyer, G. A., Meili, M., and Livingstone, D. M.: Nonlinear Temperature Response of Lake Ice Breakup, Geophys. Res. Lett., 31, L07203, https://doi.org/10.1029/2004GL019530, 2004.
Weyhenmeyer, G. A., Livingstone, D. M., Meili, M., Jensen, O., Benson, B., and Magnuson, J. J.: Large Geographical Differences in the Sensitivity of Ice-Covered Lakes and Rivers in the Northern Hemisphere to Temperature Changes, Glob. Change Biol., 17, 268–275, 2011.