the Creative Commons Attribution 4.0 License.
the Creative Commons Attribution 4.0 License.
 | 24 Jun 2022
Impact of freshwater runoff from the southwest Greenland Ice Sheet on fjord productivity since the late 19th century
Mimmi Oksman
Anna Bang Kvorning
Signe Hillerup Larsen
Kristian Kjellerup Kjeldsen
Kenneth David Mankoff
William Colgan
Thorbjørn Joest Andersen
Niels Nørgaard-Pedersen
Marit-Solveig Seidenkrantz
Naja Mikkelsen
Sofia Ribeiro
Climate warming and the resulting acceleration of freshwater discharge from the Greenland Ice Sheet are impacting Arctic marine coastal ecosystems, with implications for their biological productivity. To accurately project the future of coastal ecosystems and place recent trends into perspective, palaeo-records are essential. Here, we show runoff estimates from the late 19th century to the present day for a large sub-Arctic fjord system (Nuup Kangerlua, southwest Greenland) influenced by both marine- and land-terminating glaciers. We followed a multiproxy approach to reconstruct spatial and temporal trends in primary production from four sediment core records, including diatom fluxes and assemblage composition changes and biogeochemical and sedimentological proxies (total organic carbon, nitrogen, ratio, biogenic silica, δ13C, δ15N, and grain-size distribution). We show that an abrupt increase in freshwater runoff in the mid-1990s was reflected by a 3-fold increase in biogenic silica fluxes in the glacier-proximal area of the fjord. In addition to increased productivity, freshwater runoff modulates the diatom assemblages and drives the dynamics and magnitude of the diatom spring bloom. Our records indicate that marine productivity is higher today than it has been at any point since the late 19th century and suggest that increased mass loss of the Greenland Ice Sheet may continue promoting high productivity levels at sites proximal to marine-terminating glaciers. We highlight the importance of palaeo-records in offering a unique temporal perspective on ice–ocean–ecosystem responses to climate forcing beyond existing remote sensing or monitoring time series.
- Article
(15551 KB) - Full-text XML
- BibTeX
- EndNote


Arctic coastal ecosystems are experiencing profound and rapid changes that are predicted to intensify in the near future due to ongoing climate change (Lannuzel et al., 2020). Arctic ecosystems are impacted by sea-ice thinning and retreat (Arrigo and van Dijken, 2015; Stroeve and Notz, 2018) and by increasing freshwater discharge from melting glaciers and terrestrial runoff (Hopwood et al., 2020). During the last 2 decades, freshwater runoff from the Greenland Ice Sheet (GrIS) has rapidly increased and doubled in volume, amounting to ca. 1000 Gt yr−1 today (Bamber et al., 2018; Mankoff et al., 2020), and, under a warming climate, freshwater discharge is predicted to increase in the future (Fettweis et al., 2013). Glacial freshwater discharge changes the physical and chemical properties of the water column and nutrient (e.g. nitrate, phosphate, and silica) dynamics, which in turn impact primary production, the process by which primary producers convert solar energy into organic compounds, the length of the productive season, species composition, and the distribution of biological communities (e.g. Hawkings et al., 2015; Hopwood et al., 2020). Recent studies have observed increased phytoplankton blooms and primary production rates as well as a more prolonged productive season in the high Arctic (Renaut et al., 2018; Lewis et al., 2020). However, these studies cover only the last few decades, whereas long-term records, providing the natural baseline for the recent changes, are scarce.
Greenland fjord ecosystems, at the interface between the ocean and the GrIS, maintain high biological productivity which is essential to sustain important socio-economic activities such as fisheries and harvesting of indigenous resources (mainly marine mammals). Higher-trophic-level organisms, such as mammals and birds, are typically not directly impacted by the freshwater increase, yet changes in their food sources have cascading effects with severe implications for these organisms (e.g. Berthelsen, 2014). Long-term records of primary production changes, as well as knowledge on its spatial variability, are needed to estimate the fate of these unique ecosystems under a changing climate. However, our current knowledge of freshwater impacts on marine productivity is largely based on modern observations (Meire et al., 2017; Hopwood et al., 2018, 2020) and on monitoring data spanning only a few decades (Greenland Ecosystem Monitoring programme; GEM). These studies have shown that the influence of glaciers on marine productivity depends on multiple factors such as glacier type (i.e. marine- vs. land-terminating), fjord geometry, and the resources (nutrients and light availability) that are limiting phytoplankton growth (Hopwood et al., 2020). In fjords with marine-terminating glaciers, subglacial discharge plays a key role in sustaining high productivity levels, as the upwelling meltwater plume brings crucial nutrients from the ambient deep water to the surface (Meire et al., 2017; Hopwood et al., 2018; Kanna et al., 2018). However, in the future, this nutrient source can shut down as marine-terminating glaciers retreat onto land or if glacier grounding-line depths change significantly.
The GrIS is presently losing mass (between tens of gigatons per year and ∼500 Gt yr−1) with a long-term trend of increasing mass loss; most pronounced on the western side of the ice sheet (Mankoff et al., 2021). Nuup Kangerlua (Godthåbsfjord), situated in southwest Greenland (Fig. 1), is one of the largest fjord systems in the world. The fjord is ca. 190 km long, 4–8 km wide, and up to 625 m deep and covers an area of ca. 2013 km2. The fjord has several sills; the main one is located at the mouth of the fjord at ca. 170 m water depth, with smaller sills in the side branches of the fjord (Mortensen et al., 2011). The fjord hydrography is influenced by ocean forcing (governed largely by the West Greenland Current, WGC) and both tidal and wind mixing (Juul-Pedersen et al., 2015), and the combination of atmosphere–ocean–ice forcing makes the fjord particularly sensitive to climatic changes. The main fjord branch, Nuup Kangerlua, is heavily influenced by glacial discharge and acts as a gateway for iceberg outflow, while the three side branches, Kapisillit Kangerluat, Qoornup Sullua, and Uummannap Sullua, do not house large outlet glaciers and are not directly influenced by glacial discharge (Fig. 1). The average yearly freshwater runoff between 2015 and 2019 was ca. 20.9 Gt yr−1, and solid ice discharge was ca. 8.1 Gt yr−1 (Mankoff et al., 2020). The fjord system is heavily impacted by meltwater, especially during summer, which lowers the surface salinities (Meire et al., 2017). However, icebergs also have a significant role in the freshwater flux as they can produce up to ca. one-quarter of the total meltwater (Van As et al., 2014). The fjord receives freshwater and sediment discharge from three marine-terminating glaciers (Kangiata Nunaata Sermia, KNS; Akullersuup Sermia, AS; and Narsap Sermia, NS) and three land-terminating glaciers (Qamanaarsuup Sermia, QS; Kangilinnguata Sermia, KS; and Saqqap Sermia, SS), of which SS drains into the lake Tasersuaq, while the others drain into the fjord (Fig. 1). The turbid meltwater reduces light penetration in the inner fjord close to the outlet point of Tasersuaq, creating a large spatial contrast across the fjord (Fig. 1; Meire et al., 2017). The inner part of the fjord is annually covered by sea ice from November to May, whereas the outer part stays ice-free for most of the year. A large interannual environmental gradient exists inside the fjord as the inner part receives ice, freshwater, and sediments especially in the spring and late summer, creating salinity, temperature, and productivity gradients (Mortensen et al., 2013; Krawczyk et al., 2015b, 2018; Meire et al., 2016b, 2017).
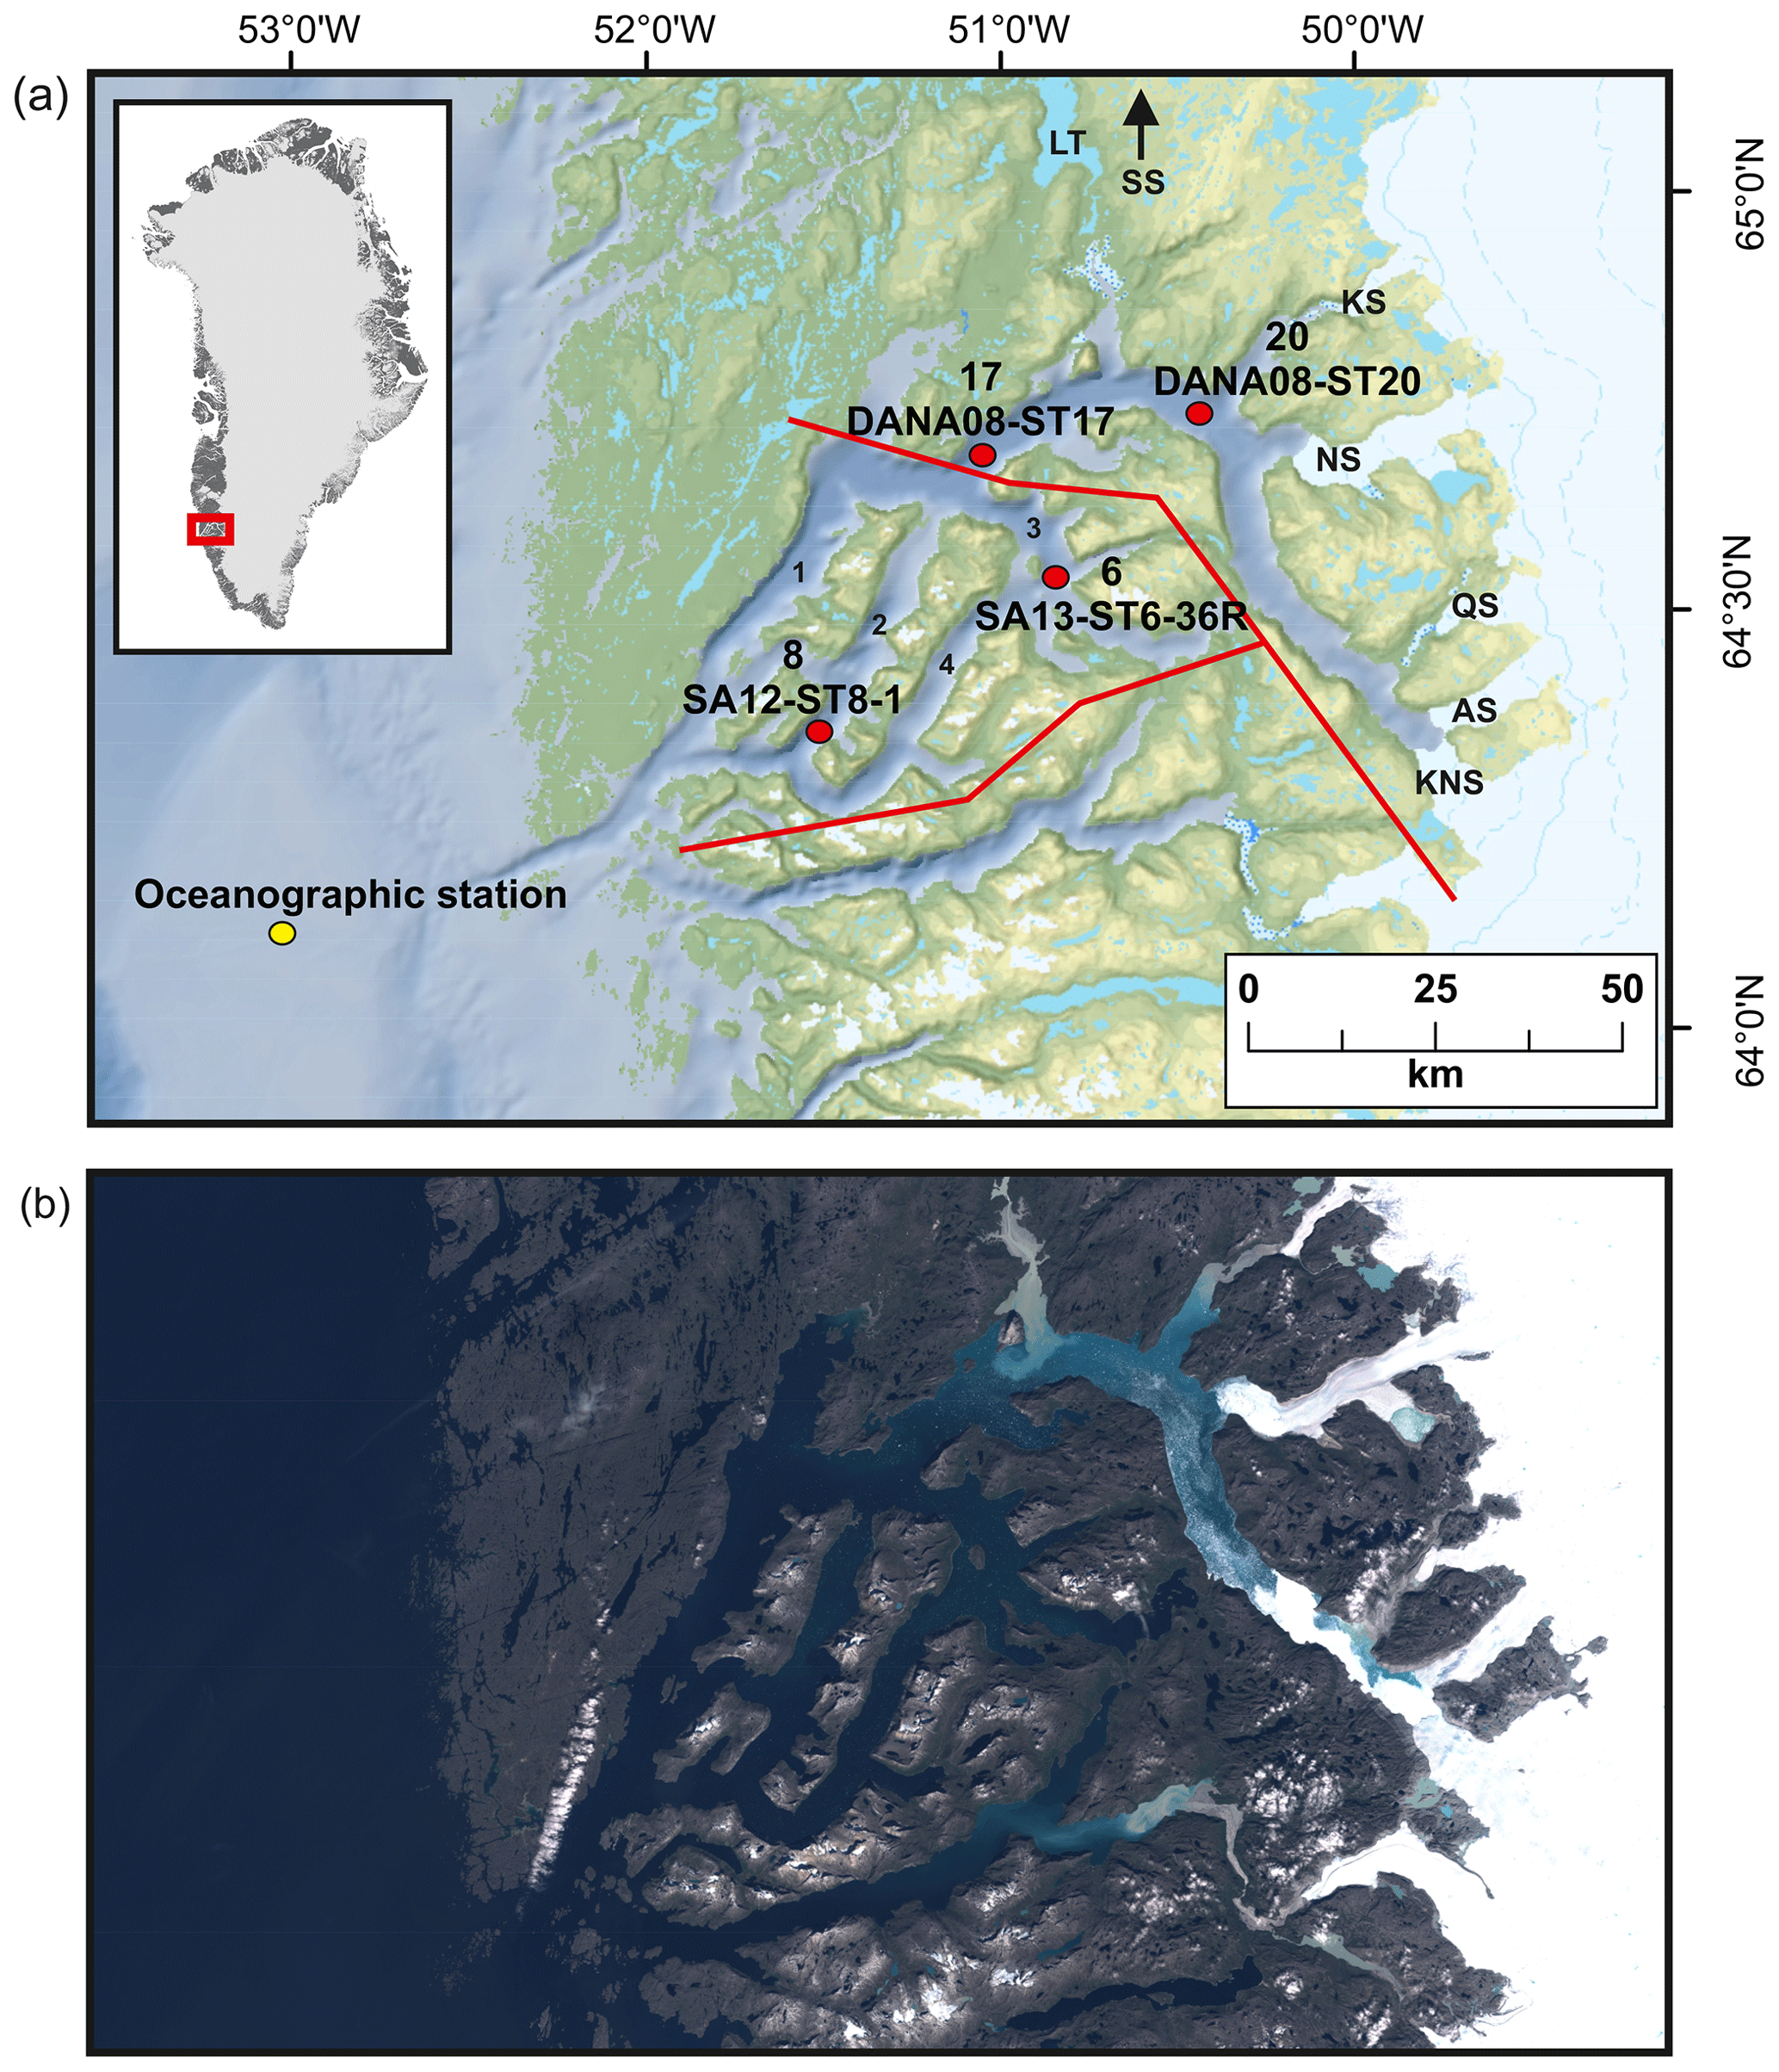
Figure 1(a) Locations of studied sediment cores (with site numbers) SA13-ST6-36R (site 6), SA12-ST8-1 (site 8), DANA08-ST17 (site 17), and DANA08-ST20 (site 20) and the main freshwater sources feeding into the fjord: Kangiata Nunaata Sermia (KNS), Akullersuup Sermia (AS), Narsap Sermia (NS), Kangilinnguata Sermia (KS), Qamanaarsuup Sermia (QS), Saqqap Sermia (SS), and the lake Tasersuaq (LT) in the Nuup Kangerlua fjord system. (1) Main fjord branch Nuup Kangerlua, (2) Qoornup Sullua, (3) Kapisillit Kangerluat, and (4) Uummannap Sullua. Yellow circle indicates the oceanographic station for sea-surface-temperature measurements (Ribergaard, 2014). Red lines mark the division into inner, outer, and southern fjord used for the freshwater runoff estimates. (b) True colour Sentinel-2 imagery of the fjord representing summer season conditions, from 9 August 2018, obtained from http://earthexplorer.usgs.gov (last access: 30 November 2021).
Present-day total annual primary production in Nuup Kangerlua is generally high (84.6–139.1 g C m−2 yr−1), and it is maintained by diverse pelagic and benthic protist communities (Juul-Pedersen et al., 2015; Krawczyk et al., 2015a, b, 2018). Two phytoplankton blooms of a similar magnitude occur each year with the first bloom taking place during the spring in April–May and the second during the summer in July–August (Juul-Pedersen et al., 2015). The spring bloom plays a major role in Nuup Kangerlua, accounting for 50 %–60 % of the annual production, and it is highly relevant for fuelling the marine food web by starting the annual productive season (Hodal et al., 2012; Meire et al., 2016b). During recent decades, phytoplankton spring blooms in the Arctic have become markedly longer and occur earlier due to sea-ice retreat (Kahru et al., 2011). However, in Arctic fjords, increased freshwater discharge has been suggested to be one of the main factors enhancing the phytoplankton spring bloom (Meire et al., 2016b). In Nuup Kangerlua, the timing, intensity, and location of the modern spring bloom is also controlled by a combination of sea-ice cover, upwelling of nutrient-rich waters, and wind forcing (Juul-Pedersen et al., 2015; Meire et al., 2015, 2016b). The spring bloom is typically dominated by pennate diatoms (that form silicified frustules), and thus the input of dissolved silica (DSi) from the GrIS is one of the critical components driving the primary production. Meltwater runoff is suggested to be tightly linked to DSi input to the fjord, with surface runoff contributing 79 %, subglacial discharge 12 %, and solid ice discharge 9 % of the total silica input to Nuup Kangerlua (Meire et al., 2016a). Together, these three mechanisms sustain a high silica concentration and primary production 30–80 km downstream of the marine-terminating glaciers, with the highest production at ca. ∼50 km off the glacier termini (Meire et al., 2016a, 2017).
Diatoms are one of the principal contributors to marine primary production in polar and sub-polar regions. The silicified frustules of diatoms sink to the seabed and, over time, become archived in sedimentary records (Hasle and Syvertsen, 1996). While diatoms are widely distributed and abundant as a group, many species have narrow ecological preferences in terms of hydrographic conditions (e.g. salinity, temperature, and light availability), which makes them an excellent tool for reconstructing past environmental and productivity changes (Hasle and Syvertsen, 1996; von Quillfeldt, 2000, 2004; Krawczyk et al., 2018; Oksman et al., 2019; Weckström et al., 2020). In Nuup Kangerlua, diatom assemblages have been shown to respond mainly to physical conditions in the water column (temperature and salinity) rather than to biogeochemical properties (e.g. nutrients), and especially glacial discharge appears to favour diatoms more than other protist groups (Krawczyk et al., 2015b, 2018).
Recent studies on primary production around Greenland have focused either on process-level understanding, characterizing dynamics during the productive season, or on the annual cycle of species succession (e.g. Arendt et al., 2016; Meire et al., 2016b; Krawczyk et al., 2015a, b, 2018; Holding et al., 2019; Luostarinen et al., 2020). Although some marine and coastal studies have focused on longer timescales (e.g. Limoges et al., 2020; Saini et al., 2020), records of decadal to centennial fjord productivity and particularly its response to increased freshwater discharge are poorly documented. As underlined by the Intergovernmental Panel on Climate Change (IPCC), long-term variations in fjord primary productivity remain poorly constrained, and thus we lack solid knowledge of past productivity responses to cryosphere changes that can be used as a base for future projections (Bindoff et al., 2019).
The aim of this study is to assess the impacts of freshwater runoff from the GrIS on primary productivity in the Nuup Kangerlua fjord system since the late 19th century (from ca. 1890 to the present day). We chose Nuup Kangerlua as a suitable glaciated fjord system due to its high productivity and magnitude of modern glacial discharge and because the fjord has been monitored since 2008 and is a key site for the GEM. We extracted basin-wide freshwater runoff estimates between 1900 and 2019 from model hindcasts and reconstructed trends in primary production from four dated sediment records following a multiproxy approach including diatom fluxes and assemblage composition, biogenic silica (BSi) content, composition and origin of organic matter (total organic carbon, TOC; ratio; carbon and nitrogen isotopes – δ13C and δ15N), and grain-size analysis. Alongside the freshwater runoff estimates, we interpret spatial and temporal trends in our proxy data against historical records of regional air and sea-surface temperature and changes in the front position of glaciers feeding into the fjord. Our combined records of freshwater runoff and primary production span more than a century and provide a novel insight into historical and recent changes and their spatial variability.
2.1 Sediment core material
A total of four sediment core records were included in this study, retrieved during three campaigns that took place between 2008 and 2013 (Fig. 1). During the campaigns, coring sites were carefully selected based on shallow seismic records and multibeam bathymetry data from previous research cruises (Harff et al., 2016; Jensen and Rasch, 2008; Mikkelsen et al., 2012; Seidenkrantz et al., 2014). The studied sediment cores were chosen based on their location and temporal resolution. Core SA12-ST8-1 (503 m water depth, 153 cm long; 64∘16.416′ N, 51∘19.777′ W) was retrieved from the side branch Qoornup Sullua in May 2012 (Mikkelsen et al., 2012), and core SA13-ST6-36R (398 m water depth, 96 cm long; 64∘29.076′ N, 50∘42.553′ W) was retrieved from the side branch Kapisillit Kangerluat in 2013 (Seidenkrantz et al., 2014). Both cores were collected on board the Greenlandic research vessel (RV) Sanna using a Rumohr lot. Cores DANA08-ST17 (575 m water depth, 40 cm long; 64∘37.277′ N, 50∘56.938′ W) and DANA08-ST20 (496 m water depth; 45 cm long; 64∘41.927′ N, 50∘21.566′ W) were recovered with a multicorer from the main branch of Nuup Kangerlua in 2008, on board the Danish RV Dana. This fjord branch is heavily influenced by glacial discharge as ice floes and icebergs travel through this channel to exit the fjord (Fig. 1). All sediment cores were stored in cold (4–7 ∘C) and dark conditions until opened. Sediment core sub-samples were frozen at −20 ∘C and freeze-dried before further processing. Sediment core records are hereafter referred to by their site numbers as sites 8 (SA12-ST8-1), 6 (SA13-ST6-36R), 17 (DANA08-ST17), and 20 (DANA08-ST20) and are presented in the figures following an outer-fjord–inner-fjord gradient (8, 6, 17, and 20) (Fig. 1).
2.2 Geochronology
The activity of 210Pb, 226Ra, and 137Cs was analysed from all studied cores by gamma spectrometry at the Gamma Dating Centre at the University of Copenhagen. From selected depth intervals, ca. 2 g of freeze-dried sediment was measured per sample using Canberra ultralow-background Ge detectors. The 210Pb was measured via its gamma peak at 46.5 keV, 226Ra via the granddaughter 214Pb (peaks at 295 and 352 keV), and 137Cs via its peak at 661 keV. Chronologies for each site were obtained using a modified constant rate of supply (CRS) model (Andersen, 2017), where the activity below the lowermost sample was calculated based on a regression of activity versus accumulated mass depth for the upper part of the core. The obtained chronologies were validated by 137Cs data.
2.3 Grain-size analysis
The grain-size distribution of the sediment records was analysed on 28, 19, 20, and 23 samples from sites 8, 6, 17, and 20, respectively, using two complementary methods: wet sieving and laser diffraction. For wet sieving, a minimum of 2 g of freeze-dried sediment was used to obtain the percentages of clay and silt (<63 µm), fine sand (63–150 µm), and coarse sand (>150 µm). The laser diffraction analyses were performed on a Malvern Mastersizer E/2000 to obtain the distribution of clay (<2 µm) and silt (2–63 µm). Before laser diffraction measurements, samples of ca. 0.2 g of sediment were treated with a sodium pyrophosphate decahydrate solution and ultrasonicated once for 2 min to separate aggregates.
2.4 Biogeochemical analysis
The total organic carbon (TOC) content of the sediments was measured at the Geological Survey of Denmark and Greenland using a LECO CS-200 instrument on sub-samples (1 g of freeze-dried sediment). TOC was measured in a total of 72 samples: 19 from site 8, 10 from site 6, 20 from site 17, and 23 from site 20. The inorganic carbon fraction was removed by treating the samples with HCl before measuring their TOC content. Sources of the organic material (terrestrial versus marine) were further investigated from 13 (site 8) and 10 (site 6) samples by measuring the isotopic composition of bulk organic carbon (δ13C) and nitrogen (δ15N). The isotopic composition analyses were performed at the Department of Geosciences and Natural Resources Management, University of Copenhagen. Approximately 20–30 mg of each sample was homogenized before its carbon and nitrogen content and isotopic ratios were measured by Dumas combustion (1700 ∘C) on an elemental analyser (EA; CE 1110, Thermo Electron, Milan, Italy, or Flash 2000, Thermo Scientific, Bremen, Germany). The EA was coupled in continuous-flow mode to a Finnigan MAT Delta plus or Thermo Delta V Advantage isotope ratio mass spectrometer (Thermo Scientific, Bremen, Germany).
Biogenic silica was measured at the Geological Survey of Denmark and Greenland according to the 5 h Na2CO3 extraction method (DeMaster, 1991) in a total of 100 samples: 40, 17, 20, and 23 samples from sites 8, 6, 17, and 20, respectively. Samples of 30±1 mg of freeze-dried sediment were leached using 40 mL of 1 % sodium carbonate (Na2CO3) in an 85 ∘C water bath for 5 h. Sub-samples (1 mL) were taken after 3, 4, and 5 h of extraction and measured with a spectrophotometer Jenway 7305 using the blue ammonium-molybdate method (Mullin and Riley, 1955). Final biogenic silica concentrations were calculated and corrected for mineral dissolution using the intercept of a linear regression line through 3, 4, and 5 h sub-samples under the assumption that all biogenic silica dissolved during the first 2 h, whereas minerogenic silica dissolves slowly at a constant rate throughout the extraction (Barão et al., 2015).
2.5 Diatoms
Diatom microscopy slides were prepared according to Battarbee et al. (2001) at the Geological Survey of Denmark and Greenland from 48, 21, and 20 samples from sites 8, 6, and 17, respectively. Approximately 0.1 g of sediment per sample was treated with 10 % hydrochloric acid (HCl) and 30 % hydrogen peroxide (H2O2) in an 80 ∘C water bath for 4 h to remove carbonates and organic material. Afterwards, samples were rinsed with distilled water and spiked with 0.1 mL of a microsphere solution of 6.13×10⁶ spheres mL−1. Slides were then mounted using Naphrax® with a refractive index of 1.73. Diatom slides were analysed with an Olympus BX51 light microscope using phase contrast optics at 1000× magnification, and a minimum of 300 valves were counted (excluding Chaetoceros). Diatom concentrations (valves g−1 dry sediment) were calculated using the sum of microspheres counted per total diatom sum and the number of microspheres added in the diatom sample. The non-linear ordination method of correspondence analysis (CA) was utilized using the program PAST version 4.02 (Hammer et al., 2001) to detect ecological shifts and the major patterns of variation in the diatom assemblages. CA was run on relative abundance data for all taxa representing >1 %, and the resulting sample eigenvalues give a measure of the variance accounted for by the corresponding eigenvectors. To test correlation between CA axis scores, diatom taxa, grain size, geochemical parameters, and environmental variables (runoff, air and sea-surface temperatures), a Pearson product-moment correlation coefficient and the associated level of statistical significance (p<0.05) were used on the 5-year running mean average for each time series.
2.6 Freshwater runoff 1900–2019
We used regional climate model data to obtain runoff estimates for the period 1900–2019. For the period 1979–2019, we used the Greenland liquid water runoff dataset (Mankoff et al., 2020). This dataset is based on MAR v3.11, which is driven by the most recent reanalysis data ERA5 (Delhasse et al., 2020). For the period prior to 1979, we used MAR v3.5 (Fettweis et al., 2017), which is based on 20CRv2c reanalysis (Compo et al., 2011). The runoff data from the Greenland liquid water discharge dataset are considered to be more accurate than the MAR v3.5 dataset, and thus, the latter data series was calibrated prior to merging of the two datasets. Modelled runoff from both ice and tundra surfaces were extracted for the Nuup Kangerlua basin partitioned into three regions (Fig. 1) – inner, outer, and southern part of the fjord – in order to investigate spatial differences between the four sediment core sites.
2.7 Glacier front position
To assess temporal changes in the front positions of the outlet glaciers feeding into Nuup Kangerlua, we use historical aerial and satellite imagery. The historic imagery consists of oblique and vertical images from the Danish Agency for Data and Infrastructure, supplemented with CORONA imagery from the 1960s and satellite data from different Landsat missions retrieved from http://earthexplorer.usgs.gov (last access: 30 November 2021). All imagery was georeferenced relative to a 2 m ortho-photo mosaic (Korsgaard et al., 2016), which in this area of Greenland is based on aerial stereophotogrammetric imagery from summer 1985. The georeferencing is based on the method outlined by Bjørk et al. (2012).
3.1 Geochronology
The relatively high sedimentation rates since the late 19th century allowed for obtaining fjord records with a sub-decadal resolution for all the cores (average sample resolution between 2 and 6 years).
For site 8, the 210Pb-based chronology indicates that the upper 55 cm of the record covers the period between ca. 1890 and 2012 (Fig. 2), resulting in an average sample resolution of 2 years. Sedimentation rates are relatively high at site 8 and vary between 0.33 and 0.67 cm yr−1, with a mean of 0.45±0.1 cm yr−1 (Fig. 3).
For site 6, the topmost 21 cm of the sediment core used in this study represents the period from ca. 1890 to 2013, thus giving an average sample resolution of ca. 6 years (Fig. 2). Sedimentation rates are thus lower at site 6 than site 8 and vary between 0.13 and 0.25 cm yr−1, with a mean of 0.18±0.03 cm yr−1 (Fig. 3).
The cores from sites 17 and 20 cover shorter time intervals, from 1930 to 2008 and from 1956 to 2008, respectively (Fig. 2). Sedimentation rates are higher in these glacier-proximal sites and vary between 0.24 and 1.18 cm yr−1 at site 17 (mean 0.57±0.2 cm yr−1) and between 0.46 and 2.33 cm yr−1 (mean 1.10±0.6 cm yr−1) at site 20 (Fig. 3). The sediment cores from sites 17 and 20 were analysed at 4-year and 2-year resolutions, respectively.

Figure 2Age–depth models and 210Pb and 137Cs activities for the sediment cores SA12-ST8-1 (8), SA13-ST6-36R (6), DANA08-ST17 (17), and DANA08-ST20 (20).
3.2 Grain-size distribution analysis
All the sediment cores consisted mostly of clay and silt (Fig. 3). This <63 µm fraction of the sediment varied from 90.7 % to 98.2 % (mean 96.6±1.4 %) at site 8, from 28.2 % to 93.0 % at site 6 (mean 76.7±14.7 %), from 87.3 % to 99.0 % (mean 94.2±3.2 %) at site 17, and from 88.5 % to 99.6 % (mean 96.7±2.8 %) at site 20 (Fig. 3). More detailed distribution between silt (2–63 µm) and clay (<2 µm) grains is presented in Fig. 3. The fraction of coarse material >63 µm is widely used as a proxy for ice-rafted debris (IRD) carried by icebergs that generally melt relatively close to their source. The fine-sand fraction (63–150 µm) varied between 1.2 % and 3.7 % (mean 2.2±0.7 %) at site 8, between 3.8 % and 25.5 % (mean 7.5±4.6 %) at site 6, between 0.6 % and 4.8 % (mean 2.1±1.1 %) at site 17, and between 0.2 % and 10.8 % (mean 1.9±2.4 %) at site 20, whereas the portion of the coarse-sand fraction (>150 µm) ranged between 0.2 % and 5.8 % (mean 1.2±1.0 %) at site 8, between 4.2 % and 22.2 % (mean 8.4±4.4 %) at site 6, between 0.5 % and 10.9 % (mean 3.7±2.4 %) at site 17, and between 0.1 % and 8.2 % (mean 1.4±1.7 %) at site 20 (Fig. 3). The variations in the grain sizes between the two methods are not in full agreement when it comes to the larger fraction. This might be caused by the different sample volumes used, making the wet-sieving method more sensitive for estimating the fraction of larger grain sizes.
3.3 Biogeochemical analysis
Total organic carbon (TOC) content in sediments provides an integrated signal of production, deposition, and preservation of organic matter over time, whereas the stable carbon and nitrogen isotopes and ratio can be used to infer the origin of organic matter (i.e. sourced from the terrestrial, marine, or sea-ice environments). TOC contents were highest in the most glacier-distal area (sites 8 and 6) and substantially lower at the glacier-proximal sites (17 and 20) (Table 1 and Fig. 3). Sediment ratios were calculated from the sediment cores from sites 8 and 6 and show relatively low values, thus suggesting a predominantly marine origin (Table 1 and Fig. 3).
Table 1Results of the TOC, TN, ratio, δ13C, δ15N, and BSi analyses.
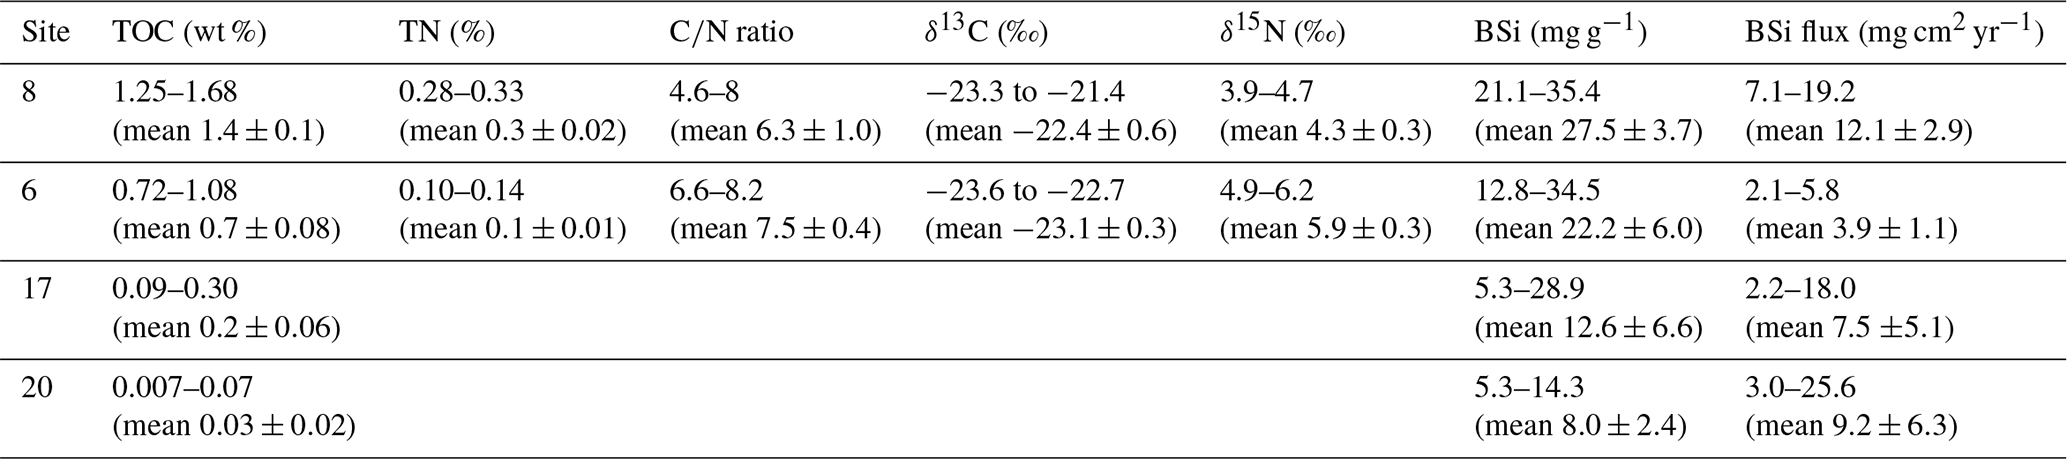
The stable nitrogen isotope composition in sediments can be used to infer nitrate (NO) supply in the euphotic zone. As phytoplankton consumes lighter nitrate, the sediment becomes enriched in the heavier (δ15N) nitrate, indicating increased productivity. The total nitrogen and isotopic composition of the sediments were not measured in the sediment cores from sites 17 and 20 due to the very low organic matter content (Table 1 and Fig. 3). Biogenic silica concentrations were higher in the glacier-distal sites than in the glacier-proximal sites (Table 1). However, when accounting for differences in sedimentation rates, BSi fluxes were higher in the glacier-proximal sites (Table 1 and Fig. 3).

Figure 3Sediment grain-size distribution (wet sieving and laser diffraction), sedimentation rate (cm yr−1), diatom flux (valves ×106 g−1 yr−1), BSi content (mg g−1 dry mass; green line) and BSi flux (mg cm2 yr−1; black line), total organic carbon (wt %), total nitrogen (%), ratio, δ13C (‰ Pee Dee Belemnite) and δ15N (‰) in sediment cores SA12-ST8-1 (8), SA13-ST6-36R (6), DANA08-ST17 (17), and DANA08-ST20 (20).
3.4 Diatoms
Diatom assemblages were both rich and diverse at all sites expect for site 20, which was virtually barren of diatoms and is discussed in Sect. 4.1. At sites 8, 6, and 17, a total of 172, 138, and 93 different taxa, respectively, were identified to the species level and 22, 21, and 10 taxa, respectively, to the genus level. Total diatom concentrations (including resting spores and vegetative forms of Chaetoceros spp.) in the sediment samples varied from 1.2×10⁶ to 12.2×10⁶ valves g−1 at site 8, from 2.3×10⁶ to 35.8×10⁶ valves g−1 at site 6, and from 2.8×10⁶ to 30.4×10⁶ valves g−1 at site 17 (Fig. 4). Annual diatom fluxes ranged between 0.5×10⁶ and 5.1×10⁶ valves cm−1 yr−1 (mean valves cm−1 yr−1) at site 8, 0.3×10⁶ to 7.2×10⁶ valves cm−1 yr−1 (mean valves cm−1 yr−1) at site 6 and between 0.8×10⁶ and 15.8×10⁶ valves cm−1 yr−1 (mean valves cm−1 yr−1) at site 17 (Fig. 3).
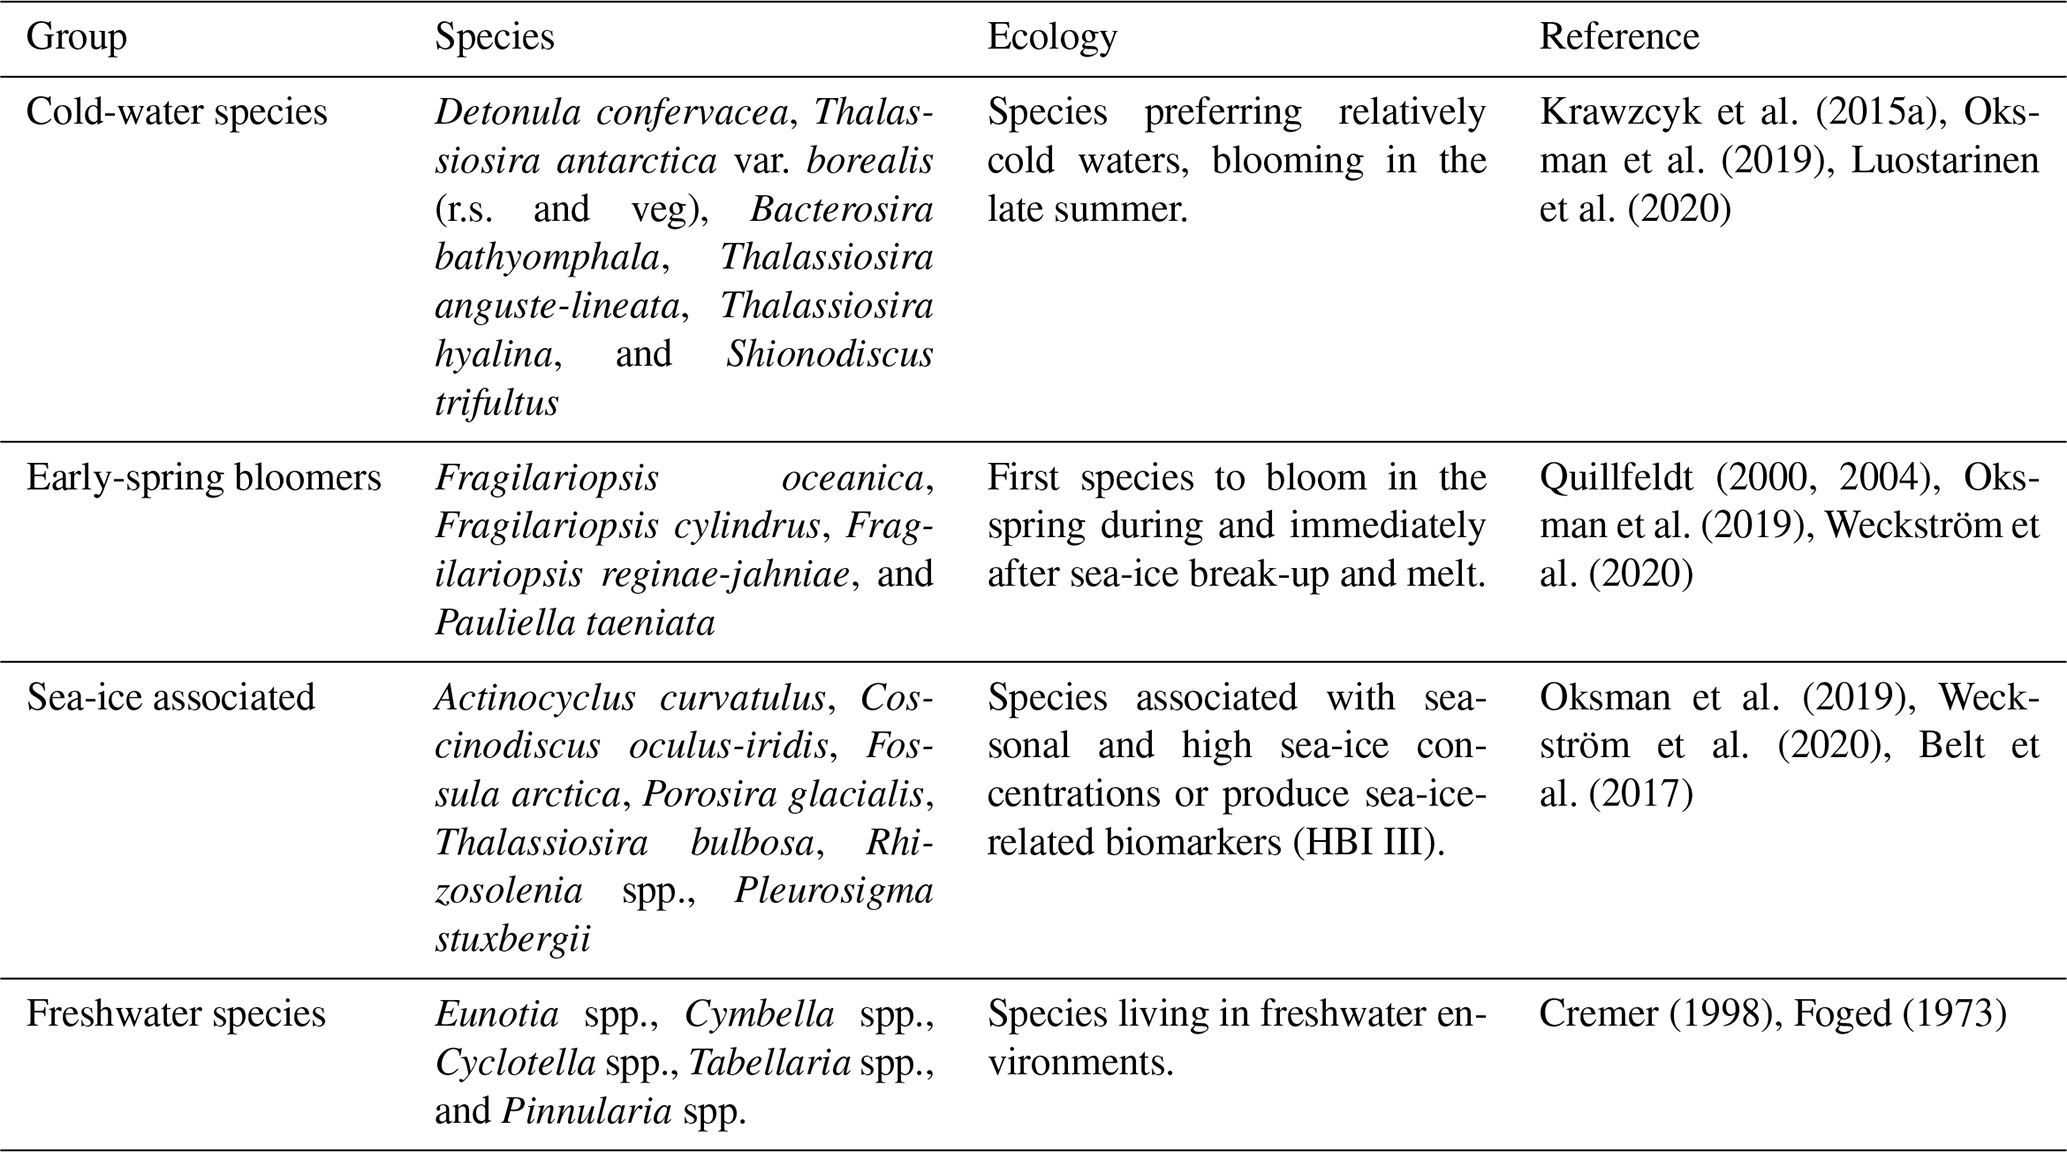
Diatom assemblage composition was relatively uniform between the three studied sites, and diatom taxa (excluding Chaetoceros species) were generally dominated by Detonula confervacea (resting spore), Thalassiosira antarctica var. borealis (resting spore), Fragilariopsis oceanica, F. cylindrus, and T. nordenskioeldii (Fig. 4). Diatoms were divided into five groups according to their ecological preferences: cold-water species, early-spring bloomers, benthic species, sea-ice-associated species, and freshwater species (Table 2).
Table 2Diatom groups, species in each group, ecological preferences, and references. The abbreviations r.s. and veg denote resting spore and vegetative cell, respectively.
Chaetoceros spp. are generally abundant in the sediment due to their good preservation and are likely to be over-represented in the assemblage and thus were left out of the diatom assemblage percentage calculations discussed here (Fig. 4). However, to estimate the concentrations of Chaetoceros spp. and chrysophyte cysts, we calculated flux rates (Fig. 4). Chaetoceros spp. (including vegetative forms and resting spores) were abundant in all the cores containing diatoms, making average flux rates of 0.4×10⁶, 0.4×10⁶, and 0.8×10⁶ valves cm−1 yr−1 at sites 8, 6, and 17, respectively (Fig. 4). Additionally, chrysophyte cysts were counted as this group is associated with low-salinity waters during the summer–autumn bloom (Hasle and Heimdal, 1998; Krawczyk et al., 2015b) and can thus provide additional information on past salinity changes.
For the diatom record from site 8, the first CA axis explains 36 % of the variation in the dataset (Fig. 4). The axis scores switch from mainly positive to mostly negative values in around the late 1940s. At site 6, the first CA axis accounts for 49.7 % of the variation in the dataset and the CA axis scores change from negative to positive in around the 1960s. At site 17, the first CA axis explains 29.5 % of the variation in the dataset. Scores for the first CA axis remain mainly negative until ca. 1985, when they shift to positive values.
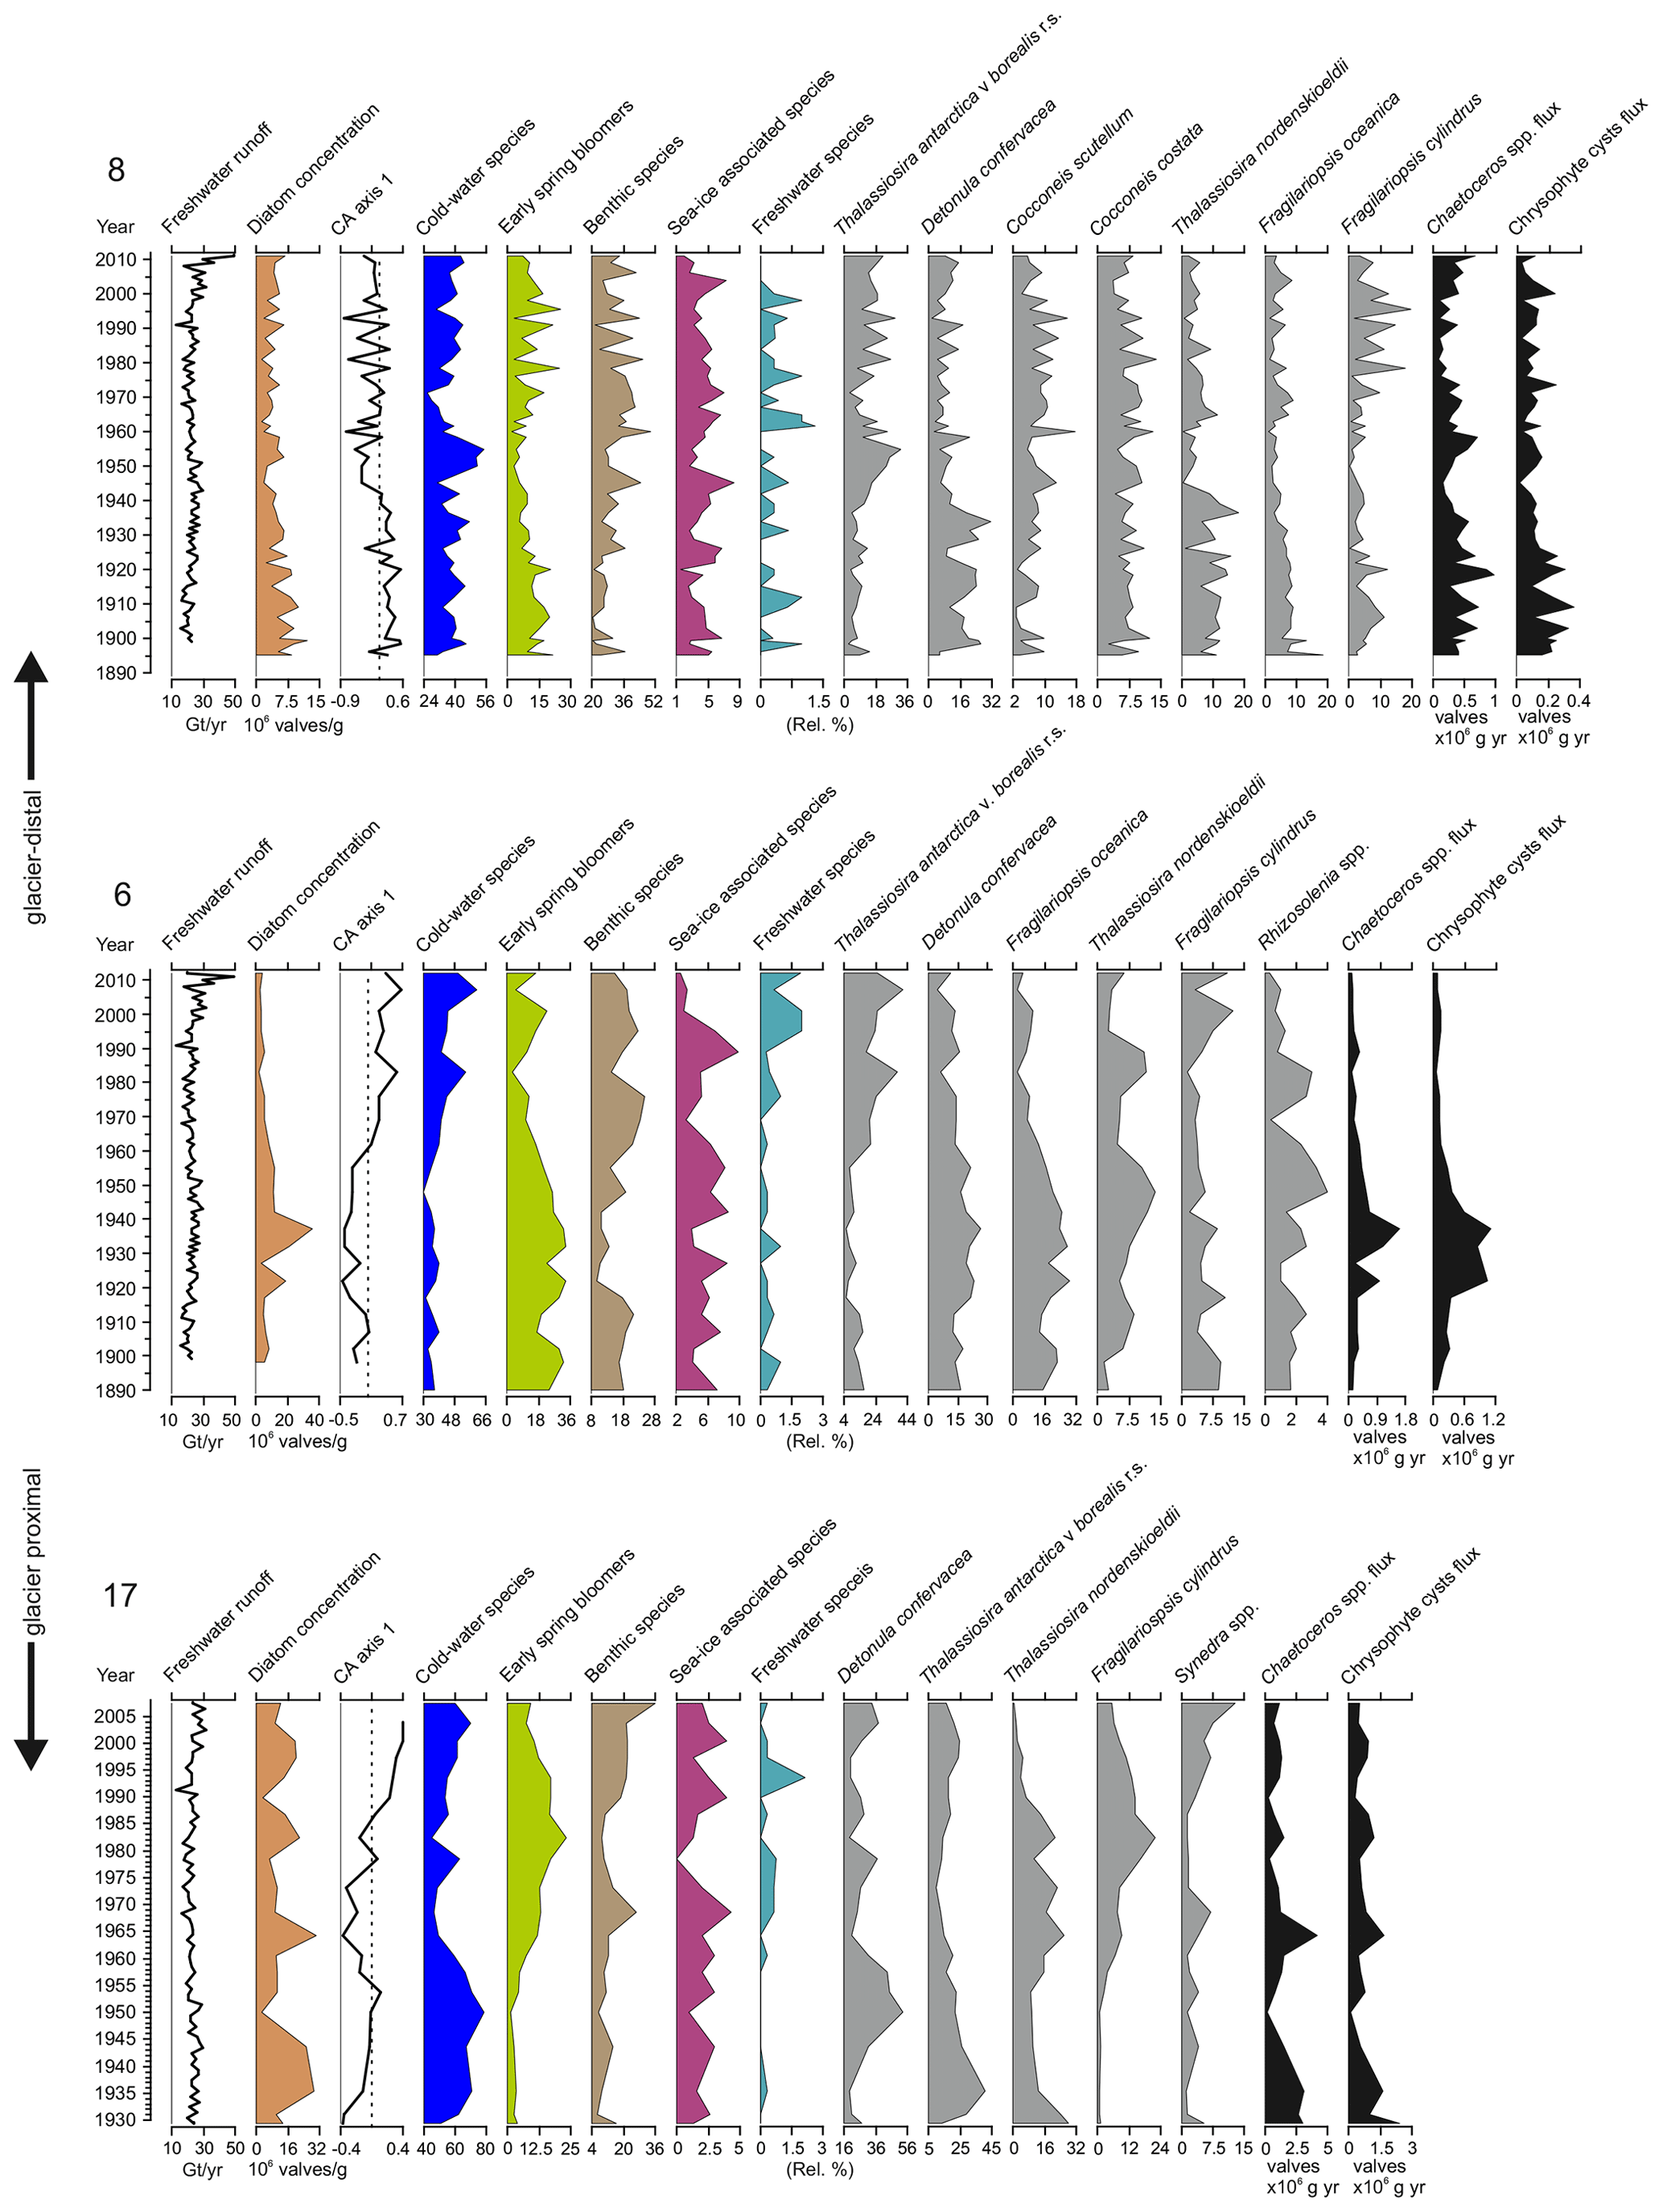
Figure 4Total freshwater runoff (Gt yr−1), diatom valve concentration (106 valves g−1 dry sediment), CA axis 1 scores (dashed lines indicate 0), relative abundance (%) of the cold-water species, early-spring bloomers, benthic species, sea-ice-associated species, freshwater species, relative percentage of the most abundant taxa in each core, Chaetoceros spp., and chrysophyte cyst fluxes (×106 valves cm−1 yr−1) in sediment cores SA12-ST8-1 (8), SA13-ST6-36R (6), and DANA08-ST17 (17). DANA08-ST20 (20) was devoid of diatom valves. Diatom species are scaled on different x axes for better visualization of trends in the percentages of less abundant species.
3.5 Freshwater runoff
Total freshwater runoff estimates extracted from MAR were further partitioned into estimates representing inner-fjord runoff, outer-fjord runoff, and southern-fjord runoff (Fig. 5). Runoff estimates for the southern part of the fjord system (see Fig. 1 for division of the fjord regions) are excluded since they represent part of the fjord that is not investigated in this study. The estimate for the total freshwater runoff varies between 13.0 and 49.0 Gt yr−1 (mean 23.1 Gt yr−1), for the inner-fjord runoff between 9.1 and 41.1 Gt yr−1 (mean 18.0 Gt yr−1), and for the outer-fjord runoff between 0.7 and 2.2 Gt yr−1 (mean 1.3 Gt yr−1) (Fig. 5). Glacial runoff makes up the largest proportion of the total runoff in Nuup Kangerlua, whereas the runoff from both tundra and rainfall has a smaller contribution (Fig. 5).
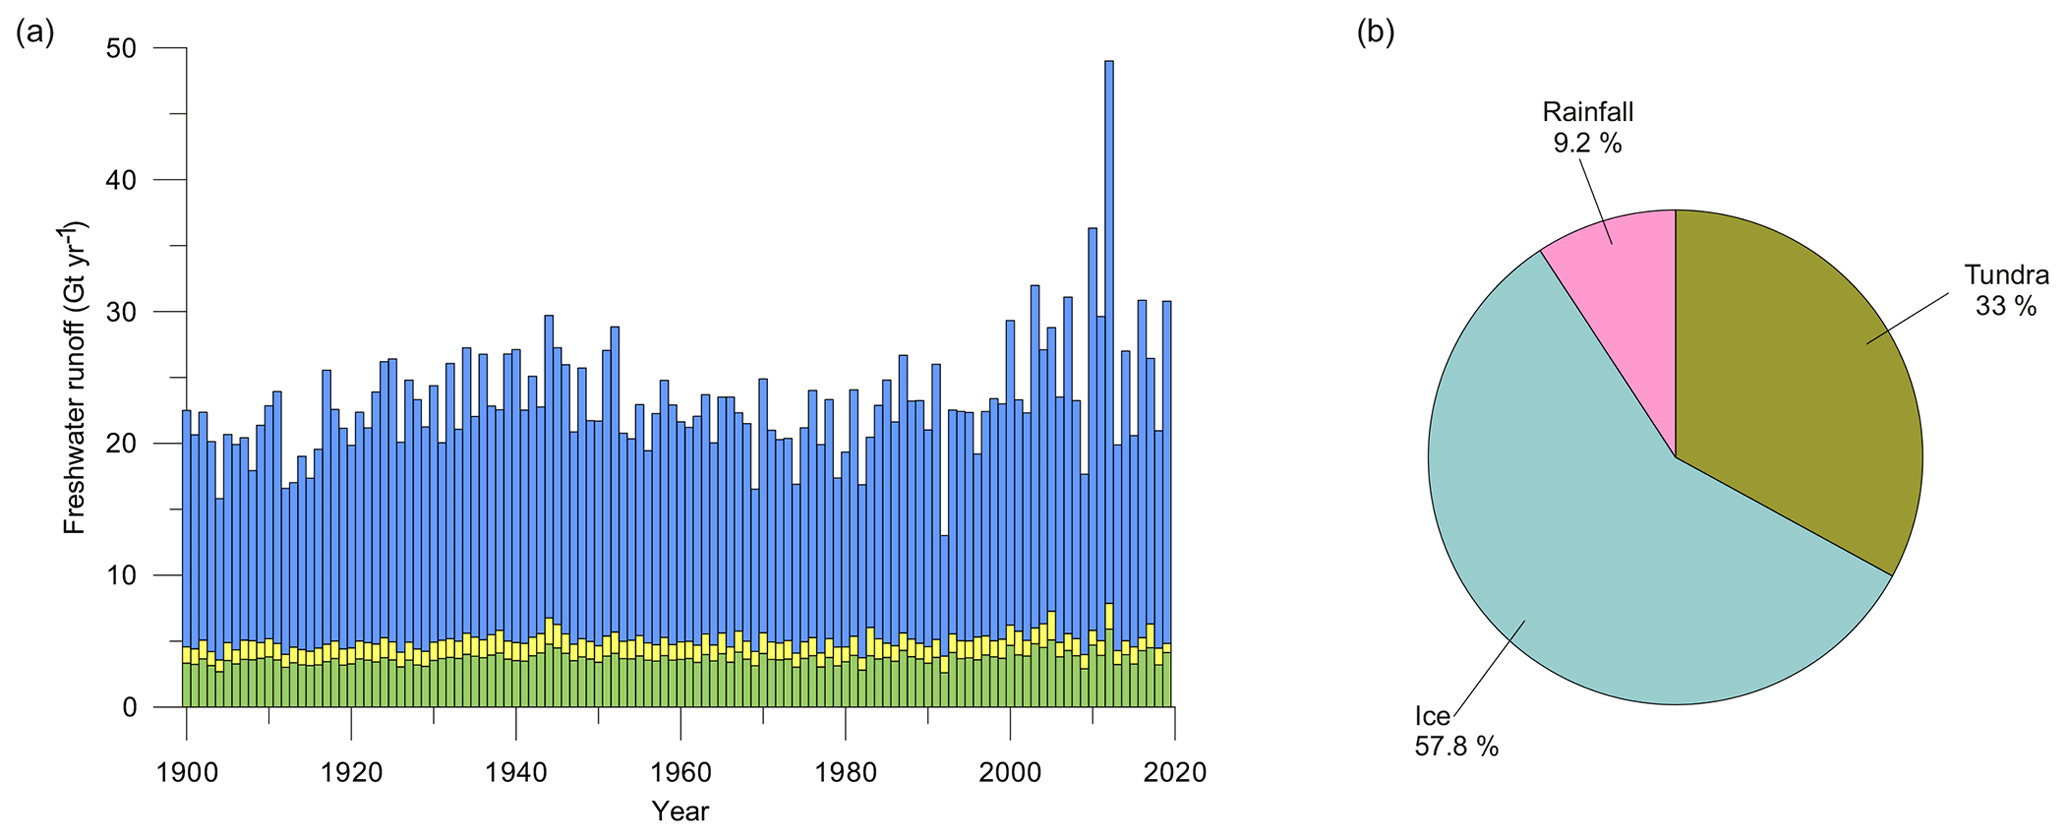
Figure 5(a) Inner-fjord (blue), outer-fjord (yellow), and southern-fjord (green) freshwater runoff estimates (Gt yr−1) for 1900–2019. For definitions of the different regions of the fjord, see red lines in Fig. 1. (b) Pie chart showing the distribution of the average runoff from ice (turquoise blue), tundra (green), and fjord rainfall (pink) between 2010–2019.
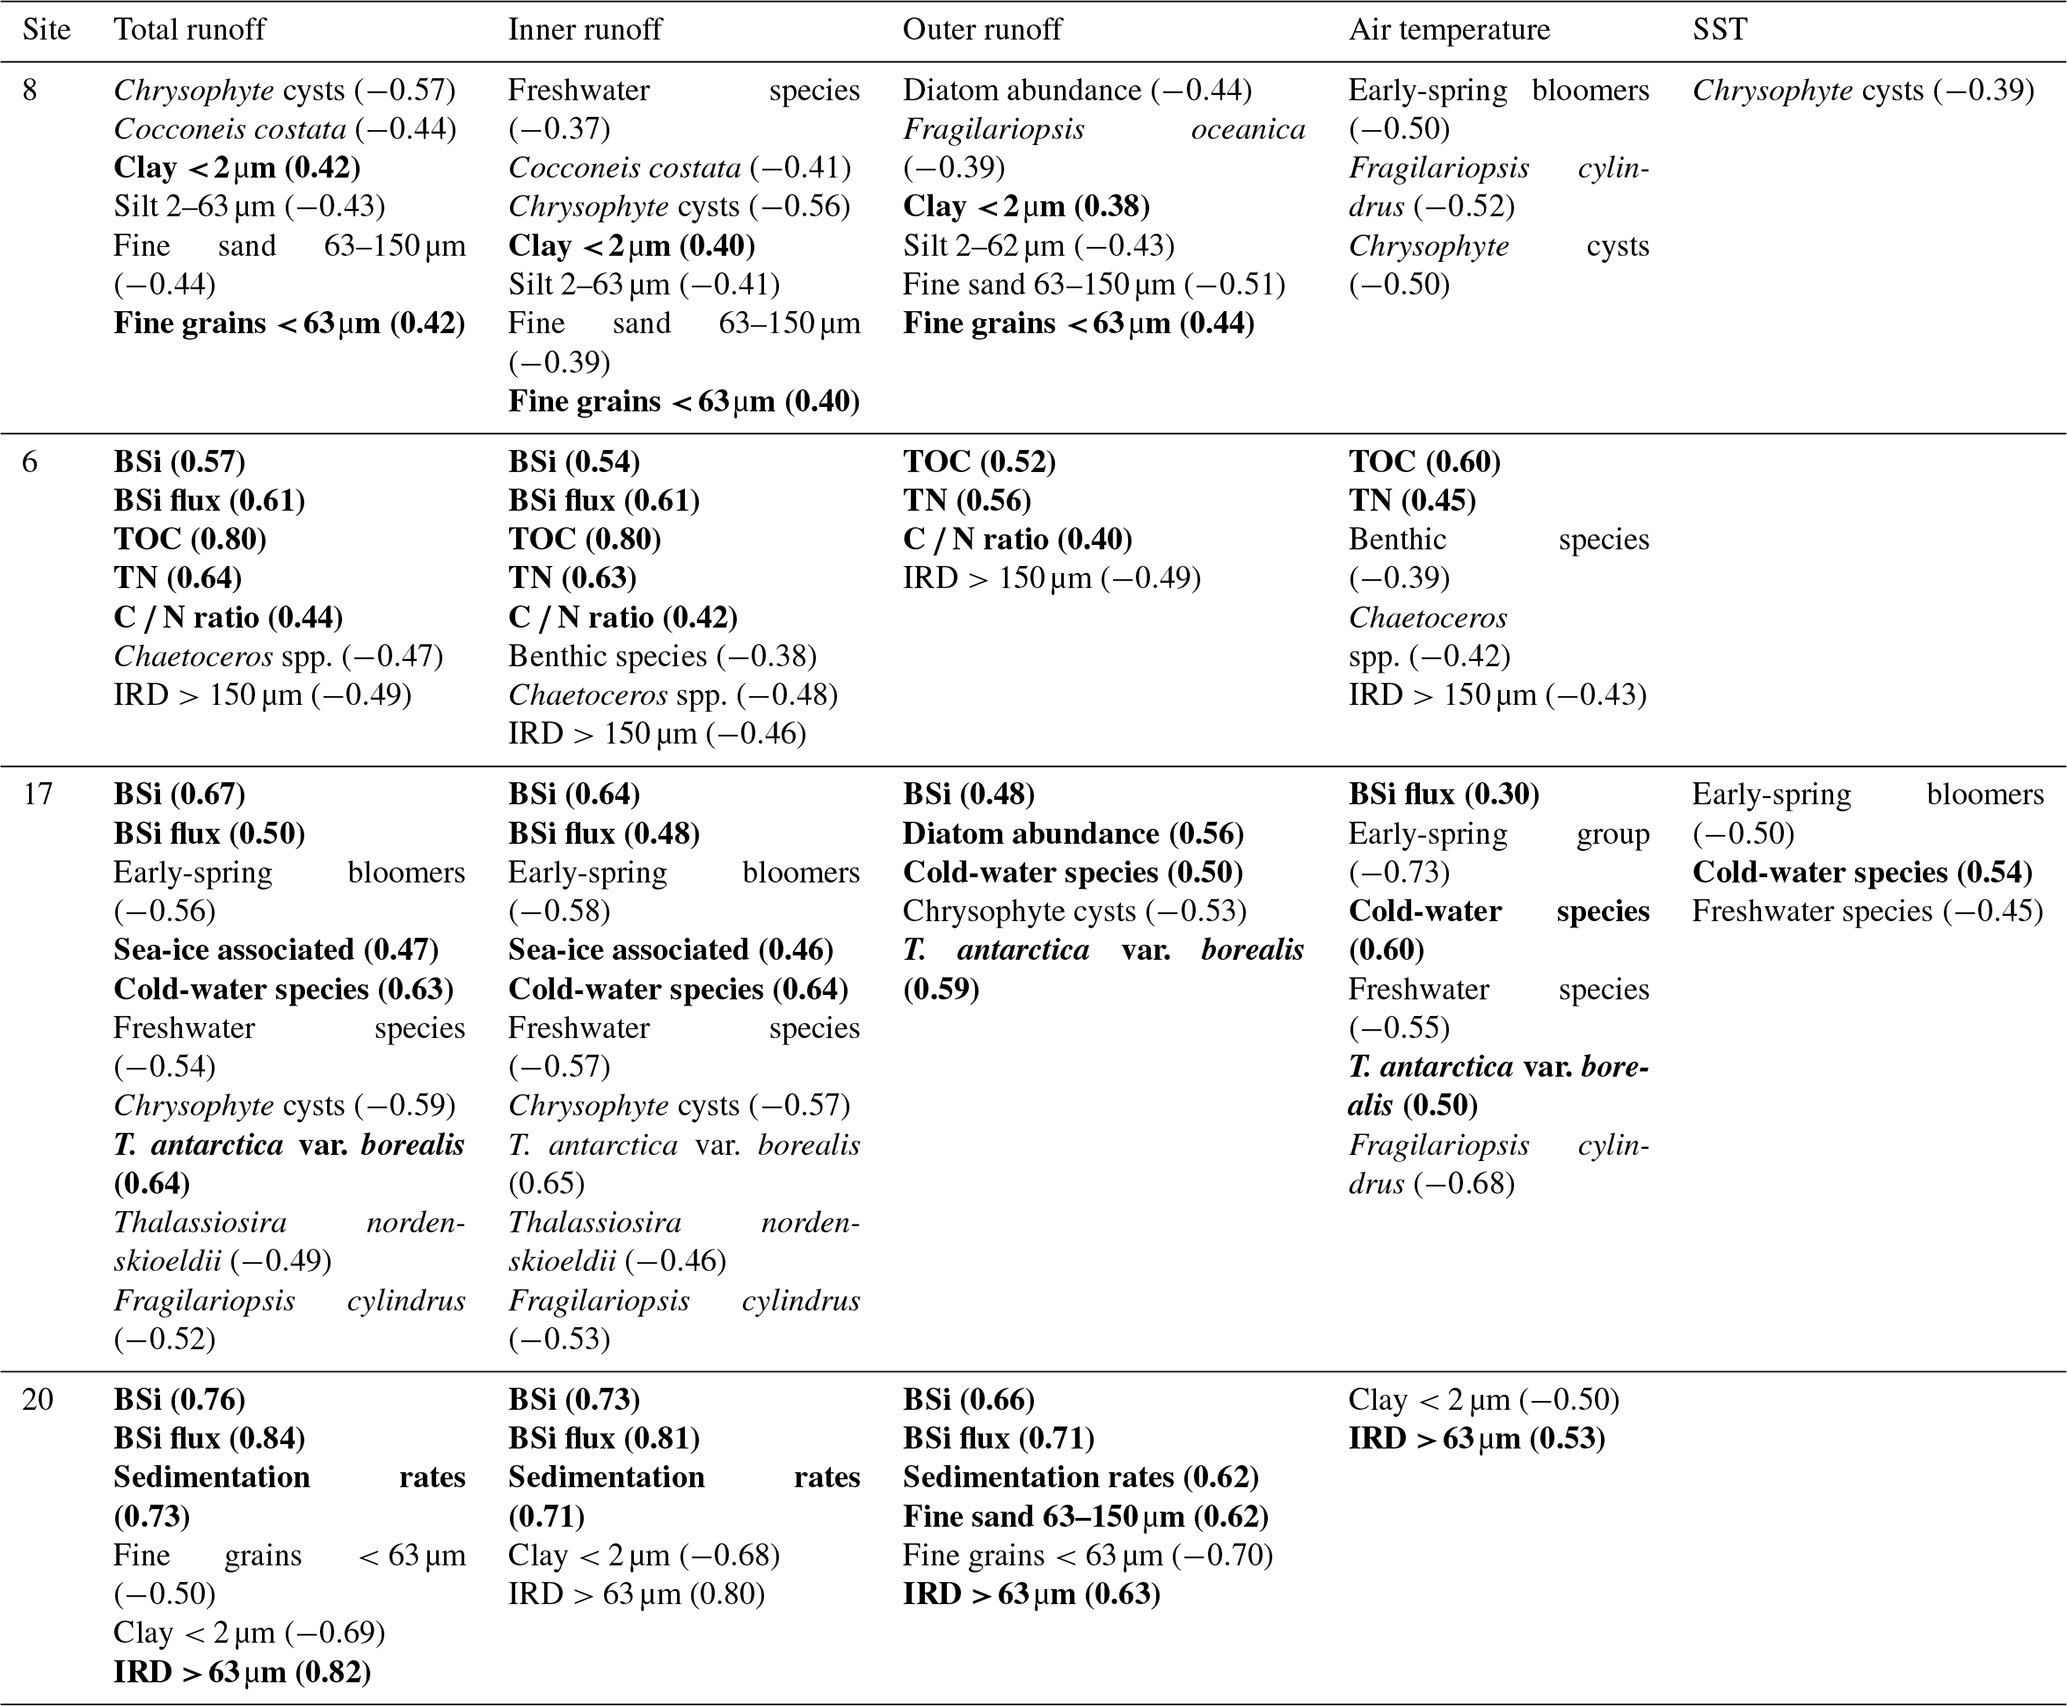
The relationship between the different runoff estimates and historical climate records was tested, showing a positive correlation between the total and inner-fjord runoff and the historical air temperature record (r=0.61 and r=0.63, respectively) as well as the sea-surface-temperature (SST) record (r=0.47 and r=0.49) from the Fyllas Banke oceanographic station shown in Fig. 1. In contrast, the outer-fjord runoff estimates did not have a statistically significant correlation to either air or sea-surface temperatures. All statistically significant correlations between the studied proxies and the total, inner-fjord, and outer-fjord freshwater runoff and air and sea-surface temperatures are presented in Table 3.
Table 3Statistically significant correlations (p<0.05) between proxy records (diatoms, geochemistry, grain size) and environmental variables (total, inner, and outer freshwater runoff; historical air temperatures; and sea-surface temperatures, SSTs) in sediment cores SA12-ST8-1 (8), SA13-ST6-36R (6), DANA08-ST17 (17), and DANA08-ST20 (20). Correlation coefficient (r) values are presented in brackets for each correlation. Positive correlations are in bold.
In Arctic fjords, marine primary production is a crucial ecosystem function that sustains important ecosystem services such as fisheries and indigenous livelihoods (Berthelsen, 2014; Lydersen et al., 2014; Meire et al., 2017; Laufer-Meiser et al., 2021). Here, we present sub-decadal records of temporal and spatial changes on marine primary production (diatom fluxes, BSi, and TOC) and diatom species composition in Nuup Kangerlua since the late 19th century and discuss these changes in relation to annual freshwater runoff estimates, historical air and sea-surface temperatures, and glacier front dynamics.
4.1 Records of marine productivity in Nuup Kangerlua since the late 19th century
Our productivity indicators (diatom fluxes, BSi, and TOC) from Nuup Kangerlua display large spatial variability between the studied sites (Fig. 3). In addition to variations in productivity between the sites, different proxies from the same core show minor dissimilarities (Fig. 3) as they do not all reflect the same productivity signal. TOC and BSi values, representing organic carbon from primary and secondary producers and the amount of biologically produced silica (Table 1), point to a relatively high productivity in Nuup Kangerlua throughout the 20th century when compared to modern values from other coastal Arctic sites, where TOC in the surface samples remains <1 wt % and BSi <10 mg g−1 (e.g. Ribeiro et al., 2017; Limoges et al., 2018; Kumar et al., 2016; Detlef et al., 2021). Similarly, high values have been observed on the northwest Greenland shelf during the Holocene when climate conditions were favourable for high primary production (Limoges et al., 2020; Saini et al., 2020; Ribeiro et al., 2021). The modern fjord hydrography in Nuup Kangerlua has been shown to maintain productivity also in the outer fjord, as biomass and nutrients are partly advected from the inner fjord by currents and wind and tidal mixing, which, together with the warm, nutrient-rich waters carried by the WGC, can increase seasonal productivity (Juul-Pedersen et al., 2015). Also, the year-round ice-free conditions in the outer fjord may prolong the productive season, whereas glacial calving and sea-ice cover in the inner fjord shorten the productive window.
Today, spatial trends in primary production in Nuup Kangerlua are mainly controlled by sea-surface temperature and salinity gradients along with nutrient availability, so the highest productivity rates have been reported from the inner-fjord area (Krawczyk et al., 2015a, 2018; Meire et al., 2016a, 2017). In contrast, our sediment records with the highest organic carbon content were retrieved from the outer fjord (site 8), where average TOC and BSi levels are up to 46 and 3 times higher, respectively, than in the inner-fjord area (Fig. 3). While sedimentation rates are more than 2 times higher in the inner fjord, mean BSi fluxes are still slightly higher at the outer-fjord site than at the two inner-fjord sites 17 and 20 (Table 2). Such an inner-fjord–outer-fjord gradient of increasing productivity can be found elsewhere along the Arctic coasts (Arendt et al., 2016; Kumar et al., 2016; Ribeiro et al., 2017; Limoges et al., 2018). Whereas productivity (diatom productivity, BSi, and TOC) at the outer-fjord site (8) has remained relatively stable (and high) since the late 19th century, this site records frequent low-amplitude fluctuations in biogenic silica content and diatom production occurring at a sub-decadal scale (Fig. 3).
The diatom productivity (absolute concentrations and fluxes) is highest at site 17, and this part of the Nuup Kangerlua fjord is characterized by very high rates of annual primary production (up to 120 g C m2 yr−1) according to data from the Greenland Ecosystem Monitoring programme (Juul-Pedersen et al., 2015; Meire et al., 2015). Diatoms alone account for about 95 % of the biomass here (Arendt et al., 2011; Meire et al., 2016b). The high productivity in this part of the fjord has been suggested to be maintained by the high dissolved silica (DSi) input from surface runoff combined with upwelling of nutrient-rich deep waters (Meire et al., 2016a, 2017). The high diatom production at site 17 can be explained by its ideal location that receives freshwater discharge from both surface runoff and several marine-terminating glaciers (Fig. 1). Subglacial discharge plays a key role in sustaining high productivity in this part of the fjord. Although the most glacier-proximal site (20) has a mean BSi flux of 9.2 mg cm2 yr−1, no diatom valves were found apart from in the uppermost part of the sediment core. In general, biogenic silica contents at site 20 are significantly lower until the late 1990s, suggesting low primary production here, compared to the other sites. The major increase in BSi and appearance of diatom valve fragments in the upper part of the core indicate an increase in productivity, although this remained significantly lower than at the other sites. The absence of diatoms and low BSi values indicate, in turn, very low productivity levels. The near absence and overall poor preservation of diatom valves may also be explained by dissolution of the diatom valves in the water column or water–sediment interface due to adverse physicochemical conditions (Ryves et al., 2006).
4.2 Sources of sedimentary organic matter in glacier-distal sites
The stable isotope carbon-13 (δ13C) and the carbon-to-nitrogen () ratio can be used to trace whether the organic matter in the sediment originates from marine or terrestrial sources. Autochthonous organic carbon is produced by the primary producers using the CO2 dissolved in the seawater, whereas allochthonous organic carbon sources can be of terrestrial or marine (e.g. sea ice) origin (Bianchi et al., 2020). At sites 8 and 6, the organic matter in the sediment can be traced to be of marine origin, as the measured δ13C values (between −20 ‰ and −22 ‰) are typical of protein-rich marine phytoplankton, whereas the terrestrial organic carbon would generally be more depleted in δ13C (Meyers, 1994). In our record from sites 6 and 8, we find no evidence of freshwater runoff increasing the amount of terrestrial carbon in the sediment as the variations in δ13C values are minimal and show no increase in pace with the freshwater runoff dataset (Fig. 3). Despite the ratio from site 6 having a positive correlation with freshwater runoff, the very low values (average of 6.3 at site 8 and average of 7.4 at site 6) further support autochthonous organic matter sources as ratios above 20 would indicate terrestrial carbon sources (Meyers, 1994). In marine sediments, bound inorganic nitrogen can constitute a large portion of the total nitrogen concentration, and thus the marine organic matter might be more depleted in δ13C than terrestrial organic matter (Kumar et al., 2016). However, we found no clay-bound nitrogen when ratios were tested for land-derived inorganic nitrogen according to Schubert and Calvert (2001). These analyses (δ13C and ratio) were performed only for the glacier-distal records (8 and 6) and not for the glacier-proximal records (17 and 20) due to extremely low carbon contents in these sediments (Fig. 3). Although the sedimentary organic carbon in our records is mainly from marine sources, we found freshwater diatoms in sites 8, 6, and 17 (Fig. 4) that originate from terrestrial freshwater sources, e.g. lakes and ponds, and enter the fjord via runoff (Jensen, 2003). Overall, the relative abundance of freshwater diatoms is extremely low (<2 %), but it represents a clear fingerprint of terrestrial origin as these species generally have very low to zero tolerance to saline waters and are not found in marine environments (Cremer, 1998; Foged, 1973), thus supporting the assumption that part of the organic carbon could originate from terrestrial sources. However, freshwater species were most abundant at site 6 (Fig. 4) where the data suggest that the organic matter was found to originate from marine sources (Fig. 3).
4.3 Freshwater discharge positively impacts primary production in the inner fjord
Our records display a substantial increase in BSi content and fluxes at the glacier-proximal sites (17 and 20) from ca. 1995 onwards as sedimentary BSi contents increase rapidly, keeping pace with the inner-fjord freshwater runoff (Fig. 6). In modern monitoring studies the inner fjord is found to have high productivity, as upwelling of the subglacial freshwater discharge and the subsequent meltwater plume bring essential nutrients from the nutrient-rich deep water into the surface water layer for the primary producers (Meire et al., 2016a, 2017; Hopwood et al., 2018, 2020). Also, the input of dissolved silica (DSi) and its implications for increasing diatom productivity are highest in the inner part of the fjord (Meire et al., 2016a). The modern monitoring data from Nuup Kangerlua reach back to 2008 (Greenland Ecosystem Monitoring); however, our long-term records suggest that the high productivity levels, prevailing at the glacier-proximal area today, had been already initiated in the 1990s. The strong positive correlation between marine productivity (BSi flux) and freshwater runoff (Table 3) shows that increased productivity in this part of the fjord is tightly associated with freshwater discharge. This positive correlation suggests that in the future, increased freshwater discharge is likely to have a positive socio-economic impact as high productivity is reflected in the higher trophic levels such as fish and marine mammals (Boye et al., 2010). For example, halibut fisheries, which are economically important for Greenland (Berthelsen, 2014), have been shown to have a positive correlation with meltwater input (Meire et al., 2017).
Although most of the freshwater originates from glacial discharge (Fig. 5), the increasing relative abundance of freshwater diatoms recorded from the 1990s (Fig. 6) indicates flushing of freshwater deposits (such as the lake Tasersuaq) into the fjord. Together with the BSi flux, coarse sediment grains (>63 µm) at site 20 display a strong positive correlation with freshwater runoff (Table 3), suggesting that freshwater input to this site originates from solid ice discharge. The coarse sediment grain size generally represents the IRD deposited by icebergs, which typically release most of the coarse grains close to the source as they melt. The melting of icebergs can cause water column vertical mixing in a similar way to subglacial discharge and thus provide more nutrients to the surface waters (Kanna et al., 2018). Also, sedimentation rates are increasing at sites 17 and 20 along with freshwater runoff (Table 3), suggesting that a large amount of sediment is being delivered to the fjord with freshwater discharge. Subglacial discharge from marine-terminating glaciers typically causes sediment suspension plumes (Fig. 1), which, by upwelling, bring nutrients from nutrient-rich deep waters to the surface for the primary producers (Meire et al., 2017; Hopwood et al., 2018, 2020). In the inner fjord, an increase in freshwater discharge, accompanied by increased sediment fluxes and upwelling, would represent a shift from clear, stratified waters to turbid, mixed waters after the 1990s. In fact, our diatom record from site 17 shows that species such as Thalassiosira nordenskioeldii and Fragilariopsis cylindrus, as well as chrysophyte cysts, which prefer low salinities and stratified waters (Hasle and Heimdal, 1998; von Quillfeldt, 2004; Krawczyk et al., 2015a, b), decrease after the 1990s (Fig. 4), while the number of benthic species, associated with water turbidity and with low-light conditions (Glud et al., 2002; Karsten et al., 2011) increases (Fig. 4). Interestingly, site 17 shows evidence of the suspension plume typically caused by the marine-terminating glaciers, whereas the record from site 20 suggests increased iceberg calving.
In contrast to the inner fjord, the record from the glacier-distal site (site 8) shows no correlation between productivity (diatom fluxes, BSi, or TOC) and freshwater runoff throughout the entire studied period, and here, freshwater runoff is limited (Fig. 5). The diatom CA axis suggests an important change in the assemblage around the 1940s (Fig. 6), from an assemblage dominated by early-spring bloomers to an assemblage dominated by benthic species and late-summer bloomers, e.g. Thalassiosira antarctica var. borealis r.s. (resting spore; Fig. 4). This suggests an increase in water turbidity, and/or more nutrient limitation (Glud et al., 2002; Karsten et al., 2011). However, the timing of this shift in the assemblage composition is not associated with any significant changes in freshwater runoff and may therefore be caused by changes in, for example, wind strength and consequently mixing of the water column.
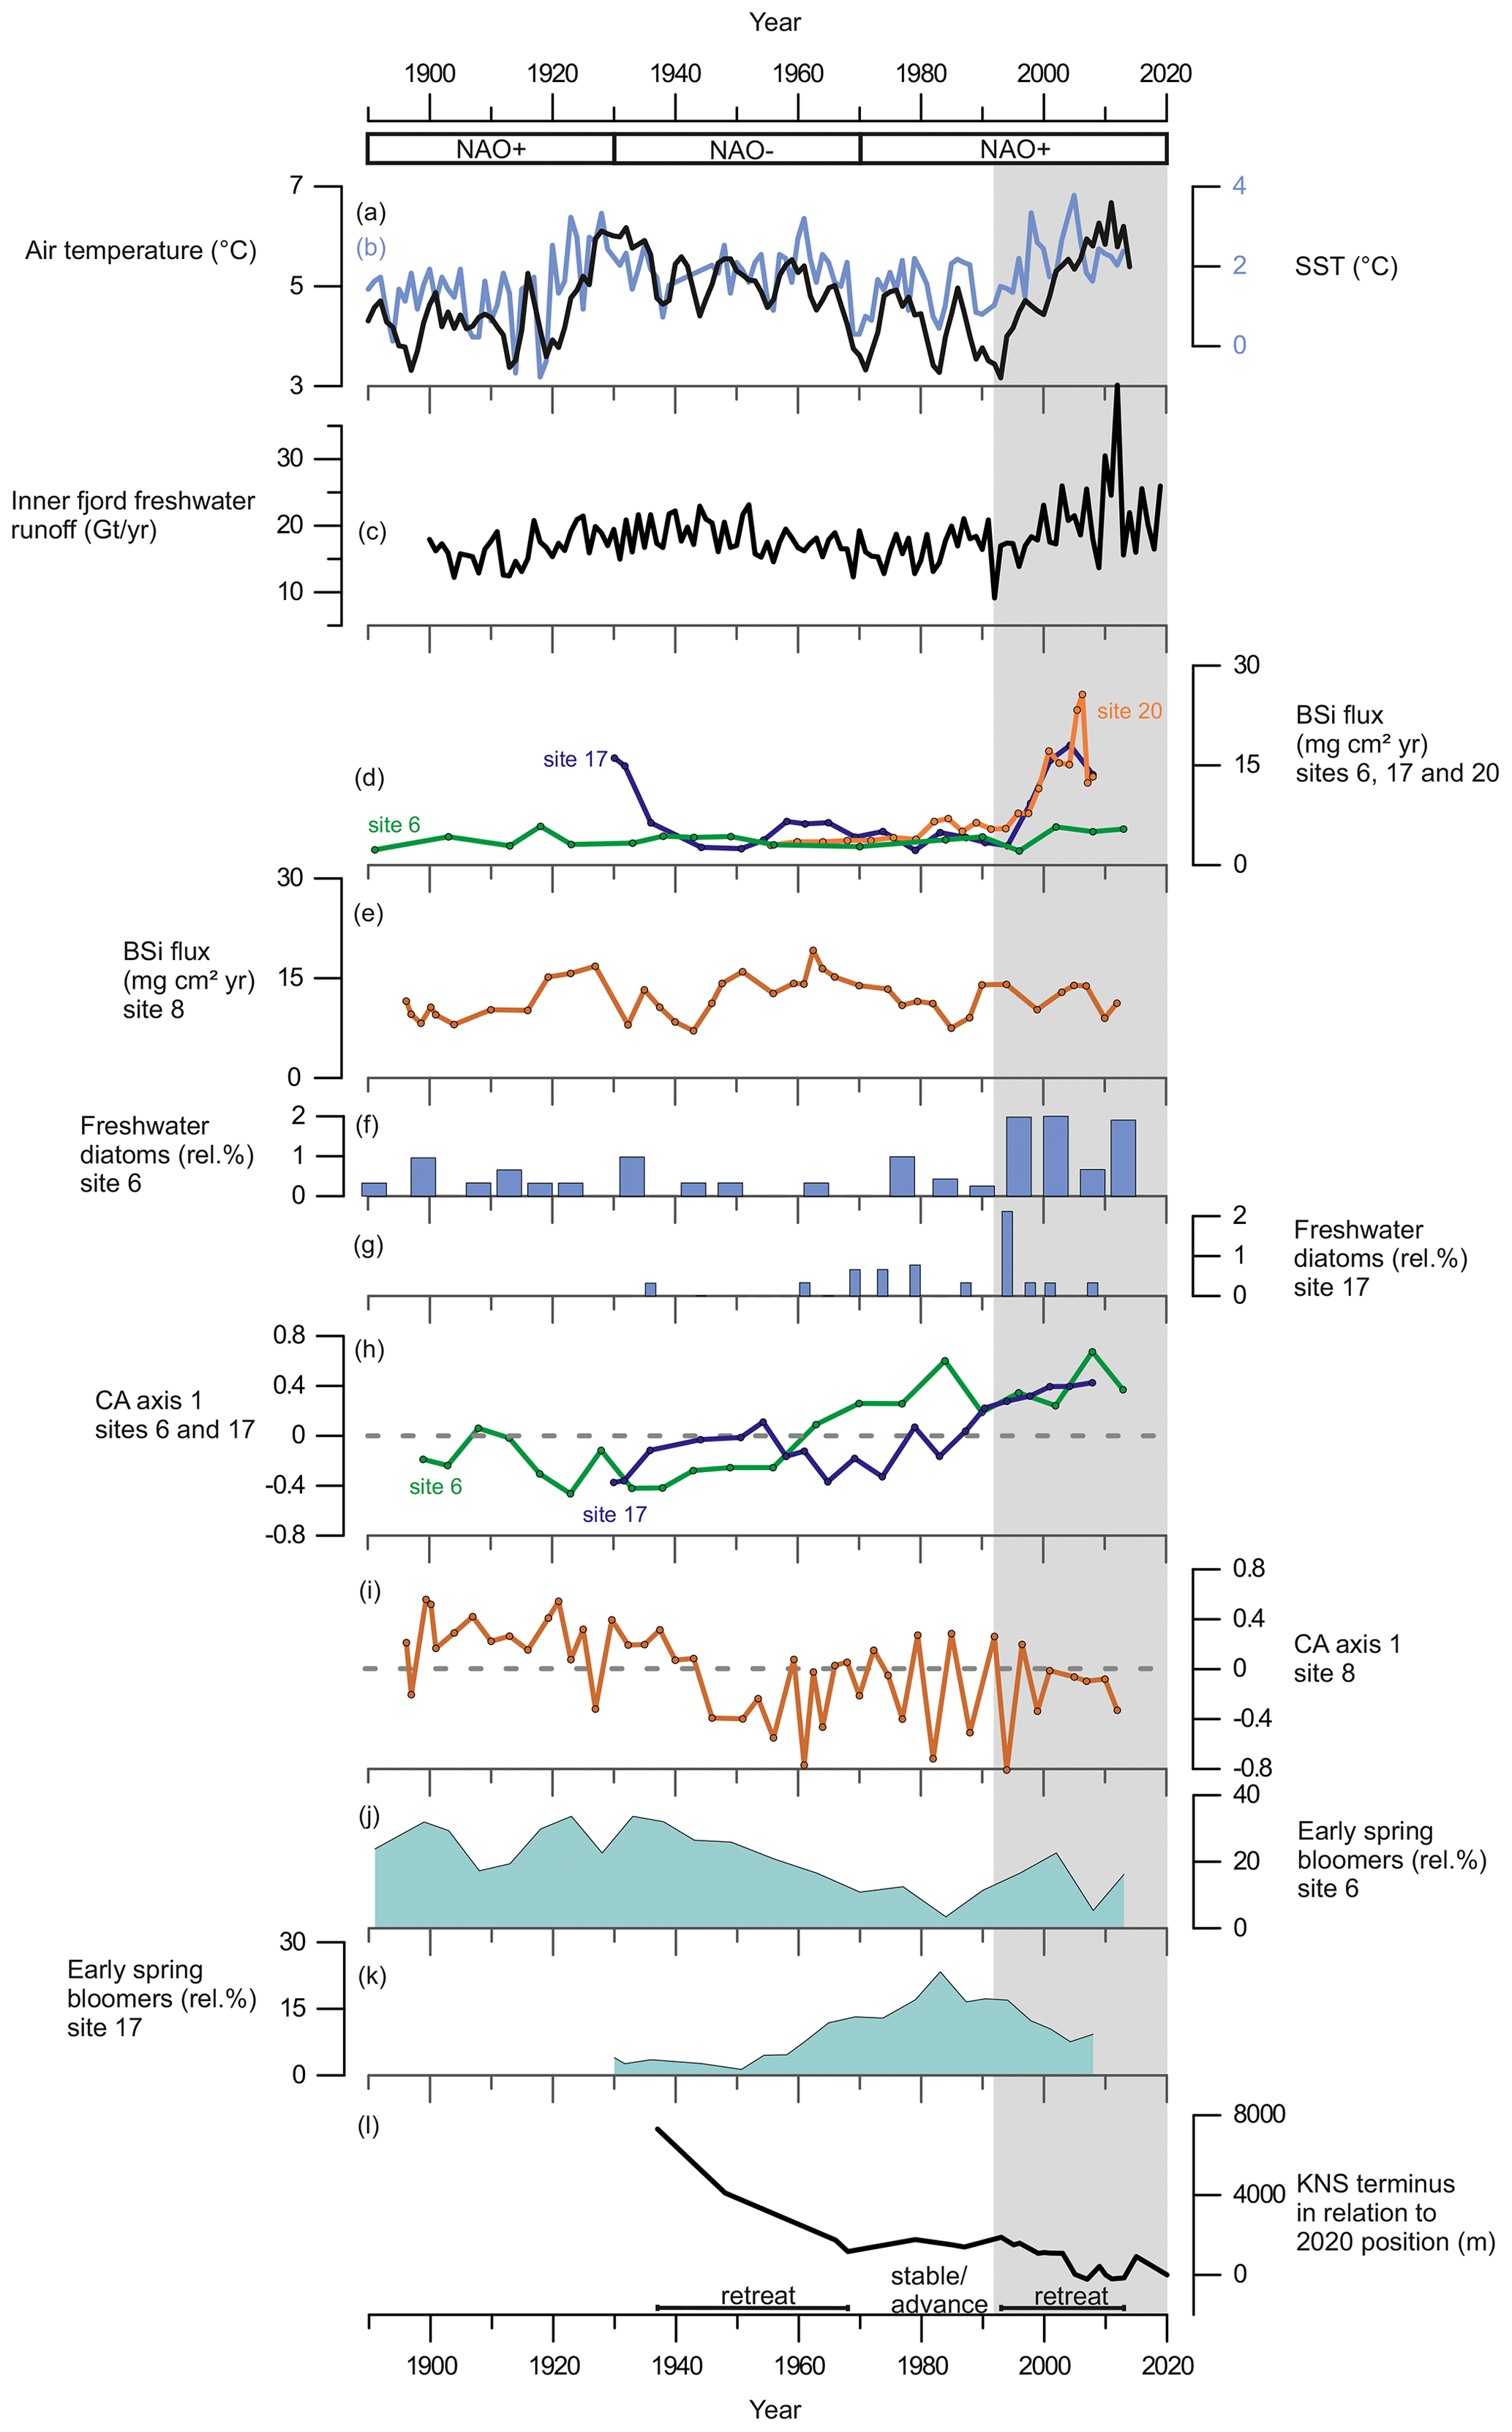
Figure 6(a) The 3-year average of annual summer (May to August) air temperature measured at Nuuk Airport (black line) from Ribergaard (2014) and (b) June sea-surface temperatures, SSTs (0–40 m), from Fyllas Banke (blue line) from Ribergaard (2014). (c) Inner-fjord freshwater runoff estimates (Gt yr−1). (d) BSi flux (mg cm2 yr−1) at site 6 (green line), site 17 (purple line), and site 20 (orange line). (e) BSi flux (mg cm2 yr−1) at site 8. (f) Relative percentage of freshwater diatoms at site 6. (g) Relative percentages of freshwater diatoms at site 17. (h) Diatom CA axis 1 scores at site 6 (green line) and site 17 (purple line); dashed line indicates 0. (i) Diatom CA axis 1 scores at site 8; dashed line indicates 0. (j) Relative percentage of early-spring bloom species at site 6. (k) Relative percentage of early-spring bloom species at site 17. (l) Changes in KNS glacier front position (m) in relation to the observed position in 2020. Shaded area marks the period from 1995 to the present.
4.4 Freshwater discharge influences spring and summer bloom dynamics
Based on modern observations, the annual marine primary production in Nuup Kangerlua is sustained by two seasonal blooms of similar magnitude occurring during the early spring and the late summer (Juul-Pedersen et al., 2015). Our long-term perspective indicates that the dynamics and magnitude of these blooms have varied according to freshwater discharge (Fig. 6). We find that freshwater runoff leads to a stronger spring bloom signal at site 6, while it promotes late-summer bloomers at site 17 (Table 3 and Fig. 6) and vice versa during periods of lower runoff. In terms of species responses, the diatom records show that species blooming in early spring during ice melt (Fragilariopsis spp.) or right after ice break-up in late spring (Thalassiosira nordenskioeldii) (Cremer, 1998; Jensen, 2003; Oksman et al., 2019) dominate the assemblage at site 6 during periods of higher freshwater discharge, while these species at site 17 have a negative correlation with freshwater (Table 3). Yet, the species blooming during the late summer (Detonula confervacea and Thalassiosira antarctica var. borealis r.s.) as well as Chaetoceros spp., which typically follow nutrient exhaustion and represent the last stage of the productive season (Krawczyk et al., 2015b), are more common at site 17 during periods of increased freshwater runoff (Fig. 4).
Modern observations have shown that today spring and summer bloom dynamics are mainly controlled by seasonal changes in salinity and temperature as well as fjord hydrography and tidal and wind mixing (Juul-Pedersen et al., 2015; Krawczyk et al., 2015b, 2018; Meire et al., 2016b). Other environmental factors, in particular sea ice, might better explain the differences observed at the two sites as sea ice can also influence the timing and magnitude of the spring bloom (Meire et al., 2016b). At the glacier-proximal site (17), a relatively high number of sea-ice species (which have a positive correlation with freshwater runoff) and low number of early-spring bloomers suggest sea-ice presence continuing late into the spring and limiting the spring production season (Fig. 4). However, the substantially high percentage (up to 79 % in the 1950s) of late-summer bloomers alongside elevated BSi and diatom flux (Fig. 3) is indicative of a productive summer season.
The spring bloom makes up a significant part of the annual primary production in Nuup Kangerlua (Juul-Pedersen et al., 2015), and increased spring production in the Arctic is a typical feature of the ongoing climatic warming, which has been evident in the Arctic Ocean over recent decades (Renaut et al., 2018). The length of the productive season has implications for CO2 capture as the fjords can function as carbon sinks (Meire et al., 2015; Rysgaard et al., 2012). In the future, increasing freshwater discharge is likely to extend the productive season and contribute to spatial differences in the timing of blooms occurring in different parts of the fjord system. The spring bloom is likely to occur earlier in the side branch of the fjord, whereas the magnitude of the late-summer bloom increases along the main ice flow pathway.
4.5 Freshwater impact reaching the glacier-distal side branch
Until now, the impacts of freshwater runoff on primary production have mainly been studied in the main branch of the Nuup Kangerlua fjord system (Juul-Pedersen et al., 2015; Meire et al., 2016a, b, 2017; Krawczyk et al., 2018), whereas productivity changes in the side branches are less known. Today, the upwelling of nutrients by subglacial processes in Nuup Kangerlua is suggested to affect primary production downstream, to a distance of 10–100 km along the pathway of the advected bloom (Meire et al., 2016b; Hopwood et al., 2018). Here, we show that freshwater runoff impacts primary production (BSi flux and TOC) in the glacier-distal site at the side branch of the fjord system (site 6). Here, both BSi flux and TOC strongly correlate with the freshwater runoff, despite this site being in the sheltered side branch ca. 110 km from the Kangiata Nunaata Sermia (KNS) termini and not directly on the main flow path of glacier influence (Fig. 1). The high number of early-spring bloomers at site 6 indicates an earlier seasonal ice break-up and strong inflow of freshwater into the side branch as these species thrive in cold and fresh surface waters. Diatom production was high (up to 36×106 valves g−1 and a flux of 7.2 valves cm−1 yr−1) during the 1930s and the 1940s while freshwater runoff was elevated and sea-surface temperatures were relatively high (Figs. 3 and 6). The high productivity is further supported by the diatom species composition data, as the Rhizosolenia genus reaches the highest abundances of the record in around 1945 (Fig. 4). This genus has been linked to a nutrient-rich and stratified water column, conditions that are generally related to meltwater pulses (Kemp et al., 2006).
4.6 Long-term productivity links to atmospheric forcing
Teleconnections in the North Atlantic region, such as the North Atlantic Oscillation (NAO) and the Atlantic Multidecadal Oscillation (AMO), have been shown to drive marine primary production (Martinez et al., 2009). These decadal-scale ocean–atmosphere oscillations modulate sea-surface conditions through fluctuations in temperature, precipitation, and wind and, thus, impact ecosystem responses (Martinez et al., 2009; Racault et al., 2017). In West Greenland, the locations of glacier termini are driven primarily by atmospheric temperatures reflecting NAO phases, and atmospheric forcing has been defined as the primary driver of KNS ice margin changes (Lea et al., 2014; Bjørk et al., 2018). NAO phases modulate the climate so that during a negative NAO phase, West Greenland experiences warmer climate and increased precipitation, whereas during the positive phase the opposite occurs (e.g. Hurrell, 1995; Bjørk et al., 2018).

Figure 7Glacier terminus changes in Saqqap Sermia (SS), Kangilinnguata Sermia (KS), Narsap Sermia (NS), Qamanaarsuup Sermia (QS), Kangiata Nunaata Sermia (KNS), Akullersuup Sermia (AS), and the lake Tasersuaq (LT) in a relation to their 2020 position.
In Nuup Kangerlua, most of the glacier termini responded to the warm atmospheric temperatures during the negative NAO phase between the 1930s and 1970s by retreat and mass loss (Fig. 7), with KNS having the largest retreat of ca. 8 km (Fig. 6). Our record shows increased marine productivity at site 6 during this negative NAO phase (Fig. 6), and here the TOC has a strong positive correlation with regional air temperature and freshwater runoff records. The diatom record from site 6 shows freshening of surface waters as Chaetoceros spp. and chrysophyte cyst fluxes are highest, together with a higher relative percentage of early-spring bloomers (Fig. 4). Together, this suggests that fjord productivity responds to decadal ocean–atmosphere oscillations. After the 1970s, the NAO phase has remained mainly positive, but interestingly since the 1990s the accelerated climate warming has overruled the NAO-modulated climate signal (Seidenkrantz et al., 2009), and both temperatures and freshwater discharge have increased substantially despite the ongoing positive NAO phase (Fig. 6). During recent decades, asynchronous behaviour of KNS and NS has primarily been attributed to subglacial melt (Motyka et al., 2017); however, both KNS and NS have retreated (Fig. 7), resulting in increased freshwater discharge and productivity in the inner-fjord sites. The accelerated warming of the recent decade may lead to substantial retreat of KNS in the future (Aschwanden et al., 2019). This can have a negative impact on productivity if the grounding depth changes significantly (reducing the fertilizing effect of nutrient upwelling) or if the ice margin retreats onto land. The retreat of marine-terminating glaciers is likely to have a strong impact on productivity due to the key role that subglacial discharge plays in sustaining high fjord productivity on both interannual (Meire et al., 2017; Hopwood et al., 2018) and multidecadal timescales as shown here.
Long-term records of marine productivity are needed to define the natural baseline against which to assess recent cryosphere and coastal ecosystem changes. More accurate baselines ultimately provide more robust projections of future changes. Here, we have combined sub-decadal records of primary productivity changes with estimates of freshwater runoff since the late 19th century to determine the impacts of freshwater on fjord productivity for Nuup Kangerlua, southern West Greenland.
We find that in the glacier-proximal area, biogenic silica fluxes are tightly associated with freshwater runoff and that freshwater imposes positive impacts on marine productivity. Our record shows non-uniform responses to freshwater inside the fjord system, which highlights the importance of marine-terminating glaciers to marine productivity. However, we find that the impacts of freshwater discharge are wider than previously known as freshwater has a positive impact on the marine productivity in the glacier-distal side branches of the fjord away from the main discharge flow path. Further, our diatom assemblage data show that freshwater modulates the location and magnitude of the spring and late-summer blooms, and these blooms are not synchronous inside the fjord. Freshening of the inner fjord prolongs the late-spring sea-ice conditions, leading to more extensive spring bloom in the side branch, while summer bloom becomes larger in the inner fjord. Overall, however, we conclude that productivity is higher today than at any other time since the late 19th century. A substantial increase in productivity that was initiated in the 1990s in the inner fjord is coincident with local cryosphere changes (retreat of the glacier terminus and subglacial freshwater input to the fjord) that are associated with acceleration in climate warming.
In the future, freshwater runoff is expected to increase and will likely result in higher marine productivity in Nuup Kangerlua, with positive influence on Greenlandic fisheries and other harvestable marine resources. It is likely that, in a warmer near-term future with more ice-sheet melt, the fjord system with marine-terminating glaciers that have not retreated beyond their grounding line may become a greater CO2 sink as increasing freshwater runoff is related to increasing marine production and a prolonged annual productive season due to increased nutrient availability. Ultimately, the future productivity of this system will be tightly linked to the fate of its marine-terminating glaciers.
The data presented in this paper are archived in the GEUS Dataverse and can be accessed through the following link: https://doi.org/10.22008/FK2/ICURNP (Oksman, 2022).
MO planned the study together with SR. SR designed the project (GreenShift) and provided sediment core material together with NNP, MSS, and NM. MO conducted diatom, grain-size, and BSi analysis, and ABK assisted with BSi and grain-size analyses. TJA carried out 210Pb measurements. SHL and WC provided freshwater runoff calculations for 1900–2010 together with KDM, who provided freshwater runoff data. KKK provided data for the ice margin position. MO wrote the manuscript with input from all the co-authors.
The contact author has declared that neither they nor their co-authors have any competing interests.
Publisher's note: Copernicus Publications remains neutral with regard to jurisdictional claims in published maps and institutional affiliations.
We thank Ida Sofie Mikaelsdóttir Olsson, Annette Ryge, and Charlotte Olsen for help with biogenic silica analysis and diatom slide preparation. Finally, we thank Thomas Juul-Pedersen and Ann Lennert for supporting our sediment coring activities during the Greenland Ecosystem Monitoring cruise with RV Sanna in 2012.
This research has been supported by the Geocenter Danmark (project GreenShift, grant no. 2018-5 to Sofia Ribeiro) and by the Independent Research Fund Denmark (grant no. 9064-00039B to Sofia Ribeiro). Marit-Solveig Seidenkrantz was funded by the Danish Council for Independent Research (grant no. 7014-00113B (project G-Ice) and 0135-00165B (project GreenShelf)) with additional funding from the European Union's Horizon research and innovation programme (grant no. 869383 (project ECOTIP)). The 2013 cruise with RV Sanna was funded by the Arctic Research Centre of Aarhus University, Denmark.
This paper was edited by Elizabeth Bagshaw and reviewed by two anonymous referees.
Andersen, T. J.: Some Practical Considerations Regarding the Application of 210Pb and 137Cs Dating to Estuarine Sediments, in: Applications of Paleoenvironmental Techniques in Estuarine Studies, Springer, Developments in Paleoenvironmental Research (DPER), 20, 121–140, https://doi.org/10.1007/978-94-024-0990-1_6, 2017.
Arendt, K. E., Dutz, J., Jonasdottir, S. H., Jung-Madsen, S., Mortensen, J., Moller, E. F., and Nielsen, T. G.: Effects of suspended sediments on copepods feeding in a glacial influenced sub-Arctic fjord, J. Plankton Res., 33, 1526–1537, https://doi.org/10.1093/plankt/fbr054, 2011.
Arendt, K. E., Agersted, M. D., Sejr, M. K., and Juul-Pedersen, T.: Glacial meltwater influences on plankton community structure and the importance of top-down control (of primary production) in a NE Greenland fjord, Estuar., Coast. Shelf Sci., 183, 123–135, 2016.
Arrigo, K. R. and van Dijken, G. I.: Continued increases in Arctic Ocean primary production, Prog. Oceanogr., 136, 60–70, 2015.
Aschwanden, A., Fahnestock, M. A., Truffer, M., Brinkerhoff, D. J., Hock, R., Khroulev, C., Mottram, R., and Khan, S. A.: Contribution of the Greenland Ice Sheet to sea level over the next millennium, Sci. Adv., 5, eaav9396, https://doi.org/10.1126/sciadv.aav9396, 2019.
Bamber, J. L., Tedstone, A. J., King, M. D., Howat, I. M., Enderlin, E. M., van den Broeke, M. R., and Noel, B.: Land Ice Freshwater Budget of the Arctic and North Atlantic Oceans: 1. Data, Methods, and Results, J. Geophys. Res.-Oceans, 123, 1827–1837, https://doi.org/10.1002/2017jc013605, 2018.
Barão, L., Vandevenne, F., Clymans, W., Frings, P., Ragueneau, O., Meire, P., Conley, D. J., and Struyf, E.: Alkaline-extractable silicon from land to ocean: A challenge for biogenic silicon determination, Limnol. Oceanogr. Meth., 13, 329–344, https://doi.org/10.1002/lom3.10028, 2015.
Battarbee, R. W., Jones, V. J., Flower, R. J., Cameron, N. G., Bennion, H., Carvalho, L., and Juggins, S.: Diatoms, in: Tracking Environmental Change Using Lake Sediments Volume 3, Terrestial, Algal, and Siliceous Indicators, edited by: Smol, J. P., Birks, H. J. B., and Last, W. M., Kluwer Academic Publishers, Dordrecht, Netherlands, 155–202, 2001.
Belt, S. T., Brown, T. A., Smik, L., Tatarek, A., Wiktor, J., Stowasser, G., Assmy, P., Allen, C. S., and Husum, K.: Identification of C25 highly branched isoprenoid (HBI) alkenes in diatoms of the genus Rhizosolenia in polar and sub-polar marine phytoplankton, Org. Geochem., 110, 65–72, 2017.
Berthelsen, T.: Coastal fisheries in Greenland, KNAPK report, Nuuk, 2014.
Bianchi, T. S., Arndt, S., Austin, W. E. N., Benn, D. I., Bertrand, S., Cui, X., Faust, J. C., Koxiorowska-Makuch, K., Moy, C. M., Savage, C., Smeaton, C., Smith, R. W., and Syvitski, J.: Fjord as Aquatic Critical Zones (ACZs), Earth Sci. Rev., 203, 103145, https://doi.org/10.1016/j.earscirev.2020.103145, 2020.
Bindoff, N. L., Cheung, W. W. L., Kairo, J. G., Arístegui, J., Guinder, V. A., Hallberg, R., Hilmi, N., Jiao, N., Karim, M. S., Levin, L., O'Donoghue, S., Purca Cuicapusa, S. R., Rinkevich, B., Suga, T., Tagliabue, A., and Williamson, P.: Changing Ocean, Marine Ecosystems, and Dependent Communities, 2019, in: IPCC Special Report on the Ocean and Cryosphere in a changing Climate, edited by: Pörtner, H.-O., Roberts, D. C., Masson-Delmotte, V., Zhai, P., Tignor, M., Poloczanska, E., Mintenbeck, K., Alegría, A., Nicolai, M., Okem, A., Petzold, J., Rama, B., Weyer, N. M., Cambridge University Press, Cambridge, UK and New York, NY, USA, 447–587, https://doi.org/10.1017/9781009157964.007, 2019.
Bjørk, A. A., Kjær, K. H., Korsgaard, N. J., Khan, S. A., Kjeldsen, K. K., Andresen, C. S., Box, J. E., Larsen, N. K., and Funder, S.: An aerial view of 80 years of climate-related glacier fluctuations in southeast Greenland, Nat. Geosci., 5, 427–432, https://doi.org/10.1038/ngeo1481, 2012.
Bjørk, A. A., Aagaard, S., Lütt, A., Khan, S. A., Box, J. E., Kjeldsen, K. K., Larsen, N. K., Korsgarrd, N. J., Cappelen, J., Colgan, W. T., Macguth, H., Andresen, C. S., Peings, Y., and Kjær, K. H.: Changes in Greenland's peripheral glaciers linked to the North Atlantic Oscillation, Nat. Clim. Change, 8, 48–52, https://doi.org/10.1038/s41558-017-0029-1, 2018.
Boye, T. K., Simon, M., and Madsen, P. T.: Habitat use of humpback whales in Godthåbsfjord, West Greenland, with implications for commercial exploitation, J. Mar. Biolog. Assoc. of the United Kingdom, 90, 1529–1539, 2010.
Compo, G. P., Whitaker, J. S., Sardeshmukh, P. D., Matsui, N., Allan, R. J., Yin, X., Gleason, B. E., Vose, R. S., Rutledge, G., Bessemoulin, P., Brönnimann, S., Brunet, M., Crouthamel, R. I., Grant, A. N., Groisman, P. Y., Jones, P. D., Kruk, M. C., Kruger, A. C., Marshall, G. J., Maugeri, M., Mok, H. Y., Nordli, Ø., Ross, T. F., Trigo, R. M., Wang, X. L., Woodruff, S. D., and Worley, S. J.: The Twentieth Century Reanalysis Project, Q. J. Roy. Meteor. Soc., 137, 1–28, https://doi.org/10.1002/qj.776, 2011.
Cremer, H.: The diatom flora of the Laptev Sea (Arctic Ocean), edited by: Lange-Bertalot, H. and Kociolek, P., Bibliotheca diatomologica, 40, Berlin and Stuttgart, 169 pp., ISBN 3-443-57031-3, 1998.
Delhasse, A., Kittel, C., Amory, C., Hofer, S., van As, D., S. Fausto, R., and Fettweis, X.: Brief communication: Evaluation of the near-surface climate in ERA5 over the Greenland Ice Sheet, The Cryosphere, 14, 957–965, https://doi.org/10.5194/tc-14-957-2020, 2020.
DeMaster, D. J.: Measuring biogenic silica in marine sediments and suspended matter, in: Marine Particles: Analysis and Characterization, Geophysical Monograph 63, American Geophysical Union, edited by: Hurd, D. C. and Spencer, D. W., Washington, D.C., 363–367, 1991.
Detlef, H., Reilly, B., Jennings, A., Mørk Jensen, M., O'Regan, M., Glasius, M., Olsen, J., Jakobsson, M., and Pearce, C.: Holocene sea-ice dynamics in Petermann Fjord in relation to ice tongue stability and Nares Strait ice arch formation, The Cryosphere, 15, 4357–4380, https://doi.org/10.5194/tc-15-4357-2021, 2021.
Fettweis, X., Franco, B., Tedesco, M., van Angelen, J. H., Lenaerts, J. T. M., van den Broeke, M. R., and Gallée, H.: Estimating the Greenland ice sheet surface mass balance contribution to future sea level rise using the regional atmospheric climate model MAR, The Cryosphere, 7, 469–489, https://doi.org/10.5194/tc-7-469-2013, 2013.
Fettweis, X., Box, J. E., Agosta, C., Amory, C., Kittel, C., Lang, C., van As, D., Machguth, H., and Gallée, H.: Reconstructions of the 1900–2015 Greenland ice sheet surface mass balance using the regional climate MAR model, The Cryosphere, 11, 1015–1033, https://doi.org/10.5194/tc-11-1015-2017, 2017.
Foged, N.: Diatoms from southwest Greenland, Meddelelser om Grønland, 194 nr. 5, København, C.A. Reitsel, 1973.
Glud, R. N., Kühl, M., Wenzhöfer, F., and Rysgaard, S.: Benthic diatoms of a high Arctic fjord (Young Sound, NE Greenland): importance for ecosystem primary production, Mar. Ecol. Prog. Ser., 238, 15–29, 2002.
Hammer, Ø., Harper, D. A. T., and Ryan, P. D.: PAST: Paleontological Statistics Software Package for Education and Data Analysis, Paleontol. Electron., 4, 3–4, 2001.
Harff, J., Perner, K., and Moros, M.: Deglacial history, coastal development, and environmental change in West Greenland during the Holocene: Results of the R/V “Maria S,Merian” expedition MSM05/03, 15 June to 4 July 2007, Meereswiss. Ber., Warnemünde, 99, https://doi.org/10.12754/msr-2016-0099, 2016.
Hasle, G. R. and Heimdal, B. R.: The net phytoplankton from Kongsfjorden, Svalbard, July 1988, with general remarks on species composition of arctic phytoplankton, Polar Res., 17, 31–52, 1998.
Hasle, G. R. and Syvertsen, E. E.: Marine diatoms, in: Identifying Marine Phytoplankton, edited by: Tomas, C.R., Academic Press, California, 5–385, 1996.
Hawkings, J. R., Wadham, J. L., Tranter, M., Lawson, E., Sole, A., Cowton, T., Tedstone, A. J., Bartholomew, I., Nienow, P., Chandler, D., and Telling, J.: The effect of warming climate on nutrient and solute export from the Greenland Ice Sheet, Geochem. Perspect. Lett., 1, 94–104, https://doi.org/10.7185/geochemlet.1510, 2015.
Hodal, H., Falk-Petersen, S., Hop, H., Kristiansen, S., and Reigstad, M.: Spring bloom dynamics in Kongsfjorden, Svalbard: Nutrients, phytoplankton, protozoans and primary production, Polar Biol., 35, 191–203, https://doi.org/10.1007/s00300-011-1053-7, 2012.
Holding, J. M., Markager, S., Juul-Pedersen, T., Paulsen, M. L., Møller, E. F., Meire, L., and Sejr, M. K.: Seasonal and spatial patterns of primary production in a high-latitude fjord affected by Greenland Ice Sheet run-off, Biogeosciences, 16, 3777–3792, https://doi.org/10.5194/bg-16-3777-2019, 2019.
Hopwood, M. J., Carroll, D., Browning, T. J., Meire, L., Mortensen, J., Krisch, S., and Achterberg, E. P.: Non-linear response of summertime marine productivity to increased meltwater discharge around Greenland, Nat. Commun., 9, 3256, https://doi.org/10.1038/s41467-018-05488-8, 2018.
Hopwood, M. J., Carroll, D., Dunse, T., Hodson, A., Holding, J. M., Iriarte, J. L., Ribeiro, S., Achterberg, E. P., Cantoni, C., Carlson, D. F., Chierici, M., Clarke, J. S., Cozzi, S., Fransson, A., Juul-Pedersen, T., Winding, M. H. S., and Meire, L.: Review article: How does glacier discharge affect marine biogeochemistry and primary production in the Arctic?, The Cryosphere, 14, 1347–1383, https://doi.org/10.5194/tc-14-1347-2020, 2020.
Hurrell, J. W.: Decadal trends in the North Atlantic Oscillation: regional temperatures and precipitation, Science, 269, 676–679, 1995.
Jensen, K. G.: Holocene hydrographic changes in Greenland coastal waters, PhD thesis, The Geological Survey of Denmark and Greenland, Copenhagen, Denmark, 2003.
Jensen, L. M. and Rasch, M.: Nuuk Ecological Research Operations, 2nd Annual Report, National Environmental Research Institute, Aarhus University, Denmark, 80 pp., 2008.
Juul-Pedersen, T., Arendt, K. E., Mortensen, J., Blicher, M. E., Søgaard, D. H., and Rysgaard, S.: Seasonal and interannual phytoplankton production in a sub-Arctic tidewater outlet glacier fjord, SW Greenland, Mar. Ecol. Prog. Ser., 524, 27–38, 2015.
Kahru, M., Brotas, V., Manzano-Sarabia, M., and Mitchell, B. G.: Are phytoplankton blooms occurring earlier in the Arctic?, Glob. Chang. Biol., 17, 1733–1739, https://doi.org/10.1111/j.1365-2486.2010.02312.x, 2011.
Kanna, N., Sugiyama, S., Ohashi, Y., Sakakibara, D., Fukamachi, Y., and Nomura, D.: Upwelling of macronutrients and dissolved inorganic carbon by a subglacial freshwater driven plume in Bowdoin Fjord, northwestern Greenland, J. Geophys. Res.-Biogeo., 123, 1666–1682, https://doi.org/10.1029/2017JG004248, 2018.
Karsten, U., Schlie, C., Woelfel, J., and Becker, B.: Benthic diatoms in Arctic Seas – Ecological functions and adaptations, Polarforschung, 81, 77–84, 2011.
Kemp, A. E. S., Pearce, R. B., Grigorov, I., Rance, J., Lange, C. B., Quilty, P., and Salter, I.: Production of giant marine diatoms and their export at oceanic frontal zones: Implications for Si and C flux from stratified oceans, Global Biogeochem. Cycles, 20, GB4S04, https://doi.org/10.1029/2006GB002698, 2006.
Korsgaard, N. J., Nuth, C., Khan, S. A., Kjeldsen, K. K., Bjørk, A. A., Schomacker, A., and Kjær, K. H.: Digital elevation model and orthophotographs of Greenland based on aerial photographs from 1978–1987, Sci. Data, 3, 160032, https://doi.org/10.1038/sdata.2016.32, 2016.
Krawczyk, D., Arendt, K. E., Juul-Pedersen, T., Sejr, M. K., Blicher, M. E., and Jakobsen, H. H.: Spatial and temporal distribution of planktonic protists in the East Greenland fjord and offshore waters, Mar. Ecol. Prog. Ser., 538, 99–116, 2015a.
Krawczyk, D. W., Witkowski, A., Juul-Pedersen, T., Arendt, K. E., Mortensen, J., and Rysgaard, S.: Microplankton succession in a SW Greenland tidewater glacial fjord influenced by coastal inflows and run-off from the Greenland Ice Sheet, Polar Biol., 38, 1515–1533, 2015b.
Krawczyk, D., Meire, L., Lopes, C., Juul-Pedersen, T., Mortensen, J., Li, C. L., and Krogh, T.: Seasonal succession, distribution, and diversity of planktonic protists in relation to hydrography of the Godthåbsfjord system (SW Greenland), Polar Biol., 2033–2052, https://doi.org/10.1007/s00300-018-2343-0, 2018.
Kumar, V., Tiwari, M., Nagoji, S., and Tripathi, S.: Evidence of anomalously low δ13C of marine organic matter in an arctic fjord, Sci. Rep.-UK, 6, 36192, https://doi.org/10.1038/srep36192, 2016.
Lannuzel, D., Tedesco, L., van Leeuwe, M., Campbell, K., Flores, H., Delille, B., Miller, L., Stefels, J., Assmy, P., Bowman, J., Brown, K., Castellani, G., Chierici, M., Crabeck, O., Damm, E., Else, B., Fransson, A., Fripiat, F., Geilfus, N.-X., Jacques, C., Jones, E., Kaartokallio, H., Kotovich, M., Meiners, K., Moreau, S., Nomura, D., Peeken, I., Rintala, J.-M., Steiner, N., Tison, J.-L., Vancoppenolle, M., Van der Linden, F., Vichi, M., and Wongpan, P.: The future of Arctic sea-ice biogeochemistry and ice-associated ecosystems, Nat. Clim. Change, 10, 983–992, https://doi.org/10.1038/s41558-020-00940-4, 2020.
Laufer-Meiser, K., Michaud, A. B., Maisch, M., Byrne, J. M., Kappler, A., Patterson, M. O., Røy, H., and Jørgensen, B. B.: Potentially bioavailable iron produced through benthic cycling in glaciated Arctic fjords of Svalbard, Nat. Commun., 12, 1349, https://doi.org/10.1038/s41467-021-21558-w, 2021.
Lea, J. M., Mair, D. W. F., Nick, F. M., Rea, B. R., van As, D., Morlighem, M., Nienow, P. W., and Weidick, A.: Fluctuations of a Greenlandic tidewater glacier driven by changes in atmospheric forcing: observations and modelling of Kangiata Nunaata Sermia, 1859–present, The Cryosphere, 8, 2031–2045, https://doi.org/10.5194/tc-8-2031-2014, 2014.
Lewis, K. M., van Dijken, G. L., and Arrigo, K. R.: Changes in phytoplankton concentration now drive increased Arctic Ocean primary production, Science, 369, 198–202, 2020.
Limoges, A., Ribeiro, S., Weckström, K., Heikkilä, M., Zamelczyk, K., Andersen, T. J., Tallberg, P., Massé, G., Rysgaard, S., Nørgaard-Pedersen, N., and Seidenkrantz, M.-S.: Linking the modern distribution of biogenic proxies in High Arctic Greenland shelf sediments to sea ice, primary production, and Arctic-Atlantic inflow, J. Geophys. Res.-Biogeo., 123, 760–786, https://doi.org/10.1002/2017JG003840, 2018.
Limoges, A., Weckström, K., Ribeiro, S., Georgiadis, E., Hansen, K.E., Martinez, P., Seidenkrantz, M.-S., Giraudeau, J., Crosta, J., and Massé, G.: Learning from the past: Impact of the Arctic Oscillation on sea ice and marine productivity off northwest Greenland over the last 9,000 years, Glob. Change Biol., 26, 6767–6786, https://doi.org/10.1111/gcb.15334, 2020.
Luostarinen, T., Ribeiro, S., Weckström, K., Sejr, M., Meire, L., Tallberg, P., and Heikkilä, M.: An annual cycle of diatom succession in two contrasting Greenlandic fjords: from simple sea-ice indicators to varied seasonal strategists, Mar. Micropaleontol., 158, 101873, https://doi.org/10.1016/j.marmicro.2020.101873, 2020.
Lydersen, C., Assmy, P., Falk-Petersen, S., Kohler, J., Kovacs, K. M., Reigstad, M., Steen, H., Strøm, H., Sundfjord, A., Varpe, Ø., Walczowski, W., Weslawski, J. M., and Zajaczkowski, M.: The importance of tidewater glaciers for marine mammals and seabirds in Svalbard, Norway, J. Mar. Syst., 129, 452–471, 2014.
Mankoff, K. D., Noël, B., Fettweis, X., Ahlstrøm, A. P., Colgan, W., Kondo, K., Langley, K., Sugiyama, S., van As, D., and Fausto, R. S.: Greenland liquid water discharge from 1958 through 2019, Earth Syst. Sci. Data, 12, 2811–2841, https://doi.org/10.5194/essd-12-2811-2020, 2020.
Mankoff, K. D., Fettweis, X., Langen, P. L., Stendel, M., Kjeldsen, K. K., Karlsson, N. B., Noël, B., van den Broeke, M. R., Solgaard, A., Colgan, W., Box, J. E., Simonsen, S. B., King, M. D., Ahlstrøm, A. P., Andersen, S. B., and Fausto, R. S.: Greenland ice sheet mass balance from 1840 through next week, Earth Syst. Sci. Data, 13, 5001–5025, https://doi.org/10.5194/essd-13-5001-2021, 2021.
Martinez, E., Antoine, D., D'Ortenzio, F., and Gentili, B.: Climate-driven basin-scale decadal oscillations of oceanic phytoplankton, Science, 326, 1253–1256, https://doi.org/10.1126/science.1177012, 2009.
Meire, L., Søgaard, D. H., Mortensen, J., Meysman, F. J. R., Soetaert, K., Arendt, K. E., Juul-Pedersen, T., Blicher, M. E., and Rysgaard, S.: Glacial meltwater and primary production are drivers of strong CO2 uptake in fjord and coastal waters adjacent to the Greenland Ice Sheet, Biogeosciences, 12, 2347–2363, https://doi.org/10.5194/bg-12-2347-2015, 2015.
Meire, L., Meire, P., Struyf, E., Krawczyk, D. W., Arendt, K. E., Yde, J. C., Juul-Pedersen, T., Hopwood, M., Rysgaard, S., and Meysman, F. J. R.: High export of silica from the Greenland Ice Sheet, Geophys. Res. Lett., 43, 9173–9182, https://doi.org/10.1002/2016GL070191, 2016a.
Meire, L., Mortensen, J., Rysgaard, S., Bendtsen, J., Boone, W., Meire, P., and Meysman, J. R.: Spring bloom dynamics in a subarctic fjord influenced by tidewater outlet glaciers (Godthåbsfjord, SW Greenland), J. Geophys. Res.-Biogeo., 121, 1581–1592, https://doi.org/10.1002/2015JG003240, 2016b.
Meire, L., Mortensen, J., Meire, P., Juul-Pedersen, T., Sejr, M. K., Rysgaard, S., Nygaard, R., Huybrechts, P., and Meysman, F. J. R.: Marine-terminating glaciers sustain high productivity in Greenland fjords, Glob. Change Biol., 23, 5344–5357, 2017.
Meyers, P. A.: Preservation of elemental and isotopic source identification of sedimentary organic matter, Chem. Geol., 114, 289–302, https://doi.org/10.1016/0009-2541(94)90059-0, 1994.
Mikkelsen, N., Lennert, A., Ribeiro, S., and Nørgaard-Pedersen, N.: Marine geological sampling in the Godthåbsfjord region, Geological cruise report – R/V Sanna 10–18 May 2012, Danmarks og Grønlands geologiske undersøgelse rapport 2012/89, 2012.
Mortensen, J., Lennert, K., Bendtsen, J., and Rysgaard, S.: Heat sources for glacial melt in a sub-Arctic fjord (Godthåbsfjord) in contact with the Greenland Ice Sheet, J. Geophys. Res., 116, C01013, https://doi.org/10.1029/2010JC006528, 2011.
Mortensen, J., Bendtsen, J., Motyka, R. J., Lennert, K., Truffer, M., Fahnestock, M., and Rysgaard, S.: On the seasonal freshwater stratification in the proximity of fast-flowing tidewater glaciers in a sub-Arctic sill fjord, J. Geophys. Res.-Oceans, 118, 1382–1395, https://doi.org/10.1002/jgrc.20134, 2013.
Motyka, R. J., Cassotto, R., Trueffer, M., Kjeldsen, K. K., van As, D., Korsgaard, N. J., Fahnestock, M., Howat, I., Langen, P. L., Mortensen, J., Lennert, K., and Rysgaard, S.: Asynchronous behavious of outlet glaciers feeding Godthåbsfjord (Nuup Kangerlua) and the triggering of Narsap Sermia's retreat in SW Greenland, J. Glaciol., 63, 288–308, 2017.
Mullin, J. and Riley, J.: The colorimetric determination of silicate with special reference to sea and natural waters, Anal. Chim. Acta, 12, 162–176, https://doi.org/10.1016/S0003-2670(00)87825-3, 1955.
Oksman, M.: Data for Impact of freshwater runoff from the southwest Greenland Ice Sheet on fjord productivity since the late 19th century, GEUS Dataverse, V1 [data set], https://doi.org/10.22008/FK2/ICURNP, 2022.
Oksman, M., Juggins, S., Miettinen, A., Witkowski, A., and Weckström, K.: The biogeography and ecology of common diatom species in the northern North Atlantic, and their implications for paleoceanographic reconstructions, Mar. Micropaleontol., 148, 1–28, https://doi.org/10.1016/j.marmicro.2019.02.002, 2019.
Racault, M.-F., Sathyendranath, S., Brewin, R. J. W., Raitsos, D. E., Jackson, T., and Platt, T.: Impact of El Niño variability on oceanic phytoplankton, Front. Mar. Sci., 4, 133, https://doi.org/10.3389/fmars.2017.00133, 2017.
Renaut, S., Devred, E., and Babin, M.: Northward expansion and intensification of phytoplankton growth during the early ice-free season in Arctic, Geophys. Res. Lett., 45, 10590–10598, https://doi.org/10.1029/2018GLO78995, 2018.
Ribeiro, S., Sejr, M. K., Limoges, A., Heikkilä, M., Andersen, T. J., Tallberg, P., Weckström, K., Husum, K., Forwick, M., Dalsgaard, T., Massé, G., Seidenkrantz, M.-S., and Rysgaard, S.: Sea ice and primary production proxies in surface sediments from a High Arctic Greenland fjord: Spatial distribution and implications for paleoenvironmental studies, Ambio, 46, 106–118, https://doi.org/10.1007/s13280-016-0894-2, 2017.
Ribeiro, S., Limoges, A., Massé, Johansen, K. L., Colgan, W., Weckström, K., Jackson, R., Georgiadis, E., Mikkelsen, N., Kuijpers, A., Olsen, J., Olsen, S. M., Nissen, M., Andersen, T. J., Strunk, A., Wetterich, S., Syväranta, J., Hendersson, A. C. G., Mackay, H., Taipale, S., Jeppesen, E., Larsen, N. K., Crosta, X., Giraudeau, J., Wengrat, S., Nuttall, S., Grønnow, B., Mosbech, A., and Davidson, T. A.: Vulnerability of the North Water ecosystem to climate change, Nat. Commun., 12, 4475, https://doi.org/10.1038/s41467-021-24742-0, 2021.
Ribergaard, M. H.: Oceanographic investigations off West Greenland 2013, NAFO Scientific Council Documents, 14/001, 2014.
Rysgaard, S., Mortensen, J., Juul-Pedersen, T., Sørensen, L. L., Lennert, K., Søgaard, D. H., Arendt, K. E., Blicher, M. E., Sejr, M. K., and Bendtsen, J.: High air-sea CO2 uptake rates in nearshore and shelf areas of Southern Greenland: Temporal and spatial variability, Mar. Chem., 128–129, 26–33, 2012.
Ryves, D. B., Battarbee, R. W., Juggins, S., Fritz, S. C., and Anderson, N. J.: Physical and chemical predictors of diatom dissolution in freshwater and saline lake sediments in North America and West Greenland, Limnol. Oceanogr., 51, 1355–1368, 2006.
Saini, J., Stein, R., Fahl, K., Weiser, J., Hebbeln, D., Hillaire-Marcel, C., and de Vernal, A.: Holocene variability in sea ice and primary productivity in the northeastern Baffin Bay, Arktos, 6, 55–73, https://doi.org/10.1007/s41063-020-00075-y, 2020.
Schubert, C. J. and Calvert, S. E.: Nitrogen and carbon isotopic composition of marine and terrestrial organic matter in Arctic Ocean sediments: implications for nutrient utilization and organic matter composition, Deep-Sea Res., 48, 789–810, https://doi.org/10.1016/S0967-0637(00)00069-8, 2001.
Seidenkrantz, M.-S., Kuijpers, A., and Schmith, T.: Comparing past and present climate – a tool to distinguish between natural and human-induced climate change. In: Beyond Kyoto: Addressing the challenges of climate change, IOP Conference Series: Earth and Environmental Sciences, 8, 012012, https://doi.org/10.1088/1755-1315/8/1/012012, 2009.
Seidenkrantz, M.-S., Røy, H., Lomstein, B. A., Meire, L., and the shipboard and on-shore parties: Godthåbsfjord system and the West Greenland shelf with “R/V Sanna”, 11–16, Cruise report, Aarhus University, Denmark, 2014.
Stroeve, J. and Notz, D.: Changing state of Arctic sea ice across all seasons, Environ. Res. Lett., 13, 103001, https://doi.org/10.1088/1748-9326/aade56, 2018.
van As, D., Andersen, M. L., Petersen, D., Fettweis, X., van Angelen, J. H., Lenaerts, J. T. M., van den Broeke, M., Lea, J. M., Bøggild, C. E., Alhstrøm, A. P., and Steffen, K.: Increasing meltwater discharge from the Nuuk region of the Greenland ice sheet and implications for mass balance (1960–2021), J. Glaciol., 60, 314–322, https://doi.org/10.3189/2014JoG13J065, 2014.
von Quillfeldt, C. H.: Common diatom species in Arctic spring blooms: Their distribution and Abundance, Bot. Mar., 43, 499–516, 2000.
von Quillfeldt, C. H.: The diatom Fragilariopsis cylindrus and its potential as an indicator species for cold water rather than for sea ice, Vie Milieu 54, 137–143, 2004.
Weckström, K., Roche, B., R., Miettinen, A., Krawczyk, D., Limoges, A., Juggins, S., Ribeiro, S., and Heikkilä, M.: Improving the plaeoceanographic proxy tool kit – On the biogeogeography and ecology of the sea ice-associated species Fragilariopsis oceanica, Fragilariopsis reginae-jahniae and Fossula arctica in the northern Atlantic, Mar. Micropaleontol., 157, 101860, https://doi.org/10.1016/j.marmicro.2020.101860, 2020.