the Creative Commons Attribution 4.0 License.
the Creative Commons Attribution 4.0 License.
 | 20 May 2022
Flexural and compressive strength of the landfast sea ice in the Prydz Bay, East Antarctic
Qingkai Wang
Zhaoquan Li
Peng Lu
Yigang Xu
Zhijun Li
A total of 25 flexural and 55 uniaxial compressive strength tests were conducted in laboratory using landfast sea ice samples collected in the Prydz Bay. Three-point bending tests were performed at ice temperatures of −12 to −3 ∘C with force applied vertically to original ice surface, and compressive strength tests were performed at −3 ∘C with a strain-rate level of 10−6–10−2 s−1 in the directions vertical and horizontal to ice surface. Judging from crystal structure, the ice samples were divided into congelation ice, snow ice, and a mixture of the two. The results of congelation ice showed that the flexural strength had a decreasing trend depending on porosity rather than brine volume, based on which a mathematical equation was established to estimate flexural strength. Both flexural strength and effective modulus of elasticity increased with increasing platelet spacing. The uniaxial compressive strength increased and decreased with strain rate below and above the critical regime, respectively, which is 8.0 × 10⁻⁴–1.5 × 10⁻³ s−1 for vertically loaded samples and 2.0 × 10⁻³–3.0 × 10⁻³ s−1 for horizontally loaded samples. A drop-off in compressive strength was shown with increasing sea ice porosity. Consequently, a model was developed to depict the combined effects of porosity and strain rate on compressive strength in both ductile and brittle regimes. The mechanical strength of mixed ice was lower than congelation ice, and that of snow ice was much weaker. To provide a safe guide for the transportation of goods on landfast sea ice in the Prydz Bay, the bearing capacity of the ice cover is estimated with the lower and upper envelopes of flexural strength and effective elastic modulus, respectively, which turned out to be a function of sea ice porosity.
- Article
(9381 KB) - Full-text XML
- BibTeX
- EndNote


Sea ice flexural strength, effective elastic modulus, and uniaxial compressive strength are important ice engineering properties. They are always used to assess the ice load exerted on marine structures in ice-infested waters (Sinsabvarodom et al., 2020; Su et al., 2010) and the load that can be supported by the floating ice (Masterson, 2009). Scientific and commercial activities have been expanding in the polar regions in recent years (Arctic Council, 2009; Mayewski et al., 2005). Therefore, studies on sea ice mechanical properties are still required.
Sea ice flexural strength and effective elastic modulus are obtained simultaneously using two different bending tests: cantilever and simple beam tests (Ji et al., 2011; Karulina et al., 2019). The cantilever beam test is a full-scale measurement performed on a large ice beam with whole thickness through the ice cover. The simple beam test (three- or four-point supported) is carried out using cuboid samples cut free from the ice cover. Because of maintaining the intact ice state, the cantilever beam test gives in situ ice flexural strength. However, it is highly time- and labor-consuming to prepare sufficient full-thickness cantilever beams, especially in the polar regions. Compared with the bending test, the uniaxial compressive strength test is relatively easy to carry out because of the smaller size of the samples required. Moreover, the behavior of ice under compressive strength tests is affected by machine stiffness (Sinha and Frederking, 1979). So, the test is performed using a machine with a high-stiffness loading frame (Bonath et al., 2019; Moslet, 2007).
The mechanical strength of sea ice has a strong dependence on its physical properties, to be more exact, on the multiphase structure. Timco and O'Brien (1994) compiled a database of 939 reported measurements on the flexural strength of sea ice from polar and temperate regions, and proposed a widely used empirical equation of sea ice flexural strength relying on brine volume fraction. Recently, a new formula of flexural strength dependent on brine volume was reported in Karulina et al. (2019), by performing a series of full-thickness cantilever beam tests. The parameterization of sea ice effective elastic modulus based on brine volume fraction was also given in Karulina et al. (2019). While investigations showed that gas within sea ice may occupy more space than brine, especially for warm ice (Frantz et al., 2019; Wang et al., 2020), an overestimation will be produced by calculating strength only with brine volume. Sea ice strength should depend more accurately on the total porosity (Timco and Weeks, 2010). The studies of sea ice flexural strength and effective elastic modulus related to porosity are rare. On the contrary, previous researches have related sea ice uniaxial compressive strength to porosity (Kovacs, 1997; Moslet, 2007; Timco and Frederking, 1990). The commonly adopted formulae to estimate sea ice uniaxial compressive strength were proposed by Timco and Frederking (1990), where 283 small-scale strength tests performed mostly in the Arctic waters were collected. A limitation in their equations is that the applicable condition is only for a strain rate less than 10−3 s−1 corresponding to a ductile strain-rate regime in their report. Strub-Klein and Høyland (2012) studied the variability in uniaxial compressive strength of level sea ice samples by sampling ice cores in eight matrices. Results showed that the strength variability was correlated with salinity variability and mean brine fraction.
The mechanical properties of Arctic sea ice have been widely investigated in the past century because of booming oil and gas exploration in the Northern Hemisphere polar regions, while understanding of mechanical properties of Antarctic sea ice is limited due to less human and industry activities than those developed in the Arctic. With current expansion in science and tourism in the Antarctic regions, sound knowledge of Antarctic sea ice engineering properties is urgent. It is thought that the ice strength depends on the conditions of ice cover formation and its development, which in turn determines the ice structure. Unlike Arctic sea ice, there is a large fraction of granular ice layer in the Antarctic sea ice (Carnat et al., 2013; Jeffries et al., 2001). Therefore, the empirical equations established based on Arctic sea ice strength tests may not be appropriate for Antarctic sea ice. Furthermore, because of the heterogeneous variability shown by sea ice in different Antarctic seas responding to climate change (Hobbs et al., 2016; Matear et al., 2015), sea ice in different sea areas may also behave differently in mechanical properties.
The landfast sea ice area is the only corridor for scientific expeditions to transport logistics cargos to the research stations in the shore of Prydz Bay. However, the available observations on the landfast sea ice conditions in the Prydz Bay is quite limited (Hui et al., 2017; Zhao et al., 2020), let alone the sea ice mechanical properties that are of importance to ensure safe activities on ice. The full-scale ice trial of an icebreaker was conducted in the landfast sea ice in the Prydz Bay in the late austral spring in 2019. A full-thickness ice block was extracted through the ice cover, part of which was used for on-site measurements, and the rest was stored for subsequent detailed investigations on sea ice mechanical properties in domestic laboratory. In this paper, we present the results of various mechanical experiments performed in laboratory, including crystal structure, flexural strength, effective modulus of elasticity, and uniaxial compressive strength of the Antarctic landfast first-year sea ice. The results will help to deepen the understanding of mechanical properties of Antarctic sea ice, especially the landfast sea ice in the Prydz Bay.
2.1 In situ sampling
As part of the 36th Chinese National Antarctic Research Expedition, a site (69.2∘ S, 76.3∘ E) was selected on the landfast sea ice (Fig. 1a) in the Prydz Bay to carry out ice sampling for ice trial of the vessel. A large ice block with sectional dimensions of 1.0 × 1.2 m was extracted through the whole ice cover with 1.6 m in thickness covered by 0.2 m thick snow (Fig. 1b) on 24 November 2019 (UTC). Visual observation showed that the upper part of the ice block was snow ice which was relatively porous than the underlying ice but more compacted than the new snow on the surface. Measurements of sea ice salinity and temperature were conducted on ice cores extracted nearby the ice block. Salinity measurements gave a “C-shaped” depth profile with a bulk value of 5.2 ± 1.3 psu, indicating that it was a first-year ice. A negative-gradient temperature layer was found in the top 10 cm with ice temperatures from −2.3 to −3.5 ∘C from the top down, and underneath was a positive-gradient layer with an ice temperature of −1.9 ∘C in the bottom. The mean ice temperature was −2.6 ± 0.6 ∘C. After measuring sea ice physical properties, bending tests were conducted onboard using the same machine as adopted in the laboratory tests (Fig. 1c; see details in Sect. 2.2.2). Approximately 2 h after lifting onto the deck using the ship crane, part of the ice block was cut and machined into seven three-point beams from the bottom to top, giving a flexural strength of 719 ± 48 kPa. During the sample preparation and tests, the air temperature varied from −2.6 to 1.8 ∘C with an average of −0.8 ± 0.9 ∘C, and it was overcast with low solar radiation. The air temperature from 2 months before field work, recorded by a weather station at the Zhongshan station (not far from the ice site), is shown in Fig. 1d. A rise in the air temperature occurred after 15 October 2019 from below −10 to above −10 ∘C. After these field measurements, the rest of the ice block was packed in plastic bags to avoid sublimation and stored at a temperature of −20 ∘C to reduce brine loss. Throughout the 5-month storage, they were shipped to Dalian, China, for detailed mechanical experiments in laboratory.
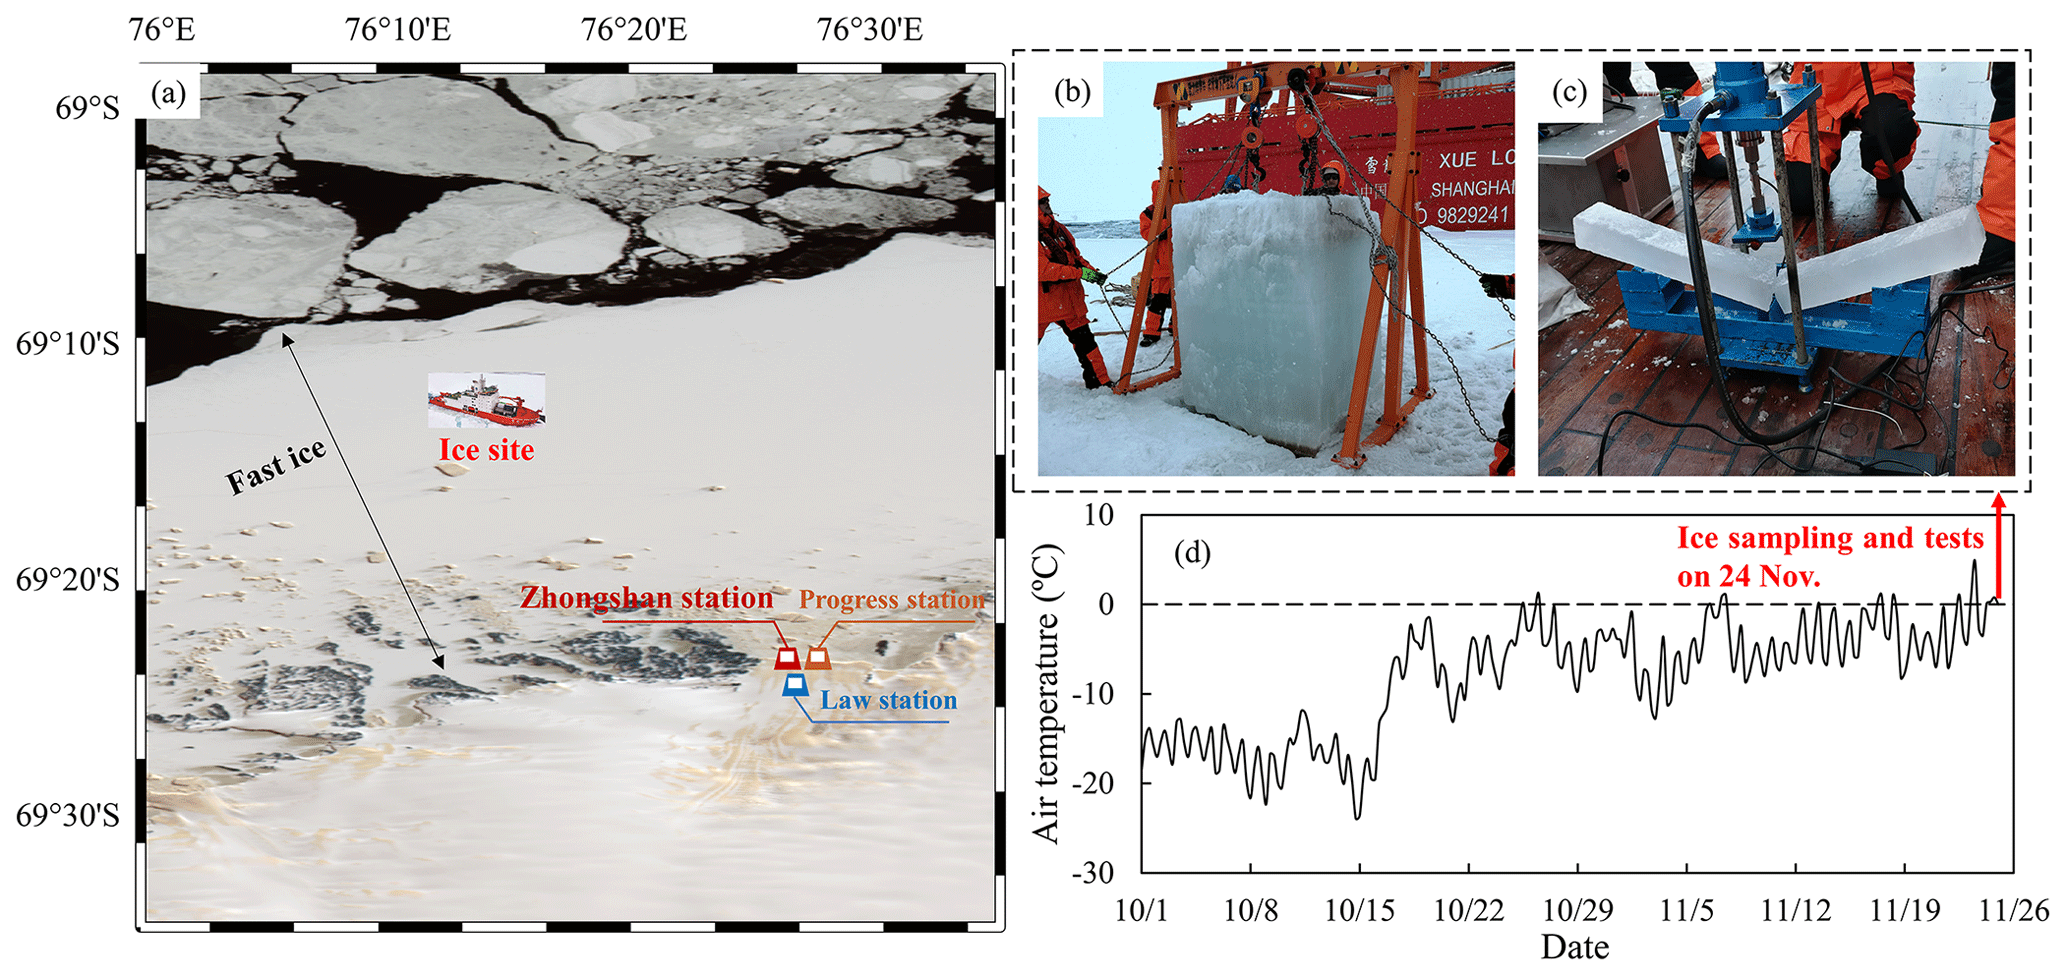
Figure 1(a) Maps of the ice sampling site (69.2∘ S, 76.3∘ E), (b) ice block extracted for measurements, (c) bending tests performed on ship deck, and (d) air temperature from 1 October to 24 November 2019 at the Zhongshan station. The background in (a) is the ice image on 23 November 2019 derived from the HY-1C satellite (https://osdds.nsoas.org.cn/, last access: 20 December 2020).
2.2 Laboratory experiments
2.2.1 Crystal structure
Vertical and horizontal sections were made for ice crystal structure measurements. One-centimeter-thick sections at approximately 10 cm intervals along the ice thickness were prepared first using a band saw. These thick sections were attached to glass plates and thinned down further to an approximate 2 mm thickness. A planer was then used to reduce the thickness to 0.5 mm. The thin slices were placed on a universal stage to observe the crystal structures under crossed polarized light, recorded by photography. Image sizes were calibrated using a ruler with a resolution of 1 mm. Moreover, the images of horizontal slices were further analyzed for grain sizes using an image processing software. The ice grains were distinguished separately and then were recognized as circles to determine the diameters from areas, all of which in a horizontal section were finally averaged.
2.2.2 Bending test
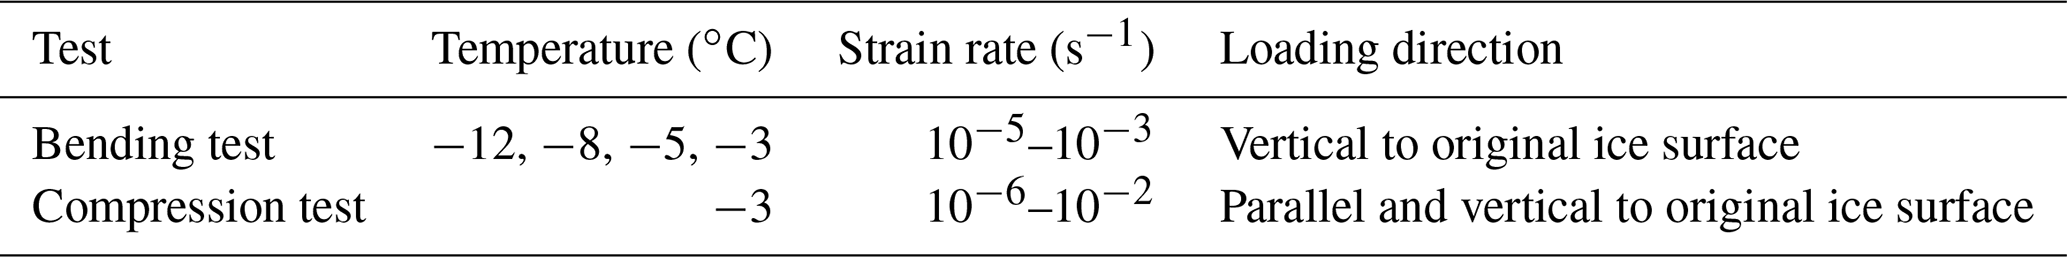
The flexural strength and effective elastic modulus of sea ice were measured using three-point supported beam tests. The rough-cut ice beams were prepared using chain saw and were then machined carefully to section dimensions of 7 × 7 cm using a band saw. The long axis of the beam was in the horizontal plane of the original ice cover. Cuboid-shaped ice samples were finally obtained using the band saw at right-angles to the beam sides to make the length 65 cm. Afterwards, they were preserved in a thermotank (accuracy ±0.1 ∘C) at required temperatures for at least 24 h before experiments.
The three-point bending test was conducted in the cold laboratory using equipment as shown in Fig. 2. The device was powered by a hydraulic actuator. A stainless-steel column was fixed on the bottom of a pressing plate to give a line force on the midspan of the ice beam underlain by a simply supported frame with a span of 60 cm. A force sensor with a capacity of 500 N and an accuracy of ±0.25 N was used to record the load. A laser sensor (accuracy ±12.5 µm) attached to the device columns and an aluminum plate fixed onto the pressing plate to reflect the laser from the sensor were used together to record the displacement of the plate, i.e., the deflection at the middle of the ice beam. Both force and displacement were recorded at frequencies of 200 Hz. The strain rate of bending tests, estimated using the method given in Han et al. (2016), varied from 10−5 to 10−3 s−1.
Based on the linear elasticity theory, the flexural strength of ice (σf) is defined as in Eq. (1):
where F is force at failure, l is span between supports, and b and h are section width and height of the ice beam, respectively.
In the three-point supported beam tests, the effective elastic modulus of ice (E) can be determined using Eq. (2) if the midspan deflection of beam (δ) is obtained:
Equation (2) was recommended by Schwarz et al. (1981) to provide guidelines for ice test methods and has been adopted by Karulina et al. (2019) and Kermani et al. (2008).
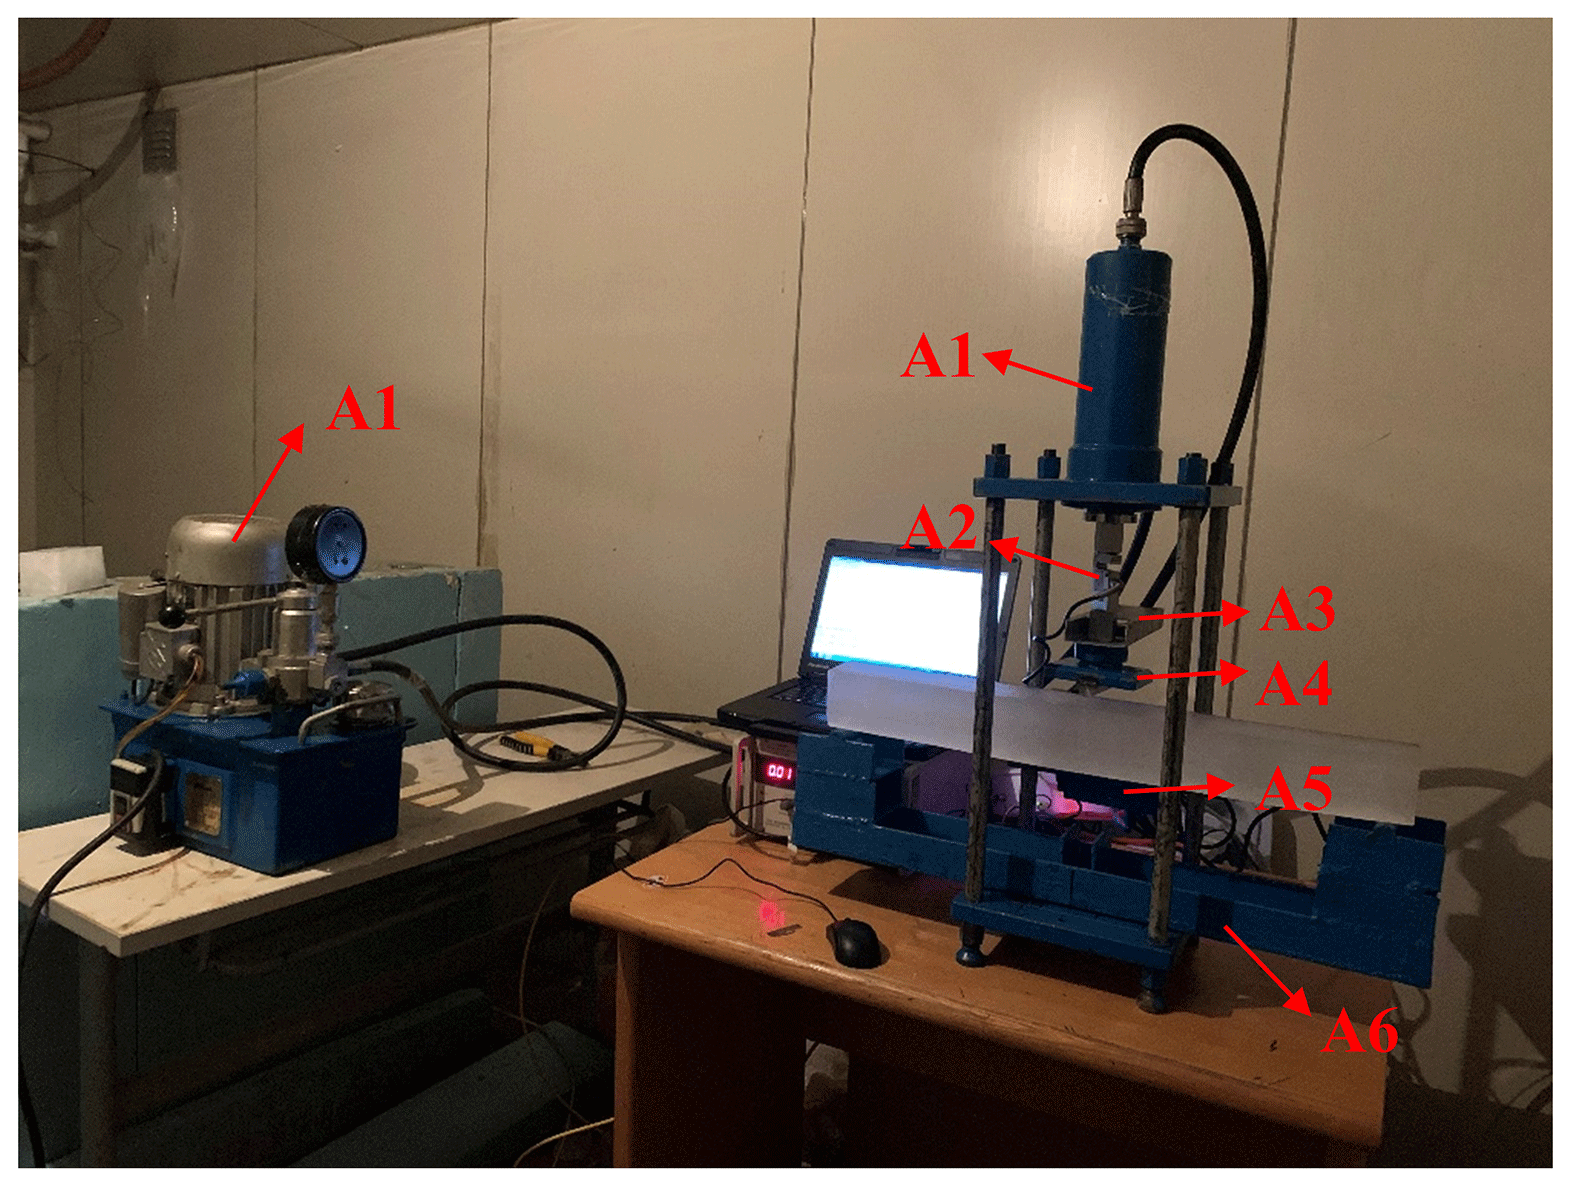
Figure 2Experiment equipment for the three-point bending test: (A1) hydraulic system; (A2) force sensor; (A3) aluminum plate; (A4) line-load pressing plate; (A5) laser displacement sensor (behind the ice sample); and (A6) simply supported frame.
Before loading, the mass of each sample was weighed using a balance ( ± 0.1 g) and the volume was calculated based on the dimensions measured using a caliper ( ± 0.02 mm). After failure, half of the broken sample was collected to melt for salinity measurements using a salinometer ( ± 0.001 psu), and the remaining half was used to observe ice grain size and ice platelet spacing. The ice platelet spacing was measured using the same method as grain size. The brine volume fraction and porosity of the ice beam were calculated using the ice temperature, salinity, and density based on Cox and Weeks (1983). It is noteworthy here that the calculations of brine volume fraction and porosity most likely involves uncertainties introduced by the measurement errors of ice physical properties; especially for sea ice porosity, the air volume fraction is largely dependent on ice density (Timco and Frederking, 1996). A total of 25 bending tests were performed, and Table 1 shows the conditions of bending tests. Details of the ice samples can be seen in Table A1 in Appendix A.
Table 1The test conditions of bending and compression experiments.
2.2.3 Compression test
Similar to sample preparation of bending tests, cuboid-shaped compression samples with dimensions of 7 × 7× 17.5 cm were finally prepared with long directions horizontal and vertical to the original ice surface, respectively. Both ends of the samples were planed using a spoke shave, with care taken to keep them flat, and made perpendicular with long axis by checking with a square ruler. After preparation, the samples were also stored in a thermotank at required temperatures for at least 24 h before compression.
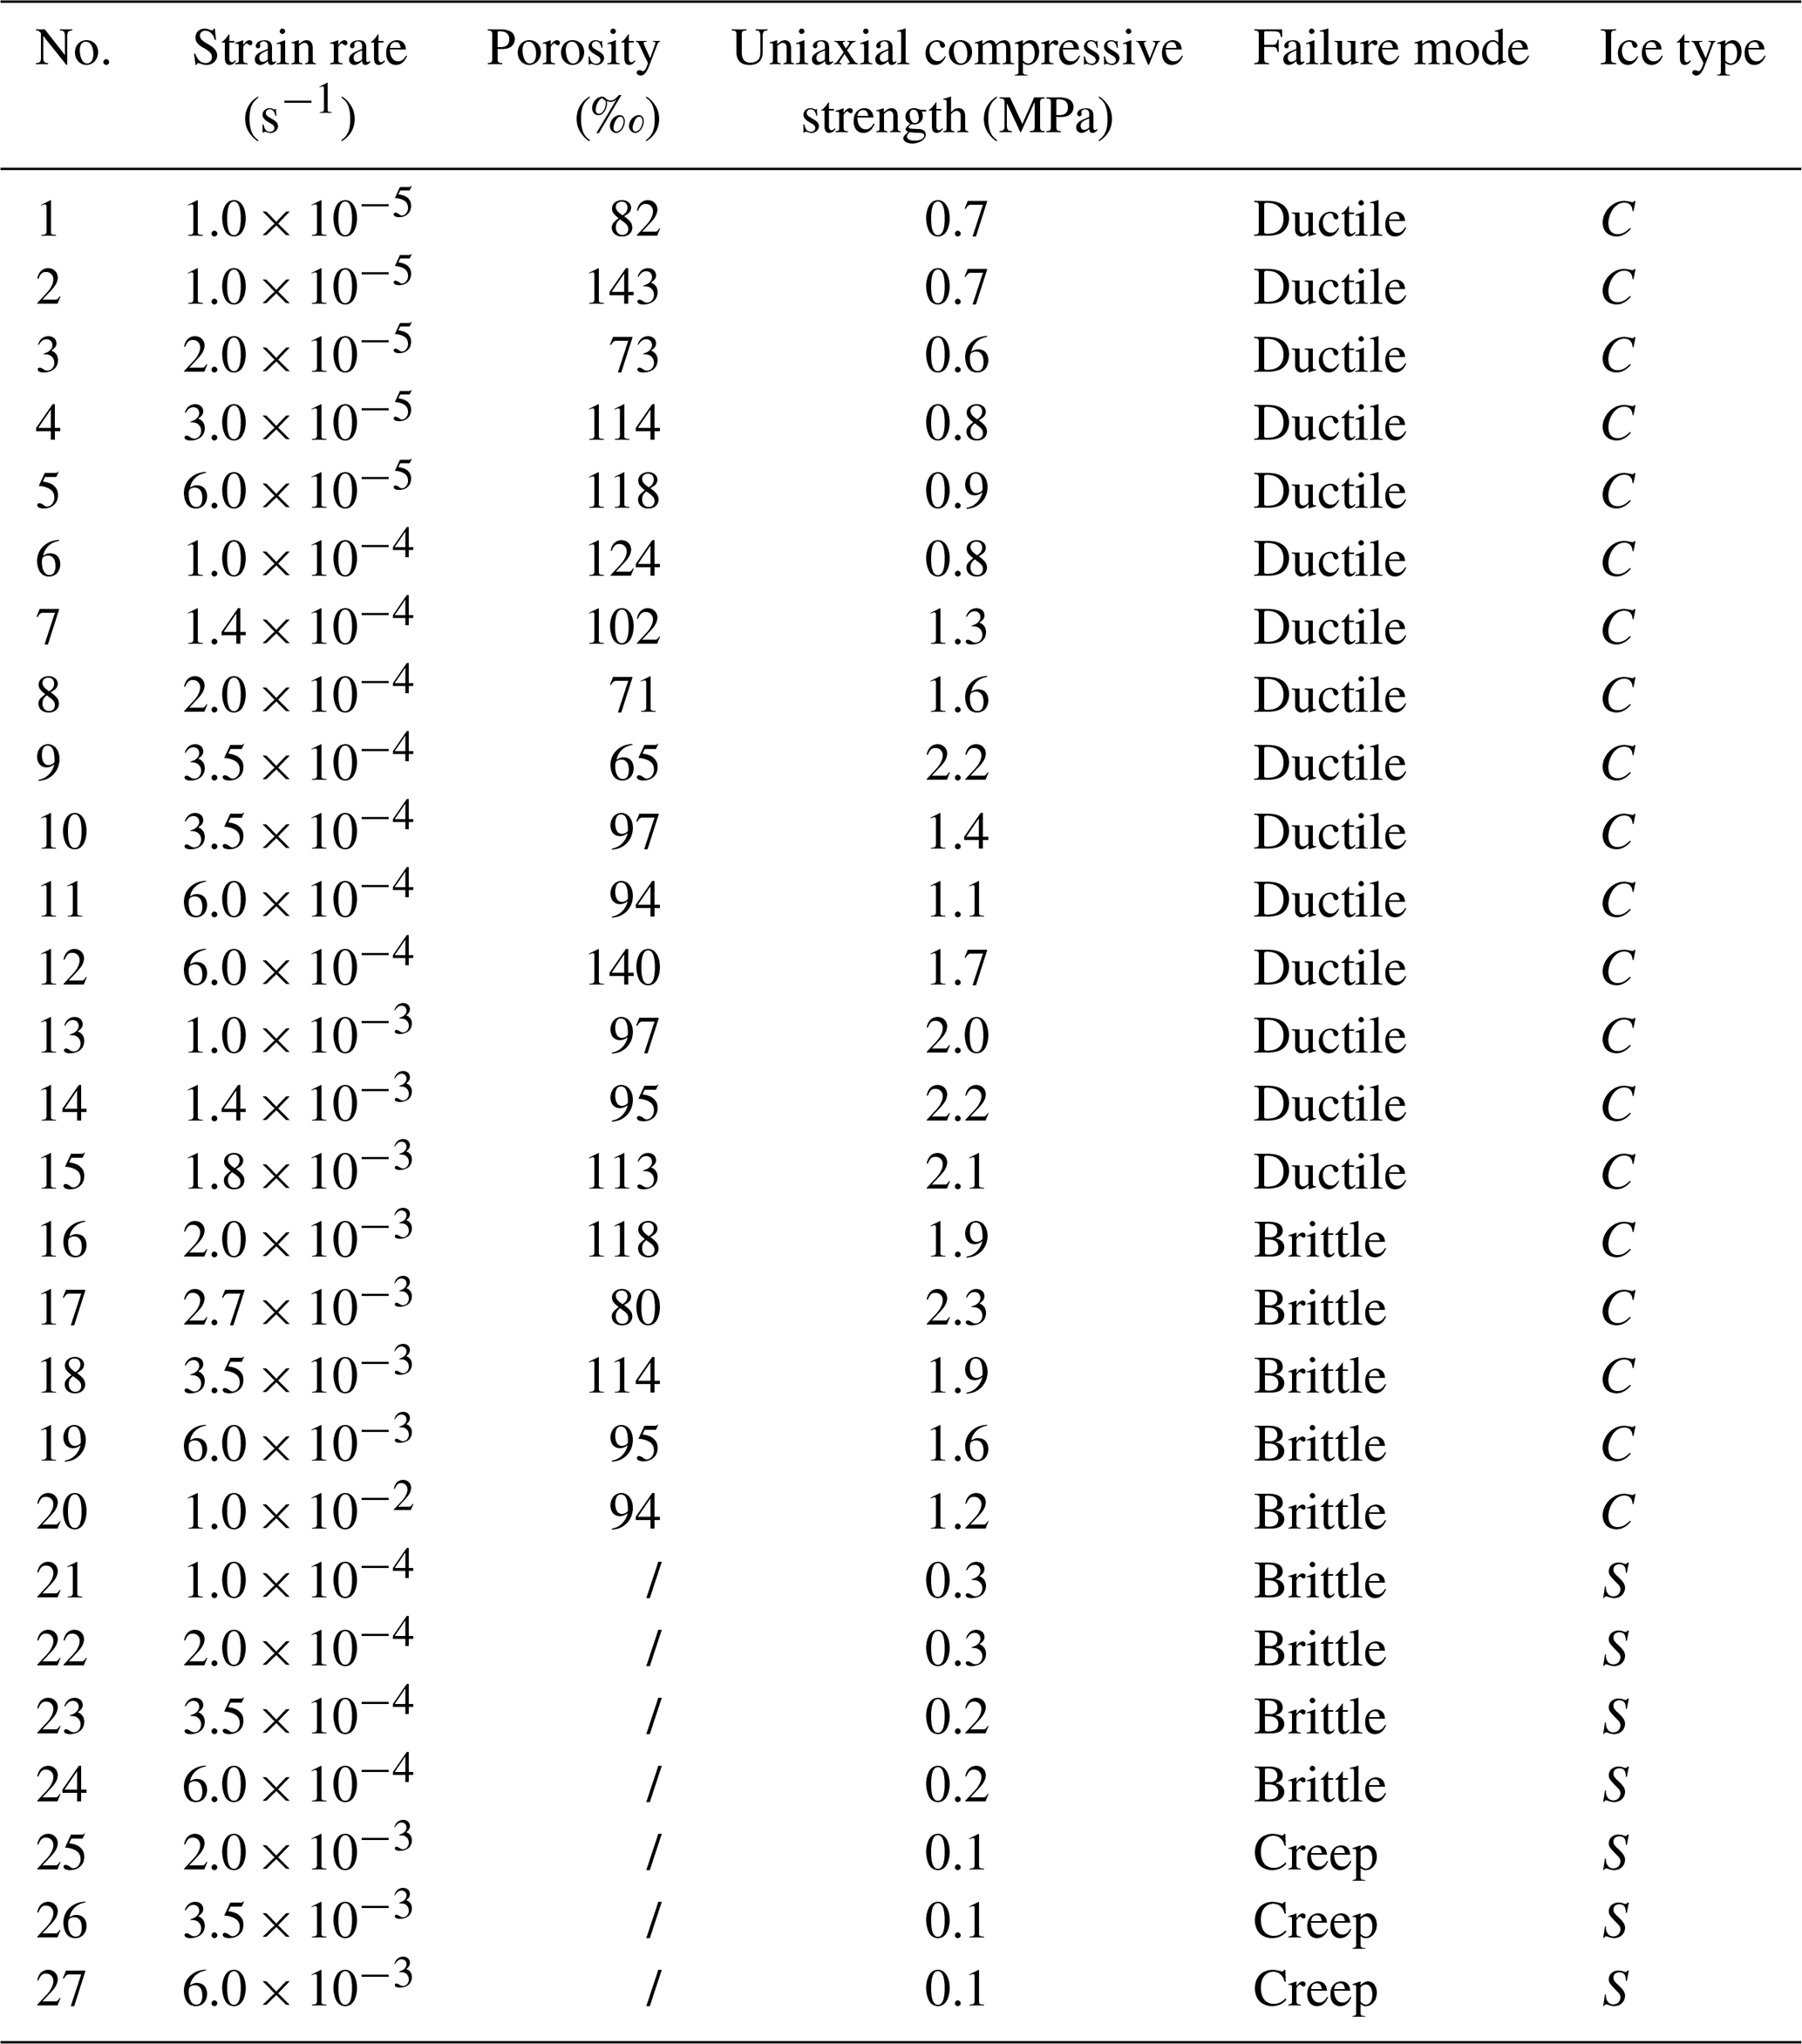
Because of the higher-rigidity setup required by the compressive strength test as compared with the bending test, a universal testing machine with a portal frame was used (Fig. 3). The machine was equipped with four columns supporting the upper beams, all of which are made of welded steel plates. So, it was expected to have a higher stiffness than the ice sample. The machine also used a servo motor which can maintain a constant loading rate with an accuracy of ±0.5 %. The machine is equipped with a force sensor of 100 kN capacity and ±0.5 % accuracy as well as a displacement sensor with ±2 µm accuracy. Both force and displacement were recorded at frequencies of 50 Hz. The ice sample was compressed in a cryostat in which a cold source was provided by a refrigerating system. The mass and dimensions of each sample were measured before compression and the fragments were collected to melt for salinity measurements after failure. The porosity of each ice sample was also determined according to Cox and Weeks (1983). Crystal texture observations were not performed as the samples generally broke into small pieces or with large deformation. A total of 55 compressive strength tests were performed, including 28 vertically loaded samples and 27 horizontally loaded samples. The test conditions are concluded in Table 1, and details are listed in Tables A2 and A3 in Appendix A. The uniaxial compressive strength of ice (σc) is given by Eq. (3):
where Fmax is maximum recorded force and S is section area of the compression sample. The nominal strain rate of the compressive strength test () is defined as in Eq. (4):
where L is the length of compression sample and is the loading rate of the pressing plate. According to Timco and Frederking (1984), the nominal strain rate of the test is higher than the true strain rate of the ice sample due to the deformation of the test machine. Contrarily, the difference between nominal and true strain rates in our test were minor because the rigidity of the test machine is expected to be stiff enough.
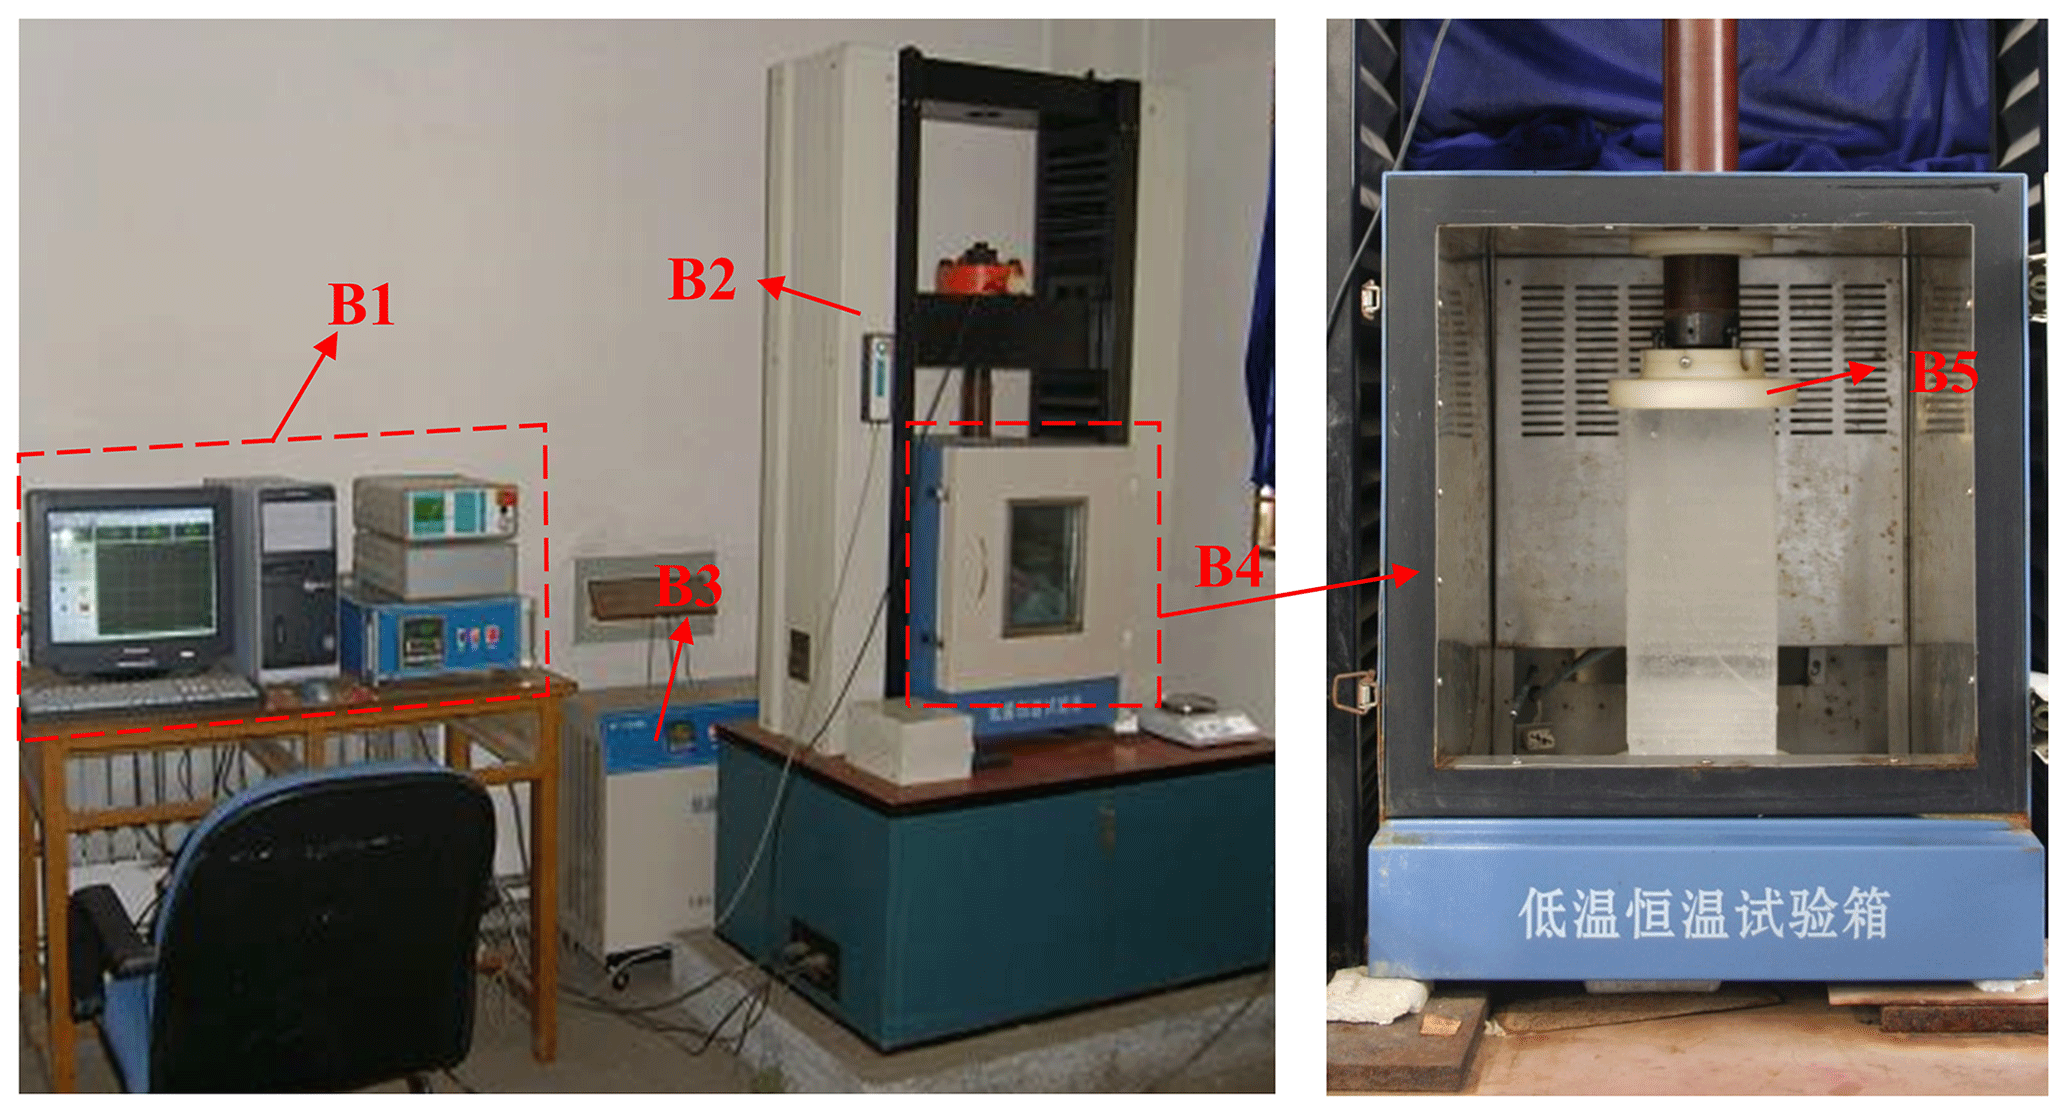
Figure 3Experiment equipment for the uniaxial compressive strength test: (B1) control system; (B2) loading frame; (B3) refrigerating system; (B4) cryostat container; and (B5) pressing plate.
3.1 Crystal structure
Results of ice crystal measurements are shown in Fig. 4. The sea level was approximately 19 cm below the ice surface. There was a snow-ice layer in the top 28 cm of the ice sheet where a large number of fine-grained crystals were in the shape of small polygons, shown in the vertical and horizontal sections. The snow ice could also be judged by its white appearance. Their diameters were too small (approximately <1 mm) to be identified precisely. Below the top snow-ice layer there was an ice layer with grains elongated perpendicularly with respect to the ice surface, which was formed by congelation of seawater without disturbance. Judging from the cross sections of the congelation ice layer, it can be divided further into transition- and columnar-ice layers. The transition ice existed just below the snow-ice layer at a depth of 28–40 cm, in which grains were fine with small diameters ≈2 mm. The exact diameters were also difficult to obtain due to excessive quantities and small sizes. Below the transition layer, there was columnar ice with larger grain sizes of 0.7–1.2 cm.
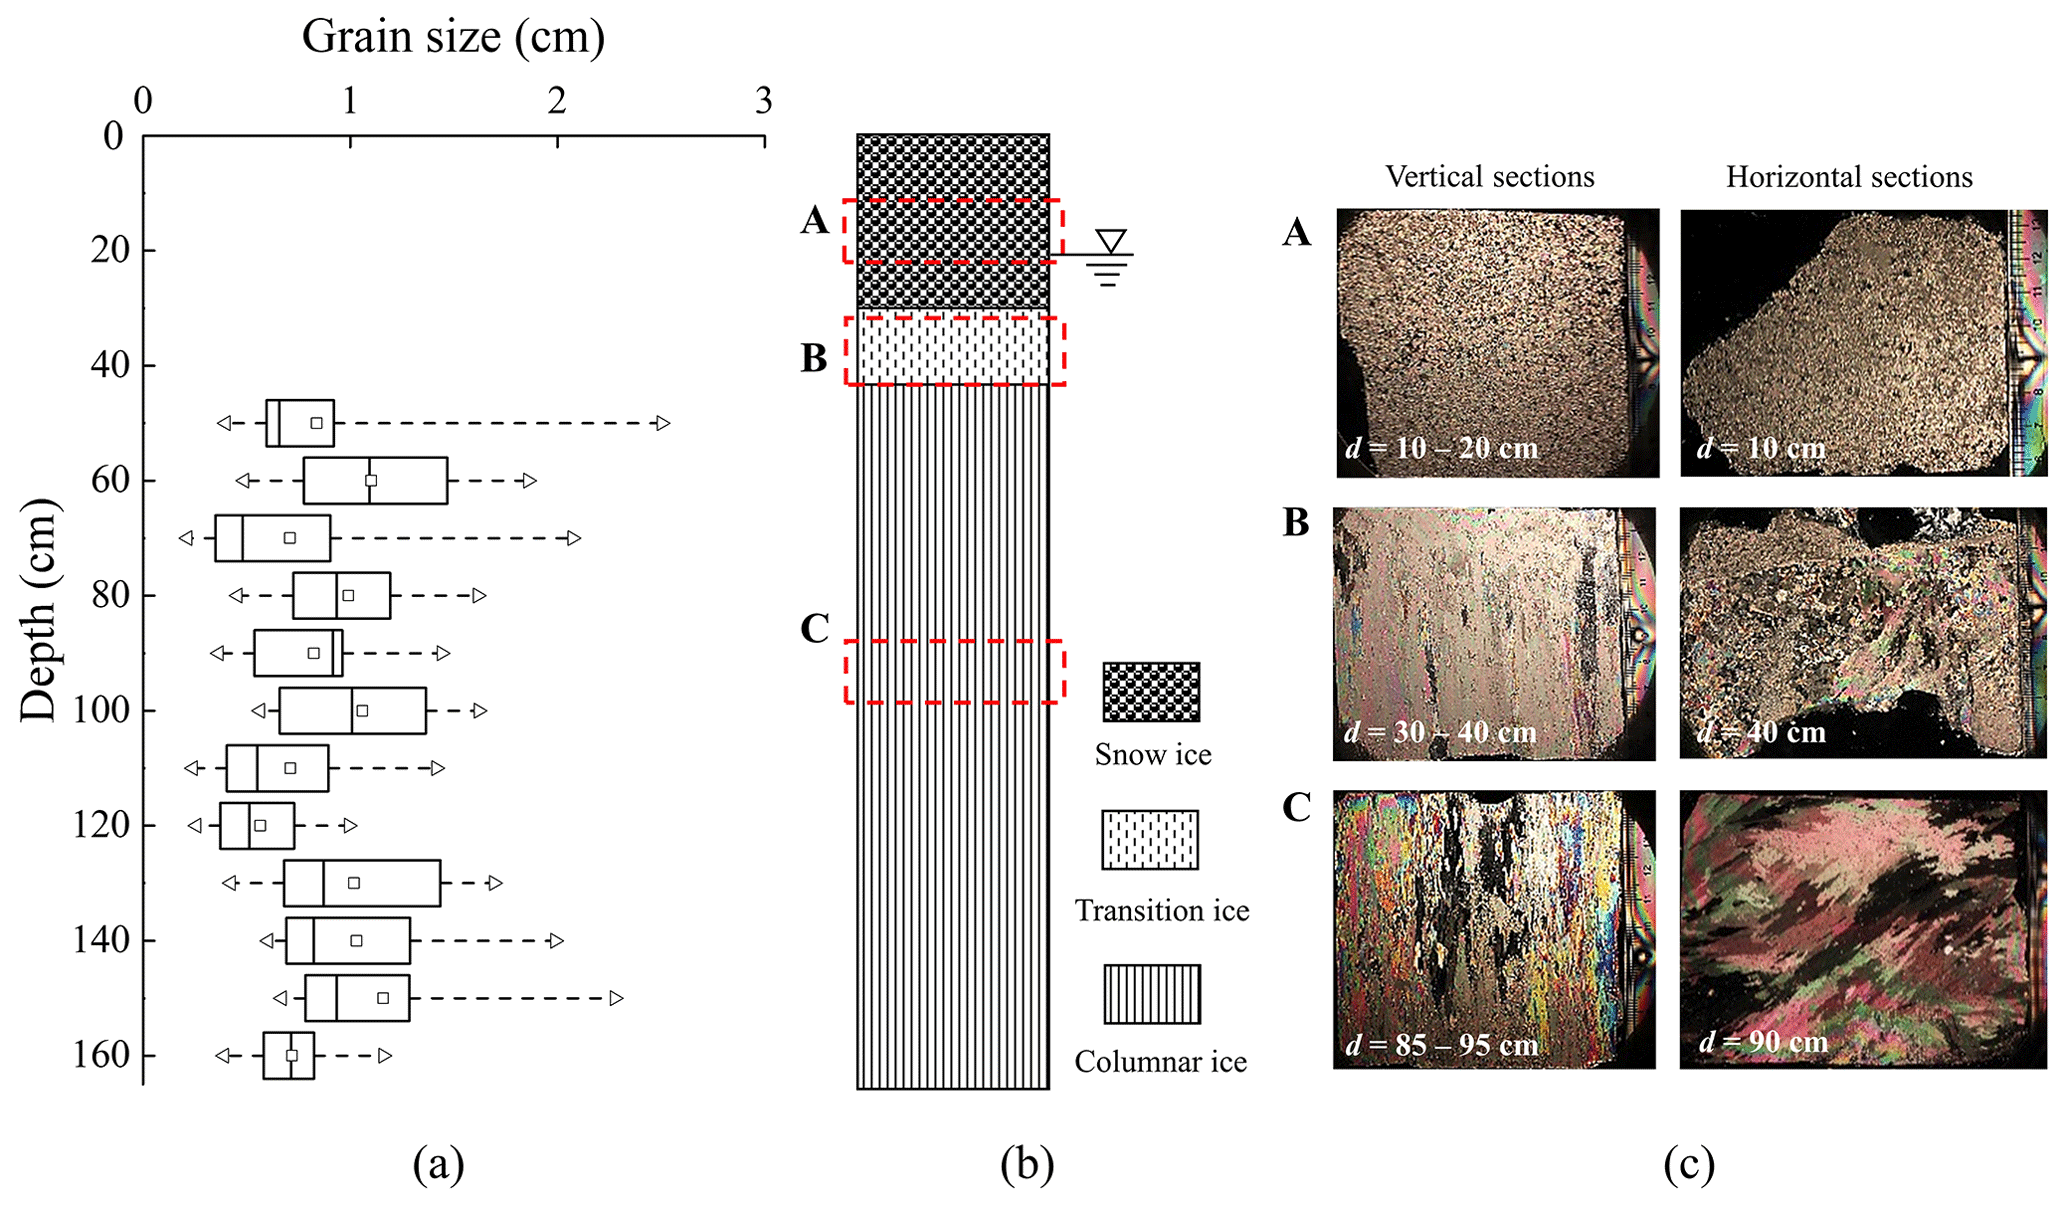
Figure 4(a) Box chart of grain sizes along ice depth, (b) the stratigraphy diagram of the ice crystal structure profile, and (c) typical pictures of grain types. The grain sizes in the top 40 cm of the ice sheet were too small to be identified clearly in (a) and d represents ice depth in (c). The freeboard of ice is approximately 19 cm.
3.2 Flexural strength
A total of three types of ice samples were measured in the bending tests which consisted of snow ice, columnar ice, and a mixture of transition and columnar ice. The snow-ice specimens could be distinguished easily by their white appearance and light weight with mean density of 0.55 ± 0.01 g cm−3. The mixed-ice specimen showed distinct stratification, of which the transition-ice part looked milky in appearance with 2 cm thickness. The mean densities of columnar- and mixed-ice specimens were 0.86 ± 0.03 and 0.88 ± 0.01 g cm−3, respectively. Figure 5 shows the typical curves of applied force varying with deflection at the middle of the simple beam for different types of ice samples. The force increased linearly with deflection and dropped abruptly when ice broke. Columnar- and mixed-ice samples behaved similarly, while for snow-ice beams, the force and deflection at failure were much less than the others. The mean slopes of force varying with deformation were similar between columnar-ice samples (512 ± 246 N mm−1) and mixed-ice samples (625 ± 178 N mm−1). The mean deflections of samples at failure were approximately similar between snow-ice samples (0.31 ± 0.11 mm) and mixed-ice samples (0.41 ± 0.21 mm). The failure modes of the ice beams are also given in Fig. 5, where the cracks (black lines) were particularly prominent, and the snow-ice sample also showed a main crack penetrating through the samples at the middle as shown by the others.
A total of 16 columnar-ice beams and 5 mixed-ice beams were conducted. In terms of strength, the flexural strength of mixed ice ranged from 511 to 846 kPa with an average of 688 ± 153 kPa, similar to the strength of columnar ice ranging from 305 to 1120 kPa with an average of 699 ± 223 kPa. A notable small difference was that the strength range of mixed ice is narrower than that of columnar ice. This is because of the inverse relationship between sea ice strength and porosity. The sea ice porosity was 76.1 ‰–120.6 ‰ with an average of 90.6 ± 26.7 ‰ for mixed ice, and was 43.3 ‰–168.6 ‰ with an average of 88.6 ± 40.1 ‰ for columnar ice. The flexural strength of snow ice ranged from 93 to 177 kPa with an average of 123 ± 37 kPa, which is quite low compared with other types of ice samples. Therefore, the flexural strength of columnar and mixed ice is analyzed together in Sect. 3.2.1 and that of snow ice is analyzed separately in Sect. 3.2.2.
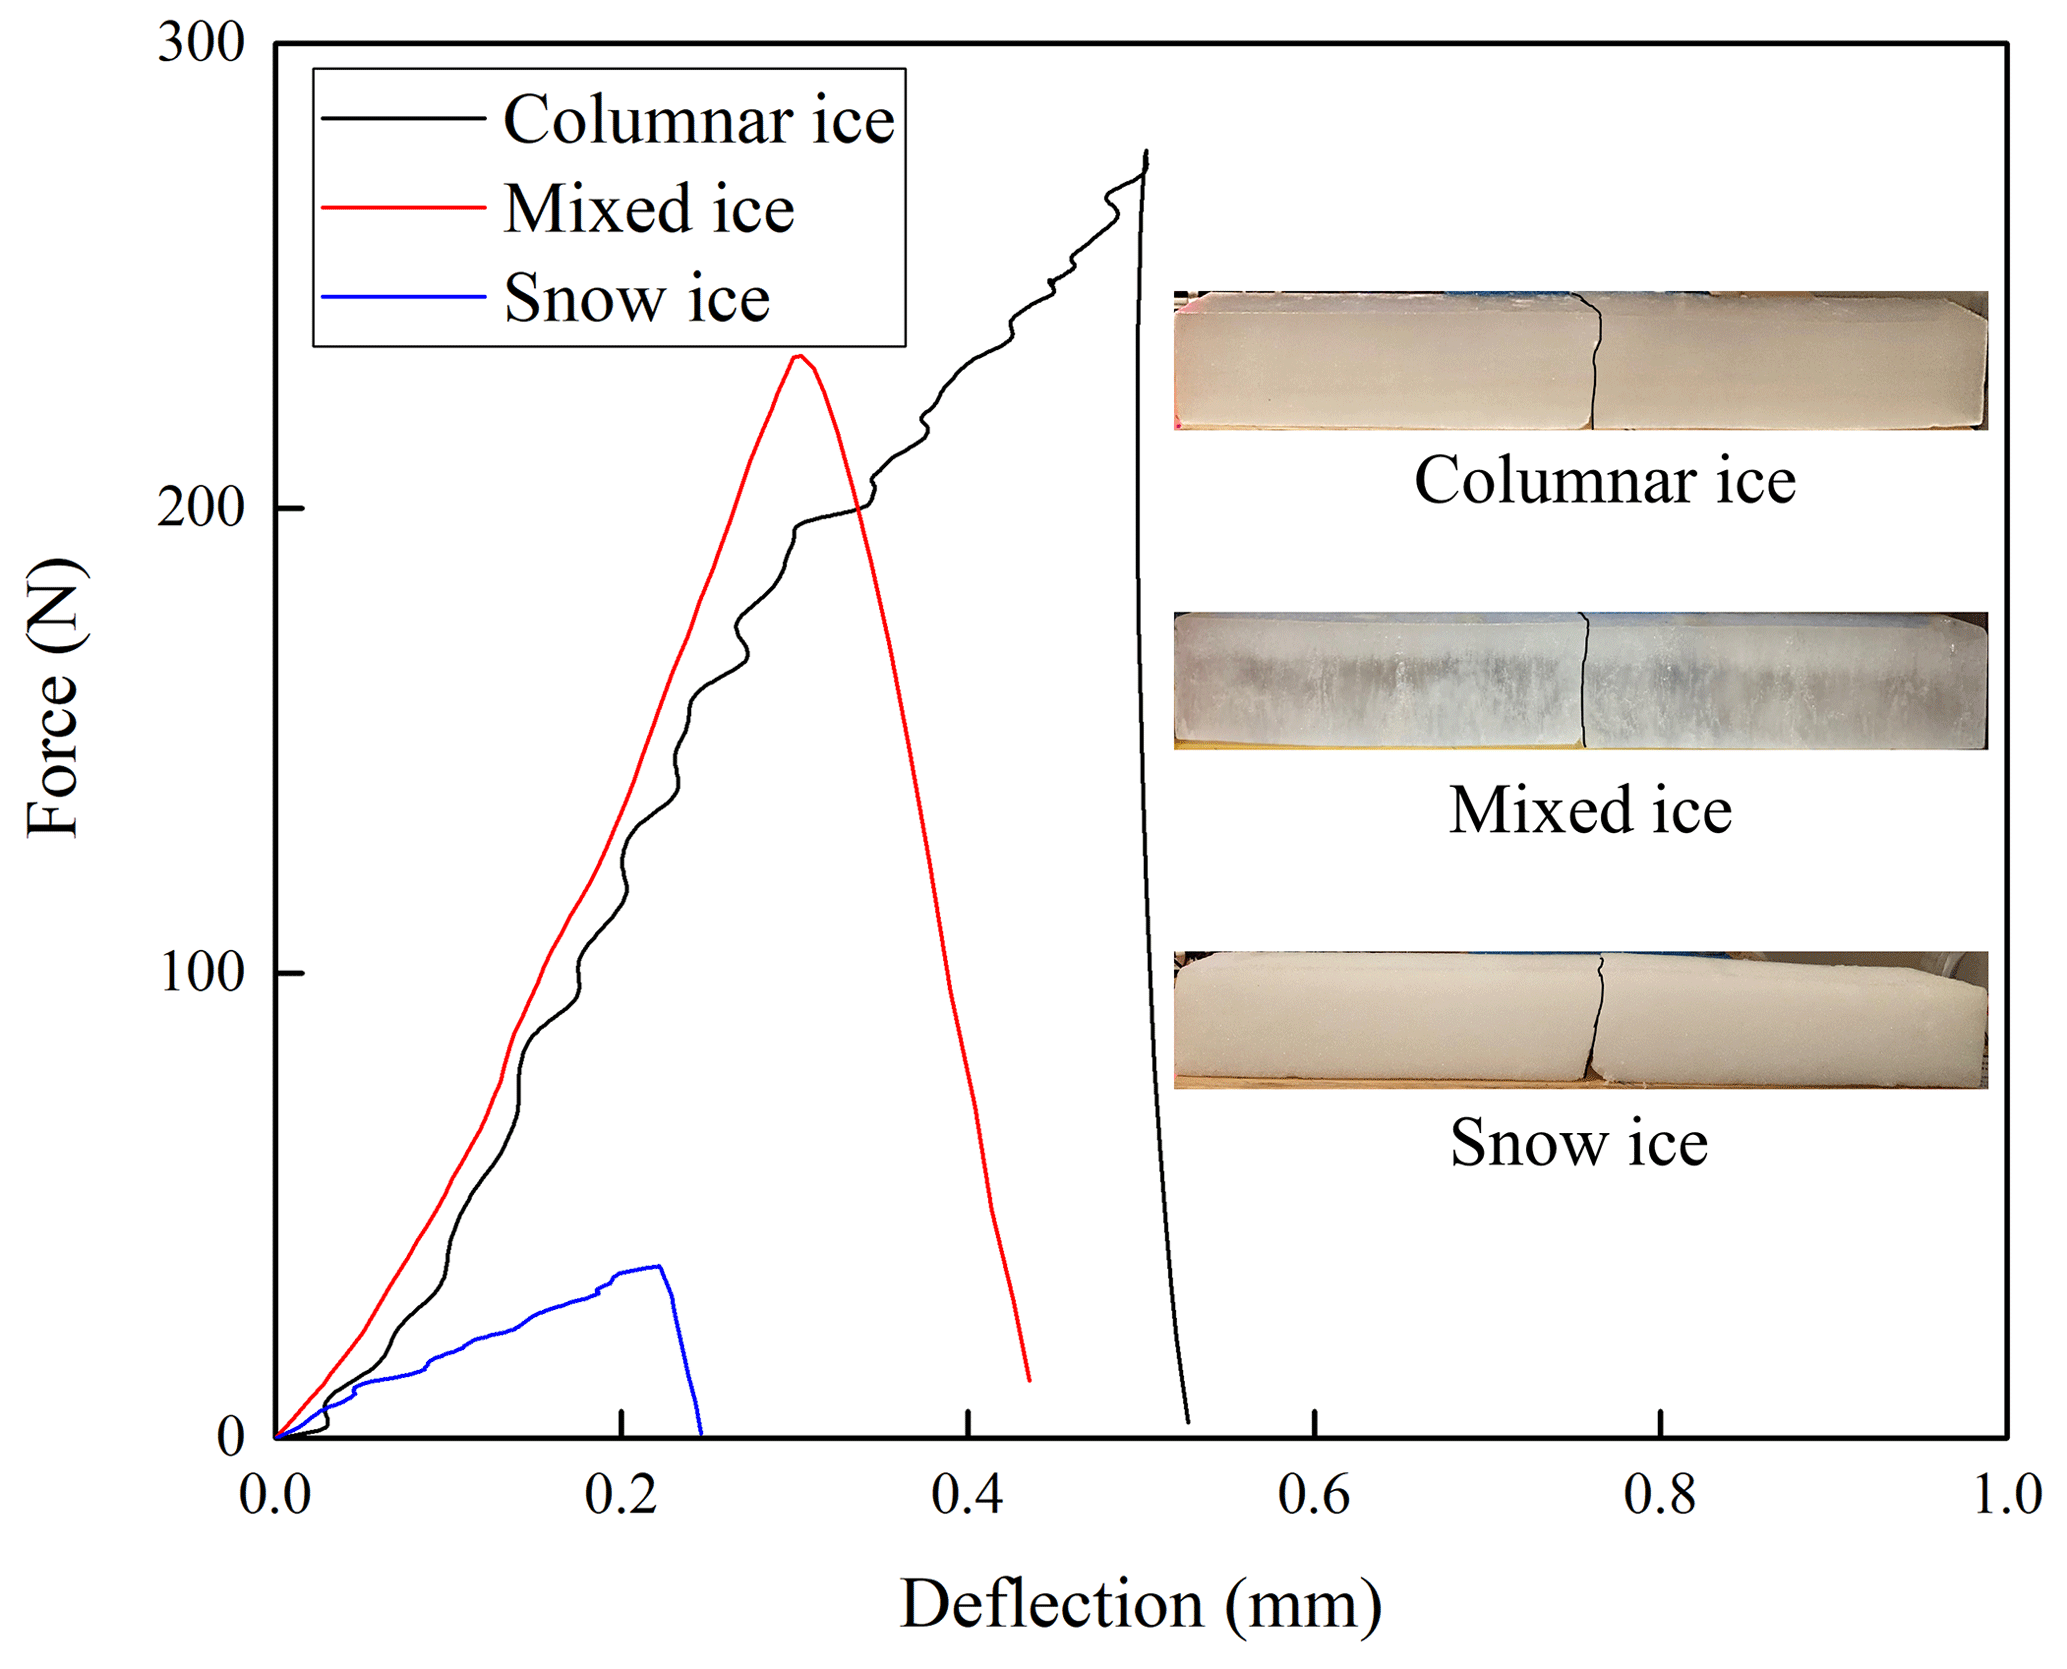
Figure 5Typical curves of force versus deflection at the middle of a beam with corresponding broken sections depicted by black lines shown in subplot.
3.2.1 Congelation ice
It was found that the flexural strength of congelation ice was dependent on sea ice porosity rather than brine volume fraction (see Sect. 4.1.1 for further discussion). Taking the square root of porosity of 0.02 as a bin, the mean value and standard deviation were determined, and the relationship between flexural strength and porosity is shown in Fig. 6. Sea ice flexural strength decreased with increasing porosity. To further quantify the dependence of flexural strength on porosity of our ice samples, regression analysis was conducted using the form as the one for brine volume fraction used in previously established equations (Table 2), and also other commonly used functions including linear, logarithmic, and power functions. Results showed a best-fit relationship with the form of Eq. (5) and with a determination coefficient (R2) of 0.68 at a significance level (p) of 0.01:
where σf is in kPa and v is porosity.
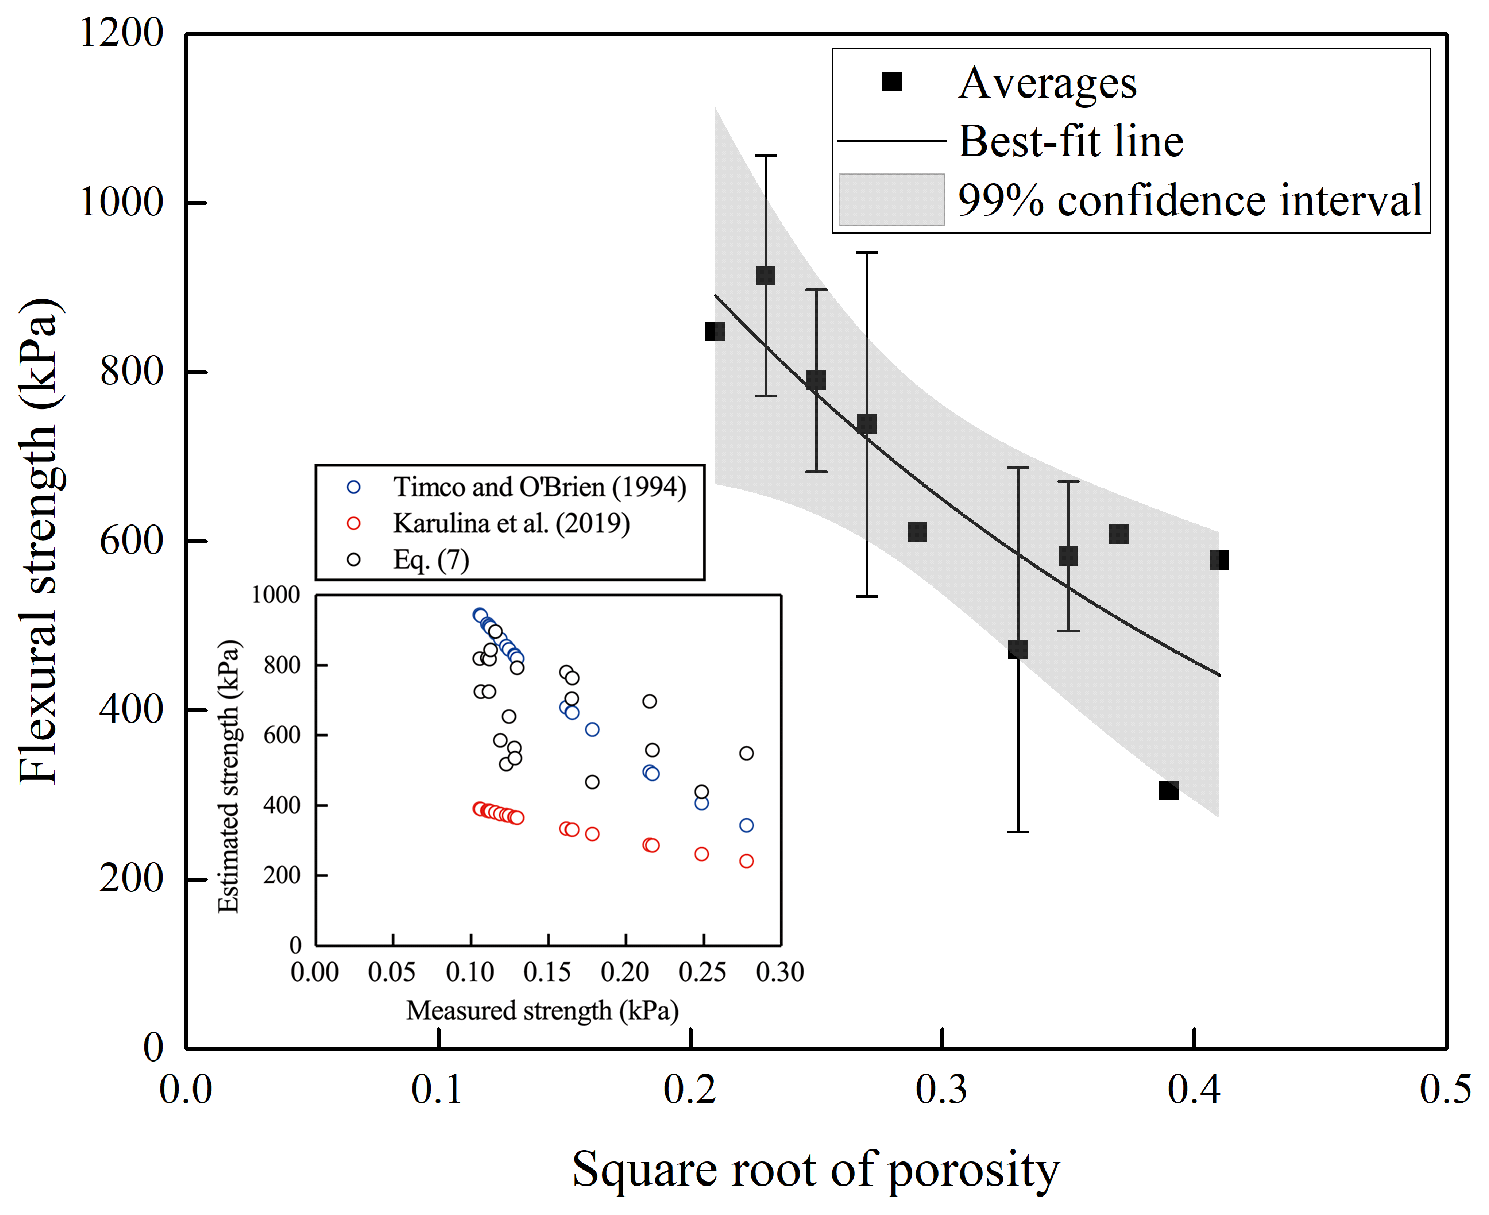
Figure 6The relationship between average sea ice flexural strength and porosity for congelation ice. The confidence interval is selected based on significance level. The subplot shows the comparisons between estimated flexural strength using the empirical equations in previous studies and this work.
Table 2Empirical relationships of flexural strength and effective modulus of elasticity based on brine volume fraction (vb). σf is in MPa and E is in GPa.
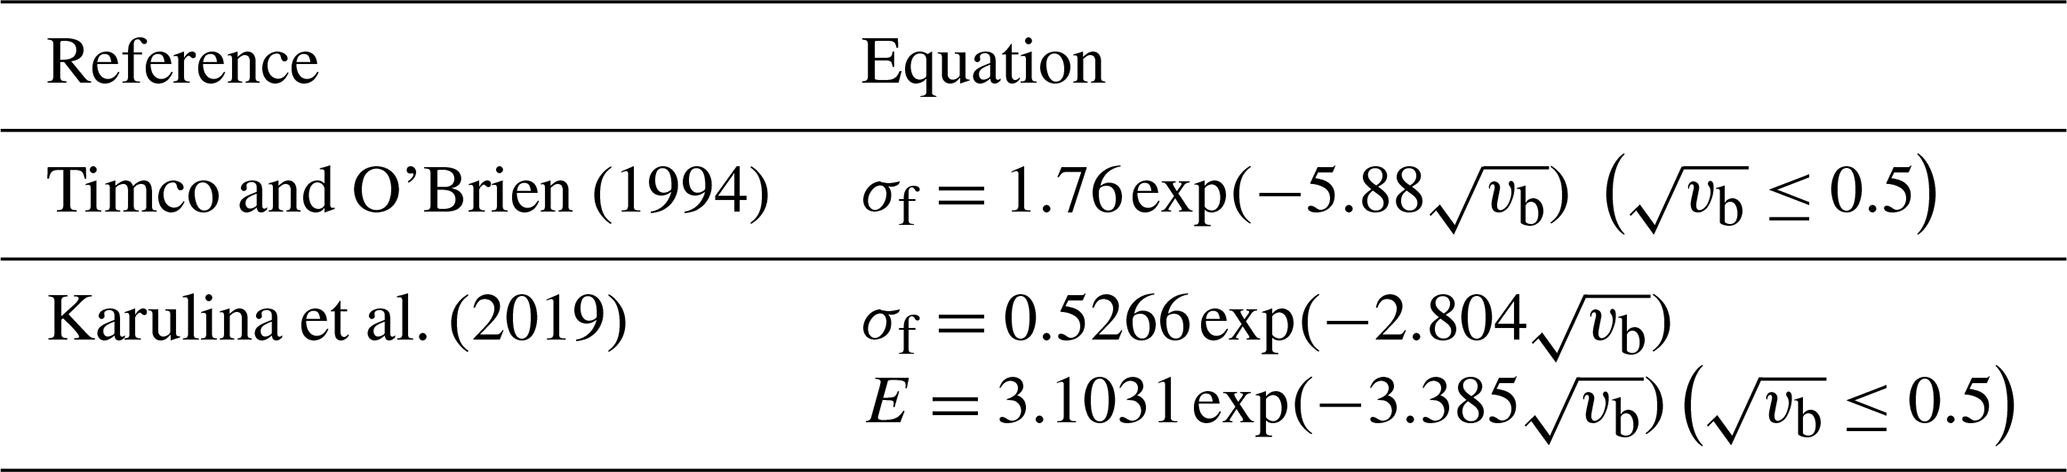
To compare our best-fit equation (Eq. 5) with existing equations in Table 2, the results of flexural strength calculated using these equations were plotted against the square root of the brine volume fraction (see subplot in Fig. 6). Results showed that the strength estimated using Karulina et al. (2019) was much lower than that estimated using ours. The strength estimated using Timco and O'Brien (1994) agreed better with ours, and only overestimated by 1.1 times.
The bending failure of ice is considered as a tensile failure in brittle manner, and grain size affects ice failure under tension. Consequently, to investigate the relationship between flexural strength and grain size, the grain size of columnar ice was divided at an interval of 0.1 cm, and the mean strength was determined. A clear trend is shown in Fig. 7a in which the flexural strength of columnar ice decreased with increasing grain size. For a homogeneous crack-free polycrystalline fresh-water ice with the same scale of grain size as our samples, the fracture process at a high strain rate is nucleation controlled. The crack propagates as soon as it forms, and the stress at failure is inversely proportional to grain size (Sanderson, 1988). It is noteworthy that probably because of the minor effect of grain size compared with porosity, the best-fit trend was not significant at p=0.1. Therefore, it is difficult to draw a firm conclusion on the dependence of flexural strength on grain size. Schulson (2001) argued that the case for sea ice may be more complicated, as brine pockets can act as pre-cracks, and platelet spacing might be more important than grain size. Therefore, the mean strength of columnar ice was determined at a platelet spacing interval of 0.01 cm, and the relationship between flexural strength and platelet spacing is plotted in Fig. 7b. Results showed that the flexural strength increased with increasing platelet spacing, and the regression analysis gave best-fit trend with a higher R2 at p=0.05. It is thus comprehensible that the larger the platelet spacing, the less are the existing pre-cracks for propagation.
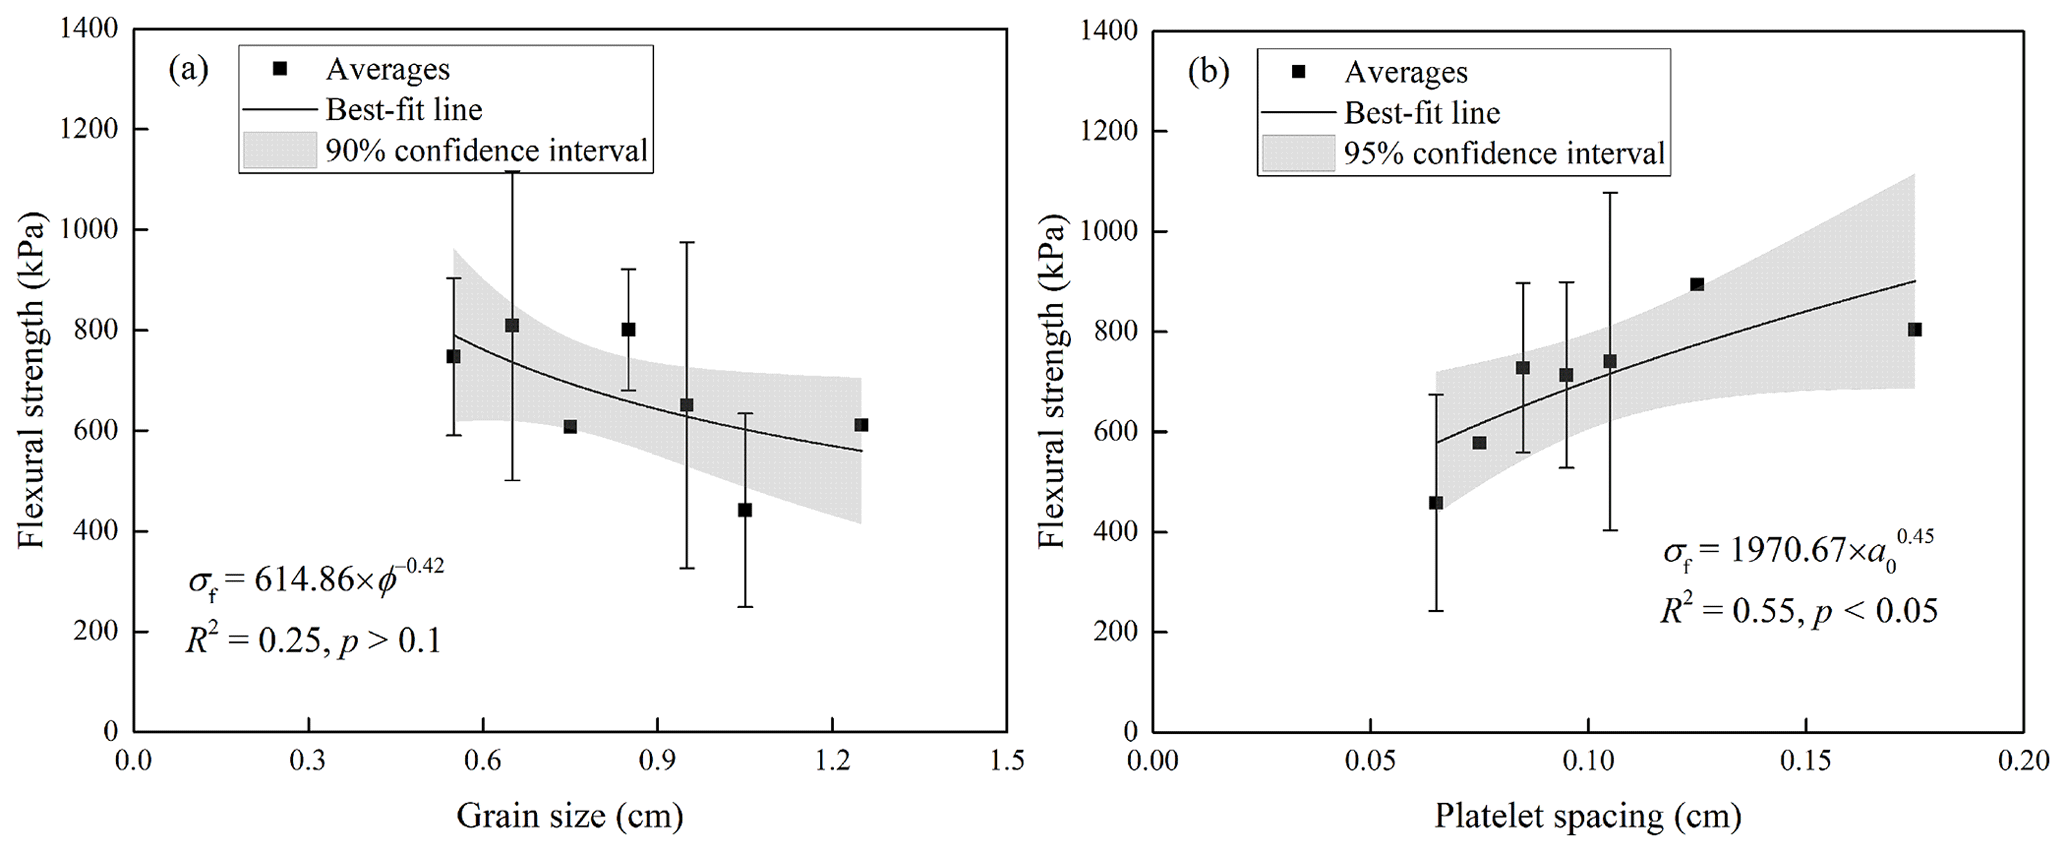
Figure 7The variations of average flexural strength with respect to (a) grain size and (b) platelet spacing for columnar ice. Also shown are the best-fit equations, where ϕ and a0 are grain size and platelet spacing, respectively.
3.2.2 Snow ice
A total of four snow-ice beams were tested, and results showed that the flexural strength of snow ice was much weaker than that of congelation ice, with an average of 123 ± 37 kPa. One of the snow-ice beams was tested at a temperature of −5 ∘C and showed relatively stronger flexural strength (177 kPa) than the mean value of the others (105 ± 11 kPa) tested at a temperature of −3 ∘C.
3.3 Effective elastic modulus
3.3.1 Congelation ice
The effective elastic modulus of columnar-ice samples ranged from 0.4 to 2.3 GPa, with an average of 1.5 ± 0.5 GPa, and that of mixed ice ranged from 0.9 to 2.0 GPa with an average of 1.6 ± 0.5 GPa. Because similarities were shown between the effective elastic modulus of columnar and mixed ice, they were also analyzed together.
The effective elastic modulus of our ice samples had no statistically significant dependence on brine volume fraction. Considering the effect of sea ice porosity on the flexural strength, the dependence of effective elastic modulus on porosity was also investigated. However, regression analysis indicated a weak relationship between them with low R2 and no statistical significance at the p=0.1 level using the form proposed by Karulina et al. (2019) (see Table 2) and other commonly used ones (linear, logarithmic, and power functions).
The effects of sea ice substructure on the effective elastic modulus of columnar ice were investigated as shown in Fig. 8, where the relationships between effective elastic modulus and grain size, as well as platelet spacing, were examined using the same processing approaches as flexural strength. Results showed that there was a negligible effect of grain size on effective elastic modulus with R2 close to 0 (Fig. 8a). On the contrary, the effect of platelet spacing on effective elastic modulus was significant. The effective elastic modulus increased with increasing platelet spacing (Fig. 8b), and regression analysis showed that the logarithmic equation was the best-fit form to depict the varying trend.
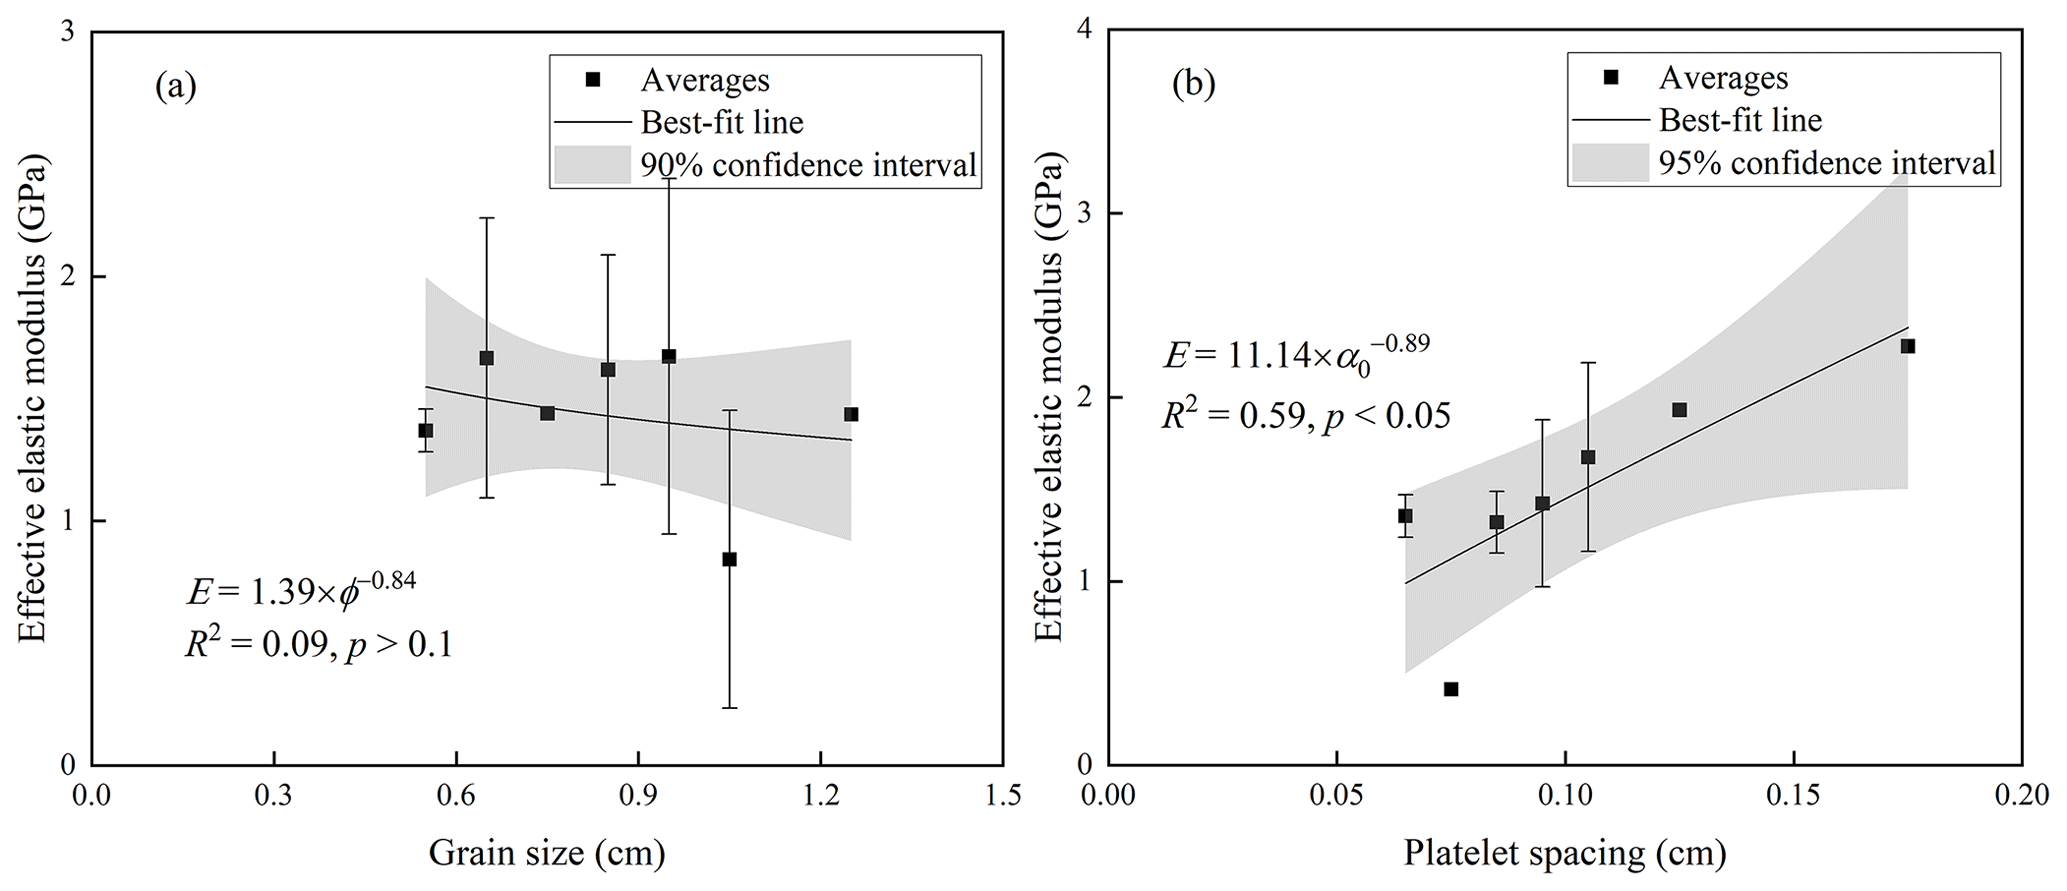
Figure 8The variations of average effective elastic modulus with respect to (a) grain size and (b) platelet spacing for columnar ice. Also shown are the best-fit equations.
3.3.2 Snow ice
The mean effective elastic modulus of snow ice was 0.4 ± 0.1 GPa, much lower than that of congelation ice. Of the snow-ice samples, the one tested at a temperature of −5 ∘C had an effective elastic modulus of 0.4 GPa, which is similar to the average modulus of the others (0.4 ± 0.2 GPa) tested at a temperature of −3 ∘C.
3.4 Uniaxial compressive strength
The uniaxial compressive strength samples were divided into three types, i.e., congelation-ice samples consisting of columnar and/or transition ice, snow-ice samples, and mixed-ice samples consisting of both snow and congelation ice. The snow-ice samples had the least density with an average of 0.61 ± 0.13 g cm−3, and the mean densities of congelation- and mixed-ice samples were 0.85 ± 0.03 and 0.81 ± 0.02 g cm−3, respectively. Of the three types, the compressive strength of congelation ice is much stronger than the other two, so it was analyzed separately.
3.4.1 Congelation ice
Figure 9 shows the typical stress–strain curves of sea ice during compressive strength tests. Different behaviors were shown by sea ice compressed under different strain rates and loading directions. At a low strain rate, stress increased linearly with strain until peak, and then decreased gently without abrupt change, indicating ductile behavior (curves B and D). Large deformation with local cracks can be seen in the samples at failure (samples B and D). With an increase in the strain rate, sea ice exhibited brittle behavior, where the stress dropped abruptly once reaching peak (curves A and C). No obvious deformation occurred at the time of failure (samples A and C). Similar stress–strain curves of brittle and ductile failures under compression were also seen in ridged ice (Bonath et al., 2019) and polycrystalline ice (Arakawa and Maeno, 1997).
In spite of stress–strain curves, there were several differences between vertically loaded and horizontally loaded samples at failure. For the vertically loaded samples compressed under a low strain rate (sample B), cracks developed along the long axes of the columnar grains, whereas for horizontally loaded samples (sample D), inclined cracks developed at both ends of the ice. For horizontally loaded samples, force was applied perpendicular to the long axes of the ice columns, and the sliding along the grain boundary was easily triggered, combined with the dislocation pile-up at grain boundaries, leading to crack development along the grain boundaries (Gold, 1997; Sinha, 1988), whereas for vertically loaded samples, force acted on the cross of the columns, and grain boundary sliding was suppressed. Therefore, local cracks developed parallel to the column axes due to the grain decohesion (Kuehn and Schulson, 1994). Alternatively, at a high strain rate, local cracks and deformation were not sufficient to relax the stress concentration. Therefore, for the vertically loaded samples, once the sea ice was split by a vertical crack, the slender columns suddenly became unstable and failed through buckling (sample A). For horizontally loaded samples, inclined cracks accumulated and formed a primary crack penetrating through the sample, and the sample failed through shear faulting (sample C).
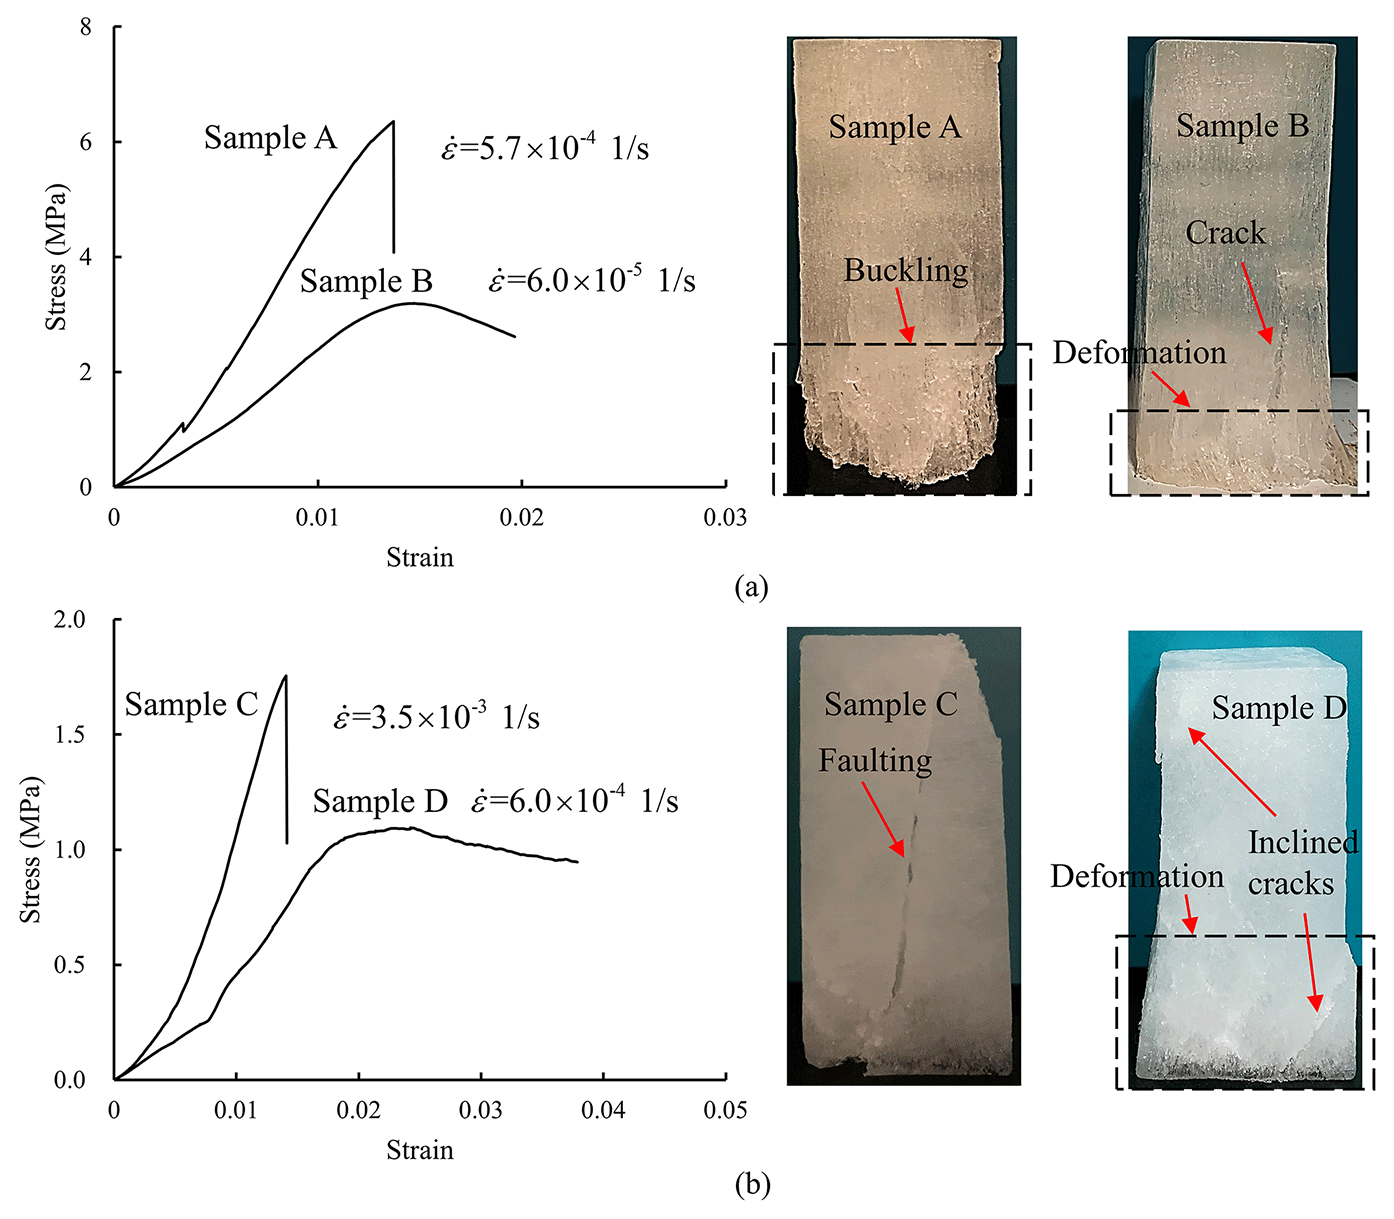
Figure 9Typical stress–strain curves and failure modes of (a) vertically and (b) horizontally loaded samples.
Since the test strain rate was wide ranging from 10−6 to 10−2 s−1, we could not determine the average strength in most bins if the strain-rate range was divided into intervals. Therefore, all the measured data was put in Fig. 10a with double logarithmic coordinates, showing the relationship between uniaxial compressive strength and strain rate. At the strain rates where ice breaks in a ductile manner (termed “ductile strain-rate regime”), the uniaxial compressive strength increased with increasing strain rate (Schulson, 2001). The power law is commonly adopted to describe the variations of uniaxial compressive strength with strain rate at the ductile strain-rate regime (Timco and Frederking, 1990; Timco and Weeks, 2010). The best-fit equations for vertically and horizontally loaded strength were given, and both showed higher R2 at p=0.01. At a brittle strain-rate regime, the uniaxial compressive strength exhibited strain-rate weakening (Schulson, 2001). While regarding the mathematical equation to depict the declining trend of strength at brittle regime, no agreement has yet been reached. Here, the power-law equation was still adopted (Arakawa and Maeno, 1997), and regression analysis gave statistically significant results with high R2. When sea ice transitioned from ductile to brittle failure, it reached maximum uniaxial compressive strength (Høyland, 2007). In addition, because sliding along the grain boundary is easily triggered when force is applied perpendicular to the long axes of the columns, the uniaxial compressive strength of vertically loaded samples was higher than that of horizontally loaded samples at both brittle and ductile regimes (Ji et al., 2020; Strub-Klein and Høyland, 2012).
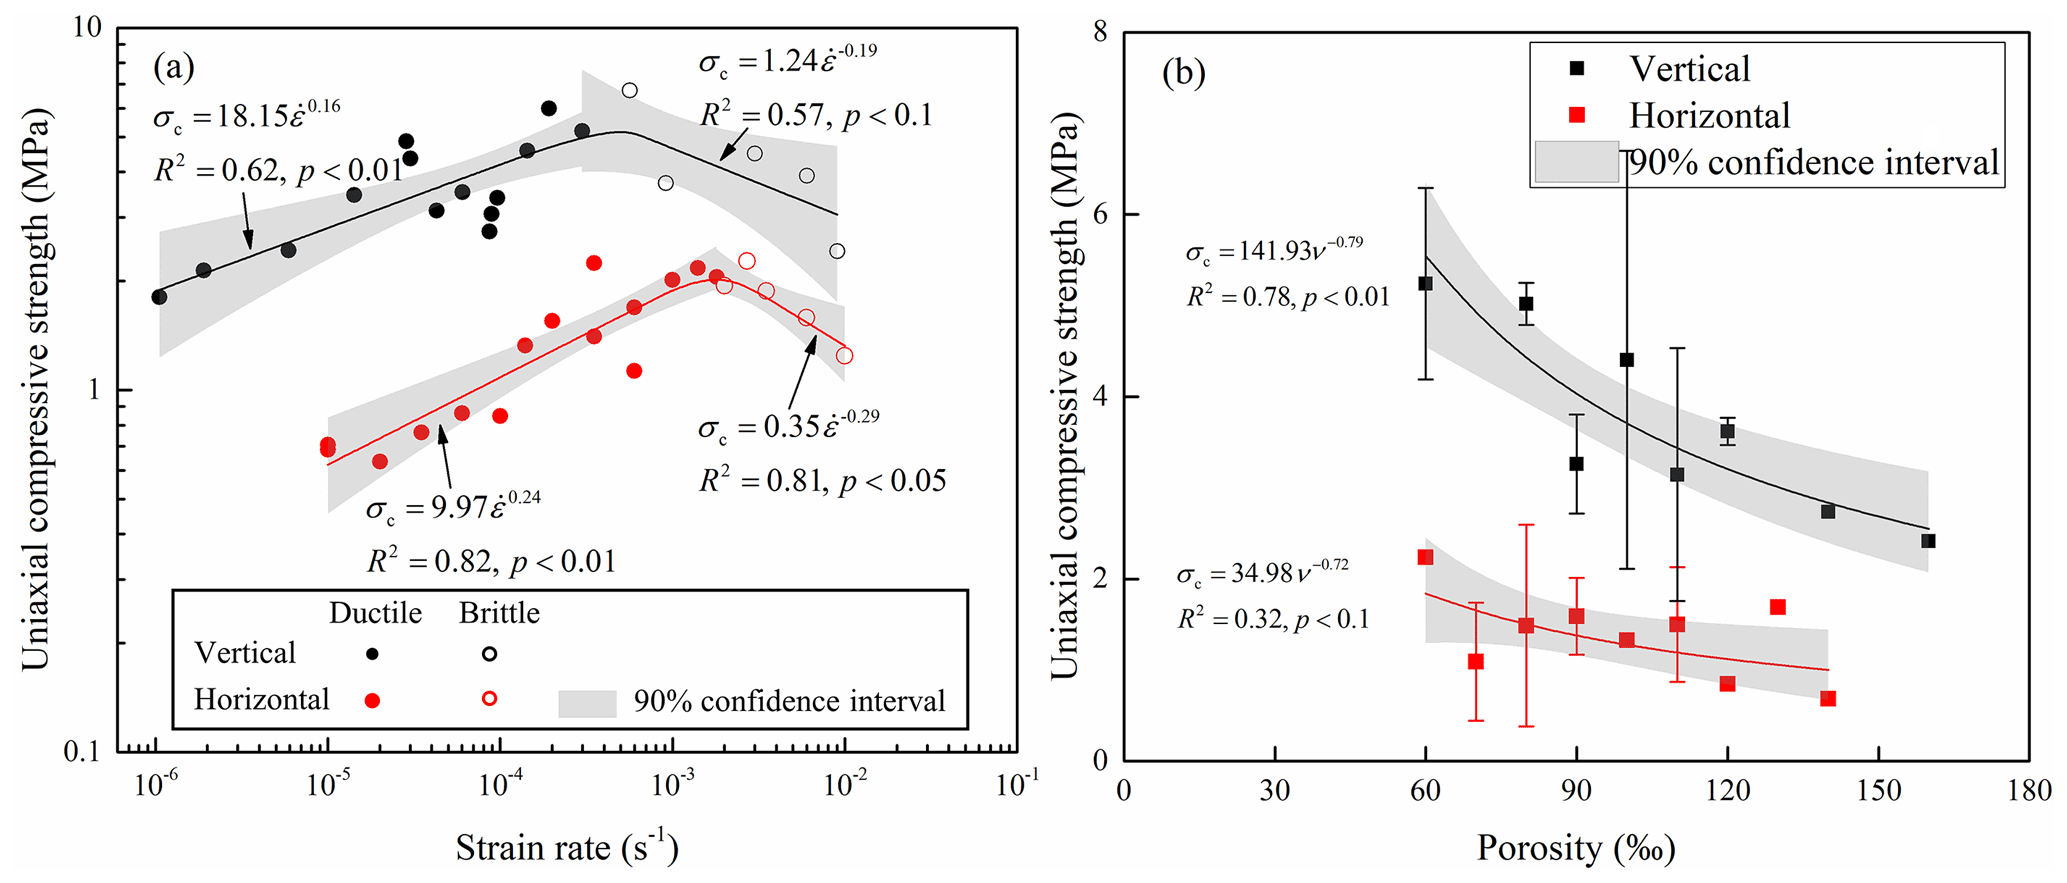
Figure 10Variations of uniaxial compressive strength with strain rate (a) and porosity (b) for congelation ice. Panel (a) adopts all measured data and (b) adopts averages determined taking the porosity of 10 ‰ as a bin. Also shown are the best-fit lines and equations, in which the confidence interval is determined using the maximum significance level of the regression equations.
The mean strength and standard deviation were determined taking the porosity of 10 ‰ as a bin, and the variations of uniaxial compressive strength with respect to porosity are plotted in Fig. 10b. As the sea ice porosity increases, strength decreases since brine and gas inclusions cannot support the load. A declining trend in sea ice compressive strength with increasing porosity was also reported in Moslet (2007). Furthermore, regression analysis showed a statistically significant dependence of uniaxial compressive strength on porosity following a power law.
Since the uniaxial compressive strength of sea ice is affected by strain rate and porosity, it is rational to parameterize the compressive strength using these two parameters. Based on the aforementioned relationships between strain rate, porosity, and uniaxial compressive strength, the form of the model proposed in Kovacs (1997) to estimate the sea ice strength in the rate-strengthening regime was used here (Eq. 6):
where A, B, and C are fitting coefficients given in Table 3.
Table 3The fitting coefficients of Eq. (6).
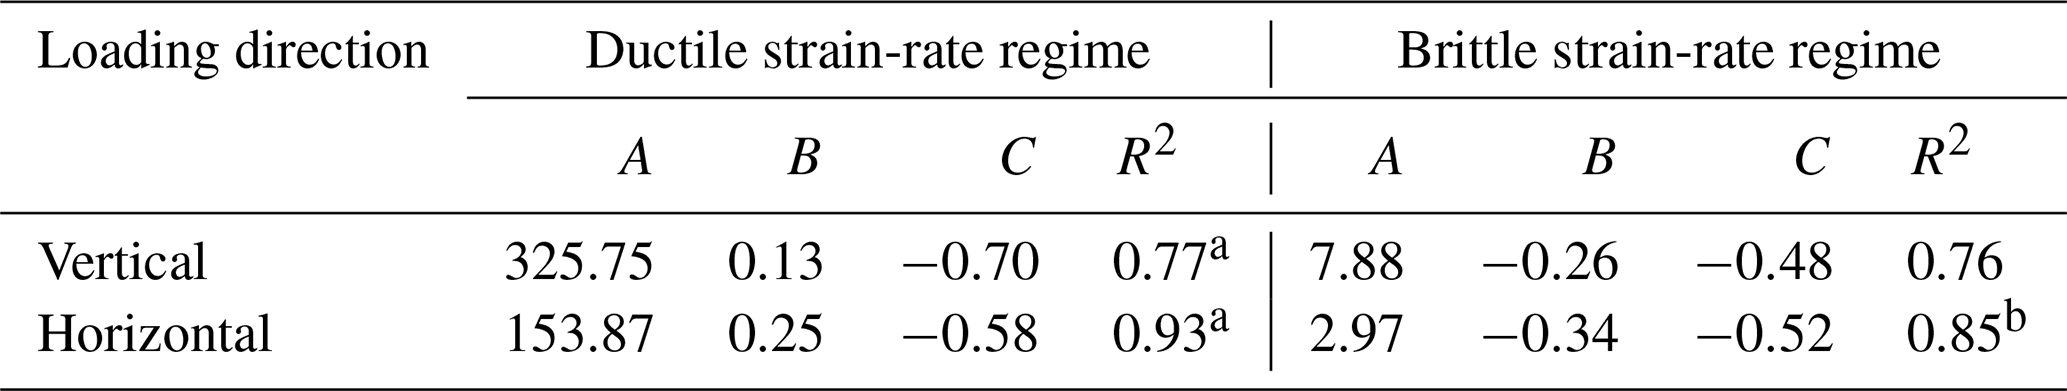
a and b represent significance levels of 0.01 and 0.1, respectively.
The original model proposed in Kovacs (1997) was extended here to cover both ductile and brittle regimes simply by changing the coefficients. All the regressions showed good R2 at p=0.1 or higher level, except that of vertically loaded strength at the brittle regime. Here, the form of Eq. (6) was applied because of the respective effects of strain rate and porosity on the uniaxial compressive strength. Statistically significant agreements between estimations and test data for horizontally loaded uniaxial compressive strength prove the applicability of this model. Probably due to the limited data points, the fit to vertically loaded strength at the brittle regime was not significant, which requires more measurements for validation in future study.
The three-dimensional surfaces of sea ice uniaxial compressive strength varying with strain rate and porosity are plotted in Fig. 11. It was found that sea ice transitioned from ductile to brittle behavior over a range of strain rates. For vertically loaded samples, the ductile-to-brittle range was approximately 8.0 × 10⁻⁴–1.5 × 10⁻³ s−1, and for horizontally loaded samples, it was narrower by 2.0 × 10⁻³–3.0 × 10⁻³ s−1. These transition strain rates agreed well with the typical ranges given by Schulson (2001).
Indeed, the transition is a result of competition between stress relaxation and stress build-up (Schulson, 2001). Under vertical loading, the stress concentration is relaxed by grain decohesion, and for horizontal loading, it is relaxed by grain boundary sliding (Gold, 1997; Kuehn and Schulson, 1994; Sinha, 1988). Because the instantaneous elastic response of the decohesion is more sensitive to the strain, ductile-to-brittle strain rate under horizontal loading is higher (Ji et al., 2020). Moreover, the transition strain rate increased with increasing porosity. Brine and gas inclusions in sea ice can act as pre-cracks promoting stress concentration. On the other hand, with sea ice being more porous, both grain decohesion and grain boundary sliding is much more easily triggered (Schulson, 2001). It seemed that the effect of porosity on the grain boundary sliding was relatively slight, so that the transition range was narrow for horizontal loading.
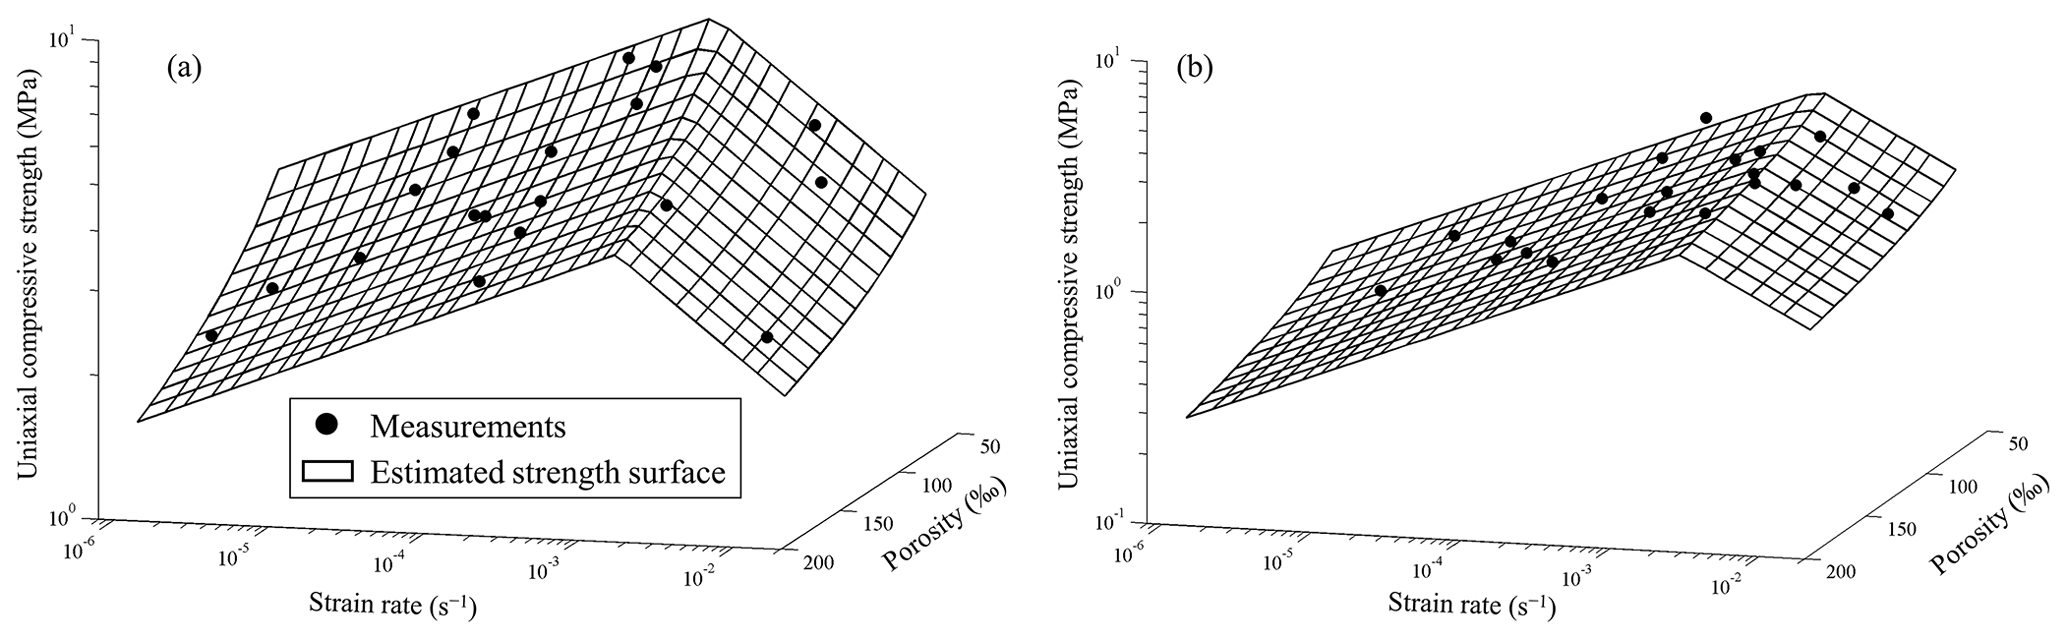
Figure 11Three-dimensional surfaces of uniaxial compressive strength of (a) vertically and (b) horizontally loaded samples varying with strain rate and porosity.
3.4.2 Mixed and snow ice
A total of four mixed-ice samples were compressed under vertical loading direction, of which two were tested at 2.0 × 10⁻⁴ s−1 and the others were tested at 2.0 × 10⁻³ s−1. But several phenomena were still found from the limited tests. The stress–strain curves and failure modes of ice samples compressed under different strain rates were different. At the low strain rate of 2.0 × 10⁻⁴ s−1, which is lower than the ductile-to-brittle strain rate of vertically loaded congelation ice, stress showed an approximate yield stage after reaching peak, during which the part of snow ice had a large deformation (Fig. 12a), whereas at the high strain rate of 2.0 × 10⁻³ s−1, which is greater than the transition strain rate of vertically loaded congelation ice, stress drops suddenly after peak and the whole ice sample failed through buckling of ice slender columns (Fig. 12b). The mean strength of mixed ice samples compressed at the low strain rate was only a bit higher than that at the high strain rate (1.7 ± 0.2 vs. 1.1 ± 0.1 MPa), whereas both were weaker than that of congelation ice at corresponding strain rate.
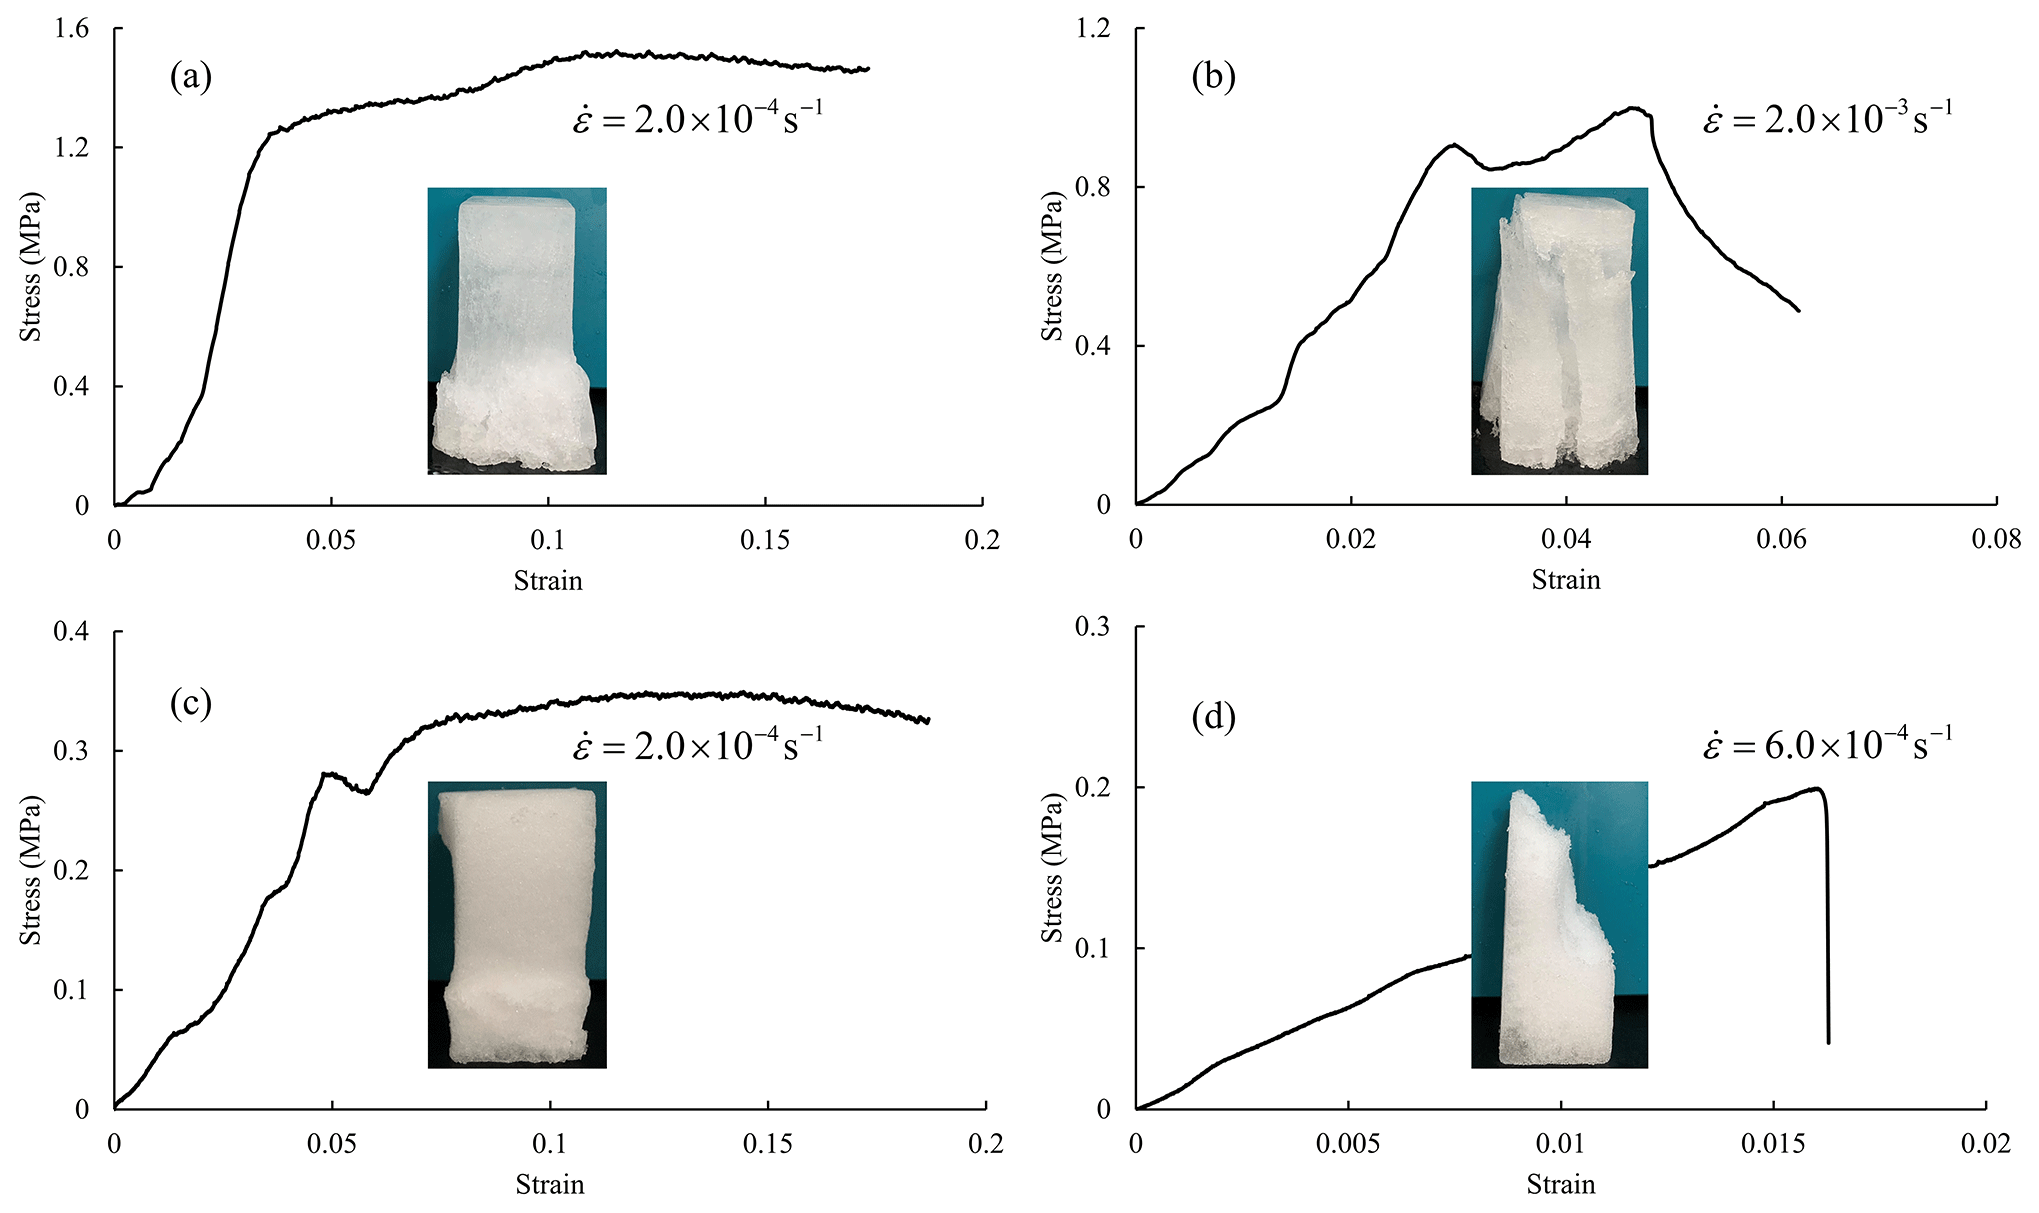
Figure 12Typical stress–strain curves and failure modes of mixed ice samples (a) and (b) as well as of snow ice samples (c) and (d) under vertical loading direction.
Similarly, snow ice samples compressed at different strain rates also showed distinct stress–strain curves. Taking the vertically loaded snow ice samples as examples, at low strain rates (e.g., 2.0 × 10⁻⁴ s−1), creep deformation occurred when the curve exhibited a yield stage (Fig. 12c). The samples seemed to be compacted judging from their appearance, but the bulk density only increased by 1.03. At high strain rates (e.g., 6.0 × 10⁻⁴ s−1), snow ice broke into parts and lost its strength suddenly (Fig. 12d). Both vertically and horizontally loaded snow ice samples had the same behaviors and similar strength values at low and high strain rates. The mean strength was 0.3 ± 0.1 MPa for both types of samples with creep deformation, which was higher than that for samples with sudden failure with values of 0.1 ± 0.1 MPa.
4.1 Comparisons with previous studies
4.1.1 Flexural strength
Sea ice flexural strength has often been related to brine volume fraction in previous studies (Karulina et al., 2019; Timco and O'Brien, 1994). To compare with previously reported empirical equations for sea ice flexural strength, the brine volume fractions of our congelation ice samples were determined and taken to the previously established equations listed in Table 2. Results shown in Fig. 13 indicate that the equation of Karulina et al. (2019) underestimated our flexural strength by approximately 40 % on average. The difference may be attributed to several factors. The first factor is that our tests were conducted in the laboratory, where samples were prepared with caution, while the tests in Karulina et al. (2019) were performed in field. Furthermore, the ice samples in Karulina et al. (2019) were much larger and contained more potential weaknesses than ours. Besides, the flexural strength in Karulina et al. (2019) was derived using cantilever beams, and stress concentrations at the root of the beam resulted in low strength. The equation provided by Timco and O'Brien (1994) was derived from various regions and test approaches, and thus its estimation agreed better with our data than the estimation using Karulina et al. (2019). Even so, it still overestimated our flexural strength by approximately 20 % because Timco and O'Brien's equation was also a conservative estimate.
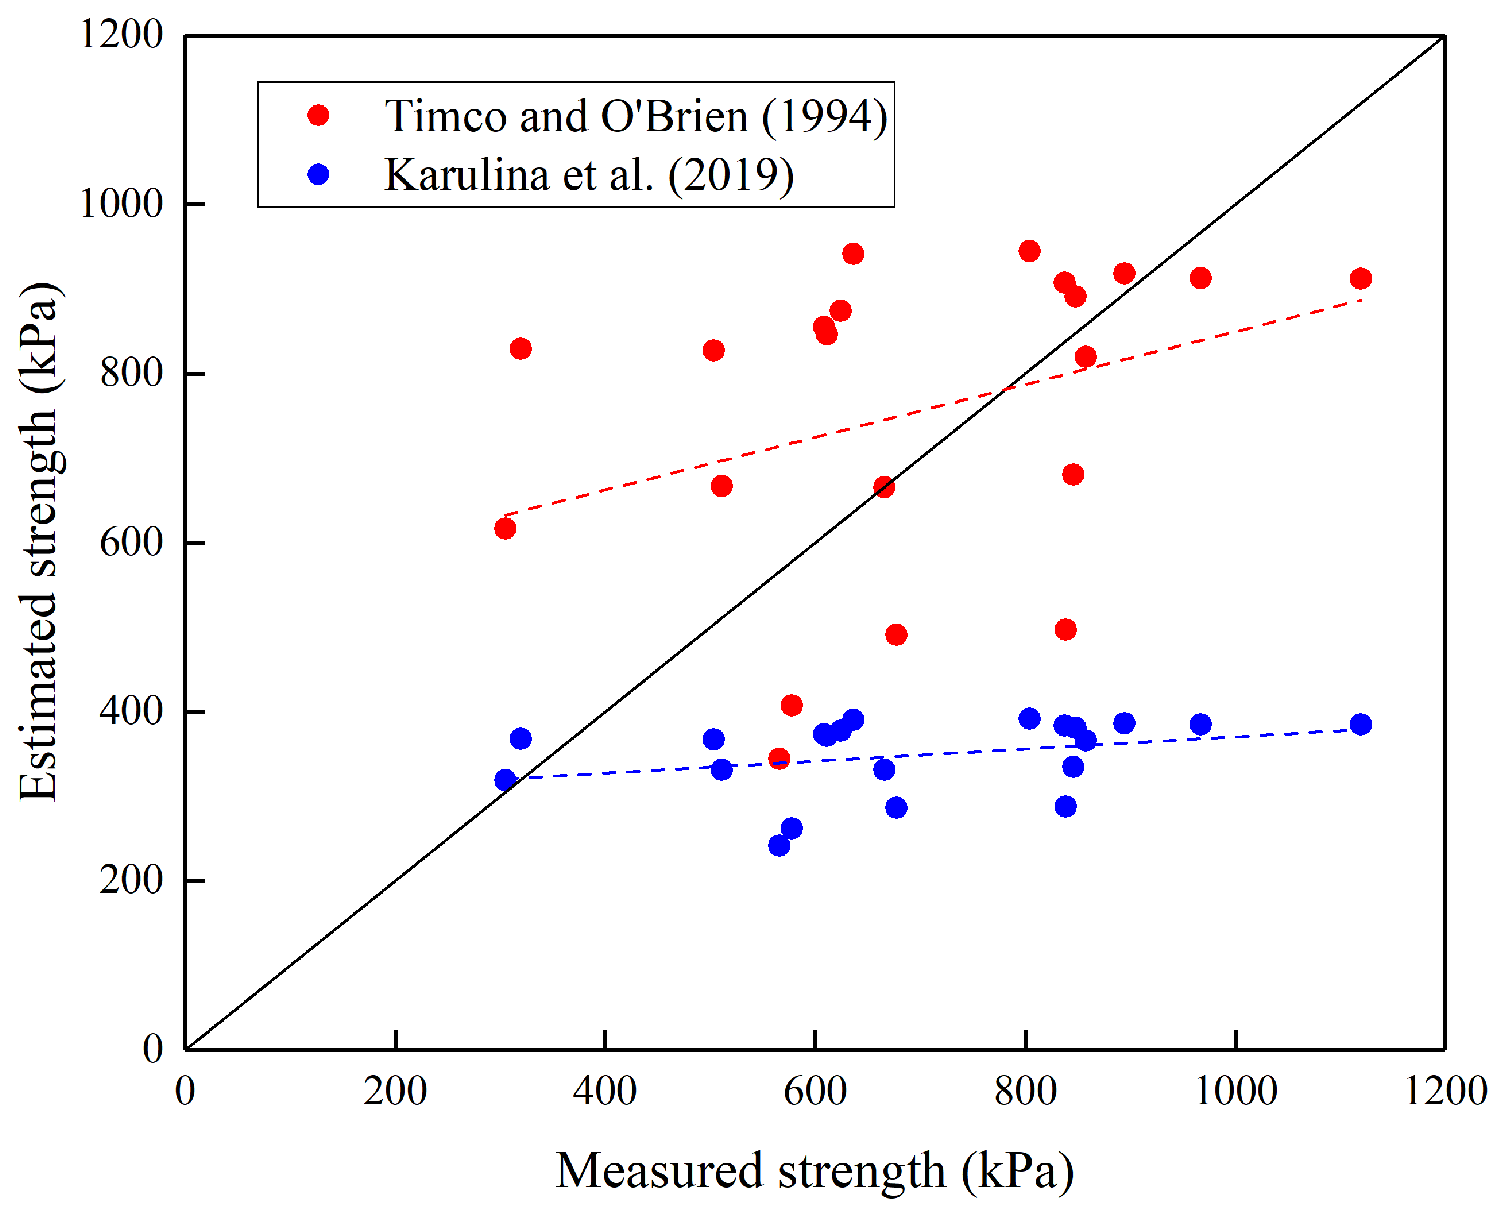
Figure 13Comparisons between estimated flexural strength, using previously established equations, and measured strength. The dashed lines are varying trends.
Furthermore, regression analysis was conducted not only using the mathematical expressions as given in Table 2, but also other commonly used functions (e.g., linear, logarithmic, and power functions) to validate the relationship between flexural strength and brine volume fraction of our congelation ice samples. However, all the fitting equations were accompanied with low R2 less than 0.1 and were not significant even at p=0.1. A probable reason is that the square root of the brine volume fraction of our congelation-ice samples ranged between 0.11 and 0.27, which is narrower than the ranges reported in Karulina et al. (2019) and Timco and O'Brien (1994), making the flexural strength of our samples not sensitive to brine volume fraction. Additional suspicion comes from the strain rate. The time-dependent viscous deformation is known to be a function of salinity (brine volume), and thus the differences of test strain rates between ours and in previous reports may influence the dependence of sea ice flexural strength on brine volume fraction. No strain rates were shown in the dataset compiled in Timco and O'Brien (1994), and the strain rate in Karulina et al. (2019) ranged from 10−4 to 10−3 s−1. Therefore, our tests were performed at a similar or even slower rate than those of Karulina et al. (2019), indicating that strain rate may not be the most reliable factor in judging whether effective elastic modulus is dependent on brine volume or porosity.
4.1.2 Effective elastic modulus and uniaxial compressive strength
The equations to estimate sea ice effective elastic modulus are rare, except where Karulina et al. (2019) proposed a mathematical relationship between sea ice effective elastic modulus and brine volume fraction, in which the effective elastic modulus decreased with the square root of the brine volume fraction in an exponential manner (Table 2). Taking our data into the equation, the comparison showed that the calculation using their formula gave 1.5 times overestimation than our measurements. As stated before, the size effect, sample preparation, and test techniques probably caused the differences.
Unlike effective elastic modulus, there are several empirical formulae to estimate sea ice uniaxial compressive strength. The frequently used parameterization was proposed by Timco and Frederking (1990), which has been validated by the Arctic sea ice strength data, although it is uncertain whether their model is appropriate for the Antarctic sea ice. Overestimates were obtained by taking our test data into the previously established model, and the ratio was 1.4 for vertically loaded samples and 1.8 for horizontally loaded samples. Furthermore, the applicable strain-rate range was below 10−3 s−1 in Timco and Frederking's model, corresponding to the ductile regime in their report, and no parameterization was given for the strength at the brittle regime. Another model of sea ice uniaxial compressive strength was proposed in Kovacs (1997), which also related the horizontally loaded sea ice strength to porosity at the ductile strain-rate regime below 10−3 s−1. Overestimates of 1.3 times were obtained using Kovacs's model. One point which should be mentioned is that Kovacs's model was proposed to estimate the strength of full-scale first-year ice, while our measurements were derived from small-scale samples.
4.2 The ratios between sea ice strength
From the viewpoint of field operations, it is easier to obtain the vertically loaded uniaxial compressive strength than the horizontally loaded compressive strength and flexural strength, because ice cores can be removed from ice cover directly using an ice driller. However, the latter two properties of sea ice are more useful than the former in engineering applications. Since both compressive strength and flexural strength are affected by porosity, taking the porosity of 10 ‰ as a bin, ratios were obtained by comparing the mean strength located in the same porosity interval. It was found that the ratio of vertically to horizontally loaded uniaxial compressive strength was independent of porosity, and the average was 3.1 ± 0.9. The ratio of vertically loaded uniaxial compressive strength to flexural strength decreased with increasing porosity, and it reached approximately 8.0 for sea ice with small porosity and approximately 4.0 for sea ice with large porosity approximately. The average ratio was 7.4 ± 1.9. Consequently, it is possible to estimate the horizontally loaded uniaxial compressive strength and flexural strength just by performing vertically loaded compressive strength tests if on-site conditions are not allowable for conducting tests. Similar comparisons have also been reported in Timco and Frederking (1990) that the uniaxial compressive strength of vertically loaded columnar ice is generally one to four times higher than horizontally loaded columnar ice, and the ratio increased with decreasing porosity. Moslet (2007) reported ratios between the vertically and horizontally loaded strength of columnar ice of 1.3 for cold ice (<−10 ∘C) and of 4–5 for warm ice. Strub-Klein and Høyland (2012) reported low vertically-to-horizontally loaded strength ratios of 1.4–1.8 for granular and columnar ice, probably because the ice cover where test samples were removed had already been broken and recrystallized before sampling.
4.3 Comparison between field measured and empirically estimated flexural strength
In Sect. 3.2.1, a mathematical equation (Eq. 5) was proposed to determine the flexural strength of landfast sea ice in the Prydz Bay based on sea ice porosity. During the field measurements, the mean ice temperature and salinity of the ice block extracted was −2.6 ± 0.6 ∘C and 5.2 ± 1.3 psu. Since no ice density measurements were conducted in the field, it was assumed as the typical value of first-year ice of 0.92 g cm−3 according to Timco and Weeks (2010). As a result, the bulk porosity of the ice block extracted was determined to be 107 ‰, and the sea ice flexural strength was estimated as 591 kPa with an interval of 471–714 kPa at p=0.01.
The field measured strength (719 ± 48 kPa) was a bit higher than the upper limit of the estimated confidence interval. An uncertainty existing in the comparison between flexural strength measured on site and empirically estimated is that the thermal cycling of an ice sample would influence its mechanical behavior (Høyland, 2007). The sea ice with warm in situ temperature was sampled and then cooled down for storage followed by heating again for final tests completed in laboratory, whereas the samples that were cooled down and heated again were stronger than the in situ ice even for comparable porosities. Currently, this phenomenon is not clear and requires further studies in the future.
Karulina et al. (2019) reported a range of sea ice flexural strength of 109–415 kPa by performing full-scale tests in the Arctic regions, which is lower than our field measured strengths. Our field measurements were performed using small-scale three-point supported beam tests, and as stated before, the differences in size effects and test techniques could result in different strength values.
4.4 Bearing capacity of landfast sea ice in the Prydz Bay
Due to the severe ice conditions and unknown offshore water depth, icebreakers usually have to stop in the landfast sea ice area in the Prydz Bay (Fig. 1), and the logistics cargos for research stations have to be transported by helicopters and trucks shortly after they are unloaded on ice. Therefore, it is of paramount importance to estimate the ice bearing capacity to ensure safety. A typical scenario of unloading cargos from an icebreaker on landfast sea ice in the Prydz Bay is shown in Fig. 14. The channel broken by the icebreaker acts as a wet crack penetrating the ice, i.e., the entire ice side surface is exposed to water (Masterson, 2009), and the cargos are loaded not far from the ship. The bending of the ice under the load causes flexural stress to be imposed on the ice cross section. If the maximum flexural stress does not exceed the ice strength, the load will be supported. Following the industry standard required by ISO19906 (2019), the extreme fiber stress in a cracked ice sheet due to a uniformly distributed load is predicted by Eqs. (7) and (8):
where E and σf are in kPa, υ is Poisson ratio ≈0.33, P is magnitude of load (in kN), H is ice thickness, k is foundation modulus = 9.81 kPa m−1, r is effective beam length, and c is the radius of loaded area.
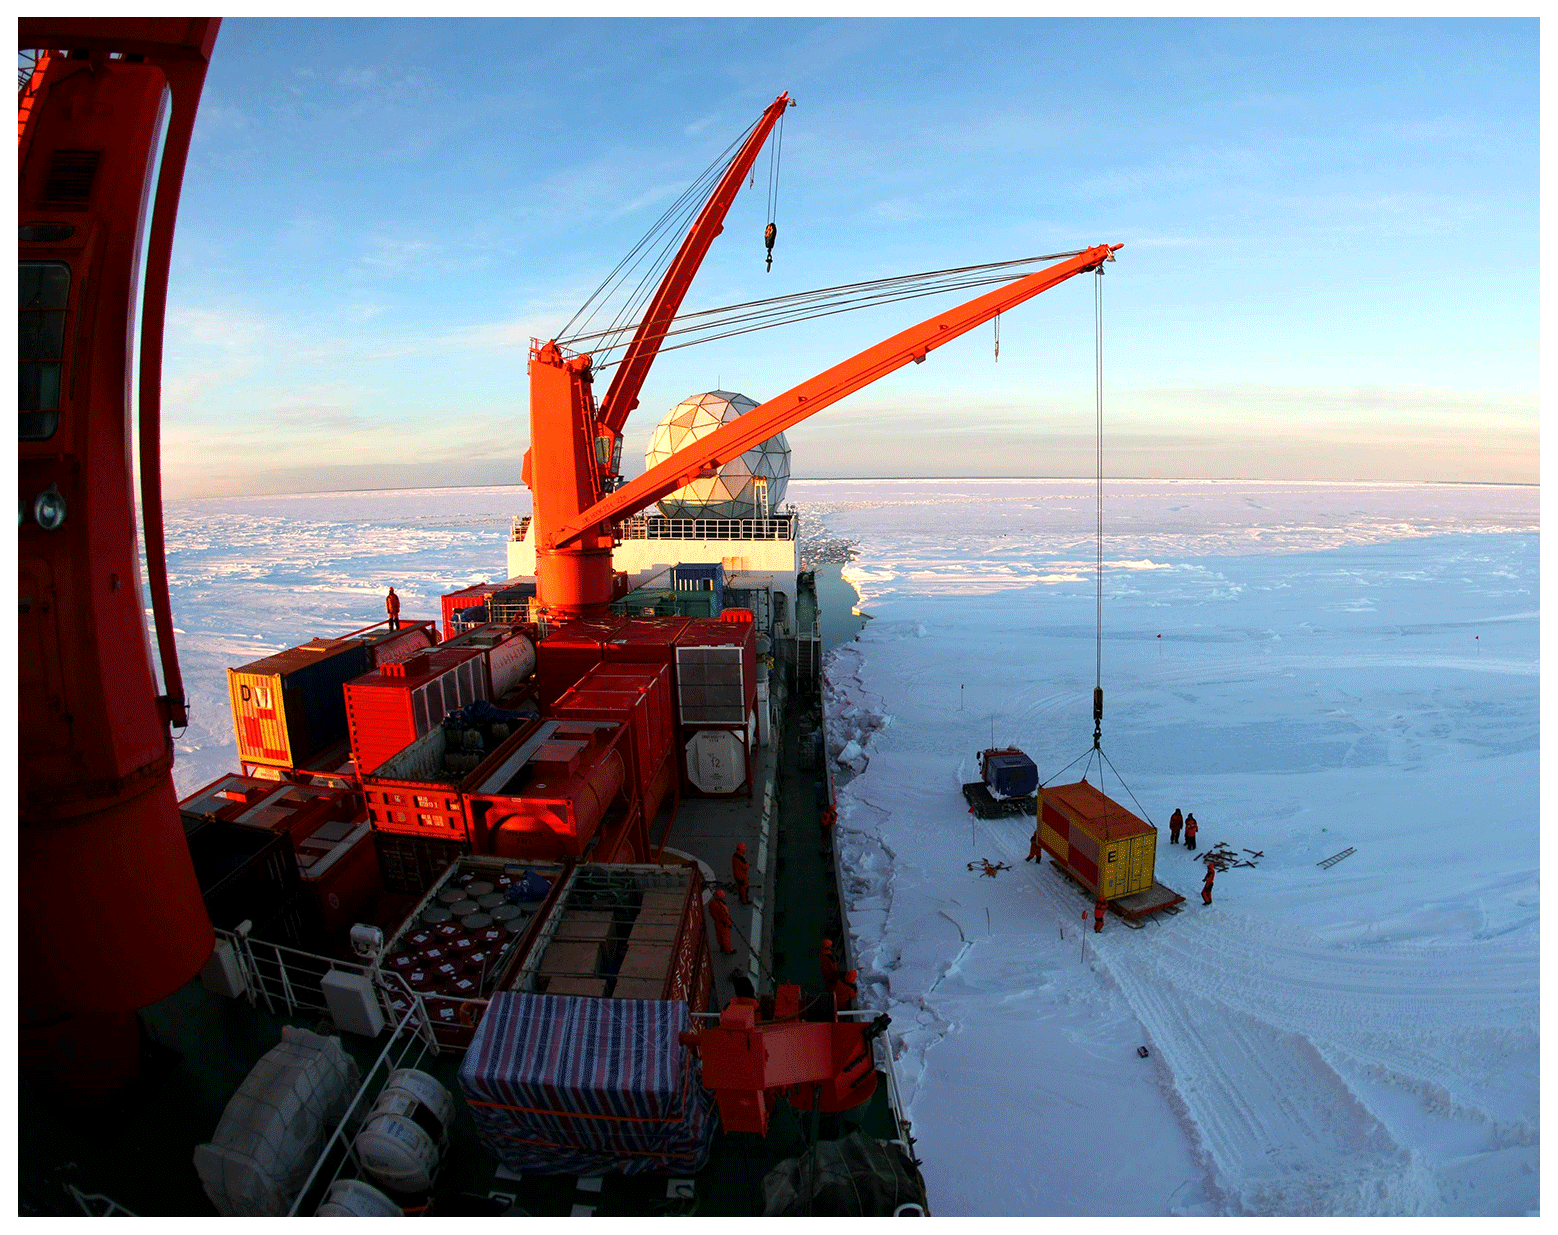
Figure 14Scenario of unloading cargos from an icebreaker on landfast sea ice in the Prydz Bay (Photo credit: Shiping Liu).

Figure 15Variations of load with respect to sea ice porosity for a landfast sea ice with congelation ice thickness of 1.3 m. c and r are radius of loaded area and effective beam length, respectively.
Noticeably, the flexural strength calculated using Eqs. (7) and (8) is based on the elastics beam theory assumption. Kerr and Palmer (1972) deduced the distributions of bending stresses considering varied elastic modulus along ice thickness in a floating ice plate. It is difficult to obtain the real distribution of elastic modulus along ice thickness, and Eqs. (7) and (8) have been proved reliable by experience (ISO19906, 2019), and hence, are adopted here. For the purpose of safe designing, a more conservative prediction is preferred in practice. According to Eq. (7), the bearing capacity increases with increasing flexural strength and decreasing effective elastic modulus. Therefore, minimum flexural strength and maximum effective elastic modulus are required. Section 3 talks about the variations of flexural strength and effective elastic modulus with porosity in terms of averages. So, all the measured data were plotted in Fig. 15a and b to determine the lower and upper envelopes of flexural strength and effective elastic modulus, respectively, providing the best-fit equations given by Eqs. (9) and (10):
where σf,min is the minimum flexural strength and Emax is the maximum effective elastic modulus.
The above estimation is close to the actual scenario to some degree. As the load is applied on the ice sheet, the sheet is compressed at the top and tensioned at the bottom. Ice is a material which is strong in compression and weak in tension. So, the ice sheet deflects until the first crack or yielding develops in the underside of the sheet beneath the center of the load (Masterson, 2009). The low flexural strength often occurs at the bottom of the ice sheet because of high ice temperature near the freezing point; therefore, it is reasonable to use the lower envelope of flexural strength.
As stated in Sect. 3.1, the flexural strength of snow ice is much weaker than that of congelation ice, making the snow cover negligible in terms of bearing capacity. Therefore, the ice thickness was taken as 1.3 m, which is the thickness of the congelation-ice layer of the ice block based on the crystal texture (Fig. 4). Additionally, Eqs. (7) and (8) worked reliably when the loaded radius was not large enough compared with the characteristic length (Lc) of sea ice (). With sea ice porosity increasing from 40 ‰ to 260 ‰, the characteristic length decreased from 16.0 to 11.6 m. Therefore, several different loaded radii were selected as 2–10 m within the characteristic-length range, and the magnitude of load was expressed as a function of sea ice porosity in Fig. 15c by substituting Eqs. (9) and (10) into Eqs. (7) and (8). The unit of load is transformed to tons in Fig. 15c necessitated by practitioners (e.g., ship captain) for better understanding. With loaded radius increasing from 2 to 10 m, the level of load increased approximately from 2 to 10 t. With loaded radii of 2, 4, 6, and 8 m, the bearing capacity of ice decreased by 32.4 %, 26.9 %, 19.6 %, and 7.9 %, respectively, with increasing porosity from 40 ‰ to 260 ‰. On the contrary, with a large loaded radius of 10 m, the bearing capacity of ice increased by 15.4 % with porosity increasing from 40 ‰ to 260 ‰.
It is emphasized that there are uncertainties in the estimated bearing capacity. First, in this paper, sea ice mechanical properties were obtained using small-scale samples, which overestimates the full-scale cantilever beam tests preferred by the industry standard. Additionally, the load calculated by Eqs. (7) and (8) is for the short term, under which the creep of ice is ignorable. Although the goods are transported away shortly after being unloaded on the ice, the duration is at least hours because of manual operation, possibly resulting in ice creep. In the industry standard, in addition to ensuring that the ice sheet extreme fiber stress be less than the allowable flexural stress for ice, it is necessary to avoid submergence caused by sea ice creep deformation (ISO19906, 2019). Therefore, the mass of goods should be less than the estimations given in Fig. 15c.
A series of laboratory mechanical experiments, including 25 bending and 55 uniaxial compressive strength tests, was carried out on landfast sea ice collected in the Prydz Bay, East Antarctica. The crystal measurements showed that a snow-ice layer exists in the top of the ice followed by transition and columnar ice formed by congelation of seawater. The flexural strength, effective elastic modulus, vertically and horizontally loaded uniaxial compressive strength of congelation ice, snow ice, and a mixture of the two were measured. The strength of mixed ice is weaker than that of congelation ice because of the existence of snow ice, and that of ice consisting of pure snow ice is the lowest. The effects of sea ice substructure on columnar ice strength were investigated. Both flexural strength and effective elastic modulus increased with increasing platelet spacing, while the influence of grain size was not significant.
The commonly used estimating equations of sea ice strength derived from Northern Hemisphere polar regions is not fit for landfast sea ice in the Prydz Bay, and alternative models are established for flexural and compressive strength (Eqs. 5 and 6). Sea ice uniaxial compressive strength was parameterized with strain rate and porosity using the form proposed in Kovacs (1997), but it was extended to cover both ductile and brittle strain-rate regimes. Sea ice flexural strength is related to porosity in this work, rather than brine volume which was often adopted in previous models. The newly proposed parameterization for flexural strength based on sea ice porosity compensates for the lack of applicability to warm ice using previous models based on brine volume. Furthermore, the dependence of sea ice strength on total porosity, rather than brine content, can reflect the potential effects of climate change. Sea ice in polar regions may become warmer under the effects of global warming (Clem et al., 2020; Screen and Simmonds, 2010), and the gas within sea ice may occupy more space than brine (Wang et al., 2020).
As scientific investigations have flourished in the Antarctic regions, the mechanical properties of Antarctic sea ice need to be urgently elucidated for safe activities on ice. With minimum flexural strength and maximum effective elastic modulus of congelation ice, a method has been established to estimate the bearing capacity of landfast sea ice cover in the Prydz Bay following the industry standard (ISO19906, 2019). In this way, it is possible to estimate the magnitude of load that can be safely put on ice, based on the sea ice physical properties.
Admittedly, the mechanical tests performed as described in this paper were derived from the extracted ice block only, so the sample amount is limited. Nevertheless, the dataset provided here is of great value as it contains most industry-concerned sea ice mechanical properties, which is helpful to improve the understanding of Antarctic sea ice and support of safe marine activities.
A total of 25 bending and 55 uniaxial compressive strength tests were performed on landfast sea ice samples. The detailed information of the ice samples is listed in Tables A1–A3, where C, S and M denote congelation ice, snow ice, and a mixture of the two, respectively, and the slashes represent no measurements.
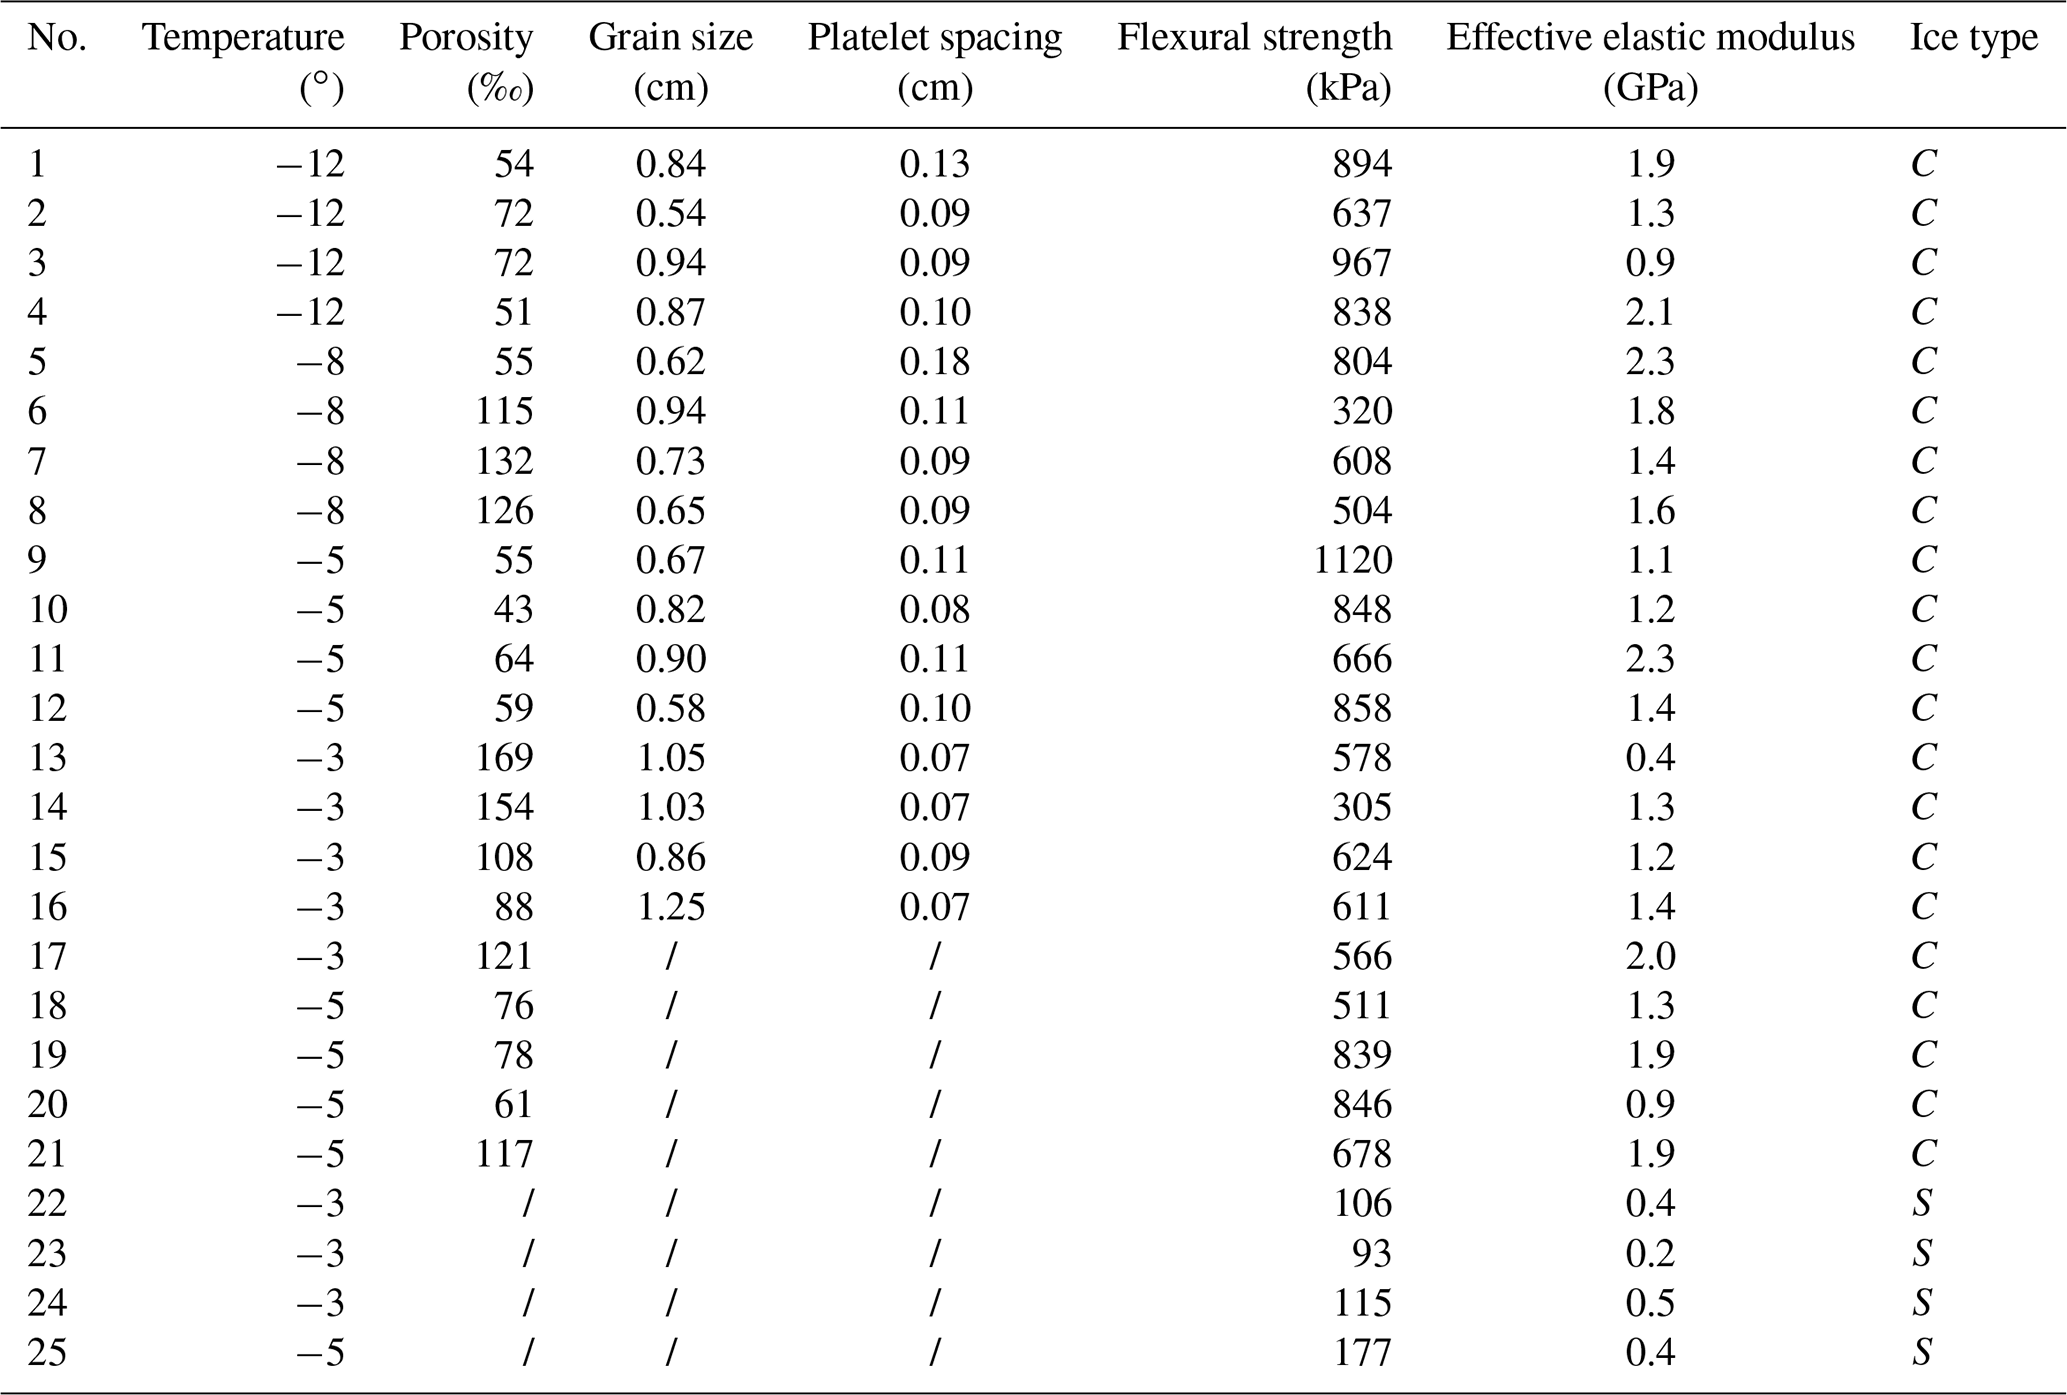
Table A2Detailed information of vertically loaded uniaxial compressive strength test samples at the temperature of −3 ∘C.
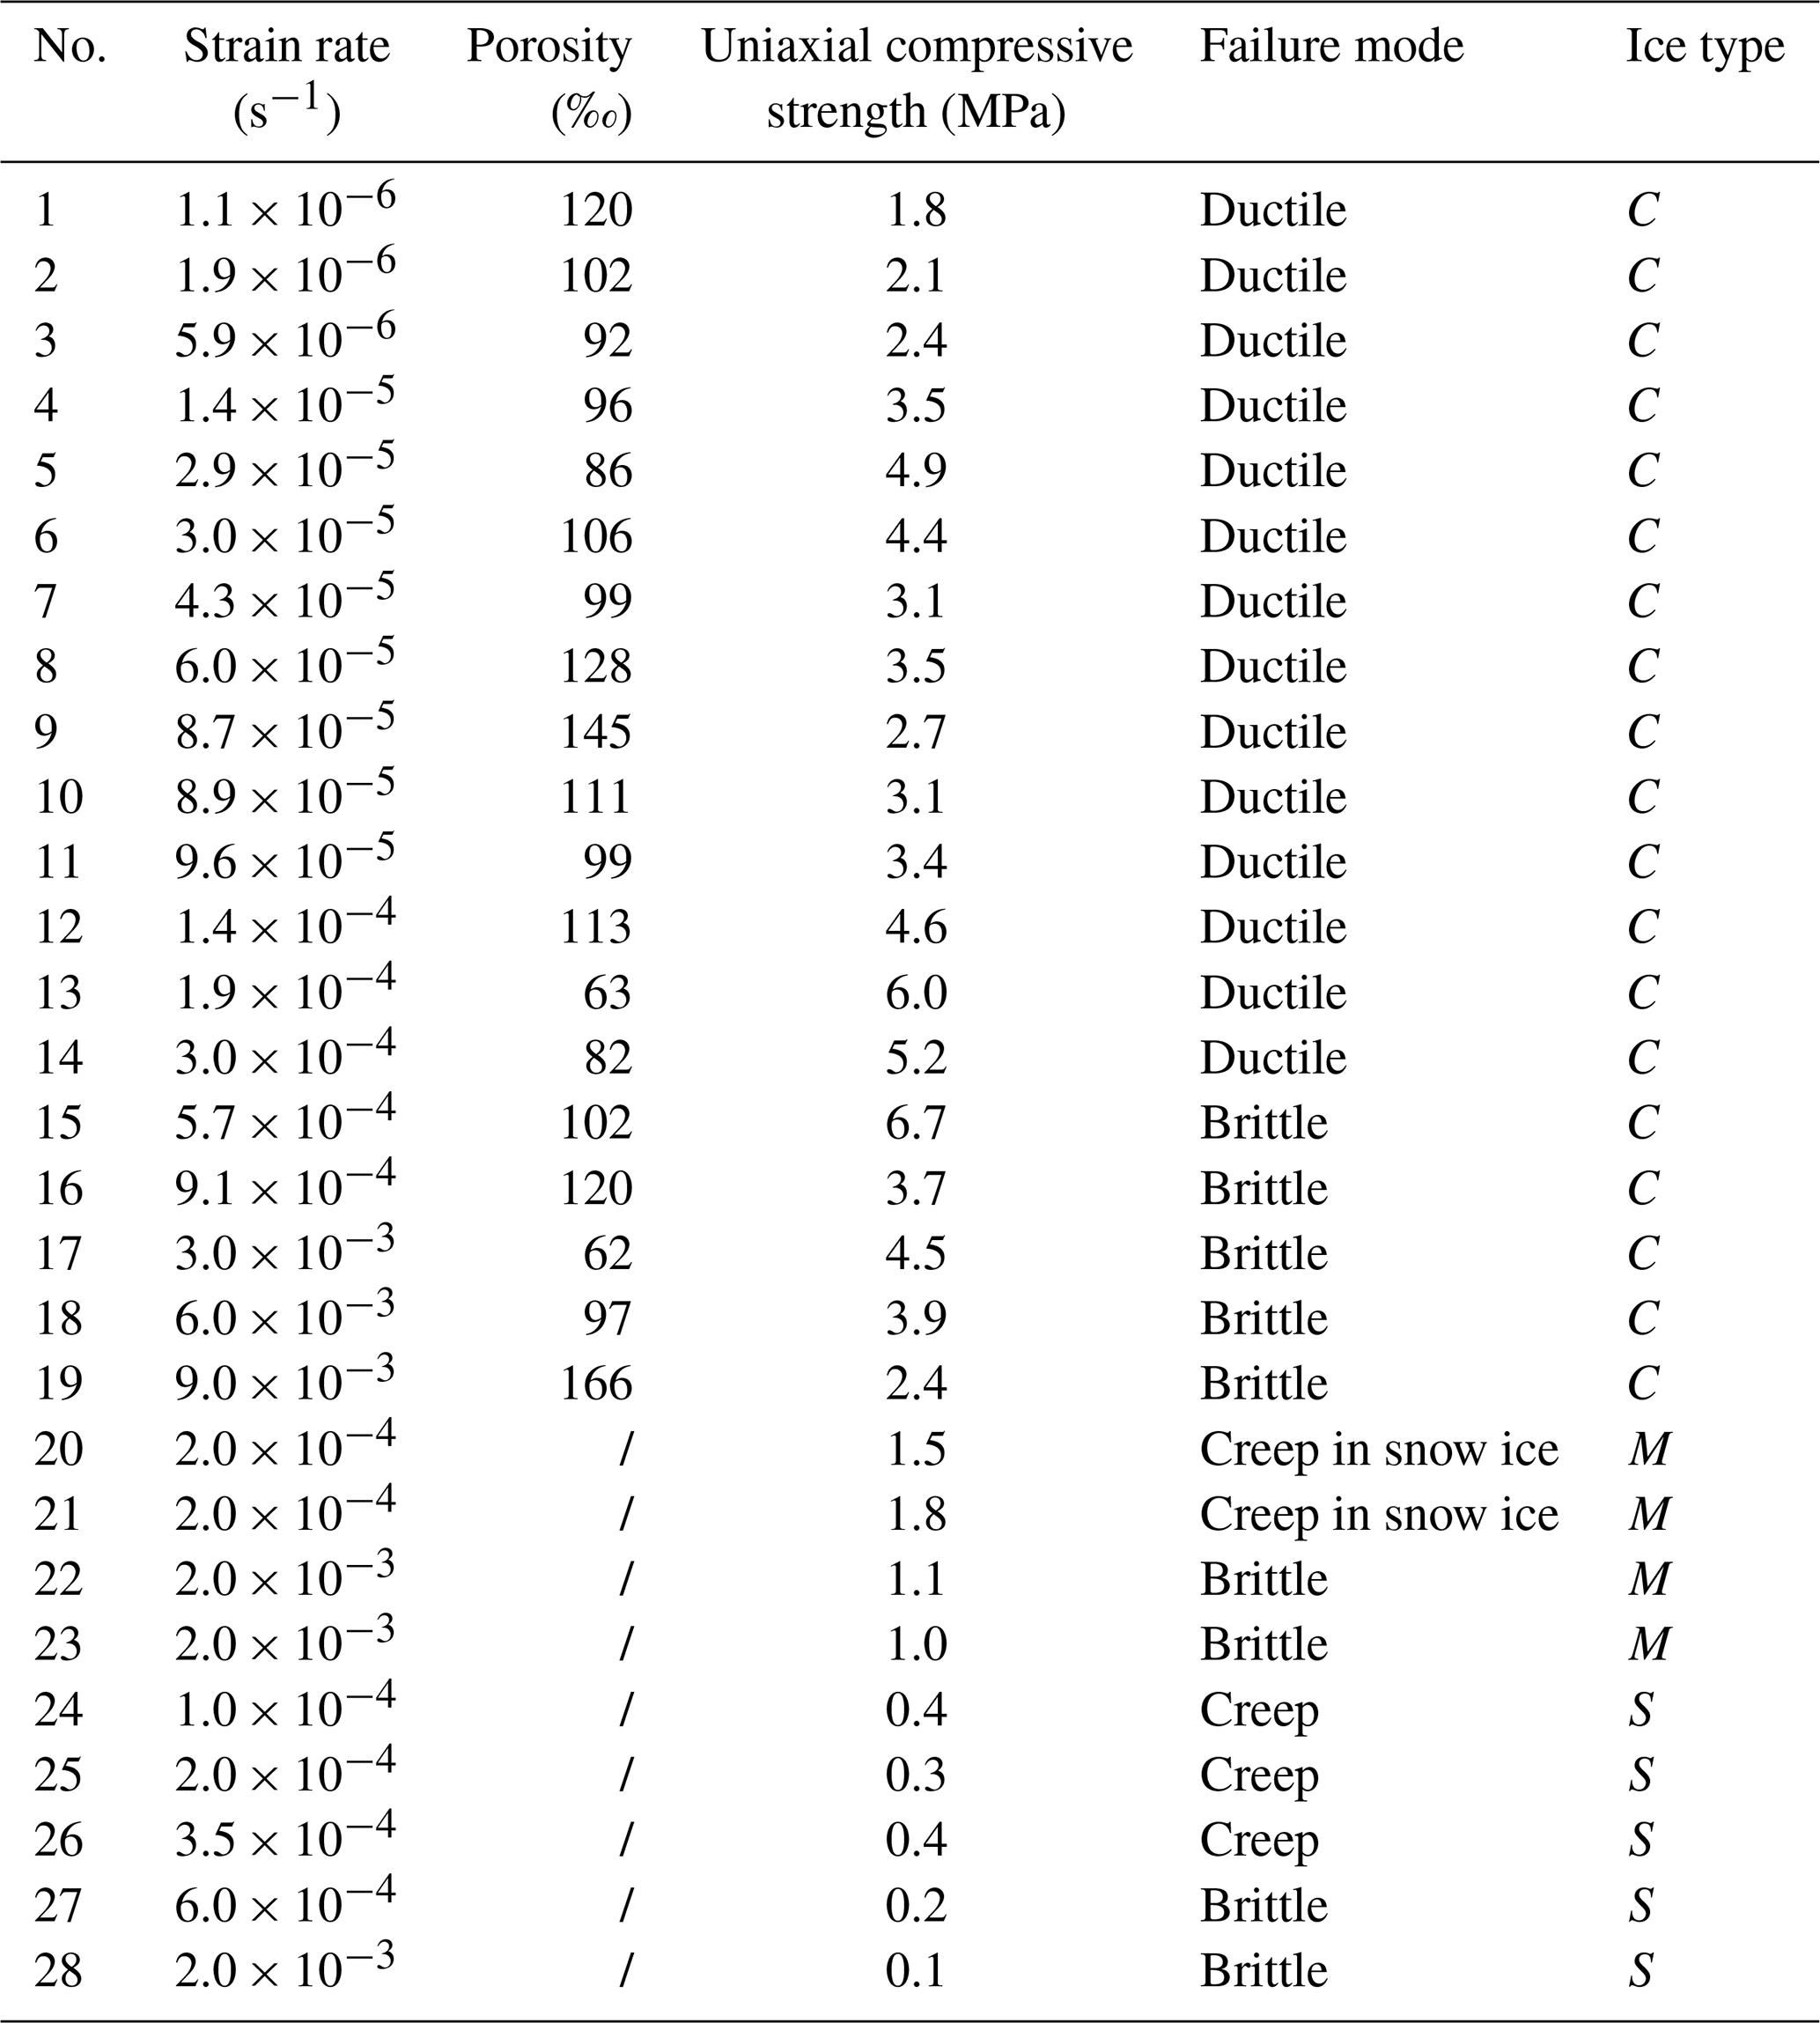
Table A3Detailed information of horizontally loaded uniaxial compressive strength test samples at the temperature of −3 ∘C.
All data are available at the website https://doi.org/10.5281/zenodo.5787915 (Wang et al., 2021).
QW, YX, and ZhiL designed the experiments, and QW and ZhaL carried them out. QW analyzed the test data and prepared the manuscript with contributions from all co-authors. PL reviewed and edited the manuscript.
The contact author has declared that neither they nor their co-authors have any competing interests.
Publisher’s note: Copernicus Publications remains neutral with regard to jurisdictional claims in published maps and institutional affiliations.
We thank the crews of PRIC for their assistance with the fieldwork during ice sampling, Shiping Liu from the Xinhua News Agency for providing the photo of unloading cargos on ice, and Minghu Ding from CAMS for providing the historical meteorological data at the Zhongshan station. We are also grateful to editor Bin Cheng and three anonymous reviewers for their valuable suggestions which contribute considerably to the publication of this paper.
This research has been supported by the National Natural Science Foundation of China (grant nos. 52192692, 41906198, and 41922045), the Fundamental Research Funds for the Central Universities (grant no. DUT21RC3086), and the Liao Ning Revitalization Talents Program (grant nos. XLYC2007033 and XLYC1908027).
This paper was edited by Bin Cheng and reviewed by three anonymous referees.
Arakawa, M. and Maeno, N.: Mechanical strength of polycrystalline ice under uniaxial compression, Cold Reg. Sci. Technol., 26, 215–226, https://doi.org/10.1016/S0165-232X(97)00018-9, 1997.
Arctic Council: Arctic Marine Shipping Assessment 2009 Report, second printing, Arctic Council, https://oaarchive.arctic-council.org/handle/11374/54 (last access: 18 May 2022), 2009.
Bonath, V., Edeskär, T., Lintzén, N., Fransson, L., and Cwirzen, A.: Properties of ice from first-year ridges in the Barents Sea and Fram Strait, Cold Reg. Sci. Technol., 168, 102890, https://doi.org/10.1016/j.coldregions.2019.102890, 2019.
Carnat, G., Papakyriakou, T., Geilfus, N. X., Brabant, F., Delille, B., Vancoppenolle, M., Gilson, G., Zhou, J., and Tison, J.: Investigations on physical and textural properties of Arctic first-year sea ice in the Amundsen Gulf, Canada, November 2007–June 2008 (IPY-CFL system study), J. Glaciol., 59, 819–837, https://doi.org/10.3189/2013JoG12J148, 2013.
Clem, K. R., Fogt, R. L., Turner, J., Lintner, B. R., Marshall, G. J., Miller, J. R., and Renwick, J. A.: Record warming at the South Pole during the past three decades, Nat. Clim. Change, 10, 762–770, https://doi.org/10.1038/s41558-020-0815-z, 2020.
Cox, G. F. N. and Weeks, W. F.: Equations for determining the gas and brine volumes in sea ice samples, J. Glaciol., 29, 306–316, https://doi.org/10.1017/S0022143000008364, 1983.
Frantz, C. M., Light, B., Farley, S. M., Carpenter, S., Lieblappen, R., Courville, Z., Orellana, M. V., and Junge, K.: Physical and optical characteristics of heavily melted “rotten” Arctic sea ice, The Cryosphere, 13, 775–793, https://doi.org/10.5194/tc-13-775-2019, 2019.
Gold, L.: Statistical characteristics for the type and length of deformation-induced cracks in columnar-grain ice, J. Glaciol., 43, 311–320, https://doi.org/10.3189/S0022143000003269, 1997.
Han, H., Jia, Q., Huang, W., and Li, Z.: Flexural strength and effective modulus of large columnar-grained freshwater ice, J. Cold Reg. Eng., 30, 04015005, https://doi.org/10.1061/(ASCE)CR.1943-5495.0000098, 2016.
Hobbs, W. R., Massom, R., Stammerjohn, S., Reid, P., Williams, G., and Meier, W.: A review of recent changes in Southern Ocean sea ice, their drivers and forcings, Glob. Planet. Change, 143, 228–250, https://doi.org/10.1016/j.gloplacha.2016.06.008, 2016.
Høyland, K. V.: Morphology and small-scale strength of ridges in the North-western Barents Sea, Cold Reg. Sci. Technol., 48, 169–187, https://doi.org/10.1016/j.coldregions.2007.01.006, 2007.
Hui, F., Zhao, T., Li, X., Shokr, M., Heil, P., Zhao J., Zhang L., and Cheng X.: Satellite-based sea ice navigation for Prydz Bay, East Antarctica, Remote Sens., 9, 518, https://doi.org/10.3390/rs9060518, 2017.
ISO19906: Petroleum and Natural Gas Industries – Arctic Offshore Structures, ISO, Geneva, Switzerland, https://www.iso.org/standard/65477.html (last access: 18 May 2022), 2019.
Jeffries, M. O., Krouse, H. R., Hurst-Cushing, B., and Maksym, T.: Snow-ice accretion and snow-cover depletion on Antarctic first-year sea-ice floes, Ann. Glaciol., 33, 51–60, https://doi.org/10.3189/172756401781818266, 2001.
Ji, S., Wang, A., Su, J., and Yue, Q.: Experimental studies on elastic modulus and flexural strength of sea ice in the Bohai Sea, J. Cold Reg. Eng., 25, 182–195, https://doi.org/10.1061/(ASCE)CR.1943-5495.0000035, 2011.
Ji, S., Chen, X., and Wang, A.: Influence of the loading direction on the uniaxial compressive strength of sea ice based on field measurements, Ann. Glaciol., 61, 86–96, https://doi.org/10.1017/aog.2020.14, 2020.
Karulina, M., Marchenko, A., Karulin, E., Sodhi, D., Sakharov, A., and Chistyakov, P.: Full-scale flexural strength of sea ice and freshwater ice in Spitsbergen Fjords and North-West Barents Sea, Appl. Ocean Res., 90, 101853, https://doi.org/10.1016/j.apor.2019.101853, 2019.
Kermani, M., Farzaneh, M., and Gagnon, R.: Bending strength and effective modulus of atmospheric ice, Cold Reg. Sci. Technol., 53, 162–169, https://doi.org/10.1016/j.coldregions.2007.08.006, 2008.
Kerr, A. D. and Palmer, W. T.: The deformations and stresses in floating ice plates, Acta Mech., 15, 57–72, https://doi.org/10.1007/BF01177286, 1972.
Kovacs, A.: Estimating the full-scale flexural and compressive strength of first-year sea ice, J. Geophys. Res.-Oceans, 102, 8681–8689, https://doi.org/10.1029/96JC02738, 1997.
Kuehn, G. and Schulson, E.: The mechanical properties of saline ice under uniaxial compression, Ann. Glaciol., 19, 39–48, https://doi.org/10.3189/1994AoG19-1-39-48, 1994.
Masterson, D. M.: State of the art of ice bearing capacity and ice construction, Cold Reg. Sci. Technol., 58, 99–112, https://doi.org/10.1016/j.coldregions.2009.04.002, 2009.
Matear, R. J., O'Kane, T. J., Risbey, J. S., and Chamberlain, M.: Sources of heterogeneous variability and trends in Antarctic sea-ice, Nat. Commun., 6, 8656, https://doi.org/10.1038/ncomms9656, 2015.
Mayewski, P. A., Frezzotti, M., Bertler, N., Vanommen, T., Hamilton, G., Jacka, T. H., Welch, B., Frey, M., Qin, D., Ren, J., Simões, J., Fily, M., Oerter, H., Nishio, F., Isaksson, E., Mulvaney, R., Holmund, P., Lipenkov, V., and Goodwin, I.: The international trans-Antarctic scientific expedition (ITASE): an overview, Ann. Glaciol., 41, 180–185, https://doi.org/10.3189/172756405781813159, 2005.
Moslet, P. O.: Field testing of uniaxial compression strength of columnar sea ice, Cold Reg. Sci. Technol., 48, 1–14, https://doi.org/10.1016/j.coldregions.2006.08.025, 2007.
Sanderson, T. J. O.: Ice Mechanics: Risks to Offshore Structures, first edn., edited by: Ling, H., Graham and Trotman, London, ISBN 0-86010-785-X, 1988.
Schulson, E. M.: Brittle failure of ice, Eng. Fract. Mech., 68, 1839–1887, https://doi.org/10.1016/S0013-7944(01)00037-6, 2001.
Screen, J. A. and Simmonds, I.: The central role of diminishing sea ice in recent Arctic temperature amplification, Nature, 464, 1334–1337, https://doi.org/10.1038/nature09051, 2010.
Sinha, N. K.: Crack-enhanced creep in polycrystalline material: strain-rate sensitive strength and deformation of ice, J. Mater. Sci., 23, 4415–4428, https://doi.org/10.1007/BF00551940, 1988.
Sinha, N. K. and Frederking, R. M. W.: Effect of test system stiffness on strength of ice, in: Proceedings of the 5th International Conference on Port and Ocean Engineering under Arctic Conditions, Norway, 13–18 August 1979, 708–717, 1979.
Sinsabvarodom, C., Chai, W., Leira, B. J., Høyland, K. V., and Naess, A.: Uncertainty assessments of structural loading due to first year ice based on the ISO standard by using Monte-Carlo simulation, Ocean Eng., 198, 106935, https://doi.org/10.1016/j.oceaneng.2020.106935, 2020.
Schwarz, J., Frederking, R., Gavrillo, V., Petrov, I. G., Hirayama, K. I., Mellor, M., Tryde, P., and Vaudery, K. D.: Standardized testing methods for measuring mechanical properties of ice, Cold Reg. Sci. Technol., 4, 245–253, https://doi.org/10.1016/0165-232X(81)90007-0, 1981.
Strub-Klein, L. and Høyland, K. V.: Spatial and temporal distributions of level ice properties: Experiments and thermo-mechanical analysis, Cold Reg. Sci. Technol., 71, 11–22, https://doi.org/10.1016/j.coldregions.2011.10.001, 2012.
Su, B., Riska, K., and Moan, T.: A numerical method for the prediction of ship performance in level ice, Cold Reg. Sci. Technol., 60, 177–188, https://doi.org/10.1016/j.coldregions.2009.11.006, 2010.
Timco, G. W. and Frederking, R. M. W.: A procedure to account for machine stiffness in uniaxial compression tests, in: Proceedings of the 7th IAHR International Symposium on Ice, Germany, 27–31 August 1984, 39–47, 1984.
Timco, G. W. and Frederking, R. M. W.: Compressive strength of sea ice sheets, Cold Reg. Sci. Technol., 17, 227–240, https://doi.org/10.1016/S0165-232X(05)80003-5, 1990.
Timco, G. W. and Frederking, R. M. W.: A review of sea ice density, Cold Reg. Sci. Technol., 24, 1–6, https://doi.org/10.1016/0165-232X(95)00007-X, 1996.
Timco, G. W. and O'Brien, S.: Flexural strength equation for sea ice, Cold Reg. Sci. Technol., 22, 285–298, https://doi.org/10.1016/0165-232X(94)90006-X, 1994.
Timco, G. W. and Weeks, W. F.: A review of the engineering properties of sea ice, Cold Reg. Sci. Technol., 60, 107–129, https://doi.org/10.1016/j.coldregions.2009.10.003, 2010.
Wang, Q., Lu, P., Leppäranta, M., Cheng, B., Zhang, G., and Li, Z.: Physical properties of summer sea ice in the Pacific sector of the Arctic during 2008–2018, J. Geophys. Res.-Oceans, 125, e2020JC016371, https://doi.org/10.1029/2020JC016371, 2020.
Wang, Q., Li, Z., Lu, P., and Li, Z.: Flexural and compressive strength of the landfast sea ice in the Prydz Bay, East Antarctic, Zenodo [data set], https://doi.org/10.5281/zenodo.5787915, 2021.
Zhao, J., Cheng, B., Vihma, T., Heil, P., Hui, F., Shu, Q., Zhang, L., and Yang, Q.: Fast Ice Prediction System (FIPS) for land-fast sea ice at Prydz Bay, East Antarctica: an operational service for CHINARE, Ann. Glaciol., 61, 271–283, https://doi.org/10.1017/aog.2020.46, 2020.