the Creative Commons Attribution 4.0 License.
the Creative Commons Attribution 4.0 License.
 | 19 May 2022
High nitrate variability on an Alaskan permafrost hillslope dominated by alder shrubs
Rachael E. McCaully
Brent D. Newman
Verity G. Salmon
Jeffrey M. Heikoop
Cathy J. Wilson
Sanna Sevanto
Nathan A. Wales
George B. Perkins
Oana C. Marina
Stan D. Wullschleger
In Arctic ecosystems, increasing temperatures are driving the expansion of nitrogen (N) fixing shrubs across tundra landscapes. The implications of this expansion to the biogeochemistry of Arctic ecosystems are of critical importance and more work is needed to better understand the form, availability, and transportation potential of N from these shrubs across a variety of Arctic landscapes. To gain insights into the processes controlling N within a permafrost hillslope system, the spatiotemporal variability of nitrate (NO) and its environmental controls were investigated at an alder (Alnus viridis spp. fruticosa) dominated permafrost tundra landscape in the Seward Peninsula, Alaska, USA. Soil pore water was collected from locations within alder shrubland growing along a well-drained hillslope and was compared to soil pore water collected from locations outside (upslope, downslope, and between) the alder shrubland. Soil pore water collected within alder shrubland had an average NO3-N (nitrogen from nitrate) concentration of 4.27±8.02 mg L−1 and differed significantly from locations outside alder shrubland (0.23±0.83 mg L−1; p<0.05). Temporal variation in NO3-N within and downslope of alder shrubland co-occurred with precipitation events where NO that accumulated in the soil was likely flushed downslope during rainfall. These findings have important implications for nutrient availability and mobility in N-limited permafrost systems that are experiencing shrub expansion in response to a warming Arctic.
- Article
(4325 KB) - Full-text XML
-
Supplement
(790 KB) - BibTeX
- EndNote


This manuscript has been authored by UT-Battelle, LLC under Contract No. DE-AC05-00OR22725 with the U.S. Department of Energy. The United States Government retains and the publisher, by accepting the article for publication, acknowledges that the United States Government retains a non-exclusive, paid-up, irrevocable, world-wide license to publish or reproduce the published form of this manuscript, or allow others to do so, for United States Government purposes. The Department of Energy will provide public access to these results of federally sponsored research in accordance with the DOE Public Access Plan (http://energy.gov/downloads/doe-public-access-plan).
1.1 Background
Ecosystems in the Arctic are directly and continually impacted by increasing global temperatures (Martin et al., 2008; Chapin et al., 2000; McClelland et al., 2007; Hovelsrud et al., 2011; Schuur et al., 2015), including permafrost degradation with subsequent feedbacks that impact soil moisture, vegetation, and nutrient availability (Shaver and Chapin, 1980; Weintraub and Schimel, 2005; Hinzman et al., 2013; Street et al., 2015; Salmon et al., 2016; Walvoord and Kurylyk, 2016). While there is a clear relationship between climate-induced shifts in vegetation and nutrient abundance, many details remain unknown or unpublished about the variability of nutrient availability across and nutrient mobility within permafrost systems (Sharkhuu and Sharkhuu, 2012; Barnes et al., 2014; Keuper et al., 2017; Rasmussen et al., 2020, 2022).
In landscapes with a topographic gradient, NO contributions in upland areas to surface waters can impact downslope hydrochemistry and alter downstream ecosystems (Vitousek et al., 1997; Koch et al., 2013; Hiltbrunner et al., 2014). Within permafrost landscapes, the mobility potential of nutrients is largely dependent on both the topographic gradient and the active layer depth, which also influence soil redox conditions (O'Donnell and Jones, 2006) and vegetation (Ogawa et al., 2006). Previous studies have determined that more research is needed to constrain N2-fixing vegetation and topographic controls on NO mobility in the Arctic (Whigham et al., 2017; Harms et al., 2019; Harms and Ludwig, 2016). Near-surface hydrologic and drainage conditions in permafrost Arctic landscapes are influenced by the seasonal thaw of shallow active-layer soils (Romanovsky and Osterkamp, 2000; Yano et al., 2010; Boike et al., 2018). Deeper active layers can result in the growth and expansion of larger plant types (including shrubs) that require drier soils and a deeper thaw to accommodate their root systems (Myers-Smith et al., 2011). The phenomenon of shrubs increasing in density and abundance in permafrost landscapes is known as “shrub expansion” or “shrubification” (Tape et al., 2006; Weintraub and Schimel, 2003; Frost and Epstein, 2014; Ju and Masek, 2016; Myers-Smith et al., 2015; Sturm et al., 2001).
Certain shrub genera are more closely associated with climate-induced shrubification than others. Alnus viridis spp. fruticosa (Siberian alder), for example, is a shrub species (Myers-Smith et al., 2011) that fixes atmospheric nitrogen (N2) through the symbiotic relationship with Frankia bacteria residing within nodules in the alder root systems (Roy et al., 2007). Alders frequently establish on steep hillslopes (Myers-Smith et al., 2011; Tape et al., 2012) and have been associated with elevated concentrations of NO3-N in soil pore water in cold environments at high elevations like the Alps (Bühlmann et al., 2014; Hiltbrunner et al., 2014).
The effects of alder on soil chemistry and stream water chemistry have been investigated in alpine, subalpine, and upland systems (Hurd and Raynal, 2004; Bühlmann et al., 2014; Mitchell and Ruess, 2009; Shaftel et al., 2012; Whigham et al., 2017); however, very few of these studies have been conducted in Arctic permafrost landscapes. Rhoades et al. (2001) found that alders in permafrost soils of northwest Alaska influenced soil NO3-N and measured high foliar N in various plant types growing within the alder understory, suggesting increased soil N below the shrubs. While the linkage between alders and soil N is clear, the variability of soil pore water NO3-N in relation to alders, topography, redox conditions, and permafrost in the Arctic has not previously been studied in detail.
1.2 Study objectives
To study the influence of alder on soil chemistry in Arctic permafrost landscapes, we investigated the relationships that exist between N2-fixing alders, topography, and soil moisture to determine the dominant controls on NO availability that occur in permafrost soils situated in a hillslope landscape. We focused our research on a location where a recent study estimated that alder area coverage in the hillslope shrubland community increased by 40 % from 7.4 ha in 1956 to 10.4 ha in 2014, with an average rate of alder expansion of 513 m2 yr−1 (Salmon et al., 2019a). Within this field setting, we hypothesize that: (1) NO availability varies both spatially and temporally on short scales across permafrost landscapes; (2) proximity to alder shrublands is a dominant control on NO availability in soil pore water and will be highest within and immediately downslope of alder stands; and (3) NO mobility is limited by changes in redox conditions across the hillslope topographic gradient.
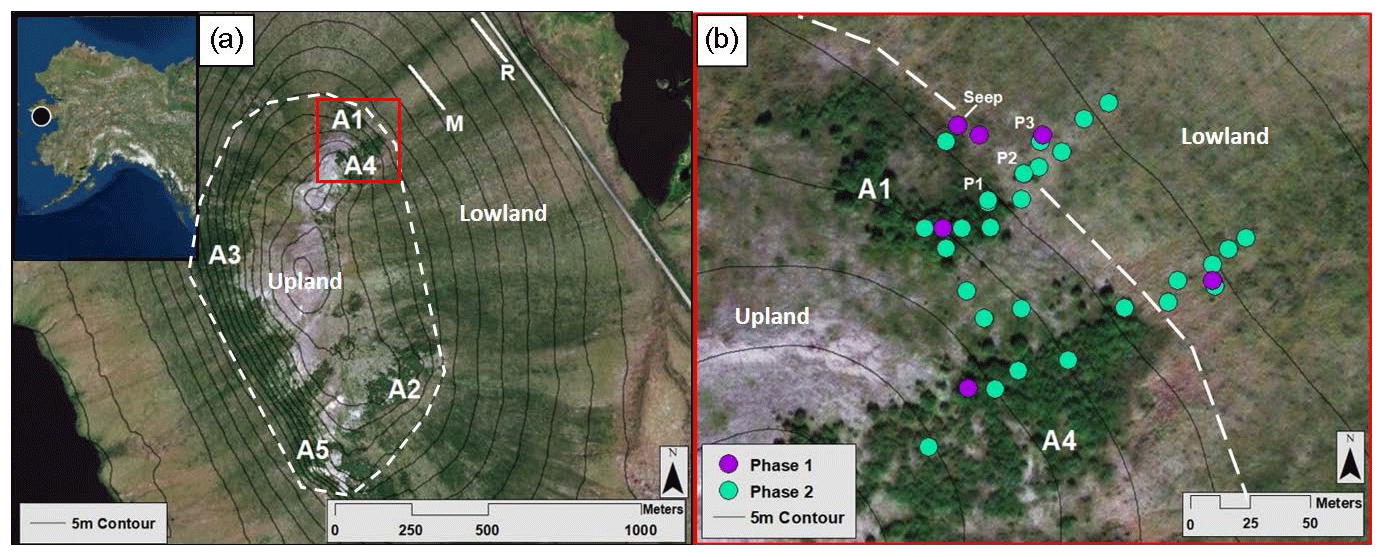
Figure 1The Kougarok field site and sampling locations. Upper left inset map indicates the location of the Kougarok field site (denoted by a black circle) approximately 80 km inland from the town of Nome on the Seward Peninsula, AK. (a) Alder patch and transect locations at the Kougarok hillslope. Solid white lines represent middle (M) and road (R) sampling transects. Dashed white line represents the boundary between the upland area and the lowland area. (b) Higher-resolution map (corresponding to the red box in Fig. 1a) of the spatial sampling locations within the A1 and A4 transects. Phase 1 (July 2017) locations are denoted by purple dots. Green dots indicate additional locations sampled during Phase 2 (September 2017, July 2018, and September 2018). P1, P2, and P3 indicate pit locations dug in July 2018. Dashed white line represents the boundary between the upland area and the lowland area. Aerial imagery in this figure are sourced from Esri, DigitalGlobe, GeoEye, Earthstar Geographics, CNES/Airbus DS, USDA, USGS, AeroGRID, IGN, and the GIS User Community.
2.1 Study location
Approximately 80 km north of the Alaskan coastal town of Nome and 12 km east of Mary's Igloo, the research hillslope of interest is located at mile marker 64 of Kougarok Road (65∘09′50.1′′ N, 164∘49′34.2′′ W) and is referred to as the Kougarok hillslope (KG hillslope; Fig. 1). The KG hillslope is a prominent hillslope (elevation from 40–140 m a.s.l.) with the Kuzitrin River to the north and west (∼11∘ topographic slope) and a series of shallow thermokarst lakes to the east (∼5∘ topographic slope). The site is composed of metagranitic late Proterozoic bedrock outcropping at the top of the hill (Hopkins et al., 1955), and gives way to continuous permafrost on the lower slope, which is likely Quaternary-aged sediments composed of peat, alluvial sediment, and interlaced gravel lenses (Hopkins et al., 1955; Till et al., 2011). The hillslope is asymmetrical and slopes more steeply to the west than to the east (∼11∘ and ∼5∘ topographic slope, respectively). The KG hillslope is overlain by an active soil layer containing organic peat and mineral horizons (taxonomic soil classification not available) and is well drained in the upland area due to the topographic gradient.
Vegetation found in the upland area primarily includes alder growing in a densely populated alder shrubland community near the crest of the hill, interspersed by lichen, moss, and dwarf shrubs. Vegetation in the lowland area is characterized by either alder savanna or tussock tundra plant communities (Iversen et al., 2016; Salmon et al., 2019b; Sulman et al., 2021). The term “alder savanna” was defined by Frost et al. (2013), who stated, “Such shrubland communities, colloquially referred to as `alder savannas', have been described at several locations in Low Arctic and interior montane Alaska (Racine, 1976; Racine and Anderson, 1979; Chapin et al., 1989). Regular spacing of alders in `alder savannas' has been attributed to intra-specific competition for limiting nutrients (Chapin et al., 1989).”
Areas defined as alder shrubland communities are dominated by large stands that are exclusively alder and thrive on steep hillslopes (Tape et al., 2006, 2012; Salmon et al., 2019a, b), whereas alder savannas occur in weakly developed water tracks and consist of short alder dispersed with other deciduous shrub species and graminoids. Between the lowland alder savanna water tracks, tussock tundra plant communities lack alder and are characterized by graminoids (e.g., Eriophorum vaginatum and Carex bigelowii), dwarf shrubs (e.g., Betula nana ssp. exilis), lichens (e.g., Cladonia spp.), and moss (e.g., Sphagnum spp.). A co-located study by Salmon et al. (2019a, b) defines the vegetation parameters of the hillslope per shrub and per ground coverage, including alder stand height, basal area, and nodule biomass. Active layer soils are deeper in the lowland area than the upland area soils, have a thicker organic peat horizon, and are poorly drained due to the low topographic gradient (Salmon et al., 2019a, b). The lowland is frequently saturated in inter-tussock areas, especially at the slope break between the steep upland area and shallow lowland area, and within the alder savanna community.
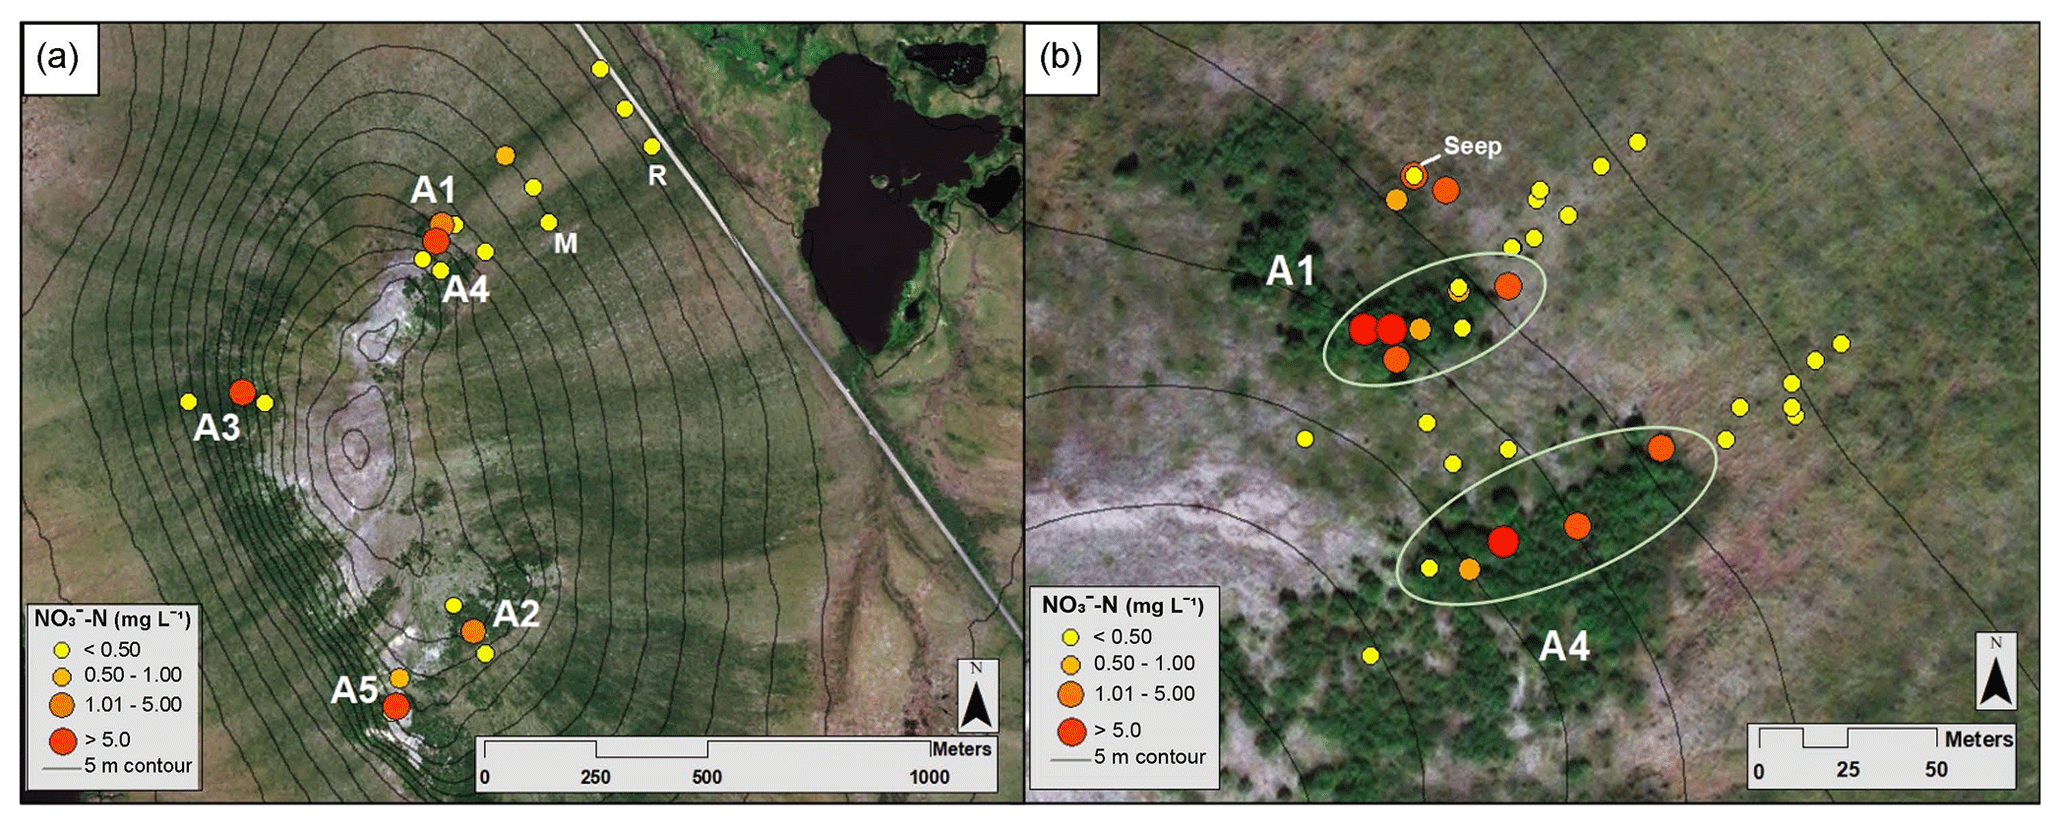
Figure 2Map of mean NO3-N concentrations from the Phase 1 and 2 sampling locations, where yellow indicates low concentrations and red indicates high concentrations (see the key for ranges; scales differ slightly). (a) Circles represent NO3-N concentrations at locations along the A1–A5, middle, and road transects in July 2017. (b) Dots represent average NO3-N concentrations along the A1 and A4 transects and between the transects over all sampling campaigns. The green ellipses indicate samples collected within the alder shrubland, as opposed to outside the alder shrubland. Aerial imagery in this figure is sourced from Esri, DigitalGlobe, GeoEye, Earthstar Geographics, CNES/Airbus DS, USDA, USGS, AeroGRID, IGN, and the GIS User Community.
For our study, soil pore water compositions within alder shrubland in the upland area were compared to soil pore water compositions outside alder shrubland (both in upland and lowland areas; see Fig. 1). These samples were collected over four field campaigns with a higher-resolution focus and additional monitoring at two alder patch transects (A1 and A4) during the latter campaigns (Figs. 1 and 2). The A1 transect includes a sampling location we identify as a “seep,” which is a direct seep from the ground located at the slope transition between the upland and lowland zones (Fig. 1b). The volume of water sourced from this seep was too small to measure directly but is estimated to be <2 cm3 s−1. However, water actively trickled from this seep location during all sampling campaigns and is likely representative of active layer melt that surfaced at the upland–lowland transition.
2.2 Sample design
To investigate the aforementioned hypotheses, this study was subdivided into two phases: an initial phase to identify NO3-N “hotspots” in relation to the alder shrubland community (Phase 1) and a comprehensive informed phase (Phase 2) to further address each of the three hypotheses. Phase 1 (18–21 July 2017) consisted of a synoptic survey to establish soil NO3-N variability within and adjacent to five upland alder shrubland areas (A1–A5; Fig. 1a). To capture this variability, transects were installed with sampling points located within alder shrubland as well as upslope and downslope of the shrubland. These transects also captured the transition between upland and lowland landscape positions, which was found to be located at the most downslope extent of each alder shrubland area.
Phase 2 (14–16 September 2017, 22–27 July 2018, and 21–22 September 2018) sampling addressed the variability of NO3-N within and downslope of two of the alder shrubland areas (A1 and A4 transects; Fig. 1b) that were exposed to the same topographic and climatic conditions and examined this variability with respect to topographic gradient. The A1 and A4 transects are located at similar reliefs on the eastern slope near the crest of the KG hillslope; however, the transects extend through and downslope of two separate alder patches allowing the nutrient dynamics associated with each shrubland area to be examined independently. These transects were examined with increasing resolution throughout sampling campaigns to determine NO3-N variability within the shrubland and to capture the extent of NO availability downgradient of the shrubland (see Table S5 in the Supplement for further details of the number of sampling locations per transect for each campaign). To address these spatiotemporal controls, we measured soil pore water NO3-N concentrations within, between, and downslope of alder shrubland and measured the natural abundances of redox-sensitive species (including manganese (Mn), ferrous iron (Fe2+), and sulfate (SO)) along the transects to assess biogeochemical processes and controls on nutrient availability in soil pore water across the tundra. Although an important intermediate form of nitrogen, NH, was measured, it is not discussed with detail in this study due to its low dissolved concentrations in these pore water samples (Table S1 in the Supplement).
Soil pore water and bulk soil samples were collected from each sampling location to assess NO3-N concentrations and any correlations with soil moisture. In Phase 1 (the July 2017 campaign), samples were collected at each of the five alder patches (Fig. 1a). In Phase 2, which spanned the three subsequent sampling campaigns, all samples were collected from the A1 and A4 transects (Fig. 1b) with the goal of examining spatial NO3-N variations with higher resolution. The alder stand along the A1 transect covers roughly ∼3400 m2 in area and is located 20 m north of the A4 transect, which intersects an alder stand covering roughly ∼6400 m2 in area (Fig. 1b). Sample collection evolved from three sampling locations per transect in Phase 1 to sampling locations placed every 10 m along each transect in Phase 2, initiating within the alder shrubland and terminating 50 m downslope from the bottom of each shrubland area (Fig. 1b). The number of samples per location for each sampling campaign varied as the spatial resolution increased through time and are shown in the associated Tables S4 and S5 in the Supplement.
2.3 Soil pore water
Soil pore water samples are the basis of our NON availability and variability investigation and were collected by installing a nest of macro-rhizons at each sample location (Rhizosphere Research Products; hereafter referred to as “rhizons”) using the methods described by Seeberg-Elverfeldt et al. (2005). Rhizons were installed at depths of 15–30 cm and, due to the volume required for chemical analyses, were installed in nests (with on average 5 rhizons per nest) at each sampling location, depending on soil saturation and water availability. Soil pore water was collected in 60 mL syringes connected by Luer-lock mechanisms on each rhizon. Syringes were subsequently combined into 1 sample per nest to obtain adequate volumes for analyses and ensure a homogeneous bulk sample. Syringes were re-hung from rhizons at their respective sampling locations and left overnight before collection the next morning.
After the soil pore water collected from each nest was integrated for a representative sample, the samples were then filtered, frozen, and transported to Los Alamos National Laboratory's Geochemistry and Geomaterials Research Laboratory (GGRL), where they were stored frozen until they underwent geochemical analysis. Cations were measured using inductively coupled plasma optical emission spectrometry (ICP-OES) on a PerkinElmer Optima 2100DV instrument (PerkinElmer Inc., USA) using United States Environmental Protection Agency (EPA) method 200.7; precision is justified to 0.01 mg L−1. Anions were measured with ion chromatography on a Dionex ICS-2100 instrument (Thermo Fisher Scientific Inc., USA) utilizing EPA method 300 (Throckmorton et al., 2015); precision is justified to 0.01 mg L−1. Isotopic analyses, including δ15N and δ18O of soil pore water and soil pore water NO3-N, were also performed to gain insights into nitrate sources and likely biogeochemical processes occurring in our study location (see the associated Supplement for full details).
2.4 Soil and leaf litter
Soil and leaf litter samples were collected for comparison to the soil pore water NO3-N content and to assess possible correlations between parameters. Along the A1 and A4 transects, soil was collected for soil moisture analysis from a depth of 15 cm (and 30 cm where the soil was deep enough) in pre-weighed tins, sealed with parafilm, and frozen for preservation. Samples were not collected from depths shallower than 15 cm because of the large presence of peat biomass at shallow depths and because all soil pore water samples were collected from ≥15 cm depths. A total of 27 soil samples were collected during July 2017, 6 during September 2017, and 24 in July 2018. It is worth noting that while our soil moisture and soil pore water samples were co-located, they were offset temporally, with our soil moisture sampling occurring at the end of our campaigns to avoid perturbing the rhizon nests while we were actively collecting soil pore water samples.
In July 2018, three soil pits (P1, P2, and P3) were dug and described along the A1 transect (Fig. 1b). In each pit, soil was excavated to frozen soil, verified by the presence of ice and sub-freezing soil temperatures. Soil was collected at intervals of 20 cm in each pit. Pits 3 and 1 had total depths of 46 and 55 cm to frozen soil, respectively, and soil samples were collected at 20 and 40 cm. Pit 2 had a depth of 61 cm to frozen soil, and soil samples were collected at 20, 40, and 60 cm depths. All soil samples were frozen and transported to GGRL or North Carolina State University Department of Marine, Earth, and Atmospheric Sciences in Raleigh, North Carolina, where they were stored frozen until analysis (see the Supplement for additional details).
Alder leaf litter was collected in September 2018 from six locations along the A1 and A4 transects (three samples from each transect), stored in sealed plastic bags, frozen, and homogenized prior to analysis (n=6). A contamination issue occurred with one of the leaf litter samples collected from the A4 transect, leaving us with n=5. Thirteen soil samples and five leaf litter samples were analyzed for total N, δ15N of soil organic nitrogen (SON), and ratios (O'Donnell and Jones, 2006; Moatar et al., 2017; see the Supplement for additional details).
2.5 In situ parameters
In situ parameters were measured for each water sampling location to provide insights into environmental field conditions, including depth to frozen soil or bedrock, soil temperature at rhizon sampling depth (∼15 cm), soil pore water pH, dissolved oxygen (DO), and specific conductivity. Summaries of DO, pH, and conductivity are provided in Table S2 (Supplement); no obvious spatial or temporal trends in these parameters and no significant correlations with NO3-N were observed (r2=0.02, 0.2, 0.06, respectively). Iron (Fe) speciation parameters were collected for 2 d during the July 2018 field campaign. These were mixed with ferrozine (to fix Fe2+ for later analysis) on-site and subsequently analyzed at GGRL using the Fe-ferrozine method (Stookey, 1970). The Fe speciation method was used to determine Fe2+ and total Fe (FeTotal; Stookey, 1970). Fe3+ was later calculated as the difference between Fe2+ and FeTotal.
2.6 Statistical analyses
The concentration data collected had a non-normal distribution (identified visually via box-plot asymmetry of the concentration data) and no outliers were identified. Thus, all measurements are included in the statistical analyses. Nonparametric Mann–Whitney rank sum tests were performed (Helsel and Hirsch, 2002) to identify significant differences between geochemical signatures (specifically NO3-N, Fe2+, FeTotal, Mn, and SO) of soil pore water within the alder shrublands and outside the alder shrublands in Phases 1 and 2 (see the Supplement). The Mann–Whitney statistical analyses performed quantified the spatial variability between the upland (alder shrubland) and lowland (alder savanna) regions of our A1 and A4 transects collected during the July 2018 and September 2018 field campaigns and did not factor in temporal variability as our time series were limited. The individual rhizon nests that composed the upland and lowland sampling sites are defined in Table S5 in the Supplement, and the detailed outcomes of the Mann–Whitney tests performed are provided in Table S6 in the Supplement. P values of less than 0.05 were considered statistically significant. Simple linear regressions were used to determine relationships between NO3-N and variables including soil moisture, depth to frozen soil or bedrock, and Fe. MATLAB R2017a was used for all statistical analyses and hydrochemical figure generation.
3.1 Soil depth and moisture
Soils within each upland patch were similar in composition, with general defining characteristics of a surficial peat horizon underlain by decayed peat and a transitional horizon into mineral soil at a depth of ∼12 to ∼15 cm, followed by bedrock or frozen soil (personal observations of field participants; Salmon et al., 2019a, b). Soil composition, moisture, and active layer depth were similar for the lowland portions of the A1 and A4 transects but differed from those for the upland portions of the transects (Table S4 in the Supplement). During both Phase 1 and Phase 2, the mean gravimetric % soil moisture content ((weight of wet soil − weight of dry soil) weight of dry soil × 100) was lowest in the upland area (28.5 %, 28.4 %, and 36.6 % in July 2017, September 2017, and July 2018, respectively) and greatest in the lowland area (>50 %). The lowlands were inundated during the Phase 2 September 2017 campaign and contained standing water in various inter-tussock locations during the July 2017 and July 2018 sampling campaigns. The mean depth to bedrock or frozen soil was greater in the lowland area (means of 56.5 and 54.3 cm in September 2017 and July 2018, respectively) than in the upland area (mean of 45.7 and 36.6 cm in September 2017 and July 2018 respectively) during all but one sampling campaign (July 2017; Table S4; in the Supplement). Soil moisture content and depth to bedrock or frozen soil were not measured during the September 2018 (21–22 September) sampling campaign due to logistical and sampling challenges.
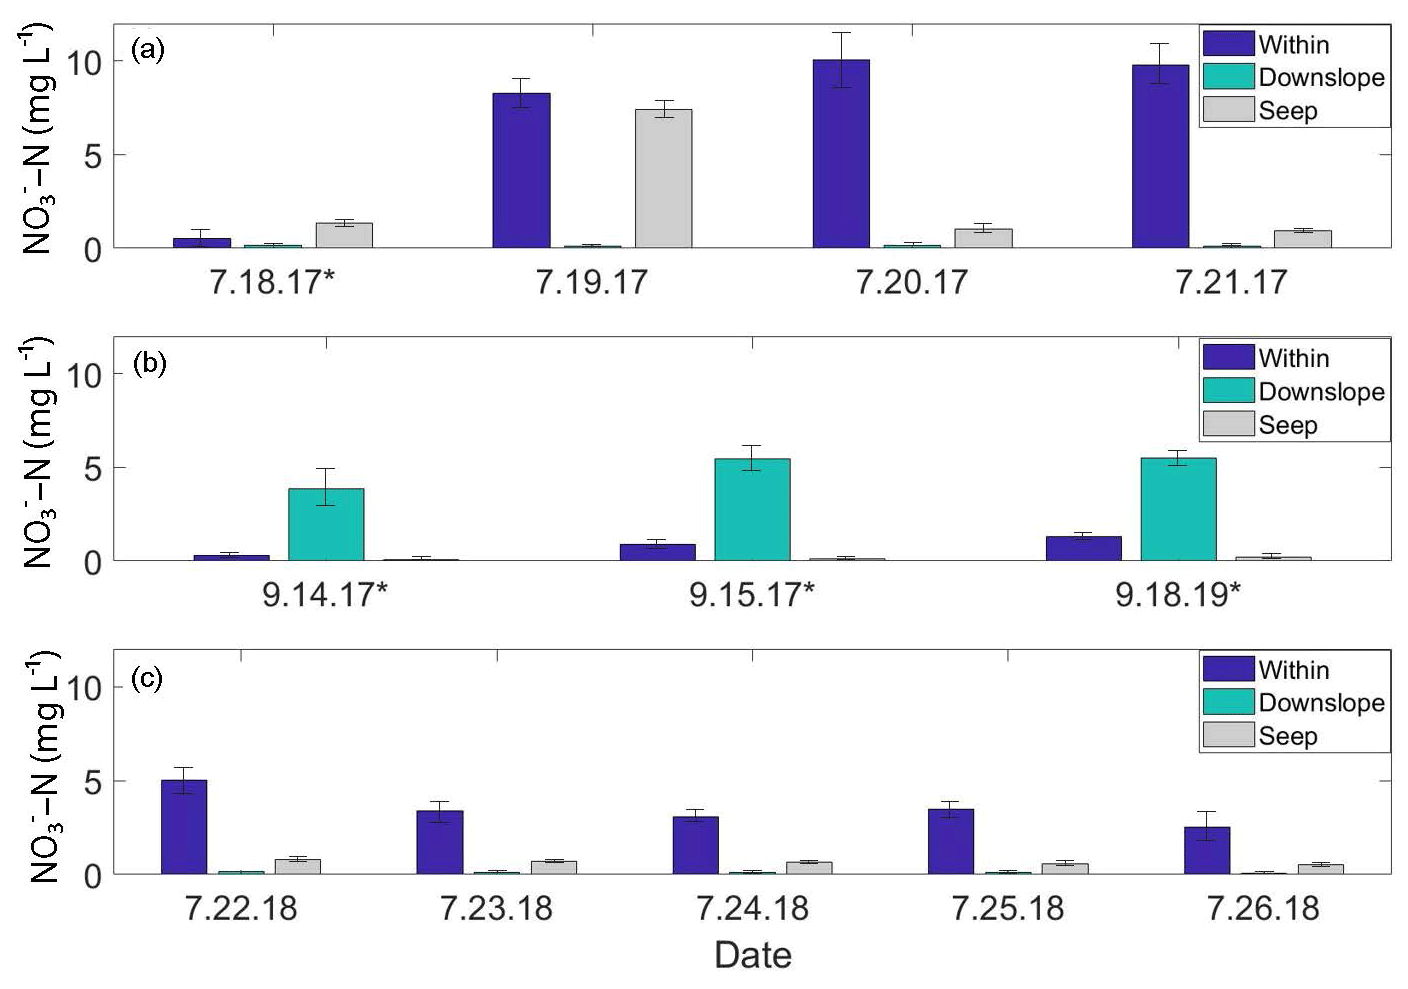
Figure 3Soil pore water NO3-N time-series plots from the A1 transect. “Within” and “Downslope” denote sample locations within and downslope of shrublands along the transect; “Seep” denotes a seep in the ground located on the A1 transect at the transition between upland and lowland. Standard deviations are displayed as black brackets on each bar. (a) July 2017 daily NO3-N concentrations. (b) September 2017 daily NO3-N concentrations. (c) July 2018 daily NO3-N concentrations. Days marked with an asterisk (*) indicate precipitation events.
3.2 Phase 1: initial results from five alder patches
From 18 to 21 July 2017, soil pore water NO3-N concentrations were significantly higher (p<0.01) within the alder shrubland than at sampling locations upslope and downslope of the shrubland along the A1, A2, A3, and A5 transects (Fig. 2a; additional details in the Supplement). A precipitation event (with a high of ∼13 ∘C) occurred overnight on 18 July (Western Regional Climate Center, 2017), but unfortunately the field-site rain gauge was out of commission and there is not a quantitative rain amount for this event. Parameters including soil depth, moisture content, pH, dissolved oxygen, and conductivity were not apparent controls on NO3-N and are reported in Tables S2 and S4 in the Supplement. Soil pore water NO3-N was initially negligible within the A1 alder shrubland (Fig. 3a) but increased in concentration following the rainfall event. A similar increase in NO3-N was also observed at a seep located at the transition between the upland and lowland along the A1 transect on 19 July relative to the other sampling days from the initial July 2017 sampling campaign. This seep is likely representative of water flowing directly from within the A1 alder shrubland to the lowland area (Fig. 2b), perhaps through fractured bedrock. Phase 1 results show that soil pore water NO3-N was elevated both from one alder shrubland patch to another (ranging from 0.3 to >10 mg L−) and within alder shrubland relative to other sampling locations along each transect. The 4 d sample collection along the A1 transect revealed daily variations in NO3-N availability at our sampling locations (0.51 to 10.08 mg L−1) that were likely associated with observed rainfall. Both the road and the middle transects located in the lowland tussock tundra and alder savanna communities had low NO3-N (<1.0 mg L−1).
3.3 Phase 2: NO3-N variability between two alder patches
3.3.1 September 2017
During the 2017 September sampling campaign (14–18 September), conditions were cool (high of ∼5.4 ∘C), with daily precipitation (personal observation of field participants; Western Regional Climate Center, 2017). NO3-N was elevated within the A4 shrubland and downslope of the A1 shrubland (Fig. 3b) but negligible in soil pore water collected from upland areas between the two transects. The mean NO3-N concentration within the A1 and A4 transects did not vary significantly from the mean NO3-N concentration directly downslope of the alder shrubland (p>0.05; reference purple sampling locations in Fig. 1b). However, the mean concentration of NO3-N both within and directly downslope of the shrublands was significantly greater (p<0.05; Table S4 in the Supplement) than the mean NO3-N concentration of the middle and road transects in the furthest extent of the lowland area (transects M and R in Fig. 1a), indicating that transport potential of NO3-N is limited to near the slope break.
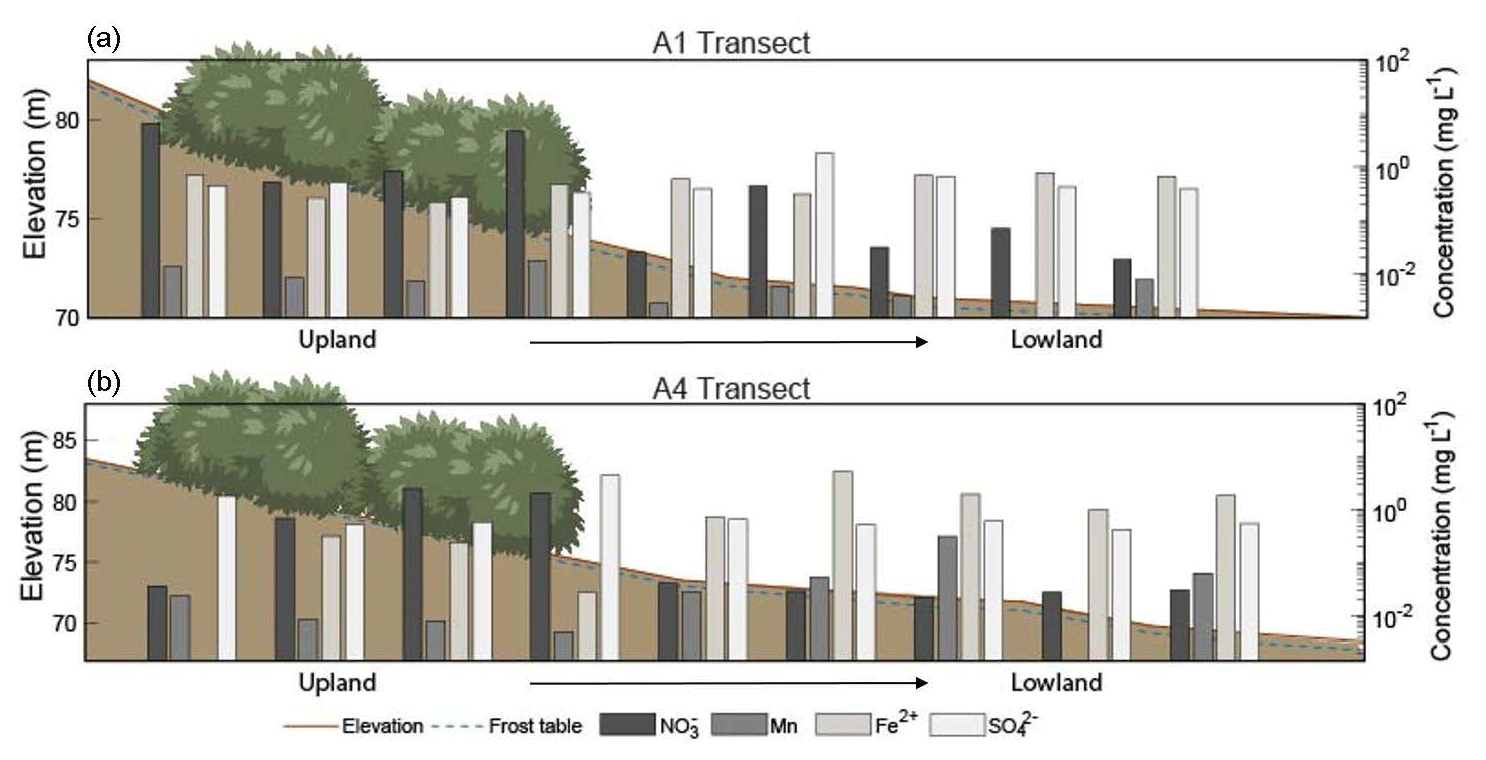
Figure 4Elevation profiles and chemical concentrations along the (a) A1 and (b) A4 transects extending from the upland area to the lowland area during July (2018) sampling. Note that the elevation scale is different for the A1 and A4 transects. The horizontal axis and shrubs are not to scale. Depth to frozen soil or bedrock is depicted by the dashed blue line, and shrubs indicate sample sites located within the alder shrubland. Redox species – nitrate (NO3-N), manganese (Mn), iron (Fe2+), and sulfate (SO) – are plotted along the secondary y axis. See Tables S5–S6 in the associated Supplement for corresponding concentrations, n values, and statistics.
3.3.2 July 2018
During the 2018 July sampling campaign (22–26 July), NO3-N was elevated along the A1 and A4 transects (Figs. 2b and 3c) both within the shrubland and up to 20 m downslope of the shrubland, where the transition between upland and lowland occurs (Fig. 3c). Each of the five sampling days in July were dry (no precipitation, a high of ∼16 ∘C), and no notable temporal variation (<3 mg L−1 difference) in NO3-N was observed along the A1 and A4 transects (Fig. 4a and b). NO3-N concentrations measured from two soil pits located along the A1 transect also increased with depth (Table S5 in the Supplement). Despite the dry conditions, we directly observed water seeping from the upslope wall into each pit, suggesting that interflow was actively occurring across the A1 transect from the upland to lowland areas. Nitrate-N concentrations decreased from upland to lowland along both the A1 and A4 transects (significantly different at p<0.001; Tables S5 and S6 in the Supplement). This pattern was mirrored by Fe, which increased in concentration from upland to lowland (p<0.001) along each transect (Fig. 4b and Tables S5 and S6 in the Supplement). Similarly, Mn increased from upland to lowland along the A4 transect (p<0.05; Fig. 4b and Tables S5 and S6 in the Supplement). Spatial trends in Mn were not identified, however, along the A1 transect (Fig. 4a) with respect to Mn reduction (p>0.05; Tables S5 and S6 in the Supplement). No trends or significant differences (p>0.05) in SO concentrations were observed along the A4 transect (Tables S5 and S6 in the Supplement).
3.3.3 September 2018
In September 2018 (21–22 September), similar patterns in NO3-N concentration occurred along both the A1 and A4 transects (Supplement), with the highest NO3-N found at locations within and directly downslope of the shrubland. Total Fe and SO did not vary along the A1 transect, but FeTotal increased along the A4 transect and SO increased between 0 and 20 m downslope of the alder shrubland (Table S5 in the Supplement). Manganese was negligible (<0.01 mg L−1) along both the A1 and A4 transects. No precipitation events occurred during sampling in September 2018.
4.1 Sources of nitrate
Previous studies conducted in continuous polygonal permafrost areas without alders indicate that soil moisture is the dominant control on NO production (Heikoop et al., 2015). However, at the KG hillslope, where polygonal permafrost features do not exist and the landscape is controlled by the slope gradient rather than the microtopography, no direct relationship was observed between NO3-N and soil moisture (r2<0.2; Fig. S1 in the Supplement). Instead of being associated with soil moisture, at this site, NO3-N concentrations were tightly constrained by the presence of alder shrublands. Although NO3-N was generally absent in the poorly drained (wet) lowland area, it was elevated within alder patches on the well-drained (dry) upland area. Elevated NO3-N was not observed laterally adjacent to or upslope of alder shrubland. Therefore, while soil moisture likely plays a role in determining NO3-N availability, our results indicate that the alder shrubland community was the dominant control on NO3-N availability in soil pore water on the KG hillslope. Furthermore, Darrouzet-Nardi and Weintraub (2014) found evidence for spatial inaccessibility of labile N in Arctic ecosystems due to isolation in environments with low water potential, but our findings indicate the potential for increased accessibility from the mobilization of labile N in the presence of topographic relief and precipitation. A detailed overview of the isotopic analyses performed and their results are presented in the Supplement; however, it is worth noting that the δ15N and δ18O of soil pore water were consistent with the predicted range of NO produced through the microbial degradation of N-rich alder shrub organic matter. Enrichment of both δ15N and δ18O isotopes at wetter downslope locations indicates that denitrification limits the mobility of NON by transforming it to other N species.
4.2 Effects of precipitation on pore water nitrate
Previous studies have linked nutrient flushing with rainfall events (Bechtold et al., 2003; Baldwin and Mitchell, 2000; Rasmussen et al., 2020, 2022), and several studies have proposed that soil NO inputs from mineralized and nitrified leaf litter are mobilized at wet-season onset (Yamashita et al., 2010; Bernal et al., 2003). In particular, Vink et al. (2007) found that in a forested catchment, inorganic N accumulated within soil and leaf litter during dry periods and was subsequently flushed into headwater streams during precipitation events – an initial pulse of NO3-N in soil pore water quickly declined following increased precipitation and discharge. The dynamic short-term temporal variability of NO3-N observed along the A1 transect (Fig. 3; within and downslope of shrubland) that co-occurred with precipitation events in July and September of 2017 provides evidence that a similar model of NO accumulation and subsequent mobilization occurs on the KG hillslope. A “pulse-like” signal of elevated soil pore water NO3-N was observed within and downslope of shrubland along the A1 transect (Fig. 3a) and occurred following an overnight precipitation event between 17–18 July 2017.
Rainfall occurred during sampling on all 3 d of the September 2017 campaign (14 through 16 September 2017; personal observation; Western Regional Climate Center, 2017). During the July 2018 (22–27 July) and September 2018 (21–22 September) campaigns, weather conditions were much drier (no recorded precipitation events), and NO3-N concentrations showed little variation with no daily pattern, ranging from 4.09 to 4.94 mg L−1 downslope of shrubland along the A1 transect over the 5 d in July 2018 and from 0.02 to 0.12 mg L−1 over 2 d in September 2018. While the precipitation events in July 2017 and September 2017 likely mobilized NO from the shrubland to the lowland area (downgradient) along the A1 transect, this mobility was only observed within the first 10–30 m downslope of the shrubland (Fig. 4a), indicating the presence of additional controls (such as denitrification bacteria, assimilation, and hydrologic flushing) acting on NO transport across the landscape.
4.3 Effects of redox on pore water nitrate-N
The decreases in soil pore water NO3-N along the A1 and A4 transects and increases in soil moisture, Fe2+, and Mn along the A4 transect in July 2018 (Fig. 4) and September 2018 (Tables S5 and S6 in the Supplement) indicate a transition from an oxic environment towards a more sub-oxic environment as the slope transitions from upland to lowland. The lack of variation in SO across these transects indicates that conditions were not reducing enough for sulfate reduction or methanogenesis (Jakobsen and Postma, 1999). Our data indicate that the oxic environment on the well-drained upland slope supports NO3-N production while the sub-oxic environment of the poorly drained lowland area supports the reduction or denitrification of NO (Table S5 in the Supplement).
Callahan et al. (2017) described upland hillslope alders as “hotspots” for NO inputs into streams at the hillslope scale, and Harms and Jones (2012) observed greater NO export in soils with increased active layer thickness. These predictions are consistent with the elevated NO3-N concentrations within and directly downslope of alder shrubland along each transect (Fig. 4). The prevailing sub-oxic conditions downslope of A1 and A4 and overall scarcity of inorganic N likely restrict NO production, indicating that the elevated NO3-N concentrations observed at these locations were produced within the alder shrubland patches and flushed downslope. However, mobility of NO beyond the first 20–30 m downslope of shrubland along the A1 and A4 transects was not observed (Fig. 4). Inputs and subsequent dilution from flow along the gradient may be responsible for the decrease in NO3-N, but it is more likely due to denitrification occurring in the sub-oxic conditions, as evidenced by the isotopic denitrification trend observed (see the Supplement for a full isotopic discussion). Consistent with these results, a study by Harms and Ludwig (2016) predicted that saturated soils and reducing conditions may buffer N export to downslope ecosystems. Thus, while hillslopes dominated by alder will likely increase NO availability with shrubification, sub-oxic to reducing zones and soil saturation occurring at downslope locations may serve as buffers to the downgradient mobility of NO through microbial denitrification. Defining the role of topographically controlled redox environments in nutrient cycling in permafrost environments will be beneficial for understanding the likelihood of NO mobilization to streams and its subsequent transport downgradient within N-limited landscapes.
4.4 Spatial and temporal variations in nitrate-N
Over the limited time series we collected in the 2017 and 2018 growing seasons, significant (p<0.05; Supplement) spatiotemporal variability of soil pore water NO3-N concentrations was observed at our continuous permafrost site with a distinct ridge-toe slope topography. Spatial variability existed within individual shrubland areas as well as from one shrubland area to another (Fig. 2; Table S5 in the Supplement). These spatial differences encompassed both changes in the distribution of NO3-N within alder shrubland and changes in the magnitude of NO3-N present in the landscape over time. Temporally, we observed dynamic daily variability in NO3-N that co-occurred with precipitation events at locations within and downslope of two alder shrubland patches (Fig. 3).
Although soil pore water NO3-N was elevated during dry conditions and active drainage through-flow was observed in open soil pits, the notable day-to-day changes in NO3-N during wet conditions indicate that this variability was likely influenced by the co-occurrence of rainfall as a mobilization mechanism. Evidence for this mechanism was observed during or following precipitation events: first after the isolated precipitation event in July 2017, where NO3-N concentrations were elevated both within and downslope of alder shrubland in one location (Fig. 3a), and again in September 2017, where NO3-N concentrations were elevated downslope but not within the same shrubland (Fig. 3b). On the KG hillslope, NO likely accumulates in the soil below alders as litter decomposes (supported by isotopic evidence presented in the Supplement) and is likely mobilized down-gradient with the onset of rainfall. These spatial variations that co-occur with rainfall events likely indicate a “flushing” downgradient of previously accumulated soil NO from within the alder shrubland, and highlight the capacity for NO to be mobilized across landscapes.
4.5 Future research
Findings from this study illuminate a level of complexity in N cycling that is not widely published by providing snapshots of variability and mobility of NO on the KG hillslope over brief time series. Future studies would benefit from the additional incorporation of continuous monitoring of NO throughout a growing season (starting around snowmelt; Rasmussen et al., 2022), the consideration of alder characteristics (biomass, root and nodule density, rates of N fixation; Salmon et al., 2019a, b), and targeted transects throughout a permafrost alder landscape (as done in this study) to further characterize spatial variation in soil pore water NO in relation to alder stand proximity. Studies to further identify processes controlling the availability, transport, and fate of N in permafrost landscapes would benefit from the inclusion of N sources, total N input, organic carbon, microbial community function, and C:N relationships, such as those conducted by Ramm et al. (2020). Long-term impacts of NO on vegetation, permafrost degradation, and interstitial water chemistry in wet downslope permafrost landscapes also require further investigation. Moreover, identification of the microbial communities in the sub-oxic reducing downslope environments would lend insights into the fate of NO: whether it is assimilated by plants or reduced to N2 or nitrous oxide gas.
Furthermore, the dynamic variability of NO3-N across the KG hillslope indicates the importance of improving the representation of N cycle processes in ESMs. Although plant functional types (PFTs) are included in ESMs currently, processes such as N fixation remain underrepresented in these classifications (Wullschleger et al., 2014), and their incorporation into ESMs could improve nutrient availability and variability predictions.
Teasing apart the dynamics between alder shrubland communities, topography, permafrost, and NO availability is complex because interactions between these factors vary across both time and space. The high degree of NO3-N variability observed over short timescales (days) and distances (meters) is documented in this study. The existence of a topographic gradient within our alder shrubland landscape allows precipitation events to mobilize nitrate downslope. However, redox environments driven by a hillslope topography are important factors in limiting the spatial extent of NO mobility across permafrost landscapes. These findings have implications for the anticipated nutrient responses associated with the expansion of shrub vegetation in the Arctic and demonstrate the importance of incorporating factors such as topography, redox conditions, and plant functional type into watershed-scale studies. Along with permafrost thaw (Harms and Jones, 2012) and changes in soil moisture distribution (Heikoop et al., 2015), the expansion of N2-fixing shrubs across tundra landscapes is a dominant mechanism that could greatly increase local NO availability in the Arctic. However, this study demonstrates that to fully account for the impact of shrubification on NO availability and export, scientists should also consider topographic gradients, hydrologic conditions, and the presence of geochemical reducing zones that may affect NO fate and transport.
The complete data set for this research can be accessed at https://doi.org/10.5440/1544760 (McCaully et al., 2022).
The supplement related to this article is available online at: https://doi.org/10.5194/tc-16-1889-2022-supplement.
REM, CAA, BDN, JMH, VGS, and CJW conceptualized the study. REM, CAA, BDN, JMH, VGS, SS, and NAW contributed to the study investigation. REM, CAA, BDN, VGS, and JMH performed formal analyses of the data. REM, CAA, BDN, JMH, GBP, and OCM contributed to the data curation of this project. CJW and SDW were involved in funding acquisition, project administration, supervision, and resource access. JMH, GBP, and OCM provided laboratory resources for this project. REM, CAA, BDN, VGS, and JMH were involved in visualization, the writing of the original draft preparation, and the review and editing process. CJW, SS, NAW, and SDW contributed to the writing, review, and editing.
The contact author has declared that neither they nor their co-authors have any competing interests.
This research was completed with the oversight and support of the Next-Generation Ecosystems Experiments (NGEE Arctic) project. We would like to thank Mary's Igloo Native Corporation for their guidance and for allowing us to conduct this research on the traditional homelands of the Iñupiat people. We would like to thank Nate Conroy, Emma Lathrop, Emily Kluk, Dea Musa, and the staff at the Geochemistry and Geomaterials Research Laboratory at LANL for their assistance in fieldwork, laboratory analysis, and data organization. We thank Bob Busey for access to continuous weather data. Thank you to the entire NGEE Arctic team for their support. Finally, we would like to thank Ethan Hyland and Gwen Hopper for laboratory assistance in the MEAS Department at North Carolina State University.
This research has been supported by the United States Department of Energy (DOE) Office of Science, Biological and Environmental Research program, as a part of the Next Generation Ecosystem Experiment, NGEE-Arctic.
Publisher's note: Copernicus Publications remains neutral with regard to jurisdictional claims in published maps and institutional affiliations.
This paper was edited by Ylva Sjöberg and reviewed by three anonymous referees.
Baldwin, D. S. and Mitchell, A. M.: The effects of drying and re-flooding on the sediment and soil nutrient dynamics of lowland river-floodplain systems: A synthesis, Regul. Rivers: Res. Mgmt., 16, 457–467, https://doi.org/10.1002/1099-1646(200009/10)16:5<457::AID-RRR597>3.0.CO;2-B, 2000.
Barnes, R. T., Williams, M. W., Parman, J. N., Hill, K., and Caine, N.: Thawing glacial and permafrost features contribute to nitrogen export from Green Lakes Valley, Colorado Front Range, USA, Biogeochemistry, 117, 413–430, https://doi.org/10.1007/s10533-013-9886-5, 2014.
Bechtold, J. S., Edwards, R. T., and Naiman R. J.: Biotic versus hydrologic control over seasonal nitrate leaching in a floodplain forest, Biogeochemistry, 63, 53–72, https://doi.org/10.1023/A:1023350127042, 2003.
Bernal, S., Butturini, A., Nin, E., Sabater, F., and Sabater, S.: Leaf litter dynamics and nitrous oxide emission in a Mediterranean riparian forest, J. Environ. Qual., 32, 191–197, https://doi.org/10.2134/jeq2003.1910, 2003.
Boike, J., Juszak, I., Lange, S., Chadburn, S., Burke, E., Overduin, P. P., Roth, K., Ippisch, O., Bornemann, N., Stern, L., Gouttevin, I., Hauber, E., and Westermann, S.: A 20-year record (1998–2017) of permafrost, active layer and meteorological conditions at a high Arctic permafrost research site (Bayelva, Spitsbergen), Earth Syst. Sci. Data, 10, 355–390, https://doi.org/10.5194/essd-10-355-2018, 2018.
Bühlmann, T., Hiltbrunner, E., and Körner, C.: Alnus viridis expansion contributes to excess reactive nitrogen release, reduces biodiversity and constrains forest succession in the Alps, Alp. Bot., 124, 187–191, https://doi.org/10.1007/s00035-014-0134-y, 2014.
Callahan, M. K., Whigham, D. F., Rain, M. C., Rains, K. C., King, R. S., Walker, C. M., Maurer, J. R., and Baird, D. J.: Nitrogen subsidies from hillslope alder stands to streamside wetlands and headwater streams, Kenai Peninsula, Alaska, JAWRA, 53, 478–492, https://doi.org/10.1111/1752-1688.12508, 2017.
Chapin, F. S., McGraw, J. B., and Shaver, G. R. Competition causes regular spacing of alder in Alaskan shrub tundra, Oecologia, 79, 412–416, https://doi.org/10.1007/BF00384322, 1989.
Chapin, F. S., Mcguire, A., D., Randerson, J., Pielke, R., Baldocchi, D., Hobbie, S. E., Roulet, N., Eugster, W., Kasischke, E., Rastetter, E. B., Zimov, A., and Running, S. W.: Arctic and boreal ecosystems of western North America as components of the climate system, Glob. Chang. Biol., 6, 211–223, https://doi.org/10.1046/j.1365-2486.2000.06022.x, 2000.
Darrouzet-Nardi, A. and Weintraub, M. N.: Evidence for spatially inaccessible labile N from a comparison of soil core extractions and soil pore water lysimetry, Soil Biol. Biochem., 73, 22–32, https://doi.org/10.1016/j.soilbio.2014.02.010, 2014.
Frost, G. V. and Epstein, H. E.: Tall shrub and tree expansion in Siberian tundra ecotones since the 1960s, Glob. Chang. Biol., 20, 1264–1277, https://doi.org/10.1111/gcb.12406, 2014.
Frost, G. V., Epstein, H. E., Walker, D. A., Matyshak, G., and Ermokhina, K. Patterned-ground facilitates shrub expansion in Low Arctic tundra, Environ. Res. Lett., 8, 015035, https://doi.org/10.1088/1748-9326/8/1/015035, 2013.
Harms, T. K. and Jones, J. B.: Thaw depth determines reaction and transport of inorganic nitrogen in valley bottom permafrost soils, Glob. Chang. Biol., 18, 2958–2968, https://doi.org/10.1111/j.1365-2486.2012.02731.x, 2012.
Harms, T. K. and Ludwig, S. M.: Retention and removal of nitrogen and phosphorus in saturated soils of Arctic hillslopes, Biogeochemistry, 127, 291–304, https://doi.org/10.1007/s10533-016-0181-0, 2016.
Harms, T. K., Cook, C. L., Wlostowski, A. N., Gooseff, M. N., and Godsey, S.E.: Spiraling down hillslopes: nutrient uptake from water tracks in a warming Arctic, Ecosystems, 22, 1546–1560, https://doi.org/10.1007/s10021-019-00355-z, 2019.
Heikoop, J. M., Throckmorton, H. M., Newman, B. D., Perkins, G. B., Iversen, C. M., Chowdhury, T. R., Romanovsky, V., Graham, D. E., Norby, R. J., Wilson, C. J., and Wullschleger, S. D.: Isotopic identification of soil and permafrost nitrate sources in an Arctic tundra ecosystem, J. Geophys. Res.-Biogeo., 120, 1000–1017, https://doi.org/10.1002/2014JG002883, 2015.
Helsel, D. R. and Hirsch, R. M.: Statistical methods in water resources: Techniques of water resources investigations, 04-A3, U.S. Geological Survey, Reston, VA, USA, 118–122, https://doi.org/10.3133/twri04A3, 2002.
Hiltbrunner, E., Aerts, R., Bühlmann, T., Huss-Danell, K., Magnusson, B., Myrold, D. D., Reed, S. C., Sigurdsson, B. D., and Körner, C.: Ecological consequences of the expansion of N2-fixing plants in cold biomes, Oecologia, 176, 11–24, https://doi.org/10.1007/s00442-014-2991-x, 2014.
Hinzman, L. D., Deal, C. J., McGuire, A. D., Mernild, S. H., Polyakov, I. V., and Walsh, J. E.: Trajectory of the Arctic as an integrated system, Ecol. Appl., 23, 1837–1868, https://doi.org/10.1890/11-1498.1, 2013.
Hopkins, D. M. and Karlstrom, T. N. V.: Permafrost and groundwater in Alaska, 264-F, US Government Printing Office, United States, Washington D. C., 122–124, 1955.
Hovelsrud, G. K., Poppel, B., van Oort, B., and Reist, J. D.: Arctic societies, cultures, and peoples in a changing cryosphere, AMBIO, 40, 100–110, https://doi.org/10.1007/s13280-011-0219-4, 2011.
Hurd, T. M. and Raynal, D. J.: Comparison of nitrogen solute concentrations within alder (Alnus incana ssp. rugosa) and non-alder dominated wetlands, Hydrol. Process., 18, 2681–2697, https://doi.org/10.1002/hyp.5575, 2004.
Iversen, C., Breen, A., Salmon, V., Vander Stel, H., and Wullschleger, S. D.: NGEE Arctic Plant Traits: Vegetation plot locations, ecotypes, and photos, Kougarok Road mile marker 64, Seward Peninsula, Alaska, 2016, Next Generation Ecosystem Experiments Arctic [data set], https://doi.org/10.5440/1346196, 2016.
Jakobsen, R. and Postma, D.: Redox zoning, rates of sulfate reduction and interactions with Fe-reduction and methanogenesis in a shallow sandy aquifer, Rømø, Denmark, Geochim. Cosmochim. Ac., 63, 137–151, https://doi.org/10.1016/S0016-7037(98)00272-5, 1999.
Ju, J. and Masek, J. G.: The vegetation greenness trend in Canada and US Alaska from 1984–2012 Landsat data, Remote Sens. Environ., 176, 1–16, https://doi.org/10.1016/j.rse.2016.01.001, 2016.
Keuper, F., Dorrepaal, E., van Bodegom, P. M., van Logtestijn, R., Venhuizen, G., van Hal, J., and Aerts, R.: Experimentally increased nutrient availability at the permafrost thaw front selectively enhances biomass production of deep-rooting subarctic peatland species, Glob. Change Biol., 23, 4257–4266, https://doi.org/10.1111/gcb.13804, 2017.
Koch, J. C., Runkel, R. L., Striegl, R., and McKnight, D. M.: Hydrologic controls on the transport and cycling of carbon and nitrogen in a boreal catchment underlain by continuous permafrost, J. Geophys. Res.-Biogeo., 118, 698–712, https://doi.org/10.1002/jgrg.20058, 2013.
Martin, P. D., Jenkins, J. L., Adams, F. J., Torre, M., Matz, A. C., Payer, D. C., Reynolds, P. E., Tidwell, A. C., and Zelenak, J. R.: Wildlife response to environmental Arctic change: Predicting Future Habitats of Arctic Alaska, report from: The Wildlife Response to Environmental Arctic Change (WildREACH): Predicting future habitats of Arctic Alaska workshop, Fairbanks, AK, USA, 17–18 November 2008.
McCaully, R., Arendt, C., Newman, B., and Heikoop, J.: Sources and Variability of Nitrate on an Alaskan Hillslope Dominated by Alder Shrubs, Kougarok, Alaska, 2017 and 2018, Next Generation Ecosystem Experiments Arctic Data Collection, Oak Ridge National Laboratory, U.S. Department of Energy, Oak Ridge, Tennessee, USA [data set], https://doi.org/10.5440/1544760, 2022.
McClelland, J. W., Stieglitz, M., Pan, F., Holmes, R. M., and Peterson, B. J.: Recent changes in nitrate and dissolved organic carbon export from the upper Kuparuk River, North Slope, Alaska: N and C export from the Kuparuk River, J. Geophys. Res.-Biogeo., 112, G4, https://doi.org/10.1029/2006JG000371, 2007.
Mitchell, J. S. and Ruess, R. W.: N2 fixing alder (Alnus viridis spp. fruticosa) effects on soil properties across a secondary successional chronosequence in interior Alaska, Biogeochemistry, 95, 215–229, https://doi.org/10.1007/s10533-009-9332-x, 2009.
Moatar, F., Abbot, B. W., Minaudo, C., Curie, F., and Pinay, G.: Elemental properties, hydrology, and biology interact to shape concentration-discharge curves for carbon, nutrients, sediment, and major ions, Water Resour. Res., 53, 1270–1287, https://doi.org/10.1002/2016WR019635, 2017.
Myers-Smith, I. H., Forbes, B. C., Wilmking, M., Hallinger, M., Lantz, T., Blok, D., Tape, K. D., Macias-Fauria, M., Sass-Klaassen, U., and Lévesque, E.: Shrub expansion in tundra ecosystems: dynamics, impacts and research priorities, Environ. Res. Lett., 6, 045509, https://doi.org/10.1088/1748-9326/6/4/045509, 2011.
Myers-Smith, I. H., Elmendorf, S. C., Beck, P. S. A., Wilmking, M., Hallinger, M., Blok, D, Tape, K. D., Rayback, S. A., Macias-Fauria, M., Forbes, B. C., Speed, J. D. M., Boulanger-Lapointe, N., Rixen, C., Lévesque, E., Schmidt, N. M., Baittinger, C., Trant, A. J., Hermanutz, L., Collier, L. S., Dawes, M. A., Lantz, T. C., Weijers, S., Jørgensen, R. H., Buchwal, A., Buras, A., Naito, A. T., Ravolainen, V., Schaepman-Strub, G., Wheeler, J. A., Wipf, S., Guay, K. C., Hik, D. S., and Vellend, M.: Climate sensitivity of shrub growth across the tundra biome, Nat. Clim. Chang., 5, 887–891, https://doi.org/10.1038/nclimate2697, 2015.
O'Donnell, J. A. and Jones, J. B.: Nitrogen retention in the riparian zone of catchments underlain by discontinuous permafrost, Freshw. Biol., 51, 854–864, https://doi.org/10.1111/j.1365-2427.2006.01535.x, 2006.
Ogawa, A., Shibata, H., Suzuki, K., Mitchell, M. J., and Ikegami, Y.: Relationship of topography to surface water chemistry with particular focus on nitrogen and organic carbon solutes within a forested watershed in Hokkaido, Japan, Hydrol. Process., 20, 251–265, https://doi.org/10.1002/hyp.5901, 2006.
Racine, C. H.: Flora and vegetation: Biological Survey of the Proposed Kobuk Valley National Monument, Final Report, edited by: Melchior, H. R., Fairbanks, AK, Alaska Cooperative Park Studies Unit, Biology and Resource Management Program, University of Alaska, 39–139, 1976.
Racine, C. H. and Anderson, J. H. Flora and vegetation of the Chukchi-Imuruk area Biological Survey of the Bering Land Bridge National Monument, Revised Final Report, edited by: Melchior, H. R., Fairbanks, AK: Alaska Cooperative Park Studies Unit, Biology and Resources Management Program, University of Alaska, 38–113, 1979.
Ramm, E., Liu, C., Wang, X., Yue, H., Zhang, W., Pan, Y., Schloter, M., Gschwendtner, S., Mueller, C. W., Hu, B., Rennenberg, H., and Dannenmann, M.: The forgotten nutrient - The role of nitrogen in permafrost soils of Northern China, Adv. Atmos. Sci., 37, 793–799, https://doi.org/10.1007/s00376-020-0027-5, 2020.
Rasmussen, L. H., Ambus, P., Zhang, W., Jansson, P. E., Michelsen, A., and Elberling, B.: Slope hydrology and permafrost: The effect of snowmelt N transport on downslope ecosystem, EGU General Assembly 2020, Online, 4–8 May 2020, EGU2020-2927, https://doi.org/10.5194/egusphere-egu2020-2927, 2020.
Rasmussen, L. H., Zhang, W., Ambus, P., Michelsen, A., Jansson, P.-E., Kitzler, B., and Elberling, B.: Nitrogen transport in a tundra landscape: the effects of early and late growing season lateral N inputs on arctic soil and plant N pools and N2O fluxes, Biogeochem., 157, 69–84, https://doi.org/10.1007/s10533-021-00855-y, 2022.
Rhoades, C., Óskarsson, H., Binkley, D., and Stottlemyer, R.: Alder (Alnus crispa) effects on soils in ecosystems of the Agashashok River valley, northwest Alaska, Ecoscience, 8, 89–95, https://doi.org/10.1080/11956860.2001.11682634, 2001.
Romanovsky, V. E. and Osterkamp, T. E.: Effects of unfrozen water on heat and mass transport processes in the active layer and permafrost, Permafrost Periglac., 11, 219–239, https://doi.org/10.1002/1099-1530(200007/09)11:3<219::AID-PPP352>3.0.CO;2-7, 2000.
Roy, S., Khasa, D. P., and Greer, C. W.: Combining alders, frankiae, and mycorrhizae for the revegetation and remediation of contaminated ecosystems, Can. J. Bot., 85, 237–251, https://doi.org/10.1139/B07-017, 2007.
Salmon, V. G., Soucy, P., Mauritz, M., Celis, G., Natali, S. M., Mack, M. C., and Schuur, E. A. G.: Nitrogen availability increases in a tundra ecosystem during five years of experimental permafrost thaw, Glob. Chang. Biol., 22, 1927–1941, https://doi.org/10.1111/gcb.13204, 2016.
Salmon, V. G., Breen, A. L., Kumar, J., Lara, M. J., Thornton, P. E., Wullschleger, S. D., and Iversen, C. M.: Alder distribution and expansion across a tundra hillslope: Implications for local N cycling, Front. Plant Sci., 10, 1099, https://doi.org/10.3389/fpls.2019.01099, 2019a.
Salmon, V. G., Iversen, C. M., Breen, A. L., Vander Stel, H., and Childs, J.: NGEE Arctic Plant Traits: Plant Biomass and Traits, Kougarok Road Mile Marker 64, Seward Peninsula, Alaska, beginning 2016, Next Generation Ecosystem Experiments Arctic [data set], https://doi.org/10.5440/1346199, 2019b.
Schuur, E. A. G., McGuire, A. D., Schädel, C., Grosse, G., Harden, J. W., Hayes, D. J., Hugelius, G., Koven, C. D., Kuhry, P., Lawrence, D. M., Natali, S. M., Olefeldt, D., Romanovsky, V. E., Schaefer, K., Turetsky, M. R., Treat, C. C., and Vonk, J. E.: Climate change and the permafrost carbon feedback, Nature, 520, 171–179, https://doi.org/10.1038/nature14338, 2015.
Seeberg-Elverfeldt, J., Schlüter, M., Feseker, T., and Kölling, M.: Rhizon sampling of porewaters near the sediment-water interface of aquatic systems, Limnol. Oceanogr. Methods, 3, 361–371, https://doi.org/10.4319/lom.2005.3.361, 2005.
Shaftel, R. S., King, R. S., and Back, J. A.: Alder cover drives nitrogen availability in Kenai lowland headwater streams, Alaska, Biogeochemistry, 107, 135–148, https://doi.org/10.1007/s10533-010-9541-3, 2012.
Sharkhuu, N. and Sharkhuu, A.: Effects of climate warming and vegetation cover on permafrost of Mongolia, in: Eurasian Steppes. Ecological Problems and Livelihoods in a Changing World, edited by: Werger, M. J. A. and van Staalduinen, M. A., Springer Netherlands, Heidelberg, Germany, 445–472, https://doi.org/10.1007/978-94-007-3886-7_17, 2012.
Shaver, G. R. and Chapin, F. S.: Response to fertilization by various plant growth forms in an Alaskan tundra: Nutrient accumulation and growth, Ecology, 61, 662–675, https://doi.org/10.2307/1937432, 1980.
Stookey, L. L.: Ferrozine-A new pectrophotometric reagent for iron, Anal. Chem., 42, 779–781, https://doi.org/10.1021/ac60289a016, 1970.
Street, L. E., Burns, N. R., and Woodin, S. J.: Slow recovery of High Arctic heath communities from nitrogen enrichment, New Phytol., 206, 682–695, https://doi.org/10.1111/nph.13265, 2015.
Sturm, M., Racine, C., and Tape, K.: Increasing shrub abundance in the Arctic, Nature, 411, 546–547, https://doi.org/10.1038/35079180, 2001.
Sulman, B. N., Salmon, V. G., Iversen, C. M., Breen, A. L., Yuan, F., and Thornton, P. E. Integrating Arctic plant functional types in a land surface model using above- and belowground field observations, J. Adv. Model., 13, e2020MS002396, https://doi.org/10.1029/2020MS002396, 2021.
Tape, K. D., Sturm, M., and Racine, C.: The evidence for shrub expansion in Northern Alaska and the Pan-Arctic, Glob. Chang. Biol., 12, 686–702, https://doi.org/10.1111/j.1365-2486.2006.01128.x, 2006.
Tape, K. D., Hallinger, M., Welker, J. M., and Ruess, R. W.: Landscape heterogeneity of shrub expansion in Arctic Alaska, Ecosystems, 15, 711–724, https://doi.org/10.1007/s10021-012-9540-4, 2012.
Throckmorton, H. M., Heikoop, J. M., Newman, B. D., Altmann, G. L., Conrad, M. S., Muss, J. D., Perkins, G. B., Smith, L. J., Torn, M. S., Wullschleger, S. D., and Wilson, C. J.: Pathways and transformations of dissolved methane and dissolved inorganic carbon in Arctic tundra watersheds: Evidence from analysis of stable isotopes, Global Biogeochem. Cycles, 29, 1893–1910, https://doi.org/10.1002/2014GB005044, 2015.
Till, A. B., Dumoulin, J. A., Werdon, M. B., and Bleick, H. A.: Bedrock geologic map of the Seward Peninsula, Alaska, and accompanying conodont data, USGS Scientific Investigations, Map 3131, 75 pp., 2011.
Vink, S., Ford, P. W., Bormans, M., Kelly, C., and Turley, C.: Contrasting nutrient exports from a forested and an agricultural catchment in south-eastern Australia, Biogeochemistry, 84, 247–264, https://doi.org/10.1007/s10533-007-9113-3, 2007.
Vitousek, P. M., Aber, J. D., Howarth, R. W., Likens, G. E., Matson, P. A., Schindler, D. W., Schlesinger, W. H., and Tilman, D. G.: Human alteration of the global nitrogen cycle: Sources and consequences, Ecol. Appl., 7, 737–750, https://doi.org/10.1890/1051-0761(1997)007[0737:HAOTGN]2.0.CO;2, 1997.
Walvoord, M. A. and Kurylyk, B. L.: Hydrologic impacts of thawing permafrost – A review, Vadose Zone J., 15, 1–20, https://doi.org/10.2136/vzj2016.01.0010, 2016.
Weintraub, M. N. and Schimel, J. P.: Interactions between carbon and nitrogen mineralization and soil organic matter chemistry in Arctic tundra soils, Ecosystems, 6, 129–143, https://doi.org/10.1007/s10021-002-0124-6, 2003.
Weintraub, M. N. and Schimel, J. P.: Nitrogen cycling and the spread of shrubs control changes in the carbon balance of Arctic tundra ecosystems, BioScience, 55, 408–415, https://doi.org/10.1641/0006-3568(2005)055[0408:NCATSO]2.0.CO;2, 2005.
Western Regional Climate Center: RAWS USA Climate Archive, https://raws.dri.edu/cgi-bin/rawMAIN.pl?akAQTZ (last access: 3 May 2021), 2017.
Whigham, D. F., Walker, C. M., Maurer, J., King, R. S., Hauser, W., Baird, S., Keuskamp, J. A., and Neale, P. J.: Watershed influences on the structure and function of riparian wetlands associated with headwater streams – Kenai Peninsula, Alaska, Sci. Total Environ., 599, 124–134, https://doi.org/10.1016/j.scitotenv.2017.03.290, 2017.
Wullschleger, S. D., Epstein, H. E., Box, E. O., Euskirchen, E. S., Goswami, S., Iversen, C. M., Kattge, J., Norby, R. J., van Bodegom, P. M., and Xu, Z.: Plant functional types in Earth system models: past experiences and future directions for application of dynamic vegetation models in high-latitude ecosystems, Ann. Bot., 114, 1–16, https://doi.org/10.1093/aob/mcu077, 2014.
Yamashita, N., Ohta, S., Sase, H., Luangjame, J., Visaratana, T., Kievuttinon, B., and Kanzaki, M.: Seasonal and spatial variation of nitrogen dynamics in the litter and surface soil layers on a tropical dry evergreen forest slope, For. Ecol. Manage., 259, 1502–1512, https://doi.org/10.1016/j.foreco.2010.01.026, 2010.
Yano, Y., Shaver, G. R., Giblin, A. E., Rastetter, E. B., and Nadelhoffer, K. J.: Nitrogen dynamics in a small Arctic watershed: retention and downhill movement of 15N, Ecol. Monogr., 80, 331–351, https://doi.org/10.1890/08-0773.1, 2010.