the Creative Commons Attribution 4.0 License.
the Creative Commons Attribution 4.0 License.
 | 13 Apr 2022
The role of föhn winds in eastern Antarctic Peninsula rapid ice shelf collapse
Charles S. Zender
Melchior van Wessem
Sebastián Marinsek
Ice shelf collapse reduces buttressing and enables grounded glaciers to contribute more rapidly to sea-level rise in a warming climate. The abrupt collapses of the Larsen A (1995) and B (2002) ice shelves on the Antarctic Peninsula (AP) occurred, at least for Larsen B, when long-period ocean swells damaged the calving front and the ice shelf was inundated with melt lakes that led to large-scale hydrofracture cascades. During collapse, field and satellite observations indicate föhn winds were present on both ice shelves. Here we use a regional climate model and machine learning analyses to evaluate the contributory roles of föhn winds and associated melt events prior to and during the collapses for ice shelves on the AP. Föhn winds caused about 25 % ± 3 % of the total annual melt in just 9 d on Larsen A prior to and during collapse and were present during the Larsen B collapse, which helped form extensive melt lakes. At the same time, the off-coast wind direction created by föhn winds helped melt and physically push sea ice away from the ice shelf calving fronts that allowed long-period ocean swells to reach and damage the front, which has been theorized to have ultimately triggered collapse. Collapsed ice shelves experienced enhanced surface melt driven by föhn winds over a large spatial extent and near the calving front, whereas SCAR inlet and the Larsen C ice shelves are affected less by föhn-wind-induced melt and do not experience large-scale melt ponds. These results suggest SCAR inlet and the Larsen C ice shelves may be less likely to experience rapid collapse due to föhn-driven melt so long as surface temperatures and föhn occurrence remain within historical bounds.
- Article
(8883 KB) - Full-text XML
-
Supplement
(4422 KB) - BibTeX
- EndNote


Ice shelves, the floating extensions of grounded glaciers, subdue the discharge of grounded ice into the global ocean (Rignot et al., 2004; Scambos et al., 2004; Gudmundsson, 2013; Borstad et al., 2016). Re-examination of past ice shelf collapse events can help to shed light on the mechanisms of collapse and improve the understanding of ice shelf dynamics for future projections of sea-level rise (Rignot et al., 2004; Gudmundsson, 2013; Borstad et al., 2016). The final collapses of the Larsen A (LAIS) in 1995 and the Larsen B (LBIS) ice shelves in 2002 have been attributed to decreased structural integrity brought on by a combination of factors: most notably, regional atmospheric warming (Scambos et al., 2000; Mulvaney et al., 2012), extended melt seasons (Scambos et al., 2003), multi-year firn pore space depletion (Kuipers Munneke et al., 2014; Trusel et al., 2015), melt pond flooding (Glasser and Scambos, 2008; Trusel et al., 2013; Leeson et al., 2020), crevasse expansion through hydrofracture (Scambos et al., 2003; Banwell et al., 2013; Pollard et al., 2015; Alley et al., 2018; Banwell et al., 2019; Robel and Banwell, 2019), glacier structural discontinuities (Glasser and Scambos, 2008), basal melt (Pritchard et al., 2012; Rignot et al., 2013; Depoorter et al., 2013; Schodlok et al., 2016; Adusumilli et al., 2018), warm meltwater intrusion (Braun and Humbert, 2009), melting of the ice melange within rifts conducive to rift propagation (Larour et al., 2021), and regional sea ice loss allowing ocean swell flexure stress on the calving front (Banwell et al., 2017; Massom et al., 2018).
While the list of mechanisms that can destabilize ice shelves is extensive, a conceptual model for rapid ice shelf collapse proposed by Massom et al. (2018) identifies four essential prerequisites for sudden collapse: (1) extensive surface flooding and hydrofracture, (2) reduced sea ice or fast ice at the ice shelf front, (3) outer margin or terminus fracturing and rifting, and (4) initial calving trigger at the ice shelf margin. They theorize waves led to calving front damage and small calving events that breached the “compressive arch” of stability of both ice shelves proposed by Doake et al. (1988). At the same time the ice shelves were covered in extensive surface melt lakes that were unlikely to drain horizontally because of the relatively flat surface (Banwell et al., 2014). Satellite observations and ice shelf stability model studies determined the LBIS was covered with >2750 melt lakes that were on average 1 m deep before collapse (Glasser and Scambos, 2008; Banwell et al., 2013). Ice shelves inundated with surface melt lakes are susceptible to disintegration through a process known as hydrofracture, where meltwater applies outward and downward pressure to the walls and tip of crevasses that can propagate through the ice shelf (Scambos et al., 2003; Banwell et al., 2013; Bell et al., 2018; Lhermitte et al., 2020). Furthermore, melt lakes that rapidly drain by hydrofracture can create fracture patterns that split ice shelves into sections with aspect ratios that support unstable rollover and hydrofracture cascades that begin when melt lakes drain and/or calving occurs at the ice shelf terminus (Scambos et al., 2003; Banwell et al., 2013; Burton et al., 2013; Robel and Banwell, 2019). The combination of ocean swell stress on the calving front and extensive melt ponds led to large-scale hydrofracture cascades that Massom et al. (2018) proposed ultimately caused the rapid collapse of the LBIS and possibly the LAIS.
In addition to a lack of sea ice and extensive melt ponds, meteorological and satellite observations identify clear skies and warm west-northwest föhn wind at the time of collapse (Fig. 1c–f) (Rott et al., 1998; Rack and Rott, 2004; Cape et al., 2015; Massom et al., 2018). Föhn winds form when relatively cool moist air is forced over a mountain barrier, often leading to precipitation on the windward side of the barrier that dries the air mass (Grosvenor et al., 2014; Elvidge et al., 2015). As the now drier air descends the leeward slope it warms adiabatically and promotes melt directly through sensible heat exchange, and indirectly by the associated clear skies that allow additional shortwave radiation to reach the surface in non-winter months (Turton et al., 2017, 2018; Kuipers Munneke et al., 2018; Elvidge et al., 2020; Laffin et al., 2021). Föhn winds and their capacity to cause surface melt have been studied extensively on the AP. Observations and model studies on the LCIS confirm the föhn mechanism that enhances sensible heat and shortwave radiation and alters local albedo, which can increase surface melt rates upwards of 50 % compared to non-föhn conditions (Cape et al., 2015; Elvidge et al., 2015; King et al., 2015, 2017; Kuipers Munneke et al., 2012, 2018; Bevan et al., 2017; Lenaerts et al., 2017; Datta et al., 2019; Kirchgaessner, et al., 2021; Laffin et al., 2021; W. Wang et al., 2021). Late-season föhn melt reduces firn pore space and thus pre-conditions ice shelves to form melt ponds that are responsible for the increased firn density pattern east of the AP mountains on the LCIS (Holland et al., 2011; Kuipers Munneke et al., 2014; Datta et al., 2019). Föhn melt climatology studies have aimed to identify how much melt is caused by föhn and the locations most affected and found föhn winds account for up to 17 % of melt and are concentrated in the LCIS inlets (Turton et al., 2017; Datta et al., 2019; Laffin et al., 2021). Pressure gradient differences across the AP range lead to föhn winds that funnel through mountain gaps as highly concentrated föhn jets, particularly in inlets east of the AP range (Luckman et al., 2014; Elvidge et al., 2015; Kuipers Munneke et al., 2012; Grosvenor et al., 2014). In addition to enhancing surface melt rates, föhn winds exert force on sea/fast ice and drag it away from the calving front, thereby exposing the front to ocean waves (Bozkurt et al., 2018). Climatic studies of the Larsen B embayment indicate that föhn winds were coincident with collapse (Rack and Rott, 2004; Leeson et al., 2017). However, it is unknown if concentrated föhn jets spilled onto the former LAIS and LBIS and, if so, whether those föhn winds contributed to their collapse. The following questions, therefore, arise. (1) To what extent did föhn-induced melt contribute to the surface melt budget on each eastern AP ice shelf? (2) Did föhn winds and associated melt play a role in triggering the collapses of the LAIS and LBIS? (3) What are the implications of föhn-induced melt for the remaining eastern AP ice shelves?
To address these questions we consider three metrics: Sect. 3.1 explores the total annual surface melt quantity induced by föhn winds and how melt is spatially distributed across each ice shelf; Sect. 3.2 identifies the coincidence of föhn-induced melt preceding and during the collapse events, and the estimated melt-lake depth in response to melt events.; Sect. 3.3 identifies the contribution of föhn melt to the climatological surface liquid water budget, comparing collapsed and extant ice shelves on the eastern AP. By constructing a timeline of melt and melt mechanisms and comparing melt metrics with collapsed and extant ice shelves, we can identify the factors contributing to collapse.
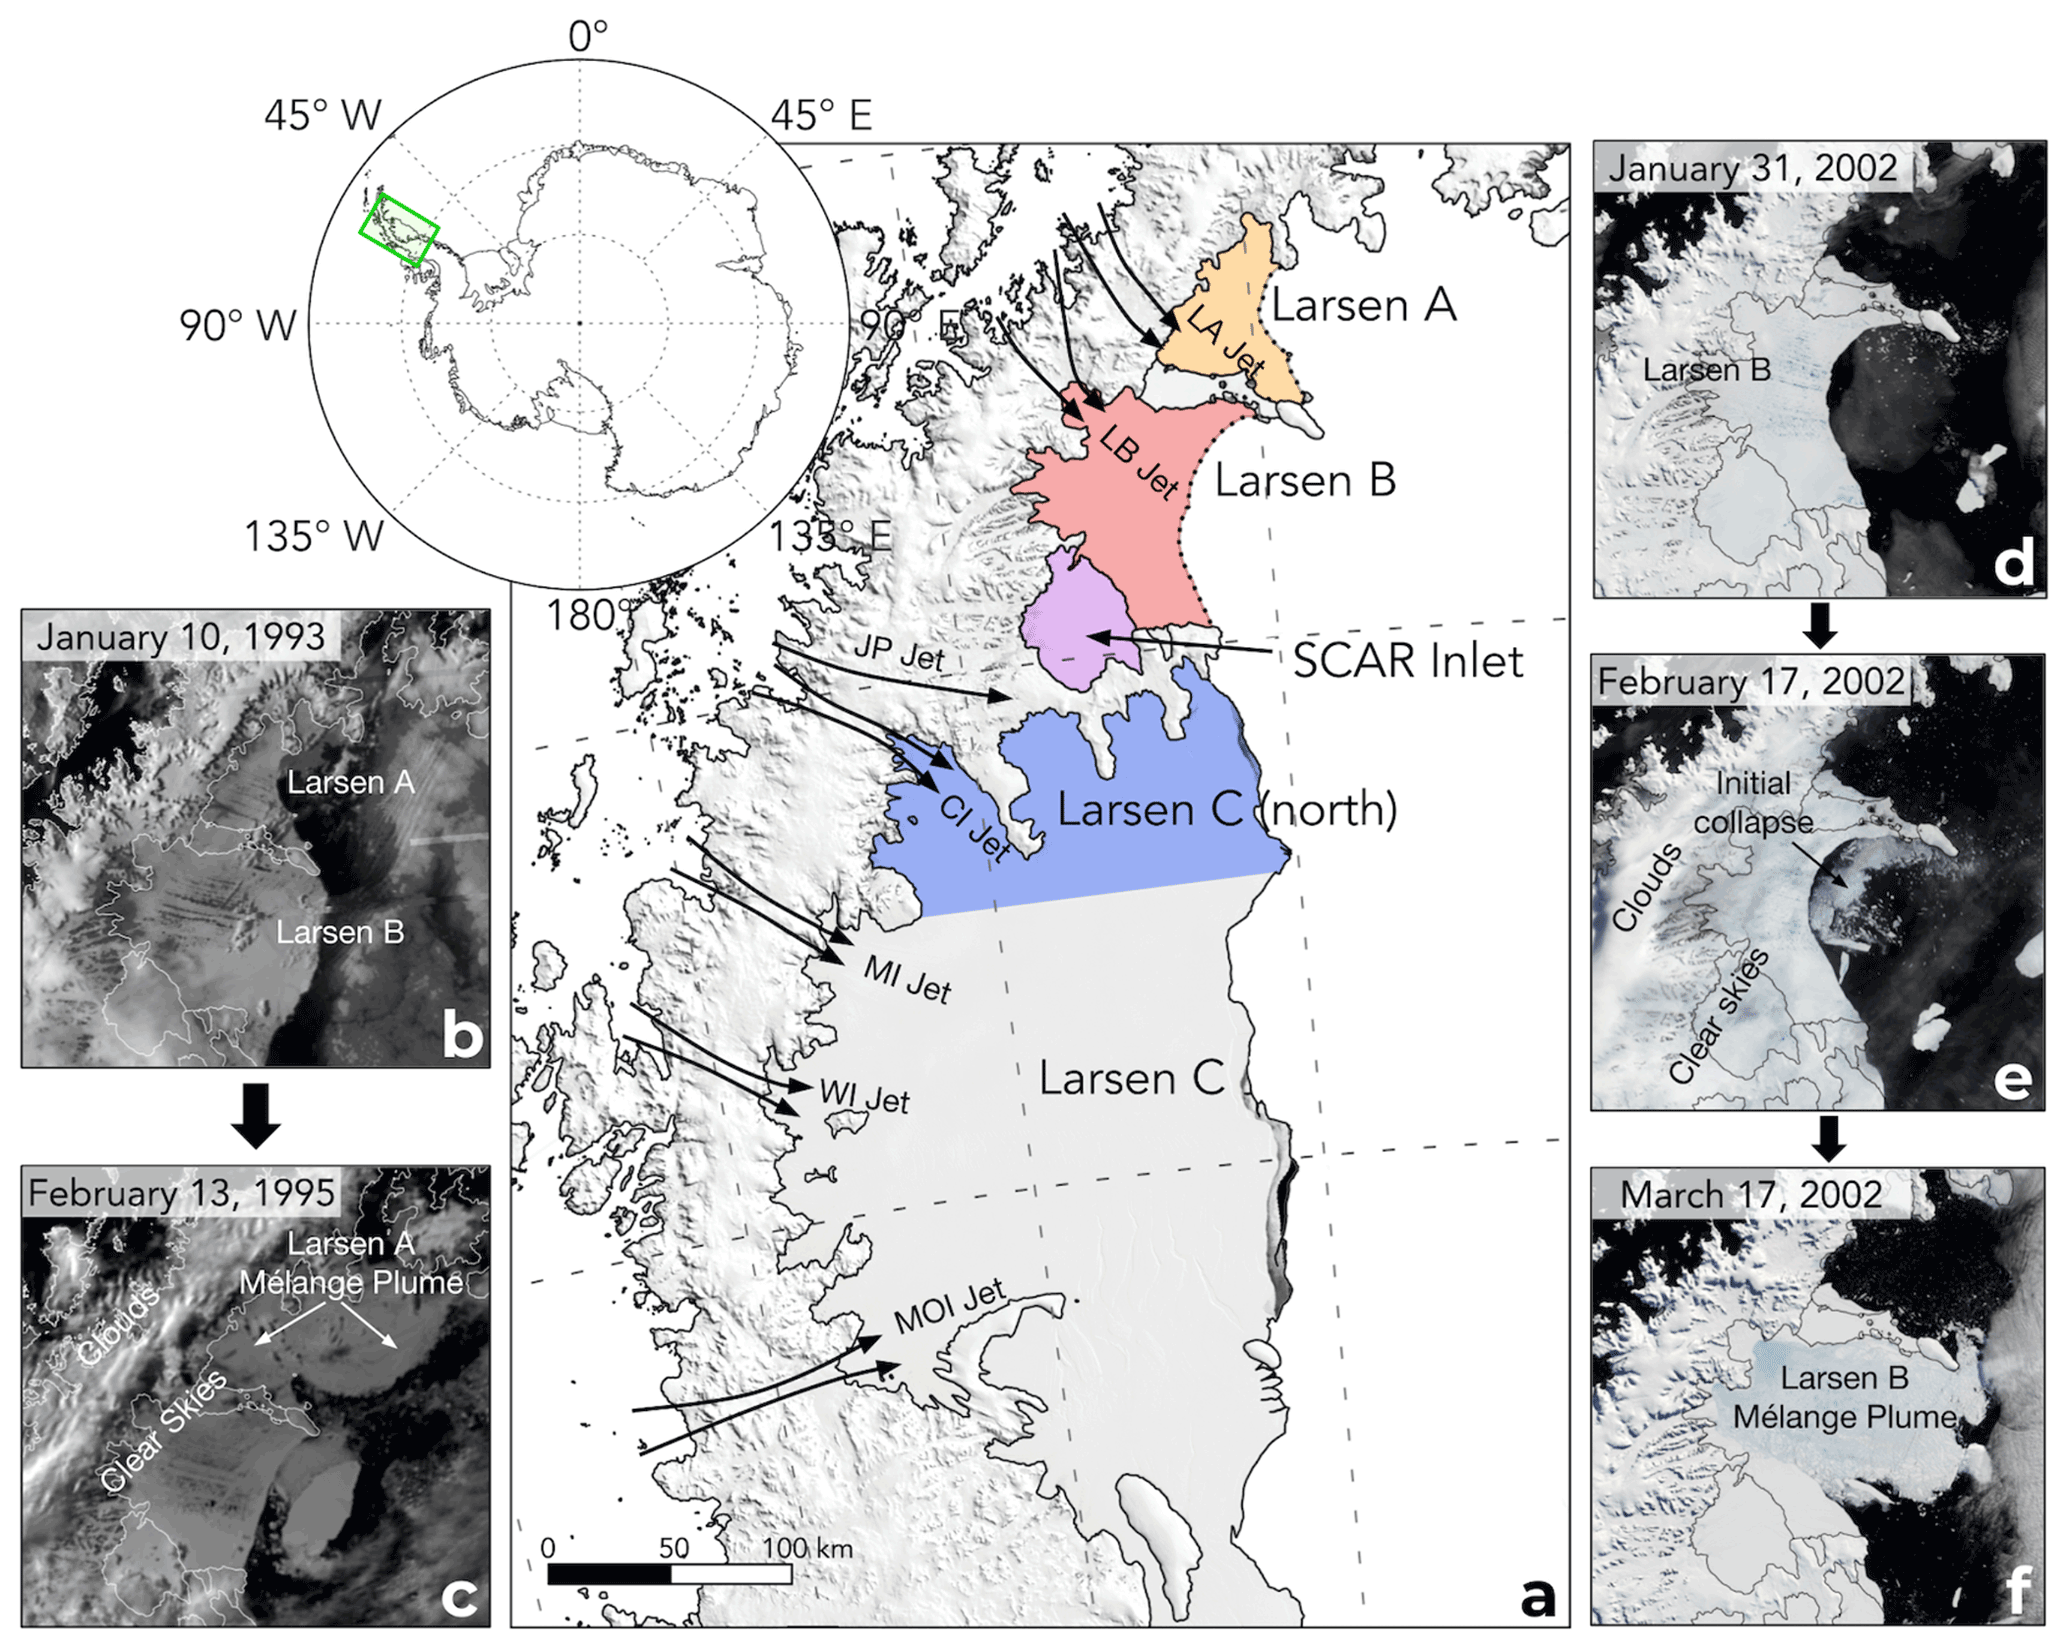
Figure 1Map of the northern Antarctic Peninsula (a) showing locations of collapsed ice shelves (LAIS – 25 January 1995, LBIS – 9 February 2002), extant ice shelves (SCAR inlet and LCIS), and föhn jets (Larsen A jet (LA jet), Larsen B jet (LB jet), Jason Peninsula jet (JP jet), Cabinet inlet jet (CI jet), Mill inlet jet (MI jet), Whirlwind inlet jet (WI jet), Mobil Oil inlet jet (MOI jet)) with a MODIS Mosaic overlay. The colored regions indicate how this study separates ice shelves for climatic analysis. The dotted lines show the former extent of the Larsen A and Larsen B ice shelves at the time of collapse. Panels (b)–(f) are satellite images of the collapses of the LAIS and LBIS. (b) AVHRR (Advanced Very High-Resolution Radiometer) image of the northern AP 2 years before the collapse of the LAIS showing melt lakes on the surface of both ice shelves. (c) AVHRR image after the collapse of the LAIS. (d) NASA-provided MODIS (Moderate Resolution Imaging Spectroradiometer) image showing the LBIS days before collapse began. (e) MODIS image showing a föhn wind event (clouds over the western AP, clear skies over the ice shelves) along with the initial collapse of the LBIS. (f) MODIS image of the complete collapse of the LBIS.
2.1 Regional Climate Model 2 Simulation (RACMO2)
We base our analysis on 3-hourly output from simulations by the Regional Atmospheric Climate Model 2 (RACMO2), version 2.3p2, with a horizontal resolution of 5.5 km (0.05∘) focused on the AP from 1979–2018. RACMO2 uses the physics package CY33r1 of the ECMWF Integrated Forecast System (IFS) (https://www.ecmwf.int/en/elibrary/9227-part-iv-physical-processes/ ECMWF, 2009, last access: 6 April 2022) in combination with atmospheric dynamics of the High-Resolution Limited Area Model (HIRLAM). When RACMO2 surface simulations are compared with AWS observations on the LCIS, surface air temperature has a slight warm bias likely because model resolution and shortwave–longwave radiation are over- or underestimated due to underestimation of clouds and moisture but overall reproduce surface observations (King et al., 2015; Leeson et al., 2017; Bozkurt et al., 2020; Laffin et al., 2021).
2.2 Föhn wind detection
We use the föhn detection algorithm (FöhnDA) that identifies föhn winds that cause melt using 12 automatic weather stations (AWSs) on the AP previously developed and detailed in Laffin et al. (2021). FöhnDA identifies föhn-induced melt events using binary classification machine learning when 10 m air temperature (T) is greater than 0 ∘C, which ensures it captures föhn events that cause surface melt. Thresholds for relative humidity (RH) and wind speed (WS) are more dynamic because high wind speeds and low relative humidity do not guarantee temperatures above freezing; they only aid to identify föhn. FöhnDA uses quantile regression to identify these variable thresholds that take into account the climatology and seasonality at each AWS site. FöhnDA uses two empirically determined thresholds: the 60th percentile wind speed and 30th percentile relative humidity, which are 2.85 m s−1 and 79 % averaged at all AWS locations. We co-locate AWS with the nearest model grid cell and use FöhnDA results to train a machine learning (ML) model that detects föhn winds in RACMO2 output. Our ML model improves the accuracy of föhn detection by over 23 % when compared to the simple binary classification method applied to RACMO2 output as described above. A sensitivity study detailed in Laffin et al. (2021) compares previous föhn detection methods (Cape et al., 2015; Datta et al., 2019) and shows that FöhnDA allows us to use in situ observations from AWS and expand föhn detection with RACMO2 output to regions and times when AWS observations are not available (Fig. S1, Table S1).
Föhn jet locations were identified using wind direction and strength during föhn events (Fig. 2a) and by the surface melt pattern during föhn (Fig. 3b). The RACMO2 topography pixel size is 5.5 km, which is sufficient to produce the föhn jets identified on the LCIS (Elvidge et al., 2015) and allows for new föhn jet identification on the LAIS and LBIS despite lack of direct observation. However, föhn winds funneled through local canyons and mountain gaps smaller than 5.5 km are not directly simulated. Therefore, we consider RACMO2-simulated estimates of surface melt caused by föhn winds to be conservative and likely greater in regions where föhn winds are funneled and concentrated.
2.3 Ice shelf intercomparison analysis
We split the ice shelves into areas shown in Fig. 1a (Larsen A, Larsen B, SCAR inlet, Larsen C (north), and Larsen C) and take the average of all model grid cells annually to create a climatology of surface melt, melt rate, melt hours, and surface temperature. We use a two-tailed t-test statistic to identify if the mean surface temperature and mean surface melt of both ice shelves are statistically different from one another at the 95 % confidence interval. We compare all ice shelves to the LBIS because it was the most recent collapse event and is adjacent to collapsed and existing ice shelves. Qualitatively similar results are obtained when comparing all ice shelves to the LAIS.
To compare ice shelf liquid water budgets, we use a liquid-to-solid ratio (LSR) as a crude proxy for available firn air content and can be estimated as
where areas with LSR <1 represent an ice shelf that receives more solid precipitation than liquid water and is therefore less likely to saturate with liquid water and form melt lakes than areas with LSR >1.
2.4 Sea ice concentration analysis
We used 3-hourly meteorological data of sea ice concentration from the European Center for Medium-Range Weather Forecasts (ECMWF) ERA5 reanalysis (Hersbach et al., 2020). These data are available at a horizontal resolution of about 30 km or 0.28∘. ERA5 is created by assimilated satellite and in situ observations into ECMWF's Integrated Forecast System (IFS). We compare sea ice concentration to the occurrence of föhn wind events to identify how föhn winds impact sea ice concentration. We measure the mean sea ice concentration of the ocean 90 km directly east of each ice shelf (Larsen A, Larsen B, and Larsen C) in the Weddell Sea. We explore the relationship of summer föhn wind occurrence and summer (DJF) sea ice concentration using a statistical Pearson correlation method. When föhn winds are present, we compare the mean of all sea ice concentration pixels in the designated ice shelf region for all years from 1979 to 2018.
3.1 Föhn jets and melt
Using RACMO2 historical simulations, informed by a machine learning algorithm (FöhnDA) that is trained with AWS observations (Laffin et al., 2021), we identify seven recurring föhn jets or “gap winds” that lead to high surface melt rates on the eastern AP ice shelves (Fig. 2a). Four of these jets (CI, MI, WI, MOI) have been studied using airborne observations and model simulations (Grosvenor et al., 2014; Elvidge et al., 2015). The remaining three jets (LA, LB, and JP) are, to our knowledge, identified here for the first time. Overall, winds from the west and northwest direction lead to increased surface melt rates that can be up to 53 % higher than melt when the wind is from other directions (Fig. 2c) (van den Broeke, 2005). Additionally, the degree to which föhn winds impact surface melt on each ice shelf varies depending on föhn jet existence, location, and wind strength (Wiesenekker et al., 2018). These variations in föhn jet location may provide insight into why SCAR inlet and the LCIS remain intact while the LAIS and LBIS have collapsed other than the significant difference in annual surface temperature (Cook and Vaughan, 2010; Bozkurt et al., 2020; Carrasco et al., 2021).

Figure 2(a) The northern AP showing the RACMO2-simulated wind speed and direction vectors on 24 January 1995, just before the collapse of the LAIS. Föhn jet locations are indicated with names. (b) RACMO2 annual average föhn melt hour percent of total melt hours, föhn melt percent of total melt for each ice shelf from 1980–2002, and percent of total hours föhn winds occur from 1980–2002. (c) RACMO2 melt rate as a function of wind direction averaged for all ice shelf regions on the AP from 1980–2002.
Surface melt production is more pronounced under the influence of föhn jets, particularly for the LA and LB jets, which produce 35.7 % and 31.8 % more melt, respectively, compared to regions not in the path of a föhn jet on each ice shelf (Fig. 3). Föhn-induced surface melt accounts for 42 % of the total annual melt between 1979 and 2002 on the LAIS and 51 % of total melt on the LBIS but only represents 21 % and 25 % of total melt hours on the LAIS and LBIS (Figs. 2b, 3c). In locations directly influenced by föhn jets, the mean annual föhn-induced melt was as high as 61 % on the LAIS and 57 % on the LBIS of total annual melt. By contrast, föhn-induced melt accounts for only 25 % of 1979–2002 total melt on SCAR inlet and 17 % on the LCIS. SCAR inlet is not directly impacted by a föhn jet but still experiences clear skies and weak föhn influence from the overall descending air during föhn events. The LCIS is affected by numerous föhn jets (CI, MI, WI, MOI), accounting for up to 40 % of the total annual melt in Cabinet and Whirlwind inlets, decreasing with distance east of the AP mountains. The stark contrast in surface melt amount and fraction caused by föhn winds on collapsed vs. intact ice shelves implicates föhn melt as a contributor to the LAIS and LBIS collapses. A clearer picture of the role of föhn winds emerges after we examine föhn-induced melt extent and timing.
The spatial distribution and extent of surface melt influence ice shelf stability. Surface melt and melt lakes near the ice shelf terminus can lead to calving front collapse and structural instability for the remaining portion of the ice shelf (Depoorter et al., 2013; Pollard et al., 2015). Consistent with this mechanism, the LA and LB föhn jets impact a large spatial area of the LAIS and LBIS and reach the ice shelf calving fronts (Fig. 3b). SCAR inlet lacks a strong föhn jet/influence and does not regularly experience large-scale melt lakes even during high-melt years (Fig. 1b–f). This helps explain why SCAR inlet is still intact, despite decreased sea ice buttress force and major structural changes observed after the collapse of the LBIS (Borstad et al., 2016; Qiao et al., 2020). LCIS on the other hand is impacted by four major jets and regularly experiences föhn-induced melt lakes, particularly in Cabinet inlet. However, the vast size of the LCIS limits the amount of föhn-induced melt at the terminus. The föhn melt mechanism breaks down by mixing with cold air, which reduces the intensity of the föhn jets from their peak at the base of the AP mountains to the calving front (Fig. 3b) (Elvidge et al., 2015; Turton et al., 2018). Having established that föhn winds significantly enhanced surface melt overall (Cape et al., 2015; Elvidge et al., 2015; Datta et al., 2019) and at the crucial calving front of LAIS and LBIS, we now examine the timing of föhn-induced melt events relative to collapse.
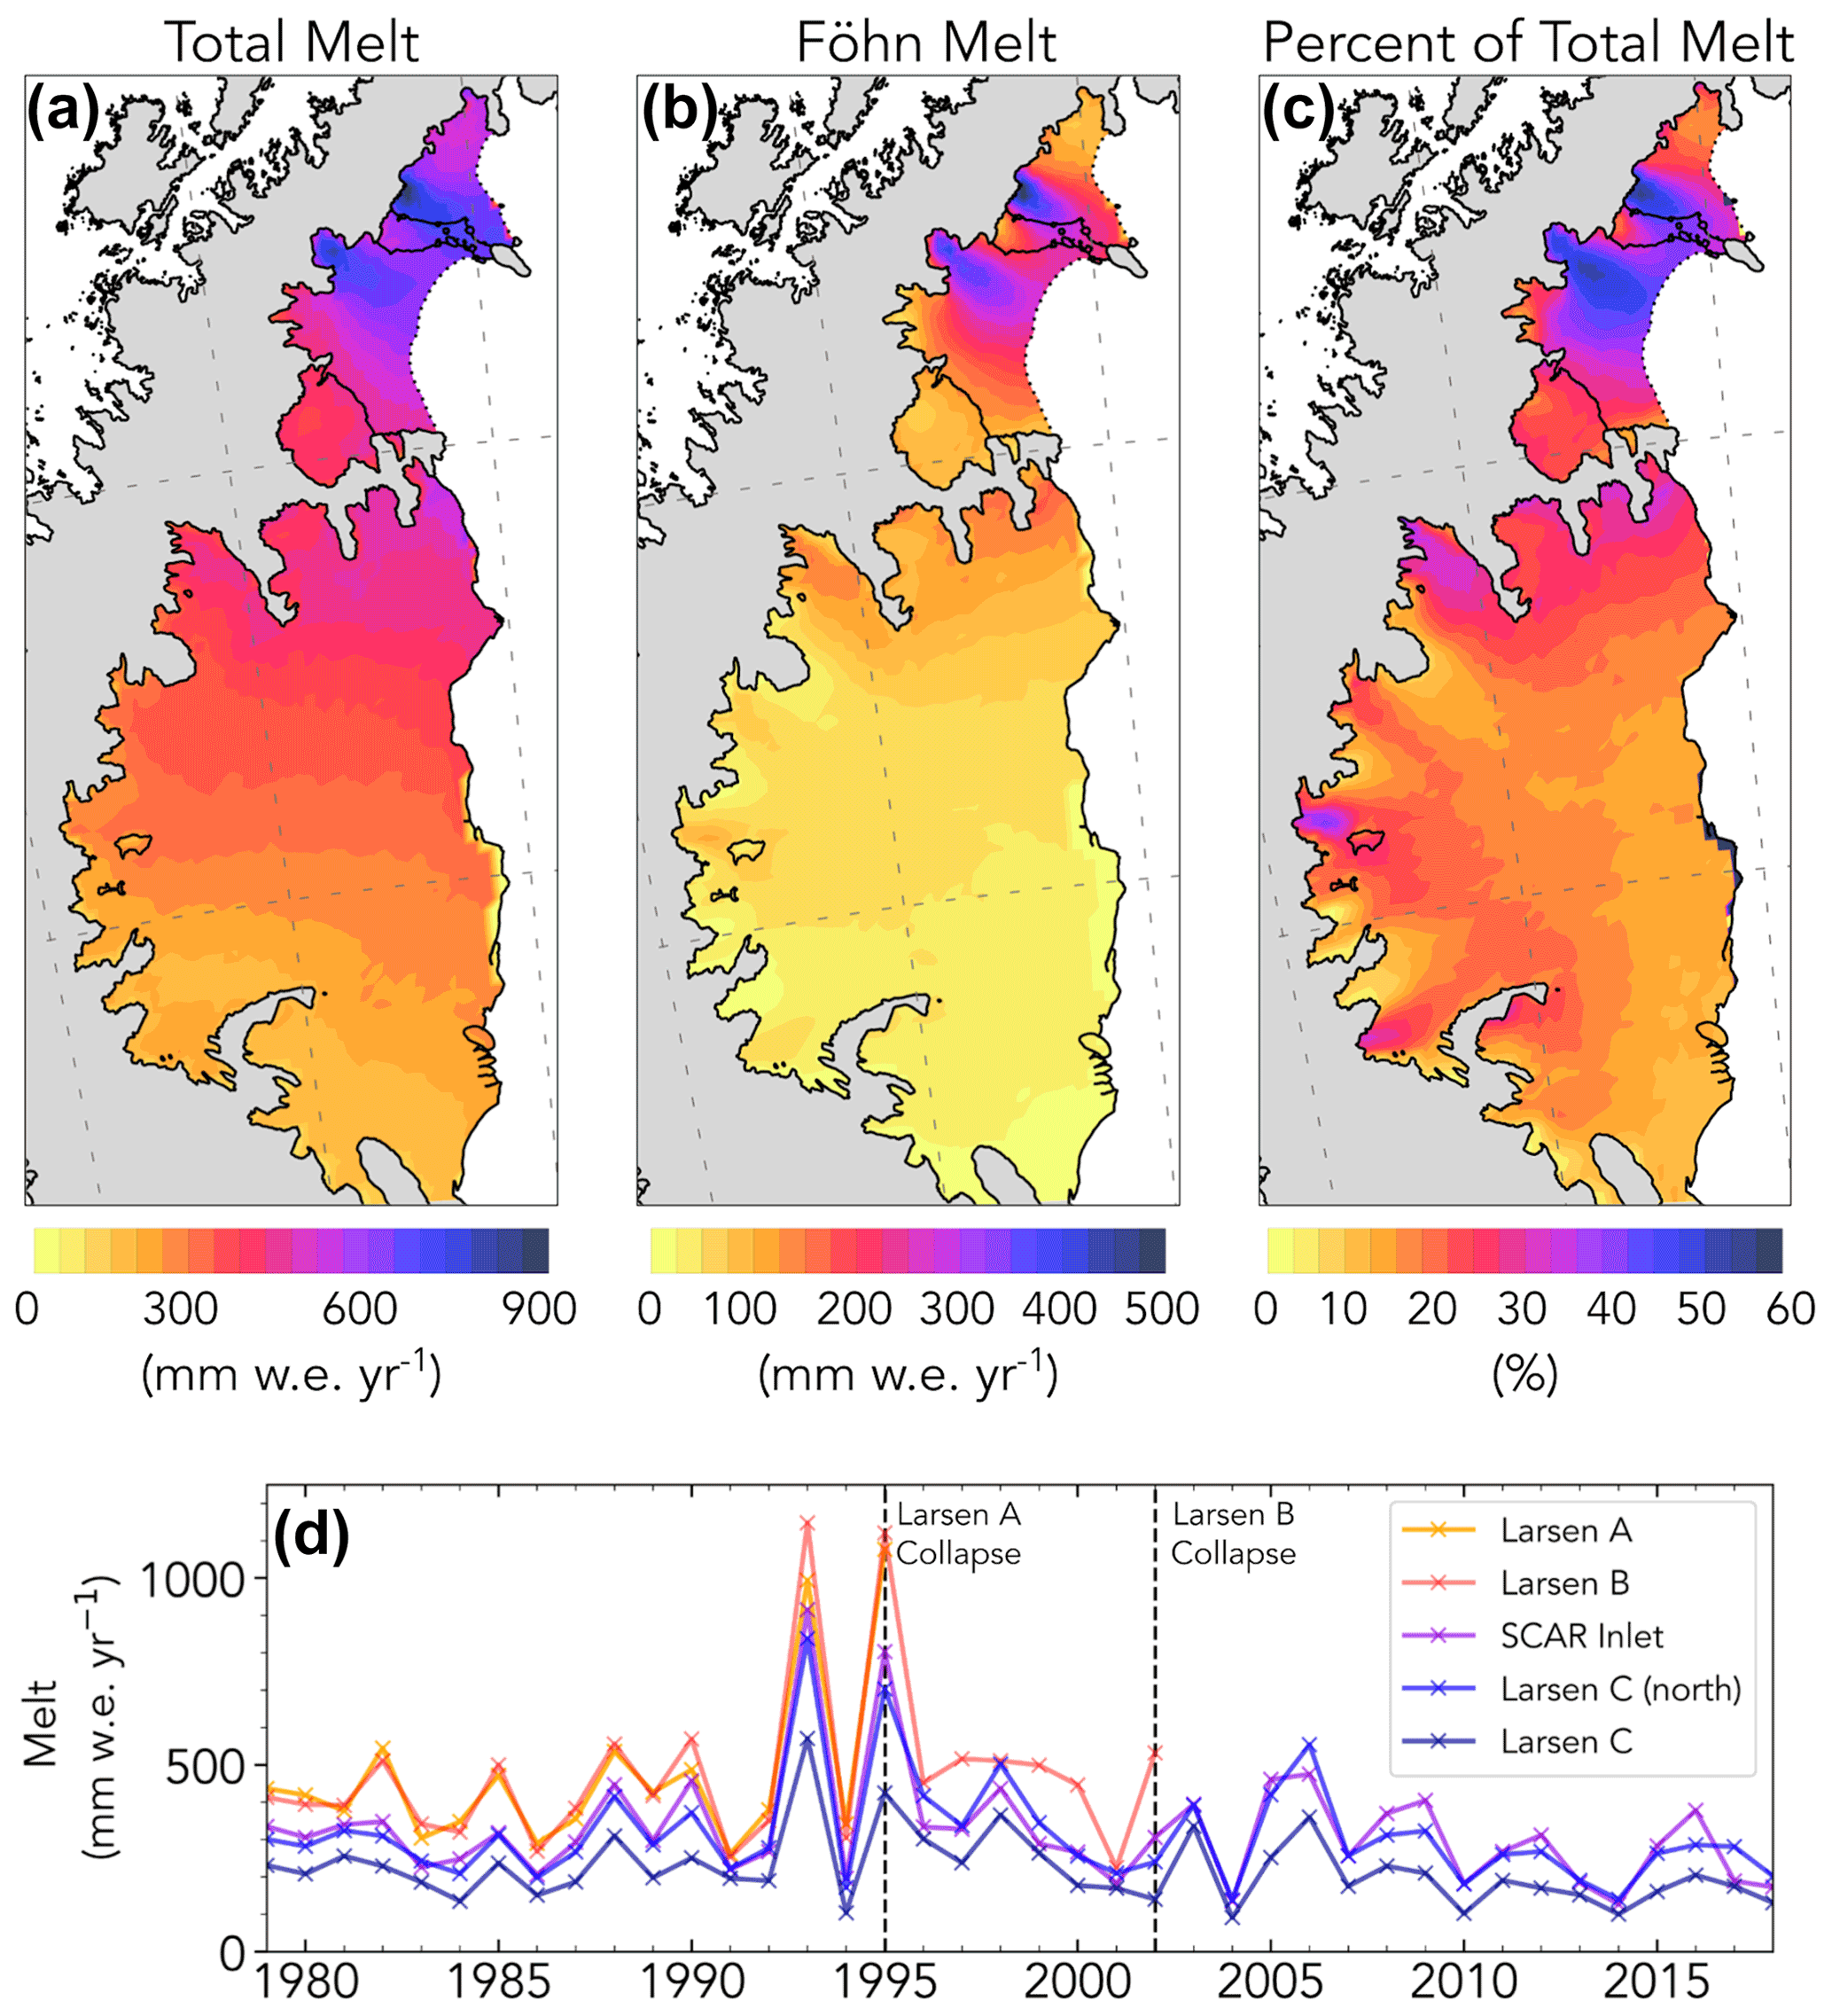
Figure 3(a) RACMO2 average annual melt from 1980–2002. (b) RACMO2 average annual föhn wind-induced melt from 1980–2002. (c) RACMO2 percent of total melt concurrent with föhn wind from 1980–2002. (d) RACMO2 time series of the mean annual surface melt on each ice shelf from 1979–2018. Dashed vertical lines indicate the year in which each ice shelf collapsed. Note that the Larsen B graph often overlaps the Larsen A curve.
3.2 Coincidence of föhn winds with collapse
3.2.1 LAIS
Three föhn wind events occurred on LAIS between 18 and 27 January 1995, overlapping with the initial phase of the LAIS collapse that began on 25 January (Fig. 4b) (Rott et al., 1998). These föhn events helped contribute to the collapse of the ice shelf in two ways: (1) enhanced surface melt rates caused by the LA jet led to extensive melt lakes across the ice shelf that possibly promoted large-scale hydrofracture cascades because of the rapid (days to weeks) nature of collapse (Banwell et al., 2013), and (2) the west-northwest wind direction actively pushed or melted sea ice and fast ice away from the calving front, allowing ocean waves to reach the ice shelf terminus (Rott et al., 1996; Massom et al., 2018). The föhn wind events prior to and during collapse lasted an average of 3 d each and produced increased surface melt greater than any other 9 d period from 1979–2018, with mean cumulative melt of 268.5 mm w.e. or 25.2 % of the total annual melt in the 1994/1995 melt season. Total melt during the 1994/1995 melt season was 127 % higher than an average year (474 mm w.e. yr−1) and the 9 d föhn wind event produced 57 % of the total melt of an average melt year. Therefore this 9 d föhn-induced melt event and melt year are clearly anomalous in the observational record. We also identify a negative correlation between the occurrence of föhn winds and sea ice concentration on all eastern AP ice shelves (Fig. 5a), which is more correlated with föhn wind occurrence than air temperature (Fig. 5b). When föhn winds occur on the AP, sea ice concentration decreases, which is consistent with other wind types in Antarctica (katabatic winds) that form perennial wintertime polynya (Fig. 5c–e) (Bromwich and Kurtz, 1984; Bozkurt et al., 2018; X. Wang et al., 2021). At the start of the 9 d föhn event, sea ice concentration east of the LAIS was at or near 100 %, but by the time collapse began, sea ice concentration dropped significantly (Fig. 5d–e).
We next examine the contribution of föhn-generated melt to other observables implicated in the collapse, namely surface liquid water, melt lake depth, and melt lake extent (Scambos et al., 2003). We estimate the spatial extent and depth of melt lakes prior to collapse on the LAIS using satellite images of melt lake surface area combined with model-simulated available liquid water volume. The cumulative spatial melt pattern between 18 and 27 January 1995 identifies significant melt on the LAIS ranging from 157–356 mm w.e. (Fig. S2a), varying spatially with the influence of the LA jet. Satellite imagery of the LAIS during the collapse in progress shows melt lakes were present (Fig. S3). However because the collapse had already begun, it is likely many of the lakes had drained or had been altered, so estimating melt lake extent is not possible. However, Advanced Very High-Resolution Radiometer (AVHRR) imagery on 8 December 1992 provides high-resolution cloudless images of the ice shelf taken at the end of a similar föhn-induced melt event during a year when melt was comparable to the 1994/1995 melt season. Therefore we consider this melt lake extent analogous to the 1994/1995 melt season (Fig. 4a). We find the melt lake surface area was likely between 5.1 %–10.8 % (103–219 km2) of the total LAIS surface area (Fig. S2b). Melt lake surface area is likely underestimated because the image was taken early in the 1992/1993 melt season and does not easily identify small lakes or river systems. Liquid water pooling on the ice surface is modulated by the local topography. If we assume all the available surface liquid water during the 9 d melt period, minus evaporation, runoff, and refreeze, forms lakes that cover the same estimated surface area as the 1992/1993 melt season, we can estimate melt lake depth during the initial collapse. We find mean melt lake depth to be between 1.38–6.86 m depending on lake location and föhn influence, which exceeds the average lake depth of the LBIS lakes prior to collapse (1 m) (Banwell et al., 2014) and the modeled lake depth (5 m) that could lead to large-scale hydrofracture cascades, especially under the influence of the LA jet (Banwell et al., 2013).
3.2.2 LBIS
A föhn wind event coincided with the initial LBIS collapse on 9 February 2002, with two events just prior to collapse and three additional events before complete collapse by 17 March 2002 (Fig. 4c). Föhn events in the LBIS 2001/2002 melt season were relatively short, averaging less than 24 h per event, and produced melt rates 27 % higher than non-föhn melt that year and 39 % of the average föhn melt rate in all other years (Fig. 4e). Similar to the LAIS collapse, the off-coast wind direction and enhanced surface melt rates during the föhn wind event helped push sea ice away from the calving front and contributed to surface melt lakes that led to hydrofracture and collapse (Fig. 5a) (Massom et al., 2018). Additionally, previous high-melt-rate föhn events such as those in the 1992/1993 and 1994/1995 melt seasons likely preconditioned the LBIS through firn densification to support melt lake formation, discussed in Sect. 3.3.

Figure 4RACMO2 time series of surface melt production and cumulative melt during the Antarctic melt season averaged over the indicated ice shelf. Grey shading indicates the presence of föhn winds. (a) 1992/1993 LAIS. (b) 1994/1995 LAIS. (c) 1992/1993 LBIS. (d) 1994/1995 LBIS. (e) 2001/2002 LBIS. Note the surface melt that occurs after the collapse events indicated by the dashed vertical lines in (b) and (e) is an estimate of melt quantity if the ice shelves did not disintegrate.
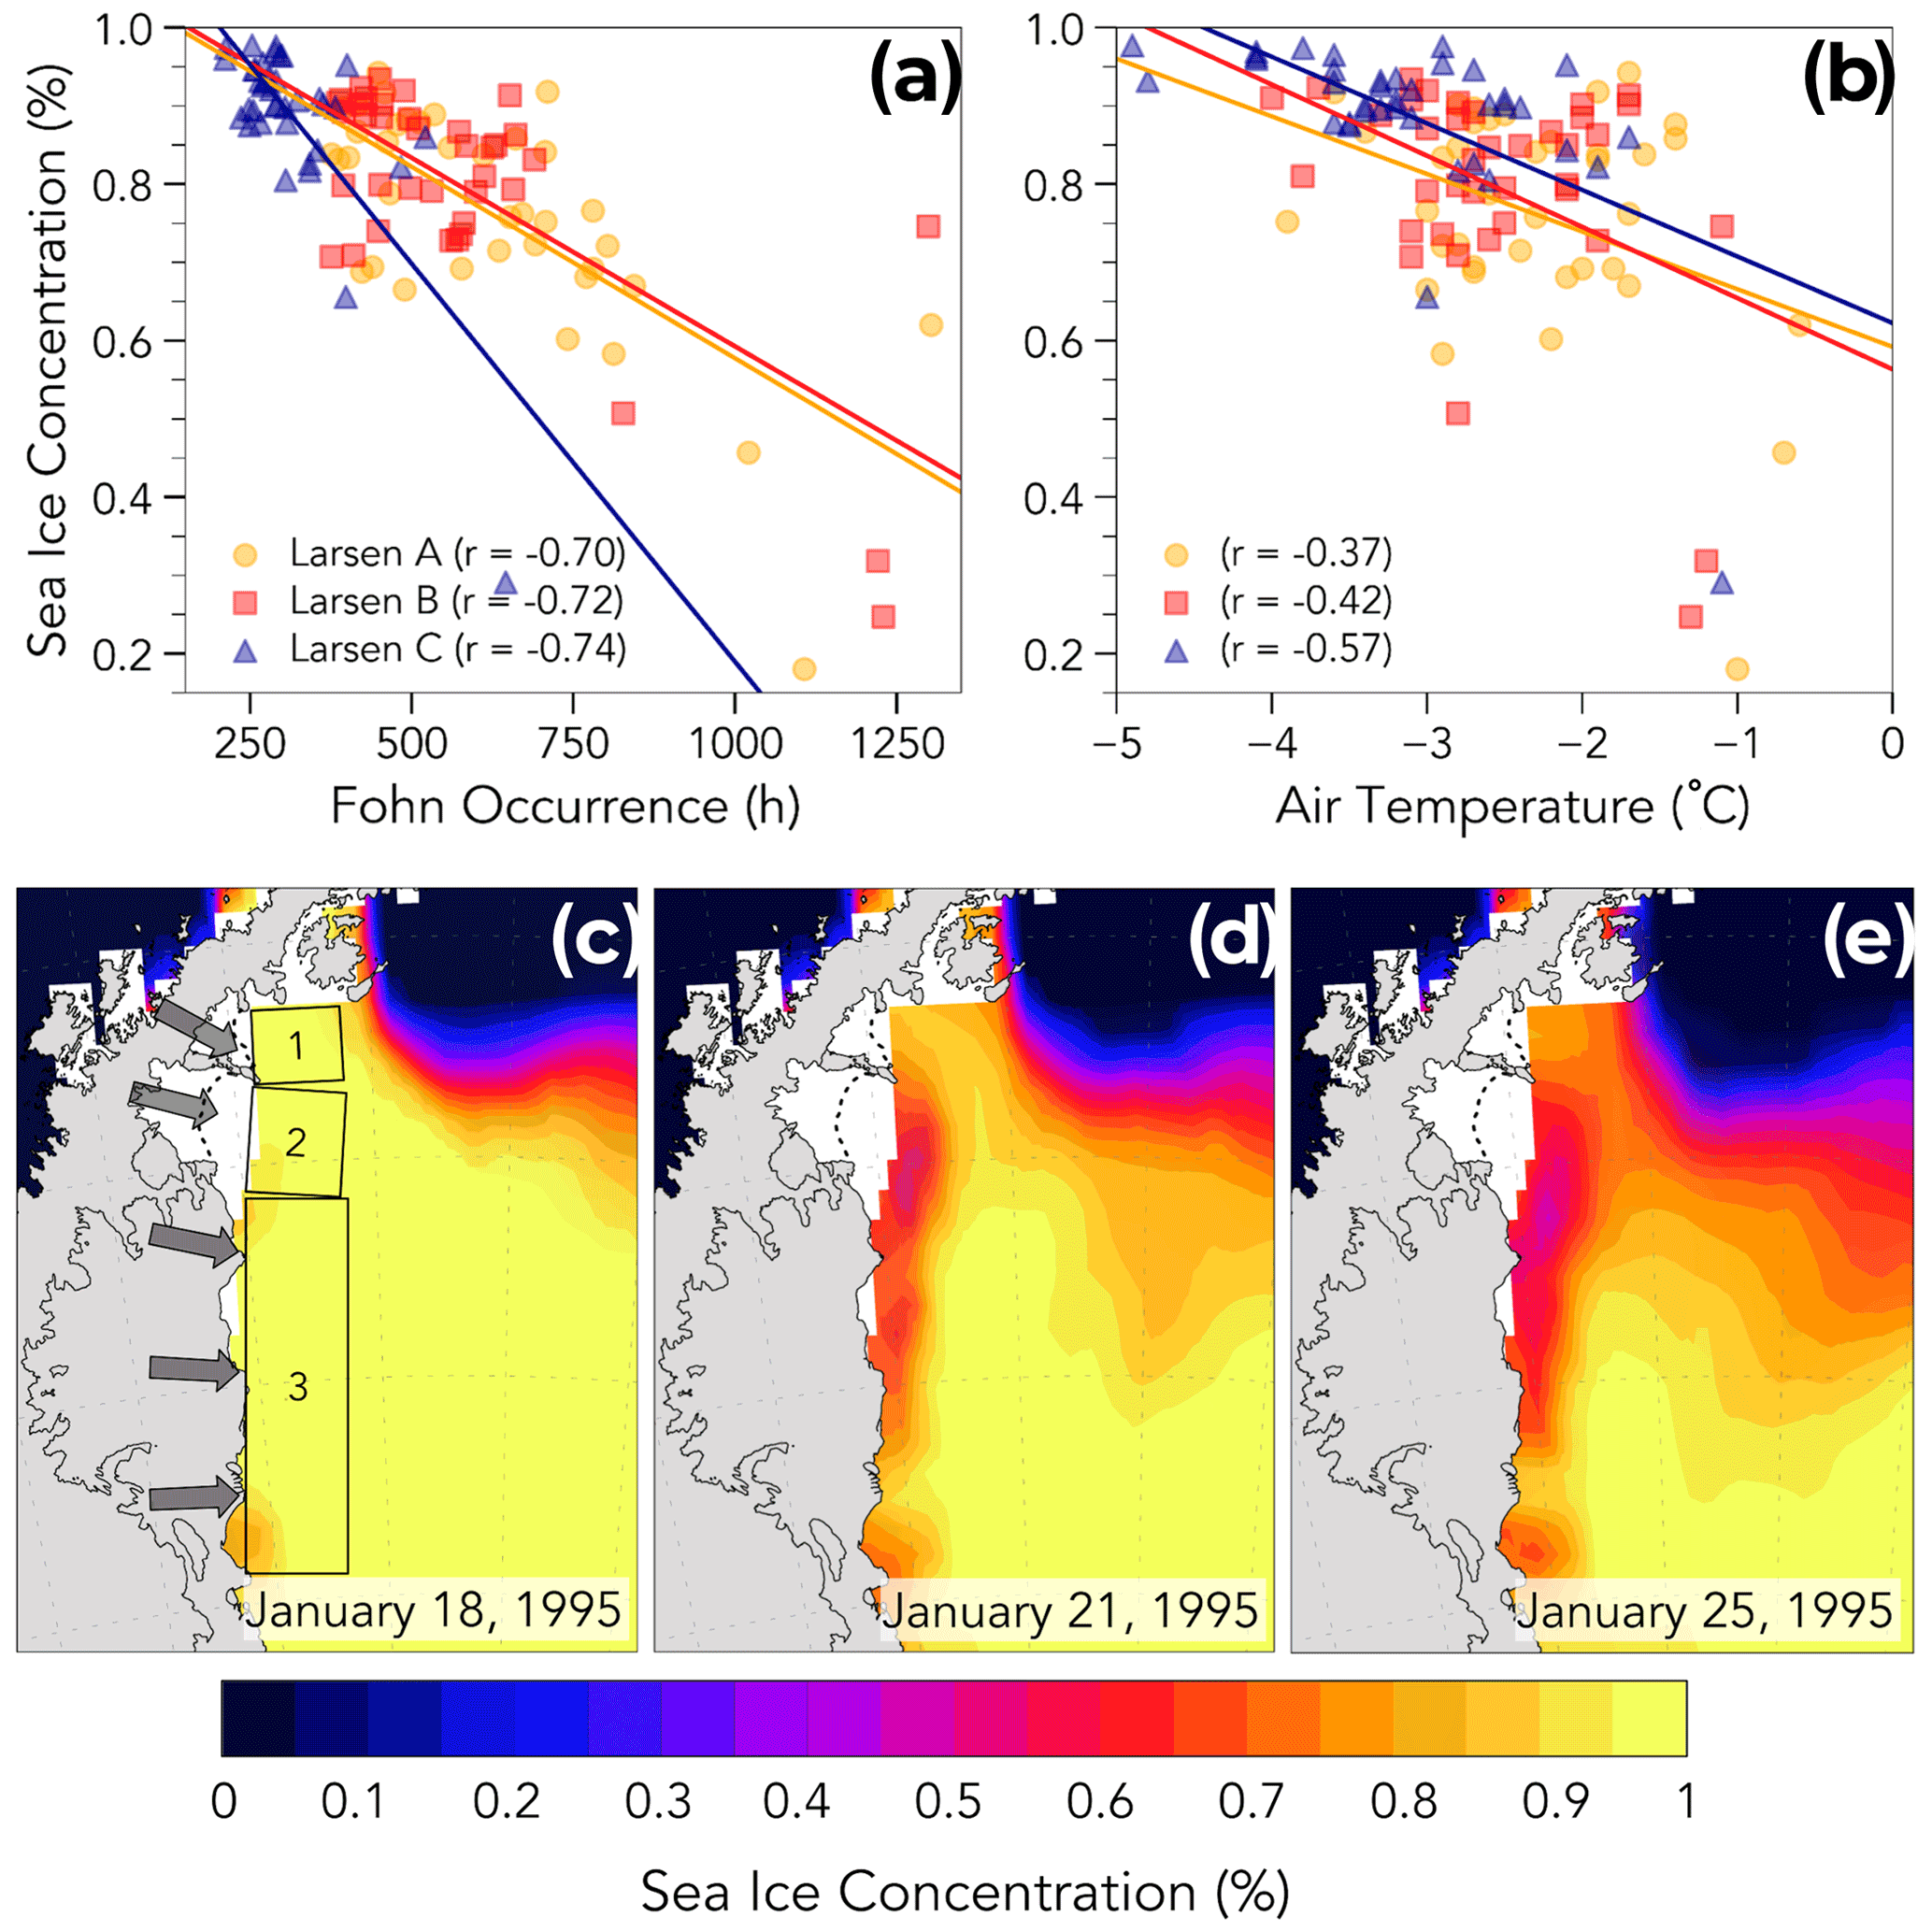
Figure 5(a) Scatter plot of ERA5 summer (DJF) sea ice concentration and RACMO2-identified föhn occurrence hours on each ice shelf from 1979–2018. (b) Scatter plot of ERA5 summer (DJF) sea ice concentration and RACMO2 mean summer air temperature on each ice shelf from 1979–2018. ERA5 sea ice concentration at the start of a 9 d föhn melt event (c), in the middle of the event (d), and on the day of initial phase of the LAIS collapse (e). Grey arrows indicate the mean föhn wind direction, and the numbered boxes indicate the sea ice study region associated with the adjacent ice shelf for the correlation analysis (LAIS (1), LBIS (2), LCIS (3)).
3.3 Föhn melt and the surface liquid water budget
To better understand the role that föhn winds play in eastern AP ice shelf surface melt and stability, we intercompare melt climatologies and the surface liquid water budget of all eastern AP ice shelves (Larsen A, Larsen B, SCAR inlet, Larsen C). A comparison of collapsed with intact ice shelves yields a clearer picture of the effects föhn winds have on ice shelf stability. We identify whether annual surface melt production, melt rate, melt hours, and surface temperature variables from 1980–2002 are significantly different from the LBIS (Fig. 6 and corresponding two-tailed t-test statistics in Table S2). We compare to LBIS because it was centered between other ice shelves and was the most recent to collapse. Total surface melt production on every ice shelf except LAIS differs significantly from LBIS melt (mean annual melt over the ice shelf area: LAIS – 476 mm w.e., LBIS – 479 mm w.e., SCAR – 353 mm w.e., Larsen C (north) – 336 mm w.e., LCIS – 238 mm w.e.) (Fig. 6a), which is expected when we consider the latitudinal location and mean annual air temperature (Fig. 6d) (Table S2). However, when föhn-induced melt is subtracted from total melt, the mean annual surface melt production on SCAR inlet and Larsen C (north) is not statistically different from the LBIS (LAIS – 337 mm w.e., LBIS – 321 mm w.e., SCAR – 286 mm w.e., Larsen(north) – 278 mm w.e., LCIS – 203 mm w.e.) (Fig. 6b). In other words, with the exception of föhn-induced melt (Fig. 6c), melt production on SCAR inlet and LCIS is statistically indistinguishable at the 95 % confidence interval from LBIS melt production. Föhn-wind-induced surface melt impacted collapsed ice shelves significantly more than SCAR inlet and the LCIS, which further defines föhn melt as an important contributor to the LAIS and LBIS melt budget.
Our analysis of firn density or available firn pore space identifies significant differences in ice shelves that have collapsed (LAIS, LBIS) and those that remain intact (SCAR inlet, LCIS). The liquid-to-solid ratio (LSR) is a crude proxy for available firn air content, with extant ice shelves (SCAR inlet, LCIS) having an LSR just above 1 for the period 1980–2002 if all surface melt is included (Fig. 7a). The LSR for LAIS and LBIS is also just above 1 for this period, though only if föhn-induced surface melt is excluded (Fig. 7b). When surface melt caused by föhn wind is included, LSR exceeds 1.5 throughout extensive regions, including the ice shelf margins, of the LAIS and LBIS. Thus the collapsed ice shelves experienced climatological LSRs significantly larger than the SCAR inlet and the LCIS, mainly due to föhn-induced melt. It is important to note that there is evidence that the LCIS experiences regions of firn densification through melt processes; however these regions are mostly focused close to the AP mountains, likely formed from the location of föhn jets (Hubbard et al., 2016). This result suggests that föhn-induced melt helped precondition the LAIS and LBIS to produce extensive melt lakes by long-term firn densification.
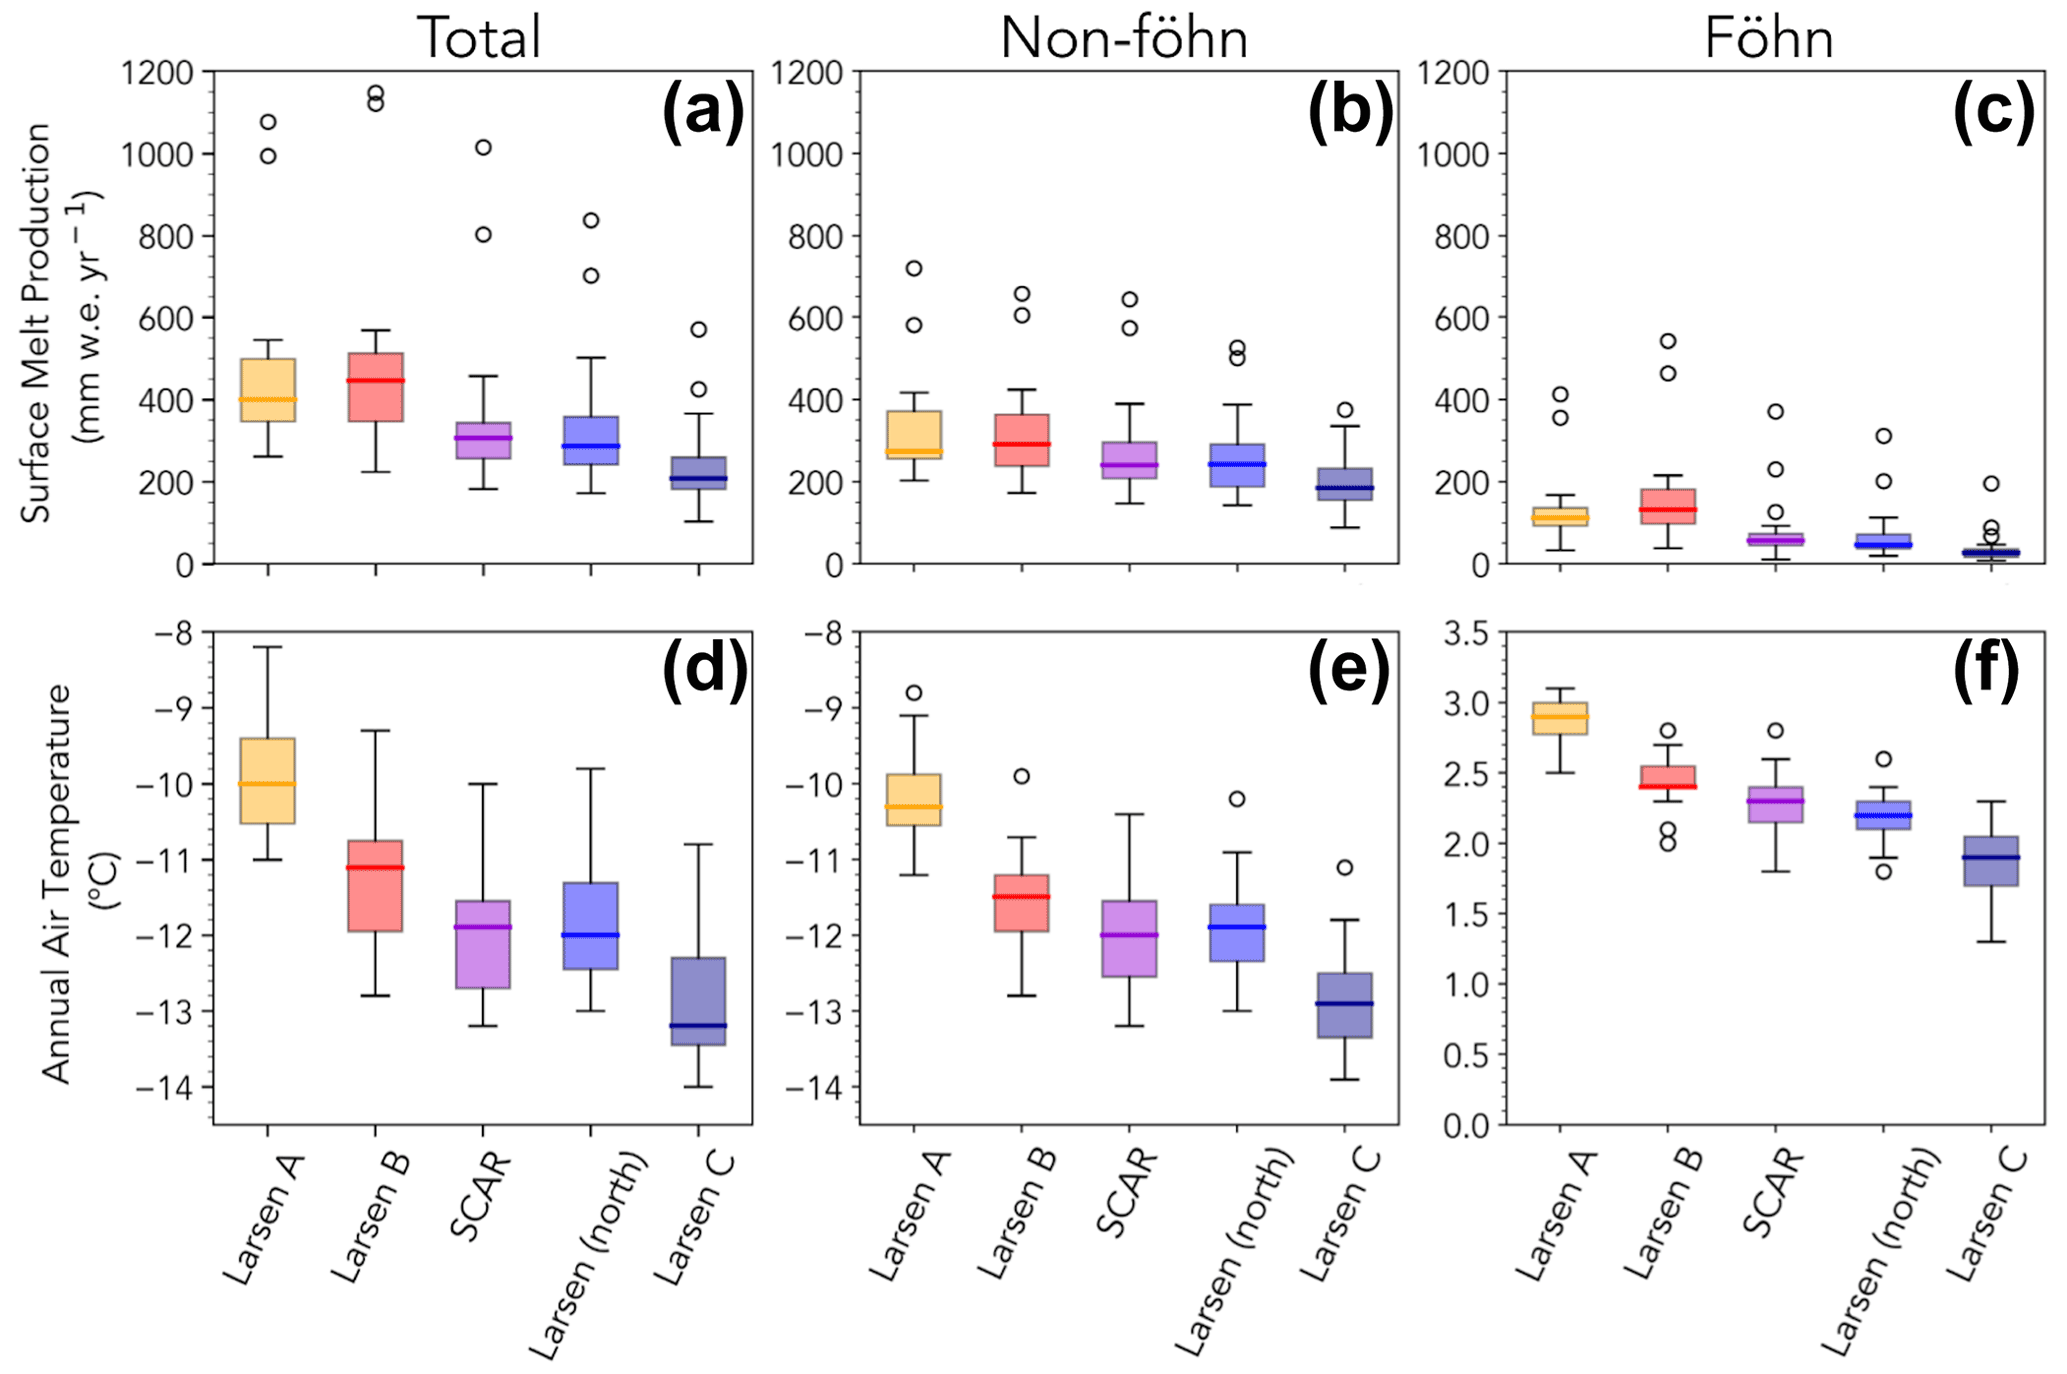
Figure 6Box-and-whisker plots intercompare ice shelves with RACMO2 simulations from 1980–2002. Annual surface melt production (a) all melt, (b) non-föhn melt, (c) föhn-induced melt. (d) Mean annual air temperature, (e) air temperature without föhn winds, and (f) air temperature during föhn winds. Note the LAIS estimates are hypothetical after 1995f but are still resolved in the model simulations.
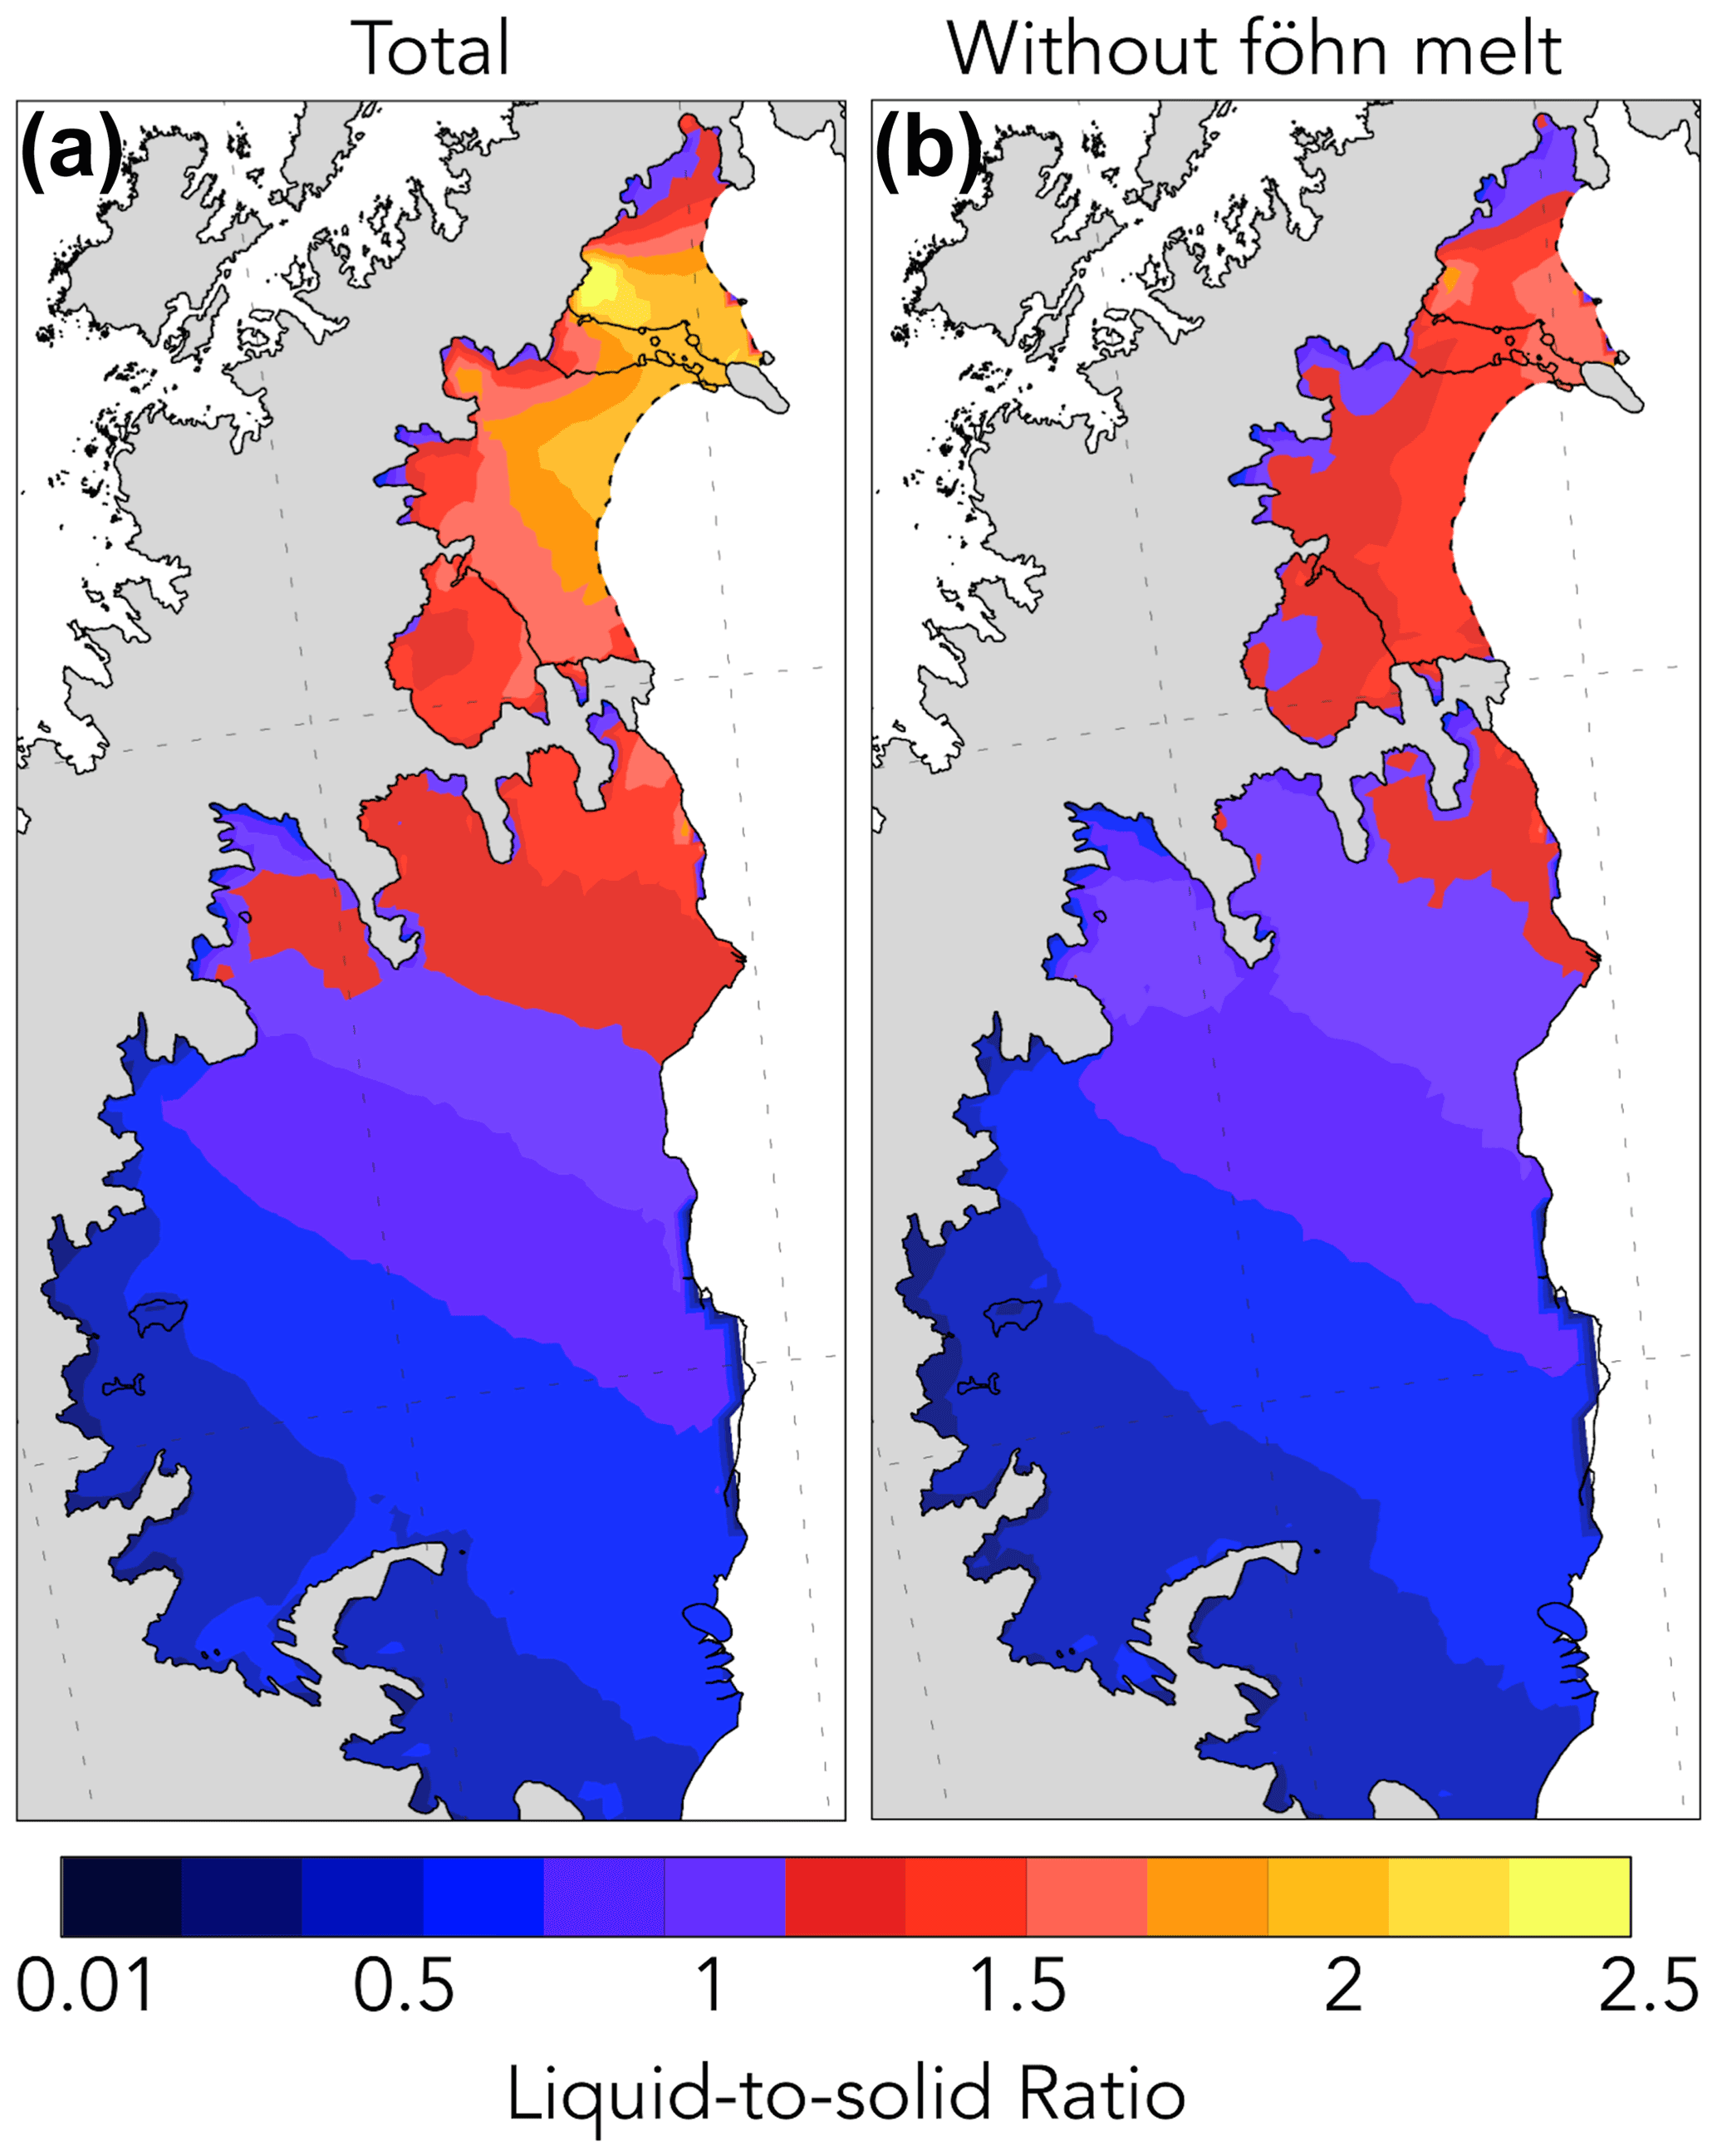
Figure 7RACMO2 firn liquid-to-solid ratio or mean annual liquid water divided by mean annual frozen precipitation from 1979–2002 for (a) total melt and (b) all liquid water except for föhn-induced melt. Note the LAIS estimates are hypothetical after 1995 but are still resolved in the model simulations.
The north–south temperature gradient present on the eastern AP ice shelves contributes to the differences in the ice shelf melt regime (Fig. 6). Warmer ice shelves can be more vulnerable to long-term thinning and retreat that accelerate disintegration (Scambos et al., 2003; Morris and Vaughan, 2003). However, the temperature gradient alone does not explain the substantial increase in surface melt on the LAIS and LBIS relative to more southerly ice shelves. Only with the addition of föhn-induced surface melt (Fig. 6c) do the LAIS and LBIS stand out significantly from the other eastern AP ice shelves (Fig. 6a, b). Temperature gradient, however, could explain why föhn wind events cause less melt on more southern ice shelves and may cause super melt events on collapsed ice shelves because temperature is already elevated on more northern ice shelves prior to the effect föhn has on temperature. With that in mind, we have examined liquid water processes on the spatiotemporal scales pertinent to AP ice shelf stability. For instance, the structural flow discontinuities or suture zones, where tributary glaciers merge together to form an ice shelf, are mechanically weak points that impact stability (Sandhäger et al., 2005; Glasser and Scambos, 2008; Glasser et al., 2009). These suture zones are further weakened through lateral shear depending on the difference in tributary glacier flow. All ice shelves in the region are composed of numerous outflow glaciers sutured together, and while some studies suggest this is a major contributor to ice shelf instability, only two of the ice shelves have collapsed (Borstad et al., 2016; Glasser and Scambos, 2008). Further research suggests that marine accretion of ice on the bottom of the ice shelves, specifically LCIS, may stabilize these suture zones, which may be why SCAR inlet has remained intact despite major rift formation (McGrath et al., 2014; Borstad et al., 2016).
The timing of surface melt and melt enhanced by föhn winds within the melt season may also provide insight into the fate of LAIS and LBIS, including why neither ice shelf collapsed in the anomalously strong 1992/1993 melt season (Fig. 3d). Pore space within the upper snow and firn layers buffers surface melt before lakes begin to form (Polashenski et al., 2017). Late-season melt is more likely to form surface melt lakes because meltwater from the preceding fall, winter, and spring has partially or completely filled available pore space. On both the LAIS and LBIS, 92 % of surface melt during the 1992/1993 melt season occurred before 9 January when there was more pore space to buffer the anomalous surface melt than at the onsets of their collapses in late January 1995 and early February 2002, respectively (Fig. 4a, c). Melt lakes were present on both ice shelves throughout the 1992/1993 melt season, though melt production slowed dramatically after mid-January 1993 (Scambos et al., 2000). The high melt rates in late November and early December 1992 on the LAIS were perhaps too early in the melt season, and after too many years of nominal melt, to form substantial melt lakes and trigger hydrofracture that season. Nevertheless, the 1992/1993 melt could have preconditioned the shelf for collapse in January 1995. The LBIS collapse began in February 2002 after the surface melt had returned to nominal 1980s levels for 6 years. How much pore space had recovered during those 6 years is unknown, and an important question for future research. Satellite images of surface melt lakes indicate 11 % of the ice shelf was covered in melt lakes prior to collapse (Glasser and Scambos, 2008). However, the preceding melt year (2000/2001) had low melt and high precipitation, which added additional snow and water mass to the unstable ice shelf (Leeson et al., 2017).
Another possible reason collapse of the LAIS and LBIS did not occur in the 1992/1993 melt season or other years prior to collapse was a possible misalignment of the four prerequisites for rapid collapse theorized by Massom et al. (2018). An AVHRR image of the LAIS taken on 8 December 1992, just after a series of major föhn wind events that lead to 252 mm w.e. of surface melt in the 8 d prior to the image (Fig. 4a), shows significant melt lakes across the LAIS, which make hydrofracture cascades possible. However, in the same image, sea ice and melange are shown to be at the calving front, protecting the front from long-period ocean swells that could trigger collapse. It may have been too early in the melt season to have substantial gaps in sea ice, the ocean temperature may have been too cold, ocean circulation could have help stabilize the sea ice at the front, the föhn winds speed could have been too weak to push the ice away or may have been in the wrong direction, all of which could have not allowed a proper trigger for collapse even though substantial melt ponds were present. Even if there were years or instances when sea ice extent was low and substantial melt lakes were present, there could have been a lack of long-period ocean swells that are thought to trigger collapse.
Regardless of other possible contributors to ice shelf instability not considered here (e.g., basal melting), föhn-induced surface melt and associated melt lakes, and the off-coast wind direction likely, played an important role in pushing the LAIS and LBIS past a structural tipping point. The estimated surface melt lake depth caused by the 9 d föhn melt event on the LAIS surpassed a melt lake depth identified by modeled and satellite-derived lake depths before the collapse of the LBIS (Banwell et al., 2013, 2014). The LAIS was likely the same thickness (200 m) or thinner at the time of collapse, so the estimate of critical surface lake depth for the LBIS that is applied to the LAIS may reflect an upper limit of melt lake depth of stability for the LAIS. Melt lake depth is likely underestimated because our estimation only accounts for melt during the 9 d melt event. Melt before this time period already exceeded an average melt year by 23 % (118 mm w.e.), so melt lakes probably already existed.
The converging lines of evidence in these results show that observed and inferred föhn-driven melt is present in sufficient amounts, and at the right locations and times, to cause extensive surface melt lakes, while the off-coast föhn wind direction pushed sea ice away from the calving front. The fact that the LAIS and LBIS collapsed catastrophically within weeks and not through long-term thinning and retreat like other ice shelves (Prince Gustav, Wordie) suggests sudden disintegration is anomalous and requires forcings to match vulnerabilities (Scambos et al., 2003). We conclude that föhn winds and the associated surface melt played a significant role in the collapses of the LAIS and LBIS, while extant eastern AP ice shelves are not likely to collapse from föhn-induced melt and hydrofracture in today's current climate. We have come to these conclusions with the following forms of evidence.
-
First, both the LAIS and LBIS are impacted by powerful melt-inducing föhn jets that affect a large spatial portion of each ice shelf and reach the ice shelf terminus. Surface melt and melt lakes near the ice shelf terminus can lead to calving front collapse and structural instability for the remaining portion of the ice shelves (Depoorter et al., 2013; Pollard et al., 2015). SCAR inlet and the LCIS are not directly affected by a föhn jet, are too vast to have any significant effect near the terminus, or are too far south to experience major melt events.
-
Second, strong föhn winds were present prior to and during collapse for the LAIS and LBIS. A series of three föhn events on the LAIS lasted 9 d total and produced over 25 % of the total annual melt for the 1994/1995 melt season, while föhn was present prior to and during the collapse of the LBIS, which enhanced surface melt rates. Enhanced melt filled new and existing melt lakes above the melt lake depth observed on the LBIS (1 m) and modeled lake depth (5 m) that could trigger large-scale hydrofracture cascades. The föhn winds on both ice shelves actively pushed/melted sea ice away from the calving front, allowing long-period ocean swells to trigger large-scale hydrofracture cascades on the LBIS and possibly LAIS, exacerbated by extensive surface melt that originated from the ice shelf terminus.
-
Third, in the absence of föhn-wind-induced melt, the surface liquid budgets of collapsed and intact ice shelves are climatically similar, which points to föhn winds as a driver of increased surface melt and extensive melt lakes on collapsed ice shelves. The additional föhn-induced-melt on the LAIS and LBIS compared to intact ice shelves helped precondition the LAIS and LBIS to produce extensive melt lakes by long-term firn densification.
This research clarifies the roles of föhn-induced melt for collapsed and extant ice shelves on the eastern AP. Future analyses of these ice shelf collapse events using advanced firn density models coupled with ice–ocean–atmosphere coupled simulations may be useful to better understand the role of surface melt in ice shelf instability. Further, the AP föhn wind regime has remained stable over the past half-century (Laffin et al., 2021), which points to enhanced surface temperatures and increased liquid phase precipitation as more important contributors to the future surface liquid budget on remaining ice shelves and is an important area of future research (Bozkurt et al., 2020, 2021). However, changes in climate drivers such as the Southern Annular Mode (SAM), which influences the north–south movement of the westerlies in the region, may alter the temperature and föhn occurrence that will likely enhance surface melt in locations farther south and therefore make more southern ice shelves more vulnerable (Abram et al., 2014; Zheng et al., 2013; Lim et al., 2016). Nevertheless, this research highlights a new understanding behind föhn melt mechanisms for ice shelf collapse and suggests that SCAR inlet and the LCIS may remain stable so long as surface liquid water from melt and precipitation remains within historical bounds.
We use SciKit-learn, a freely available Python library for the machine learning algorithm in Laffin et al. (2021) (https://scikit-learn.org/stable/, last access: 8 April 2022) and this study.
RACMO2 model data are available by request at https://www.projects.science.uu.nl/iceclimate/models/racmo-model.php (last access: 8 April 2022), however, a subset (2001–2018) of the data are hosted online at https://doi.org/10.5281/zenodo.3677642 (Van Wessem and Laffin, 2020). ERA5 data is freely available for download at https://www.ecmwf.int/en/forecasts/dataset/ecmwf-reanalysis-v5 (ECMWF, 2022).
The supplement related to this article is available online at: https://doi.org/10.5194/tc-16-1369-2022-supplement.
MKL and CSZ designed the study. MvW and SM curated the model simulation output and surface observations. MKL performed statistical data analysis. MKL wrote the article with valuable input from all authors.
The contact author has declared that neither they nor their co-authors have any competing interests.
Publisher’s note: Copernicus Publications remains neutral with regard to jurisdictional claims in published maps and institutional affiliations.
We thank Helmut Rott for generously providing detailed in-person observations of the LAIS months before collapse. We also thank the Institute for Marine and Atmospheric research Utrecht (IMAU) for providing RACMO2 output. RACMO2 model data are available by request at https://www.projects.science.uu.nl/iceclimate/models/racmo-model.php (last access: 13 December 2021); however, a subset (2001–2018) of the data are hosted online at https://doi.org/10.5281/zenodo.3677642 (Van Wessem and Laffin, 2020). This work utilized the infrastructure for high-performance and high-throughput computing, research data storage and analysis, and scientific software tool integration built, operated, and updated by the Research Cyberinfrastructure Center (RCIC) at the University of California, Irvine (UCI). The RCIC provides cluster-based systems, application software, and scalable storage to directly support the UCI research community (https://rcic.uci.edu, last access: 22 March 2022).
Matthew K. Laffin was supported by the National Science Foundation (grant no. NRT-1633631) and NASA AIST (grant no. 80NSSC17K0540). Charles S. Zender was supported by the DOE BER ESM and SciDAC programs (grant nos. DE-SC0019278, LLNL-B639667, and LANL-520117). JMVW acknowledges support by PROTECT and was partly funded by the NWO (Netherlands Organisation for Scientific Research, VENI grant VI.Veni.192.083).
This paper was edited by Xavier Fettweis and reviewed by two anonymous referees.
Abram, N. J., Mulvaney, R., Vimeux, F., Phipps, S. J., Turner, J., and England, M. H.: Evolution of the Southern Annular Mode during the past millennium, Nat. Clim. Change, 4, 564–569, https://doi.org/10.1038/nclimate2235, 2014.
Adusumilli, S., Fricker, H. A., Siegfried, M. R., Padman, L., Paolo, F. S., and Ligtenberg, S. R. M.: Variable Basal Melt Rates of Antarctic Peninsula Ice Shelves, 1994–2016, Geophys. Res. Lett., 45, 4086–4095, https://doi.org/10.1002/2017GL076652, 2018.
Alley, K. E., Scambos, T. A., Miller, J. Z., Long, D. G., and MacFerrin, M.: Quantifying vulnerability of Antarctic ice shelves to hydrofracture using microwave scattering properties, Remote Sens. Environ., 210, 297–306, https://doi.org/10.1016/j.rse.2018.03.025, 2018.
Banwell, A. F., MacAyeal, D. R., and Sergienko, O. V.: Breakup of the Larsen B Ice Shelf triggered by chain reaction drainage of supraglacial lakes, Geophys. Res. Lett., 40, 5872–5876, https://doi.org/10.1002/2013GL057694, 2013.
Banwell, A. F., Caballero, M., Arnold, N. S., Glasser, N. F., Cathles, L. M., and MacAyeal, D. R.: Supraglacial lakes on the Larsen B ice shelf, Antarctica, and at Paakitsoq, West Greenland: A comparative study, Ann. Glaciol., 55, 1–8, https://doi.org/10.3189/2014AoG66A049, 2014.
Banwell, A. F., Willis, I. C., MacDonald, G. J., Goodsell, B., Mayer, D. P., Powell, A., and MacAyeal, D. R.: Calving and rifting on the McMurdo Ice Shelf, Antarctica, Ann. Glaciol., 58, 78–87, https://doi.org/10.1017/aog.2017.12, 2017.
Banwell, A. F., Willis, I. C., Macdonald, G. J., Goodsell, B., and MacAyeal, D. R.: Direct measurements of ice-shelf flexure caused by surface meltwater ponding and drainage, Nat. Commun., 10, 730, https://doi.org/10.1038/s41467-019-08522-5, 2019.
Bell, R. E., Banwell, A. F., Trusel, L. D., and Kingslake, J.: Antarctic surface hydrology and impacts on ice-sheet mass balance, Nat. Clim. Change, 8, 1044–1052, https://doi.org/10.1038/s41558-018-0326-3, 2018.
Bevan, S. L., Luckman, A., Hubbard, B., Kulessa, B., Ashmore, D., Kuipers Munneke, P., O'Leary, M., Booth, A., Sevestre, H., and McGrath, D.: Centuries of intense surface melt on Larsen C Ice Shelf, The Cryosphere, 11, 2743–2753, https://doi.org/10.5194/tc-11-2743-2017, 2017.
Borstad, C., Khazendar, A., Scheuchl, B., Morlighem, M., Larour, E., and Rignot, E.: A constitutive framework for predicting weakening and reduced buttressing of ice shelves based on observations of the progressive deterioration of the remnant Larsen B Ice Shelf, Geophys. Res. Lett., 43, 2027–2035, https://doi.org/10.1002/2015GL067365, 2016.
Bozkurt, D., Rondanelli, R., Marín, J. C., and Garreaud, R.: Foehn Event Triggered by an Atmospheric River Underlies Record-Setting Temperature Along Continental Antarctica, J. Geophys. Res.-Atmos., 123, 3871–3892, https://doi.org/10.1002/2017JD027796, 2018.
Bozkurt, D., Bromwich, D. H., Carrasco, J., Hines, K. M., Maureira, J. C., and Rondanelli, R.: Recent Near-surface Temperature Trends in the Antarctic Peninsula from Observed, Reanalysis and Regional Climate Model Data, Adv. Atmos. Sci., 37, 477–493, https://doi.org/10.1007/s00376-020-9183-x, 2020.
Bozkurt, D., Bromwich, D. H., Carrasco, J., and Rondanelli, R.: Temperature and precipitation projections for the Antarctic Peninsula over the next two decades: contrasting global and regional climate model simulations, Clim. Dynam., 56, 3853–3874, https://doi.org/10.1007/s00382-021-05667-2, 2021.
Braun, M. and Humbert, A.: Recent retreat of wilkins ice shelf reveals new insights in ice shelf breakup mechanisms, IEEE Geosci. Remote Sens. Lett., 6, 263–267, https://doi.org/10.1109/LGRS.2008.2011925, 2009.
Bromwich, D. H. and Kurtz, D. D.: Katabatic wind forcing of the Terra Nova Bay polynya., J. Geophys. Res., 89, 3561–3572, https://doi.org/10.1029/JC089iC03p03561, 1984.
Burton, J. C., Cathles, L. M., and Wilder, W. G.: The role of cooperative iceberg capsize in ice-shelf disintegration, Ann. Glaciol., 54, 84–90, https://doi.org/10.3189/2013AoG63A436, 2013.
Cape, M. R., Vernet, M., Skvarca, P., Marinsek, S., Scambos, T., and Domack, E.: Foehn winds link climate-driven warming to ice shelf evolution in Antarctica, J. Geophys. Res., 120, 11037–11057, https://doi.org/10.1002/2015JD023465, 2015.
Carrasco, J. F., Bozkurt, D., and Cordero, R. R.: A review of the observed air temperature in the Antarctic Peninsula. Did the warming trend come back after the early 21st hiatus?, Polar Sci., 28, 100653 https://doi.org/10.1016/j.polar.2021.100653, 2021.
Cook, A. J. and Vaughan, D. G.: Overview of areal changes of the ice shelves on the Antarctic Peninsula over the past 50 years, The Cryosphere, 4, 77–98, https://doi.org/10.5194/tc-4-77-2010, 2010.
Datta, R. T., Tedesco, M., Fettweis, X., Agosta, C., Lhermitte, S., Lenaerts, J. T. M., and Wever, N.: The Effect of Foehn-Induced Surface Melt on Firn Evolution Over the Northeast Antarctic Peninsula, Geophys. Res. Lett., 46, 3822–3831, https://doi.org/10.1029/2018GL080845, 2019.
Depoorter, M. A., Bamber, J. L., Griggs, J. A., Lenaerts, J. T. M., Ligtenberg, S. R. M., Van Den Broeke, M. R., and Moholdt, G.: Calving fluxes and basal melt rates of Antarctic ice shelves, Nature, 502, 89–92, https://doi.org/10.1038/nature12567, 2013.
Doake, C. S. M., Corr, H. F. J., Rott, H., Skvarca, P., and Young, N. W.: Breakup and conditions for stability of the northern Larsen Ice Shelf, Antarctica, Nature, 391, 778–780, 1988.
ECMWF: IFS Documentation CY33R1 – Part IV: Physical Processes, in: IFS Documentation CY33R1, vol. 4., https://www.ecmwf.int/en/elibrary/9227-part-iv-physical-processes/ (last access: 6 April 2022), 2009.
ECMWF: What are the changes from ERA-Interim to ERA5?, https://confluence.ecmwf.int//pages/viewpage.action?pageId=74764925 (last access: 6 March 2020), 2018.
ECMWF: ECMWF Reanalysis v5 (ERA5), ECMWF [data set], https://www.ecmwf.int/en/forecasts/dataset/ecmwf-reanalysis-v5, last access: 8 April 2022.
Elvidge, A. D., Renfrew, I. A., King, J. C., Orr, A., Lachlan-Cope, T. A., Weeks, M., and Gray, S. L.: Foehn jets over the Larsen C Ice Shelf, Antarctica, Q. J. Roy. Meteor. Soc., 141, 698–713, https://doi.org/10.1002/qj.2382, 2015.
Elvidge, A. D., Kuipers Munneke, P., King, J. C., Renfrew, I. A., and Gilbert, E.: Atmospheric Drivers of Melt on Larsen C Ice Shelf: Surface Energy Budget Regimes and the Impact of Foehn, J. Geophys. Res.-Atmos., 125, e2020JD032463, https://doi.org/10.1029/2020JD032463, 2020.
Glasser, N. F. and Scambos, T. A.: A structural glaciological analysis of the 2002 Larsen B ice-shelf collapse, J. Glaciol., 54, 3–16, https://doi.org/10.3189/002214308784409017, 2008.
Glasser, N. F., Kulessa, B., Luckman, A., Jansen, D., King, E. C., Sammonds, P. R., Scambos, T. A., and Jezek, K. C.: Surface structure and stability of the Larsen C ice shelf, J. Glaciol., 55, 400–410, 2009.
Grosvenor, D. P., King, J. C., Choularton, T. W., and Lachlan-Cope, T.: Downslope föhn winds over the Antarctic Peninsula and their effect on the Larsen ice shelves, Atmos. Chem. Phys., 14, 9481–9509, https://doi.org/10.5194/acp-14-9481-2014, 2014.
Gudmundsson, G. H.: Ice-shelf buttressing and the stability of marine ice sheets, The Cryosphere, 7, 647–655, https://doi.org/10.5194/tc-7-647-2013, 2013.
Holland, P. R., Corr, H. F. J., Pritchard, H. D., Vaughan, D. G., Arthern, R. J., Jenkins, A., and Tedesco, M.: The air content of Larsen Ice Shelf, Geophys. Res. Lett., 38, L10503, https://doi.org/10.1029/2011GL047245, 2011.
Hubbard, B., Luckman, A., Ashmore, D. W., Bevan, S., Kulessa, B., Kuipers Munneke, P., Philippe, M., Jansen, D., Booth, A., Sevestre, H., Tison, J. L., O'Leary, M., and Rutt, I.: Massive subsurface ice formed by refreezing of ice-shelf melt ponds, Nat. Commun., 7, 11897, https://doi.org/10.1038/ncomms11897, 2016.
King, J. C., Gadian, A., Kirchgaessner, A., Kuipers Munneke, P., Lachlan-Cope, T. A., Orr, A., Reijmer, C., van den Broeke, M. R., van Wessem, J. M., and Weeks, M.: Validation of the summertime surface energy budget of Larsen C Ice Shelf (Antarctica) as represented in three high-resolution atmospheric models, J. Geophys. Res., 120, 1335–1347, https://doi.org/10.1002/2014JD022604, 2015.
King, J. C., Kirchgaessner, A., Bevan, S., Elvidge, A. D., Kuipers Munneke, P., Luckman, A., Orr, A., Renfrew, I. A., and van den Broeke, M. R.: The Impact of Föhn Winds on Surface Energy Balance During the 2010–2011 Melt Season Over Larsen C Ice Shelf, Antarctica, J. Geophys. Res.-Atmos., 122, 12062–12076, https://doi.org/10.1002/2017JD026809, 2017.
Kirchgaessner, A., King, J. C., and Anderson, P. S.: The Impact of Föhn Conditions Across the Antarctic Peninsula on Local Meteorology Based on AWS Measurements, J. Geophys. Res.-Atmos., 126, e2020JD033748, https://doi.org/10.1029/2020JD033748, 2021.
Kuipers Munneke, P., van den Broeke, M. R., King, J. C., Gray, T., and Reijmer, C. H.: Near-surface climate and surface energy budget of Larsen C ice shelf, Antarctic Peninsula, The Cryosphere, 6, 353–363, https://doi.org/10.5194/tc-6-353-2012, 2012.
Kuipers Munneke, P., Ligtenberg, S. R. M., Van Den Broeke, M. R., and Vaughan, D. G.: Firn air depletion as a precursor of Antarctic ice-shelf collapse, J. Glaciol., 60, 205–214, https://doi.org/10.3189/2014JoG13J183, 2014.
Kuipers Munneke, P., Luckman, A. J., Bevan, S. L., Smeets, C. J. P. P., Gilbert, E., van den Broeke, M. R., Wang, W., Zender, C., Hubbard, B., Ashmore, D., Orr, A., King, J. C., and Kulessa, B.: Intense Winter Surface Melt on an Antarctic Ice Shelf, Geophys. Res. Lett., 45, 7615–7623, https://doi.org/10.1029/2018GL077899, 2018.
Laffin, M. K., Zender, C. S., Singh, S., Van Wessem, J. M., Smeets, C. J. P. P., and Reijmer, C. H.: Climatology and Evolution of the Antarctic Peninsula Föhn Wind-Induced Melt Regime From 1979–2018, J. Geophys. Res.-Atmos., 126, e2020JD033682, https://doi.org/10.1029/2020JD033682, 2021 (data available at: https://scikit-learn.org/stable/, last access: 8 April 2022).
Larour, E., Rignot, E., Poinelli, M., and Scheuchl, B.: Physical processes controlling the rifting of Larsen C Ice Shelf, Antarctica, prior to the calving of iceberg A68, P. Natl. Acad. Sci. USA, 118, e2105080118, https://doi.org/10.1073/pnas.2105080118, 2021.
Leeson, A. A., Van Wessem, J. M., Ligtenberg, S. R. M., Shepherd, A., Van Den Broeke, M. R., Killick, R., Skvarca, P., Marinsek, S., and Colwell, S.: Regional climate of the Larsen B embayment 1980–2014, J. Glaciol., 63, 683–690, https://doi.org/10.1017/jog.2017.39, 2017.
Leeson, A. A., Forster, E., Rice, A., Gourmelen, N., and van Wessem, J. M.: Evolution of Supraglacial Lakes on the Larsen B Ice Shelf in the Decades Before it Collapsed, Geophys. Res. Lett., 47, e2019GL085591, https://doi.org/10.1029/2019GL085591, 2020.
Lenaerts, J. T. M., Lhermitte, S., Drews, R., Ligtenberg, S. R. M., Berger, S., Helm, V., Smeets, C. J. P. P., Broeke, M. R. V. Den, Van De Berg, W. J., Van Meijgaard, E., Eijkelboom, M., Eisen, O., and Pattyn, F.: Meltwater produced by wind-albedo interaction stored in an East Antarctic ice shelf, Nat. Clim. Change, 7, 58–62, https://doi.org/10.1038/nclimate3180, 2017.
Lhermitte, S., Sun, S., Shuman, C., Wouters, B., Pattyn, F., Wuite, J., Berthier, E., and Nagler, T.: Damage accelerates ice shelf instability and mass loss in Amundsen Sea Embayment, Sci. Libr. Ser., 117, 24735–24741, https://doi.org/10.1073/pnas.1912890117, 2020.
Lim, E. P., Hendon, H. H., Arblaster, J. M., Delage, F., Nguyen, H., Min, S. K., and Wheeler, M. C.: The impact of the Southern Annular Mode on future changes in Southern Hemisphere rainfall, Geophys. Res. Lett., 43, 7160–7167, https://doi.org/10.1002/2016GL069453, 2016.
Luckman, A., Elvidge, A., Jansen, D., Kulessa, B., Kuipers Munneke, P., King, J., and Barrand, N. E.: Surface melt and ponding on Larsen C Ice Shelf and the impact of föhn winds, Antarct. Sci., 26, https://doi.org/10.1017/S0954102014000339, 2014.
Massom, R. A., Scambos, T. A., Bennetts, L. G., Reid, P., Squire, V. A., and Stammerjohn, S. E.: Antarctic ice shelf disintegration triggered by sea ice loss and ocean swell, Nature, 558, 383–389, https://doi.org/10.1038/s41586-018-0212-1, 2018.
McGrath, D., Steffen, K., Holland, P. R., Scambos, T., Rajaram, H., Abdalati, W., and Rignot, E.: The structure and effect of suture zones in the Larsen C Ice Shelf, Antarctica, J. Geophys. Res.-Earth, 119, 588–602, https://doi.org/10.1002/2013JF002935, 2014.
Morris, E. M. and Vaughan, D. G.: Spatial and Temporal Variation of Surface Temperature on the Antarctic Peninsula and the Limit of Viability of Ice Shelves, Antarct. Res. Ser., 79, 61–68, https://doi.org/10.1029/AR079p0061, 2003.
Mulvaney, R., Abram, N. J., Hindmarsh, R. C. A., Arrowsmith, C., Fleet, L., Triest, J., Sime, L. C., Alemany, O., and Foord, S.: Recent Antarctic Peninsula warming relative to Holocene climate and ice-shelf history, Nature, 489, 141–144, https://doi.org/10.1038/nature11391, 2012.
Polashenski, C., Golden, K. M., Perovich, D. K., Skyllingstad, E., Arnsten, A., Stwertka, C., and Wright, N.: Percolation blockage: A process that enables melt pond formation on first year Arctic sea ice, J. Geophys. Res.-Oceans, 122, 413–440, https://doi.org/10.1002/2016JC011994, 2017.
Pollard, D., DeConto, R. M., and Alley, R. B.: Potential Antarctic Ice Sheet retreat driven by hydrofracturing and ice cliff failure, Earth Planet. Sci. Lett., 412, 112–121, https://doi.org/10.1016/j.epsl.2014.12.035, 2015.
Pritchard, H. D., Ligtenberg, S. R. M., Fricker, H. A., Vaughan, D. G., Van Den Broeke, M. R., and Padman, L.: Antarctic ice-sheet loss driven by basal melting of ice shelves, Nature, 484, 502–505, https://doi.org/10.1038/nature10968, 2012.
Qiao, G., Li, Y., Guo, S., and Ye, W.: Evolving instability of the scar inlet ice shelf based on sequential landsat images spanning 2005–2018, Remote Sens., 12, 36, https://doi.org/10.3390/RS12010036, 2020.
Rack, W. and Rott, H.: Pattern of retreat and disintegration of the Larsen B ice shelf, Antarctic Peninsula, Ann. Glaciol., 39, 505–510, https://www.cambridge.org/core (last access: 15 December 2021), 2004.
Rignot, E., Casassa, G., Gogineni, P., Krabill, W., Rivera, A., and Thomas, R.: Accelerated ice discharge from the Antarctic Peninsula following the collapse of Larsen B ice shelf, Geophys. Res. Lett., 31, L18401, https://doi.org/10.1029/2004GL020697, 2004.
Rignot, E., Jacobs, S., Mouginot, B., and Scheuchl, B.: Ice-Shelf Melting Around Antarctica, Science, 341, 263–266, https://doi.org/10.1126/science.1237966, 2013.
Robel, A. A. and Banwell, A. F.: A Speed Limit on Ice Shelf Collapse Through Hydrofracture, Geophys. Res. Lett., 46, 12092–12100, https://doi.org/10.1029/2019GL084397, 2019.
Rott, H., Skvarca, P., and Nagler, T.: Rapid Collapse of Northern Larsen Ice Shelf, Antarctica, Science, 271, 788–792, 1996.
Rott, H., Rack, W., Nagler, T., and Skvarca, P.: Climatically induced retreat and collapse of norther Larsen Ice Shelf, Antarctic Peninsula, Ann. Glaciol., 27, 86–92, https://doi.org/10.3189/s0260305500017262, 1998.
Sandhäger, H., Rack, W., and Jansen, D.: Model investigations of Larsen B Ice Shelf dynamics prior to the breakup, https://www.researchgate.net/publication/241354171_Model_investigations_of_Larsen_B_Ice_Shelf_dynamics_prior_to_the_breakup (last access: 29 January 2022), 2005.
Scambos, T., Hulbe, C., and Fahnestock, M.: Climate-Induced Ice Shelf Disintegration in the Antarctic Peninsula, Antarct. Res. Ser., 79, 79–92, https://doi.org/10.1029/AR079p0079, 2003.
Scambos, T. A., Hulbe, C., Fahnestock, M., and Bohlander, J.: The link between climate warming and break-up of ice shelves in the Antarctic Peninsula, J. Glaciol., 46, 516–530, https://doi.org/10.3189/172756500781833043, 2000.
Scambos, T. A., Bohlander, J. A., Shuman, C. A., and Skvarca, P.: Glacier acceleration and thinning after ice shelf collapse in the Larsen B embayment, Antarctica, Geophys. Res. Lett., 31, L18402, https://doi.org/10.1029/2004GL020670, 2004.
Schodlok, M. P., Menemenlis, D., and Rignot, E. J.: Ice shelf basal melt rates around Antarctica from simulations and observations, J. Geophys. Res.-Oceans, 121, 1085–1109, https://doi.org/10.1002/2015JC011117, 2016.
Stroeve, J. and Shuman, C.: Historical Arctic and Antarctic Surface Observational Data, Version 1, NASA National Snow and Ice Data Center Distributed Active Archive Center, Boulder, Colorado USA [data set], https://doi.org/10.5067/4DIN375AWFIO, 2004.
Trusel, L. D., Frey, K. E., Das, S. B., Munneke, P. K., and Van Den Broeke, M. R.: Satellite-based estimates of Antarctic surface meltwater fluxes, Geophys. Res. Lett., 40, 6148–6153, https://doi.org/10.1002/2013GL058138, 2013.
Trusel, L. D., Frey, K. E., Das, S. B., Karnauskas, K. B., Kuipers Munneke, P., Van Meijgaard, E., and Van Den Broeke, M. R.: Divergent trajectories of Antarctic surface melt under two twenty-first-century climate scenarios, Nat. Geosci., 8, 927–932, https://doi.org/10.1038/ngeo2563, 2015.
Turton, J. V., Kirchgaessner, A., Ross, A. N., and King, J. C.: Does high-resolution modeling improve the spatial analysis of föhn flow over the Larsen C Ice Shelf?, Weather, 72, 192–196, https://doi.org/10.1002/wea.3028, 2017.
Turton, J. V., Kirchgaessner, A., Ross, A. N., and King, J. C.: The spatial distribution and temporal variability of föhn winds over the Larsen C ice shelf, Antarctica, Q. J. Roy. Meteor. Soc., 144, 1169–1178, https://doi.org/10.1002/qj.3284, 2018.
van den Broeke, M.: Strong surface melting preceded collapse of Antarctic Peninsula ice shelf, Geophys. Res. Lett., 32, L12815, https://doi.org/10.1029/2005GL023247, 2005.
Van Wessem, J. M. and Laffin, M. K.: Regional Atmospheric Climate Model 2 (RACMO2), version 2.3p2 (2.3p2), Zenodo [data set], https://doi.org/10.5281/zenodo.3677642, 2020.
Wang, W., Zender, C. S., van As, D., Fausto, R. S., and Laffin, M. K.: Greenland Surface Melt Dominated by Solar and Sensible Heating, Geophys. Res. Lett., 48, e2020GL090653, https://doi.org/10.1029/2020GL090653, 2021.
Wang, X., Zhang, Z., Wang, X., Vihma, T., Zhou, M., Yu, L., Uotila, P., and Sein, D. V.: Impacts of strong wind events on sea ice and water mass properties in Antarctic coastal polynyas, Clim. Dynam., 57, 3505–3528, https://doi.org/10.1007/s00382-021-05878-7, 2021.
Wiesenekker, J. M., Munneke, P. K., van den Broeke, M. R., and Paul Smeets, C. J. P.: A multidecadal analysis of Föhn winds over Larsen C ice shelf from a combination of observations and modeling, Atmosphere, 9, 172, https://doi.org/10.3390/atmos9050172, 2018.
Zheng, F., Li, J., Clark, R. T., and Nnamchi, H. C.: Simulation and projection of the Southern Hemisphere annular mode in CMIP5 models, J. Climate, 26, 9860–9879, https://doi.org/10.1175/JCLI-D-13-00204.1, 2013.