the Creative Commons Attribution 4.0 License.
the Creative Commons Attribution 4.0 License.
 | 30 Mar 2022
Characteristics of mountain glaciers in the northern Japanese Alps
Kenshiro Arie
Chiyuki Narama
Ryohei Yamamoto
Kotaro Fukui
Hajime Iida
Since 2012, seven perennial snow patches in the northern Japanese Alps have been determined to be very small glaciers (VSGs: <0.5 km2). However, it had not been determined how such glaciers could be maintained in such a warm climate. In this study, we calculate the annual mass balance, accumulation depth, and ablation depth of five of these VSGs, covering 2015–2019 for four of them (2017–2019 for the fifth) using multi-period digital surface models (DSMs) based on structure-from-motion–multi-view-stereo (SfM–MVS) technology and images taken from a small airplane.
The results indicate that, due to snow acquired from avalanches and snowdrifts, these VSGs are maintained by an accumulation in winter that is more than double that from the snowfall, thereby exceeding the ablation in summer. Therefore, we classify them as topographically controlled VSGs. We find very small yearly fluctuations in their ablation depth; however, their annual mass balance and accumulation depth have large yearly fluctuations. The annual mass balance, which mainly depends on the accumulation depth, showed accumulation throughout each glacier during heavy snow years and ablation throughout each glacier during light snow years. This characteristic differs from the upper accumulation area and lower ablation area that exists on most glaciers. These VSGs lack a positive annual mass balance gradient, which suggests that they are not divided by a distinct glacier equilibrium line altitude (ELA) into an upstream accumulation area and a downstream ablation area. Moreover, compared to other glaciers worldwide, we find the mass balance amplitude of VSGs in the northern Japanese Alps to be the highest measured to date.
- Article
(15602 KB) - Full-text XML
-
Supplement
(335 KB) - BibTeX
- EndNote


More than 100 perennial snow patches are distributed throughout the northern Japanese Alps (Higuchi and Iozawa, 1971), with some containing glacial ice as determined by their density (at least 830 kg m−3) (Sakita, 1931; Ogasahara, 1964; Kawashima et al., 1993; Kawashima, 1997). Since the 1960s, researchers have tried to determine which ones are glaciers, but the difficulty of measuring flow stymied the earlier efforts (Fukui et al., 2018, 2021). Recently, however, smaller and more accurate surveying instruments have been developed that allow the measurement of ice thickness using ground-penetrating radar. Using these instruments together with the centimeter-scale accuracy of global navigation satellite system (GNSS) surveys, several groups measured the ice thickness and horizontal flow velocity of seven perennial snow patches in the region, finding them to be active glaciers, subsequently named Gozenzawa, Sannomado, Komado, Kakunezato, Karamatsuzawa, Kuranosuke, and Ikenotan (Fukui and Iida, 2012; Fukui et al., 2018, 2021; Arie et al., 2019). As they are less than 0.5 km2 in area, they are classified as very small glaciers (VSGs) (Huss, 2010; Huss and Fischer, 2016).
In general, glaciers form and change in response to their mass balance, which is determined by the accumulation of primary snowfall and ablation of primary snowmelt. Therefore, to understand the factors contributing to glacier formation and persistence, one must measure accumulation and ablation (Ohmura, 2010). Accumulation and ablation can be substituted by winter and summer balances (Ohmura, 2011). This approach should also apply to VSGs.
Accumulation and ablation incorporate the glacier's geographical characteristics and are crucial for assessing the relationship between the climatic environment and glacier mass balance (Dyurgerov and Meier, 1999; Huss et al., 2008; Ohmura, 2011; Pelto et al., 2019). A related quantity is the mass balance amplitude, which Meier (1984, 1993) defines as half of the sum of the absolute values of the winter and summer mass balances. In the Glossary of Mass Balance and Related Terms (Cogley et al., 2011), the mass balance amplitude tends to be higher for glaciers in maritime climates than those in continental climates due to the former having higher accumulation.
In the northern Japanese Alps, Fukui et al. (2018, 2021) measured the mass balance of the Gozenzawa Glacier using the stake or glaciological method. Based on the mass balance, they argued that the entire glacier area was an accumulation area in 2012–2015 but an ablation area in 2015–2016. The characteristic of accumulation or ablation throughout has also been reported for the VSGs in the European Alps (Colucci et al., 2021). Fukui et al. (2018, 2021) also showed that avalanches contributed significantly to the accumulation of Gozenzawa Glacier. However, as the stakes were measured only twice, in the autumns of 2012 and 2016, the accumulation and ablation were not determined. For measuring accumulation and ablation, the stake method is not reliable in the northern Japanese Alps because the stakes are buried under heavy snowfall during winter. In some years, they remain buried even at the end of the snowmelt season.
Although some characteristics of VSGs that persist in warm environments at middle latitudes (here: 36.57–36.69∘ N) and low altitudes (here: 1750–2770 m) have been explored, the mechanisms by which the VSGs in the northern Japanese Alps are formed and maintained remain unclear. To clarify the mass balance characteristics of these VSGs, we measured the annual mass balance, accumulation depth, and ablation depth of five VSGs in the northern Japanese Alps using a geodetic method. The geodetic method obtains the change in volume by evaluating the elevation change of the entire glacier surface between two dates (Ohmura, 2010, 2011). This method has been used in recent years to measure the mass balance of many glaciers because it can obtain data for parts of the glacier that are difficult to access and observe on-site (Brun et al., 2016; Dussaillant et al., 2019; Vincent et al., 2021).
Here, we calculate the annual mass balance, accumulation depth, and ablation depth of four VSGs in 2015–2019 and for one VSG in 2017–2019 in the northern Japanese Alps by comparing multi-period digital surface models (DSMs) created using structure-from-motion–multi-view-stereo (SfM–MVS) software and aerial images taken from a small airplane. We then compare their mass balance amplitudes to those of other glaciers worldwide. In addition, we discuss the characteristics of the mass balance profile of VSGs based on their profile of altitude change.
The climate of the northern Japanese Alps is greatly influenced by the winter monsoon and Tsushima warm current in the Sea of Japan. During the winter monsoon, a dry, cold air mass from the continent passes over the Tsushima warm current, gaining heat and water vapor, and then undergoes topographic updraft, producing some of the heaviest snowfall worldwide over the northern Japanese Alps (Nosaka et al., 2019; Kawase et al., 2020). The winter northwesterly winds supply much snow to the east side of the mountain ridge due to snowdrifts deposits (Suzuki and Sasaki, 2019). As a result, over 80 % of the perennial snow patches lie on the east side of mountain ridge (Asahi, 2016). For meteorological data, we refer to that from a nearby station on Mt. Hakuba (2932 m), run by the Research Center for Mountain Environment of Shinshu University. Here, the maximum daily wind speeds for the months of December 2010 through March 2011 are 23.5, 34.9, 23.3, and 25.9 m s−1 respectively with wind directions being mainly west and northwest. For 2011, the average monthly temperature was −18.0 ∘C in January and 11.9 ∘C in July, with an average annual temperature of −2.3 ∘C. Moreover, the average March snow depth at Murododaira (∼2450 m; Fig. 1), located at the west side of the mountain ridge, was about 6.8 m during 1996–2018 (Iida et al., 2018).
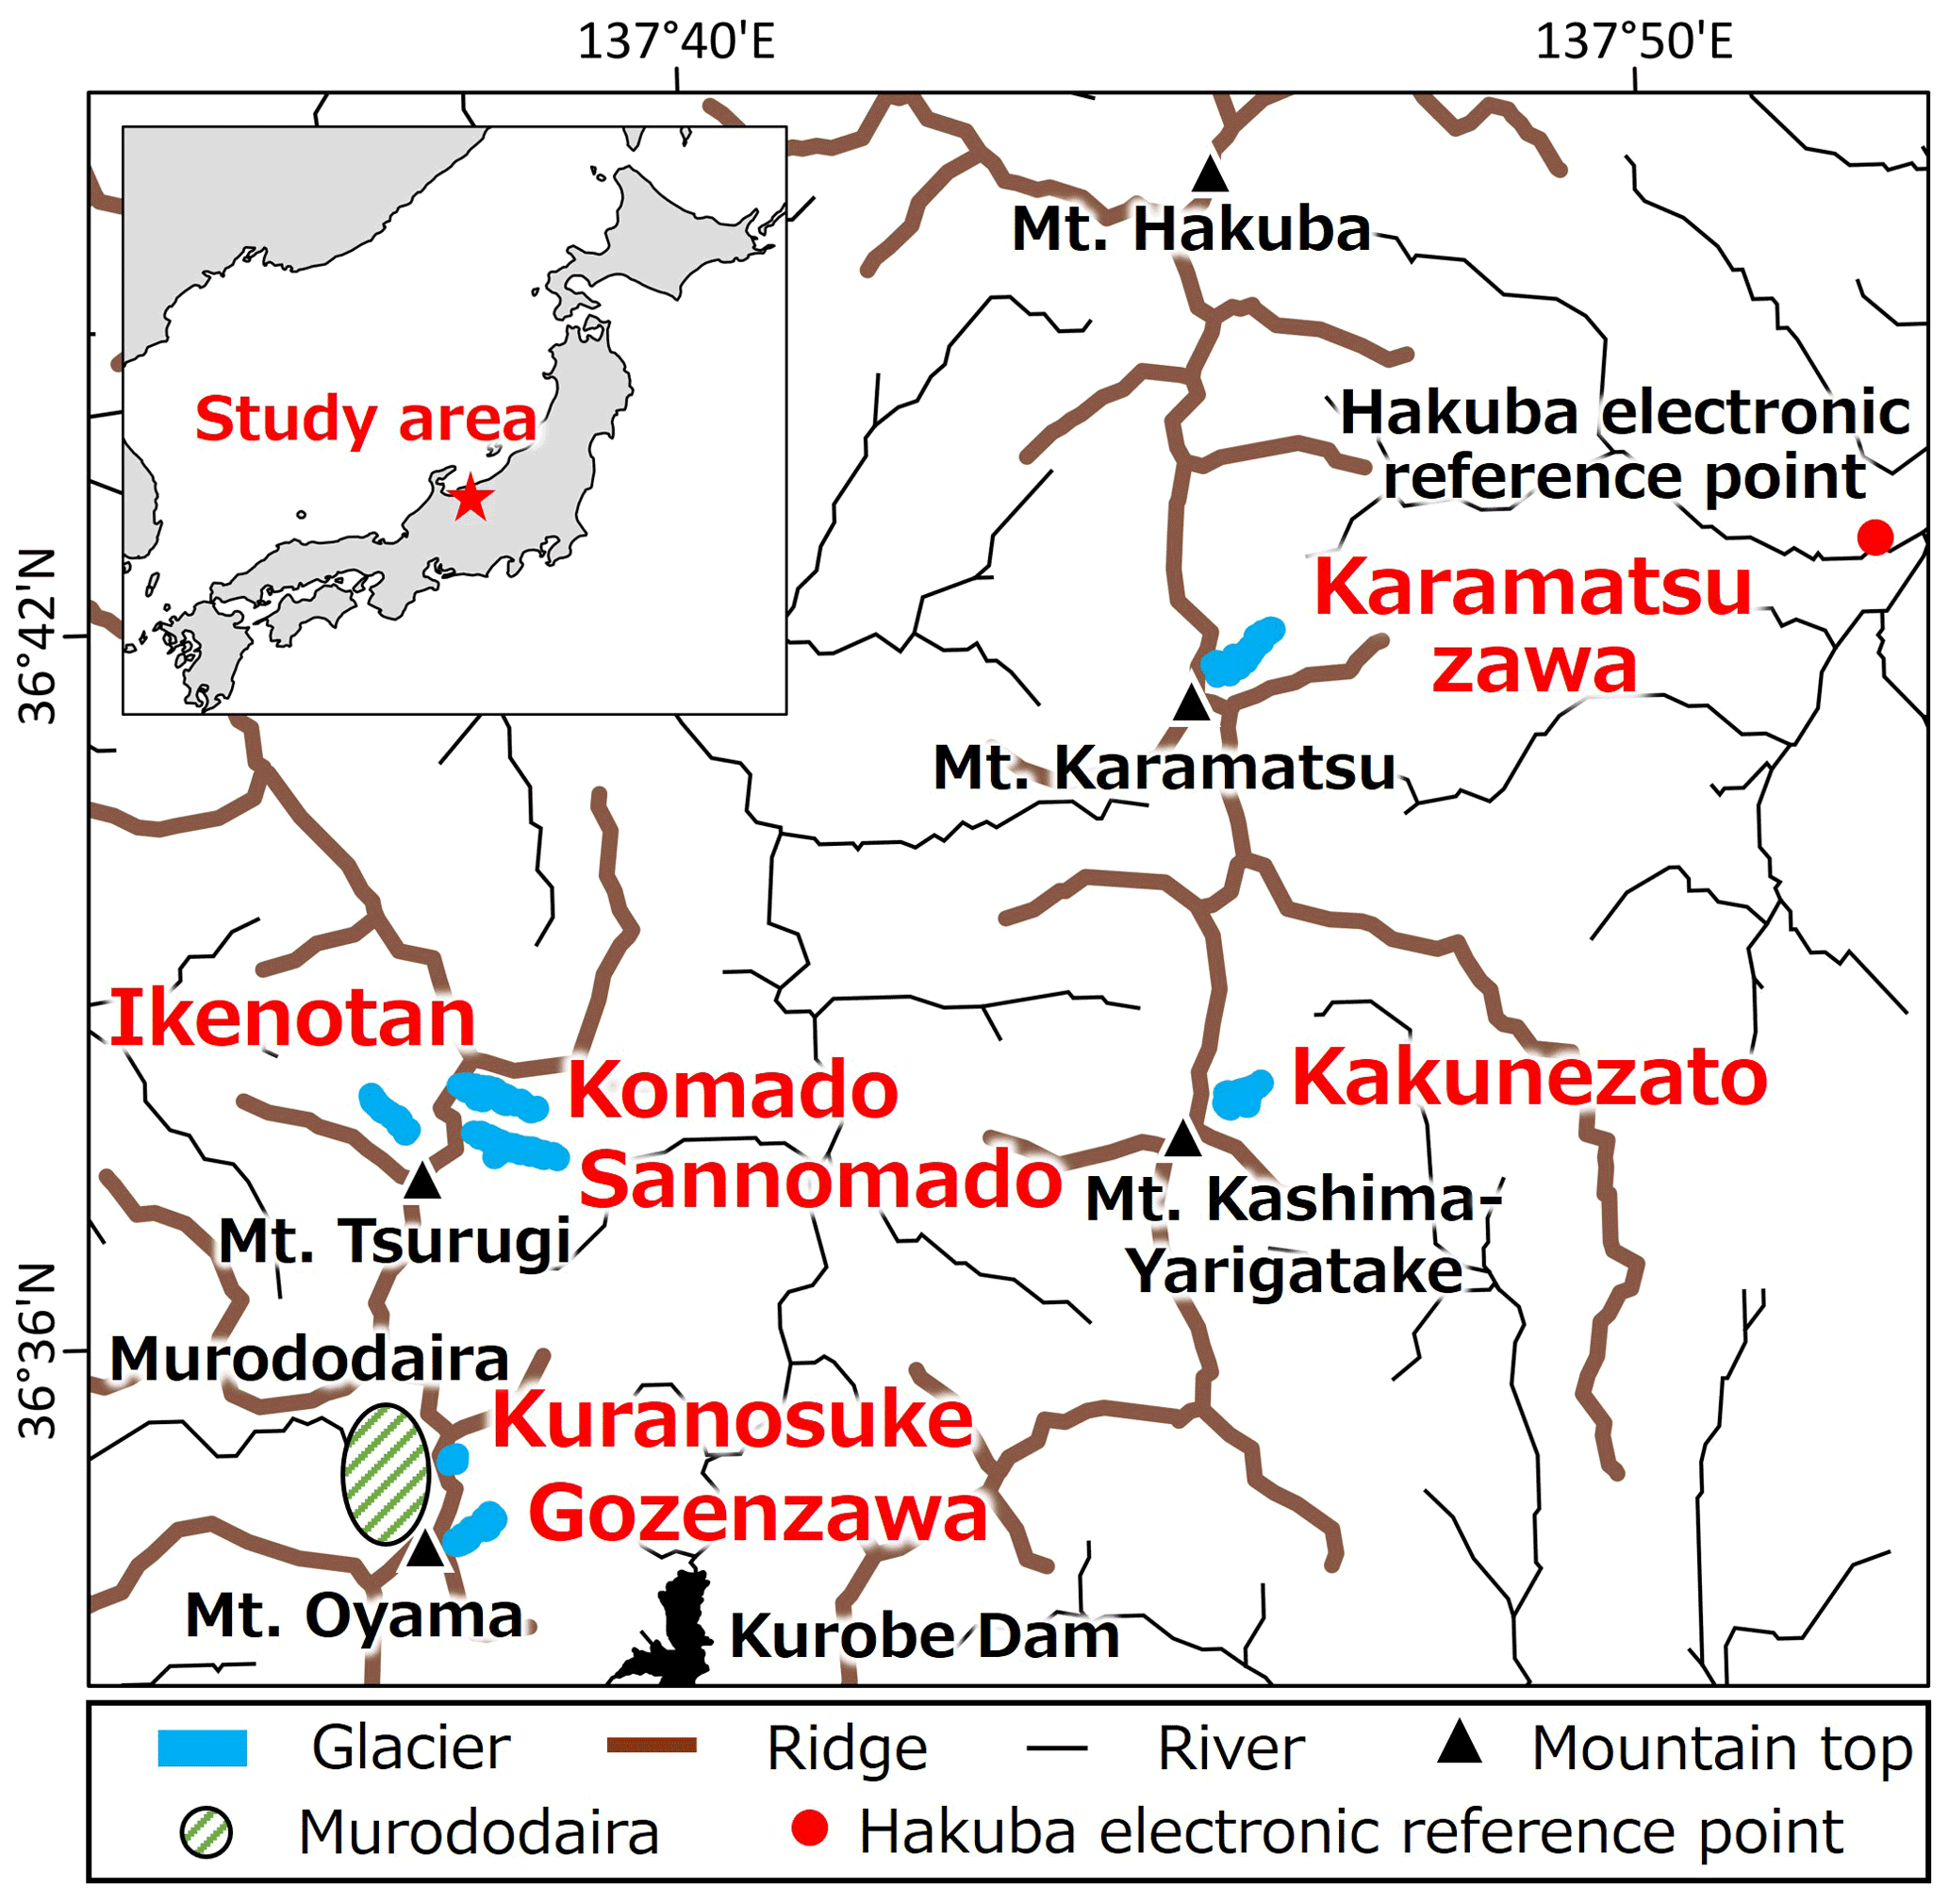
Figure 1The location of seven glaciers in the northern Japanese Alps (names in red font).
In this study, we focus on five VSGs in the northern Japanese Alps (Fig. 1). Briefly, their characteristics and environments are as follows. The Gozenzawa Glacier (Fig. 2a) lies on the eastern side of Mt. Oyama (3003 m), at the bottom of Gozenzawa valley, which bends to the northeast. The Sannomado Glacier (Fig. 2b) lies at the bottom of the glacial trough erosion valley between the Sannomado and Hachimine ridges of Mt. Tsurugi (2999 m) and trends east–southeast. The Komado Glacier (Fig. 2b) lies at the bottom of the glacial trough erosion valley between the southeast side of Mt. Ikenotaira (2561 m) and the Sannomado ridge and trends east–southeast. The Kakunezato Glacier (Fig. 2c) is at the head of the glacial trough erosion valley extending northeast from the northern peak of Mt. Kashima-Yarigatake (2842 m). The Karamatsuzawa Glacier (Fig. 2d) lies at the head of the glacial trough erosion valley extending northeast from the northern peak of Mt. Karamatsu (2696 m). Each glacier sits at the base of a trough just east of a mountain ridge, surrounded by steep bedrock, meaning that snow avalanches and snowdrifts can greatly contribute to the accumulation of the entire glacier.
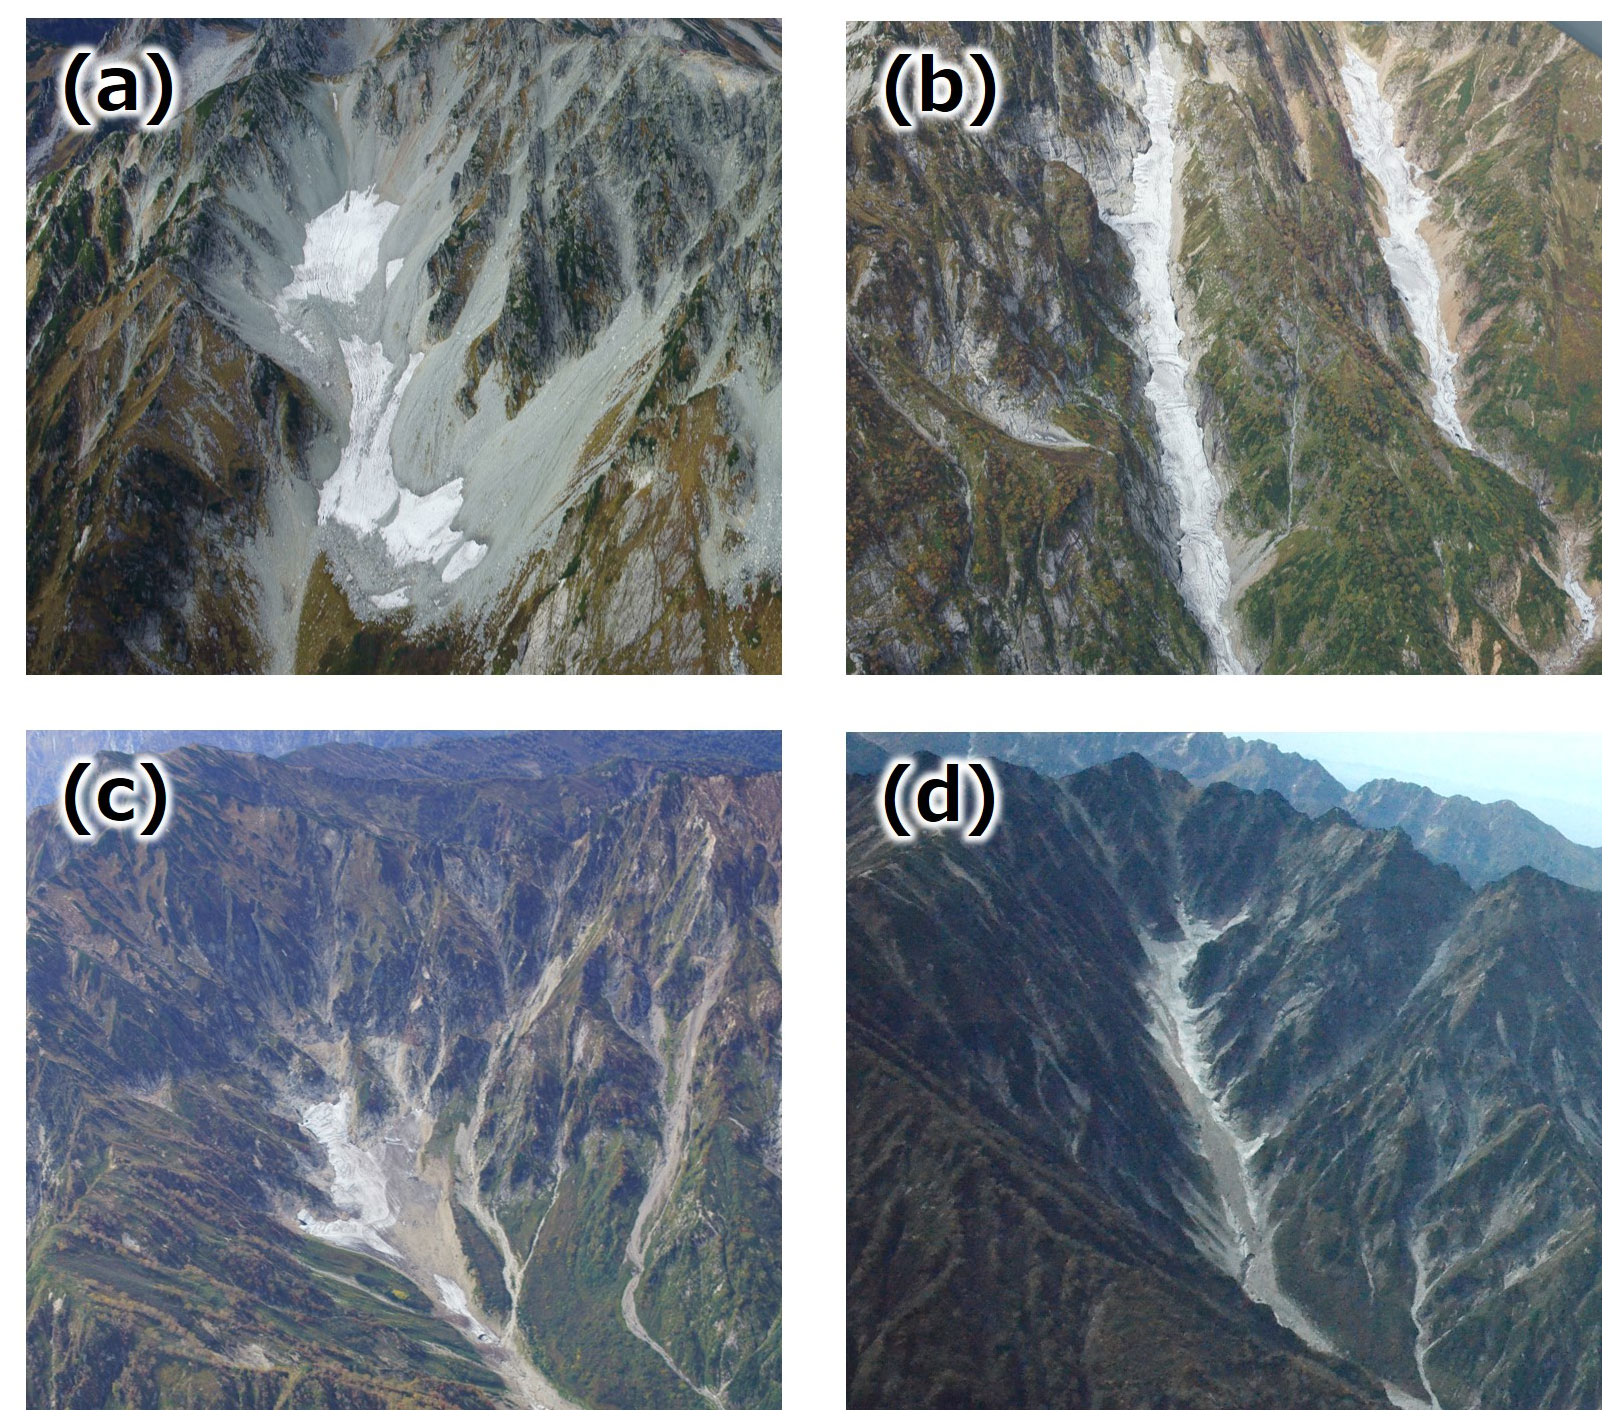
Figure 2The five very small glaciers (VSGs) in this study at the end of snowmelt season in 2016. (a) Gozenzawa. (b) Sannomado (left) and Komado (right). (c) Kakunezato. (d) Karamatsuzawa. All taken on 30 September.
The bedrock surrounding the Sannomado and Komado glaciers is diorite, whereas that for the Gozenzawa and Kakunezato glaciers is granite and that for the Karamatsuzawa Glacier is serpentine. These geological differences influence the differing amounts of sediment on the glacier surfaces. In particular, the Sannomado and Komado glaciers are clean-type glaciers with little debris, whereas the Gozenzawa, Kakunezato, and Karamatsuzawa glaciers have a debris-covered area in their middle and terminal regions during ablation years.
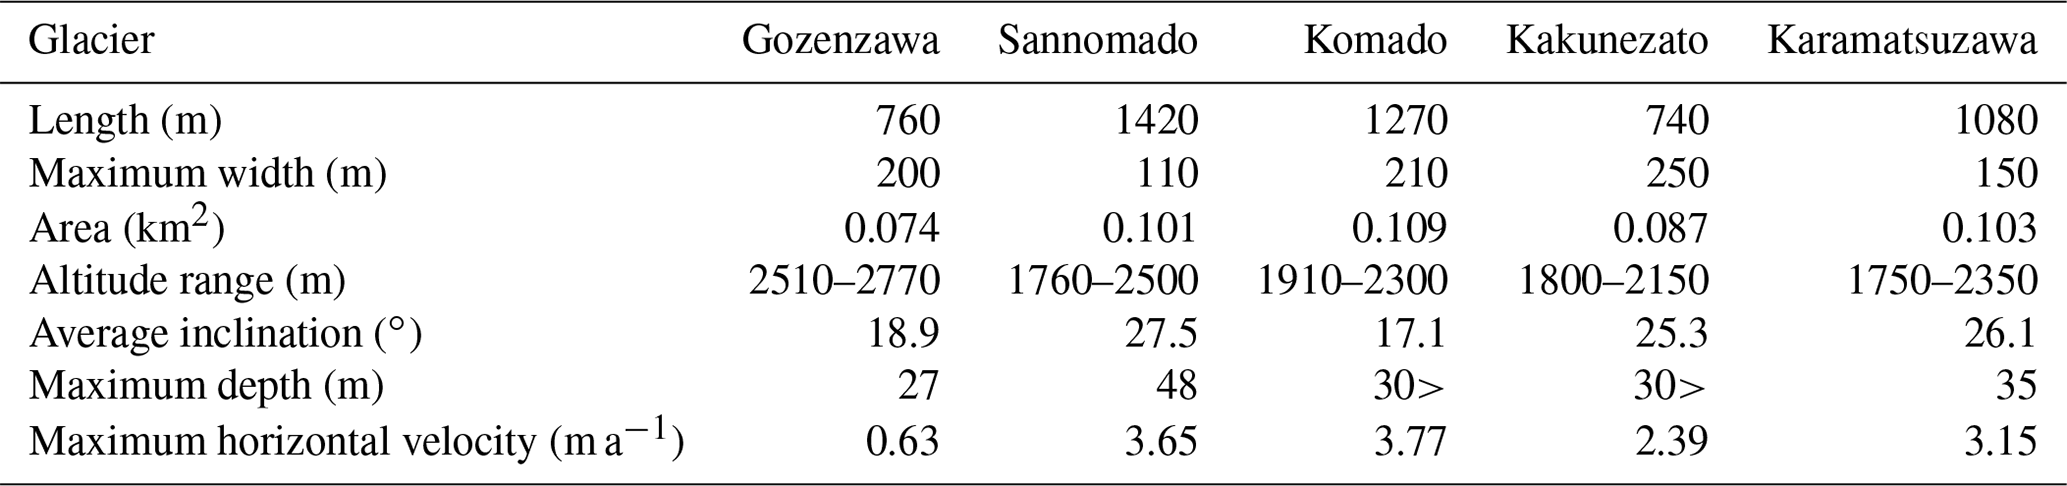
For further details about these glaciers, see Table 1 (also, Fukui and Iida 2012; Fukui et al., 2018, 2021; Arie et al., 2019).
Table 1Physical properties of the glaciers. Maximum depth and maximum horizontal velocity at Gozenzawa, Sannomado, Komado, and Kakunezato glaciers are from Fukui et al. (2018).
3.1 Data acquisition
We determine the altitude changes (annual, winter, summer) of the five glaciers by comparing multi-period DSMs created using aerial images and SfM–MVS software. The images were taken under clear weather with few clouds from a small Cessna aircraft at the end of the snowmelt season (late September to early October) and during the maximum snow depth season (late March to early April) from 2015 to 2019. Images were acquired on 9 October 2015, 16 March and 30 September 2016, 5 April and 30 September 2017, 10 April and 3 October 2018, 18 March, and 16 October 2019.
The cameras were a Sony Alpha 7 II (24.3 million pixels) from 2015 (end of snowmelt season) to 2018 (maximum snow depth season) and a Sony Alpha 7R II (42.4 million pixels) from 2018 (end of snowmelt season) to 2019 (end of snowmelt season). Images were taken every 2 s to obtain a complete view of the entire glacier and surrounding terrain from an altitude range of 3500–3800 m. The camera's “auto” mode was used from 2015 (end of snowmelt season) to 2017 (maximum snow depth season). From 2017 (end of snowmelt season) to 2019 (end of snowmelt season), we used a shutter setting of less than s and an ISO of 100–200, with the F value set to automatic. The flight route first visits Gozenzawa; then Sannomado, Komado, and Karamatsuzawa (from 2017) glaciers; and finally Kakunezato Glacier.
The observation period included both light and heavy snow years. For 1996–2018, the measured snow depths at Murododaira (2450 m) were the lowest in 2016 and second highest in 2017 (Iida et al., 2018).
3.2 SfM–MVS analysis
SfM is a calculation technique that allows automatic camera position determination in three-dimensional (3D) space. After estimating the camera positions, we use additional dense image-matching algorithms such as MVS to calculate the dense 3D point cloud of the surveyed object on an arbitrary relative scale (Piermattei et al., 2015). This relative scale must then be converted into an absolute scale to obtain geometric measurements using real-world coordinates or a known field distance (Dai et al., 2014).
Creating a DSM is as follows. First, high-density point cloud data are created from continuous aerial images using SfM–MVS. Next, multiple (three or more) ground control points (GCPs) are defined in the created point cloud data and geometrically corrected. Finally, these corrected data are used to create a DSM. Setting the GCPs is the only manual work in this process because PIX4Dmapper automates the first and last steps.
We set the GCPs using a DSM (resolution: 0.5 m) created from both aerial laser survey data (from the Ministry of Land, Infrastructure, Transport and Tourism) and orthophoto-corrected images of aerial images obtained at the time of the survey. The error in the height direction of the aerial laser survey data is 0.4–0.6 m in a region with large undulations (Sato et al., 2004). The aerial laser survey data are from the end of the snowmelt season in 2009 for the Sannomado and Komado glaciers, in 2010 for the Kakunezato Glacier, in 2011 for the Gozenzawa Glacier, and in 2014 for the Karamatsuzawa Glacier. The GCPs were positioned to surround the glacier. At the end of the snowmelt season, the GCPs were set at long-term immovable and easy-to-read buildings and rocks. In the maximum snow depth season, GCPs were set at an exposed rock wall without snow at the same location for each image. Figure 3 shows the locations of GCPs for each glacier and period. The number of GCPs for each glacier at the end of the snowmelt season are 17 at Gozenzawa Glacier, 28 at Sannomado and Komado glaciers, 17 at Kakunezato Glacier, and 17 at Karamatsuzawa Glacier. For the maximum snow depth season, these numbers are instead 5, 6, 5, and 7, respectively.
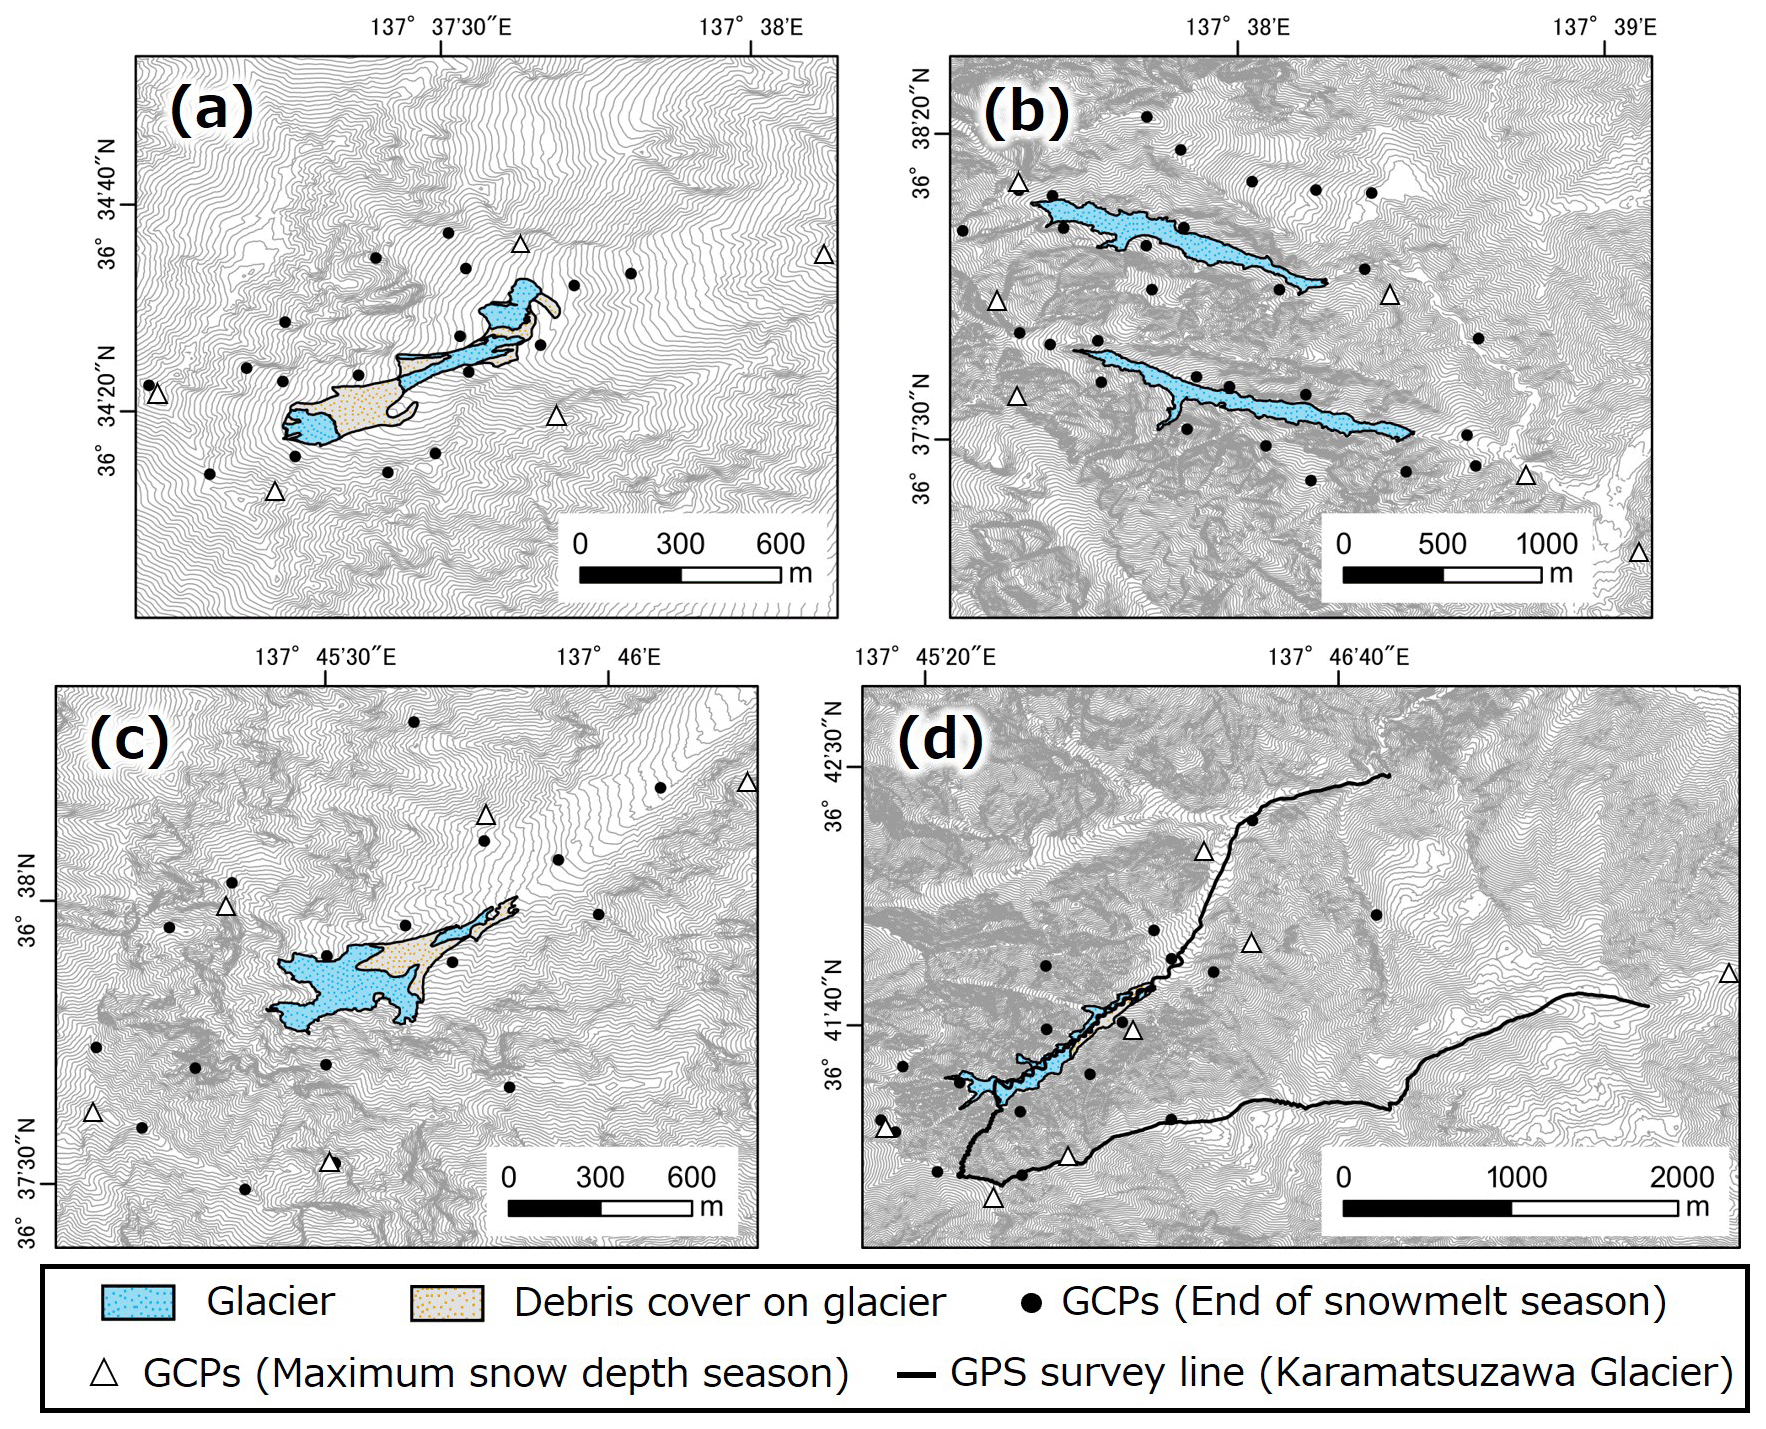
Figure 3Glacier area and GCP locations for each glacier and season. (a) Gozenzawa. (b) Sannomado (lower) and Komado (upper). (c) Kakunezato. (d) Karamatsuzawa. Black line of panel (d) is the GPS survey line. Contour interval is 10 m.
3.3 Geodetic mass balance determination
In the geodetic method, the mass balance of glaciers is estimated by the change in volume as judged by comparing the DSMs for two periods and multiplying the result by the estimated ice density (Huss, 2013; Piermattei et al., 2016). This estimated relative volume change equals the surface mass balance plus the vertical component of glacier flow (i.e., the emergence velocity). Therefore, to express the surface mass balance, one integrates the relative volume change for the entire glacier to remove the vertical flow component (Ohmura, 2010). The resulting mass balance B is
where B is expressed in meters of water equivalent (m w.e.), δV is the relative volume change (m3), ρ is the snow and ice density (kg m−3), and A is the glacier area (m2).
For the calculation of annual mass balance, we first determine annual δV by comparing DSMs from the end of one snowmelt season to the end of the next. The area A is determined at the end of the snowmelt season, an approach called a stratigraphic system (Cogley et al., 2011). With the stratigraphic system, the aerial images should be taken just before first snowfall at the end of snowmelt season. However, there is a gap of a few days as the stratigraphic system, due to aerial image, is only taken under clear weather conditions.
Here, differences between DSMs are calculated using a geographic information system (GIS). For the ice density, the average value for Gozenzawa is 695 kg m−3 in the top 0.7 m (570–740 kg m−3) and 860 kg m−3 at depths below 0.7 m (824–907 kg m−3) at the end of the snowmelt season (Fukui et al., 2018, 2021). In the perennial snow patches in Japanese mountains, snow transitions to glacier ice during a 1-year period (Kawashima, 1997); therefore, the layer between the snow surface and a depth of 0.7 m consists of residual snow from the previous winter, whereas the deeper layer consists of ice formed earlier. For annual mass balance calculations for all glaciers, we used a snow and ice density of 695 kg m−3 if the balance was positive and 860 kg m−3 if the balance was negative.
We also compare DSMs created for the maximum snow depth season with those for the end of the snowmelt season and calculate the change in relative volume during the accumulation and ablation seasons. The accumulation depth is calculated by dividing the relative volume change during winter by the entire glacier area. For ablation, we instead use that during summer. Due to the uncertainty of the winter snow density, including that in avalanche deposits, it is difficult to calculate the exact winter and summer balance. At Murododaira, which is flat and not affected by the topographical influence of avalanches and snowdrifts, Iida et al. (2018) measured the density in the snow-cover cross sections in late March 1996–2018, getting an average of 431 kg m−3. However, in avalanche deposits, the snow density is larger than that in snowfall snow layers (Naruse et al., 1986; Abe et al., 2016), with Shimizu et al. (1974) finding a value of 590 kg m−3 for this region. Here, we calculate the winter and summer balances using the winter snow density of minimum value 431 and maximum value 590 kg m−3 and relative volume change during the accumulation and ablation seasons.
We apply these calculations for the Gozenzawa, Sannomado, Komado, and Kakunezato glaciers in 2015–2016, 2016–2017, 2017–2018, and 2018–2019, as well as for the Karamatsuzawa Glacier in 2017–2018 and 2018–2019. For each glacier, the mass balance calculation uses the glacier area when this area was smallest for 5 years. This occurred on 16 October 2019, for Gozenzawa, Sannomado, Komado, and Karamatsuzawa glaciers, and on 30 September 2016, for Kakunezato Glacier.
3.4 Data accuracy
Following the method in Immerzeel et al. (2014), we estimate the error for the annual mass balance at the end of the snowmelt season by first creating a 10 m wide buffer zone around the outside of the glacier area on the base area (Fig. 4). Then, we calculate the geodetic annual mass balance error as the mean and standard deviation (SD) of the altitude difference in the buffer zone.
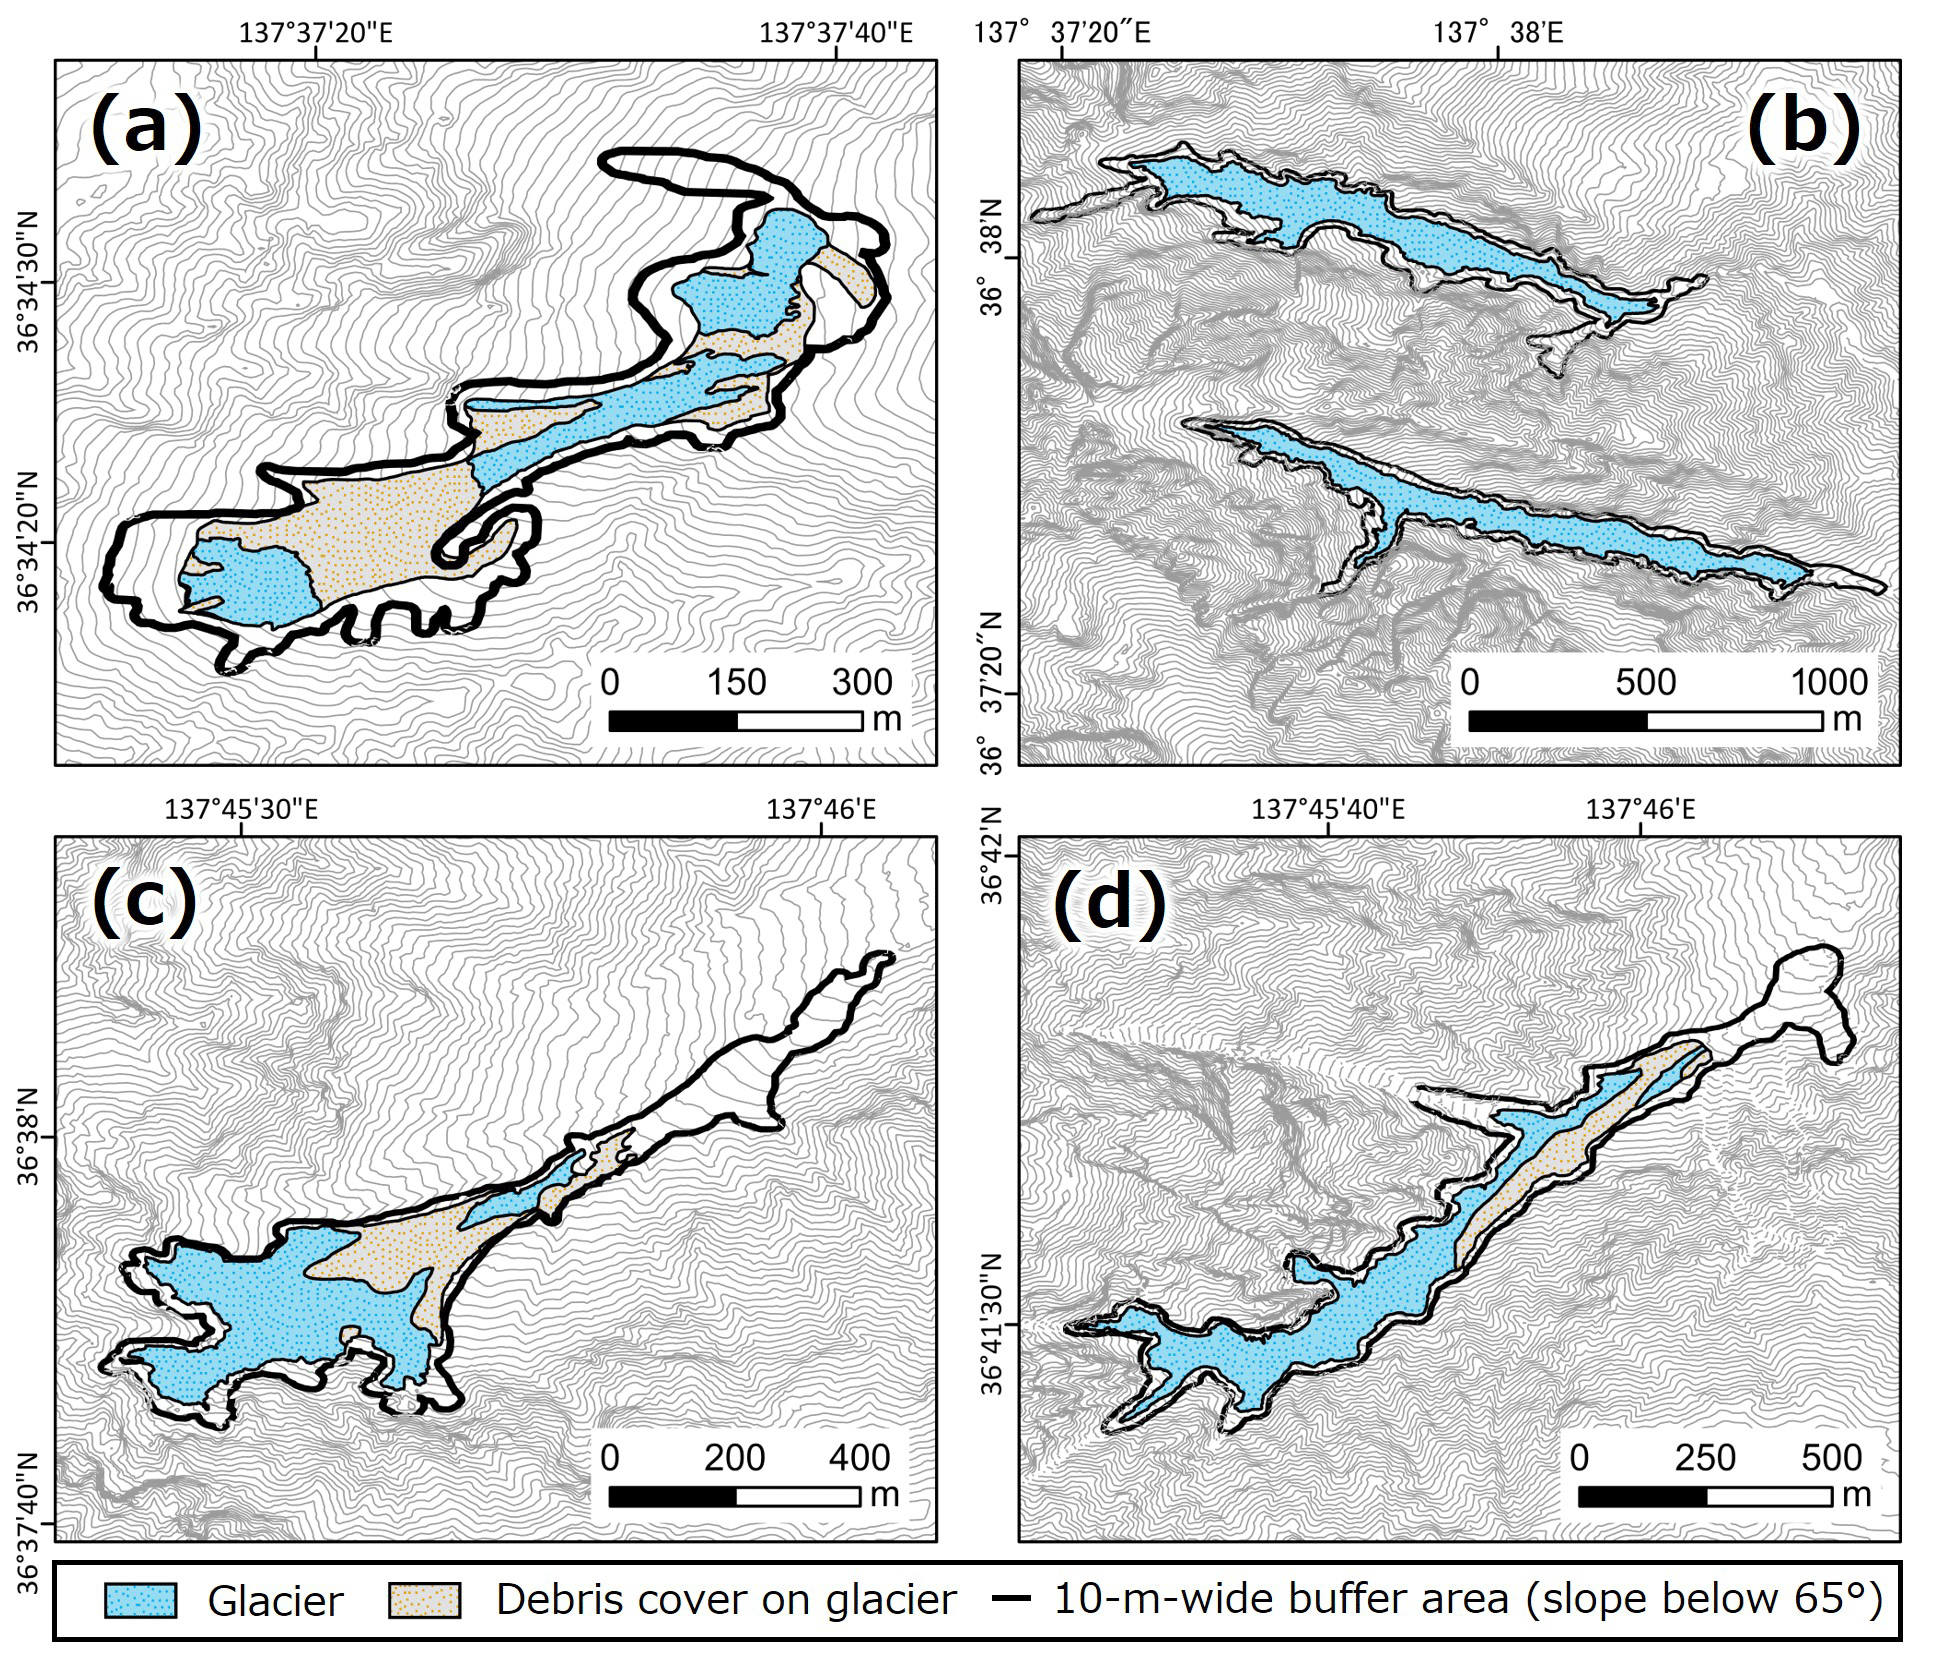
Figure 4Glacier area and 10 m wide buffer zone used for uncertainty estimate. (a) Gozenzawa. (b) Sannomado and Komado. (c) Kakunezato. (d) Karamatsuzawa. Contour interval is 10 m.
However, because the base area is covered with snow during winter, we must use a different method to estimate the accumulation and ablation depth error. For this estimate, we ran kinematic GPS surveys of Karamatsuzawa Glacier and the ridge between Mt. Karamatsu and Happoike-Sanso (mountain hut) 1 d after the aerial photography (Fig. 3). We then equate the geodetic seasonal mass balance error as the SD of the altitude difference between the measured kinematic GPS data for 19 March and the DSM of Karamatsuzawa Glacier on 18 March, both in 2019. The GPS surveying instrument is the GEM-1 (Enabler; formerly GNSS Technologies), with calculated coordinates of the GPS antenna and post-processing using the open-source program RTKLIB (version 2.4.3) with the base station data of the Hakuba electronic reference point of the Geospatial Information Authority of Japan (Fig. 1).
3.5 Mass balance amplitude
The mass balance amplitude (α) equals the average of the absolute values of the winter (Bw) and summer (Bs) balances:
Using this Eq. (2) with winter and summer balances calculated during 2015–2019, we estimate the mass balance amplitude for the Gozenzawa, Sannomado, Komado, and Kakunezato glaciers. We then compare these 4-year averages to the average mass balance amplitude of other glaciers worldwide. The worldwide glaciers were all glaciers observed for periods longer than 5 years according to the “fluctuations of glaciers” database of the World Glacier Monitoring Service (WGMS, 2020). Glacier locations are shown in Fig. 5.
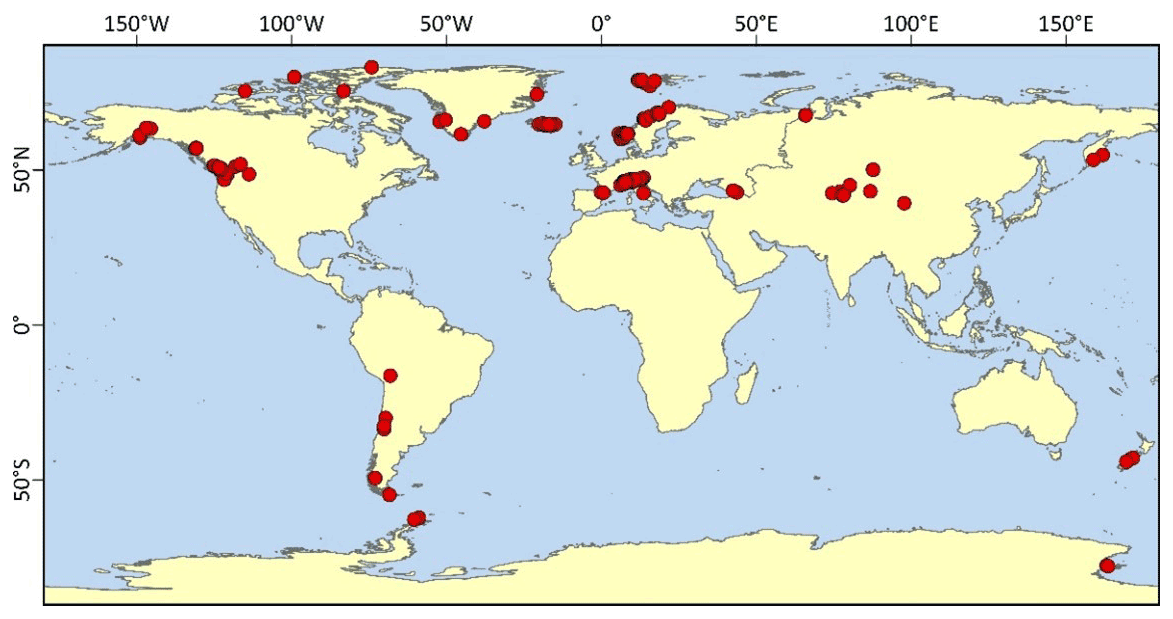
Figure 5Glacier locations used for comparison of winter and summer balances (from WGMS, 2020). All glaciers had been observed for periods longer than 5 years. The numbers of glaciers in each region are 51 in Alps, 7 in Andes, 3 in Antarctica, 3 in Arctic North America, 3 in Caucasus, 2 in Dry Valley, 5 in Greenland, 13 in high-mountain Asia (HMA: Tien Shan, Altai, Qilian), 12 in Iceland, 2 in Kamchatka, 3 in New Zealand, 38 in Scandinavia, 9 in Svalbard, 2 in the Urals, and 27 in western North America.
3.6 Mass balance profile and emergence velocity
On many glaciers, the amounts of ablation and accumulation vary systematically with altitude, and thus the mass balance has an altitude profile, and the rate at which mass balance changes with altitude is termed mass balance gradient (Benn and Evans, 2014). In general, the amount of ablation and accumulation increases with altitude due to the decrease in temperature.
We divided each glacier region into 10 m altitude intervals and calculated the profile of altitude changes (annual, winter, summer) using the altitude changes of each interval. This was done for the Gozenzawa, Sannomado, Komado, and Kakunezato glaciers because they were observed for 4 years. However, altitudinal changes calculated by the geodetic method include both the surface mass balance and the emergence velocity (as explained in Sect. 3.3). Thus, the profile is evaluated using the estimated emergence velocity.
The emergence velocity (Ve) is expressed using the flux method as
where Q is the ice flux into and out of the target area, W is the average glacier width, and x is the longitudinal length of the target area (Nuimura et al., 2011).
The ice flux at the boundaries of the target area is
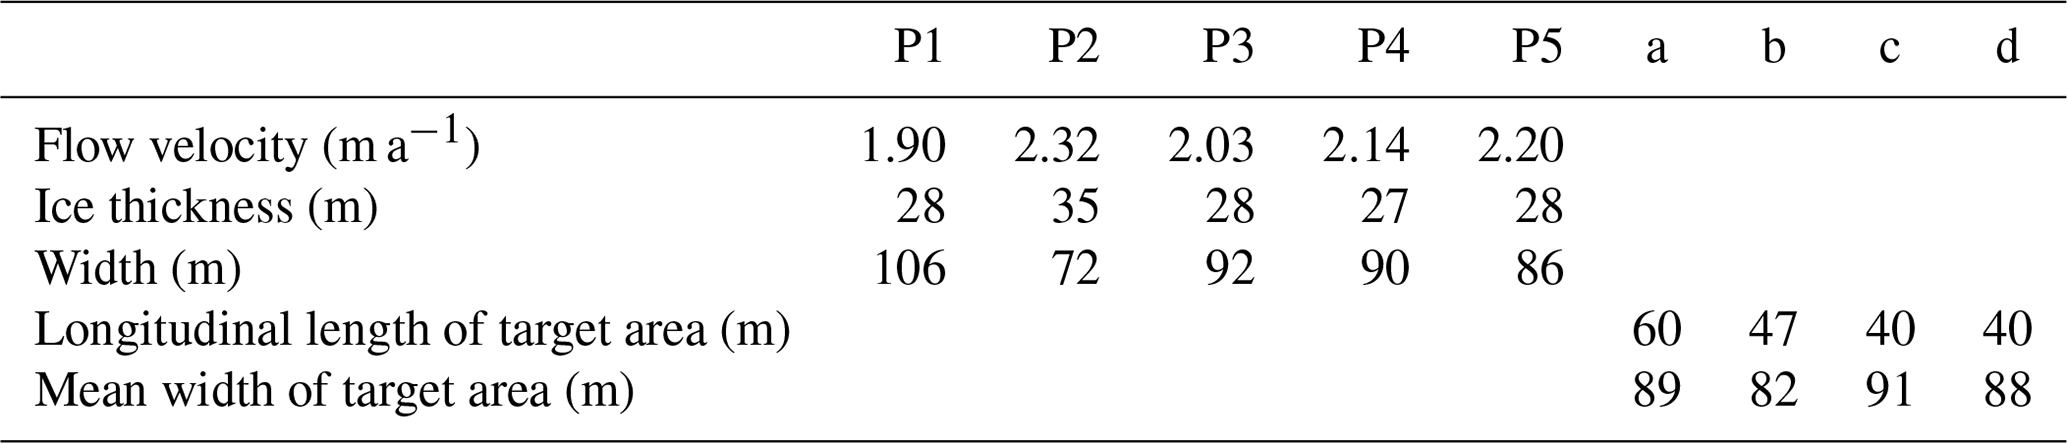
where W, h, and v are the glacier width, depth, and flow velocity (Nuimura et al., 2011). For the Karamatsuzawa Glacier, we measured W and v and used the depth measurement from an earlier study (Arie et al., 2019). For the flow v, we measured the stake locations on 22 October 2019 using a GEM-3 GNSS surveying instrument (Enabler) and then calculated the annual flow by comparing to their locations in 2018 (Arie et al., 2019). The earlier study had inserted 4.6 m long stakes at five points on the glacier (Fig. 6, P1–5) and used GNSS surveyors to measure the stake locations on 23 October 2018 (as a check, we also compared a base point located near the glacier terminus (Fig. 6, P6) between 2018 and 2019). With the five flow measurements, we determine Ve. We then use the maximum value as the mass balance profile error for four glaciers.
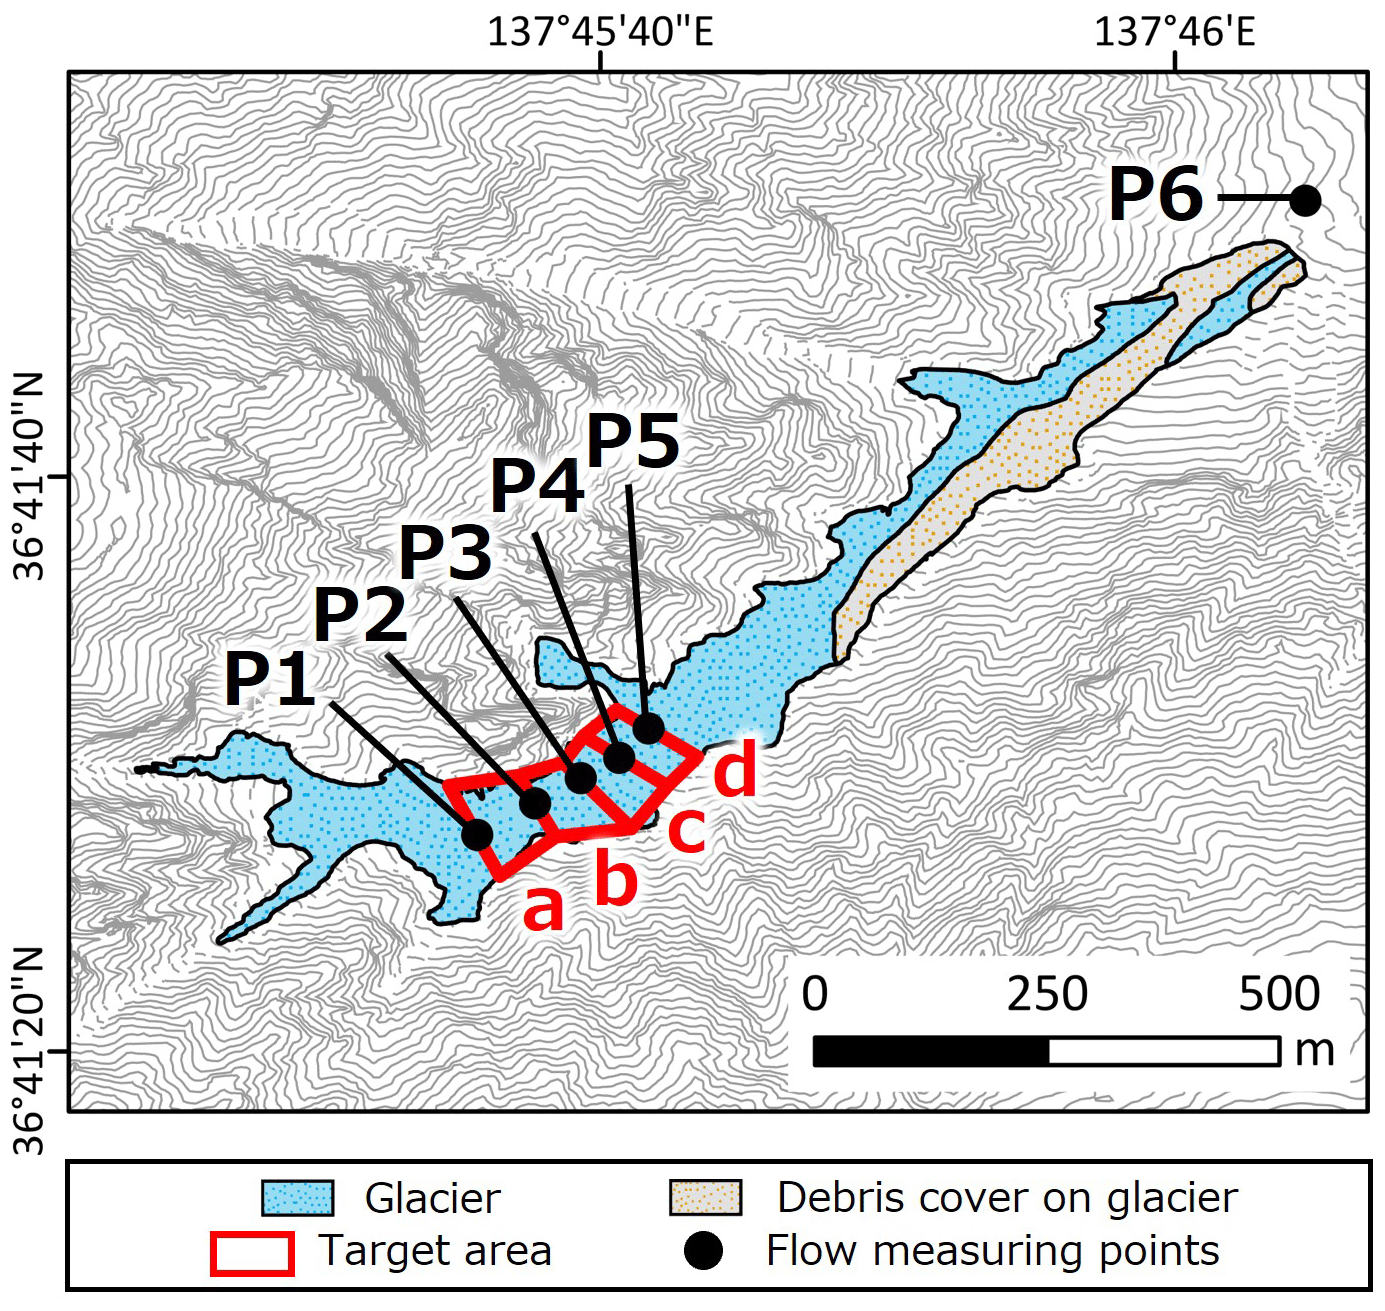
Figure 6Target area for emergence velocity estimation and flow measurement point on the Karamatsuzawa Glacier. Contour interval is 10 m.
4.1 Data accuracy
For the different DSMs, the SD of differences in slope within the 10 m buffer zone around the glacier area increases with the slope of the terrain, particularly above 60∘, as shown in Fig. 7a. Such an increase is consistent with the finding of Piermattei et al. (2016). However, regions with a slope below 65∘ account for over 75 % of the total buffer area (Fig. 7b).
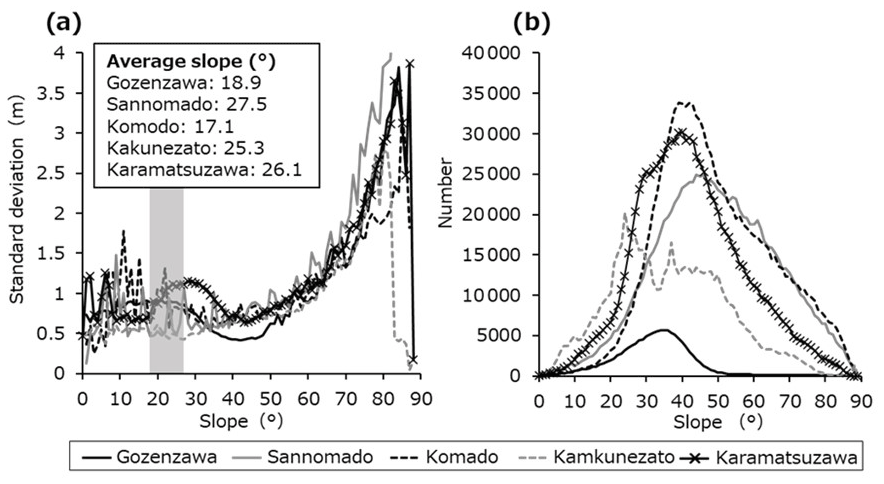
Figure 7Comparison of the DSMs for the end of the 2017 and 2018 end of snowmelt seasons. (a) The standard deviation SD of differences in slope between the different DSMs used. (b) The number of pixels within the 10 m buffer around the glacier area. Shaded band along abscissa axis is the range of average slopes of the five glaciers.
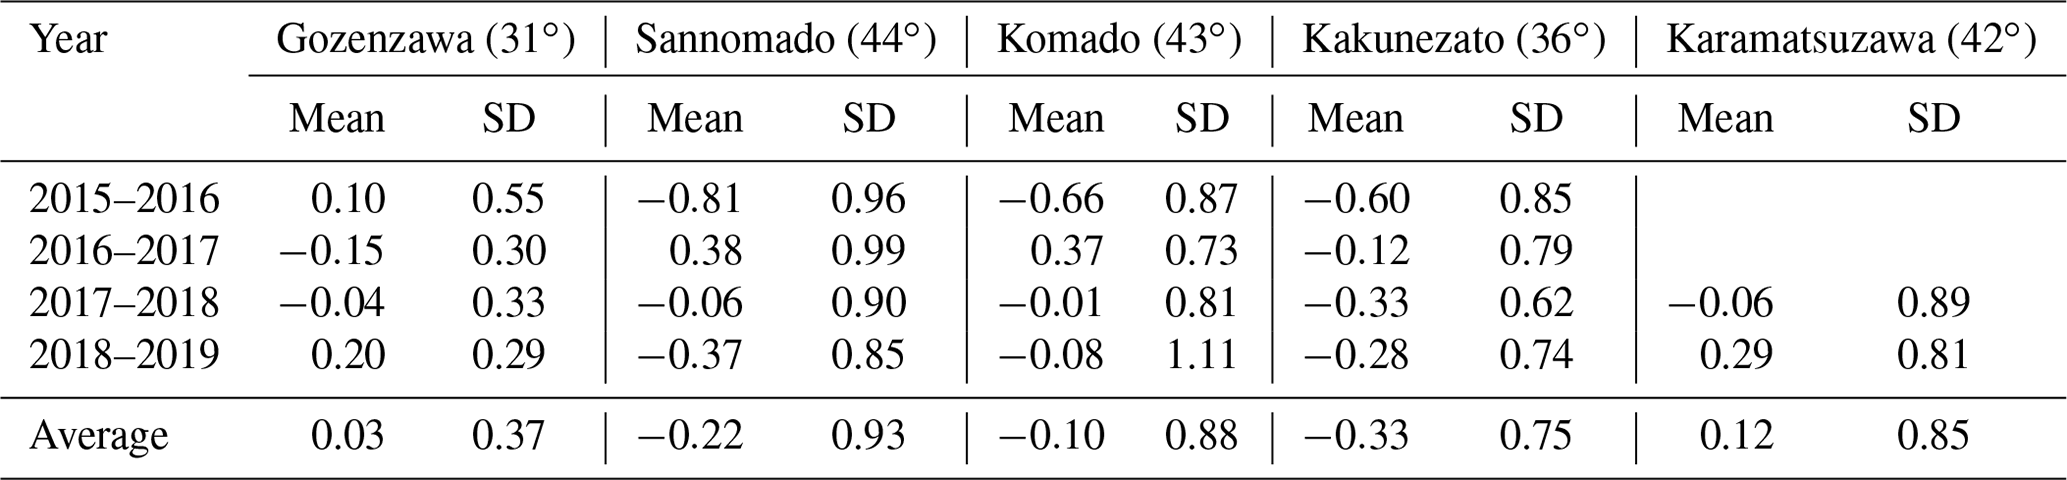
Thus, we evaluated the value in the 10 m buffer zone around each glacier, excluding regions exceeding an inclination of 65∘. Table 2 shows that all mean and SD values are below 1 m, except for 2018–2019 on Komado Glacier where the SD is 1.11 m. As the glacier slopes and buffer regions sloped less than 65∘, the annual mass-balance-calculation method has sufficient accuracy.
Table 2Mean and SD of the altitude differences (m) in the DSMs for the 10 m wide buffer zone around each glacier except places with an inclination exceeding 65∘ in the given years. In parentheses are the mean slopes in this buffer region.
To evaluate DSM accuracy during the maximum snowfall season, the day after obtaining aerial images for this season we obtained surface altitude data via a kinematic GPS survey. The survey was done when a researcher attached a GPS antenna to their pack, then walked the ridge between Mt. Karamatsu and Happoike-Sanso, and then snowboarded down Karamatsuzawa Glacier. The mean and SD of the altitude differences between the Karamatsuzawa Glacier DSM (18 March 2019) and that from the GPS data (19 March 2019) are 1.89 and 1.73 m, respectively. Assuming an average height of 1.5 m from the ground to the antenna (on the pack), the mean and SD of the altitude difference between the DSM and GPS survey data are 0.39 and 1.73 m, respectively. We used this SD value as the altitude-difference error for the winter and summer seasons.
4.2 Mass balance
For all glaciers, the annual mass balance is negative in all years except 2016–2017 (Table 3), a heavy snow year. All glaciers are also consistent in all having their largest mass reduction in 2015–2016, a light snow year. In this year, the ablation area extends throughout each glacier (first column, Fig. 8), whereas in the heavy snow year that followed (2016–2017), each glacier is entirely an accumulation area (second column, Fig. 8). These characteristics agree with Fukui et al.'s (2018, 2021) findings for the Gozenzawa Glacier.
Table 3Relative altitude change and annual mass balance of each glacier calculated from comparison of the DSMs at the end of snowmelt season. Corrected data were calculated using the mean and SD in Table 2. We subtract the mean value of the difference in the buffer zone from the value of the difference on the glaciers. The SD of buffer zone is used as the error (±).
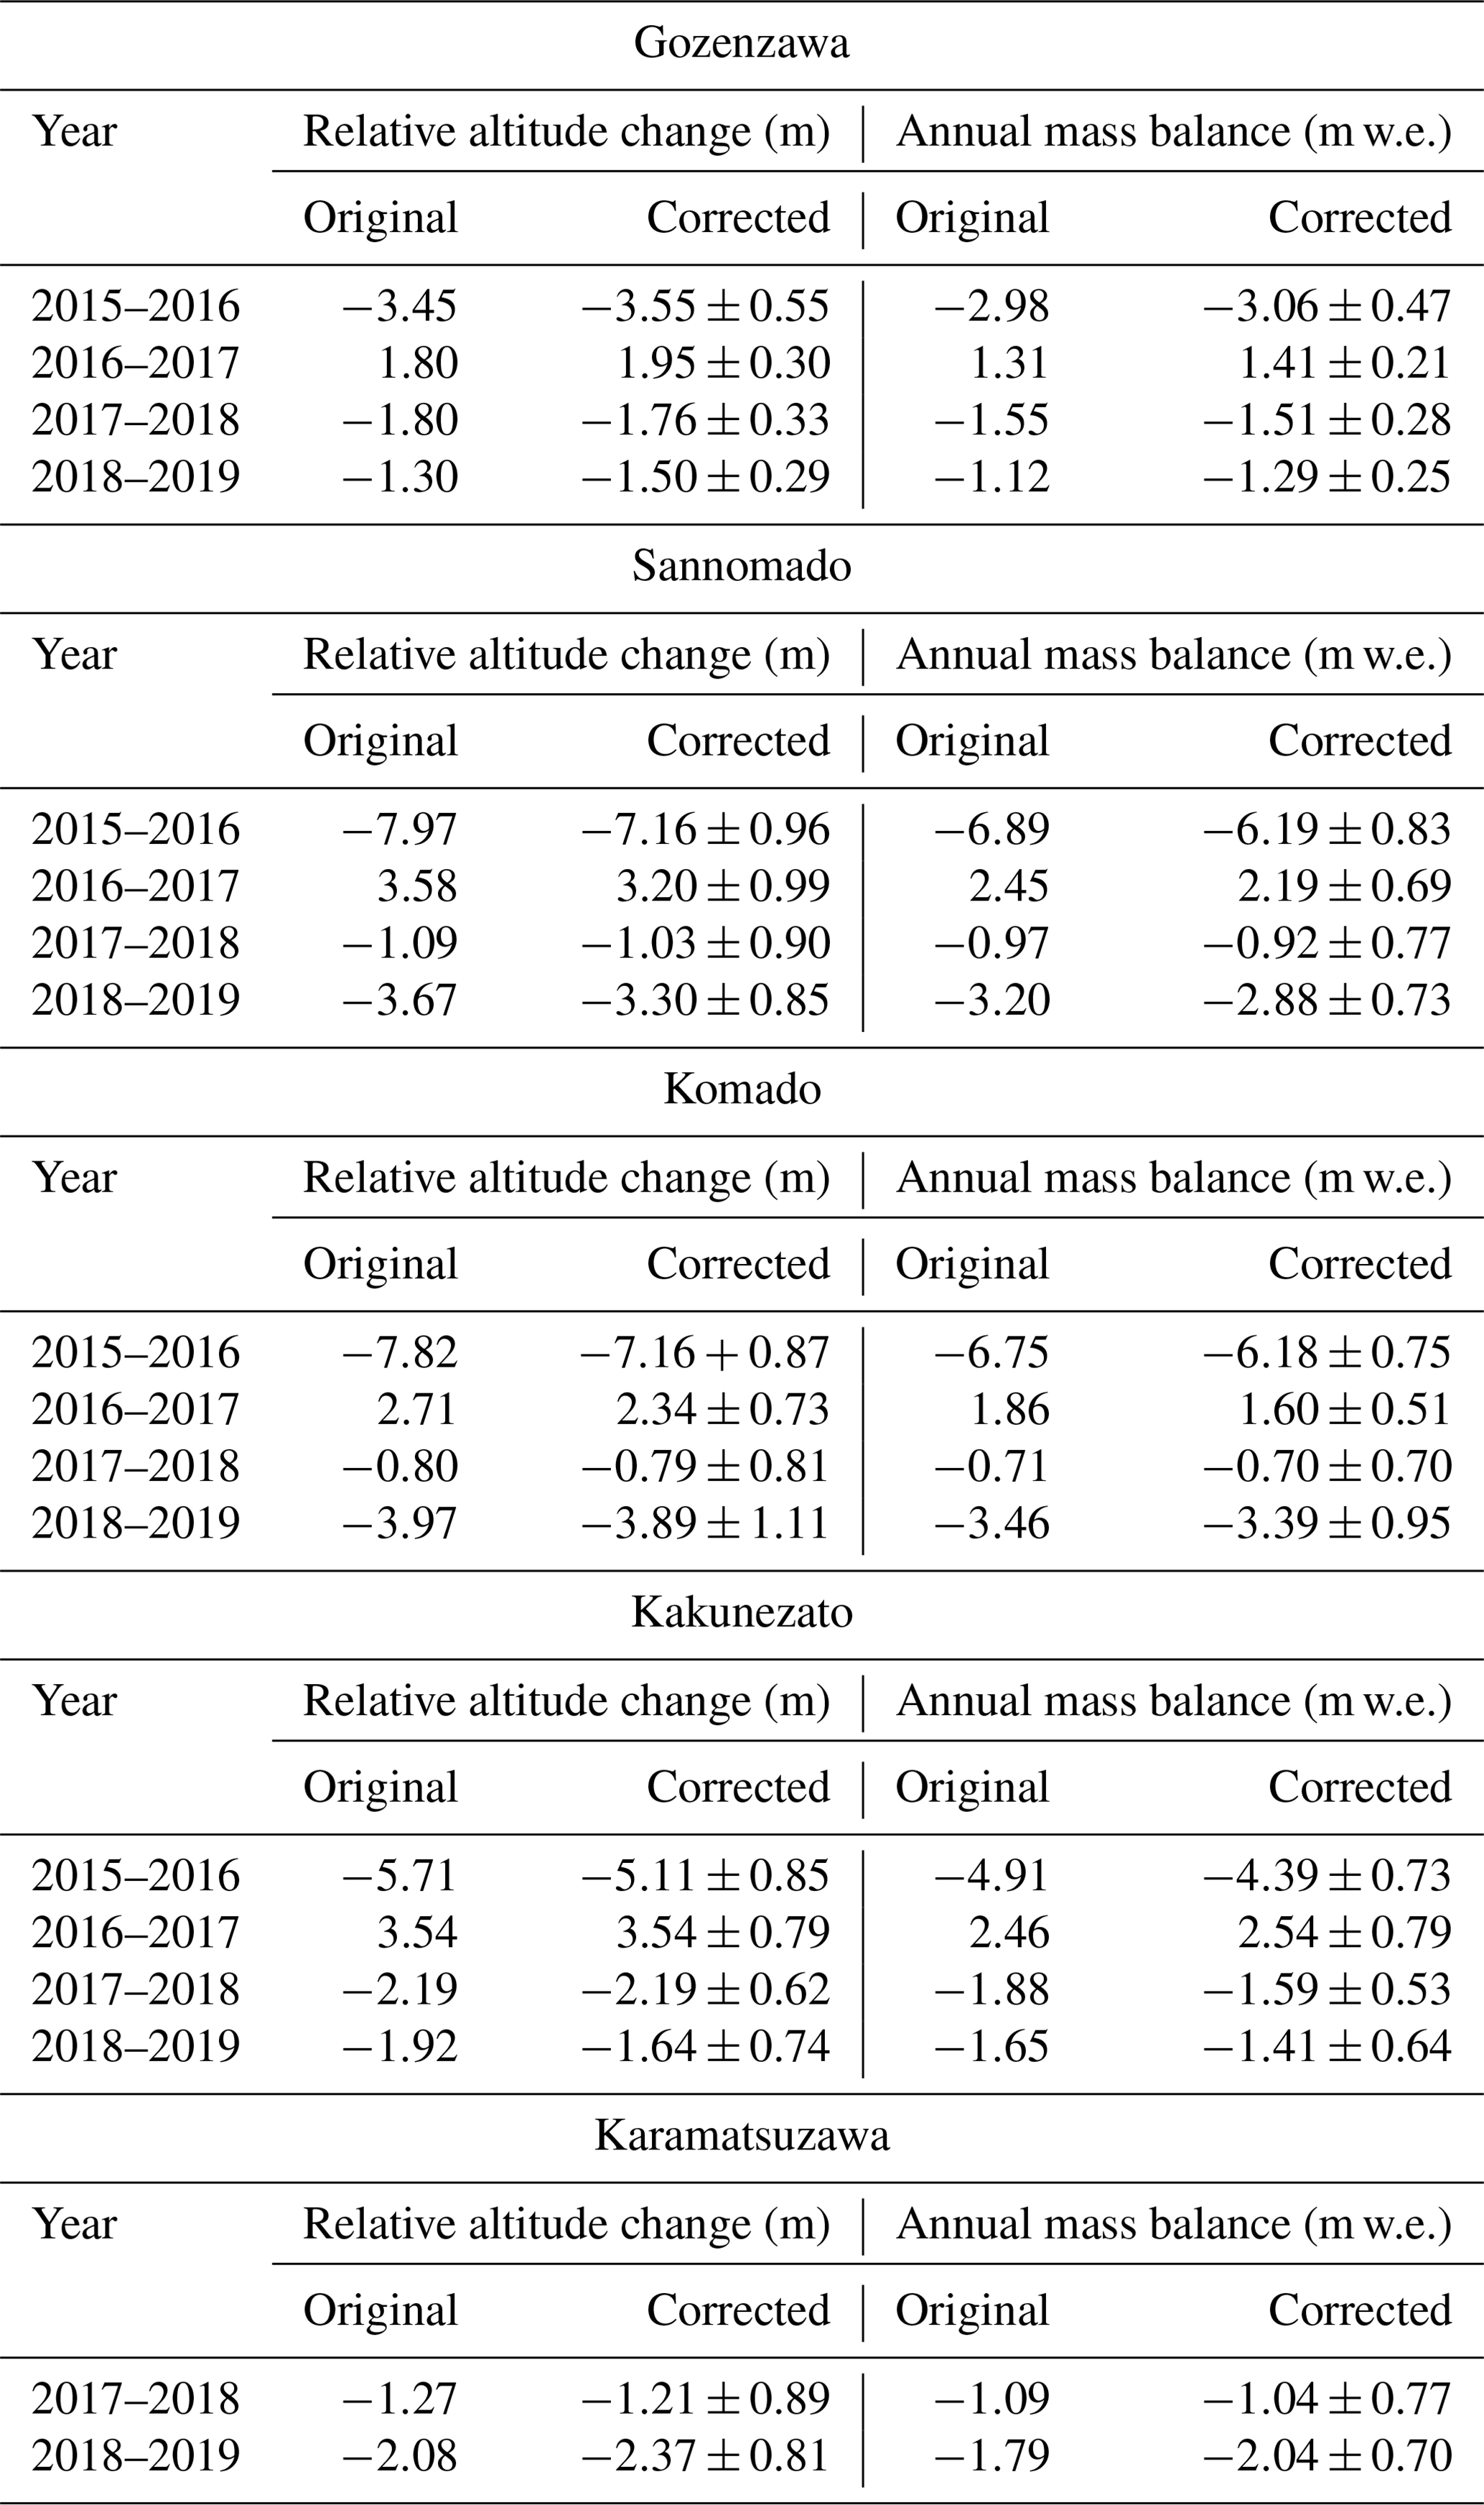
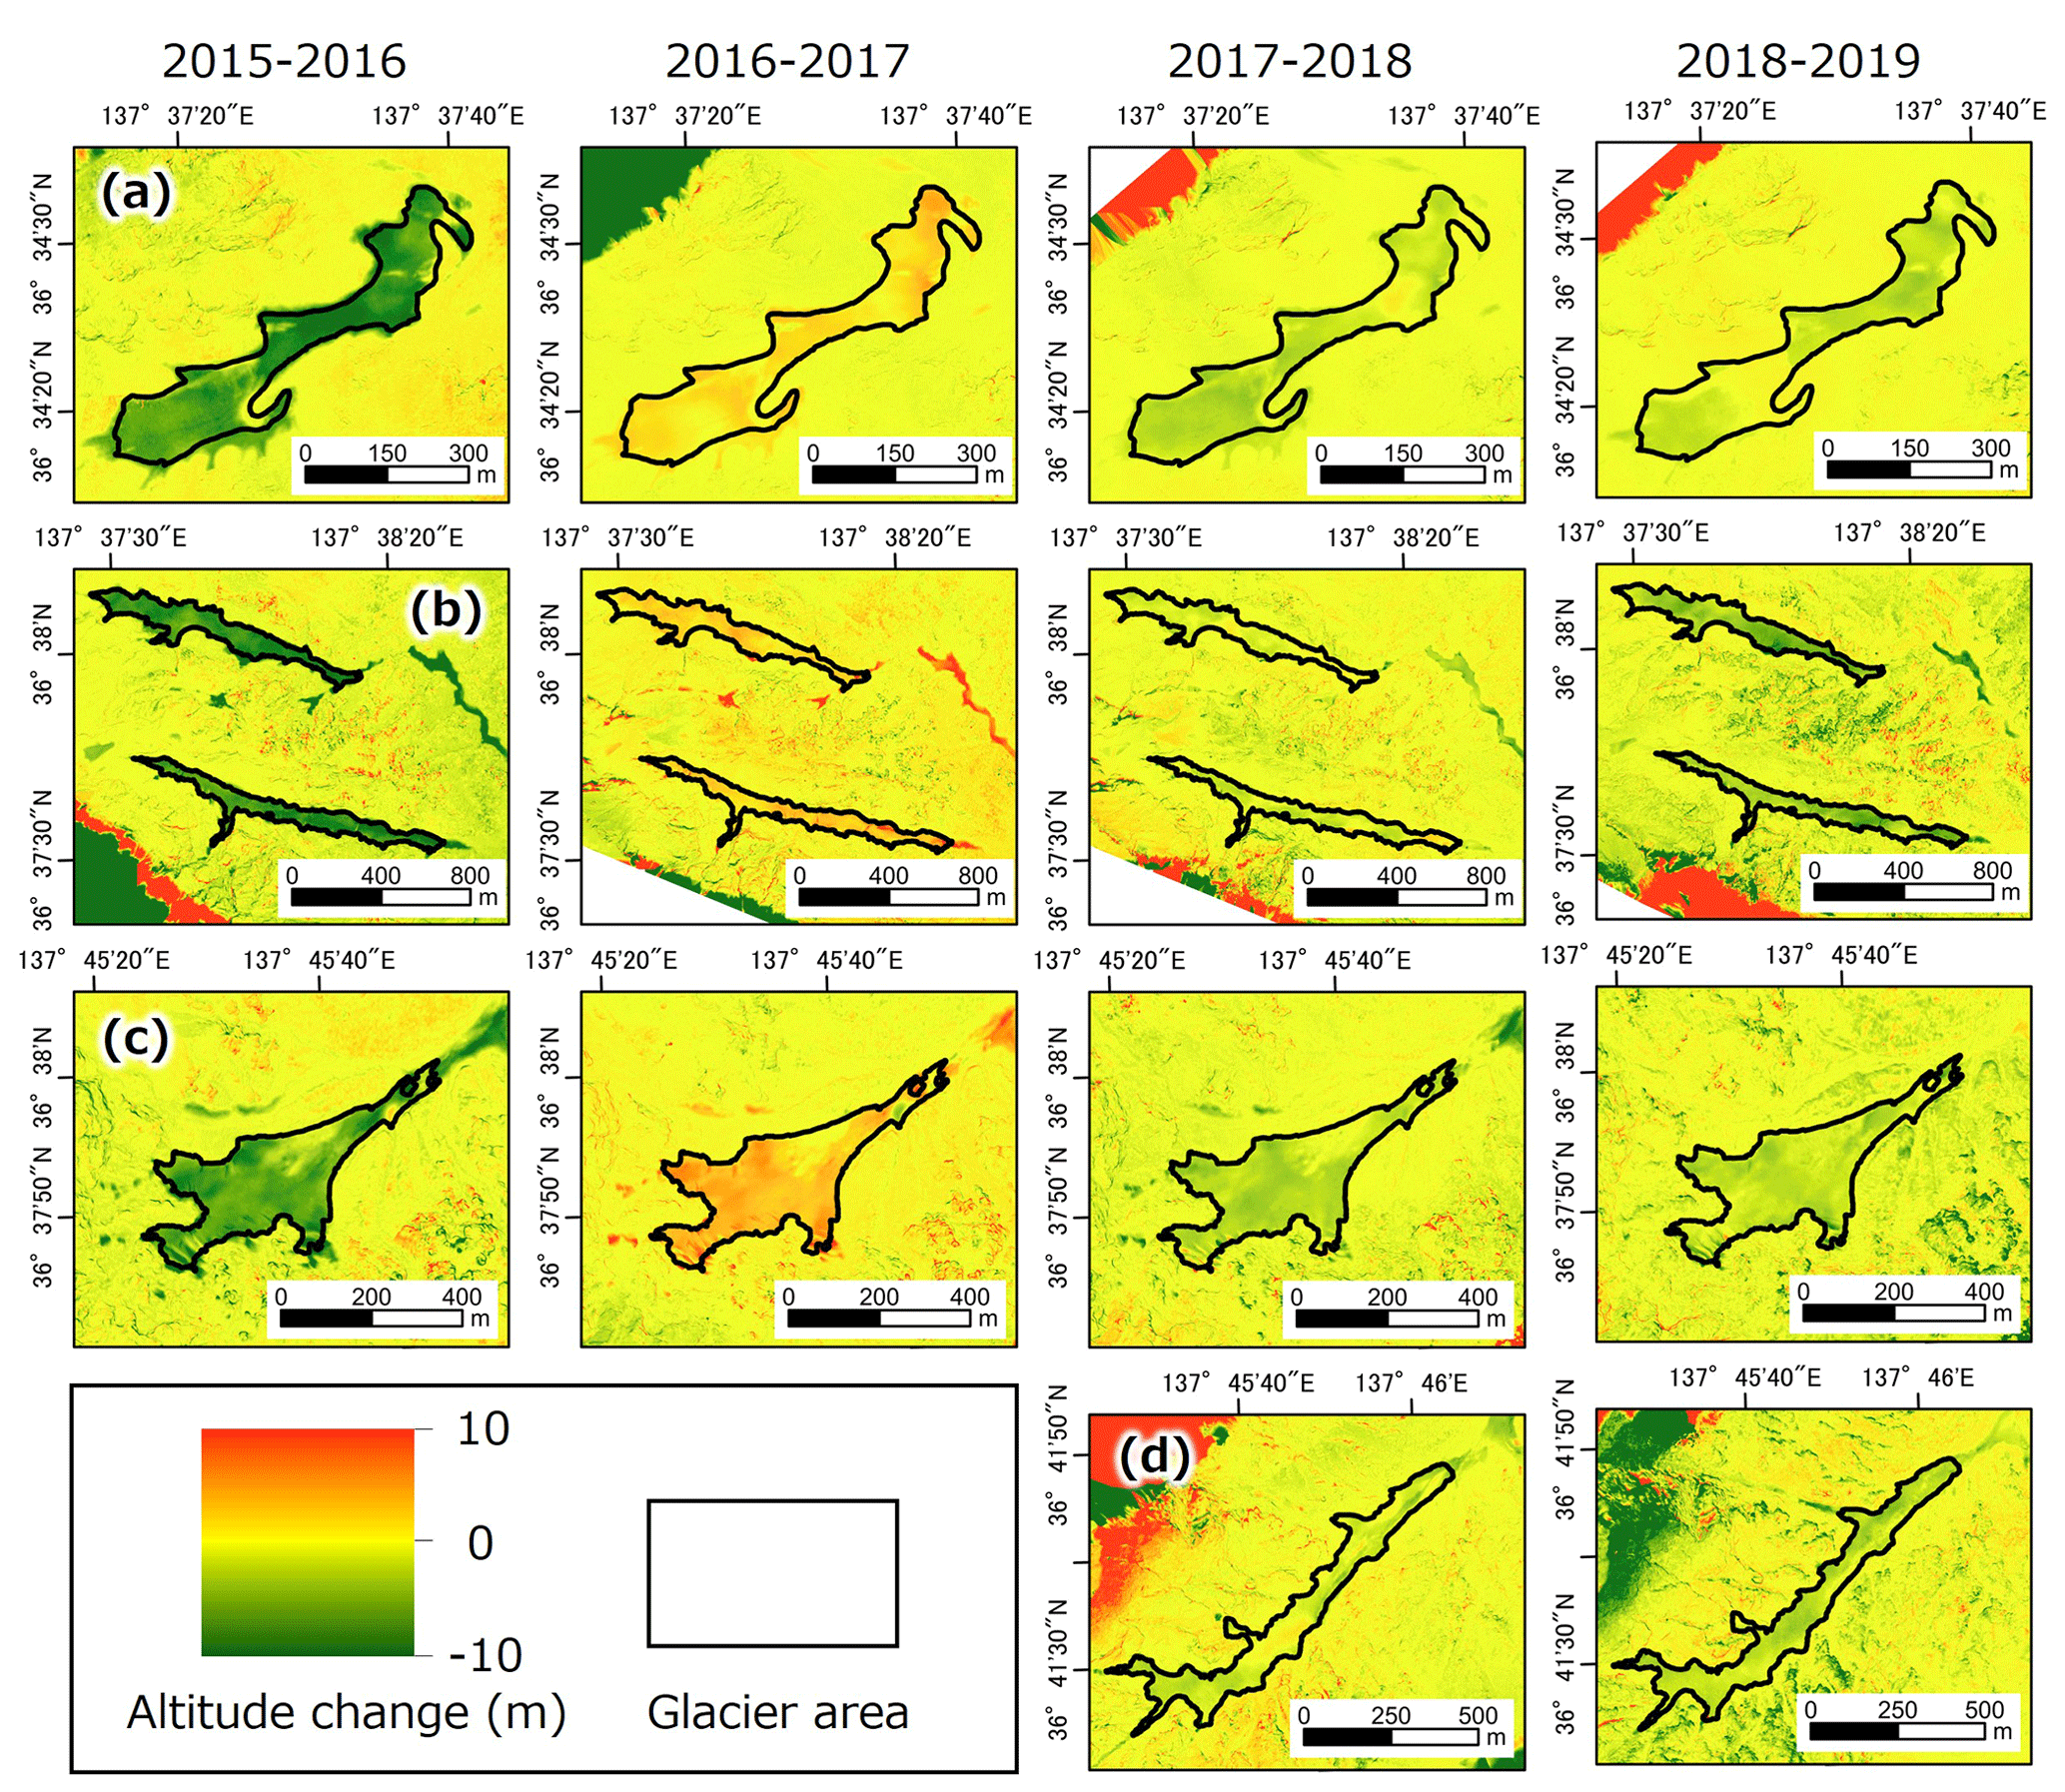
Figure 8Annual altitude changes of each glacier and year. (a) Gozenzawa. (b) Sannomado (lower) and Komado (upper). (c) Kakunezato. (d) Karamatsuzawa.
For the accumulation depth, the values for all glaciers are 13–30 m, as shown in Table 4. We can compare this value to the average snow depth of 6.8 m on Murododaira (1996–2018) (Iida et al., 2018). Unlike the glaciers, the terrain at Murododaira (2450 m) is flat and not affected by the topographical influence of avalanches and snowdrifts. But glaciers in this region have an accumulation depth of 13–30 m, or over 2–4 times as much as the snow depth at Murododaira. Presumably, this additional accumulation is from avalanches and snowdrifts.
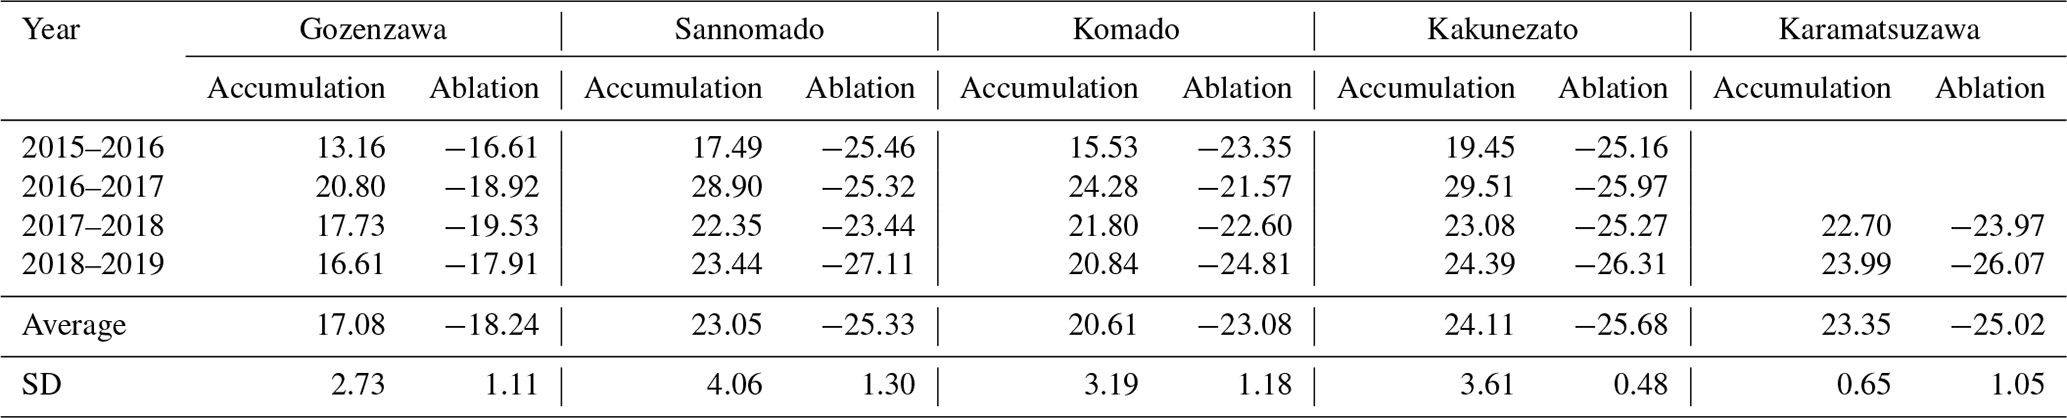
Between the light and heavy snow years, the accumulation depth increases by about 8–11 m (Table 4), whereas their ablation depth remains about the same. This difference in behavior between summer and winter can be seen to occur throughout the 4-year period in the plots in Fig. 9. Namely, the ablation depth is much less variable compared to the variations in the annual mass balance and accumulation depth.
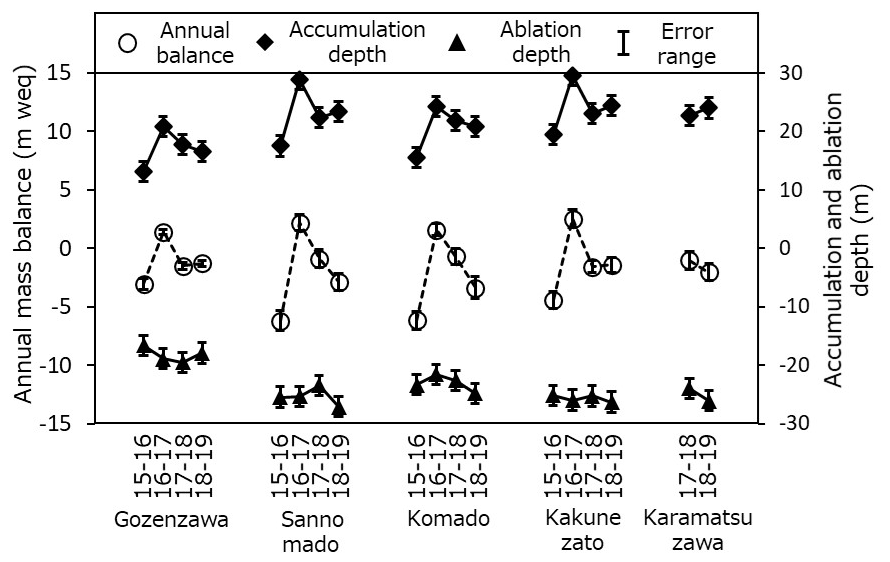
Figure 9Annual mass balance, accumulation depth, and ablation depth of each glacier in 2015–2019.
The cumulative mass balances are shown in Fig. 10. From 2015 to 2019, the trends show a significant mass loss, decreasing by 4–5 m w.e. for the Gozenzawa and Kakunezato glaciers, which had debris cover. For the Sannomado and Komado glaciers, which did not have debris cover, the loss is larger, at 7–9 m w.e. The Karamatsuzawa Glacier also has a significant mass loss, though the period covered is only 3 years (2017–2019). These balances are closely correlated between the five glaciers over this period (Figs. 9 and 10).
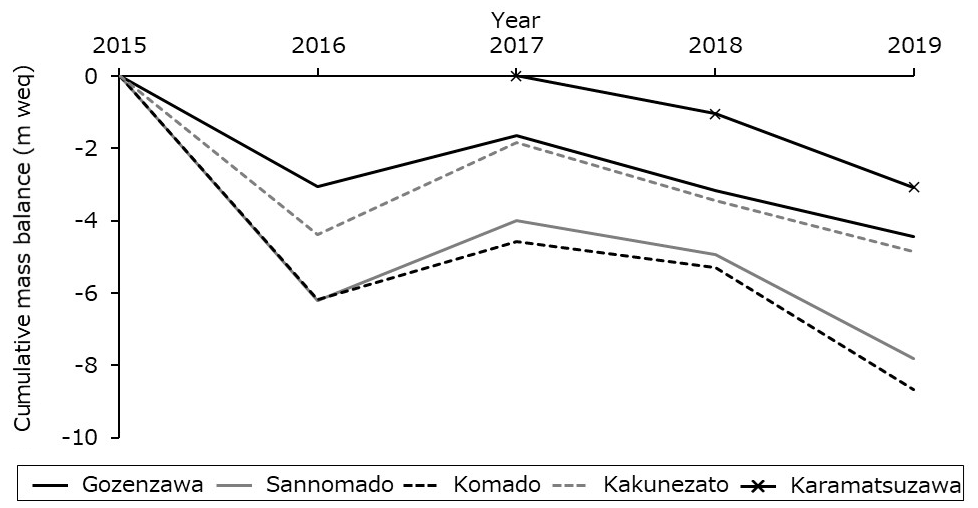
Figure 10Cumulative mass balance of each glacier with baseline of 2015 (2017 for Karamatsuzawa).
4.3 Mass balance amplitude
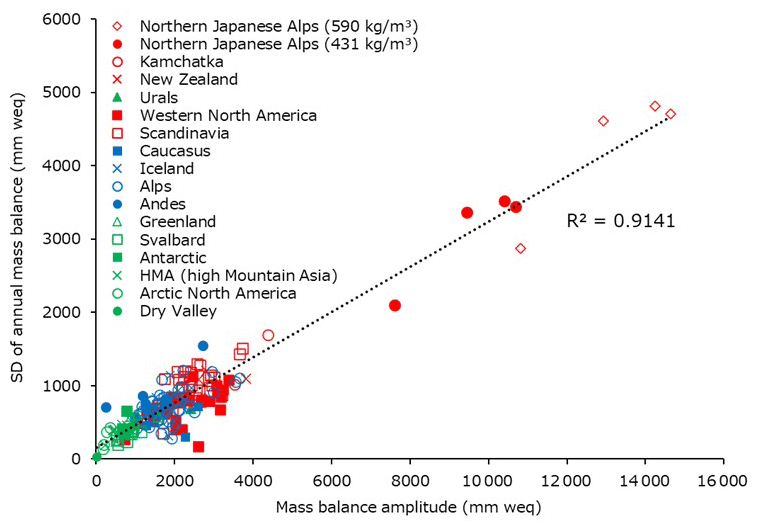
The mass balance amplitudes of these four glaciers are much higher than glaciers studied elsewhere, even in the case when the snow density is 431 kg m−3. We plot the comparison in Fig. 11. In general, the mass balance amplitudes of glaciers in polar regions and HMA (high-mountain Asia) are low, and those for glaciers in maritime climates such as New Zealand and Kamchatka are higher (Cogley et al., 2011). One exception to this trend is the relatively high value for glaciers in the Urals, despite their dry, cold climate. The SD of the annual mass balance increases linearly with the mass balance amplitudes as shown in Fig. 12.

4.4 Emergence velocity of VSGs in the northern Japanese Alps
The measurement error of the GNSS survey was set at 0.07 m, according to annual migration relative to a base point near the glacier terminal. The annual flow measurements of Karamatsuzawa Glacier in Table 5 all exceed the error level of 0.07, indicating significant flow. Based on these measurements, we find the emergence velocity in the different target areas to range from −0.04 to 0.16 m a−1.
Table 5Analyses results for the Karamatsuzawa Glacier. Regions refer to Fig. 6.
For comparison, the emergence velocity of the terminus of the Changri Nup Glacier in Nepal is about 0.37 m a−1 against an average horizontal velocity of 9.7 m a−1 (Vincent et al., 2016). For the Argentière Glacier in the French Alps, the emergence velocity of the glacier terminus is 3–6 m a−1 against a horizontal velocity of 35–60 m a−1 (Vincent et al., 2021). For these cases, the emergence velocity is less than a tenth of the horizontal velocity on the glacier surface. The situation is similar for the VSGs in the northern Japanese Alps except the magnitudes are smaller. In all cases here, the horizontal velocity is found to be less than 4 m a−1 (Table 1), and the emergence velocity is estimated to be extremely small. Therefore, the profile of altitude change shows the characteristics of a mass balance profile (next Sect. 4.5).
4.5 Mass balance profile
We now examine the profiles of altitude changes of the four VSGs studied during 2015–2019. Consider the gradient trends of these profiles of altitude changes in summer, as shown at left in Fig. 13. The gradients of altitude changes in summer for Sannomado and Komado glaciers are positive, consistent with those of a typical glacier. On the other hand, the profiles for Gozenzawa and Kakunezato glaciers are nearly flat, particularly in 2015–2016, when it is negative for Kakunezato Glacier. These glaciers differ from Sannomado and Komado glaciers by having a debris-covered area in their downstream parts in ablation years, such as the light snow year of 2015–2016. In general, most glaciers have a positive gradient in both summer and winter, with the balance increasing with altitude due to the decrease in temperature. Thus, this trend is consistent with the VSGs here for cases with little-to-no debris cover but not for cases having a debris-covered area downstream in ablation years.
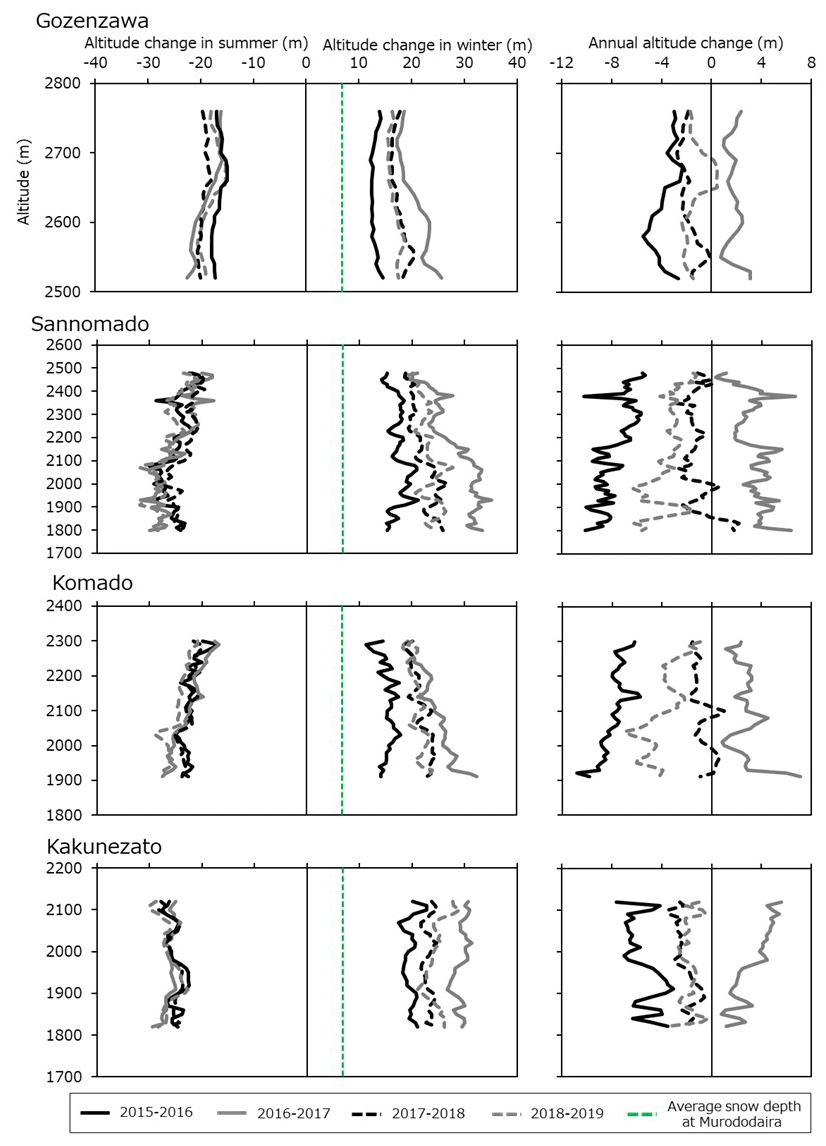
Figure 13Profiles of the altitude changes of Gozenzawa, Sannomado, Komado, and Kakunezato glaciers. The green dashed line is at 6.8 m, the average snow depth at Murododaira (Iida et al., 2018).
Now consider the gradient trends of these profiles of altitude changes in winter. In contrast to the usual trend for a larger glacier, the profiles for these four VSGs are roughly zero or negative. In the light snow year of 2015–2016, the gradient trends of the four glaciers are nearly zero. Even in the heavy snow year of 2016–2017, the gradient for Kakunezato Glacier is nearly zero. Differing even more from mountain glaciers elsewhere, the gradients of altitude changes in winter for Gozenzawa, Sannomado, and Komado glaciers are negative in the heavy snow year. Another common feature of the altitude changes in winter for these VSGs is that the values are always significantly larger than the average snow depth at Murododaira (see Sect. 4.5). Moreover, compared to the profiles of altitude changes in summer, those in winter have much greater year-to-year variation.
On the right side of Fig. 13, we show profiles of annual altitude changes. The gradients vary significantly by year and by glacier. For Sannomado and Komado glaciers, the gradients are positive in the light snow year of 2015–2016 and negative in the heavy snow year of 2016–2017. For Gozenzawa Glacier, the gradient is slightly negative in all years, whereas the gradient for Kakunezato is negative in the light snow year and positive in the heavy snow year. Thus, the gradients of the annual altitude changes of the four VSGs differ from the positive trend for typical glaciers and show significant variation between themselves.
5.1 Mass balance characteristics of VSGs in the northern Japanese Alps: comparison to other glaciers
We reported on our measurements of the accumulation depth, ablation depth, and continuous annual mass balances of the recently classified VSGs in the northern Japanese Alps. To help understand their behavior, we compare them with previously reported measurements of other glaciers worldwide. In general, the glacier mass balance amplitude increases from polar to continental and then to maritime climates. An exception to this trend is the Ural glaciers, which appear to have anomalously high amplitude for their dry, cold climate. The Urals have small glaciers that inhabit valley bottoms, where the large effects of topography (avalanche and snowdrift) are localized (Dolgushin, 1961), leading to higher mass balance amplitudes (Dyurgerov and Meier, 1999). Like the VSGs studied here, the glaciers in the Urals lie in narrow cirques, gaining much of their mass through avalanches or snowdrifts. However, while the Urals are located at a colder, drier environment, the northern Japanese Alps have some of the heaviest snowfall in the world. Therefore, steep bedrock walls surrounding the VSGs in the northern Japanese Alps cause avalanches that supply more snow to the trough bottom than glaciers in the Urals. In addition, strong northwesterly wind during winter in the northern Japanese Alps supply much snow to the east part of the mountain ridge due to snowdrift. This combination of heavy snowfall, strong northwesterly wind (snowdrift), and narrow valleys (avalanche) may explain why the mass balance amplitude of VSGs in the northern Japanese Alps is found to be higher than that of other glaciers worldwide (Fig. 11). Moreover, Braithwaite and Hughes (2020) showed that the mass balance amplitude correlated with summer temperature, which is also relatively high in the northern Japanese Alps. Consistent with that study, we found the standard deviation of the annual mass balance to be nearly proportional to the mass balance amplitude (Fig. 11), with the result that VSGs in the northern Japanese Alps have a variation in annual mass balance higher than other glaciers worldwide.
Why do the glaciers exist here? The high accumulation depth is probably a major factor. We found the winter balance of VSGs in the northern Japanese Alps to be the highest of all investigated glaciers worldwide to date, being more than double those of the Kamchatka glaciers, the second highest. However, despite the very heavy snowfall here, the winter snowfall cannot keep pace with the rapid snowmelt in summer, and hence the perennial snow patches form only where avalanches and snowdrifts deposit significant snow (Higuchi, 1968). Here, the VSGs receive more than double the snowfall depth due to recharge from avalanches and snowdrifts. This source of snow is thus the reason five VSGs located in the altitude range of 1750–2770 m can exist in such a warm mid-latitude climate.
Concerning the yearly fluctuations in mass balance, the ablation depths of the VSGs here are relatively constant, whereas the accumulation depth and annual mass balances fluctuate significantly from year to year (Fig. 9). This result indicates that the variable accumulation depth dominates the behavior of the annual mass balance of VSGs in the northern Japanese Alps. Higher mass balance amplitudes result in the annual mass balance having lower sensitivity to the summer balance and higher sensitivity to the winter balance (Dyurgerov and Meier, 1999).
The profiles of the altitude changes (Fig. 13) differ from those typical of glaciers elsewhere. A typical glacier consists of an upstream accumulation area and a downstream ablation area, separated by an equilibrium line altitude (ELA), a structure that produces a positive gradient in the annual mass balance. Even if the glacier can become an ablation area throughout due to recent climate change effects (e.g., the Ålfotbreen Glacier (Kjøllmoen et al., 2020)), the glacier's gradient can remain positive (Oerlemans and Hoogendoorn, 1989). In these cases, the ELA can be defined above the glacier altitude range. In contrast, we found that the gradients of altitude changes in the summer of VSGs in the northern Japanese Alps vary greatly in light or heavy snow years, often being near zero or negative. Although the Sannomado and Komado glaciers have positive summer gradients, the Gozenzawa and Kakunezato glaciers, where debris-covered areas appear in the downstream parts of the glacier in light snow years, do not. Suppression of melting in the downstream parts in these cases is probably due to their debris cover (e.g., Nicholson and Benn, 2006). In addition, the gradients of altitude changes in winter of these VSGs do not have a positive gradient. We argued that this property of the VSGs is probably due to the significant contributions from avalanches and snowdrift, which can be greater downstream. As a result, the gradient of the annual altitude changes can be negative. Furthermore, the annual mass balances are negative (ablation area throughout) most years, being positive (accumulation area throughout) for all VSGs only in the heavy snow year. Taken together, these results suggest that VSGs in the northern Japanese Alps are not divided by a distinct glacier ELA into an upstream accumulation zone and a downstream ablation zone.
5.2 Climate sensitivity of VSGs in the northern Japanese Alps
The VSGs in the northern Japanese Alps persist where the accumulation depth is more than double the snowfall depth due to avalanche and snowdrift deposits. Thus, of the two types of VSGs (Kuhn, 1995), these VSGs can be classified as topographically controlled VSGs.
Generally, VSGs are more sensitive and react faster to climatic change than larger glaciers (Hoelzle et al., 2003; Hoffman et al., 2007; Jóhannesson et al., 1989). However, the responses of individual VSGs to changes in climatic forcing depend on the site, being influenced by topographic factors, feedbacks, and non-linearities (e.g., Carturan et al., 2013; Kuhn, 1995; López-Moreno et al., 2006). Like the VSGs here, other topographically controlled VSGs tend to have annual mass balances strongly correlated with the winter balance and weakly correlated with the summer balance (De Marco et al., 2020; Hughes, 2009; Huss and Fischer, 2016; Pecci et al., 2008). Huss and Fischer (2016), modeling the climate sensitivity of 1133 VSGs in the Swiss Alps, argued that most VSGs in the Swiss Alps would disappear by 2060. However, they reported that the topographically controlled VSGs are less sensitive to temperature fluctuations and thus some may survive future warming. The lower sensitivity of topographically controlled VSGs to temperature rise has also been reported in the Eastern Alps (Carrivick et al., 2015) and Canadian Rockies (DeBeer and Sharp, 2009).
To help understand how these topographically controlled VSGs in the northern Japanese Alps may respond to climate, we consider their high sensitivity to the accumulation depth. Their dependence on accumulation depth suggests a dependence on snowfall depth variation. How has snowfall depth changed over recent years? Yamaguchi et al. (2011) made meteorological observations in the alpine zone of central Japan, finding no decreasing trend in snow depth in the alpine zone for 1990–2010, yet large yearly fluctuations. Suzuki and Sasaki (2019) found similar results for 2002–2017. Regional climate projections using a high-resolution non-hydrostatic regional climate model (NHRCM) with 5 km resolution and 1 km grid spacing concluded that the amount of snow in the northern Japanese Alps will decrease if the temperature rises by 2 K (Kawase et al., 2020).
If the non-decreasing trend in snow depth continues, VSGs in the northern Japanese Alps should persist like other topographically controlled VSGs worldwide. On the other hand, a temperature rise and snow depth decrease would deplete these VSGs, which are already less than 50 m thick. If glacier shrinkage continues at the same rate as that in 2015–2019, the VSGs will probably transform into perennial snow patches and then vanish.
Understanding variation in the annual mass balance of a glacier requires measurements of the seasonal balance for at least 30 years (Ohmura, 2010). As this study covered only 4 years, further mass balance observations of the VSGs in the northern Japanese Alps are needed.
In this study, we calculated the annual mass balance, accumulation depth, and ablation depth of VSGs in the northern Japanese Alps using a geodetic method based on SfM–MVS technology and aerial images. Their ablation depth showed very small yearly fluctuations, whereas their accumulation depth and annual mass balance had large yearly fluctuations. Therefore, their annual mass balance was dominated by their accumulation depth. The annual mass balance of the entire area represented an accumulation area during a heavy snow year and an ablation area during a lighter snow year. These characteristics differ from those of a typical glacier, which instead have both an upstream accumulation area and a downstream ablation area, separated by a glacier ELA. Moreover, these VSGs lack a positive annual mass balance gradient, which suggests that they were not divided by a distinct glacier ELA into an upstream accumulation area and a downstream ablation area during the observation period. A comparison of the mass balance amplitudes of VSGs in the northern Japanese Alps with those of other glaciers worldwide showed that mass balance amplitude increased from polar to continental to maritime climates. The VSGs studied here had the highest mass balance amplitudes, probably due to being in a warm mid-latitude climate with very heavy snowfall, supplemented by avalanches and snowdrift. For this reason, we classified them as topographically controlled VSGs.
Like other topographically controlled VSGs worldwide, the VSGs in the northern Japanese Alps appeared to be relatively insensitive to fluctuations in the summer balance. However, if climate models are correct in predicting a decreasing snowfall to the region in the future (Kawase et al., 2020), then these VSGs would probably respond within 10–20 years by significantly shrinking, transforming into perennial snow patches, and then vanishing. Before they experience such a fate, they should be continually observed for at least 30 years to better predict their future development.
The full sample of glaciological observations for individual glaciers is publicly available from the WGMS (https://doi.org/10.5904/WGMS-FOG-2020-08, WGMS, 2020).
The supplement related to this article is available online at: https://doi.org/10.5194/tc-16-1091-2022-supplement.
KA, CN, and RY conducted the field survey and performed an analysis of field data. KA wrote the paper. CN, KF, and HI checked and improved the manuscript and suggested some discussion points. All authors have read and agreed to the published version of the paper.
The contact author has declared that neither they nor their co-authors have any competing interests.
Publisher's note: Copernicus Publications remains neutral with regard to jurisdictional claims in published maps and institutional affiliations.
We would like to express thanks to the captains of Cessna aircraft – Takao Kinoshita (New Central Air service Co.), Kenichiro Tomooka (IBEX Aviation Co.), and Hisatoshi Miyata (Tokyo Koku Co.); mountain guides – Yukiyasu Matsuzawa, Masanobu Matsumoto, Yoshimichi Furuhata, Satoshi Arakawa, Satoshi Matsumoto, Shigeta Hisada, Shinichiro Matsubara, Taichi Nishida, Hidekazu Izumi, Shinya Hirata, and Yusuke Ito; and the researchers of the National Research Institute for Earth Science and Disaster Resilience – Satoru Yamaguchi, Sojiro Sunako, Niigata University: Hitomi Hata, Yoshitaka Mori, Hideyuki Takadama, Naoki Sakurai, Hirotaka Sugiyama, Kosuke Matsumoto, and Ryouji Yoshimura. We thank editor Chris R. Stokes and the two referees (Ian S. Evans and one anonymous) for their valuable comments and suggestions. We appreciate the Matsumoto Sabo Office, Tateyama Mountain Area Sabo Office, and Kurobe River Office of the Ministry of Land, Infrastructure, Transport and Tourism Hokuriku Regional Development Bureau for providing high-resolution aerial laser data. We also appreciate the Research Center for Mountain Environment, Shinshu University, and Keisuke Suzuki, Akihiko Sasaki, and Motoshi Nishimura for providing wind and temperature data near Mt. Hakuba.
This research was supported by the Toyama Prefecture Energetic Snow Country Creation Project in 2015 and 2016; the glacier project of Hakuba Village, Nagano Prefecture, in 2018; the Mountain Research Project on Asian High Mountains of the Niigata University Asian Link Research Center in 2019; and a research grant from the Japan Landslide Society in 2019.
This paper was edited by Chris R. Stokes and reviewed by Ian Evans and one anonymous referee.
Abe, O., Nakamura, K., Sato, K., and Kenji, K.: Observation of Frequent Avalanches in Sekiyama Pass along Route 48 and Assessment of Snowpack Stability on the Valley Slopes, Natural Disaster Research Report, 49, 39–46, available at: https://dil-opac.bosai.go.jp/publication/nied_natural_disaster/pdf/49/49-06.pdf (last access: 12 February 2022), 2016 (in Japanese).
Arie, K., Narama, C., Fukui, K., Iida, H., and Takahashi, K.: Ice thickness and flow of the Karamatsuzawa perennial snow patch in the northern Japanese Alps, Journal of the Japanese Society of Snow and Ice, 81, 283–295, https://doi.org/10.5331/seppyo.81.6_283, 2019 (in Japanese).
Asahi, K.: Snow patch distribution and variations last until autumn in Central Japan by means of aerial photographs interpretation, in Academic Research Grant Reports, vol. 2, edited by: Utility official of Japan Geographic Data Center, Tokyo, 239 pp., available at: https://www.ied.tsukuba.ac.jp/~jalps-ut/html/event/report/2012/WM6_2012.pdf (last access: 12 February 2022), ISBN 9784875529460, 2016 (in Japanese).
Benn, D. and Evans, D. J. A.: Glaciers and Glaciation, 2nd edn., Routledge, available at: https://play.google.com/store/books/details?id=dkjKAgAAQBAJ (last access: 12 February 2022), ISBN 9780340905791, 2014.
Braithwaite, R. J. and Hughes, P. D.: Regional Geography of Glacier Mass Balance Variability Over Seven Decades 1946–2015, Front Earth Sci. Chin., 8, https://doi.org/10.3389/feart.2020.00302, 2020.
Brun, F., Buri, P., Miles, E. S., Wagnon, P., Steiner, J., Berthier, E., Ragettli, S., Kraaijenbrink, P., Immerzeel, W. W., and Pellicciotti, F.: Quantifying volume loss from ice cliffs on debris-covered glaciers using high-resolution terrestrial and aerial photogrammetry, J. Glaciol., 62, 684–695, https://doi.org/10.1017/jog.2016.54, 2016.
Carrivick, J. L., Berry, K., Geilhausen, M., James, W. H. M., Williams, C., Brown, L. E., Rippin, D. M., and Carver, S. J.: Decadal-scale changes of the ödenwinkelkees, central austria, suggest increasing control of topography and evolution towards steady state, Geogr. Ann. A., 97, 543–562, https://doi.org/10.1111/geoa.12100, 2015.
Carturan, L., Baldassi, G. A., Bondesan, A., Calligaro, S., Carton, A., Cazorzi, F., Dalla Fontana, G., Francese, R., Guarnieri, A., Milan, N., Moro, D., and Tarolli, P.: Current behaviour and dynamics of the lowermost italian glacier (montasio occidentale, julian alps), Geogr. Ann. A., 95, 79–96, https://doi.org/10.1111/geoa.12002, 2013.
Cogley, J. G., Hock, R., Rasmussen, L. A., Arendt, A. A., Bauder, A., Braithwaite, R. J., Jansson, P., Kaser, G., Möller, M., Nicholson, L., and Zemp, M.: Glossary of glacier mass balance and related terms, in: IHP-VII Technical Documents in Hydrology, UNESCO/IHP, 114 pp., https://doi.org/10.5167/uzh-53475, 2011.
Colucci, R. R., Žebre, M., Torma, C. Z., Glasser, N. F., Maset, E., Del Gobbo, C., and Pillon, S.: Recent Increases in Winter Snowfall Provide Resilience to Very Small Glaciers in the Julian Alps, Europe, Atmosphere, 12, 263, https://doi.org/10.3390/atmos12020263, 2021.
Dai, F., Feng, Y., and Hough, R.: Photogrammetric error sources and impacts on modeling and surveying in construction engineering applications, Visualization in Engineering, 2, 2, https://doi.org/10.1186/2213-7459-2-2, 2014.
DeBeer, C. M. and Sharp, M. J.: Topographic influences on recent changes of very small glaciers in the Monashee Mountains, British Columbia, Canada, J. Glaciol., 55, 691–700, https://doi.org/10.3189/002214309789470851, 2009.
De Marco, J., Carturan, L., Piermattei, L., Cucchiaro, S., Moro, D., Dalla Fontana, G., and Cazorzi, F.: Minor Imbalance of the Lowermost Italian Glacier from 2006 to 2019, Water, 12, 2503, https://doi.org/10.3390/w12092503, 2020.
Dolgushin, L. D.: Main features of the modern glaciation of the Urals, International Association of Hydrological Sciences Publication, 54, 335–347, 1961.
Dussaillant, I., Berthier, E., Brun, F., Masiokas, M., Hugonnet, R., Favier, V., Rabatel, A., Pitte, P., and Ruiz, L.: Two decades of glacier mass loss along the Andes, Nat. Geosci., 12, 802–808, https://doi.org/10.1038/s41561-019-0432-5, 2019.
Dyurgerov, M. B. and Meier, M. F.: Analysis of winter and summer glacier mass balances, Geogr. Ann. A., 81, 541–554, available at: https://www.tandfonline.com/doi/abs/10.1111/1468-0459.00082 (last access: 12 March 2022), 1999.
Fukui, K. and Iida, H.: Identifying active glaciers in Mt. Tateyama and Mt. Tsurugi in the northern Japanese Alps, central Japan, Journal of the Japanese Society of Snow and Ice, 74, 213–222, available at: https://www.seppyo.org/publication/seppyo/seppyo_archives/74_2012/74_03_2012/attachment/74-3_213/ (last access: 12 February 2022), 2012 (in Japanese).
Fukui, K., Iida, H., and Kosaka, T.: Newly Identifying Active Glaciers in the Northern Japanese Alps and Their Characteristics, Geographical Review of Japan Series A, 91, 43–61, available at: https://ci.nii.ac.jp/naid/40021445177/ (last access: 12 February 2022), 2018 (in Japanese).
Fukui, K., Iida, H., and Kosaka, T.: Newly Identifying Active Glaciers in the Northern Japanese Alps and Their Characteristics, Geographical Review of Japan Series B, 94, 81–95, available at: https://www.jstage.jst.go.jp/article/geogrevjapanb/94/2/94_940203/_pdf/-char/ja, (last access: 12 February 2022), 2021.
Higuchi, K.: A Review of the Glaciological Studies on Perennial Ice and Snow Masses in Japan, Journal of the Japanese Society of Snow and Ice, 30, 195–207, https://doi.org/10.5331/seppyo.30.195, 1968 (in Japanese).
Higuchi, K. and Iozawa, T.: Atlas of perennial snow patches in central Japan, Water Research Laboratory, Faculty of Science, Nagoya University, NCID:BA42287631, 81 pp., 1971.
Hoelzle, M., Haeberli, W., Dischl, M., and Peschke, W.: Secular glacier mass balances derived from cumulative glacier length changes, Global Planet. Change, 36, 295–306, https://doi.org/10.1016/S0921-8181(02)00223-0, 2003.
Hoffman, M. J., Fountain, A. G., and Achuff, J. M.: 20th-century variations in area of cirque glaciers and glacierets, Rocky Mountain National Park, Rocky Mountains, Colorado, USA, Ann. Glaciol., 46, 349–354, https://doi.org/10.3189/172756407782871233, 2007.
Hughes, P. D.: Twenty-first Century Glaciers and Climate in the Prokletije Mountains, Albania, Arct. Antarct. Alp. Res., 41, 455–459, https://doi.org/10.1657/1938-4246-41.4.455, 2009.
Huss, M.: Mass balance of Pizolgletscher, Geogr. Helv., 65, 80–91, https://doi.org/10.5194/gh-65-80-2010, 2010.
Huss, M.: Density assumptions for converting geodetic glacier volume change to mass change, The Cryosphere, 7, 877–887, https://doi.org/10.5194/tc-7-877-2013, 2013.
Huss, M. and Fischer, M.: Sensitivity of Very Small Glaciers in the Swiss Alps to Future Climate Change, Front. Earth Sci., 4, 34, https://doi.org/10.3389/feart.2016.00034, 2016.
Huss, M., Farinotti, D., Bauder, A., and Funk, M.: Modelling runoff from highly glacierized alpine drainage basins in a changing climate, Hydrol. Process., 22, 3888–3902, https://doi.org/10.1002/hyp.7055, 2008.
Iida, H., Fukui, K., and Osada, K.: Long-term Snow pit survey in Murodo-Daira, the Tateyama Mountains (II), JSSI & JSSE Joint Conference – 2018 in Sapporo, Hokkaido, Japan, 9–12 September 2018, 254, https://doi.org/10.14851/jcsir.2018.0_253, 2018 (in Japanese).
Immerzeel, W. W., Kraaijenbrink, P. D. A., Shea, J. M., Shrestha, A. B., Pellicciotti, F., Bierkens, M. F. P., and de Jong, S. M.: High-resolution monitoring of Himalayan glacier dynamics using unmanned aerial vehicles, Remote Sens. Environ., 150, 93–103, https://doi.org/10.1016/j.rse.2014.04.025, 2014.
Jóhannesson, T., Raymond, C., and Waddington, E.: Time–Scale for Adjustment of Glaciers to Changes in Mass Balance, J. Glaciol., 35, 355–369, https://doi.org/10.3189/S002214300000928X, 1989.
Kawase, H., Yamazaki, T., Sugimoto, S., Sasai, T., Ito, R., Hamada, T., Kuribayashi, M., Fujita, M., Murata, A., Nosaka, M., and Sasaki, H.: Changes in extremely heavy and light snow-cover winters due to global warming over high mountainous areas in central Japan, Prog. Earth Planet. Sci., 7, 10, https://doi.org/10.1186/s40645-020-0322-x, 2020.
Kawashima, K.: Formation processes of ice body revealed by the internal structure of perennial snow patches in Japan, Bull. Glac. Res., 15, 1–10, available at: https://dl.ndl.go.jp/info:ndljp/pid/8958360 (last access: 12 March 2022), 1997.
Kawashima, K., Yamada, T., and Wakahama, G.: Investigations of internal structure and transformational processes from firn to ice in a perennial snow patch, Ann. Glaciol., 18, 117–122, https://doi.org/10.3189/s0260305500011368, 1993.
Kjøllmoen, B., Andreassen, L. M., Elvehøy, H., and Jackson, M.: Glaciological investigations in Norway 2018, NVE Rapport, 84 pp., ISBN 9788241019463, available at: http://publikasjoner.nve.no/rapport/2019/rapport2019_46.pdf (last access: 12 February 2022), 2020.
Kuhn, M.: The mass balance of very small glaciers, Z. Gletscherkd. Glazialgeol., 31, 171–179, 1995.
López-Moreno, J. I., Nogués-Bravo, D., Chueca-Cía, J., and Julián-Andrés, A.: Glacier development and topographic context, Earth Surf. Proc. Land., 31, 1585–1594, https://doi.org/10.1002/esp.1356, 2006.
Meier, M. F.: Contribution of small glaciers to global sea level, Science, 226, 1418–1421, https://doi.org/10.1126/science.226.4681.1418, 1984.
Meier, M. F.: Ice, Climate, and Sea Level; Do We Know What is Happening?, in: Ice in the Climate System, Springer Berlin Heidelberg, 141–160, ISBN 978-3-642-85016-5, 1993.
Naruse, R., Nishimura, K., and Maeno, N.: Studies on Mixed-phase Snow Flows IV: Stop and Accumulation Processes, Low temperature science, Series A, Physical Sciences, 44, 165–176, available at: https://eprints.lib.hokudai.ac.jp/dspace/bitstream/2115/18527/1/44_p165-176.pdf (last access: 12 February 2022), 1986 (in Japanese).
Nicholson, L. and Benn, D. I.: Calculating ice melt beneath a debris layer using meteorological data, J. Glaciol., 52, 463–470, https://doi.org/10.3189/172756506781828584, 2006.
Nosaka, M., Kawase, H., Sasaki, H., and Murata, A.: Influence of the Temporal Resolution of Sea Surface Temperature on Winter Precipitation over the Coastal Area of the Sea of Japan, SOLA, 15, 107–112, https://doi.org/10.2151/sola.2019-020, 2019.
Nuimura, T., Fujita, K., Fukui, K., Asahi, K., Aryal, R., and Ageta, Y.: Temporal Changes in Elevation of the Debris-Covered Ablation Area of Khumbu Glacier in the Nepal Himalaya since 1978, Arct. Antarct. Alp. Res., 43, 246–255, https://doi.org/10.1657/1938-4246-43.2.246, 2011.
Oerlemans, J. and Hoogendoorn, N. C.: Mass-Balance Gradients and Climatic Change, J. Glaciol., 35, 399–405, https://doi.org/10.3189/S0022143000009333, 1989.
Ogasahara, K.: Characteristics of the glaciers in the Japanese Alps at the time of the glacial age, in: The Nature of the Northern Japan Alps, edited by: Science Research Organization of the Toyama University, 5–34, Kokon Shoin, Tokyo, 1964 (in Japanese).
Ohmura, A.: Mass balance of glaciers and ice sheets during the observational period and climate change, J. Geogr., 119, 466–481, https://doi.org/10.5026/jgeography.119.466, 2010.
Ohmura, A.: Observed Mass Balance of Mountain Glaciers and Greenland Ice Sheet in the 20th Century and the Present Trends, Surv. Geophys., 32, 537–554, https://doi.org/10.1007/s10712-011-9124-4, 2011.
Pecci, M., D'Agata, C., and Smiraglia, C.: Ghiacciaio del Calderone (Apennines, Italy): the mass balance of a shrinking Mediterranean glacier, Geogr. Fis. Din. Quat., 31, 55–62, available at: http://www.glaciologia.it/wp-content/uploads/FullText/full_text_31_1/07_Pecci_55_62.pdf (last access: 12 February 2022), 2008.
Pelto, B. M., Menounos, B., and Marshall, S. J.: Multi-year evaluation of airborne geodetic surveys to estimate seasonal mass balance, Columbia and Rocky Mountains, Canada, The Cryosphere, 13, 1709–1727, https://doi.org/10.5194/tc-13-1709-2019, 2019.
Piermattei, L., Carturan, L., and Guarnieri, A.: Use of terrestrial photogrammetry based on structure-from-motion for mass balance estimation of a small glacier in the Italian alps: SfM-MVS Approach for Glacier Mass Balance Estimation, Earth Surf. Proc. Land., 40, 1791–1802, https://doi.org/10.1002/esp.3756, 2015.
Piermattei, L., Carturan, L., de Blasi, F., Tarolli, P., Dalla Fontana, G., Vettore, A., and Pfeifer, N.: Suitability of ground-based SfM–MVS for monitoring glacial and periglacial processes, Earth Surf. Dynam., 4, 425–443, https://doi.org/10.5194/esurf-4-425-2016, 2016.
Sakita, R.: Ice Block at a Valley Head in Mt. Tateyama, Geogr. Rev. Jpn., 7, 734–747, https://doi.org/10.4157/grj.7.734, 1931 (in Japanese).
Sato, H. P., Sekiguchi, T., Orimo, K., and Nakajima, T.: Accuracy validation of airborne laser scanning DTM using the ground control points, J. Jpn. Soc. Photogramm. Remote Sens., 43, 13–21, https://doi.org/10.4287/jsprs.43.4_13, 2004 (in Japanese).
Shimizu, H., Fujioka, T., Nakagawa, M., Kamada, K., Akimiya, E., and Narita, H.: Study of High-Speed Avalanche in Kurobe Canyon III, Low temperature science, Series A, Physical Sciences, 32, 113–127, available at: https://eprints.lib.hokudai.ac.jp/dspace/bitstream/2115/18251/1/32_p113-127.pdf (last access: 12 February 2022), 1974 (in Japanese).
Suzuki, K. and Sasaki, A.: Meteorological observations in the Japanese Alps region, J. Geogr., 128, 9–19, https://doi.org/10.5026/jgeography.128.9, 2019 (in Japanese).
Vincent, C., Wagnon, P., Shea, J. M., Immerzeel, W. W., Kraaijenbrink, P., Shrestha, D., Soruco, A., Arnaud, Y., Brun, F., Berthier, E., and Sherpa, S. F.: Reduced melt on debris-covered glaciers: investigations from Changri Nup Glacier, Nepal, The Cryosphere, 10, 1845–1858, https://doi.org/10.5194/tc-10-1845-2016, 2016.
Vincent, C., Cusicanqui, D., Jourdain, B., Laarman, O., Six, D., Gilbert, A., Walpersdorf, A., Rabatel, A., Piard, L., Gimbert, F., Gagliardini, O., Peyaud, V., Arnaud, L., Thibert, E., Brun, F., and Nanni, U.: Geodetic point surface mass balances: a new approach to determine point surface mass balances on glaciers from remote sensing measurements, The Cryosphere, 15, 1259–1276, https://doi.org/10.5194/tc-15-1259-2021, 2021.
World Glacier Monitoring Service (WGMS): Fluctuations of Glaciers Database, WGMS [data set], https://doi.org/10.5904/WGMS-FOG-2020-08, 2020.
Yamaguchi, S., Abe, O., Nakai, S., and Sato, A.: Recent fluctuations of meteorological and snow conditions in Japanese mountains, Ann. Glaciol., 52, 209–215, https://doi.org/10.3189/172756411797252266, 2011.