the Creative Commons Attribution 4.0 License.
the Creative Commons Attribution 4.0 License.
 | 24 Feb 2021
Mapping avalanches with satellites – evaluation of performance and completeness
Elisabeth D. Hafner
Frank Techel
Silvan Leinss
Yves Bühler
The spatial distribution and size of avalanches are essential parameters for avalanche warning, avalanche documentation, mitigation measure design and hazard zonation. Despite its importance, this information is incomplete today and only available for limited areas and limited time periods. Manual avalanche mapping from satellite imagery has recently been applied to reduce this gap achieving promising results. However, their reliability and completeness have not yet been verified satisfactorily.
In our study we attempt a full validation of the completeness of visually detected and mapped avalanches from optical SPOT 6, Sentinel-2 and radar Sentinel-1 imagery. We examine manually mapped avalanches from two avalanche periods in 2018 and 2019 for an area of approximately 180 km2 around Davos, Switzerland, relying on ground- and helicopter-based photographs as ground truth. For the quality assessment, we investigate the probability of detection (POD) and the positive predictive value (PPV). Additionally, we relate our results to conditions which potentially influence avalanche detection in the satellite imagery.
We statistically confirm the high potential of SPOT for comprehensive avalanche mapping for selected periods (POD = 0.74, PPV = 0.88) as well as the reliability of Sentinel-1 (POD = 0.27, PPV = 0.87) for which the POD is reduced because mainly larger avalanches are mapped. Furthermore, we found that Sentinel-2 is unsuitable for the mapping of most avalanches due to its spatial resolution (POD = 0.06, PPV = 0.81). Because we could apply the same reference avalanche events for all three satellite mappings, our validation results are robust and comparable. We demonstrate that satellite-based avalanche mapping has the potential to fill the existing avalanche documentation gap over large areas, making alpine regions safer.
- Article
(17290 KB) - Full-text XML
- BibTeX
- EndNote


Where and when avalanches occur, as well as what size and destructive potential they have, is key information to mitigate avalanche hazard in snow-covered mountain regions. Several applications depend on such information:
-
Avalanche warning. This is validation of the avalanche forecast (Bühler et al., 2019; Meister, 1994).
-
Hazard zoning. This is complementation of existing cadasters and validation of the hazard zones (Bühler et al., 2018; Rudolf-Miklau et al., 2015).
-
Hazard mitigation measures. This is validation of effectiveness and planning of new infrastructure (Rudolf-Miklau et al., 2015; Margreth and Romang, 2010).
-
Forestry. This is identification of potential forest damage and examination of protective functions (Bebi et al., 2009; Feistl et al., 2015).
-
Risk management. This is categorization and understanding of the severity of events and estimation of cost-effective solutions (Fuchs et al., 2005; Bründl and Margreth, 2015).
-
Numerical simulations. This is validation of avalanche models (Christen et al., 2010; Sampl and Zwinger, 2004; Bühler et al., 2011).
Nevertheless, information on avalanche occurrence is only available for limited areas and time spans. This means that most avalanche events are not reported and therefore not captured in any database or cadaster and particularly not within poorly accessible regions (Bühler et al., 2019).
Remote sensing technology is increasingly used to record and map avalanche occurrences with a consistent methodology and continuous spatial coverage over large regions. Optical data from airplanes and satellites with a high to very high spatial resolution (0.1–1.5 m) have been successfully used in the past to manually or semi-automatically map avalanches (Bühler et al., 2009; Lato et al., 2012; Eckerstorfer et al., 2016; Korzeniowska et al., 2017; Bühler et al., 2019). Optical data with a high to very high spatial resolution have mostly limited coverage and a low temporal resolution as they are usually available upon request only. Furthermore, they are often costly and depend on cloud-free conditions. Optical satellites under free and open data policies with a high temporal resolution but lower spatial resolution like Sentinel-2 have only been tested briefly for snow avalanche detection or have been used to complement Sentinel-1 investigations (Nolting et al., 2018; Abermann et al., 2019). For the documentation of individual avalanche events, unmanned aerial systems (UASs) equipped with optical cameras can flexibly provide detailed information, but they are not able to cover larger regions (Bühler et al., 2017; Eckerstorfer et al., 2016).
In the microwave spectrum, radar sensors operate independently of light and weather conditions. Radar sensors can detect the increased roughness (Oh et al., 1992) of the snow surface caused by avalanches (Eckerstorfer and Malnes, 2015; Leinss et al., 2020). Radar satellites, like RADARSAT, TerraSAR-X and Sentinel-1, have been successfully applied for avalanche mapping in various regions (Eckerstorfer and Malnes, 2015; Vickers et al., 2016; Eckerstorfer et al., 2017; Wesselink et al., 2017; Abermann et al., 2019; Leinss et al., 2020). Selective verification has shown that radar underestimates the avalanche activity to an unknown extent (Eckerstorfer et al., 2017). Often only parts of the avalanches are mapped, and Sentinel-1 misses most small avalanches due to the limited spatial resolution (Leinss et al., 2020).
For the mapping of avalanches or parts thereof change detection and unsupervised object classification (Vickers et al., 2016), semi-automated object-based approaches (Korzeniowska et al., 2017; Lato et al., 2012), and automated change detection approaches (Wesselink et al., 2017; Nolting et al., 2018; Eckerstorfer et al., 2019) as well as manual mapping (Bühler et al., 2019; Abermann et al., 2019; Eckerstorfer et al., 2015) and combinations of manual and automatic mapping (Leinss et al., 2020) have been used.
As consistent avalanche detection using satellite data is becoming increasingly important, the identification of its performance and reliability is essential. To do so, we assess the completeness of visually detected and manually mapped avalanches, using three different satellite sensors, which have recently been used to detect avalanches (e.g., Eckerstorfer and Malnes, 2015; Leinss et al., 2020; Bühler et al., 2019; Nolting et al., 2018; Abermann et al., 2019):
-
optical SPOT 6, commercial, 1.5 m spatial resolution
-
radar Sentinel-1, open access, 10 m spatial resolution
-
optical Sentinel-2, open access, 10 m spatial resolution.
As validation data, we rely on photographs taken from the ground and from helicopters to document two extreme avalanche situations in 2018 and 2019, in Davos in eastern Switzerland. We compare the completeness of avalanches detected with the three sensors by answering the following two research questions:
-
Of the avalanches identified in the ground truth, how many were correctly detected in the satellite data by a human?
-
If a human visually detected an avalanche in the satellite data, how often was there an avalanche?
Furthermore, we investigate these findings in relation to conditions which potentially influence avalanche detection in satellite imagery. To do so we consider the size of the mapped avalanche from all approaches, the illumination conditions in optical SPOT 6 (SPOT hereafter) data and the predominantly detected parts of the avalanches in radar data. Finally, we highlight the potential and the limitations of a well-established, multi-year data set of mapped avalanches as an existing data source for validation.
2.1 Study area and validation period
Our study area of approximately 180 km2 is located around Davos, Switzerland (Fig. 1). Of the total area, 25 % is considered avalanche release area according to the release area definitions introduced by Bühler et al. (2018). The study area comprises the main valley and parts of three inhabited side valleys (Flüela, Dischma, Sertig), as well as the surrounding mountains, and covers an elevation range from 1450 to 2981 m a.s.l. In January 2018, 93 % of the study area was covered by SPOT satellite imagery ordered for rapid mapping (Bühler et al., 2019). The 7 % which was missed was excluded from our study and is shaded in red in Fig. 1. In January 2019 the entire area was covered by SPOT imagery.
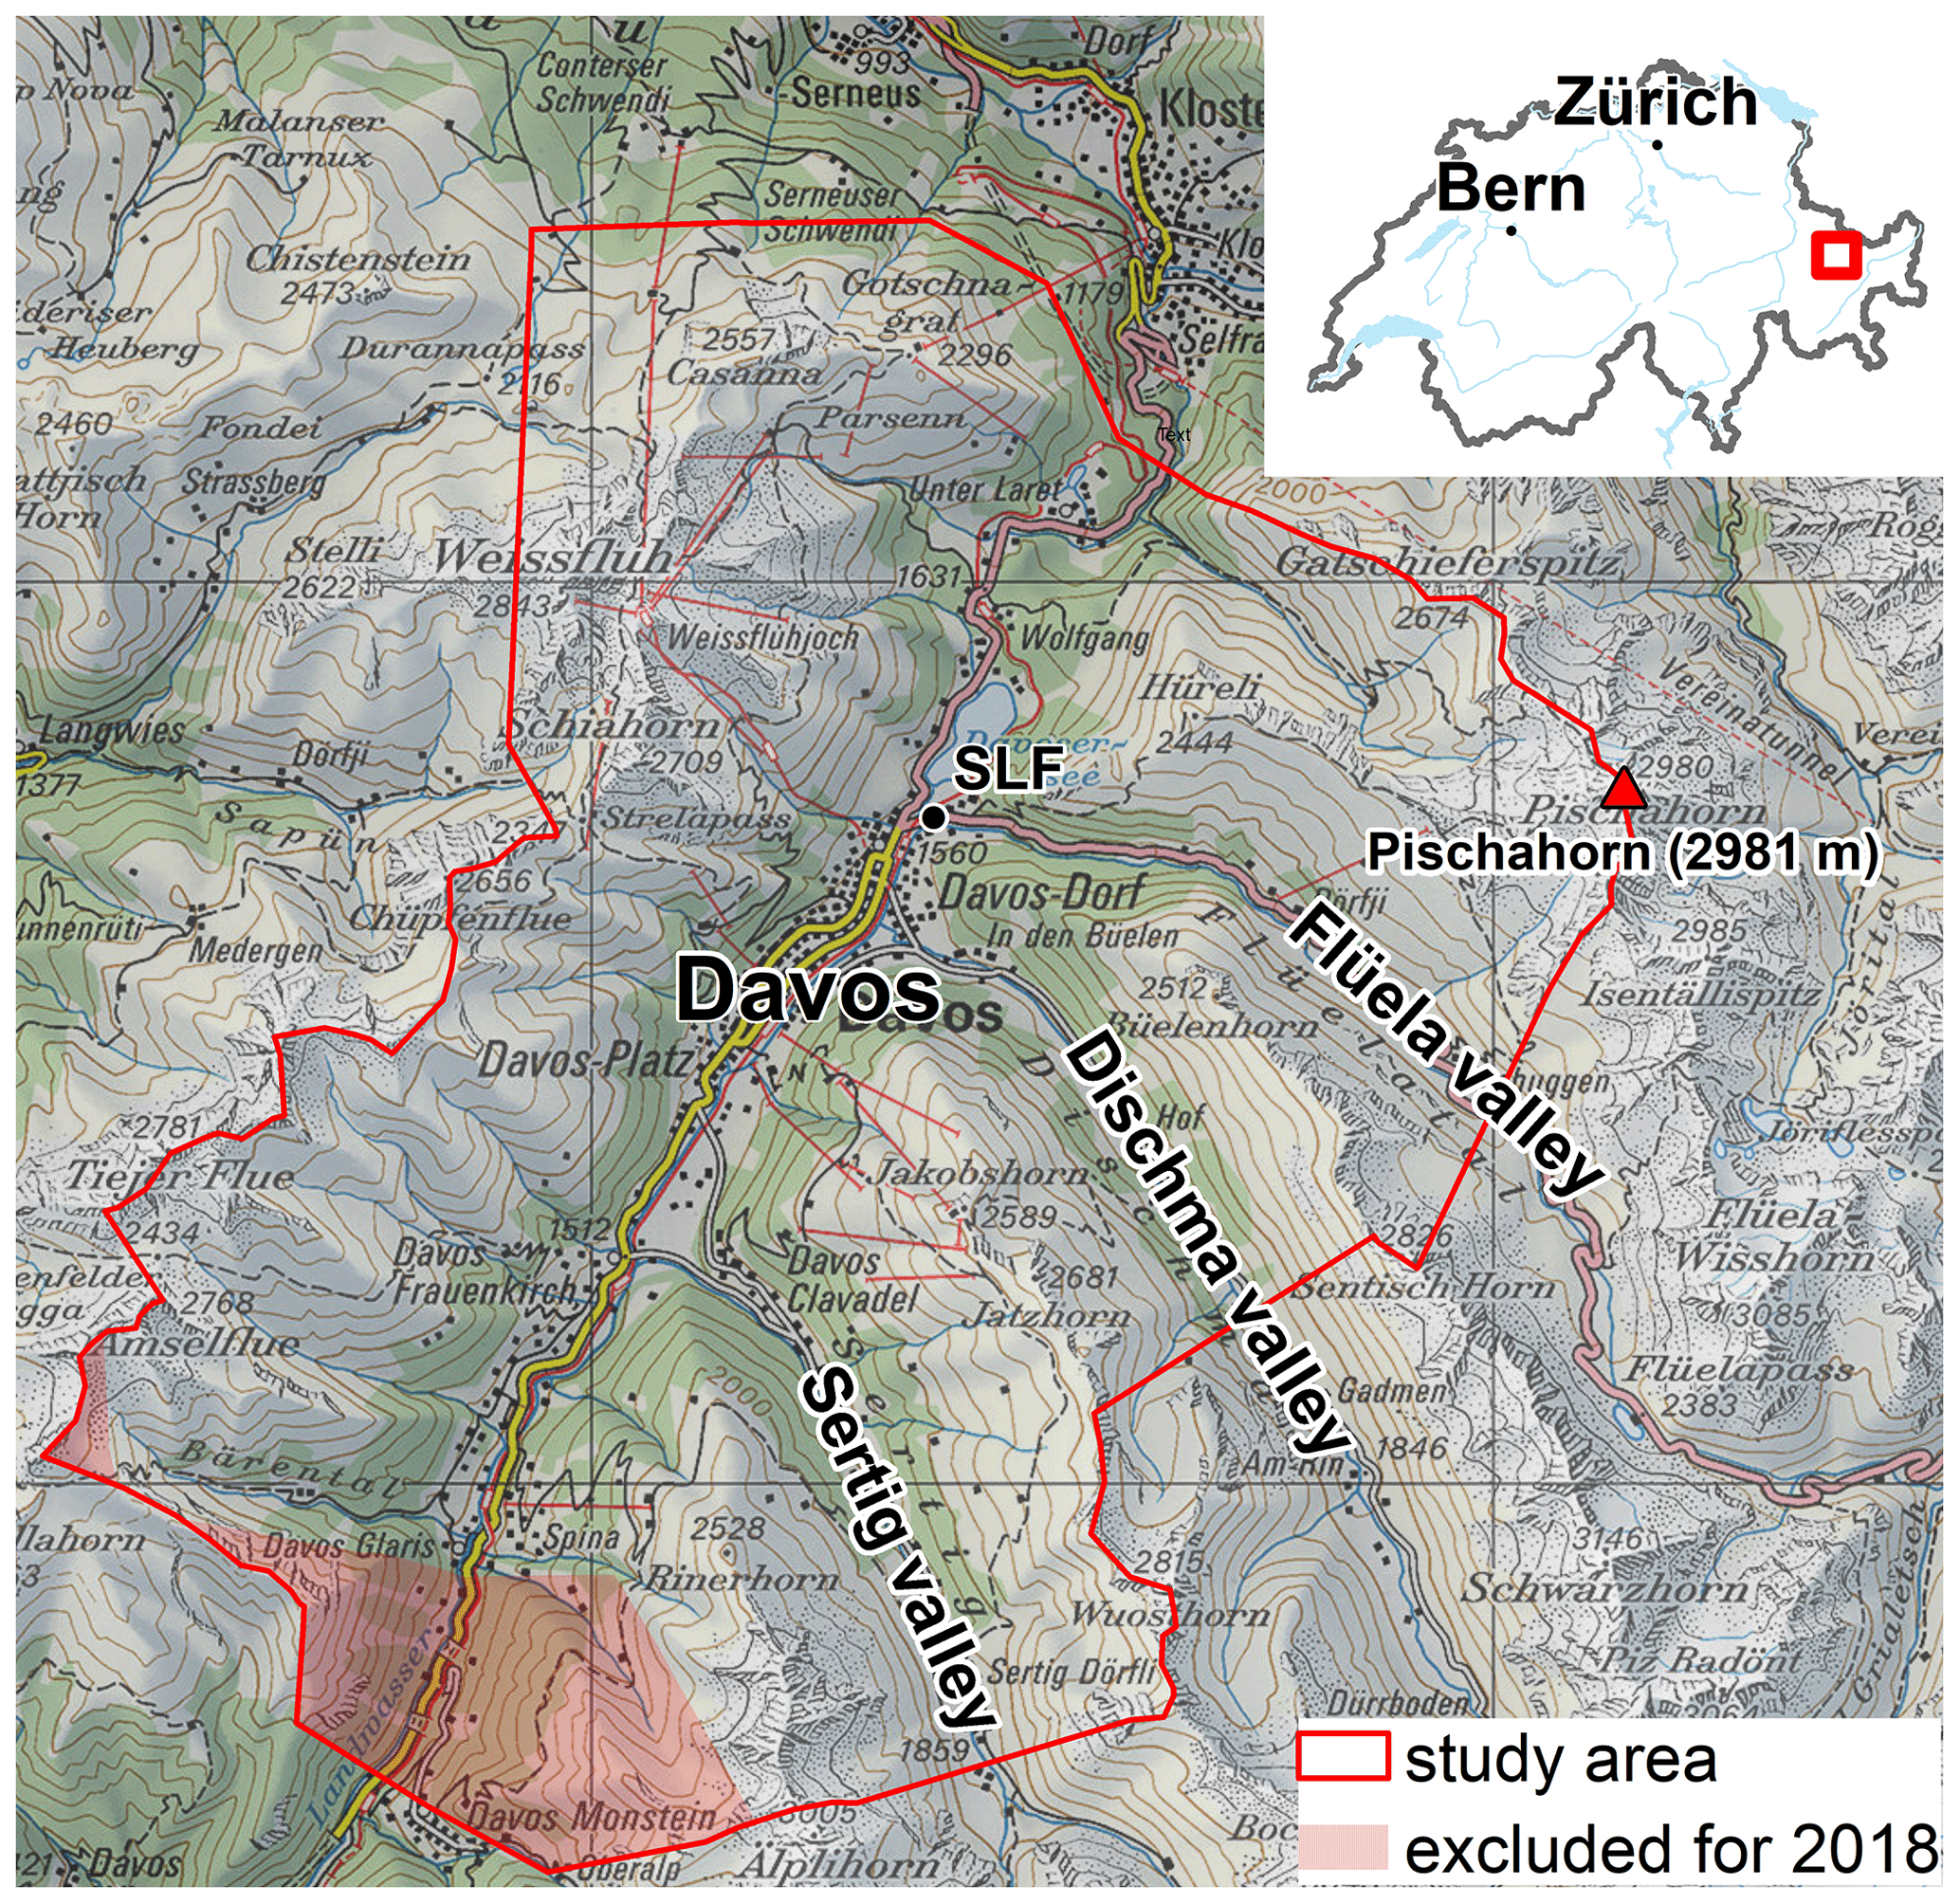
Figure 1The location of the validation area with the side valleys, the Institute for Snow and Avalance Research (SLF) and the highest point. The red-shaded area was omitted in 2018 due to lack of SPOT satellite data (map source: Federal Office of Topography).
For the validation, we considered two periods with high avalanche activity (Fig. 2):
-
From 20 to 24 January 2018, referred to as 2018. Following several snowfalls in January, about 150 cm of snow fell in 65 h. This was followed by rain up to 2000 m a.s.l. Consequently, numerous wet-snow, dry-snow and gliding avalanches released.
-
From 13 to 16 January 2019, referred to as 2019. Following several snowfalls in the 2 weeks before the period, heavy snowfall brought about 100 cm of new snow in 60 h. This resulted in mostly dry-snow avalanches, some with a destructive powder blast.
In both situations, danger levels 4 (high) and 5 (very high) on the five-level ordinal European Avalanche Danger Scale (WSL, 2019) were forecasted in the study area and avalanches of all sizes released.
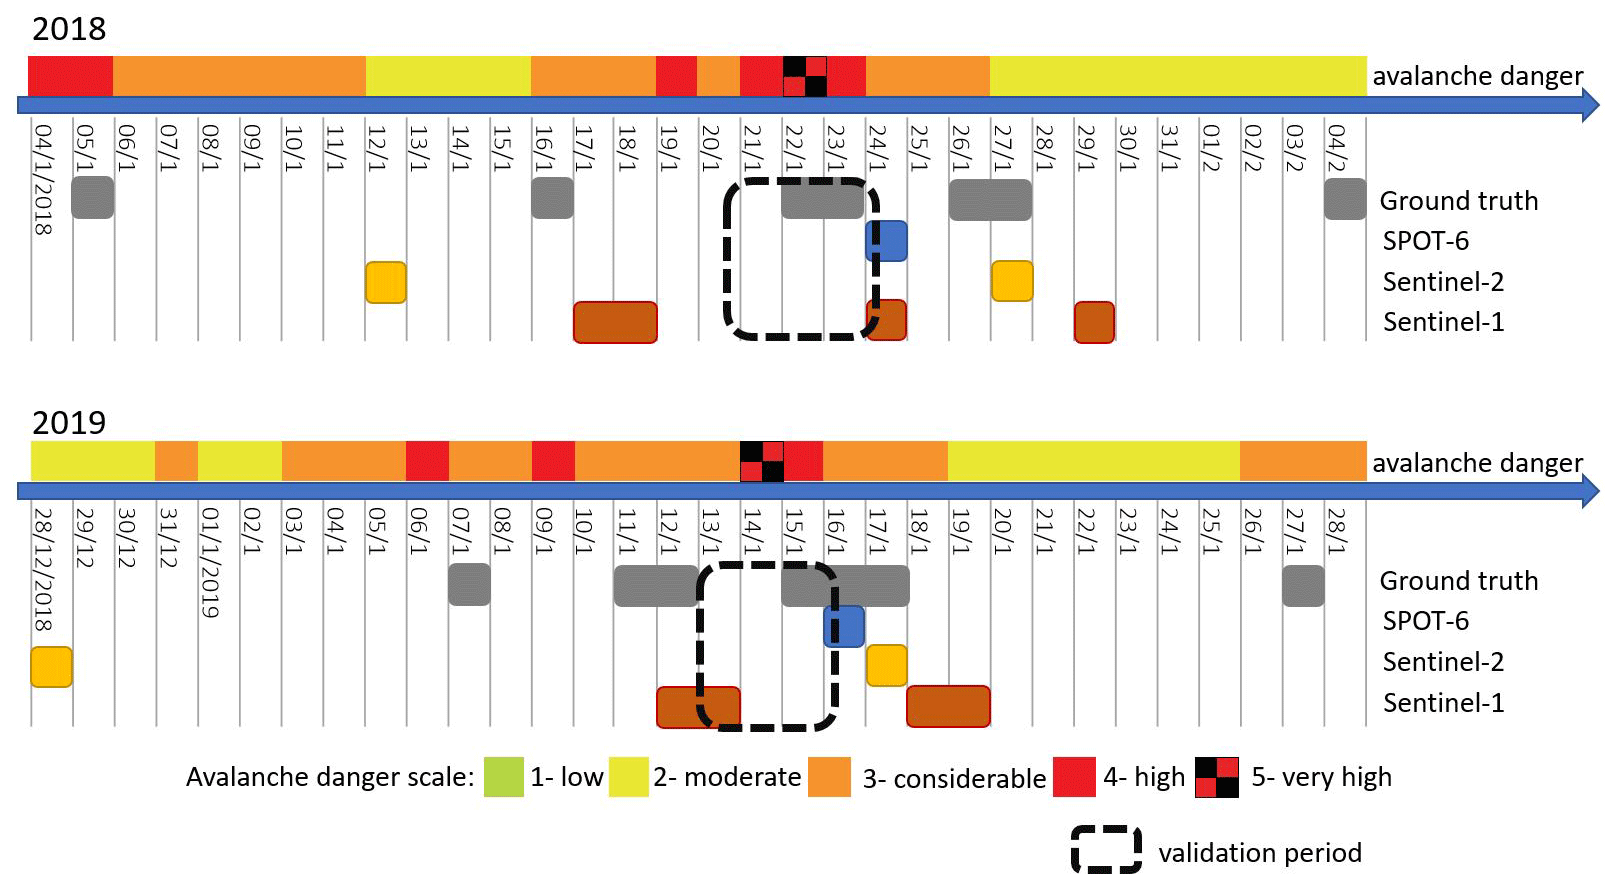
Figure 2Temporal overview of the two validation periods (marked by the dashed, black squares) and the respective days when ground-truth images and satellite data were captured (marked by colored boxes). On top the highest avalanche danger level forecasted in the validation area is shown for each day.
2.2 Satellite data
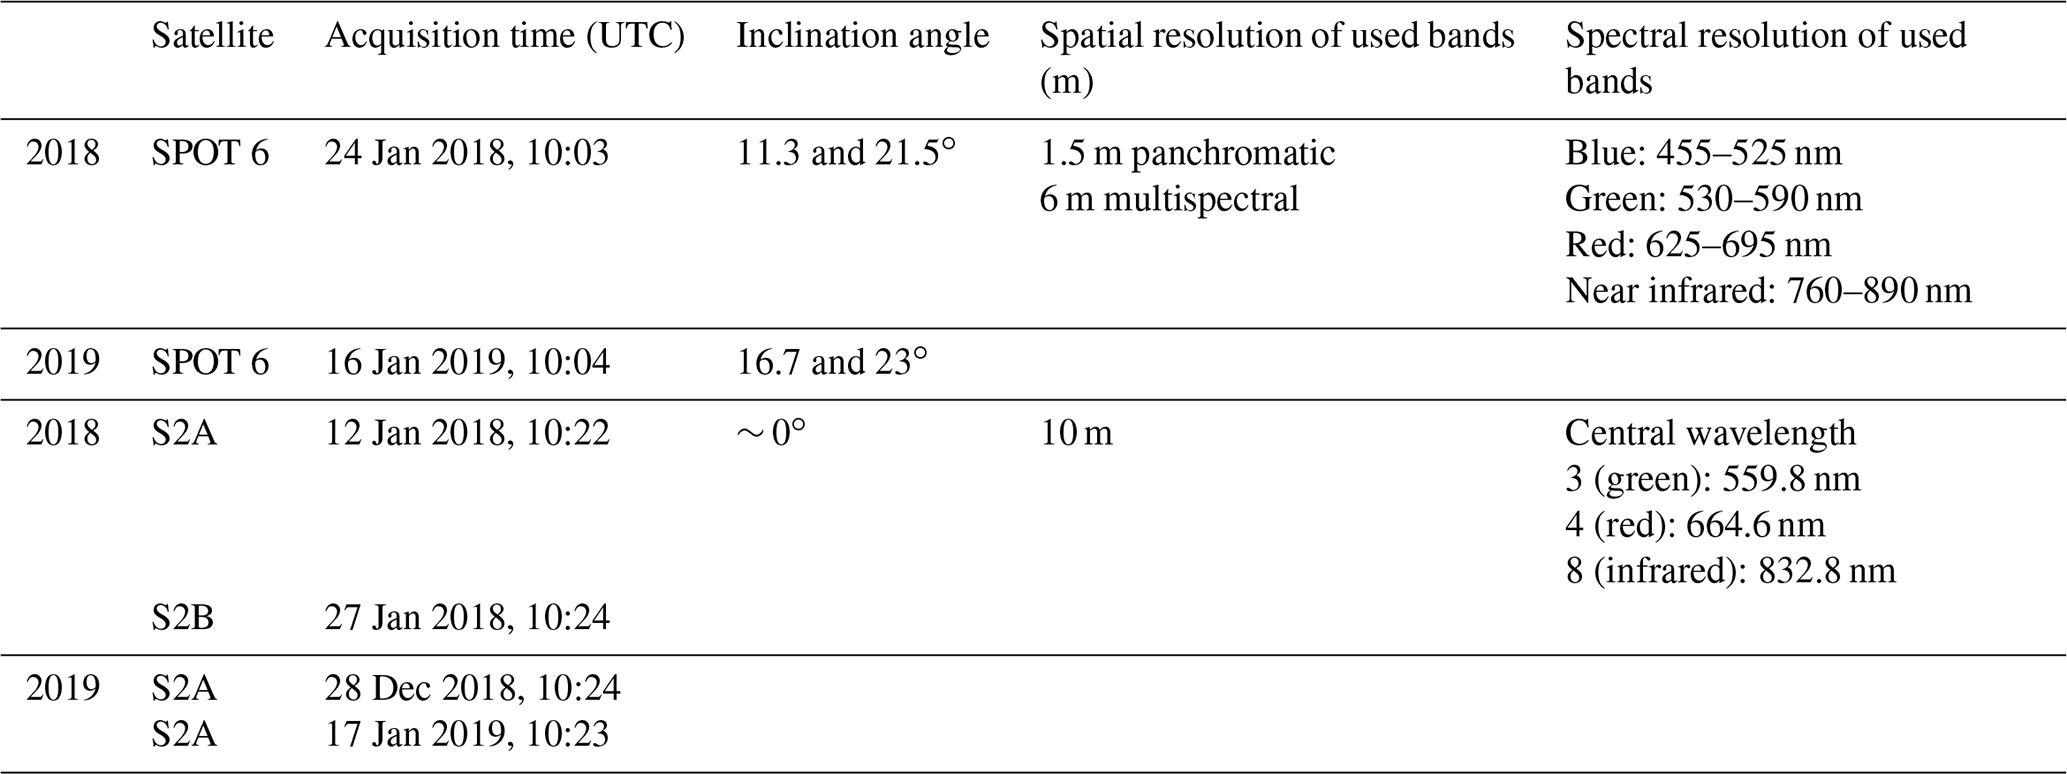
High-spatial-resolution (1.5 m) SPOT satellite imagery was acquired after the two validation periods on request (Fig. 2, Table 1). From operationally acquired medium-spatial-resolution (10 m) Sentinel-1 (Table 2) and Sentinel-2 (Table 1) acquisitions we selected images from before and after the validation period.
Table 1Properties of the data acquired by the optical sensors (SPOT 6 and Sentinel-2 – S2A and S2B).
2.3 Data preprocessing – optical data
We refrained from atmospheric corrections because they are not necessary for avalanche detection as atmospheric effects are relatively minor for most regions in winter since the water content of the atmosphere is typically low (Nolin, 2010). SPOT data were cloud-free for both years. For Sentinel-2 in 2019, about 7 % of the validation area on the post-event image was hidden by clouds. Because of the reliance on manual mapping we refrained from cloud preprocessing.
2.3.1 SPOT
SPOT imagery was delivered with type “primary” and pan-sharpened in full radiometric resolution (12 bit). The data were oriented using bundle block adjustment and orthorectified by swisstopo based on the high-quality terrain model swissALTI3D resampled to 5 m (swisstopo, 2018). In addition to automated tie-point generation, ground control points (GCPs) were digitized manually. The RMSE of the GCPs achieved a localization accuracy of better than 2 m in X and Y (Bühler et al., 2019).
2.3.2 Sentinel-2
We composed the bands 3, 4 and 8 of the Sentinel-2 level-1C products into one false-color image with a 10 m resolution. Orthorectification for Sentinel-2 level 1C relies on the 90 m resolution model PlanetDEM 90 (https://sentinel.esa.int/web/sentinel/user-guides/sentinel-2-msi/definitions, last access: 18 February 2021). Ressl and Pfeifer (2018) found an approximate accuracy of location of ±10 m (i.e., 1 Sentinel-2 pixel). No additional corrections of orthorectification were applied.
2.4 Data preprocessing – radar data
2.4.1 Sentinel-1
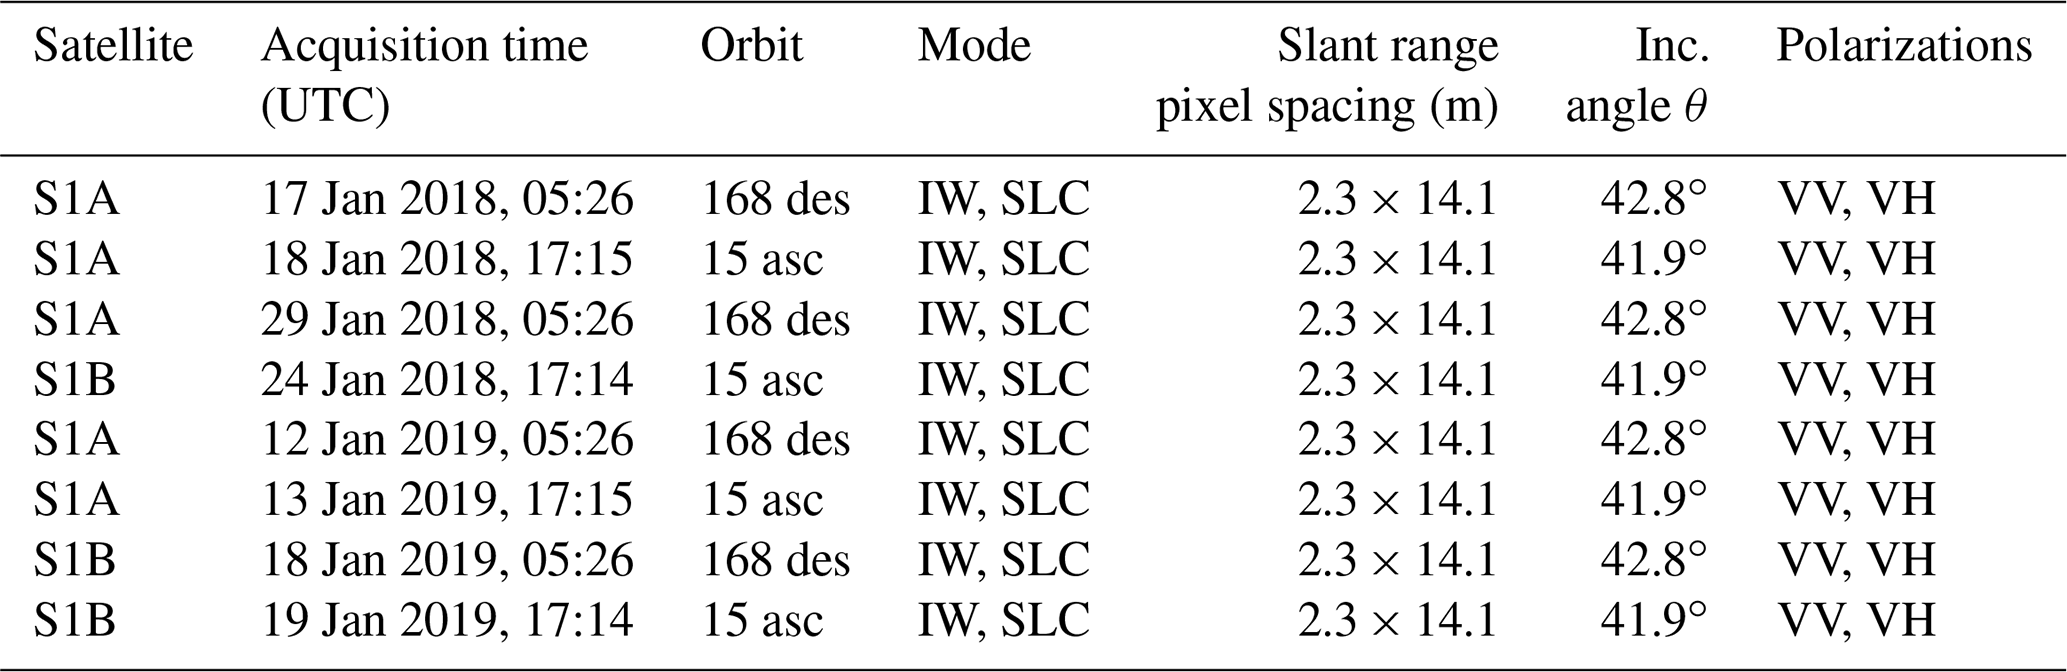
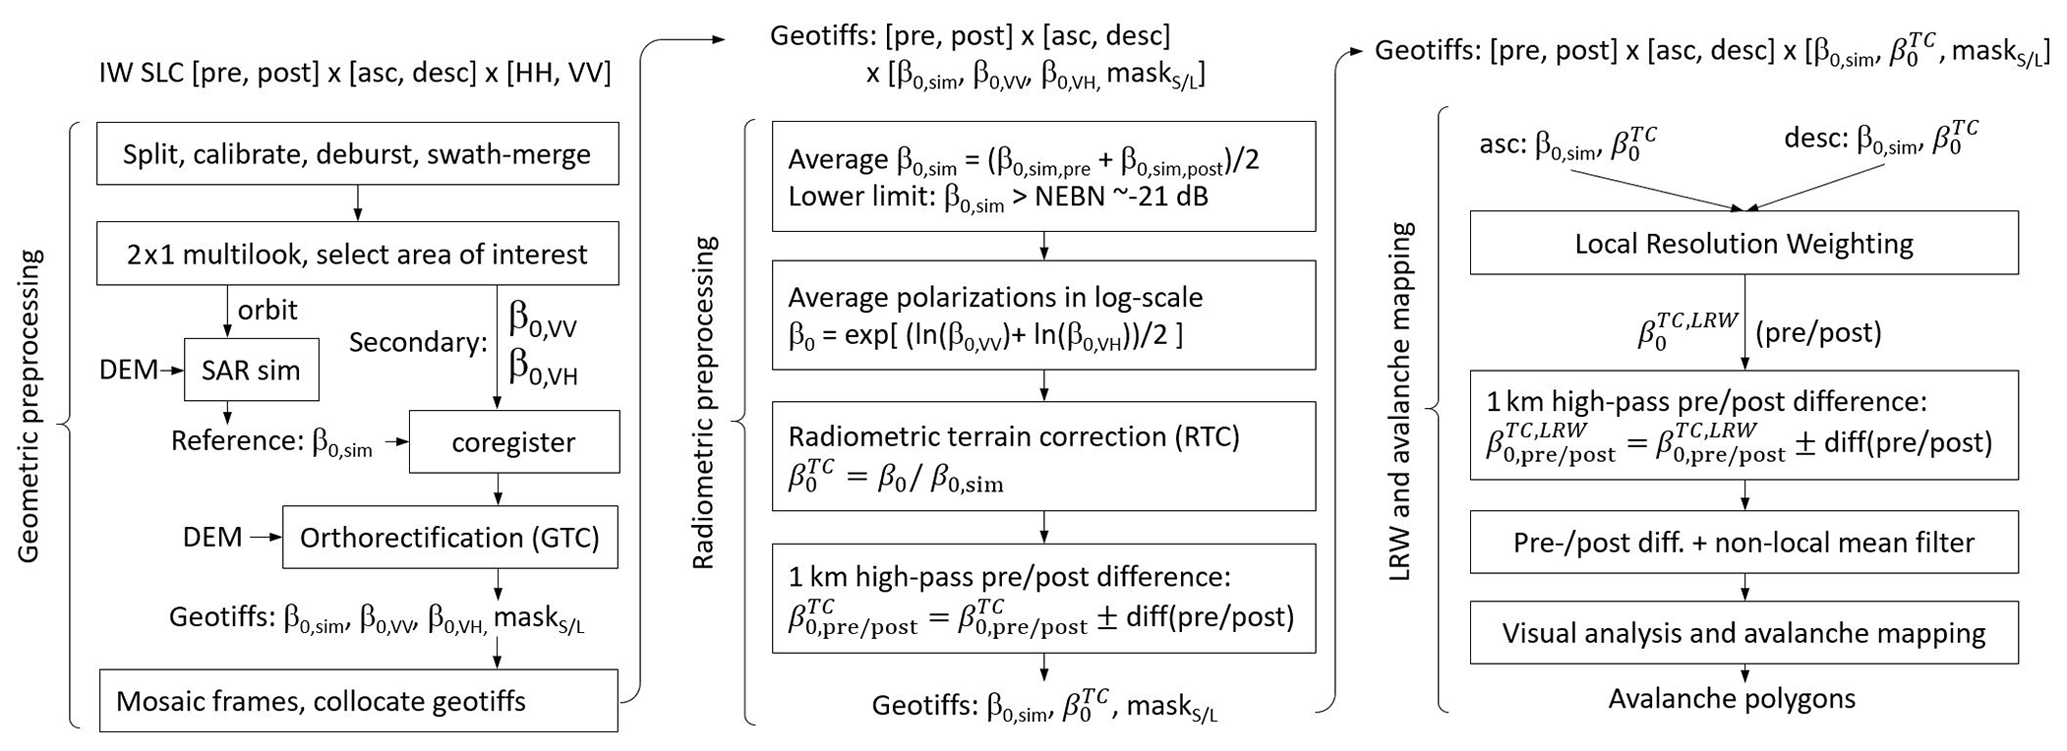
For processing, we followed the steps described in Leinss et al. (2020) but added local resolution weighting (LRW; Small, 2012) to optimize the spatial resolution and to minimize terrain shadow and layover effects. For LRW, two acquisitions from orbits with opposite view directions (ascending, looking east, and descending, looking west) were combined using a weighted average based on the local, terrain-dependent, resolution of every pixel. Table 2 lists the set of pre- and post-event images used for the two avalanche periods in 2018 and 2019; a processing flowchart is shown in Appendix A.
The coherent imaging method of the synthetic aperture radar (SAR) system requires some spatial averaging to reduce radar speckle and to improve the radiometric accuracy of the backscatter intensity. The native resolution of the single-look-complex (SLC) interferometric wide swath mode (IW) images of Sentinel-1 is about 3 × 23 m (slant range × azimuth), provided at a slant-range pixel spacing of 2.3 × 14.1 m (Bourbigot et al., 2016). To avoid loss of resolution we averaged (multi-looked) the images with a relatively small window of 2 × 1 pixels (range × azimuth). Then we averaged the backscatter intensity (β0) of both polarizations, VV and VH, scaled in decibels to reduce the multiplicative speckle noise.
As LRW requires extremely precise geocoding on the sub-pixel level we co-registered the measured backscatter intensity with the backscatter intensity β0,sim simulated using the swissALTI3D elevation model (swisstopo, 2018) downsampled to a 30 m resolution. We then orthorectified (geometric terrain correction) the measured and simulated backscatter images, sampled at a slant range resolution of 4.6 × 14.1 m (corresponds to a resolution of 6.9 × 14.1 m when projected on horizontal terrain), to a 10 × 10 m pixel spacing on the ground. Bilinear interpolation steps during co-registration, orthorectification and collocation of orthorectified images slightly reduced the spatial resolution.
The orthorectified radar images were then radiometrically terrain corrected (Small, 2011) with the simulated intensity () to remove the terrain-dependent illumination bias. LRW was applied to the backscatter signal of ascending (asc) and descending (des) acquisitions (in dB) using the simulated intensity as weight (, ):
LRW optimizes the spatial resolution, which depends strongly on the local incidence angle (given by the local slope angle η) and the topography because of the slant imaging geometry of SAR sensors (see Appendix B). From the final LRW images, we estimated an effective resolution of about 15 × 25 m. Leinss et al. (2020) list reasons, in accordance with the work of Oh et al. (1992), why the relative brightness of avalanches is stronger for slopes facing away from the radar. As these slopes are weighted more strongly by LRW, LRW also enhances the visibility of avalanches.
For avalanche segmentation we mapped areas which showed an increased radar backscatter signal in the difference in the pre- and post-avalanche event LRW image. To remove bias by changing snow properties (snow wetness), a 1 km high-pass filter was applied to the single-orbit and LRW difference image. Additionally, to suppress noise but to preserve spatially structured details, a nonlocal mean filter (Buades et al., 2005; Condat, 2010) was applied to the LRW difference image.
To compare the different mapping methods, we proceeded in five steps (Fig. 3) which are detailed in the sections below:
-
Avalanches were visually detected or mapped based on the satellite data (Sect. 3.1); furthermore, we extracted mapped avalanches from an existing database, the Davos avalanche mapping project (DAvalMap; Sect. 3.3).
-
The ground-truth data set was compiled from ground and helicopter photographs (Sect. 3.2).
-
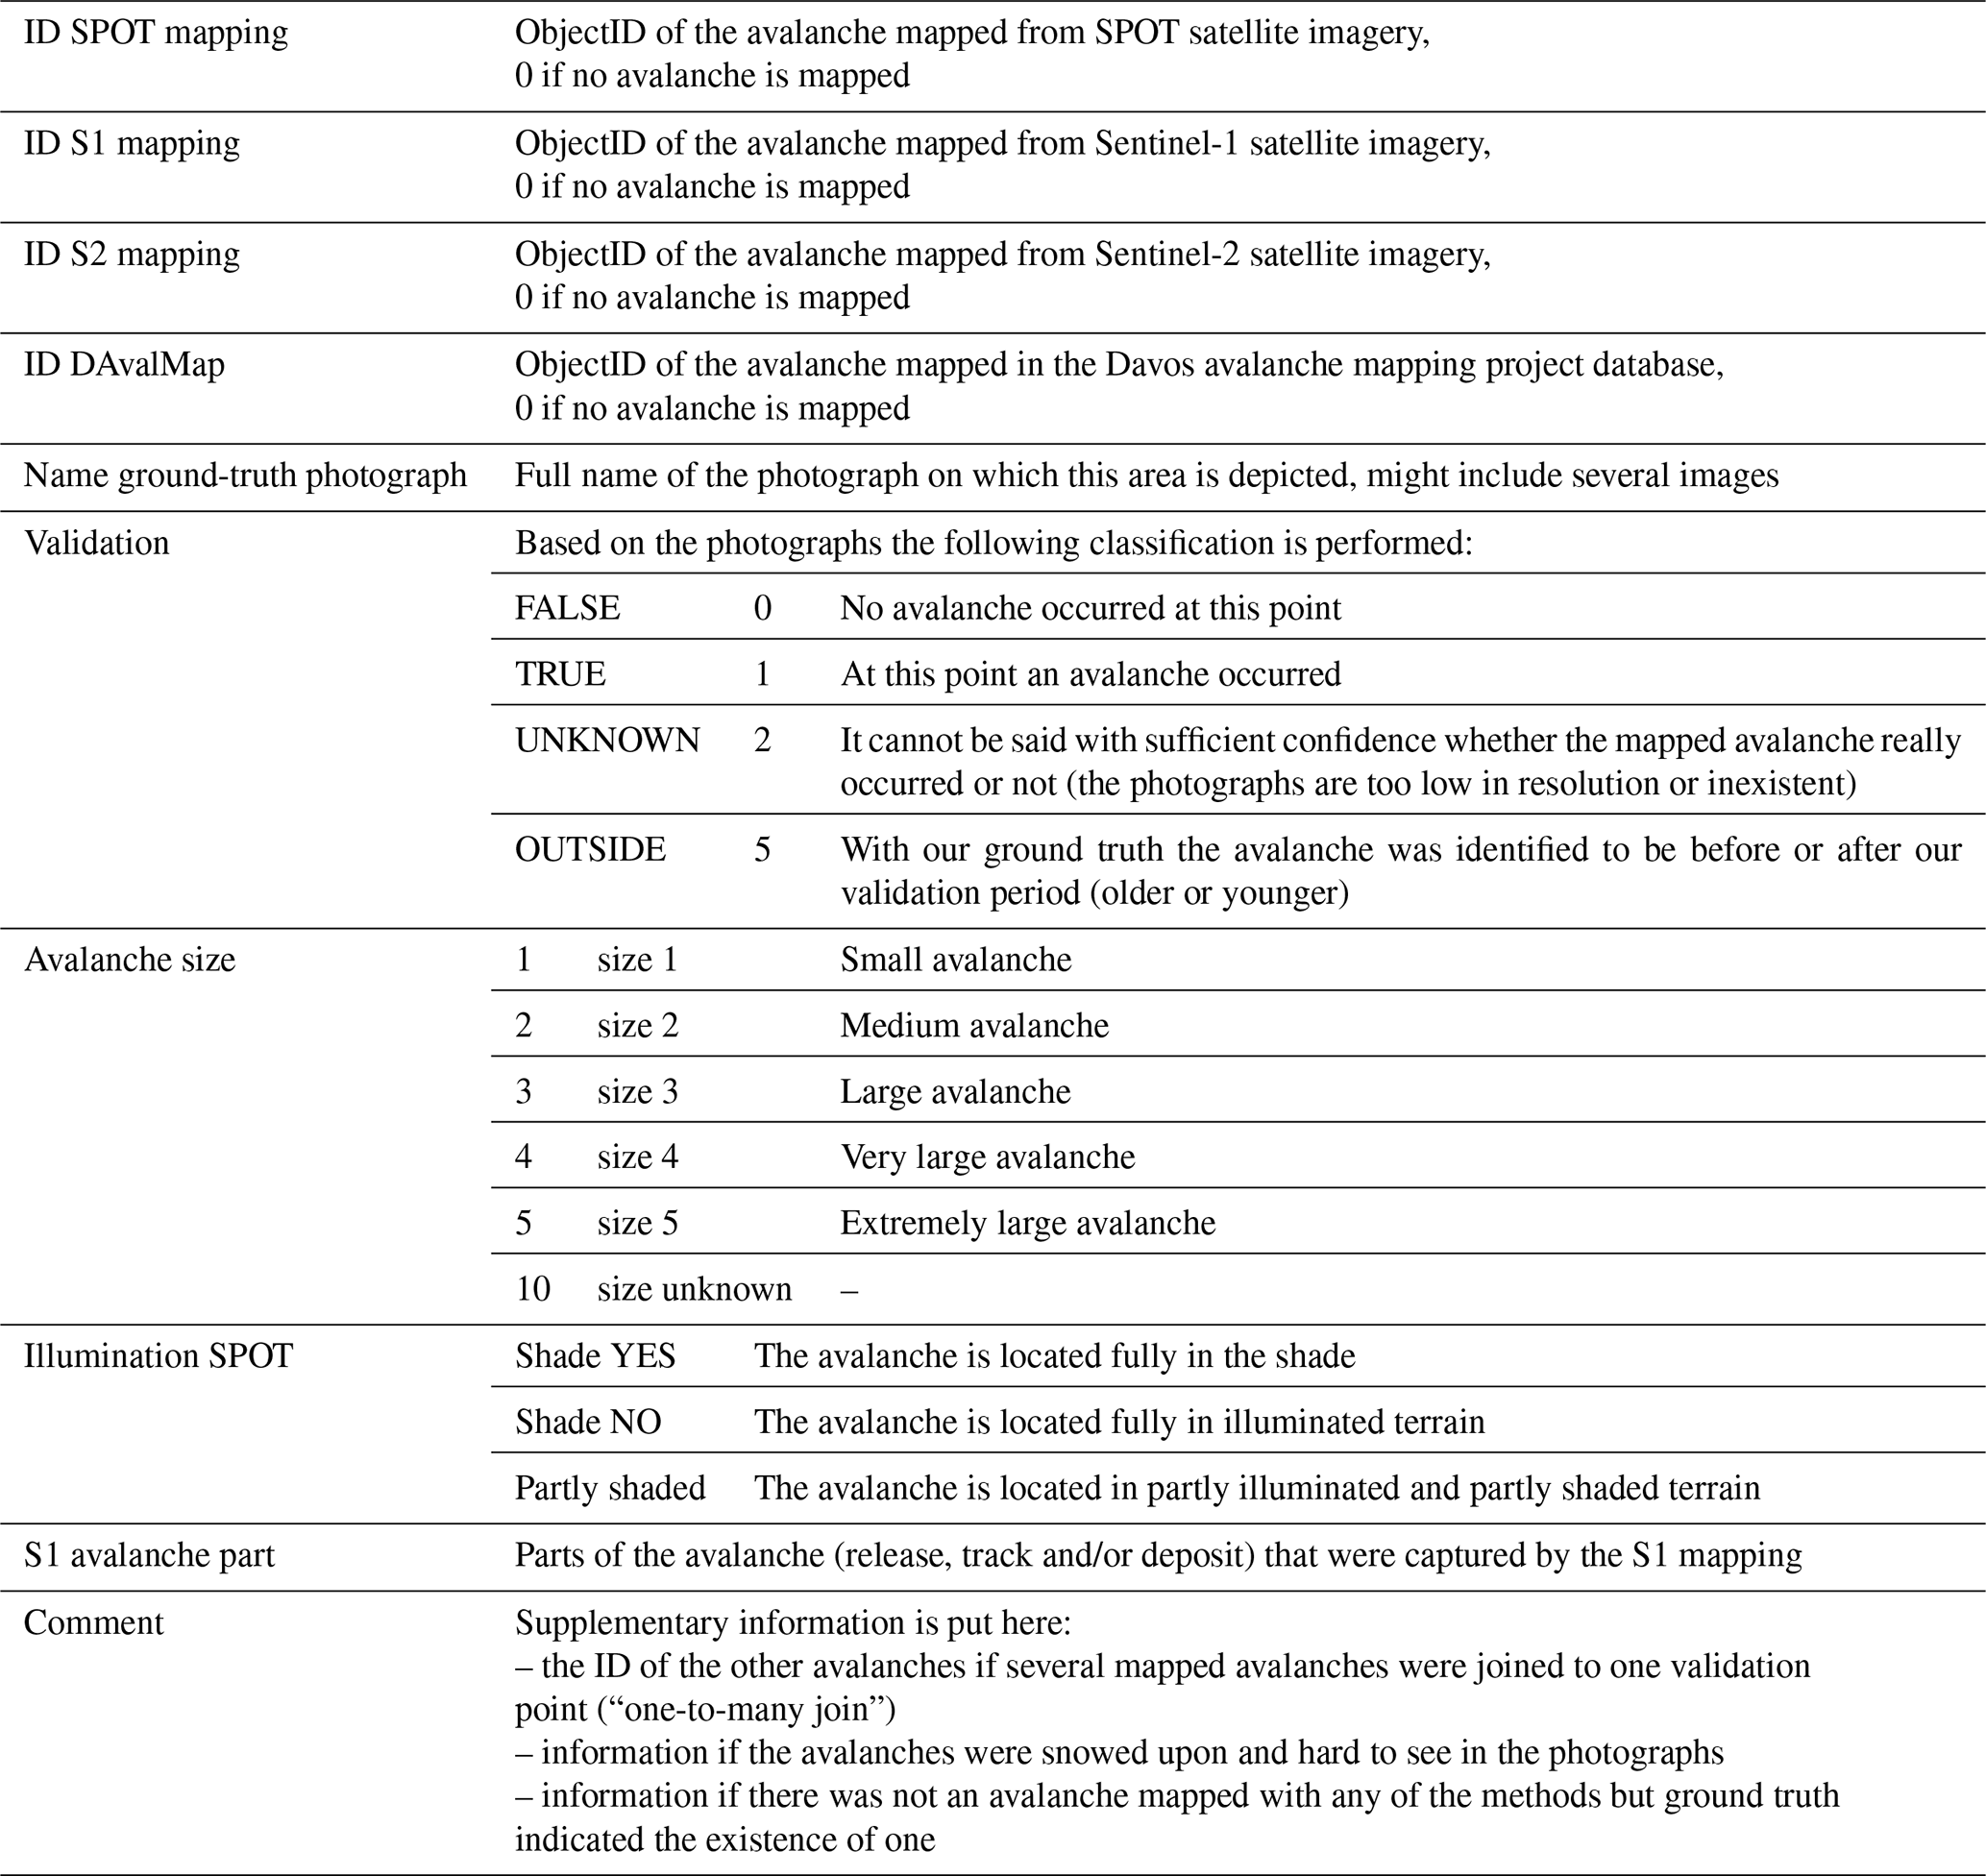
Validation points were defined to mark locations where the existence or non-existence of avalanches was examined. Consequently, validation points were created for all avalanches visible on ground-truth photographs and, in addition, for all locations where at least one of the visual mapping methods indicated an avalanche. Through bidirectional comparison of ground truth and mapped avalanches (Sect. 3.4), properties like true or false positives were assigned to the validation points (a full list of assigned attributes is given in Appendix C).
-
Validation points located in areas not covered by the ground truth or before or after the validation period were removed (Sect. 3.5).
-
Statistical measures were calculated (Sect. 3.5).

Figure 3Steps taken from the satellite mappings to the validation results. (1) Avalanches were mapped from satellite imagery and extracted from the DAvalMap database. (2) Ground-truth data were compiled. (3) In the validation process (Sect. 3.4), symbolized by the orange arrows, validation points were created and assigned attributes (see also Appendix C). (4) Points representing avalanches from before or after the validation period or outside ground truth were removed. The remaining validation points were used for analysis.
3.1 Visual detection of avalanches based on satellite data
For each of the three satellite image sources (Sect. 2.2), a different avalanche expert visually inspected the satellite images to detect and map features representing avalanches. We ascertained that the person mapping avalanches was familiar with the respective data source as we experienced that a trained person achieved better results than someone without the specific training. Furthermore, with a different person mapping the avalanches for each data source, we prevented information leaking about the presence of avalanches from one mapping method to another.
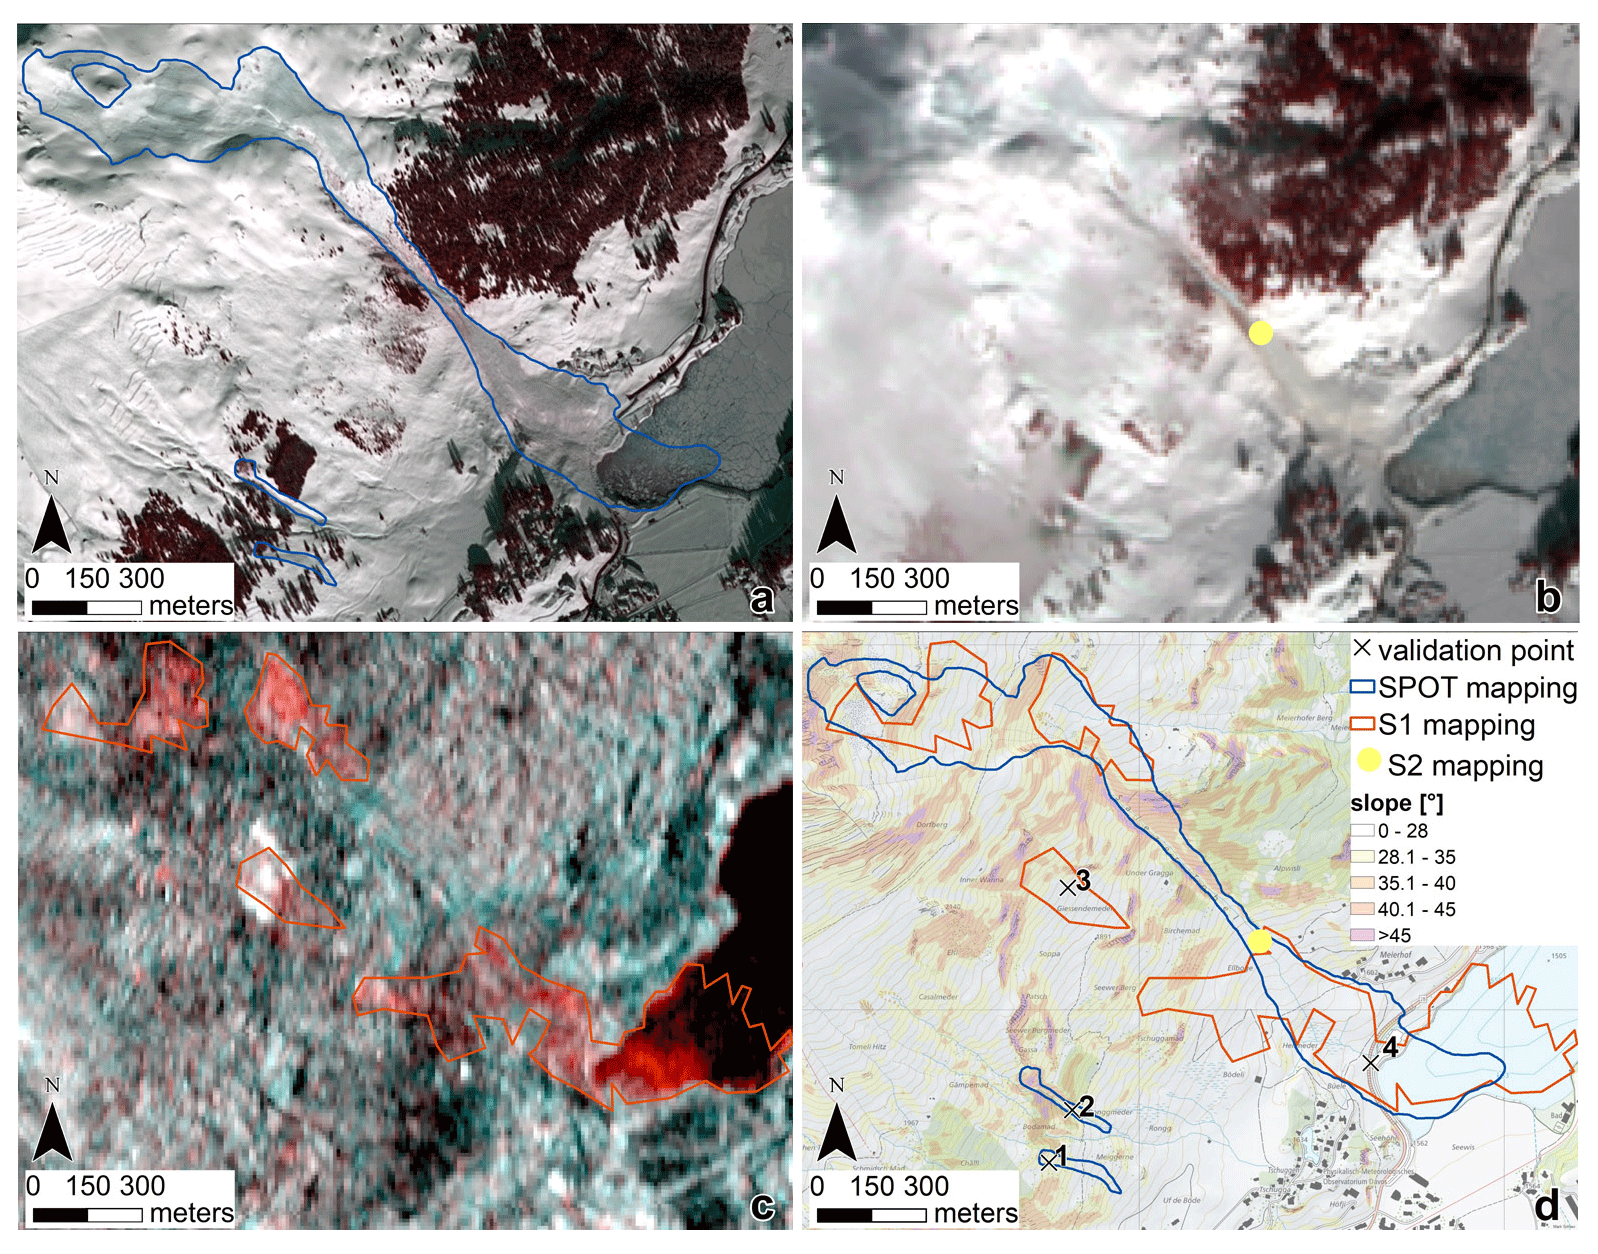
Figure 4Example of the mapping in 2019 and the base data used by the different methods for visual interpretation. (a) SPOT mapping (image: 16 January 2019, SPOT 6 © Airbus DS2019), (b) S2 mapping (image: 17 January 2019), (c) S1 mapping. The image shows an RGB composite of the pre- and post-avalanche event LRW images: red represents the post-event image, green-blue the pre-event image (pre-event image: 12 and 13 January 2019, post-event image: 18 and 19 January 2019, Sentinel-1 and Sentinel-2 © Copernicus data, 2019). (d) Overlay of the three mapping results on the Swiss Map Raster 25 with slope and the location of four validation points. At the validation points 1, 2 and 4 avalanches were confirmed by ground truth, whereas at validation point 3 no avalanche exists in the ground truth (S1 false positive). For validation points 1–3, each mapped avalanche corresponds to a single validation point (one-to-one join), whereas for the validation point 4, multiple S1 polygons correspond to a single validation point (one-to-many join) generated from ground truth (map source: Federal Office of Topography).
3.1.1 SPOT (SPOT mapping)
We took advantage of the false-color band combination in the near-infrared band (green, red and near-infrared (NIR) band), where the reflectance of snow is lower (Warren, 1982). The mapping followed the methodology described in Bühler et al. (2019): avalanches were identified and digitized as polygons from optical images (Fig. 4a). To improve visibility, image stretching and gamma optimization, as well as modifications of contrast and brightness for separate outline digitization in the sun and shaded areas, were applied. Additional data like the Swiss Map Raster 25 (swisstopo, 2020b), the summer orthophoto mosaic SWISSIMAGE 25 cm (swisstopo, 2020a) and the layer “Slope angle over 30∘” calculated from the swissALTI3D (swisstopo, 2018) were used for interpretation. The mapping was performed as part of two verification campaigns following the avalanche-active periods in 2018 and 2019 (Bründl et al., 2019; Zweifel et al., 2019), conducted for a much larger area than our study area. Of all mapped avalanches, 486 are located in our study area (2018 – 368, 2019 – 118).
3.1.2 Sentinel-2 (S2 mapping)
S2 mapping relied on false-color composite (green, red and NIR) images (Fig. 4b). For identification of avalanches, the post-event image was searched for identifiable avalanche features. Additionally, the pre-event image was consulted to identify changes (e.g., in forest) that might be connected to avalanches. As supplementary information, the SWISSIMAGE 25 cm (swisstopo, 2020a) was used. Avalanches were marked as points because the outline could not be meaningfully identified at the spatial resolution of S2. In total 44 points identifying avalanches were created (2018 – 34, 2019 – 10). In 2019 about 7 % of the validation area was hidden by clouds in the Sentinel-2 image. In total 15 avalanches were hidden in those spots with regard to ground truth (size 1 – 4, size 2 – 9, size 3 and size 5 – 1 each). Statistics for Sentinel-1 in Sect. 4 were calculated accordingly.
3.1.3 Sentinel-1 (S1 mapping)
For S1 avalanche polygons were mapped using the backscatter difference images (Sect. 2.2, Fig. 4c). In uncertain cases (e.g., to remove bright pixels due to changing human objects), the radiometrically terrain-corrected RGB backscatter composites (Fig. 4c) were considered for reference. As shown in the processing graph (Appendix A), avalanches were manually detected based on the apparent visual brightness and the shape and size of bright pixels. No pre-defined threshold was used as the mapping was performed manually. In total 125 avalanche polygons were created (2018 – 46, 2019 – 79).
3.2 Ground truth
As ground truth, we relied on over 900 photographs taken before and after the two avalanche periods (Fig. 2). Photographs were taken from the valley floor or from locations within the three ski areas by the interns of the avalanche warning service. Additionally, helicopters were used to document the exceptional avalanche activity. To avoid a bias from ground truth, we did not analyze the ground truth before finalizing the satellite mappings and the Davos avalanche mapping (Sect. 3.3). With plain photographs as ground truth, we could validate the existence of avalanches, albeit not the accuracy of outlines as the photographs were not orthorectified.
Due to limited terrain visibility, our ground truth showed gaps in both validation periods. In these gaps no validation was possible (Fig. 5). Still, the available data allowed for validation of the majority of avalanches for each period as ground truth was available for 84 % of the perimeter in 2018 and for 74 % in 2019.
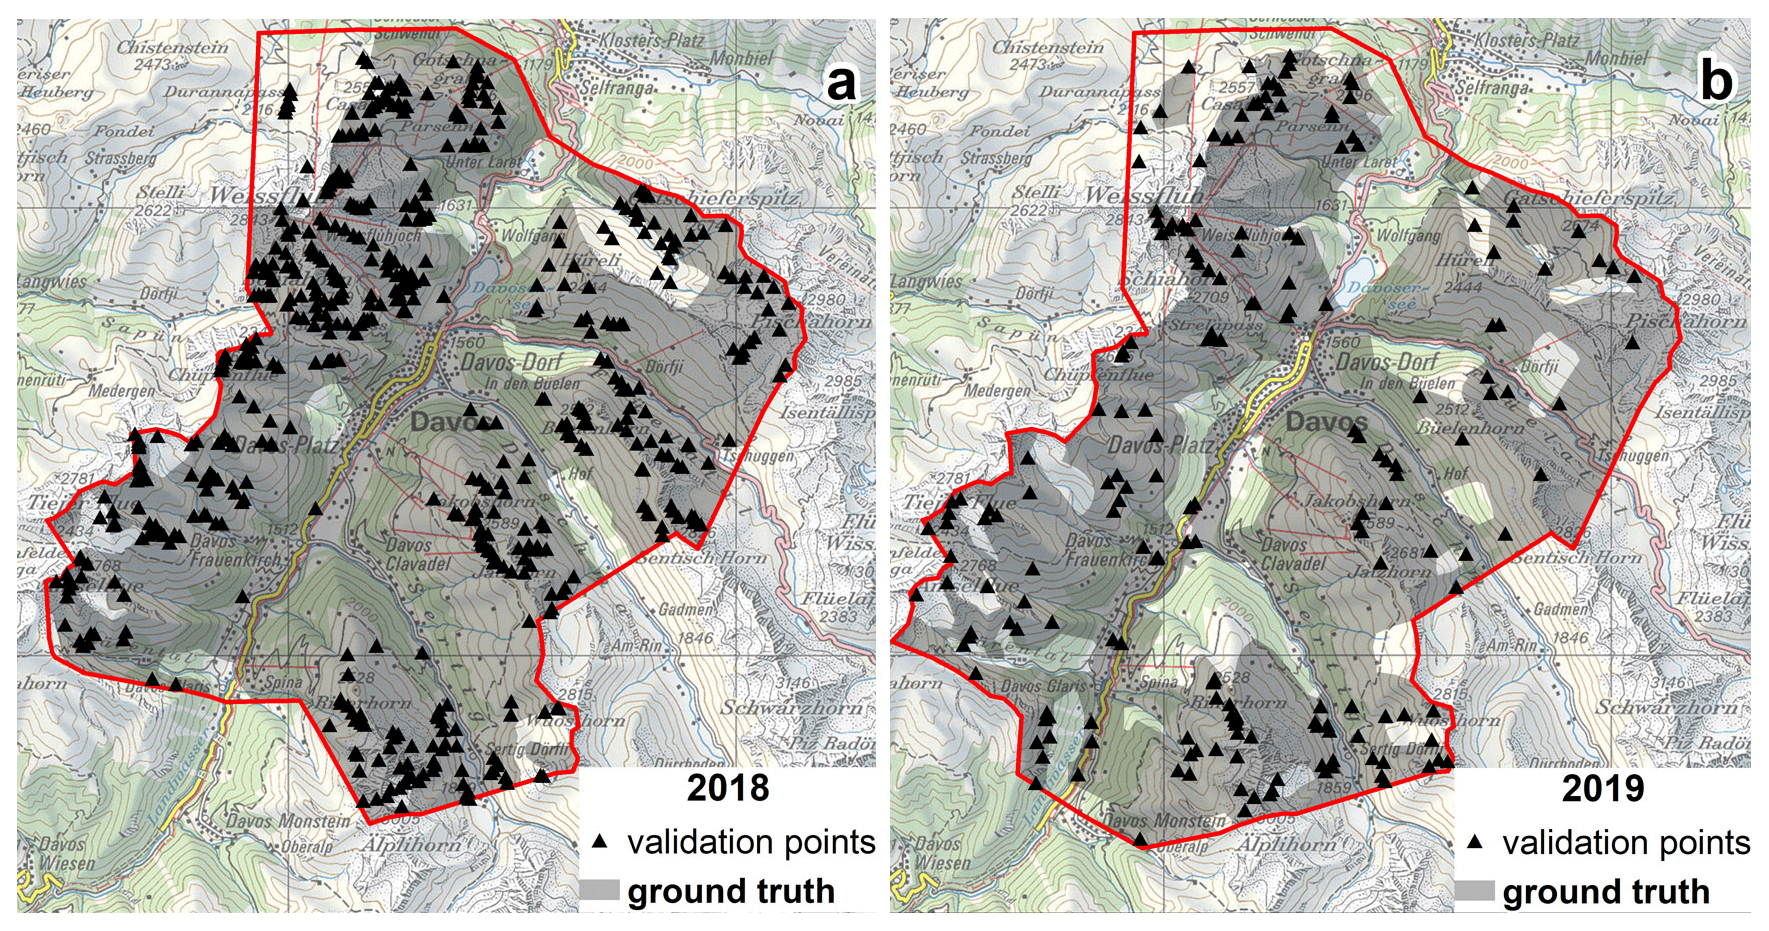
Figure 5Coverage of the study area with ground truth for (a) 2018 and (b) 2019 avalanche periods. The black triangles represent validation points. Mapped avalanches at validation points located in the gaps of the ground truth could not be evaluated (map source: Federal Office of Topography).
3.2.1 Avalanche size
To relate the mapping results to avalanche size, we classified the avalanches at the validation points. Two raters assigned avalanche size independently from each other using the ground-truth photographs. Avalanches were given one of five ordinal size classes (size 1 – small, size 2 – medium, size 3 – large, size 4 – very large, size 5 – extremely large) according to the classification defined by the European Avalanche Warning Services (EAWS, 2020) or were assigned as “unknown” if the size could not be determined. The sizes assigned by the two raters corresponded well (Cohen's κ= 0.84, considered an “almost perfect agreement”; Cohen, 1968; Landis and Koch, 1977). For 56 cases, when avalanche size differed (2018 – 37, 2019 – 19), the two raters discussed the size classification to assign a unique size. For 79 % of avalanches one of the size classes could be assigned; the remaining 21 % of the avalanches were classified as size unknown.
3.3 Davos avalanche mapping project (DAvalMap) – a ground-truth alternative
Since the winter of 1949/50, avalanches occurring in the region of Davos have been mapped. To obtain a high-quality avalanche inventory, the national avalanche warning service, located at the Institute for Snow and Avalanche Research (SLF) in Davos, cooperates with the rescue services of the ski areas and the council's avalanche warning service to document avalanches. The area of the DAvalMap covers about 180 km2 and corresponds to the study area described in Sect. 2.1. Great efforts are made to obtain a complete-as-possible avalanche inventory. However, missed avalanches and uncertain release dates may occur particularly during prolonged storms with limited visibility or due to a limited view of the more remote parts of the region.
Avalanches are recorded in the DAvalMap if the minimum extension is 50 m in one direction (width or length) for slab or glide-snow avalanches and for a length of 100 m for loose-snow avalanches. Generally, avalanches are documented by photographs taken in the field, and, at a later stage, their approximate outlines are mapped by the avalanche warning intern manually.
The Davos avalanche mapping (DAvalMap) data set is especially meaningful as it provides one of the rare data sets where avalanches have been mapped as comprehensively as possible for decades. The DAvalMap data set has been used in several studies, e.g., for validation of the avalanche forecast, as input to model wet-snow avalanche occurrence and runout distance, or to derive terrain characteristics describing potential release areas (e.g., Schweizer et al., 2003; Wever et al., 2018; Bühler et al., 2018; Harvey et al., 2018; Schweizer at al., 2020).
The properties of this data set make it a potential candidate to validate avalanches detected in, e.g., remote sensing time series. However, currently information about the quality and particularly the completeness of this data set is missing; therefore we include it in the analysis and compare the DAvalMap with the ground-truth data set.
3.4 Validation points
As our ground truth does not cover the validation area completely (Fig. 5), we had to examine our ground truth twice: first to identify avalanches in the ground truth (positives) and to create validation points which we continued to match with the mapped avalanches to classify them as true positives or false negatives and, second, to check whether the remaining unmatched avalanches (from our examined methods) were covered by ground-truth photographs which proved them to be a false detection (false positives). If no ground-truth photograph was available or where a human interpreter could not identify an avalanche on ground truth with sufficient certainty, the mapping was classified as unknown. Properties were assigned to each validation point describing which method detected an avalanche at the specific location (see also Appendix C).
We placed no validation points in locations where no avalanche was detected, even though the detection of non-events (true negatives) would have been correct. Validation points were placed either inside the area of the avalanche visible on the ground truth or, in the case the ground truth showed no avalanche or no ground truth was available, somewhere within the avalanche polygon of the corresponding mapping method. For matching locations, avalanches detected in the mapping methods had to be assigned to ground-truth validation points. In most cases, a single avalanche – outline (SPOT, S1) or point (S2) – was assigned to one validation point (Fig. 6a and validation point 1–3 in Fig. 4d). However, as sometimes one avalanche was mapped with a single polygon by one method but split up into several polygons (or points) by another method, we allowed for one-to-many and many-to-one joins (Fig. 6b and c and validation point 4 in Fig. 4d). A one-to-many join means one validation point is linked to multiple avalanche polygons, whereas a many-to-one join links one avalanche polygon to several validation points, both with respect to ground truth.
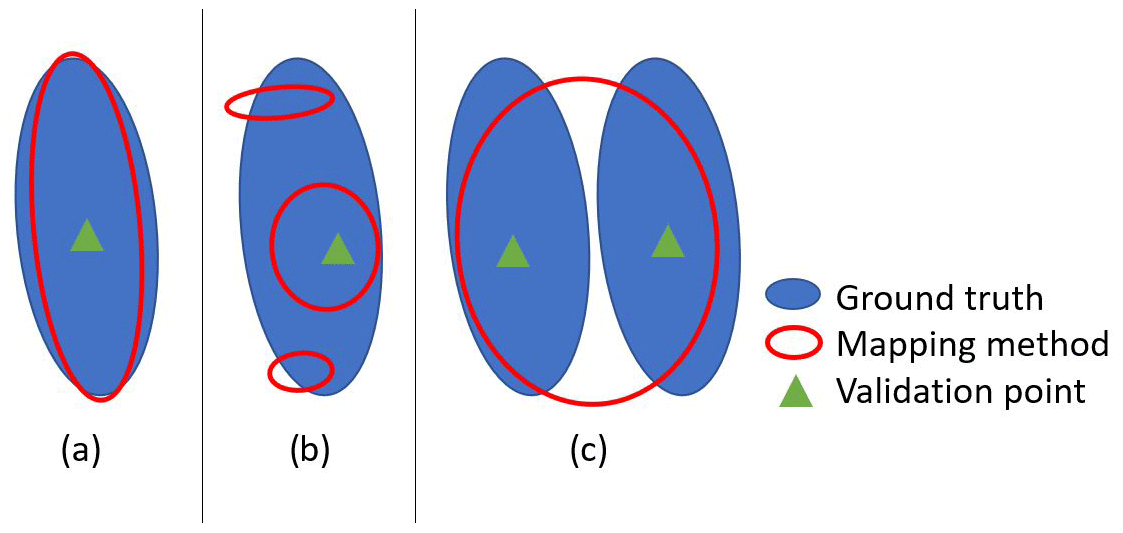
Figure 6Illustration of a one-to-one join (a), a one-to-many join (b) and a many-to-one join (c) used to assign the avalanches mapped by the different methods to the validation points.
In total, we created 733 validation points (2018 – 536, 2019 – 197). Of these, the 181 points classified as unknown were omitted from further analysis (2018 – 131, 2019 – 50). Orbit revisit times restricted the image acquisition times which differed by a few days as shown in Fig. 2. Therefore, it is possible that avalanches were mapped which had occurred before or after the validation period given by field photographs taken before and after the event. To remove them, 50 additional points were excluded (2018 – 48; 2019 – 2). This allowed us to use in total 502 (68.5 %) of all validation points (2018 – 66.6 %, 2019 – 73.6 %) for performance evaluation.
3.5 Statistical measures
To assess the detection performance of each mapping method, we calculated two statistical measures, which are based on standard 2 × 2 contingency tables (Table 3).
Table 3Contingency table with two outcomes (avalanche is 1, no avalanche is 0; adapted from Trevethan, 2017).
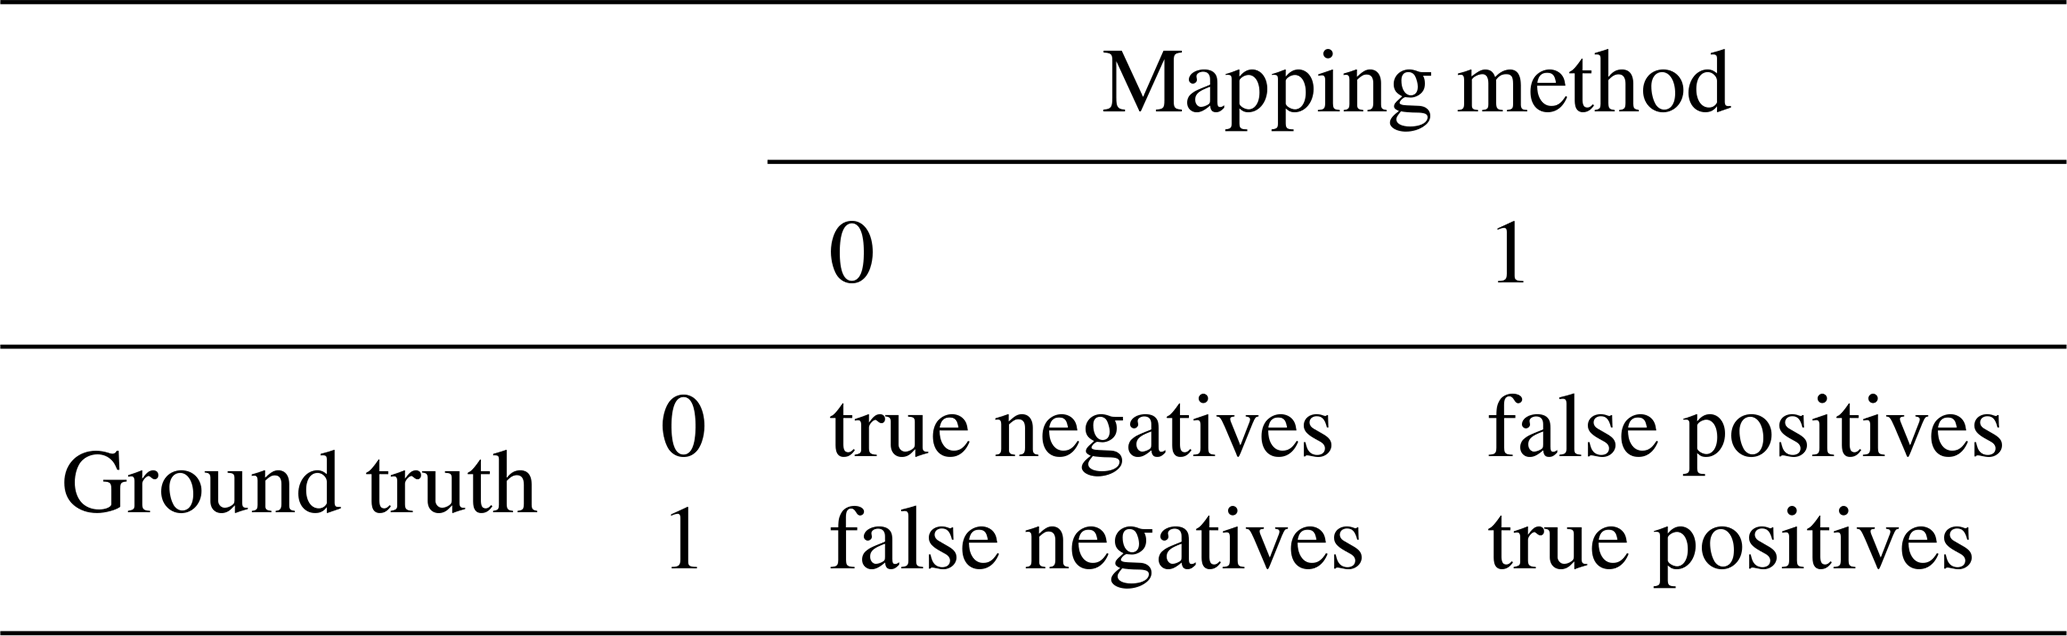
To determine how many of the avalanches identified in the ground truth were correctly detected in the satellite data by a human (research question 1), we calculated the probability of detection (POD), also called detection rate (adapted from Trevethan, 2017; see also Appendix D):
To determine how often there was really an avalanche when a human visually detected an avalanche in satellite data (research question 2), we calculated the positive predictive value (PPV; adapted from Trevethan, 2017; see also Appendix D):
3.6 Location-specific detection
Avalanche illumination conditions in optical imagery. Cast shadow on slopes has been observed to make avalanches difficult to detect in optical satellite imagery (Bühler et al., 2019; Leinss et al., 2020). Calculations using a digital elevation model (DEM) and the specific azimuth and altitude at image acquisition have shown that 65 % (61 %) of the investigated perimeter were illuminated at the time of SPOT image acquisition in 2018 (2019). To show the effect of this, the SPOT avalanches were visually checked to see if the avalanche visible on ground truth was in fully illuminated, partly illuminated (at least one-fifth of the area shaded or illuminated) or fully shaded parts of the SPOT imagery.
Partial detection of avalanches by radar. Among others, Leinss et al. (2020) and Abermann et al. (2019) pointed out that radar is more likely to detect the deposit area of avalanches, whereas the release area and the avalanche track could often be missed. To quantify this characteristic of avalanche detection by radar, we used the large number of avalanche polygons derived from Sentinel-1 in combination with the ground-truth photographs to estimate which part of an avalanche is covered by the S1 avalanche polygon. For that we considered the upper third of the ground-truth avalanche as release area, the middle part as avalanche track and the lower third as the deposit area. Each part mapped by S1 was added to the properties of the corresponding validation point. Then we calculated the POD for the subset of S1 avalanches which contained only one of the three properties of deposit, track and release area.
We performed the following analyses:
-
POD per avalanche size for each mapping method
-
POD and PPV of avalanches ≥ size 2 for each mapping method
-
POD dependence on illumination for the SPOT mapping
-
effects of partial avalanche detection in S1 mapping on the POD and PPV
-
implications of validation with other data as ground truth.
According to the ground truth, 445 avalanches occurred in the two validation periods (2018 – 318, 2019 – 127). The resulting size distributions are shown in Fig. 7. Except for size-1 avalanches, which we believe are under-represented in the ground truth, the observed size distributions agree with magnitude–frequency distributions observed in other avalanche size distributions (i.e., Faillettaz et al., 2004; Schweizer et al., 2020).
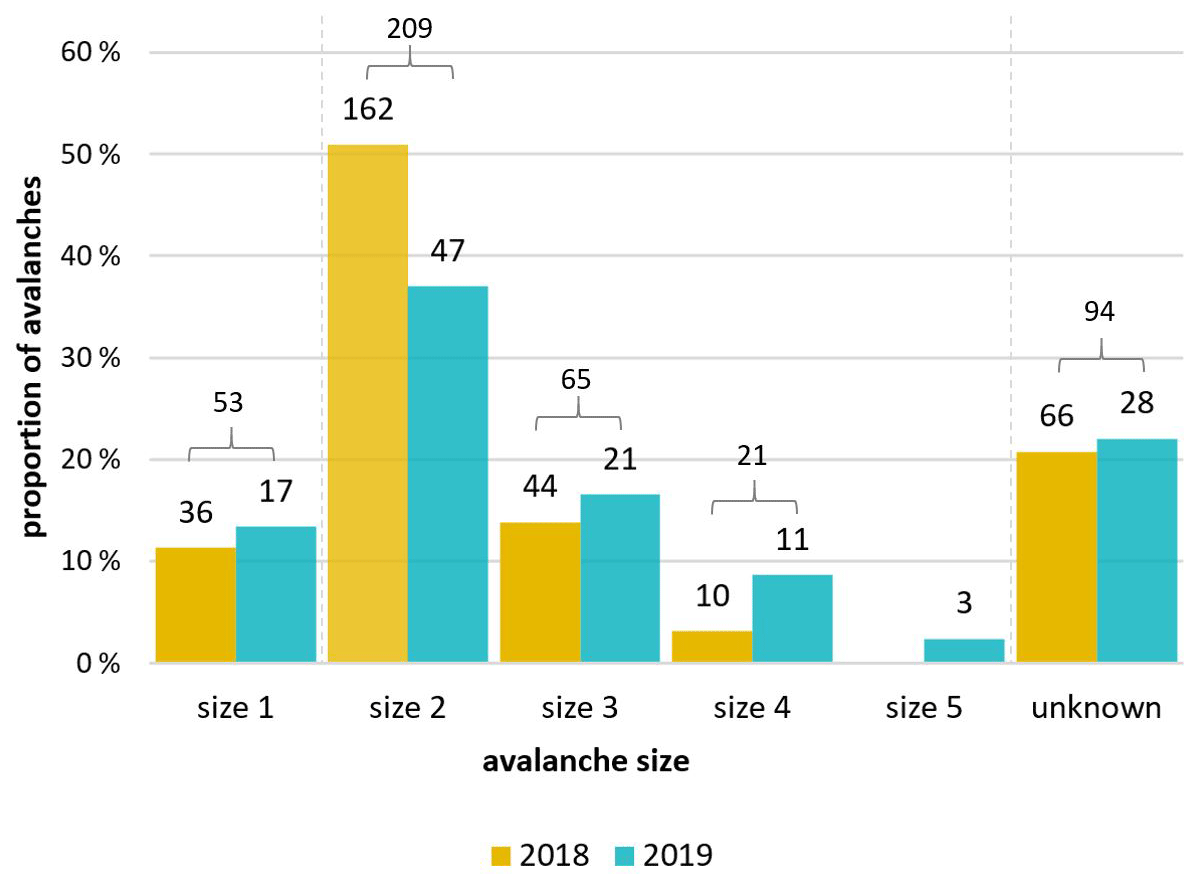
Figure 7Number and proportion of avalanches per size for 2018 (left bar) and 2019 (right bar). The proportions are indicated relative to the number of avalanches per year (2018 – 318, 2019 – 127). For the avalanches of unknown size, the raters could not reliably determine the size (Sect. 3.2).
4.1 Avalanche detection rate per avalanche size (satellite methods)
Only the SPOT mapping approach detected all size-4 and size-5 avalanches (Fig. 8a). The capabilities of the S1 mapping to detect the largest avalanches followed closely with 90 % of size-4 avalanches and all size-5 avalanches detected in 2019 (Fig. 8b). By contrast, the S2 mapping only identified 29 % of size-4 avalanches and none of the size-5 avalanches in 2019 (Fig. 8c). As Fig. 8a–d illustrate all satellite methods show declining ability to map avalanches with decreasing size. This decline is more pronounced for the S1 than for the SPOT mapping. The S2 mapping identified very few avalanches altogether, especially for 2019.
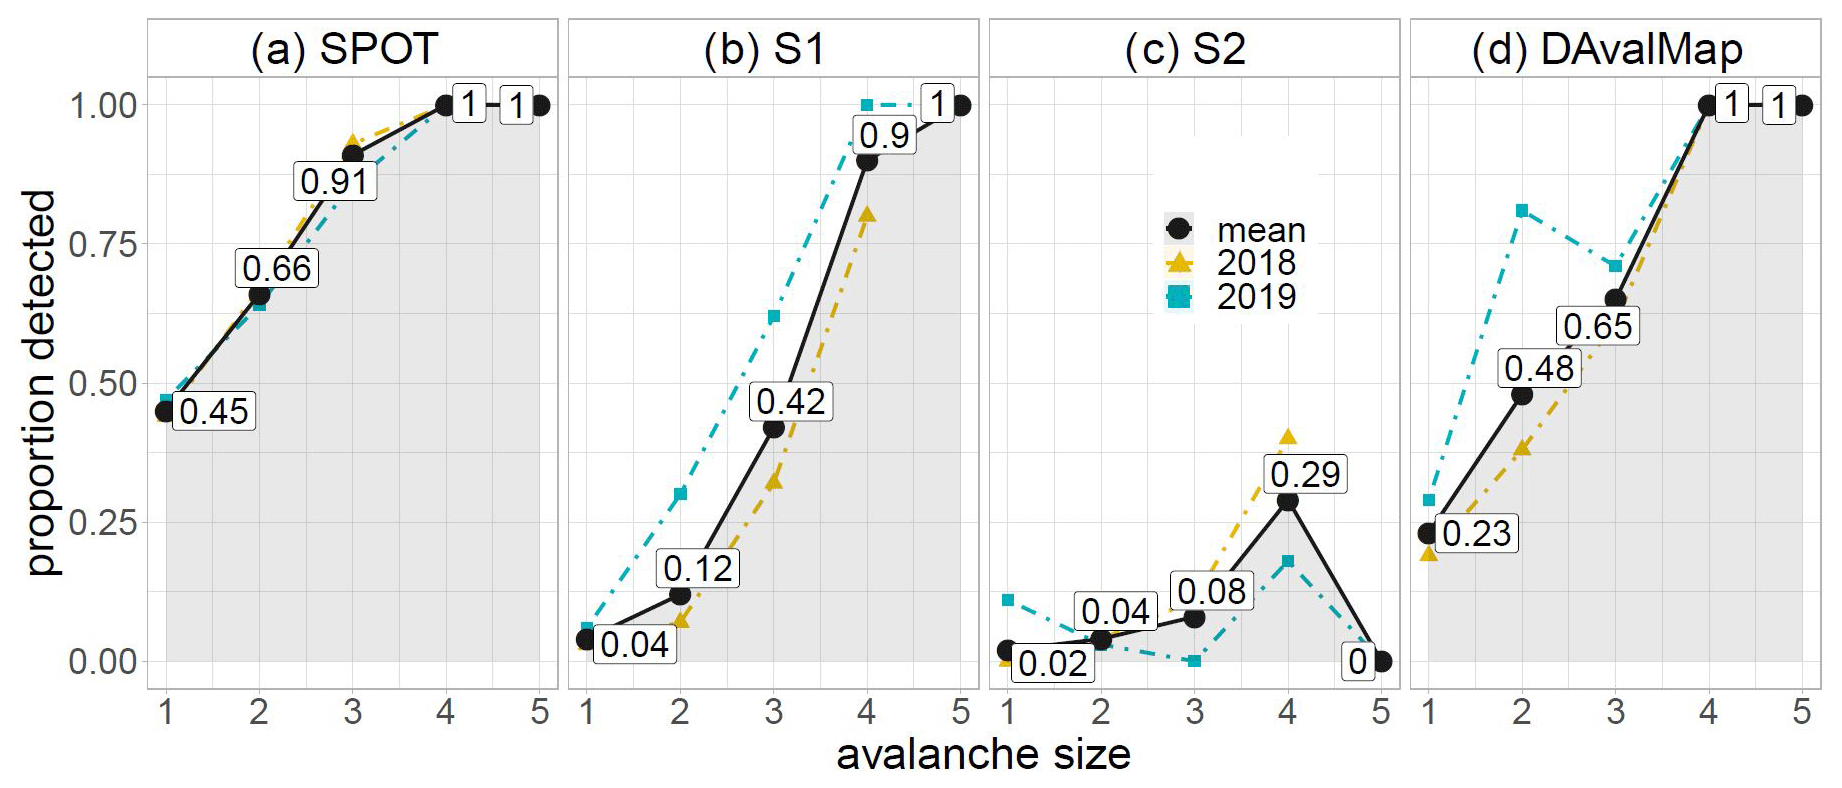
Figure 8(a–d) POD by size for each of the avalanche mapping methods tested. The black dots and line represent the mean proportion of avalanches per size identified by the different mapping methods; additionally the proportions are shaded grey. In addition, the values for 2018 (yellow triangles) and 2019 (turquoise squares) are shown for each mapping method. For the number of avalanches in each size class and subset, refer to Fig. 7.
4.2 Detection statistics of the satellite mapping methods (POD and PPV, size ≥ 2)
Size-1 (small) avalanches are unlikely to cause damage or bury a person. Furthermore, they were probably also missed more frequently in the ground-truth data. Therefore, in the following, we exclude size-1 avalanches and avalanches of unknown size and limit the analysis to the 298 avalanches confirmed by ground truth and classified as size 2 to size 5.
Avalanches of size 2 to 5 were confirmed at 298 of the remaining 355 validation points (84 %), indicating that in 57 locations at least one of the methods falsely detected an avalanche. Considerable variations in the performance of the three satellite mapping approaches are noted:
-
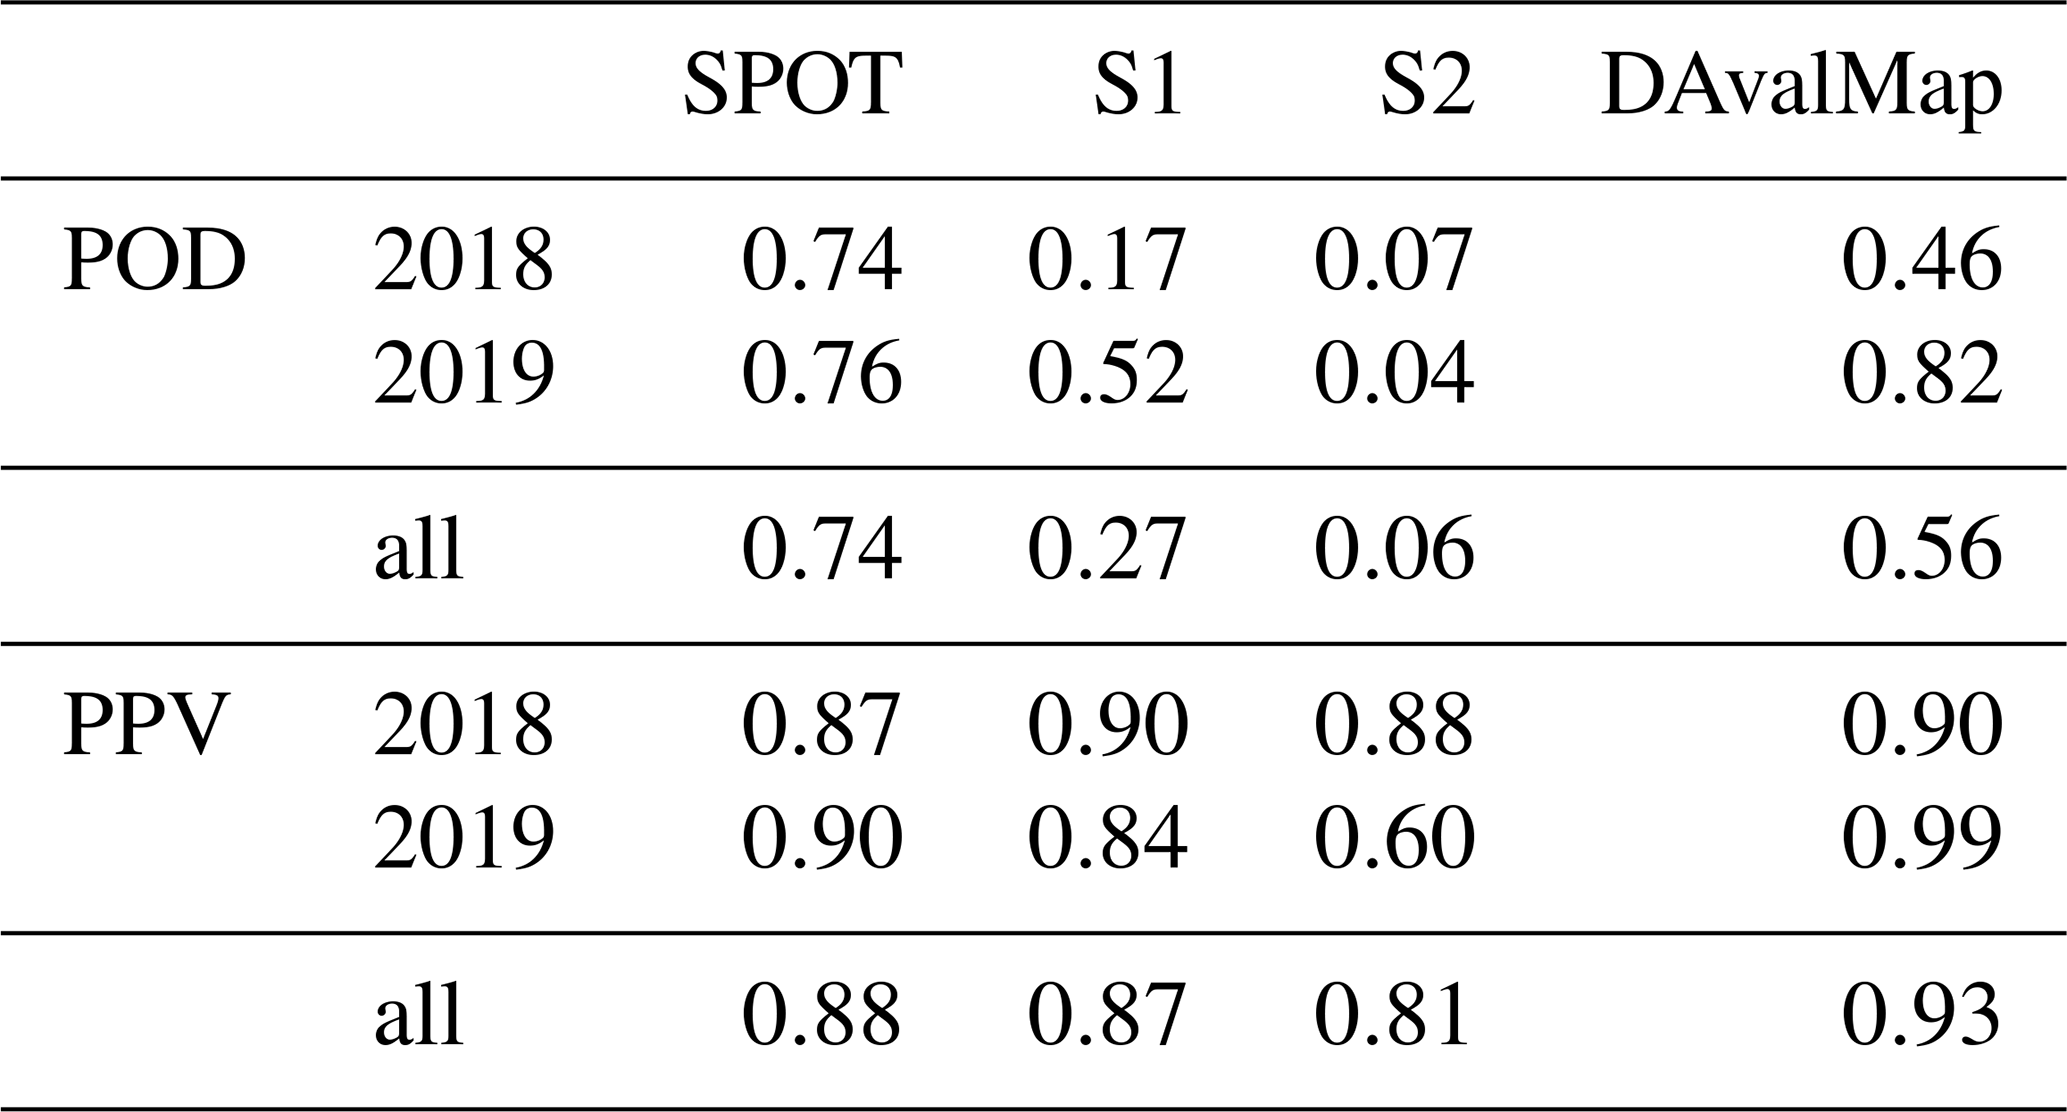
The probability of detecting an avalanche (POD), given its presence in the ground truth, varied greatly between methods (Table 4). Avalanches were most reliably detected by the SPOT mapping approach with 221 out of 298 detected avalanches (POD = 0.74), while the S1 mapping missed almost three-quarters of the size-2 to size-5 avalanches (POD = 0.27). Performance was extremely poor for S2 (POD = 0.06), highlighting that visual avalanche detection is nearly impossible in S2 data.
-
The positive predictive value (PPV), the proportion of true positive avalanches to all avalanches mapped by a specific method, was greater than 0.8 for all methods (Table 4). Again, performance was best for SPOT (PPV = 0.88) and lowest for S2 with a PPV of 0.81, indicating that between one in five (S2) to one in nine (SPOT) mapped avalanches were false alarms.
-
Comparing the performance between the two validation periods showed that the SPOT mapping is the most reliable one of the satellite-based methods with both performance metrics being similar in 2018 and 2019. The S1 mapping, in contrast, shows bigger differences between the two validation periods, with the POD being clearly lower in 2018 (POD = 0.17, mixed-snow conditions) compared to 2019 (POD = 0.52, dry-snow conditions), at least partly due to the larger occurrence of size-2 and size-3 avalanches in 2018 (Figs. 7 and 8).
Table 4POD and PPV of the different methods for the mapping from 2018, 2019 and together.
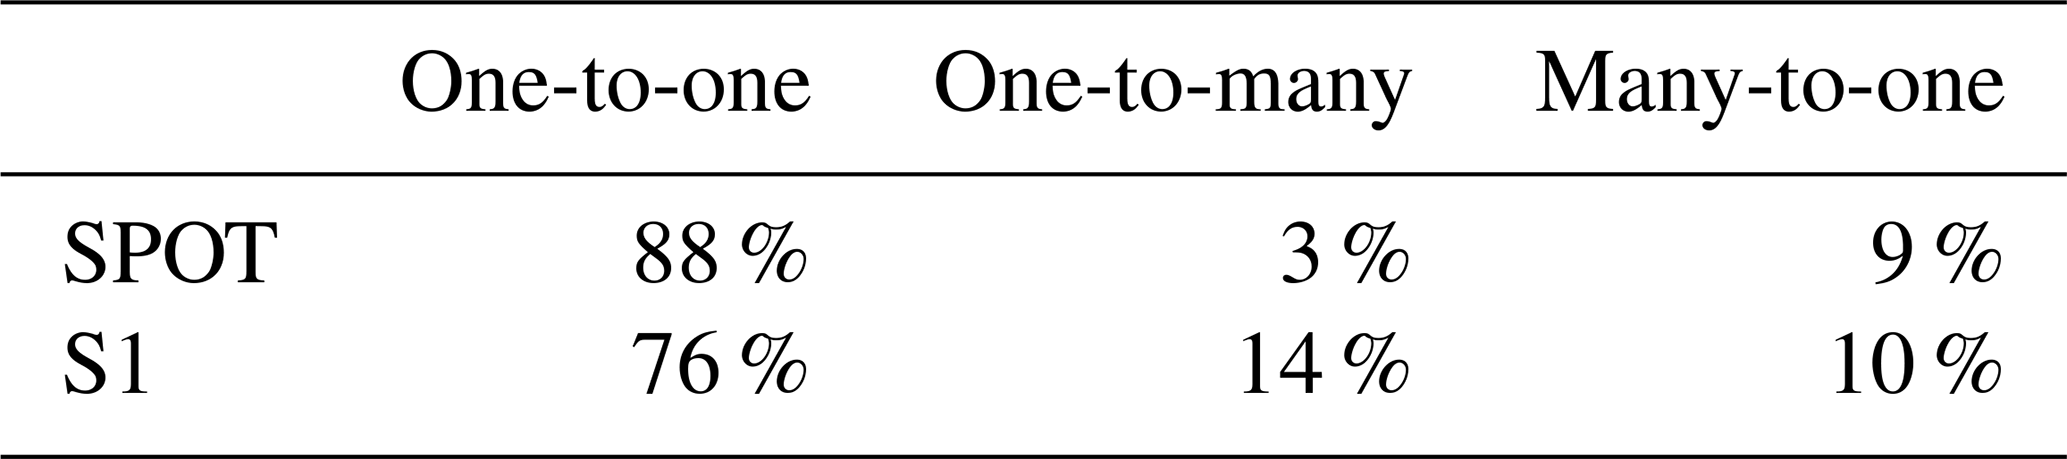
As illustrated in Fig. 6 (Sect. 3.4), mapped avalanche outlines did not always correspond to one validation point from ground truth; hence one-to-many and many-to-one joins were allowed (Fig. 6). Considering the SPOT and S1 methods only, the proportion of one-to-one joins was lower for S1 (76 %) compared to SPOT (88 %, Table 5). One-to-many joins, i.e., multiple detected avalanche patches corresponding to one avalanche in the ground truth, were comparably frequent for S1 (14 %) and rare for SPOT (3 %).
Table 5Percentage of validation points where the specified joins were applied for the SPOT and S1 mapping. For each method only the avalanches mapped and validated (true positives) were considered.
However, allowing one-to-many and many-to-one joins impacts results in two ways: firstly, in terms of the correspondence between the number of features detected and the number of avalanches they represent, and secondly it influences the calculated performance metrics (POD and PPV). For instance, a method for which a high number of one-to-many joins were made (here S1) overestimates the total number of avalanches while it increases both the POD and the PPV (Appendix E). In contrast, a method characterized by a high number of many-to-one joins tends to underestimate the number of avalanches assuming a one-to-one translation between detected features and avalanches. Furthermore, many-to-one joins will decrease both the POD and the PPV. As overall the effects of one-to-many joins are more relevant for S1 and the effects of many-to-one joins are more relevant for SPOT (see Appendix E), the results will diverge if performance is evaluated neglecting joins based on ground truth. This is caused by an artificially increased POD and PPV for S1 and a decreased POD and PPV for SPOT (see also Appendix E).
4.2.1 Effect of cast shadow on mapping from optical SPOT data
The detection rate using SPOT images depends strongly on whether the avalanche is located on a well-illuminated slope or in the cast shadow of surrounding mountains. The 221 avalanches correctly detected with SPOT mapping can be split into the following three categories:
-
in fully illuminated slopes, 127 of 147 avalanches were detected (POD = 0.86).
-
in partly illuminated slopes, 88 of 112 avalanches were detected (POD = 0.79).
-
in shaded slopes, 6 of 33 avalanches were detected (POD = 0.15).
This indicates a low detection rate for avalanches located fully in the cast shadow.
Calculations relying on a DEM, sun azimuth and sun altitude have shown that 35 % (39 %) of the investigated perimeter was shaded at the time of SPOT image acquisition on 24 January 2018 (16 January 2019). Examining the evolution of illuminated and shaded areas from 21 October to 21 April (Fig. 9), the shaded areas peak with 43 % of the perimeter on 21 December. Examining the results in Table 4, mapping results for 2019 were slightly better than 2018 even though 4 % more of the validation area was shaded. In the light of these insights, the expected performance values for SPOT might be slightly worse than presented in Table 4 from the middle of December until the middle of January but are significantly better before mid-December and after mid-January. The given evolution of shaded and illuminated areas depends on sun azimuth and sun elevation for which our results are comparable to other parts of the Alps, of course being locally modified by terrain. At higher latitudes the amount of shaded terrain will be considerably larger than in our case from which we expect that the POD is decreased to an extent possibly as low as on our shaded slopes.

Figure 9Evolution of the share of illuminated and shaded areas from 21 October to 21 April (exemplarily shown for the winter 2018/19 for the perimeter 2019). The share was calculated using the function “hillshade” (with cast shadows) in ArcGIS for every 6th and 21st day of the months relying on a DEM with a 2 m resolution, sun azimuth and sun altitude (for SPOT acquisition time at 10:00 UTC for Davos from http://sonnenverlauf.de, last access: 18 February 2021). The values between the 6th and 21st of each month were interpolated.
4.2.2 Partial avalanche detection in the S1 mapping
Avalanche polygons mapped in S1 data often show, in comparison to SPOT data (Fig. 4c vs. 4a), multiple patches. These patches correspond to a single avalanche because the joining parts between the visible patches show too little contrast in S1 imagery. The existence of multiple patches causes a discrepancy between the number of S1 avalanche polygons and the number of avalanches from ground truth and leads to the considerable number of 14 % of one-to-many joins (Table 5), whereas this number is relatively low (3 %) for SPOT. However, in Fig. 10 we observed that the detectability of different avalanche patches depends on their relative location, i.e., on which part of the avalanche the patches belong to. According to the analysis described in Sect. 3.6 we found that the total POD of 0.27 (Table 4) is reduced to a POD of 0.22 when only the deposit area is considered, as done before by several authors (Abermann et al., 2019; Eckerstorfer et al., 2017; Lato et al., 2012). On the one hand, this corresponds to the major part (75 %) of avalanches detected by radar (Fig. 10). On the other hand, however, 52 % of the radar mapped avalanches also mapped parts of the avalanche track and 35 % mapped even the release area. This, in turn, confirms the supposed ability to detect primarily the deposit area but highlights the importance to also map the release area and the avalanche path to obtain a better POD.
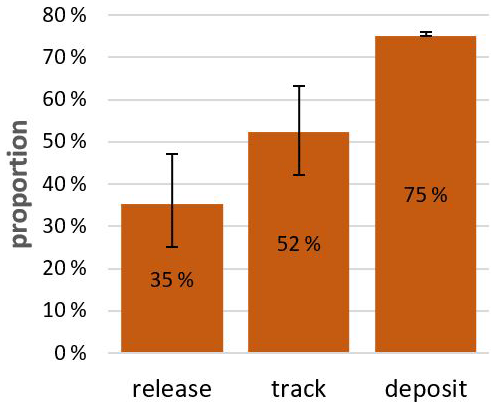
Figure 10Percentage of radar-detected avalanches where a feature was detected in the deposit, track or release area of avalanches confirmed by ground-truth photographs. The error bars indicate the respective proportions for the two validation periods.
4.3 Validation with less complete avalanche data sets (i.e., DAvalMap)
In the following, we analyze the influence of relying on less complete data sets, like the DAvalMap, SPOT or S1, for validation on performance metrics of other satellite mapping methods. In particular the DAvalMap seems to be a promising candidate that could be used as validation data sets in the future, considering the high PPV of 0.93, indicating a high reliability that mapped features in fact correspond to avalanches (Table 4). However, the POD was considerably lower with only about half of the size-2 to size-5 avalanches being detected (POD = 0.56). Similarly to the satellite mapping methods, the detection rate decreased strongly with decreasing avalanche size (Fig. 8d). Furthermore, considerable variation in the POD between the 2 years was noted (2018 – 0.46, 2019 – 0.82). Performance metrics are generally more satisfactory for 2019, indicating a dependence on the person mapping.
Recalculating the POD and PPV relying on the DAvalMap as ground truth for SPOT inevitably affected the PPV strongly; the PPV decreased from 0.88 to 0.59. The comparably large number of SPOT true-positive avalanches, considered false alarms according to DAvalMap, explains this. In contrast, the influence on the POD is comparably small (0.74 to 0.78), as SPOT also detected many of the avalanches detected in the DAvalMap.
If we use the SPOT mapping as ground truth for the S1 mapping, the POD decreases slightly from 0.27 to 0.24 with the PPV dropping from 0.87 to 0.73. Doing it the other way around, using the S1 mapping as ground truth for the SPOT mapping, the POD remains almost the same (0.74 to 0.73). In contrast, the PPV decreases from 0.88 to 0.24, caused by the large number of apparent false-positive avalanches found in the SPOT but missed by the S1 mapping.
5.1 Comparison of mapping approaches
We explored three mapping methods: optical high-resolution SPOT; optical lower-resolution Sentinel-2 (S2) and radar-based Sentinel-1 (S1). Of these methods, the 1.5 m resolution optical SPOT mapping achieved the best results for the POD (0.74) and PPV (0.88; Table 4). It can detect avalanches of all sizes (Fig. 8a). The ∼ 10 m resolution S1 mapping, in contrast, performs well for the identification of larger avalanches (size 4 or 5), but the overall POD is significantly lower (0.27) than for the SPOT mapping mainly because the majority of size-2 and size-3 avalanches, which represent the largest number of all avalanches, were missed. The PPV of S1 (0.87) is in a similar range to that of SPOT.
Another quality aspect, which highlights SPOT's mapping potential, is the high percentage of one-to-one joins (88 %), indicating that the number of features detected by SPOT shows a closer correspondence with the actual number of avalanches compared to S1 (one-to-one joins – 76 %). Compared to a joining of avalanches and validation points based on ground truth, neglecting one-to-many and many-to-one joins affects performance values leading to an over- and underestimation of the POD and PPV, respectively. This effect has to be considered if different mapping methods are compared in the future without using ground truth.
The results of the S2 mapping are poor with only 1 in 17 avalanches detected (POD of 0.06). We can therefore not recommend S2 for avalanche detection. Summarizing, high values of the POD and PPV, in combination with a high proportion of one-to-one joins, make a mapping with SPOT recommendable. However, in the two situations explored, conditions were optimal for SPOT: the day immediately after the period of interest was cloud-free and satellite images could be obtained. This dependence of optical sensors on cloud-free conditions is the biggest disadvantage of the SPOT method. Additionally, SPOT data are costly and only available upon request. Our investigations (Sect. 4.2.1) have shown that the POD is significantly lower in shaded areas for avalanche mapping in SPOT imagery. As it is more probable for larger avalanches that part of the avalanche will be illuminated due to their longer runout distance, the probability of detection for smaller avalanches will be more affected by this. The proportion of terrain shaded depends on the time of the year, i.e., sun azimuth and sun altitude at acquisition time and the terrain investigated. In our study area the fraction of shade varies between 1 % and 43 % during the winter season. However, we could not find any significant detection performance differences in the SPOT imagery from 24 January 2018 and 19 January 2019 where the fraction of shade differed by only 4 %.
Although the Sentinel-1 mapping achieved a considerably lower POD than SPOT, S1 permits observations independent of weather and light conditions. Furthermore, S1 data are free of charge and are operationally available (Table 6). Among others, Eckerstorfer et al. (2017) have focused on the mapping of avalanche deposit areas from Sentinel-1 imagery. As we have shown in Sect. 4.2, the deposit area could be identified for about 75 % of all avalanches by the S1 mapping. The remaining 25 % of S1 polygons captured release area and/or track only. Our investigation indicates that, even though deposits are more likely to be detected, the S1 mapping in many cases identifies other avalanche parts as well. Unfortunately, mapping results from S1 showed multiple patches corresponding to a single avalanche which need to be joined to avoid an overestimation of the avalanche number and an underestimation of the avalanche size. In order to solve this problem, an algorithm, joining S1 polygons belonging to the same avalanche path, would be desirable. We believe the automated snow avalanche release area delineation from Bühler at al. (2018) may be adapted for such a purpose.
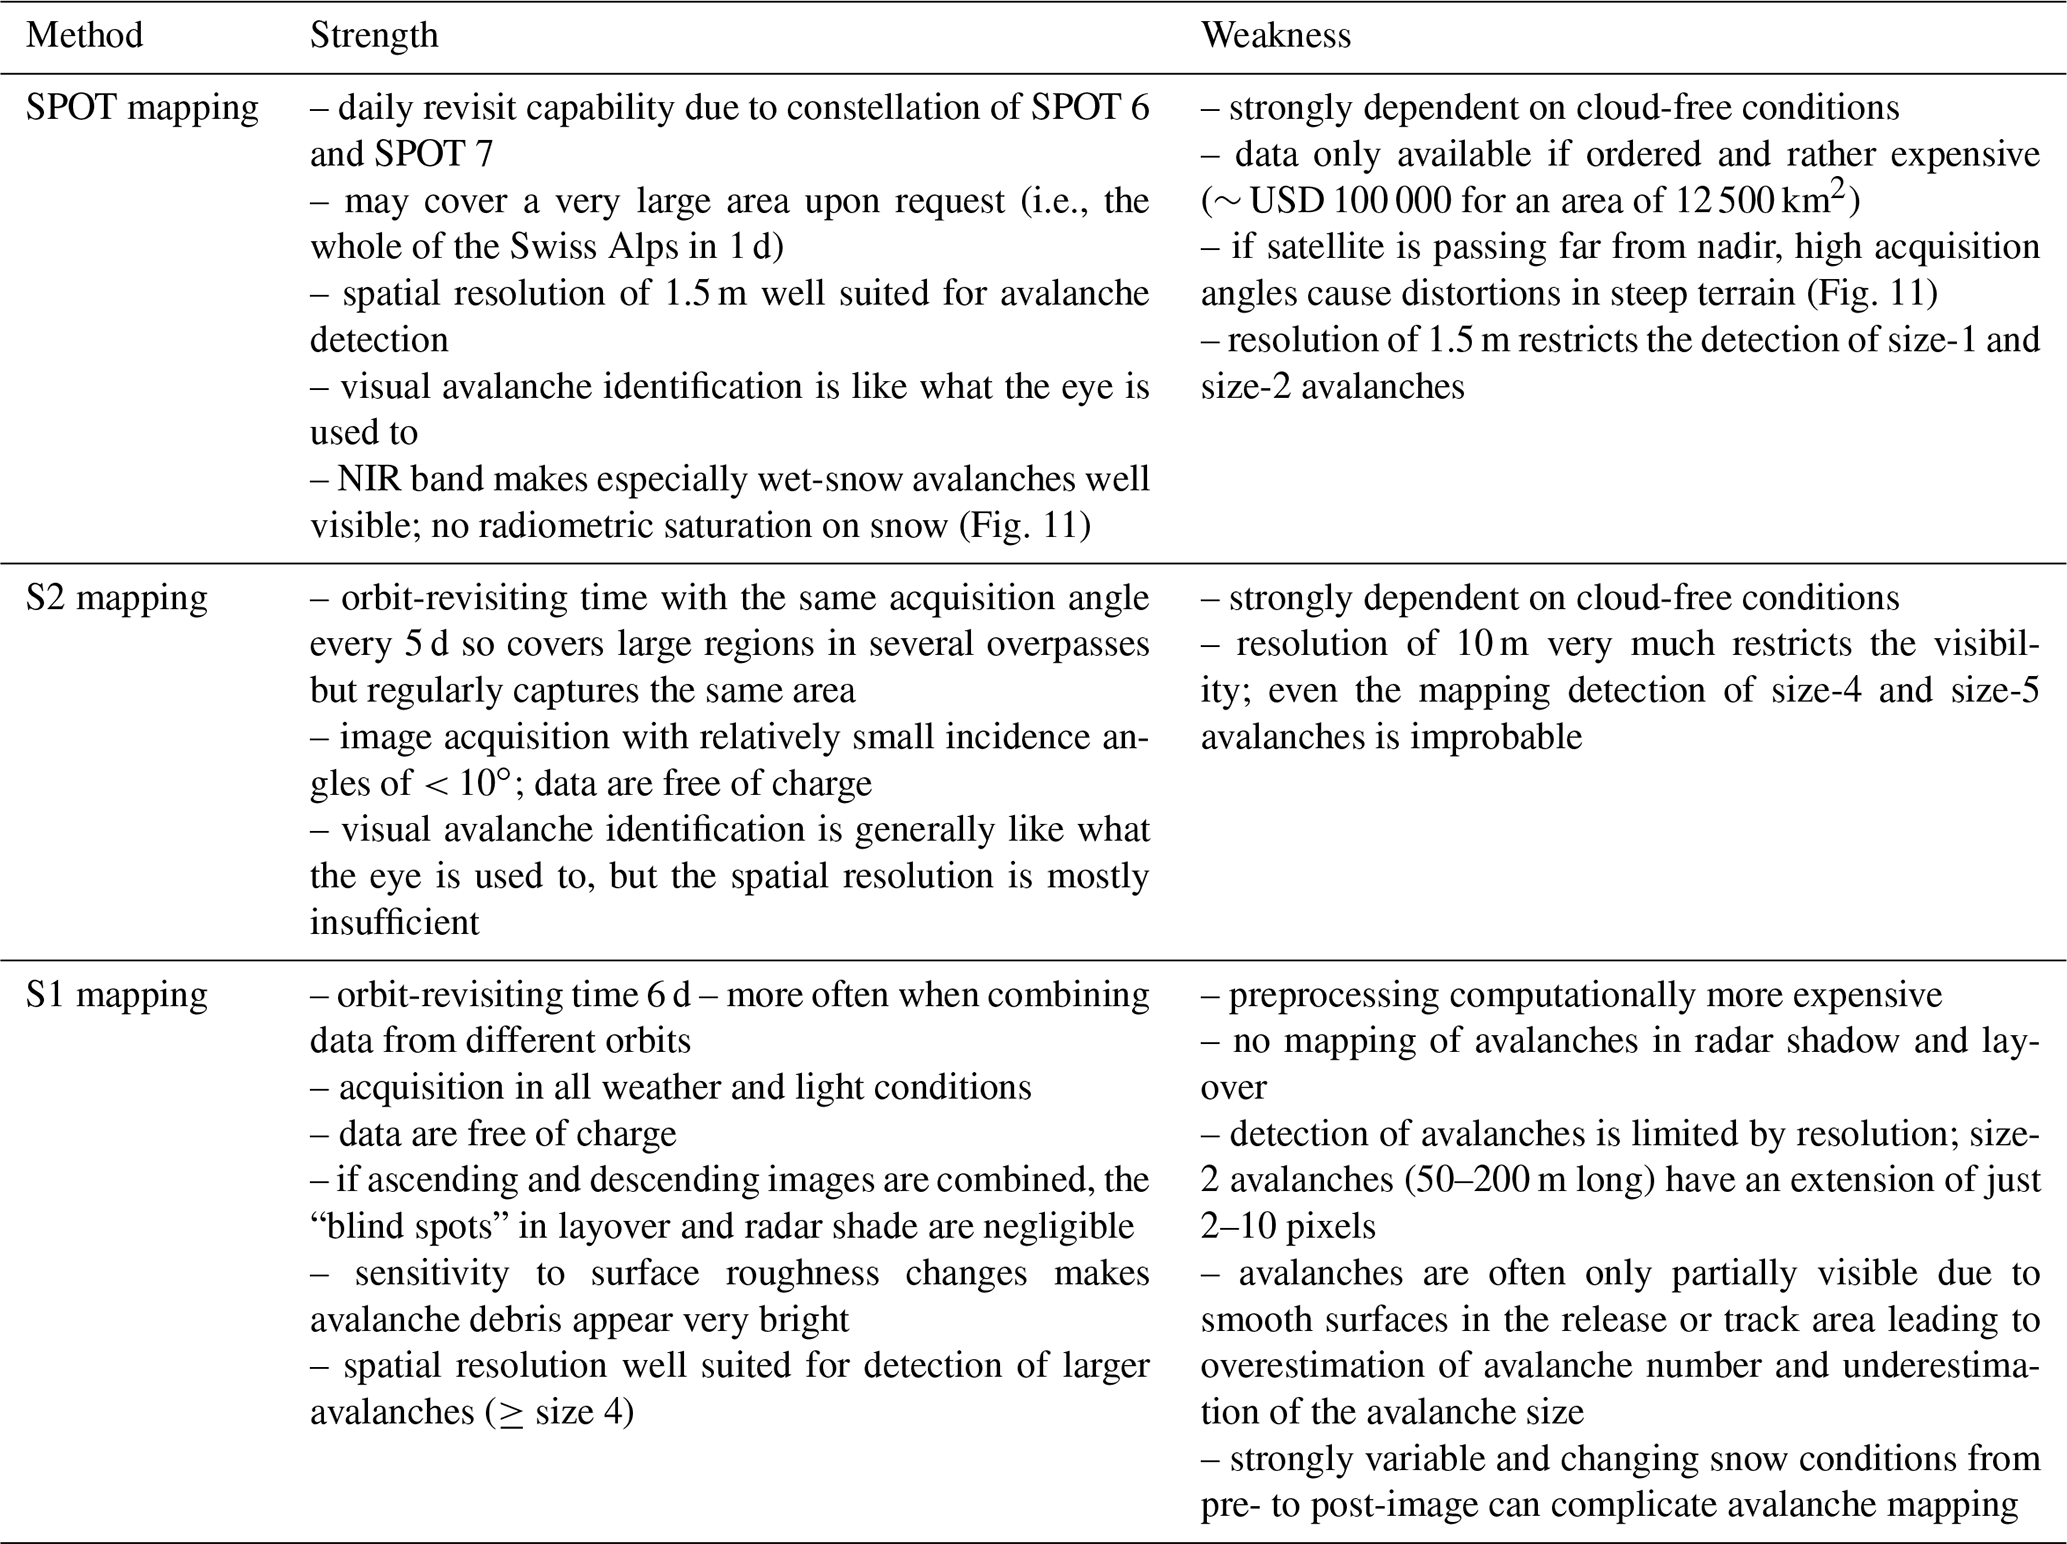
With a POD of 0.06, Sentinel-2 imagery seems unsuitable for the mapping of avalanches. Abermann et al. (2019) found 23 % of avalanches on both Sentinel-1 and Sentinel-2 images, whereas we, in contrast, found only 9 % of avalanches from the S1 mapping overlapping with the S2 mapping. This might be due to better visibility of wet-snow avalanches, especially the slush flows, in Abermann et al. (2019). An overview of the strengths and weaknesses of all investigated satellite mapping methods is given in Table 6.
Table 6Summary of the strengths and weaknesses of the methods examined.
Snow conditions differed between the 2 years: in 2018, both dry-snow and wet-snow avalanches released, while in 2019 avalanches were dry (Fig. 11). For the SPOT mapping we found no difference in the POD between dry and wet snow. In contrast, for radar-based mapping, it is commonly reasoned that wet-snow avalanches are easier to detect (e.g., Leinss et al., 2020) which was confirmed in Eckerstorfer et al. (2019) using ground-truth data. Nevertheless, we obtained apparently the opposite result in the S1 mapping (POD and PPV better for 2019 with dry-snow conditions; Table 4). This can be partially explained by the relatively large number of size-2 to size-3 avalanches in 2018, which are more likely to be missed. Nevertheless, Fig. 8b shows that during dry-snow conditions in 2019, a larger fraction of size-2 and size-3 avalanches could be detected, compared to the mixed-snow conditions (dry–wet) in 2018. Pre- and post-event radar backscatter images show much stronger overall changes in the snow conditions from mixed-snow (pre-event) to wet-snow (post-event) conditions in 2018, whereas in 2019 with stable dry-snow conditions, avalanches were the most prominent changes in the backscatter signal. This, in turn, agrees with Eckerstorfer et al. (2019), who also observed a high POD for dry-snow conditions in both (pre- and post-event) images.
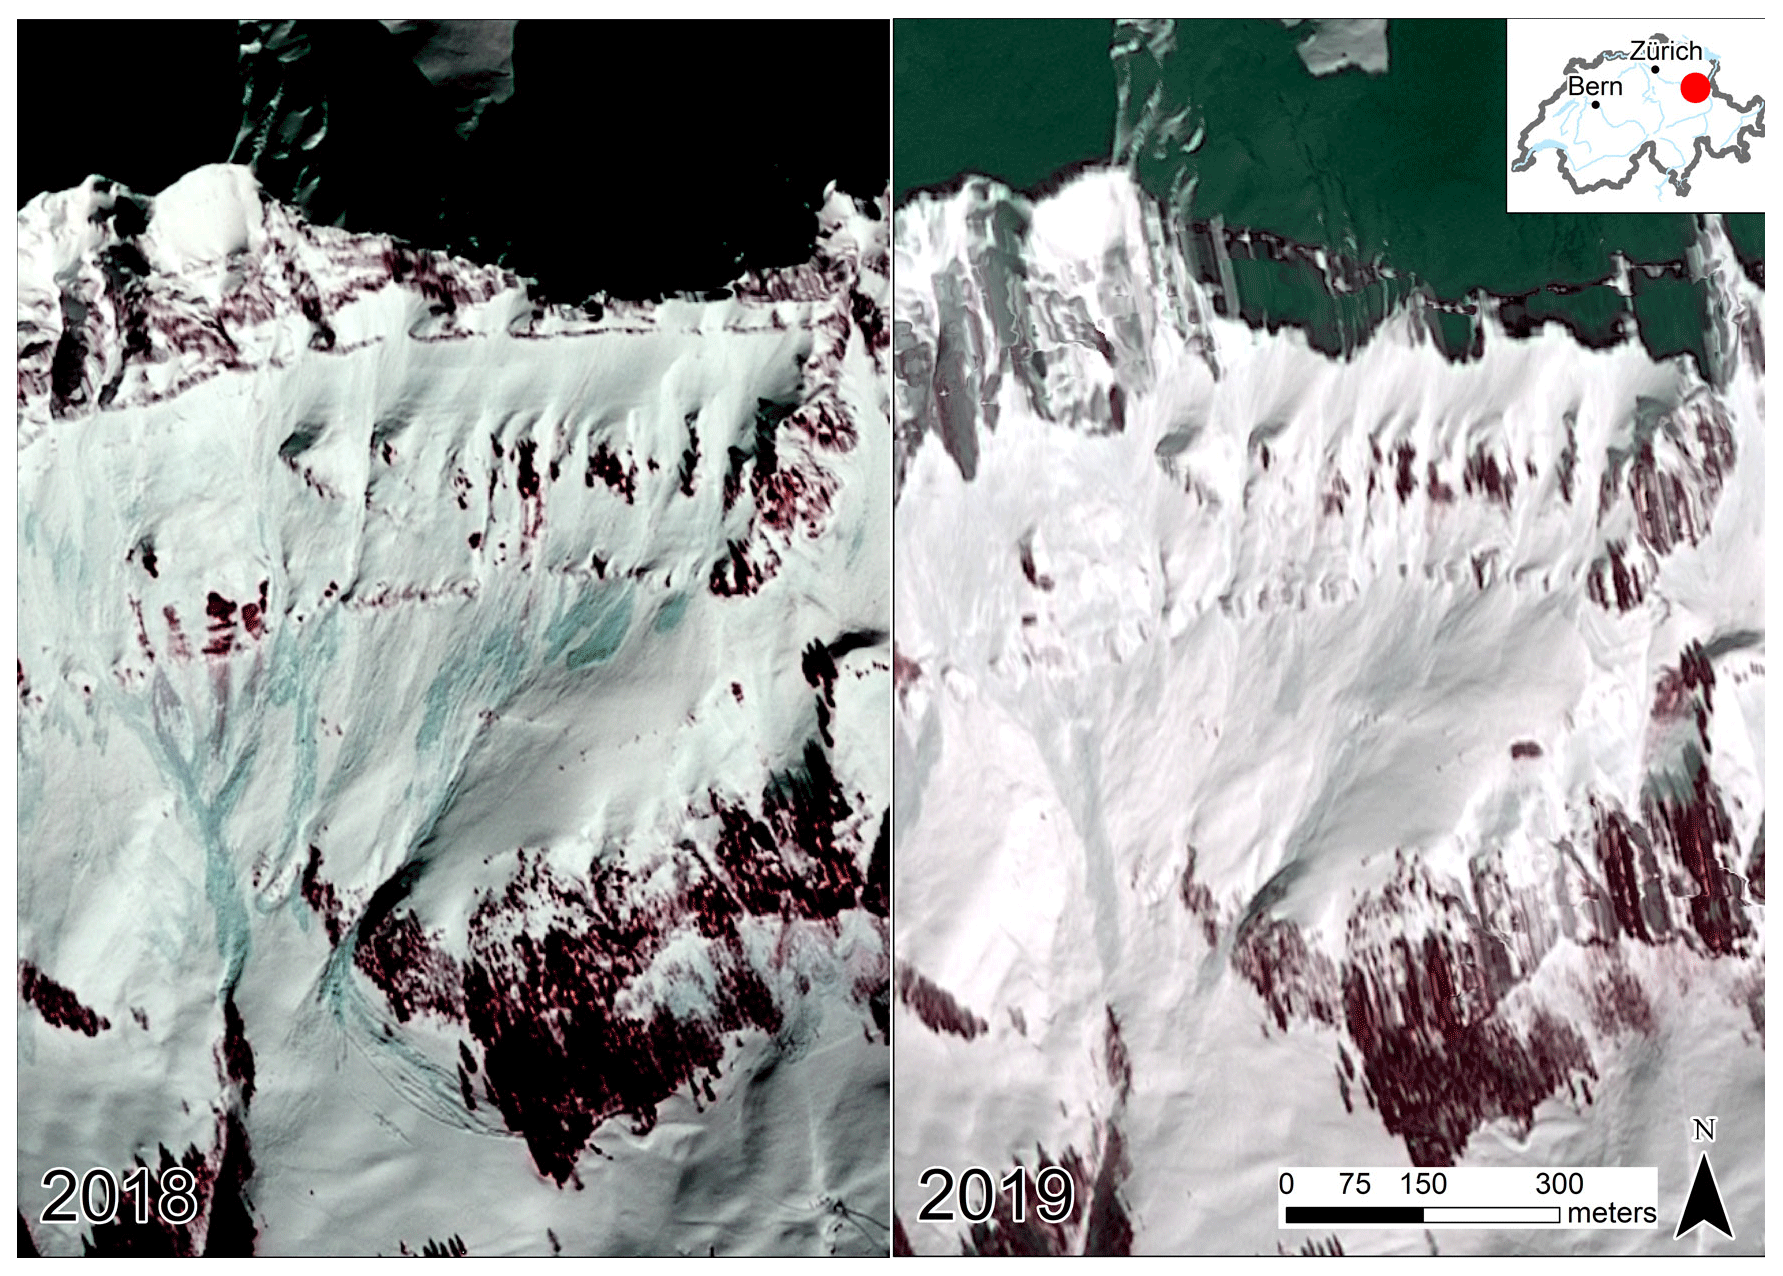
Figure 11In 2018, the temperatures and the snowfall line were high resulting in more wet-snow avalanches and deposits. Those are identifiable by the green shimmer in the NIR and more contrast to the surrounding snow in general (left side), which is not the case for the mostly dry-snow avalanches in 2019 (right side). Additionally, disparity in visibility in steep terrain due to different inclination angles is shown. The inclination angle for the tiles shown here lies at 11.3∘ in 2018 and at 27.6∘ in 2019. These distortions are among the worst we encountered comparing 2018 and 2019 SPOT data (SPOT 6 data © Airbus DS 2018/2019).
5.2 On the influence of the quality and definition of ground truth on validation results
We showed the influence of using less complete avalanche observations as a ground-truth alternative on the performance metrics (Sect. 4.3). Our findings are in line not only with theoretical investigations regarding the influence of errors in the reference class on the POD and PPV (Brenner and Gefeller, 1997) but also with other studies outlining the importance of the definition of the ground truth for performance metrics (e.g., Techel et al., 2020, for snow instability tests).
As a specific example of a ground-truth alternative, we relied on the DAvalMap data. However, the detection rate (POD = 0.56) clearly showed that this data set provides far from a complete mapping. In fact, the POD was lower for the DAvalMap compared to SPOT (POD = 0.74). In addition, differences in the quality of the mappings between the 2 years were large for the DAvalMap. The PPV has the highest value for the DAvalMap; in 2019 with 0.99 almost all avalanches mapped could be confirmed. These findings indicate that avalanches, which are stored in the DAvalMap database, may be used for validation even though the mapping is partially inconsistent as already suspected by Schweizer et al. (2003). However, to answer research questions for which comparably complete avalanche recordings are required, findings must be interpreted considering the uncertainty related to incomplete recordings.
Both SPOT and Sentinel-1 data have been used previously to detect avalanches (e.g., Bühler et al., 2019; Eckerstorfer et al., 2019; Leinss et al., 2020). Each of these studies relied on a different ground truth.
Eckerstorfer et al. (2019) conducted a selective verification of 243 manually detected avalanches from Sentinel-1 imagery achieving a POD of 0.77. This is decisively better than the POD of 0.27 found for avalanches of size 2 and larger in this study (Table 4). If we only consider avalanches of size 3 and larger, the POD increases to 0.56 (while the PPV drops to 0.79) – still considerably lower than the results presented by Eckerstorfer et al. (2019). We suspect that selective verification tends to overestimate the POD, as in these cases, verification data are usually available for well-visible prominent avalanches. Selective verification is also the reason for the higher POD achieved for the SPOT mapping (Sect. 4.3), when relying on DAvalMap as ground truth, a ground truth which had a preference towards the detection of larger avalanches (Fig. 8d).
Leinss et al. (2020) compared radar-detected avalanches (Sentinel-1) with optically detected avalanches from SPOT (Hafner and Bühler, 2019). Of the SPOT avalanches, 68 % were detected by radar in their investigation. Inversely, 44 % of the radar-detected avalanches were detected by SPOT. In our study we linked mapped avalanches to validation points from ground truth. We found 89 % of the validation points representing avalanches of size 2 and larger, detected by S1 mapping, were also found in the SPOT mapping. In contrast, S1 detected only 55 % of the SPOT avalanches. Given the validation with independent ground truth in this study, we believe that our results provide a more objective comparison of the two mapping approaches.
Applying these findings to our study, we would argue that avalanches detected using SPOT images are a rather reliable ground-truth data source for slopes which are illuminated (or partly illuminated) and when sky conditions are clear. In contrast, if slopes are shaded or sky conditions do not permit good visibility, SPOT images will be of little use for validation.
5.3 Strengths and limitations of our study
The study is limited to two avalanche periods. As shown in Fig. 2, the satellite images used were not all taken on the same day and were also not the same with respect to the defined validation periods. For Sentinel-1, four images (ascending and descending, pre- and post-event) were combined to map avalanches from one period. The difference between the ascending and descending image is always 1.5 d, except post-event 2018 (difference – 3.5 d). Because the main avalanche activity (with level 4 and 5; see Fig. 2) did not happen within these days in between, it is unlikely that avalanches occurred within these days. Instead, most of the detected avalanches must have occurred between the pre- and post-acquisitions. Furthermore, as the weight used for LRW is linear to the illuminated area (which is proportional to the (linear) backscatter intensity) the image composition follows an almost binary weighting, especially for non-horizontal terrain, rather than an equally weighted average (which only happens for nearly horizontal terrain). This makes LRW a good method for image composition, and the chance to miss avalanches by averaging is reduced, especially when specific events of high avalanche activity (as in our case) are enclosed by specifically selected acquisition dates.
SPOT images were acquired very close to the period of interest, and therefore the effect of this time gap is negligible. In 2019 Sentinel-2 imagery was acquired very close to the period of interest as well; in contrast the acquisition in 2018 happened 3 d after the investigated period. As the weather conditions were favorable without precipitation and as ground-truth photographs were available, we believe this does not distort the results.
For the two avalanche periods, we compiled a ground-truth data set. However, despite our efforts to collect a spatially complete data set, we could not validate 48 detected features (2018 – 38, 2019 – 10) because of gaps in the ground truth and 133 features (2018 – 93, 2019 – 40) because of low-quality ground-truth images. Furthermore, we expect that we missed some avalanches in the ground-truth images, particularly if these were of smaller size (Fig. 7). Despite these limitations, we consider the ground-truth data to be complete enough to allow for a sound validation of detected avalanche features. Furthermore, the independently compiled ground-truth data allowed for an objective comparison of the three satellite-based avalanche detection methods.
We explored just a small selection of the large number of potential satellite data sources, focusing on sensors and satellites previously used to detect and map avalanches (i.e., Eckerstorfer et al., 2019; Bühler et al., 2019; Leinss et al., 2020). Still, we consider the analyzed sensors and resolutions a representative selection of currently available satellite data sources. We relied on a human assessor to detect features representing avalanches visually. This approach depends heavily on the experience and skills of the human performing the task (as has been shown for landslide mapping, e.g., Hölbling et al., 2015; Galli et al., 2008) and adds a certain degree of subjectivity to the analysis. Furthermore, manual detection of features is resource- and time-consuming.
To reduce the impact of limited visibility due to adverse weather and due to variations in operator performance, we suggest that future ground-truth data sets should be complemented with avalanche occurrence data relying on automatic avalanche detection approaches, such as seismic or ground-based radar detection of avalanches (e.g., van Herwijnen and Schweizer, 2011; Mayer et al., 2020). Furthermore, recent advances in (semi-)automatically detecting avalanches are promising alternatives for complementing avalanche occurrence data (Eckerstorfer et al., 2019; Leinss et al., 2020; Korzeniowska et al., 2017).
For the first time, we presented a spatially continuous, extensive validation of methods detecting avalanches from selected satellite imagery. We analyzed two avalanche periods for an area covering approximately 180 km2 around Davos, Switzerland. We examined the potential, the advantages and the disadvantages of the evaluated methods to provide decision guidance for those wanting to comprehensively map avalanches in the future. We statistically confirmed several observations from Bühler et al. (2019) and Leinss et al. (2020): the SPOT mapping misses size-1 (small) and size-2 (medium) avalanches in several cases. S1 mapping misses most size-1 and size-2 avalanches and over half of size-3 avalanches. We also confirmed that avalanches located completely in the cast shadow are much more likely to be missed, even on high-resolution optical imagery (SPOT). For S1 we showed that avalanche deposits are the avalanche part most likely detected, but the starting zone and the avalanche track are mappable in more cases than previously suspected.
The SPOT mapping holds great potential for comprehensive mapping of avalanches, at least for selected events for which costly and analysis-intensive SPOT data provide very valuable mapping results. The S1 mapping is quite reliable for larger avalanches (size 3 to 5) and allows for frequent and even operational mapping for which automatic methods are currently being developed (e.g., Eckerstorfer et al., 2019). Still, it must be kept in mind that often the true size is underestimated by SAR sensors and that avalanches can appear partitioned into small patches which need to be joined by an advanced detection algorithm to estimate the true size. We found that Sentinel-2 data have a too low resolution to reliably map avalanches. Additionally, we explored the influence of ground truth on the validation results and ascertained that incomplete, but otherwise reliable, ground-truth data sets tend to overestimate the POD and underestimate the PPV.
We found that already-existing satellite data provide great potential to approximate the avalanche activity and to obtain an overview of the spatial distribution of avalanches. However, for studies which require a precise and complete mapping of avalanche outlines, further investigations are necessary. As ground truth for such an examination, unmanned aerial systems (UASs) have been found to be a promising solution (Eckerstorfer et al., 2016; Bühler et al., 2017). To bypass time-consuming manual mapping, automation should be aimed at by developing reliable automated mapping algorithms or refining those that have already been created (Bühler et al., 2009; Lato et al., 2012; Korzeniowska et al., 2017). Prior to operational use of any approach, a comprehensive, and not only a selective, validation should be strived for. For methods that have been comprehensively validated, the DAvalMap database or a SPOT mapping might be used for selective follow-up validations.
In the study area, the incidence angle for both orbits at about θ=42∘ (±0.5∘) results in a theoretical ground range resolution of 4.6 m/sin (42+η) × 22 m = 6.9 m × 22 m for horizontal terrain (η=0∘). For slopes facing away from the sensor (η>0) at a grazing incidence angle (θ+η close to 90∘), the resolution could theoretically be improved up to the full slant range resolution of 4.6 × 22 m, but the actual resolution is slightly reduced due to image interpolation. Larger slope angles result in radar shadow and are not observable. On the opposite valley side, where slopes are facing towards the sensor (η<0), the resolution is significantly reduced. Slopes steeper than the incidence angle (∘) collapse into radar layover where non-adjacent areas are projected into the same radar image pixels such that all resolution is lost. As the simulated backscatter intensity β0,sim shows a large dynamic range which is proportional to the area illuminated by the radar, LRW always “selects” the best resolution or averages the backscatter signal if the resolution of both orbits is the same.
Table C1Properties and required attributes for each validation point.
The POD is the probability of the identification of a characteristic feature in the presence of such a feature (Brenner and Gefeller, 1997). In our case, the POD is the probability of an avalanche being mapped by a method given its existence.
The PPV is the probability of the existence of a feature given its detection (Brenner and Gefeller 1997). A high PPV is desirable as it implies that false-positive outcomes are minimized (Trevethan, 2017). In our case, the PPV is the probability of the existence of an avalanche according to the ground truth given a mapping. If the PPV is high, avalanches mapped are likely to be “real” avalanches and falsely detected avalanches are kept to a minimum.
In Table 5 we showed the share of validation points for SPOT and S1 which were joined as illustrated in Fig. 6. In order to show the effects described in Sect. 4.2, the POD and PPV were calculated neglecting joins. For the computation, multiple mapped avalanche patches which were originally joined to one validation point were treated as separate avalanches (one-to-many) and one avalanche patch was treated as just one avalanche even though it was joined to two validation points because of ground truth (many-to-one). In order to make the effects of either join more visible, they were calculated both separately and together. The results are shown in Table E1.
It can be seen that treating several avalanche patches as several avalanches (using no one-to-many joins) overestimates the number of avalanches, leading to a higher POD and PPV. Compared to the numbers in Table 4, the increase in the POD for S1 is more pronounced as the percentage of one-to-many joins is higher (Table 5). If we are neglecting many-to-one joins and treating one avalanche polygon as one avalanche (even though ground truth showed two or more corresponding avalanches) the POD decreases as well as the PPV. If both one-to-many and many-to-one joins are neglected, for SPOT the POD and PPV are slightly lower than the results in Table 4, whereas the opposite is true for S1. This is due to one-to-many joins being more relevant for S1 and many-to-one joins being more relevant for SPOT.
Table E1POD and PPV for the SPOT and S1 mapping neglecting one-to-many, many-to-one or all joins (for the definition of those joins refer to Fig. 6).

The mapped avalanches, validation points, ground-truth coverage information and validation area used in this study as well as a detailed description of the attributes are available on EnviDat (https://doi.org/10.16904/envidat.202; Hafner et al., 2021).
EDH performed the SPOT mappings, collected the ground truth, analyzed the data sets, assigned ground-truth size, coordinated the study and wrote the paper draft. FT mapped from Sentinel-2 for 2018, assigned ground-truth size, delivered the necessary input from the SLF avalanche warning team, critically reviewed the results and heavily contributed to the paper draft. SL performed the Sentinel-1 data processing and mappings, wrote the description thereof, and reviewed and complemented the manuscript with YB and FT. YB, FT and EDH initiated the study together.
The authors declare that they have no conflict of interest.
We thank all the ground-truth photographers at the SLF and everyone else who helped to cover the area around Davos as best as possible. We thank the Swiss avalanche warning service for providing the Davos avalanche mapping outlines as well as for valuable feedback and support. We thank Linda Zaugg- Ettlin for conducting the Sentinel-2 mapping for 2019. We thank the BAFU and the canton Grisons for partly financing the SPOT mapping in our validation area. We thank Mathias Zesiger and Francesco Wyss from swisstopo for the processing of SPOT data and for complementing the data's description. We are grateful to ESA for providing Sentinel-1 and Sentinel-2 data.
This paper was edited by Marie Dumont and reviewed by Markus Eckerstorfer and one anonymous referee.
Abermann, J., Eckerstorfer, M., Malnes, E., and Hansen, B. U.: A large wet snow avalanche cycle in West Greenland quantified using remote sensing and in situ observations, Nat. Hazards, 97, 517–534, https://doi.org/10.1007/s11069-019-03655-8, 2019.
Bebi, P., Kulakowski, D., and Rixen, C.: Snow avalanche disturbances in forest ecosystems – State of research and implications for management, Forest Ecol. Manag., 257, 1883–1892, https://doi.org/10.1016/j.foreco.2009.01.050, 2009.
Bourbigot, M., Johnsen, H., Piantanida, R., Hajduch, G., Poullaouec, J., and Hajduch, G.: Sentinel-1 Product Definition, ESA Unclassified – For Official Use, availabe at: https://sentinel.esa.int/documents/247904/1877131/Sentinel-1-Product-Definition (last access: 18 February 2021), 2016.
Brenner, H. and Gefeller, O.: Variation of sensitivity, specificity, likelihood ratios and predictive values with disease prevalence, Stat. Med., 16, 981–991, 1997.
Bründl, M. and Margreth, S.: Integrative Risk Management, in: Snow and Ice-Related Hazards, Risks and Disasters, Elsevier, Amsterdam, 263–301, 2015.
Bründl, M., Hafner, E., Bebi, P., Bühler, Y., Margreth, S., Marty, C., Schaer, M., Stoffel, L., Techel, F., Winkler, K., Zweifel, B., and Schweizer, J.: Ereignisanalyse Lawinensituation im Januar 2018, WSL Berichte, Birmensdorf, 162, 2019.
Buades, A., Coll, B., and Morel, J.-M.: A Non-Local Algorithm for Image Denoising, in: 2005 IEEE Computer Society Conference on Computer Vision and Pattern Recognition (CVPR'05), San Diego, California, USA, 20–26 June 2005, 60–65, 2005.
Bühler, Y., Hüni, A., Christen, M., Meister, R., and Kellenberger, T.: Automated detection and mapping of avalanche deposits using airborne optical remote sensing data, Cold Reg. Sci. Technol., 57, 99–106, https://doi.org/10.1016/j.coldregions.2009.02.007, 2009.
Bühler, Y., Christen, M., Kowalski, J., and Bartelt, P.: Sensitivity of snow avalanche simulations to digital elevation model quality and resolution, Ann. Glaciol., 52, 72–80, https://doi.org/10.3189/172756411797252121, 2011.
Bühler, Y., Adams, M. S., Stoffel, A., and Boesch, R.: Photogrammetric reconstruction of homogenous snow surfaces in alpine terrain applying near-infrared UAS imagery, Int. J. Remote Sens., 38, 3135–3158, https://doi.org/10.1080/01431161.2016.1275060, 2017.
Bühler, Y., von Rickenbach, D., Stoffel, A., Margreth, S., Stoffel, L., and Christen, M.: Automated snow avalanche release area delineation – validation of existing algorithms and proposition of a new object-based approach for large-scale hazard indication mapping, Nat. Hazards Earth Syst. Sci., 18, 3235–3251, https://doi.org/10.5194/nhess-18-3235-2018, 2018.
Bühler, Y., Hafner, E. D., Zweifel, B., Zesiger, M., and Heisig, H.: Where are the avalanches? Rapid SPOT6 satellite data acquisition to map an extreme avalanche period over the Swiss Alps, The Cryosphere, 13, 3225–3238, https://doi.org/10.5194/tc-13-3225-2019, 2019.
Christen, M., Kowalski, J., and Bartelt, P.: RAMMS: Numerical simulation of dense snow avalanches in three-dimensional terrain, Cold Reg. Sci. Technol., 63, 1–14, https://doi.org/10.1016/j.coldregions.2010.04.005, 2010.
Cohen, J.: Weighted kappa: Nominal scale agreement with provision for scaled disagreement or partial credit, Psychol. Bull., 70, 213–220, https://doi.org/10.1037/h0026256, 1968.
Condat, L.: A Simple Trick to Speed Up and Improve the Non-Local Means, hal-00512801v3, available at: https://hal.archives-ouvertes.fr/file/index/docid/512801/filename/hal.pdf (last access: 18 February 2021), 2010.
EAWS: Standards: Avalanche Size, online availabe at: https://www.avalanches.org/standards/avalanche-size/ (last access: 18 February 2021), 2020.
Eckerstorfer, M. and Malnes, E.: Manual detection of snow avalanche debris using high-resolution Radarsat-2 SAR images, Cold Reg. Sci. Technol., 120, 205–218, https://doi.org/10.1016/j.coldregions.2015.08.016, 2015.
Eckerstorfer, M., Bühler, Y., Frauenfelder, R., and Malnes, E.: Remote sensing of snow avalanches: Recent advances, potential, and limitations, Cold Reg. Sci. Technol., 121, 126–140, https://doi.org/10.1016/j.coldregions.2015.11.001, 2016.
Eckerstorfer, M., Malnes, E., and Müller, K.: A complete snow avalanche activity record from a Norwegian forecasting region using Sentinel-1 satellite-radar data, Cold Reg. Sci. Technol., 144, 39–51, https://doi.org/10.1016/j.coldregions.2017.08.004, 2017.
Eckerstorfer, M., Vickers, H., Malnes, E., and Grahn, J.: Near-Real Time Automatic Snow Avalanche Activity Monitoring System Using Sentinel-1 SAR Data in Norway, Remote Sens.-Basel, 11, 2863, https://doi.org/10.3390/rs11232863, 2019.
Faillettaz, J., Louchet, F., and Grasso, J.-R.: Two-threshold model for scaling laws of noninteracting snow avalanches, Phys. Rev. Lett., 93, 208001, https://doi.org/10.1103/PhysRevLett.93.208001, 2004.
Feistl, T., Bebi, P., Christen, M., Margreth, S., Diefenbach, L., and Bartelt, P.: Forest damage and snow avalanche flow regime, Nat. Hazards Earth Syst. Sci., 15, 1275–1288, https://doi.org/10.5194/nhess-15-1275-2015, 2015.
Fuchs, S., Keiler, M., Zischg, A., and Bründl, M.: The long-term development of avalanche risk in settlements considering the temporal variability of damage potential, Nat. Hazards Earth Syst. Sci., 5, 893–901, https://doi.org/10.5194/nhess-5-893-2005, 2005.
Galli, M., Ardizzone, F., Cardinali, M., Guzzetti, F., and Reichenbach, P.: Comparing landslide inventory maps, Geomorphology, 94, 268–289, https://doi.org/10.1016/j.geomorph.2006.09.023, 2008.
Hafner, E. D. and Bühler, Y.: SPOT6 Avalanche outlines 24 January 2018, SLF, EnviDat, https://doi.org/10.16904/envidat.77, 2019.
Hafner, E. D., Leinss, S., Techel, F., and Bühler, Y.: Satellite avalanche mapping validation data, SLF, EnviDat, https://doi.org/10.16904/envidat.202, 2021.
Harvey, S., Schmudlach, G., Bühler, Y., Dürr, L., Stoffel, A., and Christen, M.: Avalanche terrain maps for backcountry skiing in Switzerland, in: International Snow Science Workshop ISSW, 7–12 October 2018, Innsbruck, Austria, 1625–1631, 2018.
Hölbling, D., Friedl, B., and Eisank, C.: Correction to: An object-based approach for semi-automated landslide change detection and attribution of changes to landslide classes in northern Taiwan, Earth Sci. Inform., 8, 327–335, https://doi.org/10.1007/s12145-018-00375-8, 2015.
Korzeniowska, K., Bühler, Y., Marty, M., and Korup, O.: Regional snow-avalanche detection using object-based image analysis of near-infrared aerial imagery, Nat. Hazards Earth Syst. Sci., 17, 1823–1836, https://doi.org/10.5194/nhess-17-1823-2017, 2017.
Landis, J. R. and Koch, G. G.: The Measurement of Observer Agreement for Categorical Data, Biometrics, 33, 159–174, https://doi.org/10.2307/2529310, 1977.
Lato, M. J., Frauenfelder, R., and Bühler, Y.: Automated detection of snow avalanche deposits: segmentation and classification of optical remote sensing imagery, Nat. Hazards Earth Syst. Sci., 12, 2893–2906, https://doi.org/10.5194/nhess-12-2893-2012, 2012.
Leinss, S., Wicki, R., Holenstein, S., Baffelli, S., and Bühler, Y.: Snow avalanche detection and mapping in multitemporal and multiorbital radar images from TerraSAR-X and Sentinel-1, Nat. Hazards Earth Syst. Sci., 20, 1783–1803, https://doi.org/10.5194/nhess-20-1783-2020, 2020.
Margreth, S. and Romang, H.: Effectiveness of mitigation measures against natural hazards, Cold Reg. Sci. Technol., 64, 199–207, https://doi.org/10.1016/j.coldregions.2010.04.013, 2010.
Mayer, S., van Herwijnen, A., Ulivieri, G., and Schweizer, J.: Evaluating the performance of an operational infrasound avalanche detection system at three locations in the Swiss Alps during two winter seasons, Cold Reg. Sci. Technol., 173, 102962, https://doi.org/10.1016/j.coldregions.2019.102962, 2020.
Meister, R.: Country-wide Avalanche Warning in Switzerland, in: International Snow Science Workshop ISSW, 30 October–3 November 1994, Snowbird, Utah, USA, 58–71, 1994.
Nolin, A. W.: Recent advances in remote sensing of seasonal snow, J. Glaciol., 56, 1141–1150, https://doi.org/10.3189/002214311796406077, 2010.
Nolting, S., Marin, C., Steger, S., Schneiderbauer, S., Notarnicola, C., and Zebisch, M.: Regional scale statistical mapping of snow avalanche likelihood and its combination with an optical remote sensing based avalanche detection approach – first attempts for the province of South Tyrol (Italy), in: International Snow Science Workshop ISSW, 7–12 October 2018, Innsbruck, 382–387, 2018.
Oh, Y., Sarabandi, K., and Ulaby, F. T.: An Empirical Model and an Inversion Technique for Radar Scattering from Bare Soil Surfaces, IEEE T. Geosci. Remote, 30, 370–381, https://doi.org/10.1109/36.134086, 1992.
Ressl, C. and Pfeifer, N.: Evaluation of the elevation model influence on the orthorectification of Sentinel-2 satellite images over Austria, Eur. J. Remote Sens., 51, 693–709, https://doi.org/10.1080/22797254.2018.1478676, 2018.
Rudolf-Miklau, F., Sauermoser, S., and Mears, A.: The technical avalanche protection handbook, Ernst & Sohn, Berlin, Germany, 430 pp., ISBN 978-3-433-03034-9, 2015.
Sampl, P. and Zwinger, T.: Avalanche simulation with SAMOS, Ann. Glaciol., 38, 393–398, https://doi.org/10.3189/172756404781814780, 2004.
Schweizer, J., Kronholm, K., and Wiesinger, T.: Verification of regional snowpack stability and avalanche danger, Cold Reg. Sci. Technol., 37, 277–288, https://doi.org/10.1016/S0165-232X(03)00070-3, 2003.
Schweizer, J., Mitterer, C., Techel, F., Stoffel, A., and Reuter, B.: On the relation between avalanche occurrence and avalanche danger level, The Cryosphere, 14, 737–750, https://doi.org/10.5194/tc-14-737-2020, 2020.
Small, D.: Flattening Gamma: Radiometric Terrain Correction for SAR Imagery, IEEE Trans. Geosci. Remote Sensing, 49, 3081–3093, https://doi.org/10.1109/TGRS.2011.2120616, 2011.
Small, D.: SAR backscatter multitemporal compositing via local resolution weighting, in: 2012 IEEE International Geoscience and Remote Sensing Symposium, IGARSS 2012, 2012 IEEE International Geoscience and Remote Sensing Symposium, Munich, Germany, 22–27 July 2012, 4521–4524, 2012.
swisstopo: swissALTI3D – Das hoch aufgelöste Terrainmodell der Schweiz, Swiss Federal Office of Topography swisstopo, Berne, Switzerland, 2018.
swisstopo: SWISSIMAGE – Das digitale Orthofotomosaik der Schweiz, Swiss Federal Office of Topography swisstopo, Berne, Switzerland, 2020a.
swisstopo: Swiss Map Raster – Produktdokumentation, Swiss Federal Office of Topography swisstopo, Berne, Switzerland, 2020b.
Techel, F., Winkler, K., Walcher, M., van Herwijnen, A., and Schweizer, J.: On snow stability interpretation of extended column test results, Nat. Hazards Earth Syst. Sci., 20, 1941–1953, https://doi.org/10.5194/nhess-20-1941-2020, 2020.
Trevethan, R.: Sensitivity, Specificity, and Predictive Values: Foundations, Pliabilities, and Pitfalls in Research and Practice, Frontiers in Public Health, 5, 307, https://doi.org/10.3389/fpubh.2017.00307, 2017.
van Herwijnen, A. and Schweizer, J.: Monitoring avalanche activity using a seismic sensor, Cold Reg. Sci. Technol., 69, 165–176, https://doi.org/10.1016/j.coldregions.2011.06.008, 2011.
Vickers, H., Eckerstorfer, M., Malnes, E., Larsen, Y., and Hindberg, H.: A method for automated snow avalanche debris detection through use of synthetic aperture radar (SAR) imaging, Earth and Space Science, 3, 446–462, https://doi.org/10.1002/2016ea000168, 2016.
Warren, S. G.: Optical properties of snow, Rev. Geophys., 20, 67–89, https://doi.org/10.1029/RG020i001p00067, 1982.
Wesselink, D. S., Malnes, E., Eckerstorfer, M., and Lindenbergh, R. C.: Automatic detection of snow avalanche debris in central Svalbard using C-band SAR data, Polar Res., 36, 1333236, https://doi.org/10.1080/17518369.2017.1333236, 2017.
Wever, N., Vera Valero, C., and Techel, F.: Coupled Snow Cover and Avalanche Dynamics Simulations to Evaluate Wet Snow Avalanche Activity, J. Geophys. Res.-Earth, 123, 1772–1796, https://doi.org/10.1029/2017JF004515, 2018.
WSL Institute for Snow and Avalanche Research SLF: Avalanche Bulletin Interpretation Guide: Edition December 2019, WSL Institute for Snow and Avalanche Research SLF, 53 pp., available at: https://www.slf.ch/files/user_upload/SLF/Lawinenbulletin_Schneesituation/Wissen_zum_Lawinenbulletin/Interpretationshilfe/Interpretationshilfe_EN.pdf (last access: 18 February 2021), 2019.
Zweifel, B., Lucas, C., Hafner, E., Techel, F., Marty, C., and Stucki, T.: Schnee und Lawinen in den Schweizer Alpen: Hydrologisches Jahr 2018/19, WSL Berichte, Birmensdorf, 134, available at: https://www.dora.lib4ri.ch/wsl/islandora/object/wsl%3A22232/datastream/PDF/Zweifel-2019-Schnee_und_Lawinen_in_den-%28published_version%29.pdf (last access: 18 February 2021), 2019.
- Abstract
- Introduction
- Area and data sets
- Methods
- Results
- Discussion
- Conclusions and outlook
- Appendix A
- Appendix B: Slant image geometry (Sentinel-1)
- Appendix C
- Appendix D: Description of the POD and PPV
- Appendix E: Effects of joins on the POD and PPV
- Data availability
- Author contributions
- Competing interests
- Acknowledgements
- Review statement
- References