the Creative Commons Attribution 4.0 License.
the Creative Commons Attribution 4.0 License.
 | 10 Dec 2021
Fractionation of O2∕N2 and Ar∕N2 in the Antarctic ice sheet during bubble formation and bubble–clathrate hydrate transition from precise gas measurements of the Dome Fuji ice core
Kenji Kawamura
Tsutomu Uchida
Shuji Fujita
Kyotaro Kitamura
Motohiro Hirabayashi
Shuji Aoki
Shinji Morimoto
Takakiyo Nakazawa
Jeffrey P. Severinghaus
Jacob D. Morgan
The variations of and in the Dome Fuji ice core were measured from 112 m (bubbly ice) to 2001 m (clathrate hydrate ice). Our method, combined with the low storage temperature of the samples (−50 ∘C), successfully excludes post-coring gas-loss fractionation signals from our data. From the bubbly ice to the middle of the bubble–clathrate transition zone (BCTZ) (112–800 m) and below the BCTZ (>1200 m), the and data exhibit orbital-scale variations similar to local summer insolation. The data in the lower BCTZ (800–1200 m) have large scatter, which may be caused by millimeter-scale inhomogeneity of air composition combined with finite sample lengths. The insolation signal originally recorded at the bubble close-off remains through the BCTZ, and the insolation signal may be reconstructed by analyzing long ice samples (more than 50 cm for the Dome Fuji core). In the clathrate hydrate zone, the scatter around the orbital-scale variability decreases with depth, indicating diffusive smoothing of and . A simple gas diffusion model was used to reproduce the smoothing and thus constrain their permeation coefficients. The relationship between and is markedly different for the datasets representing bubble close-off (slope ∼ 0.5), bubble–clathrate hydrate transformation (∼1), and post-coring gas loss (∼0.2), suggesting that the contributions of the mass-independent and mass-dependent fractionation processes are different for those cases. The method and data presented here may be useful for improving the orbital dating of deep ice cores over the multiple glacial cycles and further studying non-insolation-driven signals (e.g., atmospheric composition) of these gases.
- Article
(8062 KB) - Full-text XML
- BibTeX
- EndNote


Air trapped in polar ice sheets provides information on past climate and atmosphere. Air is transported mainly by molecular diffusion from the surface to the bottom of firn (typically 50–100 m below the snow surface) and trapped as air bubbles. During the bubble close-off process, relatively small gas molecules such as He, Ne, O2, and Ar are preferentially excluded from air bubbles to open pores (e.g., Bender et al., 1994a; Battle et al., 1996; Severinghaus and Battle, 2006; Huber et al., 2006). The size-dependent gas fractionation may be related to the size of channels within ice crystals (Huber et al., 2006) or the differences in the dominant diffusion mechanism (Ikeda-Fukazawa et al., 2004; Severinghaus and Battle, 2006). Deep ice cores from Antarctic inland show of −5 ‰ to −10 ‰ relative to the atmosphere due to the close-off fractionation (Bender, 2002; Suwa and Bender, 2008a, b; Kawamura et al., 2007; Extier et al., 2018). has been rarely reported, and it is less depleted than (Sowers et al., 1989; Bender et al., 1995; Severinghaus et al., 2009).
High correlations were found between local summer insolation and records of the Vostok and Dome Fuji (DF) cores, which have been used for orbital dating of the cores (Bender, 2002; Suwa and Bender, 2008a; Kawamura et al., 2007). Summer insolation may influence the physical properties of snow, which later control the close-off fractionation (Bender, 2002; Kawamura et al., 2007; Fujita et al., 2009). The phasing between the local summer insolation and signals and its variability are typically neglected in the dating practice. However, the data from the European Project for Ice Coring in Antarctica (EPICA) Dome C (EDC), Vostok, and DF cores around the last interglacial period show discrepancies and high-frequency variabilities, challenging the assumption of stable phasing (Bazin et al., 2016).
The current understanding of the gas fractionation and hence the assessment of and as the local insolation proxy are hindered, at least partly, by the scarceness of the data that are unaffected by post-coring gas loss (during ice-core drilling and storage), which also fractionates and (Bender et al., 1995; Kawamura et al., 2007; Kobashi et al., 2008; Severinghaus et al., 2009; Sowers et al., 1989). For example, configurational diffusion may occur in microcracks to produce size-dependent and weak mass-dependent fractionations (Bender et al., 1995; Huber et al., 2006). Molecular diffusion through ice matrix may also produce size-dependent fractionation (Ikeda-Fukazawa et al., 2004). The DF, Vostok, and GISP2 deep cores indeed showed gradual depletion over several years at −25 to −35 ∘C (Kawamura et al., 2007; Suwa and Bender, 2008a, b).
Another obstacle to understanding the close-off fractionation lies in the transformation of bubbles to clathrate hydrates. In the bubble–clathrate hydrate transition zone (BCTZ: e.g., 450–1200 m at Dome Fuji (Narita et al., 1999), extreme gas fractionations on the order of several hundreds of ‰ can occur between individual bubbles and clathrate hydrates due to lower dissociation pressure and larger permeation coefficient of O2 relative to N2 (e.g., Chazallon et al., 1998; Ikeda-Fukazawa et al., 2001). The microscopic gas fractionation, combined with the post-coring gas-loss fractionation, creates high variabilities of and from gas measurements in the BCTZ (Bender, 2002; Kawamura et al., 2007; Kobashi et al., 2008; Lüthi et al., 2010; Shackleton et al., 2019). Below the BCTZ, the variabilities of and decrease with depth over several hundred meters, possibly due to diffusive smoothing (Lüthi et al., 2010; Bereiter et al., 2014; Shackleton et al., 2019). The understanding of the smoothing process has been insufficient because of the lack of high-resolution gas data for a proper numerical simulation (Bereiter et al., 2014). Moreover, the fact that reliable records have been available only from the clathrate hydrate ice (i.e., older than ∼100 kyr) has hindered the discussion of how the original close-off fractionation signals are preserved through the BCTZ.
A better understanding of the gas fractionation associated with bubble close-off and clathrate hydrate formation is important for the ice-core dating and eventual reconstruction of the past atmospheric ratios. Bereiter et al. (2009) predicted that the original gas composition is preserved in the inner part of the cores for a few decades at low temperature (e.g., −50 ∘C), based on a numerical simulation of gas diffusion. The prediction was verified by analyzing the DF core, which has been stored at −50 ∘C for ∼20 years, after sufficiently removing its fractionated outer part (Oyabu et al., 2020). In this work, we employ the method by Oyabu et al. (2020) and measure and from the bubbly ice to clathrate hydrate ice in the DF core. In addition to the discrete sampling, we obtain high-resolution, continuous gas and chemical data at selected depth intervals to understand the smoothing process of and below the BCTZ. Moreover, the outer ice is also measured for discussing the artifactual fractionation during storage. We analyze the data mainly based on the relationships between , and δ18O of O2 to distinguish the gas fractionation processes associated with the bubble close-off, transformation of bubbles to clathrate hydrates, and post-coring gas loss. A simple gas diffusion model is also employed to constrain the permeation coefficients of N2, O2, and Ar, and discuss the preservation of insolation signals in the gas records through the BCTZ.
2.1 Ice core
We use the first Dome Fuji ice core (DF1 core) drilled from 1993 to 1997 (Watanabe et al., 2003). After transporting to Japan, the samples had been stored at −50 ∘C at the Institute for Low Temperature Science, Hokkaido University (until 2009), and the National Institute of Polar Research (NIPR, 2009–present). Within the DF ice core, 105–450 m is bubbly ice, 450–1200 m is the BCTZ, and below 1200 m is bubble-free ice (Narita et al., 1999; Ohno et al., 2004).
2.2 Air extraction and measurements
A typical ice sample is ∼60 g and ∼110 mm long (corresponding to ∼3 to 30 years) (Fig. 1a), which is cut out from a bulk section (∼500 mm long). Because and near the sample surface are depleted by gas loss during storage, we removed the surface by more than 8 mm for clathrate ice (Oyabu et al., 2020) and 5 mm for bubbly ice (see below). For some samples in the BCTZ (1000–1200 m), we removed the surface by 20 mm (Fig. 1b) to minimize the signal of gas loss from high-pressure bubbles (Bender, 2002).
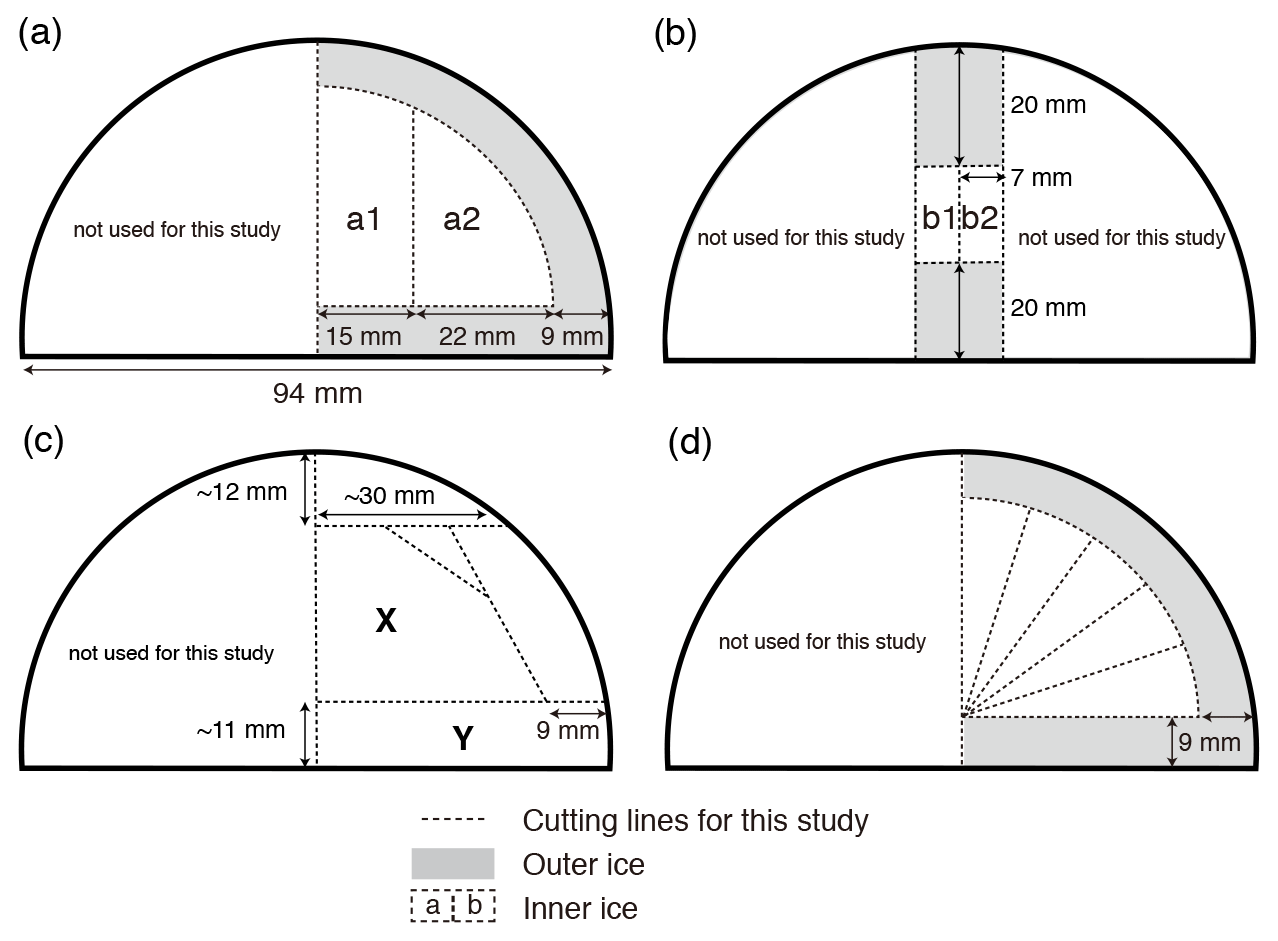
Figure 1Typical cross-sectional cutting plan. The outer black line in each panel is the original surface that was exposed to the atmosphere for ∼20 years at −50 ∘C. Dotted lines are the cutting lines for this study. (a) Duplicate measurements and outer–inner comparisons. The sample length is 11 cm. For single (non-duplicate) measurements, only a2 is cut out. (b) Same as panel (a) but for 13 depths in 1000–1100 m with the sample length of 20 cm. (c) High-resolution analysis. Sections X and Y were used for the gas and ion measurements with the lengths of 2.5 and 1.25 cm, respectively, for X and Y, respectively. (d) Test of gas loss under vacuum with the length of 11 cm.
The thickness of surface removal (5 mm) for bubbly ice was determined as follows. Within a pair of samples with 3 mm removal, the sample with larger outer surface (“a2” in Fig. 1a) had generally lower and , and slightly higher δ18O than the other sample (“a1” in Fig. 1a) (Fig. B1). No such tendency is observed with >5 mm surface removal (Fig. B1). We note that δ15N is insensitive to the removal thickness (Fig. B1c), confirming its immunity from gas loss (Severinghaus et al., 2009; Oyabu et al., 2020).
The experimental procedures at NIPR are described elsewhere (Oyabu et al., 2020). Briefly, ice sample was evacuated for 2 h and melted, and the released air was cryogenically collected into a sample tube. The air sample was split into two aliquots and measured with a mass spectrometer (Thermo Delta V, for , , δ15N and δ18O) and gas chromatographs (two Agilent 7890A, for CO2, CH4 and N2O concentrations; not shown in this study). Corrections were made for non-linearity of the elemental and isotopic ratios upon sample pressure, and for the dependency of δ15N, δ18O and upon (Bender et al., 1994b). Then, the values were normalized to the modern atmosphere (Oyabu et al., 2020). The , , and δ18O values relative to the modern atmosphere were corrected for the gravitational enrichment in firn, which is nearly proportional to the mass difference between the gas pairs (Craig et al., 1988; Sowers et al., 1989). The gravitational correction can be estimated from δ15N of the same sample:
where δgravcorr is gravitationally corrected value, δ is measured value, and Δm is mass difference (4 for , 12 for , and 2 for δ18O). We measured 522 and 162 depths with single and replicates, respectively, between 112.88 to 2001.12 m (3 to 173 kyr BP).
We tested the possibility of gas loss during the sample evacuation (Craig et al., 1988). For bubbly ice (446.4 m) and clathrate hydrate ice (2001.1 m), we split each sample into five thin pieces of 13–18 g (Fig. 1d) and evacuated them for different durations (two pieces for 20 min, one for 2 h, and two for 5 h). There is no dependence of , , δ15N, and δ18O on the pumping time (Fig. B2). The bubbly ice data show somewhat low and for the 20 min evacuation, but the result is opposite to the expectation from gas loss. Also, larger variabilities of and are expected in the bubbly ice than in the clathrate hydrate ice (Sect. 4.1). Thus, our method and core quality do not significantly fractionate the gases.
In total, 11 samples from 179.69 to 2496.55 m, stored for 11 years at −25 ∘C, were measured for and δ15N at Tohoku University. The analytical method was slightly modified from the previous method by Kawamura et al. (2007) as follows. The typical sample size was 250 g, and the measurements were made with a Delta plus XP (Thermo Fisher Scientific) with 64 changeover cycles. Analytical precisions (1σ) were estimated to be 0.4 ‰ and 0.011 ‰ for and δ15N, respectively.
2.3 High-resolution analyses
The air composition and ion concentrations were measured on five 50 cm segments at the resolutions of 1–2 cm. Three segments were measured for the air (1258.51–1258.99, 1389.79–1390.32, and 1893.51–1893.99 m) and two segments were measured for the air and ions (1292.29–1292.82 and 1399.03–1399.48 m). In Fig. 1c, the X and Y sections were divided into 25 and 12.5 mm pieces for air and ion measurements, respectively.
For the ion measurements, the ice was decontaminated by shaving off ∼3 mm and then chopped off with a ceramic knife and sampled in particle-free plastic bags. They were melted in a clean laboratory (class 10 000) and analyzed for the concentrations of Cl−, , , F−, , Na+, , K+, Mg2+, and Ca2+ using ion chromatography (Thermo Fisher Scientific Dionex ICS-5000+) (Goto-Azuma et al., 2019).
2.4 Diffusion model
We simulate diffusive smoothing of and in the clathrate hydrate ice with a one-dimensional diffusion model (Ikeda-Fukazawa et al., 2005; Bereiter et al., 2009, 2014) to test whether the observed reduction of variability below BCTZ (see Sect. 3.1.4) is consistent with molecular diffusion in ice as previously hypothesized. Because both diffusion coefficients and solubilities of O2, N2, and Ar in ice are poorly known, we run the model with different sets of previously proposed permeabilities (the product of diffusion coefficient and solubility).
The model assumes that the molecular diffusion through ice lattice is driven by the concentration gradient of gas molecules dissolved in ice, which are in equilibrium with clathrate hydrates in respective layers of the model. The governing equation is
where Dm is the diffusivity of the m molecule in ice at 1 MPa and is the concentration of the m molecule (m=N2, O2 or Ar) dissolved in ice in equilibrium with clathrate hydrate (see Table A1 for the full list of symbols). is expressed as
where Sm is the solubility of the m molecule in ice at 1 MPa, is the dissociation pressure of the m molecule, and Xm is the mean molar fraction of m molecule in the clathrate hydrates. The dissociation pressure (MPa) of m molecule at temperature T (K) is given by Miller (1969) and Kuhs et al. (2000) (Fig. A1):
where am and bm are constant and shown in Table A2.
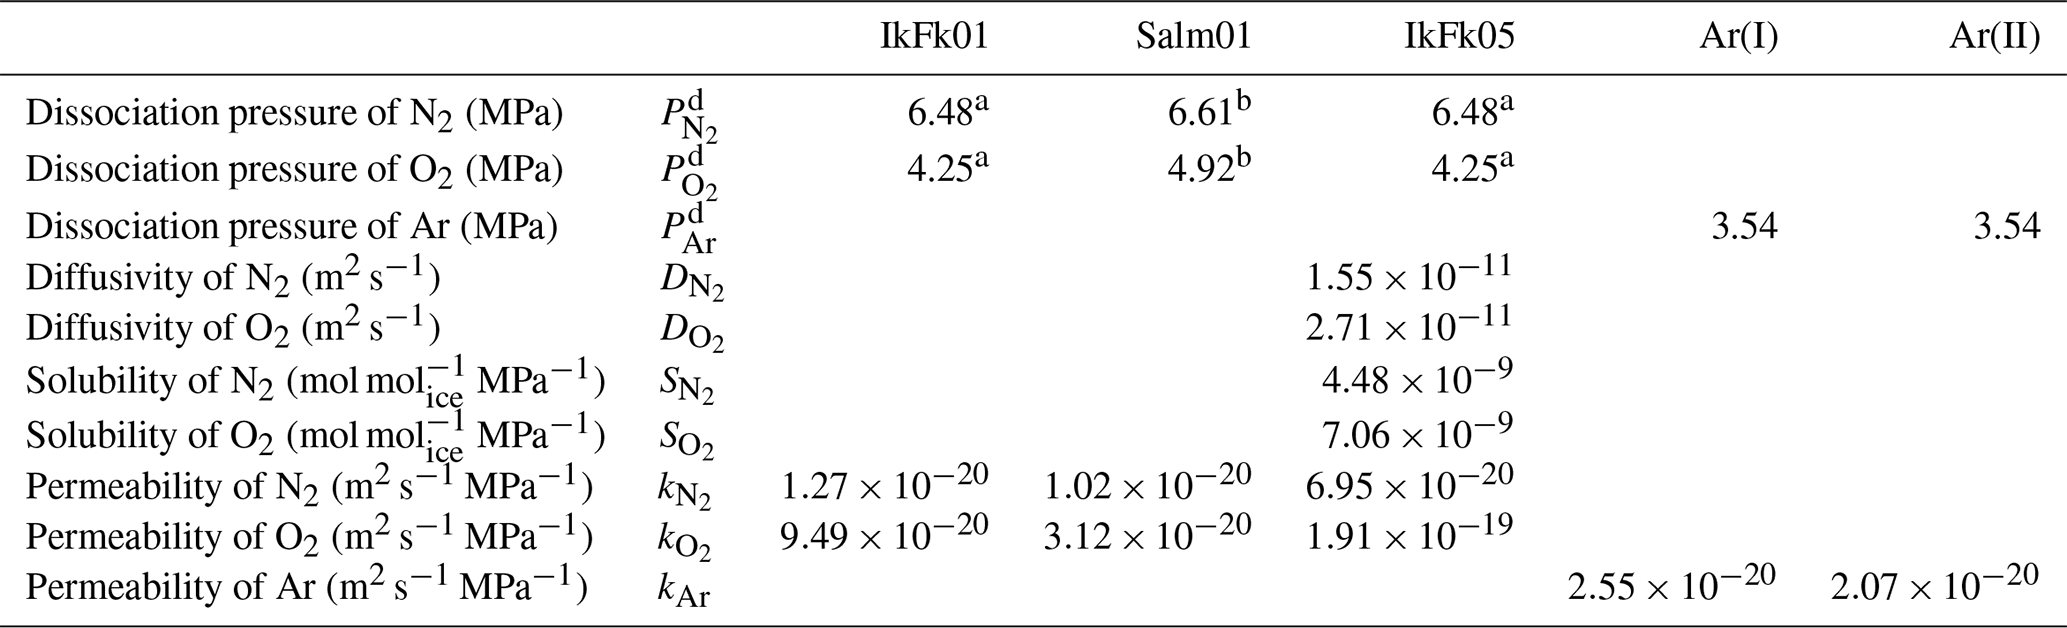
We tested three sets of model-based permeabilities estimated by Ikeda-Fukazawa et al. (2001) (hereafter IkFk01), Salamatin et al. (2001) (hereafter Salm01), and Ikeda-Fukazawa et al. (2005) (hereafter IkFk05) (Fig. 2, Tables A2 and A3).

Figure 2Permeation coefficients of O2, N2, Ar, and air, estimated by different authors. See text for details.
There is no published permeability of Ar in ice; thus, we used two formulations proposed by Kobashi et al. (2015) (Fig. 2). The first permeability kAr(I) uses diffusion coefficients of N2, O2, and Ar at 270 K from the molecular dynamics simulations by Ikeda-Fukazawa et al. (2004) (: m2 s−1, : m2 s−1 and : m2 s−1):
The second permeability kAr(II) is based on the observations that is often depleted about half of (e.g., Severinghaus et al., 2009) and is given by
The model has the initial depth domain of 20 m, consisting of 0.5 mm thick boxes. The initial depth profiles of the gas concentrations are given by repeating the shallowest high-resolution and data (1258.51–1258.99 m, 81.7 kyr BP) normalized to zero mean, converted with total air content. The model is run for 100 kyr with the time step of ∼12 d to simulate the diffusive relaxation of the initial concentration variations and thus the composition of clathrate hydrates. To account for the actual ice sheet conditions, the box heights are gradually reduced according to the thinning function (Nakano et al., 2016) and age scale of the ice core (Kawamura et al., 2007) (Fig. A2). The temperature in the model is also changed according to the observed depth profile of borehole temperature (Buizert et al., 2021) (Fig. A2). We assume that the depth profiles of thinning and temperature are constant through time. The modeled and at 2.9, 13.7, 14.5, and 67.5 kyr (modeled age) are compared with the corresponding high-resolution data at 1292, 1390, 1399, and 1894 m, respectively. Because we do not know the initial concentration profiles at the top of the clathrate hydrate zone for each high-resolution datum, it is reasonable only to compare the amplitudes and frequencies of the and variations between the data and model outputs. Additional details of the model and simulation method are described in Appendix A.
3.1 and in bubbly ice, BCTZ ice, and clathrate hydrate ice
and from the 11 cm samples are shown in Fig. 3b and c. Note that all , , and δ18O data in this and the following sections are gravitationally corrected (see Sect. 2.2). As expected, most data are negative (i.e., lower than the atmosphere) because of preferential loss of O2 and Ar relative to N2 during bubble close-off (Bender et al., 1995; Severinghaus and Battle, 2006). The average values of and are about −10 ‰ and −5 ‰, with the overall ranges of −14 ‰ to −5 ‰ and −7 ‰ to −3 ‰, respectively.

Figure 3 and records from the Dome Fuji ice core. Published data of water isotopes and air inclusions are also shown. (a) Stable water isotope record (Uemura et al., 2018), (b, c) and after gravitational corrections, (d, e) absolute residuals of and from their low-pass-filtered curves, (f, g) absolute pair differences of and , (h) in bubbles and clathrate hydrates observed by Raman spectroscopy (Ikeda-Fukazawa et al., 2001), and (i, j) number concentrations and radius of bubbles and clathrate hydrates (Ohno et al., 2004).
Variations in and for the depths deeper than ∼1200 m have similarity with local summer insolation curve, while little similarity is found for 800–1200 m with extremely large scatter (Fig. 4). For the depths shallower than ∼800 m, the comparisons between the gas records and insolation are less robust than for the deeper depths because of the short length (in terms of age) and small insolation amplitudes (small signal-to-noise ratio). Nevertheless, we find similarity between and local summer insolation in that both curves show the two peaks at ∼350 m (12 kyr BP) and ∼700 m (32 kyr BP) and that the second peak (at ∼700 m) is larger than the first one. We assess the scatter in the data by taking residuals of and from their low-pass-filtered curves (Fig. 3d and e). The low-pass filter (cut-off period: 16.7 kyr) and its usage are the same as in Kawamura et al. (2007). Briefly, we put the and data on the DFO-2006 timescale, linearly interpolated them at 0.1 kyr intervals, and applied the filter to extract their orbital-scale variations. The average residuals of are 1.1 ‰ in the bubbly ice zone (∼112–450 m), 0.7 ‰ in the upper BCTZ (∼450–800 m), 4.6 ‰ in the lower BCTZ (800–1200 m), 2.3 ‰ just below BCTZ (∼1200–1480 m), and 0.4 ‰ in the deeper depths (∼1480–2000 m). The average residuals of also show a similar pattern (0.5 ‰ for 112–450 m, 0.5 ‰ for 450–800 m, 2.8 ‰ for 800–1200 m, 1.3 ‰ for 1200–1480 m, and 0.3 ‰ for ∼1480–2000 m). Below, we divide our dataset into four depth ranges guided by the scatter as well as the classic boundaries between the bubbly ice zone, BCTZ, and clathrate ice zone (Narita et al., 1999; Ohno et al., 2004).
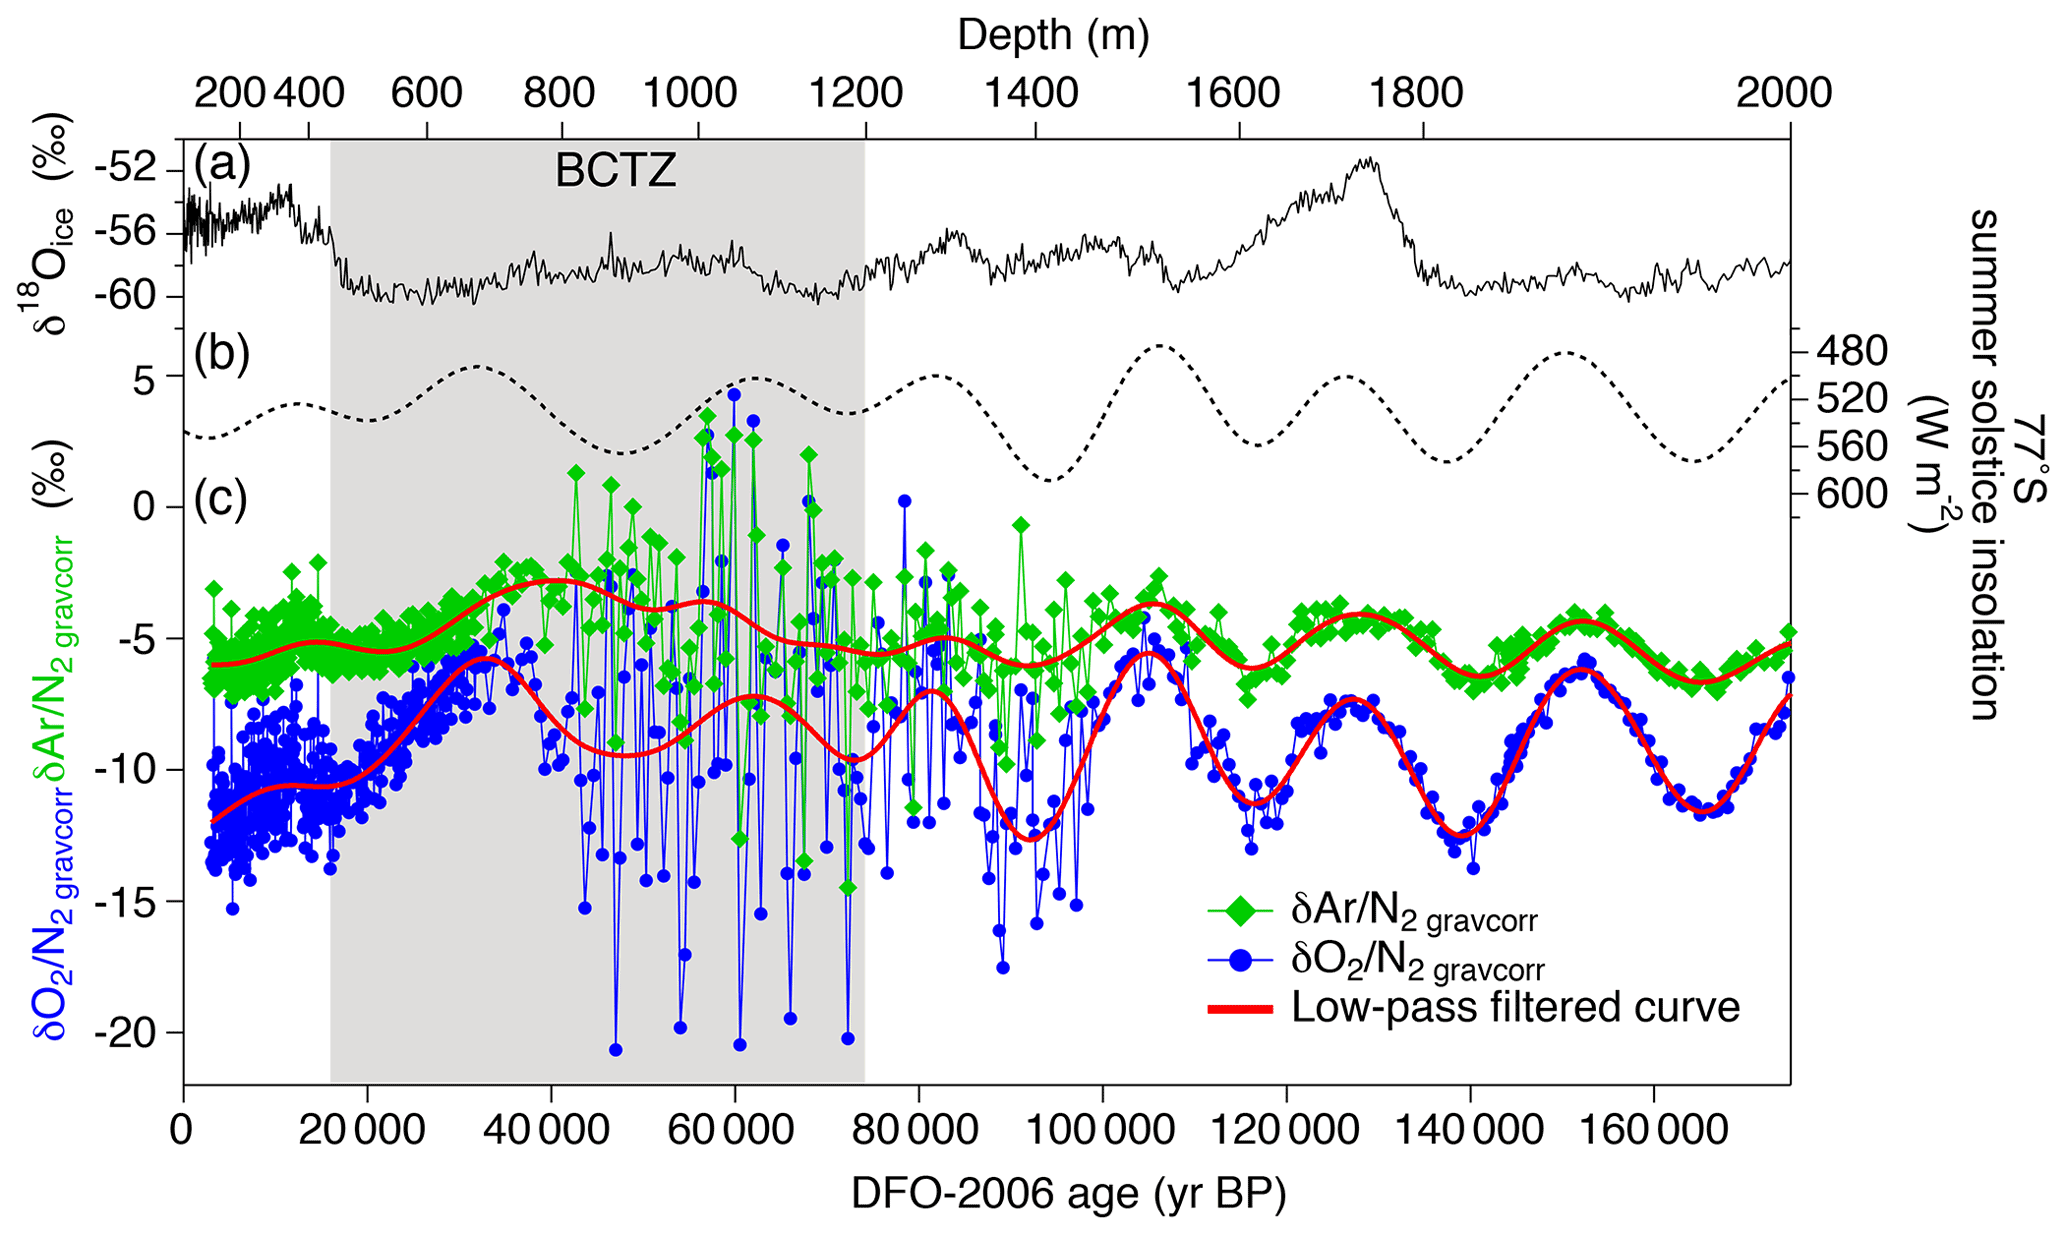
Figure 4 and with published records plotted against the age of ice. (a) Stable water isotope record (Uemura et al., 2018), (b) summer solstice insolation at Dome Fuji (Laskar et al., 2004), and (c) and with low-pass-filtered curves (cut-off at 16.7 kyr; the filter was designed by Kawamura et al., 2007) (red lines).
3.1.1 112–450 m (bubbly ice)
The average and are −10.9 ‰ and −5.6 ‰, with the overall ranges of −13.0 ‰ to −7.0 ‰ and −7.2 ‰ to −3.4 ‰, respectively. Figure 2f and g show differences of and between ice samples cut from the same depth (Fig. 1a) (hereafter referred to as the pair difference or Δ and Δ). Ranges of Δ and Δ are ∼0.02 ‰ to 0.97 ‰ and 0.01 ‰ to 0.96 ‰, respectively. Pair differences are usually used to calculate the pooled standard deviation, a metric of analytical precision. Instead, we use it to evaluate spatial variability in air composition for a given depth in the ice sheet (pair differences of δ15N and δ18O are plotted in Fig. B3 and pooled standard deviations are summarized in Table C1).
Our new data are compared with previously obtained data at Tohoku University using the samples stored at −25 ∘C for various durations (Fig. 5). As expected, the samples stored at −25 ∘C generally show lower than those stored at −50 ∘C, with dependency on the storage duration. Also, while the data from the −50 ∘C samples slightly increase with depth in the bubbly ice zone as expected from the insolation variation, the data from the −25 ∘C samples tend to decrease with depth possibly due to the increase in bubble pressure (leading to larger gas loss) (Ikeda-Fukazawa et al., 2005; Kawamura et al., 2007).
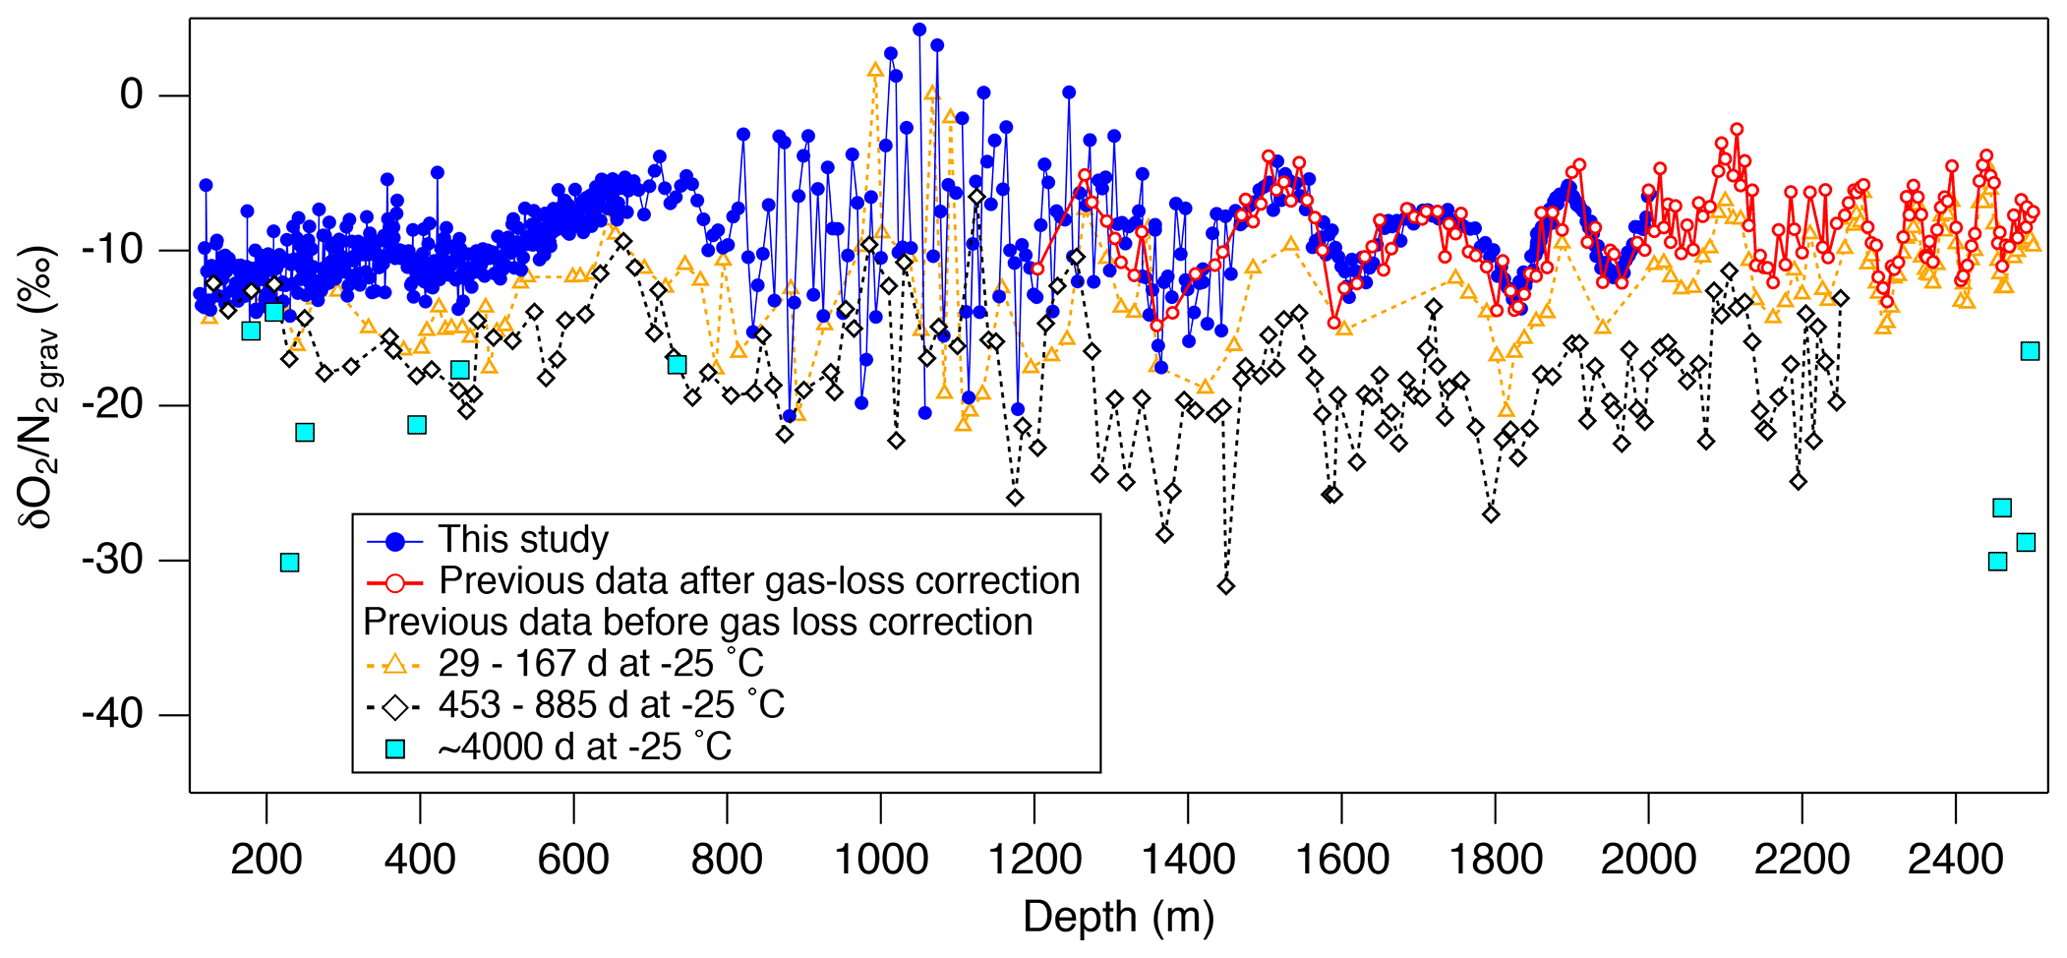
Figure 5Comparison of the new and previous data from the Dome Fuji ice core. Solid circles (blue) are the new data (this study), and open circles (red) are the previous data corrected for gas loss during storage at −25 ∘C (Kawamura et al., 2007). Open triangles (orange), open diamonds (black), and the solid square (light blue) are the uncorrected previous data for the storage period of 29–167, 453–885 d (Kawamura, 2001) and ∼4000 d (11 years) (this study), respectively.
3.1.2 450–800 m (upper BCTZ)
The number and size of clathrate hydrates gradually increase with depth, but air bubbles are still the dominant form of air inclusion (Fig. 3i and j) (Ohno et al., 2004). In the lowermost part of this range (below 720 m), individual clathrate hydrates with extremely enriched ( ‰) are found by Raman spectroscopy (Fig. 3h) (Ikeda-Fukazawa et al., 2001), in which laser light is focused on individual bubbles or clathrate hydrates, and the shift of wavelength and intensity of scattered light (Raman spectra) are measured for quantifying O2 and N2. The compositional ratio of O2 and N2 is assumed to be equal to the ratio of their Raman peak intensities. The and values from the gas analyses smoothly connect with those in the bubbly ice zone, with a slightly increasing trend with depth (Fig. 3b and c). The pair differences of and are smaller than 1 ‰ until ∼650 m, below which they show high values (>3 ‰, Fig. 3f and g).
3.1.3 800–1200 m (lower BCTZ)
Major transitions from air bubbles to clathrate hydrates occur in this depth range (Fig. 3i and j) (Ohno et al., 2004). The values of clathrate hydrates decrease from extremely high values towards the atmospheric value, and those of remaining air bubbles decrease to extremely negative values ( ‰) (Fig. 3h) (Ikeda-Fukazawa et al., 2001).

Figure 6High-resolution data of and in five depth intervals. Black, blue, and red lines are the raw data (2.5 cm resolution), 10 cm averages, and 25 cm averages, respectively. Standard deviations (SDs) of the raw 2.5 cm data (black) and 10 cm averages (blue) are shown in each panel. Thick horizontal black bars with gray shadings in some panels are the independent data from the 11 cm samples with 1σ error (measured by the standard protocol).
In contrast to the upper BCTZ, the bulk and in the lower BCTZ show elevated scatter (Fig. 3b–e). Very high scatter has also been reported from the Vostok (Suwa and Bender, 2008a), GISP2 (Kobashi et al., 2008), and West Antarctic Ice Sheet (WAIS) Divide (Shackleton et al., 2019) ice cores, with numerous positive values (higher than the atmosphere). The previous data were affected by the post-coring gas loss; thus, they were interpreted only as artifacts created by the preferential gas loss from extremely N2-rich air bubbles (Bender, 2002; Ikeda-Fukazawa et al., 2001; Kobashi et al., 2008; Shackleton et al., 2019). In our data, relatively few samples (six and 10 samples for and , respectively) show positive values, and even the samples with twice the surface removal (20 mm) show large scatter. Thus, the large and variabilities naturally occur in this zone. The pair differences of and are also large (up to ∼10 ‰, Fig. 3g and h; Table C1), indicating large inhomogeneities also in the horizontal direction.
3.1.4 1200–1980 m (clathrate hydrate ice)
Between 1200 and 1480 m, the and data show smaller scatter than those in the lower BCTZ (Fig. 3b–e), and their low-pass-filtered curves (corresponding to ∼80 to 100 kyr BP) show similarity to the local summer insolation (Fig. 4). The residuals of the data from the filtered curves are up to ∼5 ‰ and ∼3 ‰ for and , respectively. The large scatter below the BCTZ has also been found in the WAIS Divide (Shackleton et al., 2019), EPICA Dronning Maud Land (EDML), and EDC (Lüthi et al., 2010) ice cores. The pair differences of and are 1 ‰–2 ‰ just below the BCTZ (∼1200 m), and they decrease with depth to <0.1 ‰ (Fig. 3 and g, Table C1).
Below 1480 m, the and variations show remarkable similarities with the local summer insolation with small scatter (Fig. 4). The pair differences are also small (Fig. 3f and g, Table C1). The previous data corrected for the gas-loss fractionation (measured at Tohoku University; Kawamura et al., 2007) agree well with our new data (Fig. 5), suggesting that the inner part of the ice core stored at −50 ∘C has kept the original for two decades.
3.2 Outer ice
In almost all outer ice samples, and are significantly lower and δ18O is significantly higher than those in the inner ice, as expected for gas loss (Ikeda-Fukazawa et al., 2005; Severinghaus et al., 2009). The outer ice stored at −30 ∘C for ∼1 year shows larger gas-loss signals than those stored at −50 ∘C (Fig. B4), indicating that the gas-loss fractionation strongly depends on the storage temperature and duration. In the lower BCTZ, some and values from the outer ice are positive (Fig. B4a and b), possibly due to the preferential gas loss from N2-rich bubbles (Bender et al., 1995). We do not find significant differences between the outer and inner pieces for δ15N, CH4 concentration and N2O concentration (Fig. B4d–f). The results are consistent with the earlier notion that only the molecules smaller than 3.6 Å in collision diameter (O2 and Ar among the above species) significantly fractionate (Huber et al., 2006; Severinghaus and Battle, 2006).
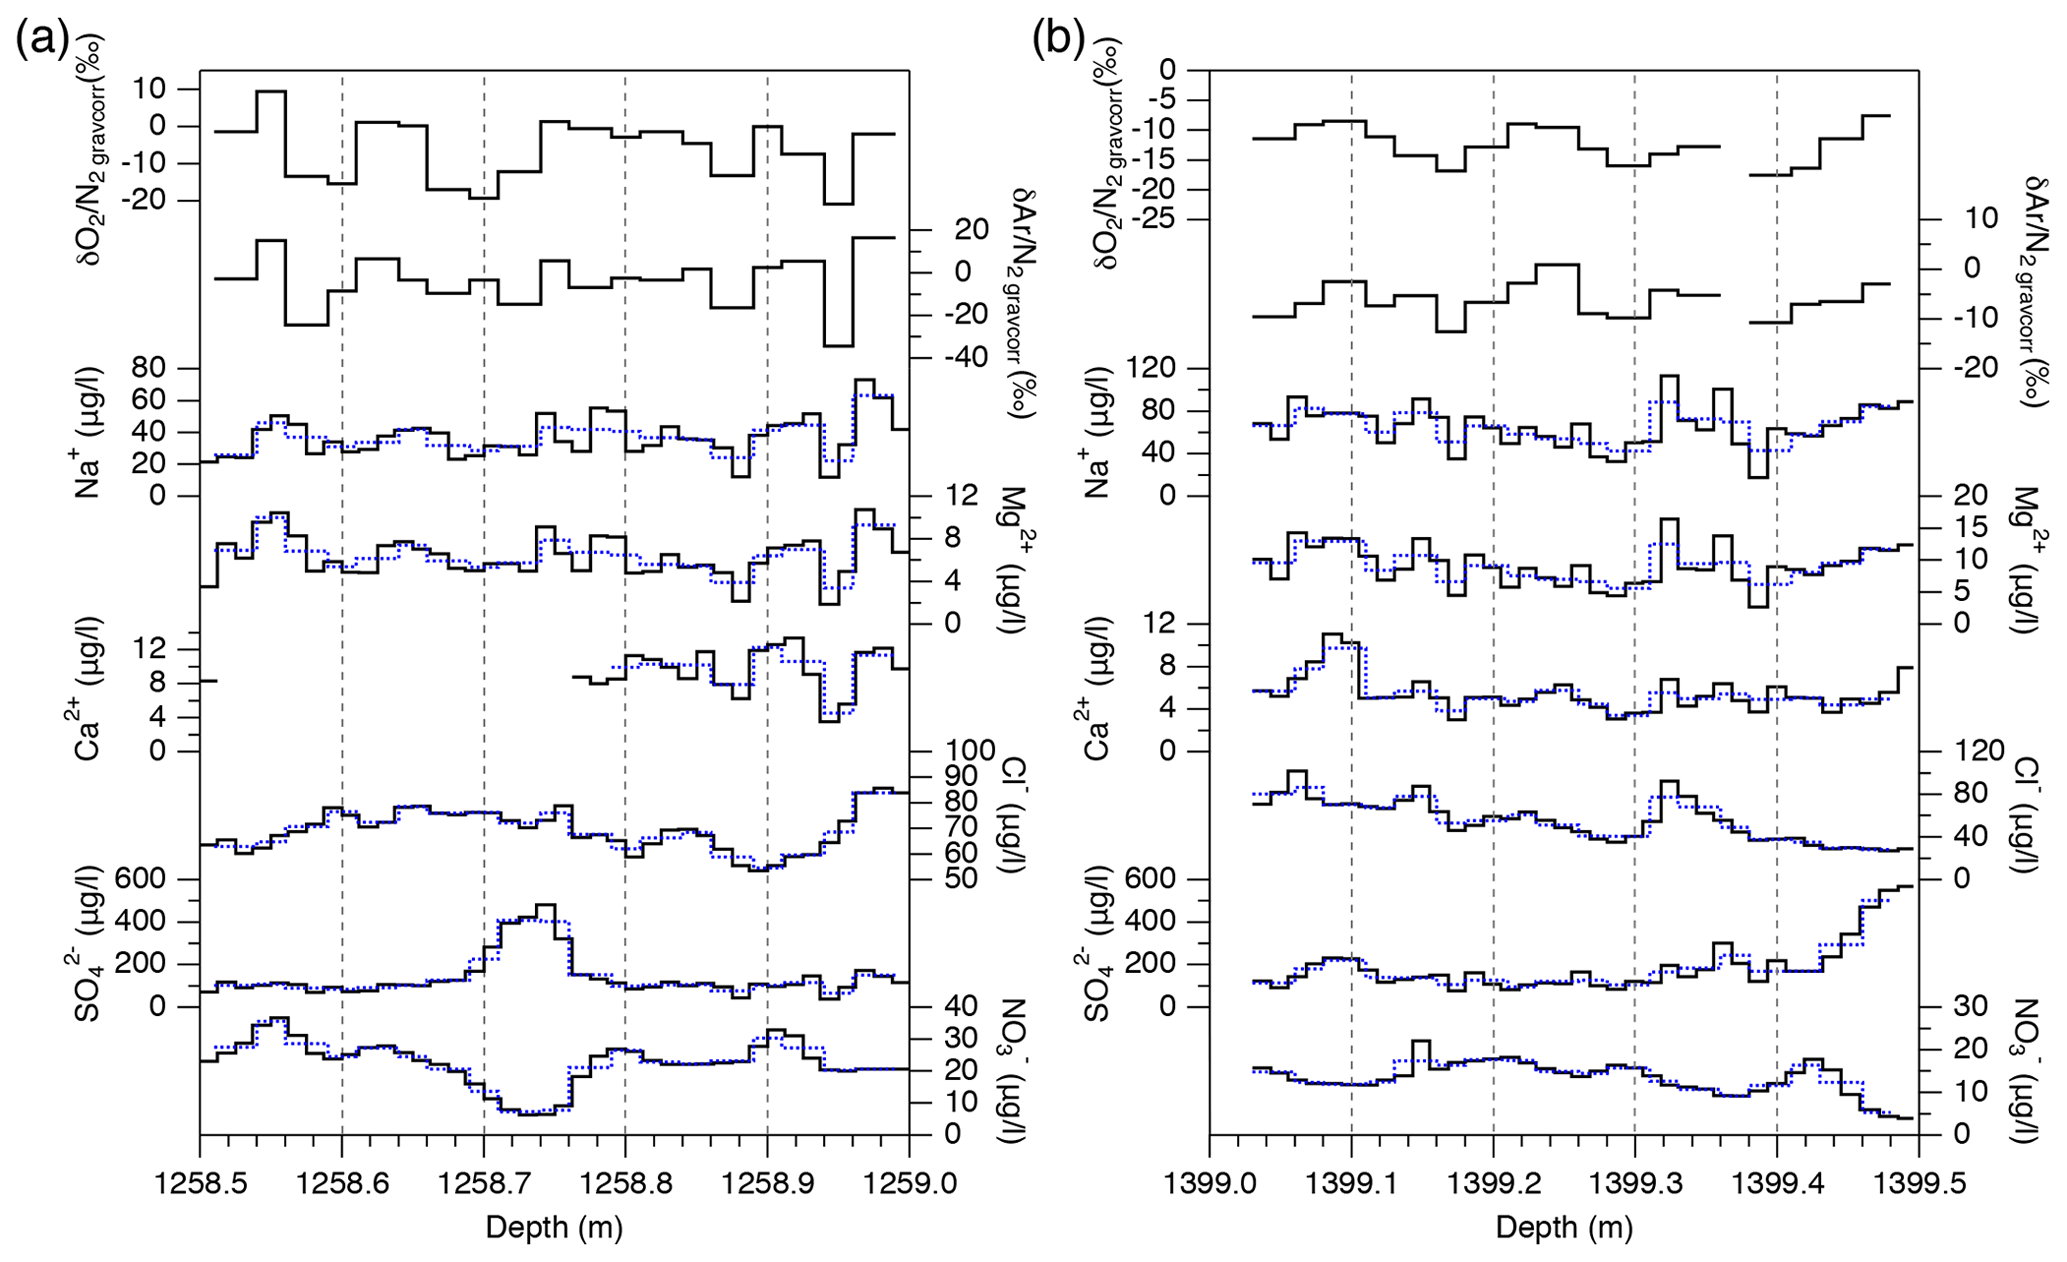
Figure 7High-resolution data of and (2.5 cm resolution) and ion concentrations (1.25 cm resolution). Dotted blue lines are the interpolated ion data to match with the resolution of the gas data. The Ca2+ data for 1258.51–1258.75 m are excluded (high contamination due to sample handling error).
3.3 High-resolution data
The high-resolution data (∼1258, 1292, 1390, 1399, and 1894 m) are shown in Fig. 6. For the upper four depths, and fluctuate with very large amplitudes (peak to peak: 10 ‰–30 ‰) and the cycles of 10–15 cm. In the deepest sample (1894 m), the values are quite stable. The standard deviations of are 8.4 ‰, 5.9 ‰, 5.8 ‰, 3.1 ‰, and 0.2 ‰, and those of are 12.5 ‰, 6.4 ‰, 5.6 ‰, 3.4 ‰, and 0.2 ‰ for 1258, 1292, 1390, 1399, and 1894 m, respectively.
The data are averaged over four to five consecutive samples and compared with the data from the normal (11 cm) samples (Fig. 6). Two normal samples at ∼1293 and 1390 m are taken from the same depths as the high-resolution measurements, and they agree with the averages of the high-resolution data. The standard deviations of the averaged data (blue curves in Fig. 6) for the upper four depths are 1.4 ‰ to 2.8 ‰ for and 0.8 ‰ to 1.5 ‰ for , which are significantly higher than that for the deepest sample (0.1 ‰ and 0.2 ‰). High variabilities at 10 cm scales have also been found in the continuous measurements of the GRIP core (in the BCTZ, Huber and Leuenberger, 2004) and EDML core (just below the BCTZ, Lüthi et al., 2010). Also, in the GRIP data, the variabilities of well below the BCTZ (∼2500 m depth) are much smaller than those in the lower BCTZ (∼1100–1400 m) (Huber and Leuenberger, 2004).
Major ion concentrations (Na+, Mg2+, Ca2+, Cl−, , and ) at 12.5 mm resolution from the two depths (1258 and 1399 m) are shown in Fig. 7. The Na+, Mg2+ and Ca2+ concentrations show similar variations, and they appear to be correlated with the gas records. For example, narrow dips in the ion concentrations at 1258.88–1258.89 and 1258.94–1258.95 m possibly correspond to the dips in the gas records. Another example is common dips in the Na+, Mg2+, Ca2+, Cl−, and concentrations and the gas data for 1399.17–1399.18 m. On the other hand, the Cl−, , and concentrations show smooth variations possibly due to their higher mobility in firn and ice. The correlation coefficients between the ion concentrations and gas ratios are summarized in Table 1. For calculating the correlation coefficients, the ion data are resampled to the depths of the gas data. Significant correlations with the gas data are found for the Na+, Mg2+, and Ca2+ concentrations.
Table 1Correlation coefficients between high-resolution gas data and ion concentrations within two 50 cm samples.
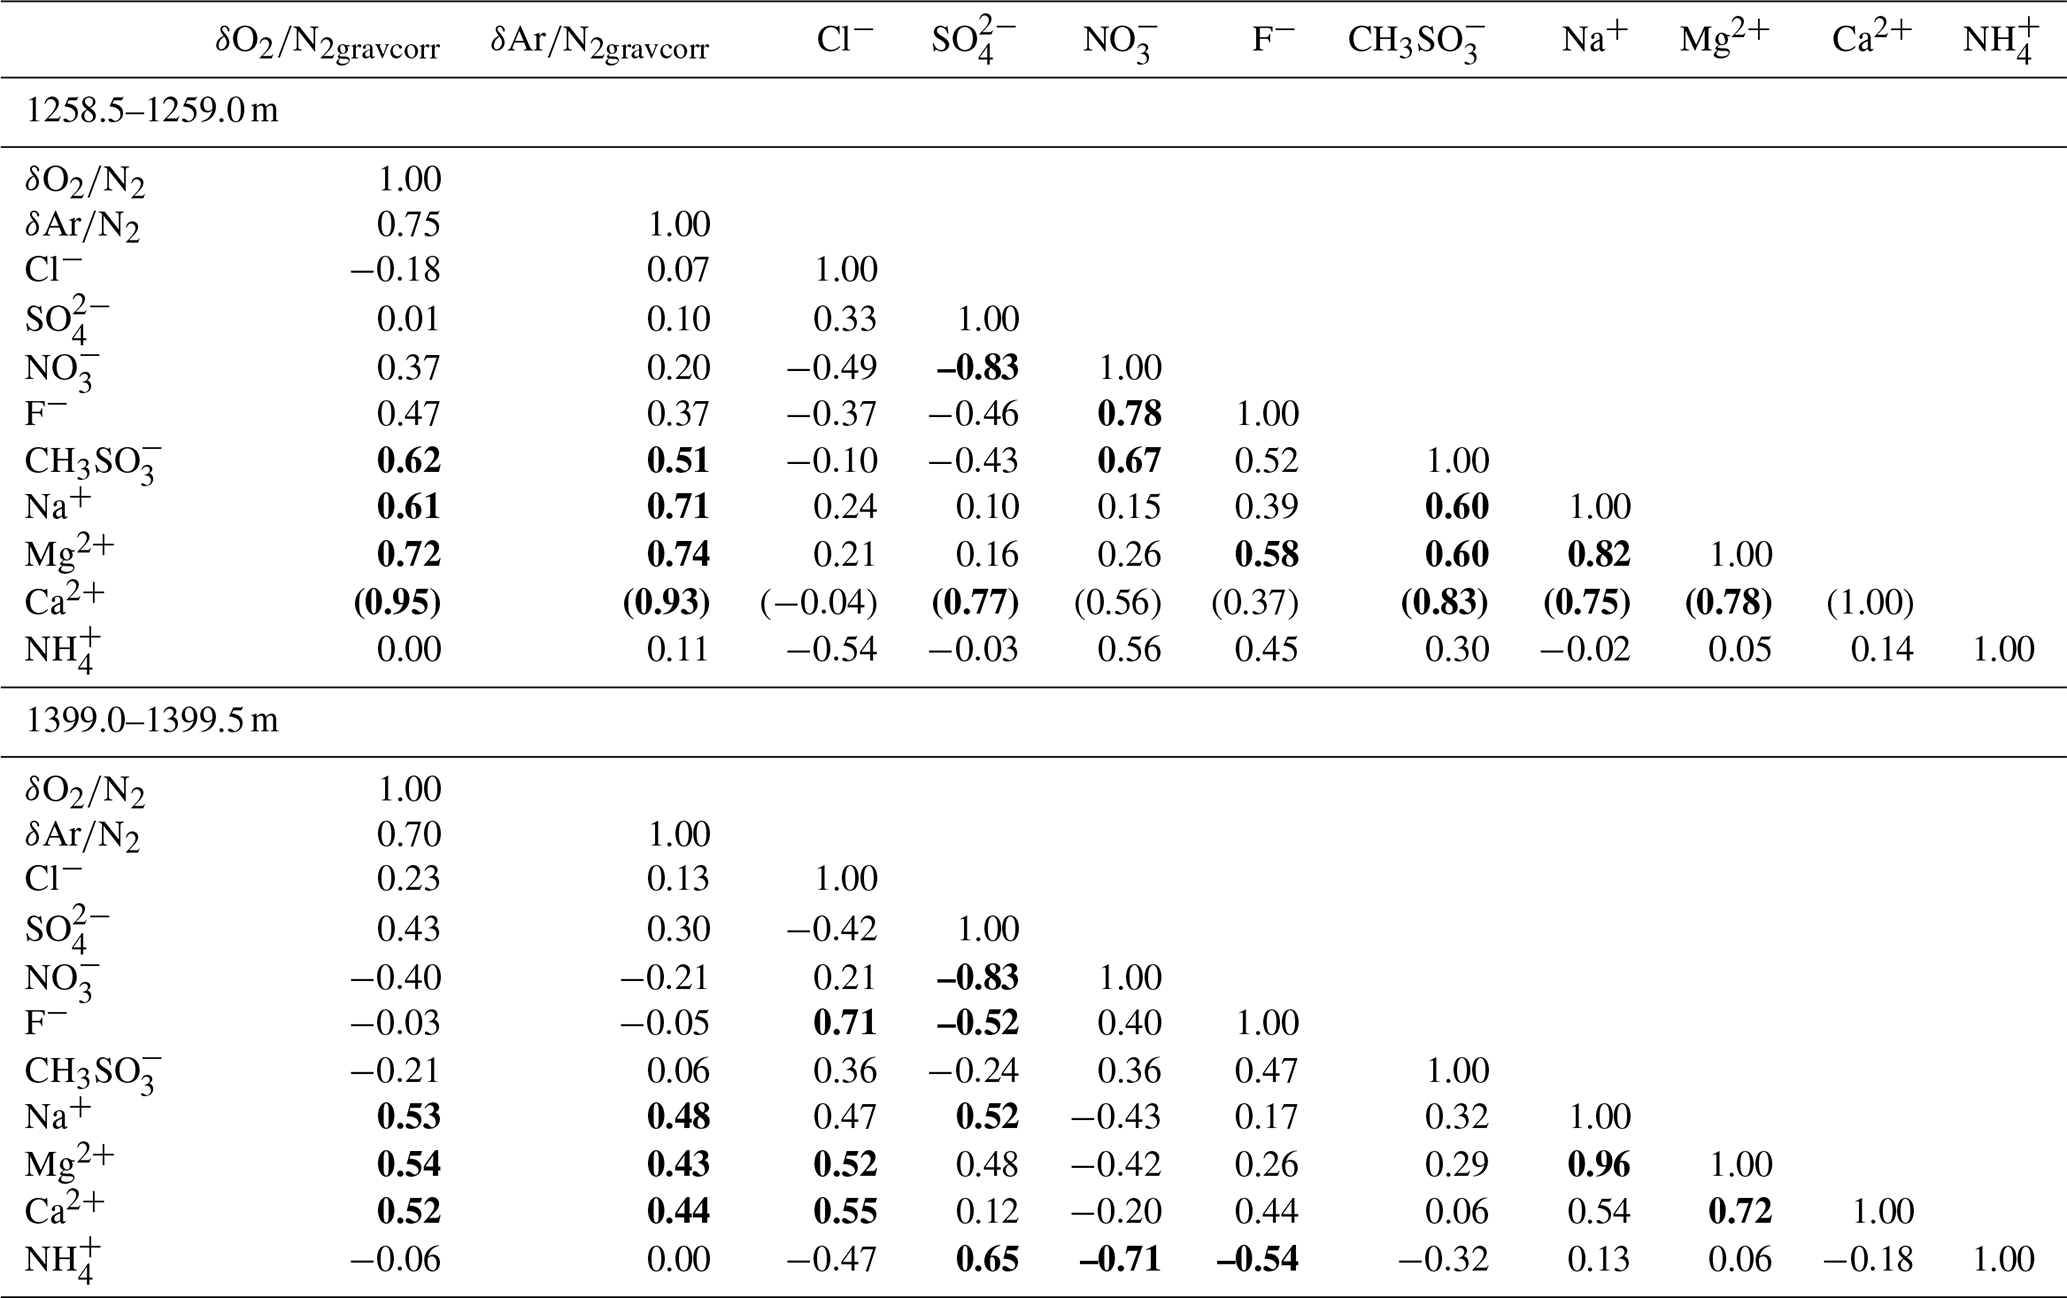
Bold numbers indicate significant correlations (p<0.05). Numbers in brackets are calculated using the data from the lower 20 cm (because of the experimental problem in the Ca2+ data).
3.4 Diffusion model
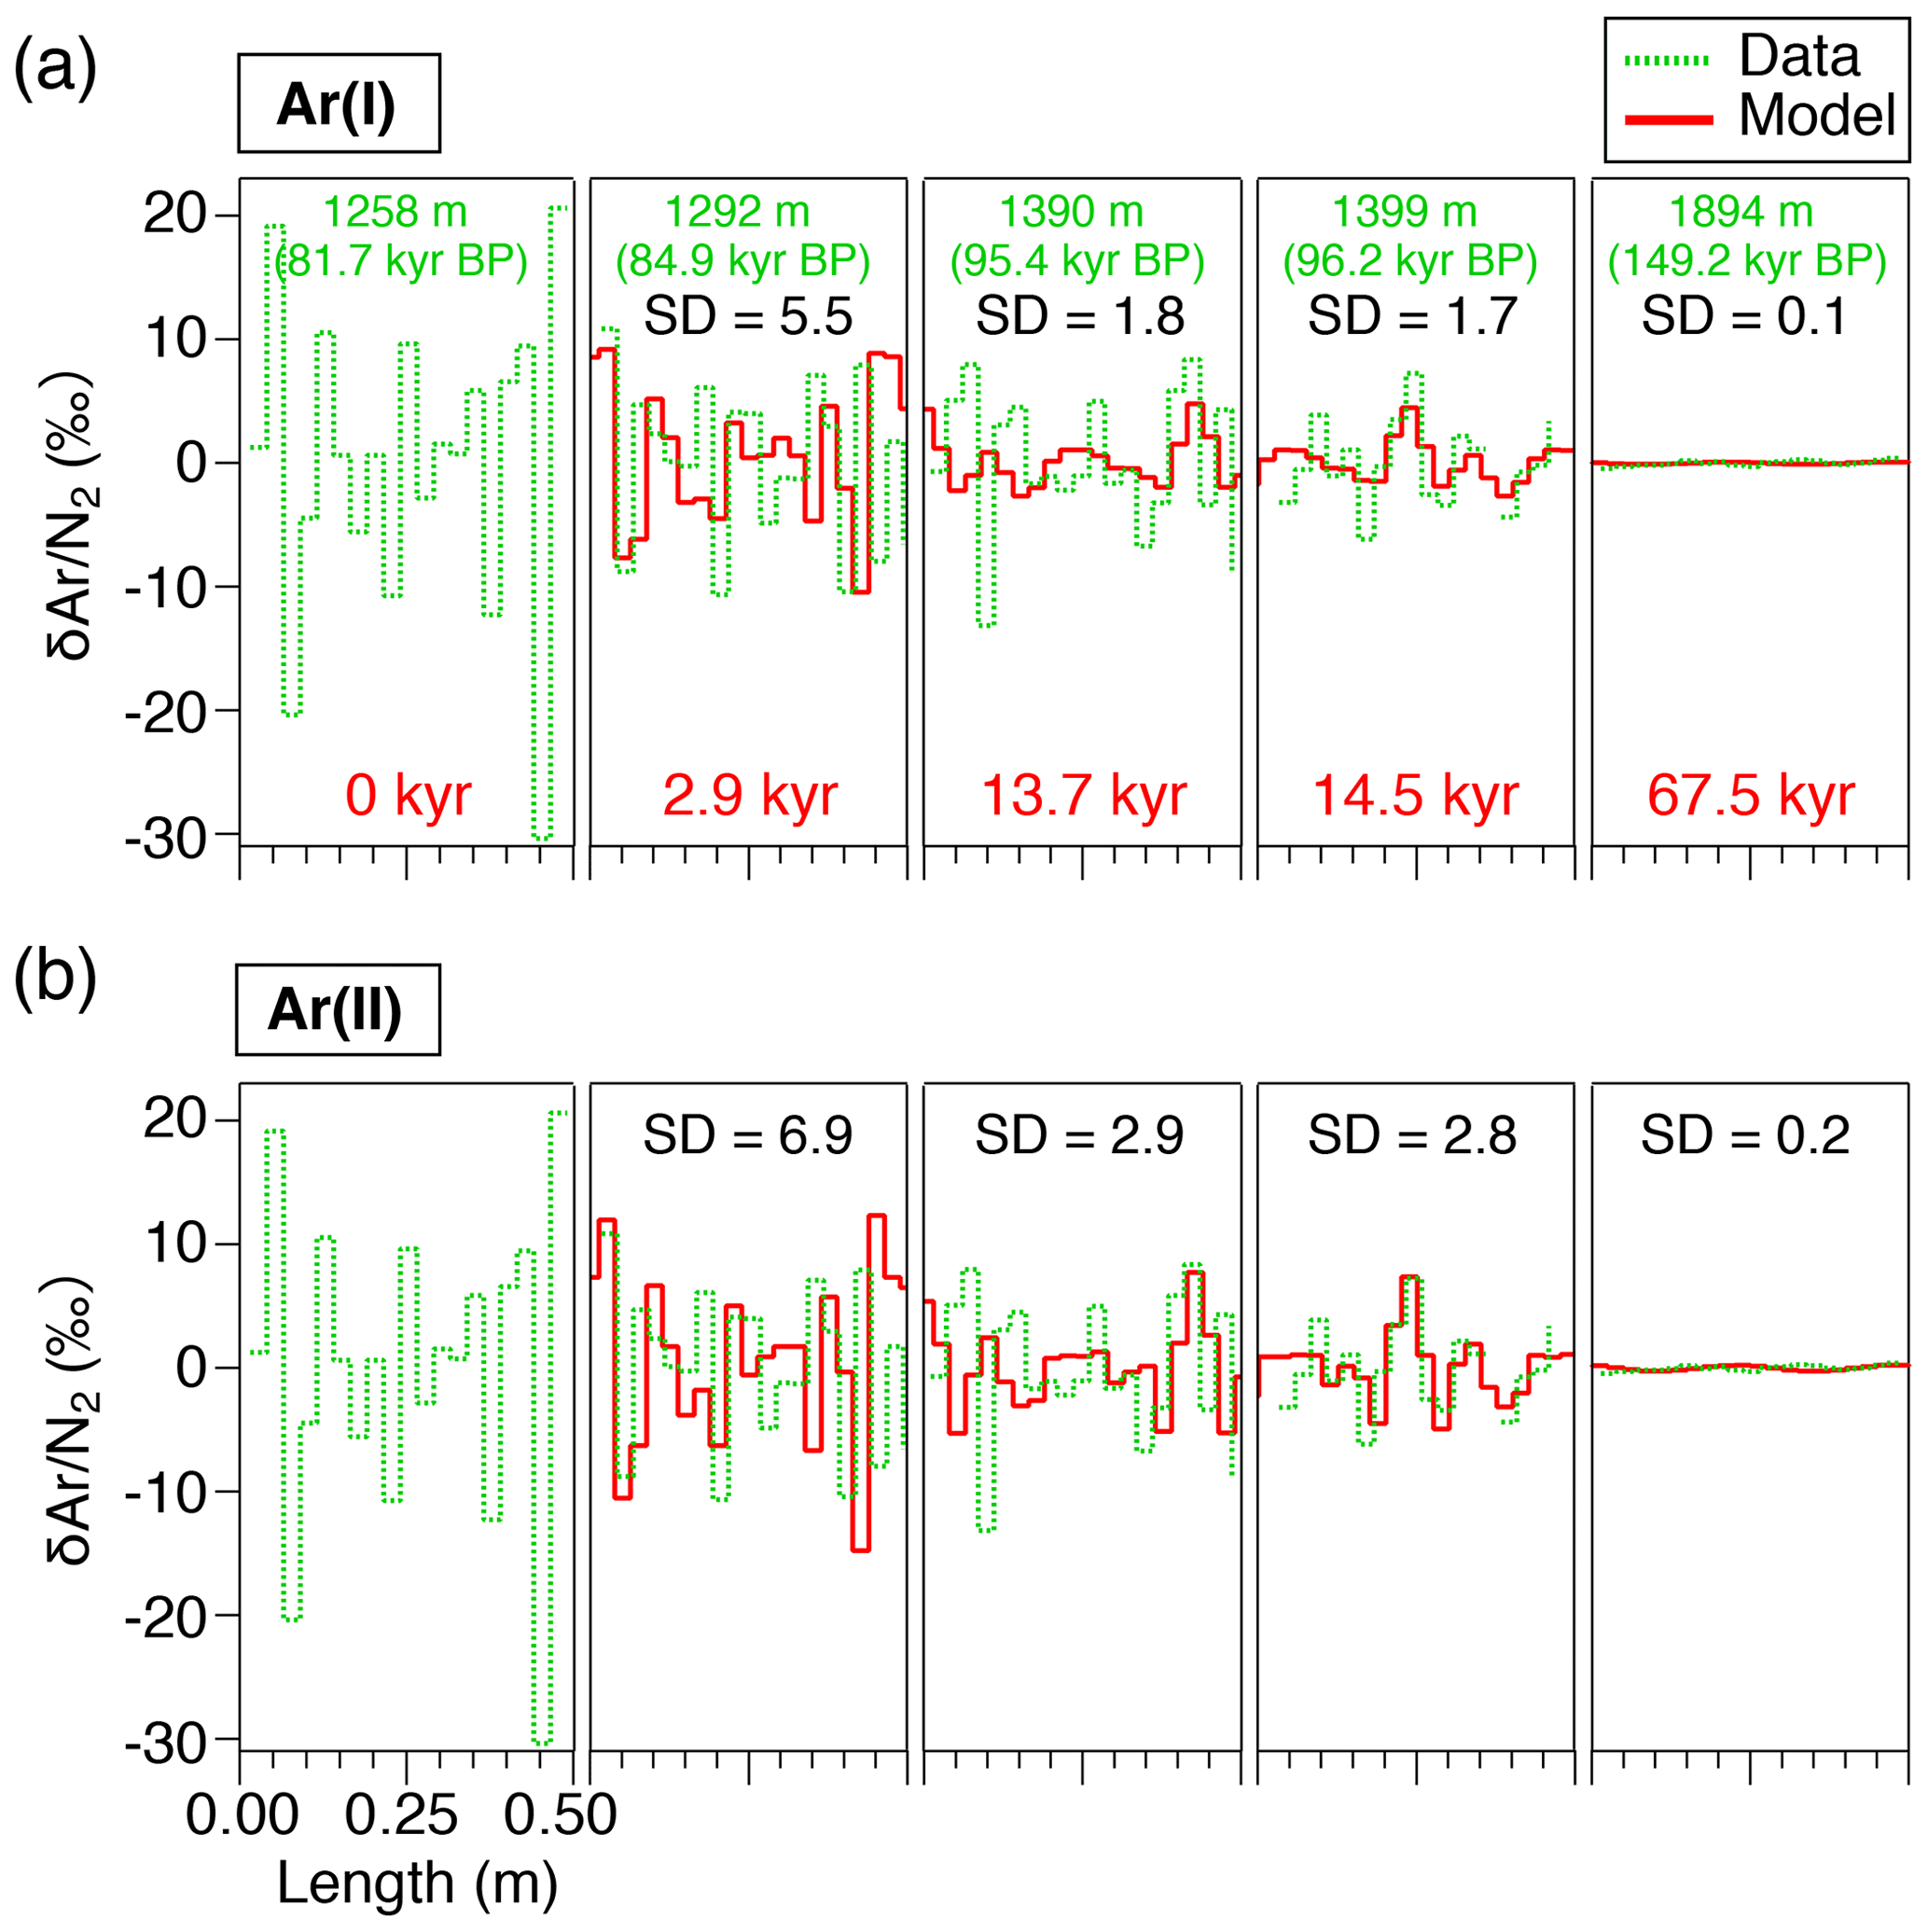
The results of the diffusion model for 2.9, 13.7, 14.5, and 67.5 kyr (at 1292, 1390, 1399, and 1894 m, respectively) after the initial state (81.7 kyr BP at 1258 m, Fig. 6) are resampled at 2.5 cm intervals and compared with the data (Fig. 8). The IkFk05 permeation parameters give the smoothest profiles with a poor agreement with the data (Fig. 8c). The IkFk01 parameters produce the profiles similar to the data at 1292 m, but the model results are too smooth at 1390 and 1399 m (Fig. 8b). The results with the Salm01 parameters agree well with the data, including rapid changes (>10 ‰) within a few consecutive samples and the standard deviation (∼3 ‰) at 1399 m (Fig. 8a). We note that the data at 1390 and 1399 m show rather different standard deviations (5.8 ‰ and 3.1 ‰) probably reflecting the original fractionations in the BCTZ. Thus, the model–data comparison is inadequate with the small number of cases. For Ar, the model results with the scaling function Ar(II) are closer to the data than those with Ar(I) (Fig. 9).
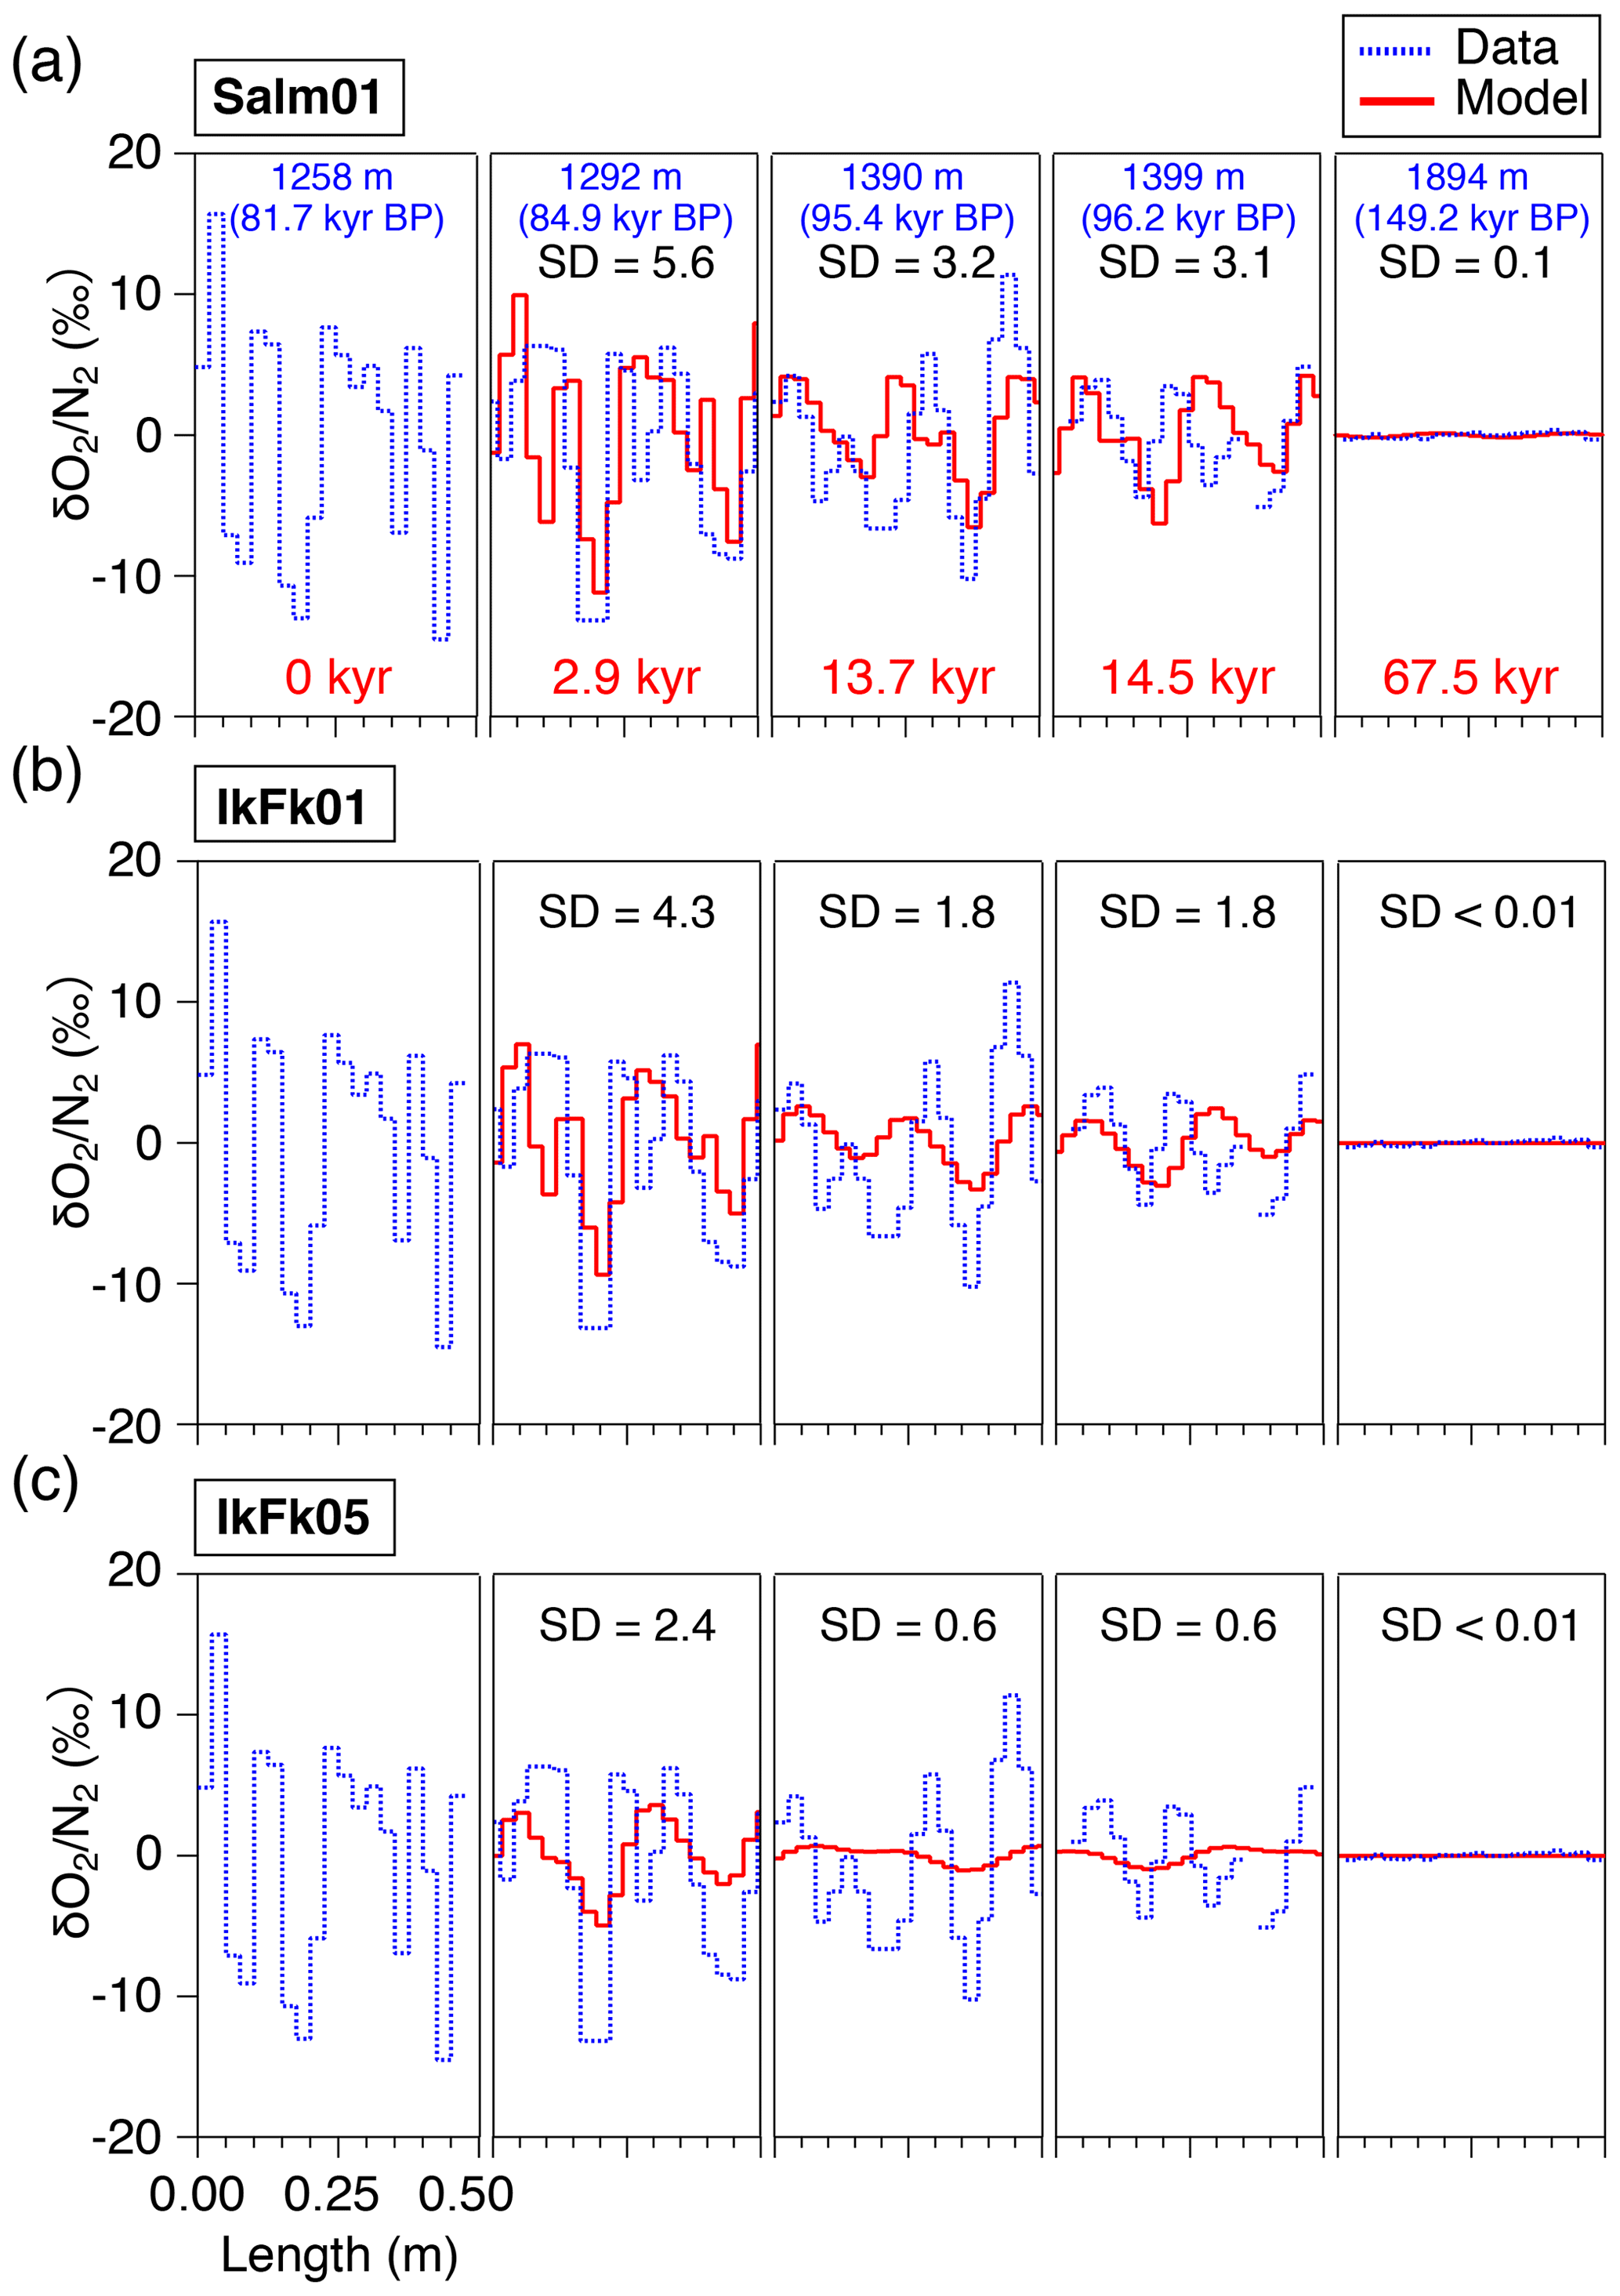
Figure 8Comparison of the diffusion model outputs for with different permeation parameters (red lines) and high-resolution data (dotted blue lines), at 1292, 1390, 1399, and 1894 m. The data at 1258 m were given to the diffusion model as the initial condition. Solid lines (red) are the model outputs at the elapsed time of 2.9, 13.7, 14.5, and 67.5 kyr, resampled at 2.5 cm intervals, to compare with the corresponding high-resolution data. SDs of the model results are shown in each panel.
4.1 Fractionation in firn
The and data below BCTZ show variations similar to the local summer insolation (Fig. 4). In addition, we find the possible insolation signals in the bubbly ice zone and upper BCTZ (see Sect. 3.1), as expected from the proposed link between the local summer insolation and close-off fractionation through the effects on the snow metamorphism (Bender, 2002; Fujita et al., 2009).
In the bubbly ice zone, the scatter of the data is significantly larger than that of the pair differences, probably reflecting high variabilities of natural close-off fractionation in the vertical direction. In the Dome Fuji region, firn layerings of several 10 cm are found in δ18O of ice, ion concentrations, and density (Hoshina et al., 2014; Fujita et al., 2016). The layers closed off deeper may be less depleted in O2 and Ar because (1) air bubbles spend a shorter time in the close-off zone, and (2) and are enriched deeper in the open pores (e.g., Severinghaus and Battle, 2006). Also, microbubbles may form near the surface (Lipenkov, 2000) and become extremely depleted in O2 and Ar (Ohno et al., 2021), also causing the and variations (Kobashi et al., 2015). Hereafter, we collectively call the natural fractionation during the firn densification and bubble formation as “close-off fractionation”.
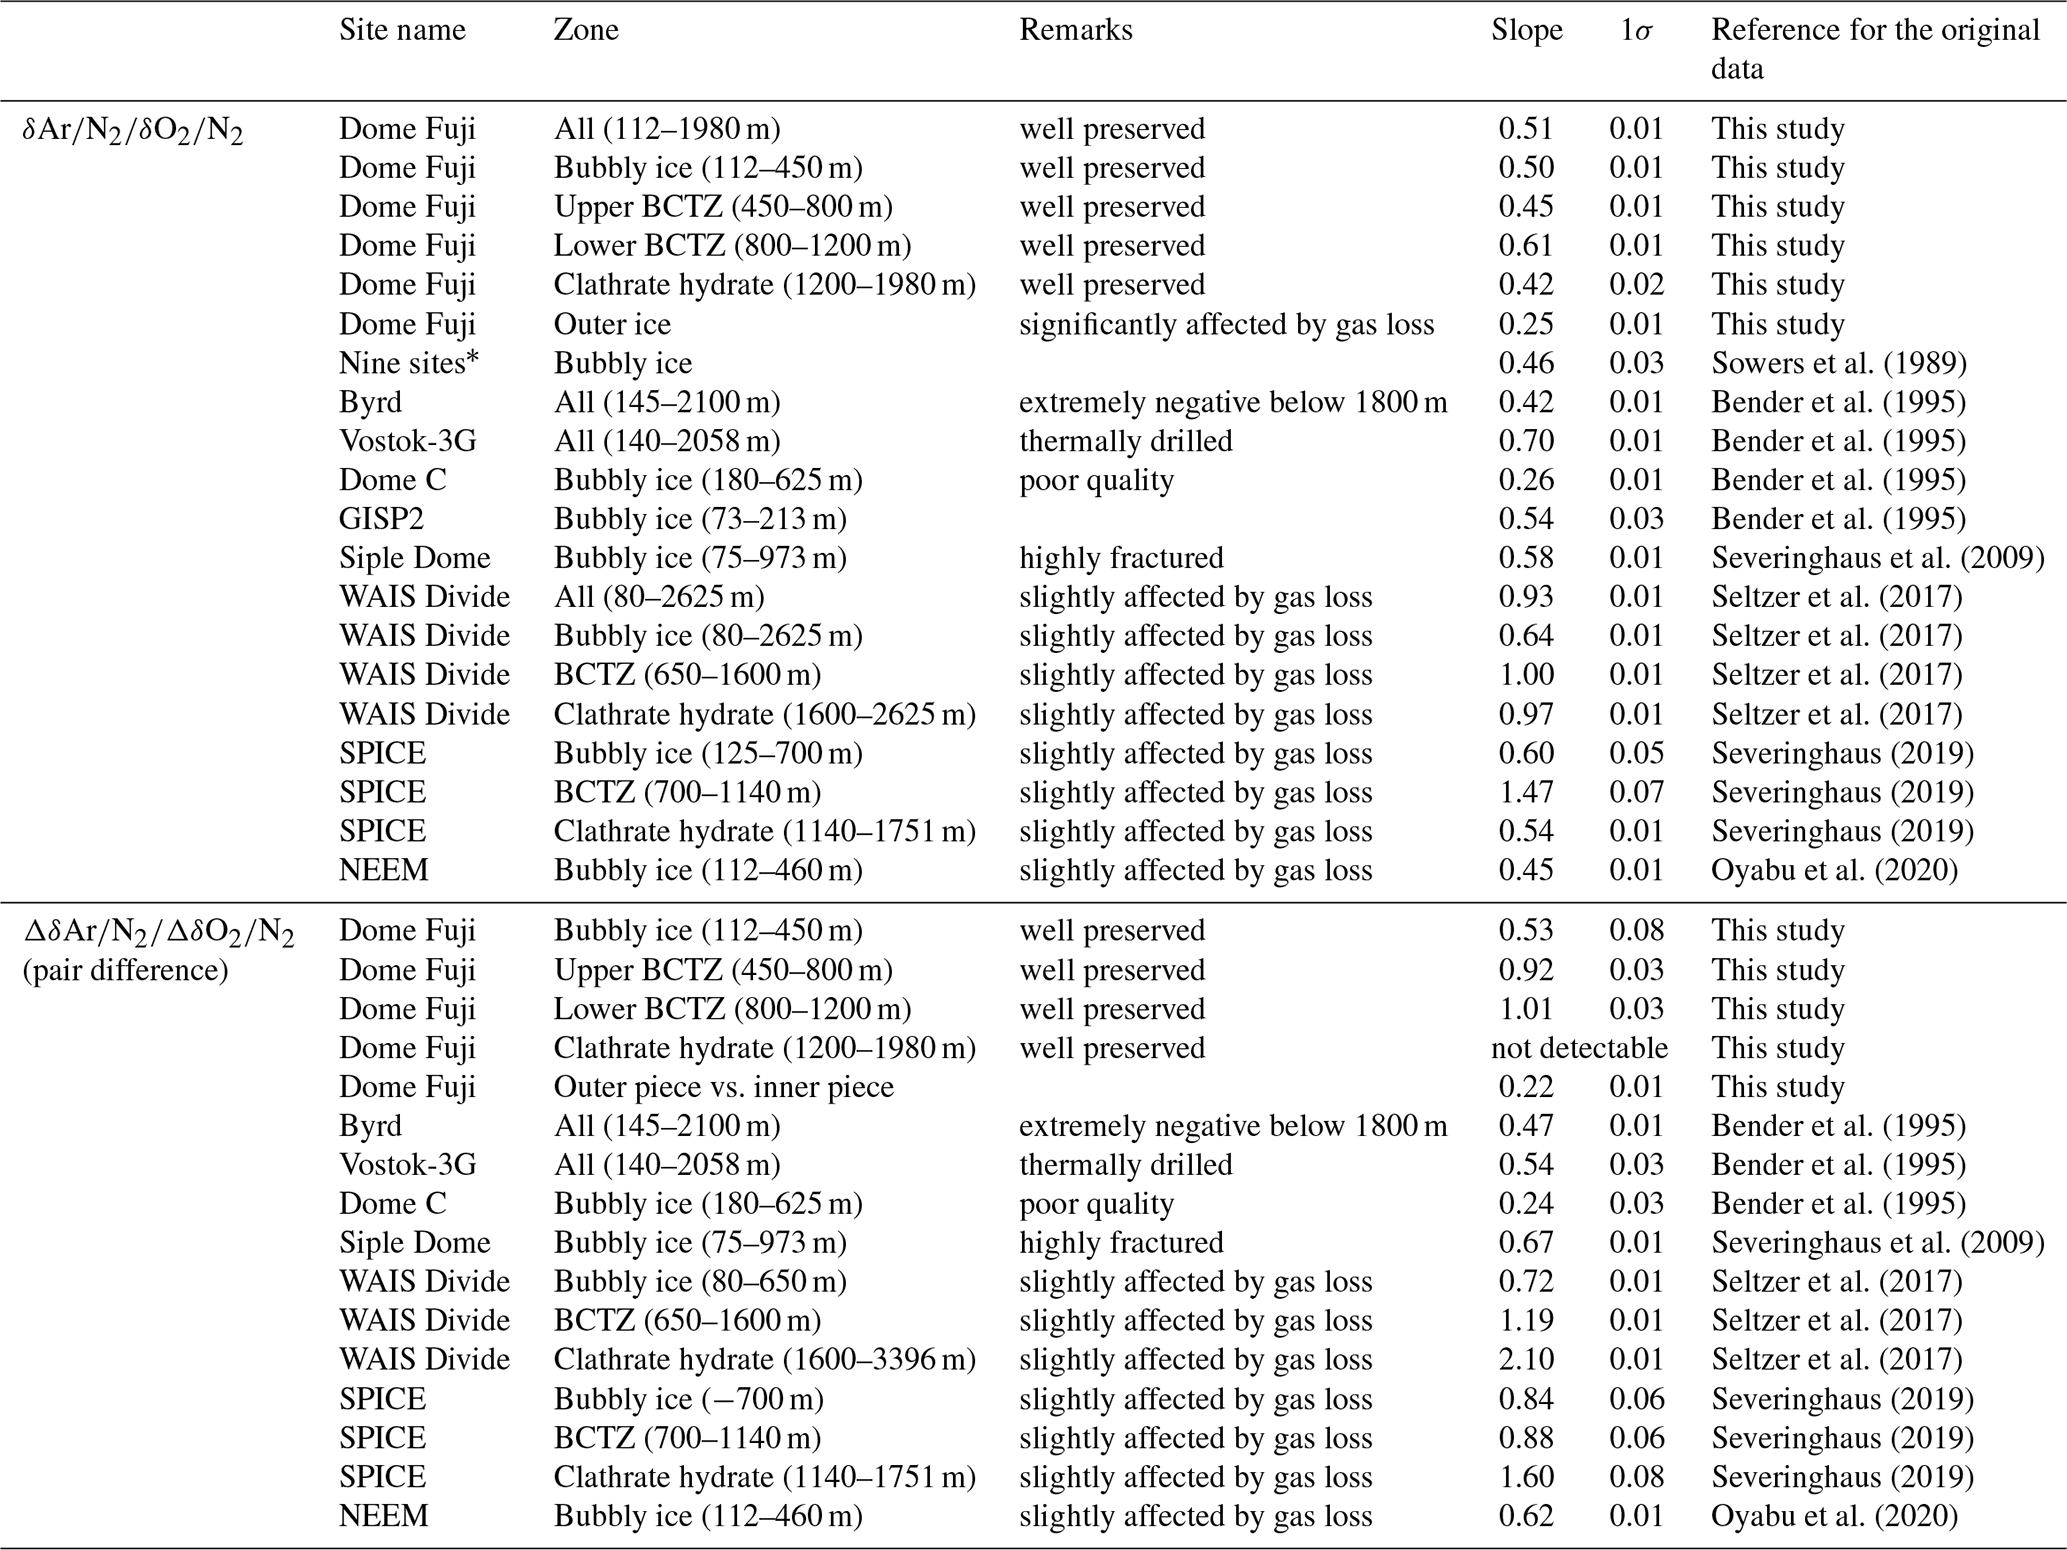
As discussed above, the relationship between and in our data is expected only to reflect natural fractionations. For bubbly ice, we find a high correlation between and with the slope of 0.50±0.01 (Fig. 10c, Table C2), which agrees with that of pair differences (0.53±0.04) (Fig. 10d, Table C2). The smaller fractionation for is consistent with the size-dependent fractionation. We find similar slopes in the upper BCTZ, lower BCTZ, and below the BCTZ (0.45±0.01, 0.61±0.01, and 0.42±0.02, respectively, Fig. 10e, g, and i, Table C2), despite large scatter in the lower BCTZ and just below the BCTZ (∼800–1480 m). We interpret the similarity of the slopes as preservation of the close-off fractionation signals through the BCTZ. The slight differences between the slopes in the different zones might arise from different temperature or accumulation rate in the past (affecting the close-off fractionation) or natural variations of O2 in the atmosphere.
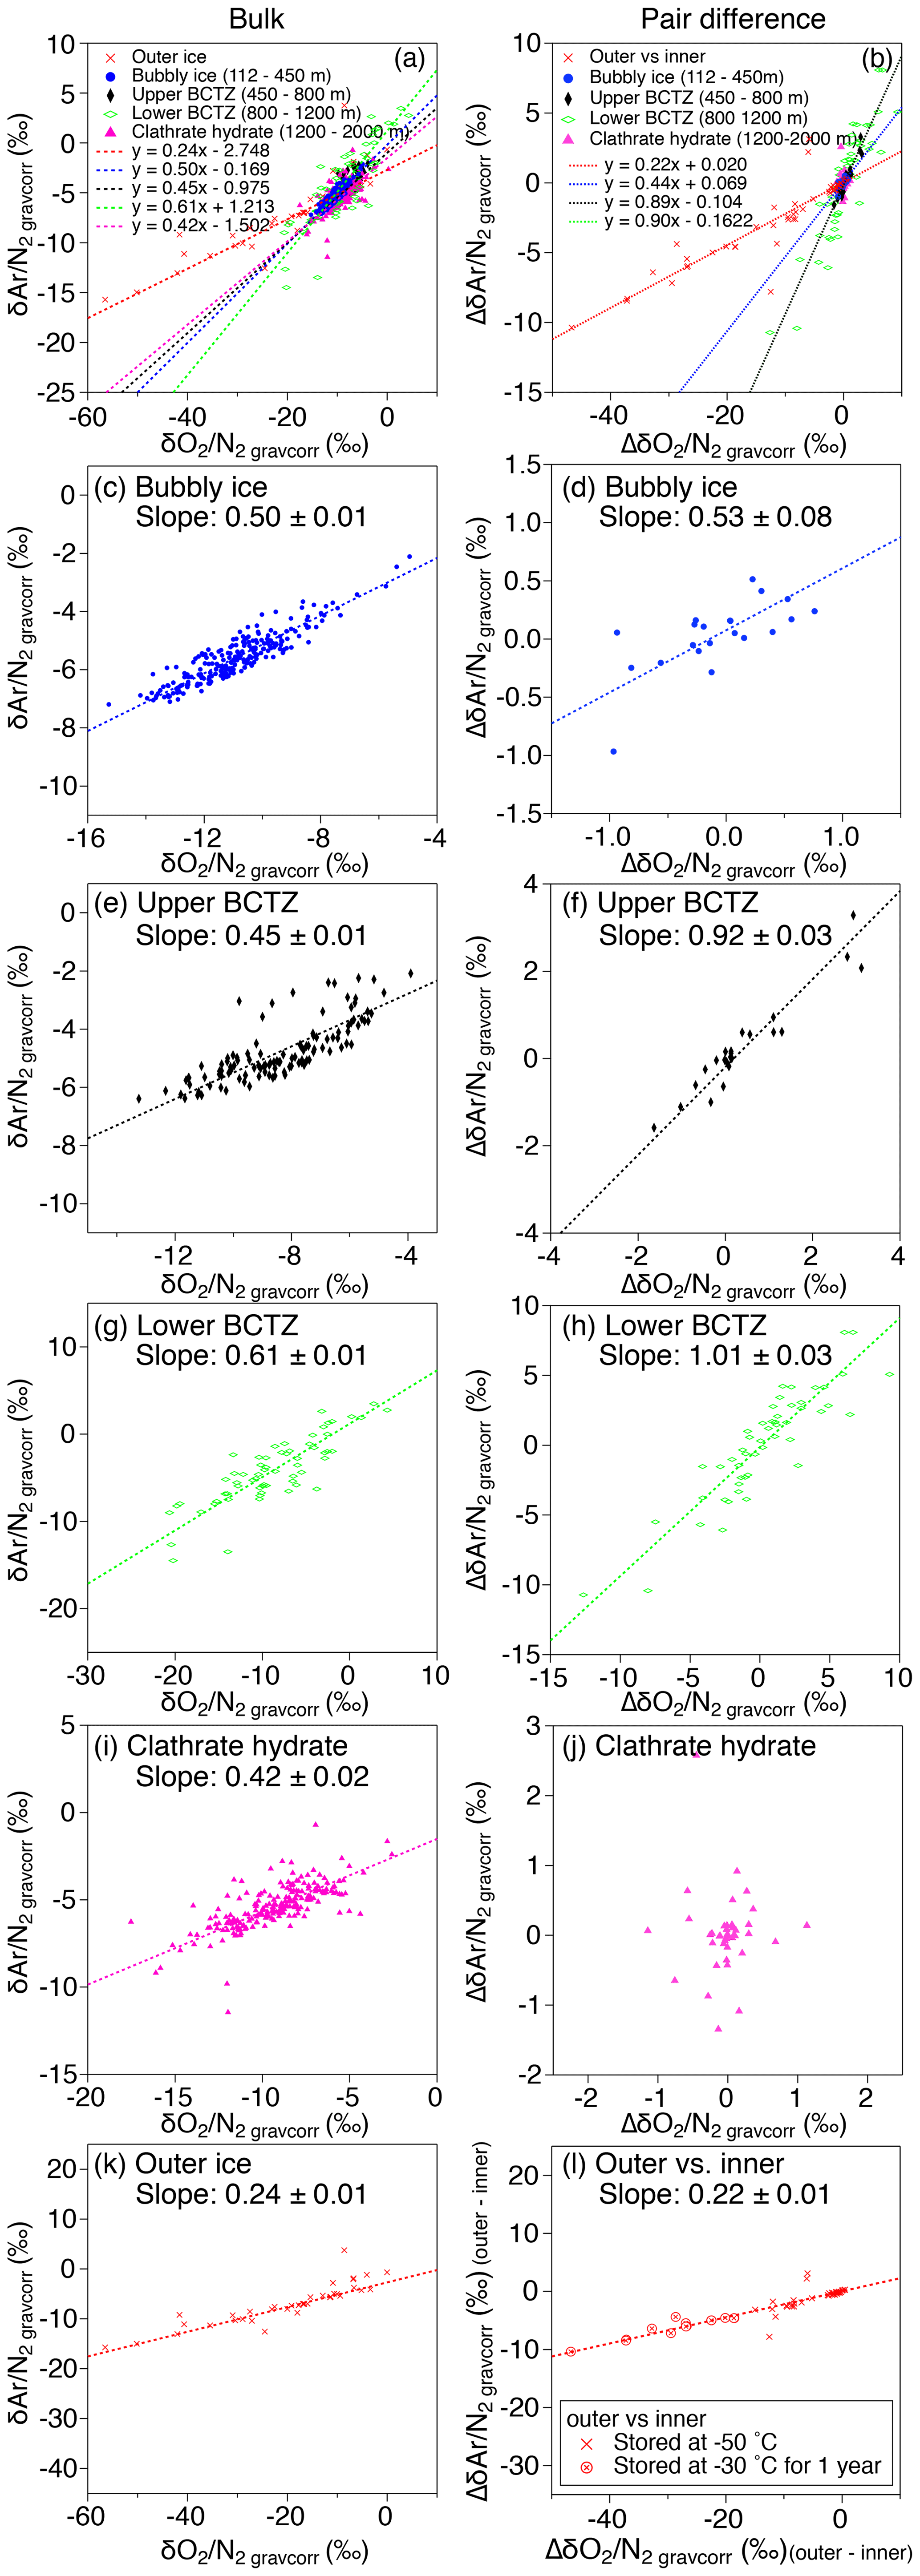
Figure 10Scatter plot of vs. (a, c, e, g, i, k) and that of pair differences of and (b, d, f, h, j, l). (a, b) All data, (c, d) bubbly ice zone (112–450 m), (e, f) upper BCTZ (450–800 m), (g, h) lower BCTZ (800–1200 m), (i, j) clathrate hydrate ice zone (1200–2000 m), and (k, l) outer ice (bubbly ice and clathrate hydrate ice).
A firn–air study at WAIS Divide (Battle et al., 2011) provided the evidence of mass-dependent fractionation associated with the close-off process with the slope of δ18O vs. of −0.0090 (‰ ‰−1). For the DF ice-core data, the pair differences in the bubbly ice zone (Fig. B5), as well as the data for the last 2000 years (Oyabu et al., 2020), do not show significant correlations between δ18O and . Thus, our data cannot verify the mass-dependent fractionation, and much higher precision is required to detect the δ18O change of ∼0.01 ‰ expected for the range of DF .
From the comparison of three Antarctic inland cores (EDC, Vostok, DF) that showed large short-term variabilities and discrepancies between the cores around the last interglacial period, Bazin et al. (2016) discussed the possibility of non-orbital-scale variabilities of close-off fractionation. In our data, the residuals of from the filtered curve are small ( ‰) below ∼1480 m (Fig. 3d), whereas the previous data (after gas-loss correction) show the variability of 1.3 ‰ for the similar depth range (Kawamura et al., 2007) (Fig. 5). Thus, the large short-term variabilities in the previous datasets may be mostly attributed to the poor ice-core quality, and the actual short-term variability of close-off fractionation may be rather small, at least for the DF core.
4.2 Bubble–clathrate transformation fractionation
In the upper BCTZ, the residuals of and from the low-pass-filtered curves exhibit scatter of ∼3 ‰ and ∼2 ‰ (peak to peak), respectively, which is much smaller than that in the lower BCTZ (Fig. 4). Pair differences are similar to those at the bottom of the bubbly ice zone, suggesting insignificant effects of the clathrate hydrate formation on the measured and until ∼40 % of air bubbles are transformed to clathrate hydrates. This may be reasonably explained by the dominance of direct conversion of air bubbles to clathrate hydrates (thus little displacements of molecules) in the early stages of bubble–clathrate transformation (Lipenkov, 2000). It may also be the case that the distance of gas diffusion from the bubbles to clathrate hydrates, even if it occurs, is too short to create scatter in the bulk and .
In the lower BCTZ, the scatter around the orbital-scale variations dramatically increases for and despite the sufficient removal of the outer ice (Figs. 3 and 4). Microscopic observations by Ohno et al. (2004) found layered distributions of air bubbles and clathrate hydrates in the lower BCTZ, as well as high spatial variability of total number of air inclusions on scales of a few millimeters, possibly due to diminishing bubbles by transferring their molecules to nearby clathrates. Using their number concentrations of air bubbles and clathrate hydrates, the average distance between air inclusions is estimated to be 1.1 mm. Thus, the distance of air migration associated with the bubble–clathrate transformation should be on this order. Ikeda-Fukazawa et al. (2001) observed extremely fractionated bubbles and clathrate hydrates in the lower BCTZ, up to about +1000 ‰ for clathrate hydrates and −740 ‰ for bubbles for . From these observations, we suggest that the highly fractionated bubbles and clathrate hydrates may be stratified in millimeter-scale layers, and that the scatter in our dataset may be produced by random inclusion of such fractionated layers at the top and/or bottom of the ice samples. For example, if a 100 mm long ice sample coincidentally includes a 1 mm thick anomalous layer with of +1000 ‰, the of the bulk sample should be elevated by ∼10 ‰ relative to the value without the anomalous layer. We indeed observe the residual of up to ∼10 ‰ in the lower BCTZ around the orbital-scale fitting curve. Thus, by simply analyzing longer samples, the scatter created by the thin anomalous layers should be reduced. We suggest that a sufficient sample length to reduce the scatter to an acceptable level is ∼50 cm, which would produce anomalies of up to ∼2 ‰. With this noise level in the data, the insolation signal should be reconstructed in the BCTZ, as seen in the somewhat scattered depths just below the BCTZ (1200–1480 m). We also emphasize that the removal of the gas-loss-fractionated outer ice is a prerequisite for the practice of averaging longer samples, for better reconstruction of average in the ice sheet.
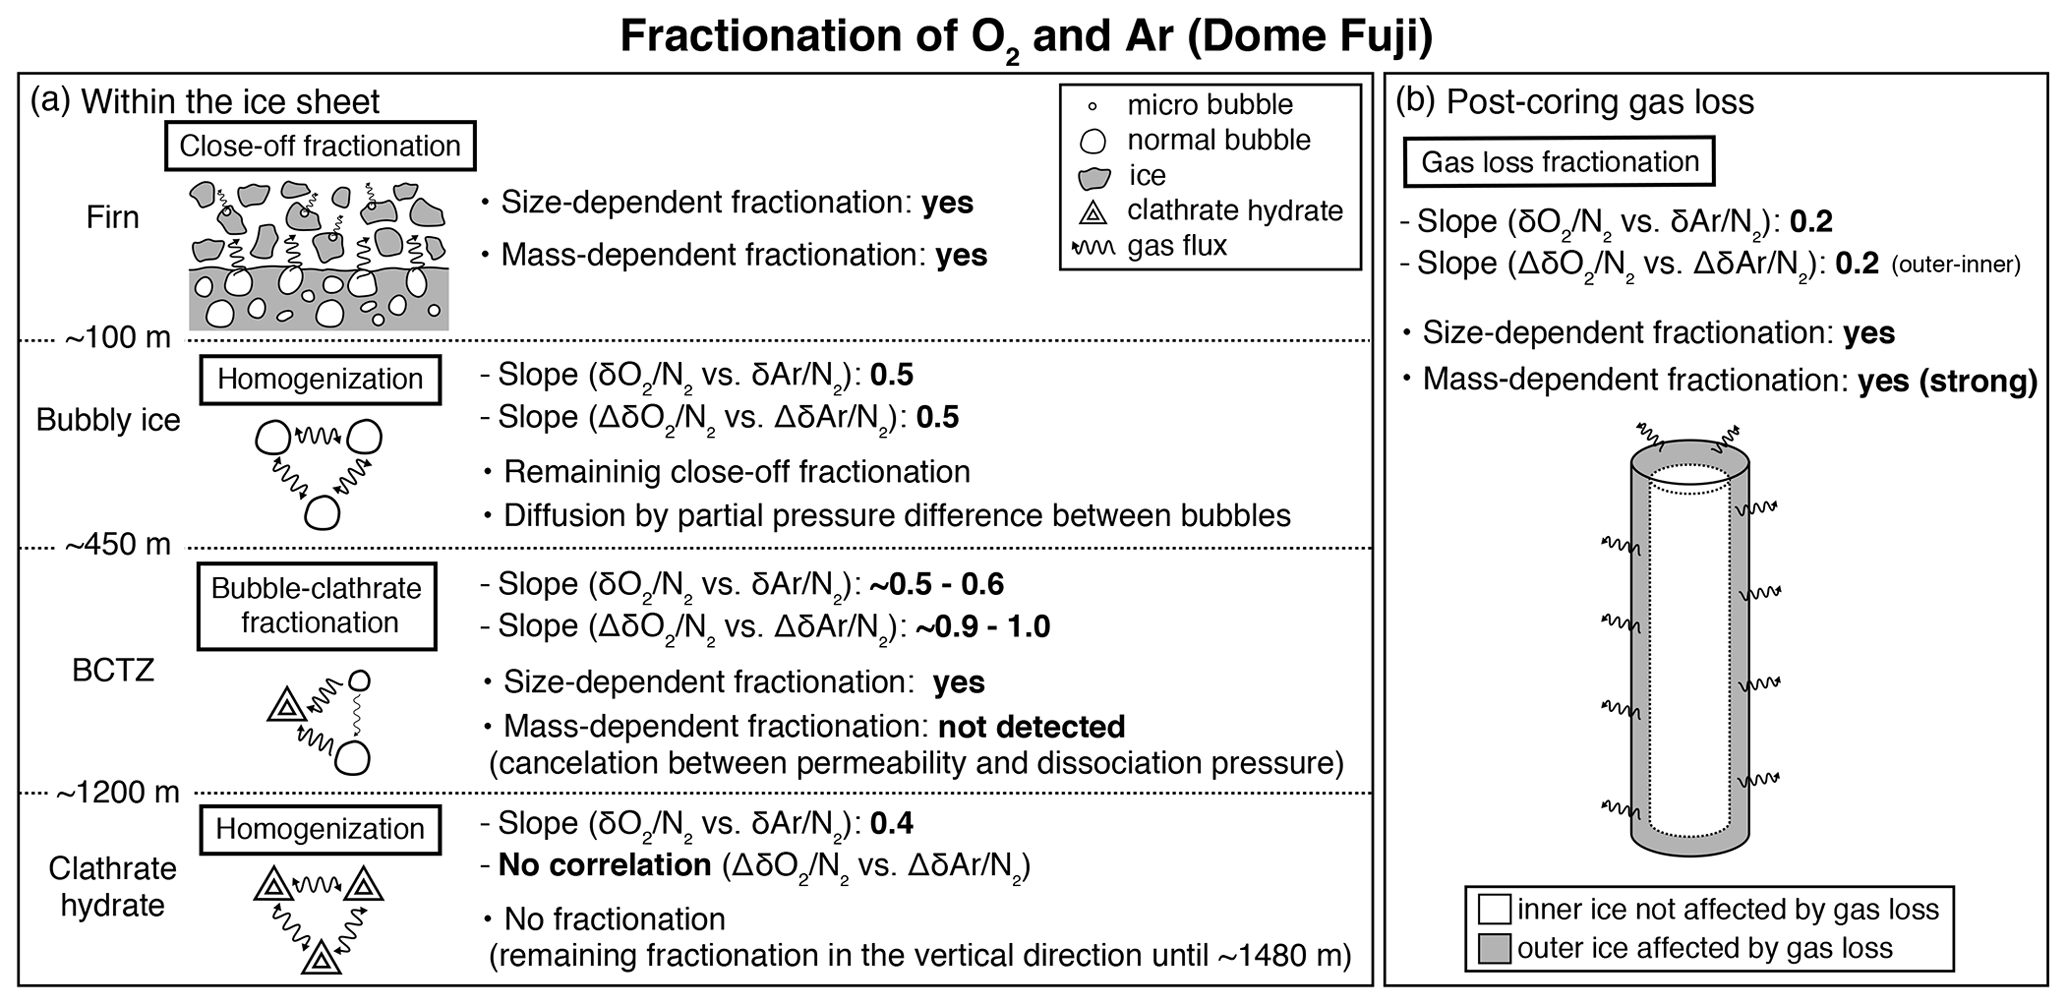
Figure 11Schematic of fractionations of O2 and Ar (a) within the ice sheet at Dome Fuji and (b) for the post-coring gas loss. The slopes were taken by the bulk data and the pair difference of and , respectively (see Fig. 10). The descriptions of “yes” indicate the observed results (this study; Severinghaus and Battle, 2006; Huber et al., 2006; Battle et al., 2011).
The slopes of vs. from the pair differences are close to 1 for both the upper and lower BCTZ (Fig. 10f and h, Table C2). They are strikingly different from the that in the bubbly ice (Fig. 10d, Table C2) and should be created by the fractionations associated with bubble–clathrate transition, because the amplitudes of Δ and Δ are larger than those in the bubbly ice by an order of magnitude. We also investigate the pair differences of δ18O vs. , which may be an indicator of mass-dependent fractionation. We find no correlation between Δδ18O and Δ with relatively wide ranges of Δ (up to 10 ‰, Fig. B5), indicating that the fractionation by the bubble–clathrate transformation is not mass dependent. This is clearly different from the known correlations between Δδ18O and Δ for bubble close-off (Battle et al., 2011) and post-coring gas loss (Severinghaus et al., 2009). Thus, we suggest that the net fractionation associated with the bubble–clathrate transformation and molecular diffusion between air inclusions within the ice sheet is mass independent, and that the bubble close-off and post-coring gas-loss fractionations include mass-dependent processes for molecules smaller than 3.6 Å such as He, O2, and Ar (Craig and Scarsi, 1997; Severinghaus et al., 2009) (Fig. 11). For the BCTZ, the mass fluxes of gases from bubbles to clathrates through ice may depend on permeation coefficient and dissociation pressure (Eq. 8 in Salamatin et al., 2001), with larger permeation coefficient and lower dissociation pressure leading to larger flux. Thus, for the case of Ar and O2, the lower permeation coefficient of Ar than that of O2 ( and m2 s−1 MPa−1 at 240 K, respectively) may be counteracted by the lower dissociation pressure of Ar than O2 (3.5 and 4.9 MPa at 240 K, respectively), to result in similar relative fractionation between bubbles and clathrates with respect to N2. This hypothesis may explain the observed similarity of and enrichment in clathrates. For the bubble close-off, such a cancellation cannot occur, explaining the observed that is only half as enriched as . The bubble close-off fractionation of small molecules (<3.6 Å molecular diameter) appears to be caused by permeation through the thin ice wall of freshly formed bubbles, which create both size-dependent and mass-dependent fractionations; Ikeda-Fukazawa et al., 2004; Severinghaus and Battle, 2006; Battle et al., 2011).
We find similar slopes (∼1) of Δ vs. Δ in the BCTZ of the WAIS Divide (Seltzer et al., 2017) and South Pole (Severinghaus, 2019) ice cores, although the samples have possibly experienced post-coring gas loss to some extent (Table C2). The fact that the different cores from a wide range of temperature show similar relationships between Δ and Δ may suggest that the permeation coefficients of O2 and Ar in ice have similar dependence on temperature.
4.3 Preservation of insolation signal through BCTZ
Below the BCTZ, the low-pass-filtered and show close resemblance to the variations of local summer insolation, although the residuals are rather scattered until 1480 m (Figs. 3 and 4). The large scatter probably originates in the extreme layered fractionation in the lower BCTZ. Until the conversion of bubbles to clathrate hydrates complete (at ∼1200 m), gas flux from the remaining (extremely fractionated) bubbles to clathrate hydrates should continue and enhance the inhomogeneity of gas composition. Once all bubbles disappear, the gas flux occurs only between clathrate hydrates; thus, their compositions become gradually homogenized. The major homogenization finishes within 300 m (∼25 kyr) below the BCTZ, and further homogenization continues to ∼500 m (∼50 kyr) below the BCTZ where the scatter becomes small and stable (±0.2 ‰) (Figs. 3d, e and 12).

Figure 12Diffusive smoothing of (a) and (b) below the BCTZ. Open markers with dashed lines (gray) are the residuals from the low-pass-filtered data. Black lines are exponential fits through the residuals for >5600 years (corresponding to the model's initial age). The model results (standard deviations of 11 cm resampled outputs) with the best permeation parameters are shown by solid red lines. Blue and green lines are the other model results.
In contrast to the scatter from the 11 cm samples discussed above, the pair differences decrease sharply at the bottom of BCTZ (Fig. 3f and g), suggesting smaller spatial variability of gas composition in the horizontal direction. The 2.5 cm continuous data from the four 50 cm samples (1258 to 1399 m) also show much higher variabilities (5 ‰–10 ‰ difference between neighboring samples) than the pair differences (Figs. 3f, g and 6). Thus, our data consistently show the large anisotropy of gas fractionation, as expected from the layered clathrate hydrate formation in the BCTZ (Ohno et al., 2004). The positive correlations between the gas ratios and Na+, Mg2+ and Ca2+ concentrations are consistent with the suggestion by Ohno et al. (2010) that nucleation of clathrate hydrates tends to occur in the layers with abundant micro-inclusions, because the elements Na, Mg, and Ca likely exist as water-soluble salts (Oyabu et al., 2014, and references therein). Thus, the high-micro-inclusion layers may create early clathrate nucleation, which attract O2 and Ar from air bubbles in the adjacent layers with fewer micro-inclusions and increase their and . The same conclusion was reached by Huber and Leuenberger (2004) (albeit with ∼50 times larger measurement uncertainties than ours), based on the quasi-annual cycles in the and in the GRIP ice core, Greenland, and their similarity to Ca2+ concentrations.
The molecular diffusivities should depend on the direction in the ice sheet and also contribute to the horizontal homogeneity. The c-axis orientation gradually becomes clustered around the vertical, and the crystal grains become horizontally elongated, by the vertical compression within the ice sheet (Azuma et al., 2000). In terms of molecular diffusion through ice matrix, the diffusivity in the direction perpendicular to the c axis is greater than that in the direction parallel to the c axis (Ikeda-Fukazawa et al., 2004). For the diffusion along grain boundaries, the pathway should be shorter in the horizontal direction due to the crystal elongation. In addition, lattice defect and dislocation within ice crystals tend to develop along the basal plane (Hondoh, 2009), possibly providing another pathway for gas diffusion. All these mechanisms should contribute to preferential homogenization of gases in the horizontal direction.
This study, for the first time, directly compares the diffusion model results with the detailed and in the ice sheet. The model could reproduce the smoothing of layered gas compositions as seen in the high-resolution continuous data (Figs. 8a and 9b). Also, the relationships between and in different zones (bubbles, BCTZ, and clathrates) are similar to each other (slope of around 0.5) (Fig. 10). From these observations, we conclude that the large scatter just below the BCTZ originates in layered gas fractionations in the lower BCTZ, and that the subsequent decrease of scatter is due to diffusive homogenization (Fig. 11). Thus, we favor the possibility that the recording mechanism of insolation variations at Dome Fuji was intact when the layers in the modern BCTZ and below were initially formed at the past firn–ice transition.
We also analyze our data in a similar manner to the work by Bereiter et al. (2014). The standard deviations of the model results resampled at 11 cm intervals are compared with the residual and data from the low-pass-filtered curves (Fig. 12) (following Bereiter et al., 2014). Exponential fitting curves through the residual data (black line) are in close agreement with the model results of the Salm01 and Ar(II) permeation parameters. On the other hand, the model results with the other parameters (IkFk01, IkFk05 and Ar(I)) show a too-rapid decrease of scatter in comparison with the data. Therefore, our datasets (high-resolution and normal datasets) consistently support the Salm01 and Ar(II) permeation parameters at around 240 K (temperature at DF for the simulated depths).
From the Salm01 parameters, the rate of diffusive migration is on the order of 0.1 mm per 10 kyr (10−10 m s−1). Therefore, we favor the interpretation that the extreme scatter of and in the BCTZ in our datasets is caused by millimeter-scale inhomogeneity of the compositions of air inclusions combined with the finite sample length, rather than by centimeter-scale bulk migration of gas molecules. We also suggest that the original insolation signal on and in the BCTZ may be reconstructed by analyzing long ice samples (>50 cm) to average out the inhomogeneity (see Sect. 4.2).
4.4 Gas-loss fractionation
In the outer ice, the and are significantly depleted and δ18O is enriched due to post-coring gas loss, with higher storage temperature leading to larger fractionation (Fig. B4). The slope of Δ vs. Δ is 0.22 (Fig. 10l, Table C2), which is significantly smaller than those from the pairs of inner ice, suggesting that the process for gas loss is different from natural fractionation processes within the ice sheet. The slope of Δδ18O vs. Δ is −0.0083 (Fig. B5), which is similar to those previously reported for artifactual gas loss from the Siple Dome (Severinghaus et al., 2009), WAIS Divide (Seltzer et al., 2017), and EDC (Extier et al., 2018) ice cores.
Severinghaus et al. (2009) extensively measured the Siple Dome ice core and found a tight relationship between Δ and Δ with the slope of ∼0.5, which was also typical for other ice cores that experienced large gas loss (Sowers et al., 1989; Bender et al., 1995). The slope of ∼0.5 may be the combination of size-dependent fractionation (e.g., 1:1 for and ) and mass-dependent fractionation (1:3 for and ) (Severinghaus et al., 2009). The slope for the DF gas-loss fractionation (∼0.2) is significantly smaller than most of the previous values, implying that mass-dependent fractionation may be more important for the storage condition of the DF core (Fig. 11). Significant mass-dependent fractionation is expected for gas loss through microcracks (Bender et al., 1995). Thus, there may have been microcracks in the outer ice, although we did not observe visible cracks. The insensitivity of δ15N to gas loss, consistent with earlier findings, may be explained by viscous flow for N2 or molecular-size-limited diffusion through ice matrix (Severinghaus et al., 2009).
4.5 Optimal storage and sampling strategy
We discuss here the recommended practices for the storage and measurement of a newly drilled ice core based on our data. For long-term storage, it is more advantageous to have a larger ice-core cross section and lower temperature. Based on our Dome Fuji data (∼1 cm from the surface is affected by the gas loss at −50 ∘C after 20 years), a square cross section of 3×3 cm seems sufficient in a −50 ∘C storage, for sampling a central part (cross section of 1×1 cm or more) that is unaffected by the post-coring gas loss. The temperature of −50 ∘C was originally selected for inhibiting the clathrate hydrate dissociation due to the relaxation of ice matrix during long-term ice-core storage (Uchida et al., 1994). To obtain high-quality and data, it is recommended to test the real ice-core samples to find sufficient removal thickness. The removal thickness can be determined by examining the pair differences of with different surface removal thicknesses (e.g., 5 and 8 mm or 3 and 5 mm; Oyabu et al., 2020), which should be within the measurement uncertainty. Five pairs or more for a given combination of removal thicknesses would be required to make the assessment.
The length of a sample is also an important ice-core-specific factor, especially for reasonably averaging the high scatter in the BCTZ. We speculate that the reasonable sample length in the BCTZ to obtain a clear insolation signal may be more than 50 cm for the Dome Fuji ice core. We note that this length should be different for different ice cores because the thicknesses of the alternating layers of high and low clathrate concentrations should be different at different sites (Lüthi et al., 2010; Shackleton et al., 2019). To find a reasonable sample length for a core, it is advisable to continuously measure a ∼1 m long section with a ∼2 cm resolution and examine various averaging lengths. The sample length should also be larger than one annual layer thickness to average out the seasonal layering (especially important for the cores with high accumulation rates).
The variations of and within the ice sheet from bubbly ice to clathrate hydrate ice at Dome Fuji are reconstructed without post-coring gas-loss signals. Their variations in the bubbly ice zone, upper BCTZ, and below the BCTZ show close similarity to the local summer insolation. Our data from the clathrate hydrate ice zone agree with the previous data after the gas-loss correction (Kawamura et al., 2007), with much less scatter, demonstrating that the original air composition is preserved in the ice core stored at −50 ∘C.
The large scatter in the lower BCTZ may be created by millimeter-scale vertical inhomogeneity of air composition combined with finite sample length. The insolation signal originally recorded at the bubble close-off remains through the BCTZ, and the insolation signal may be reconstructed by analyzing long ice samples (>50 cm).
Below the BCTZ, the scatter around the orbital-scale variability decreases with depth. The high-resolution analyses of five 50 cm segments show decreasing centimeter-scale variability of and with depth, suggesting diffusive smoothing. A one-dimensional gas diffusion model reproduces the smoothing in this zone with the permeation coefficients of Salamatin et al. (2001).
The slope of the pair differences of to is about 1 in the BCTZ, and no correlation is found between those of δ18O and , suggesting that the O2 and Ar fractionations associated with the bubble–clathrate transition are mostly mass independent (Fig. 11). On the other hand, the slope for the bubble close-off process is around 0.5, suggesting a combination of mass-independent and mass-dependent fractionation for O2 and Ar. For the BCTZ, the slower molecular diffusion of Ar than O2 may be canceled by the lower dissociation pressure of Ar than O2, which should produce a steeper Ar partial pressure gradient from the bubbles to the growing clathrate. For the bubble close-off of small molecules, such a cancellation cannot occur, and both the bond-breaking mechanism and the interstitial mechanism may play roles for the molecular diffusion through the thin ice wall of fresh bubbles. The slope is small (0.2) in ice that experienced large gas loss, suggesting that mass-dependent fractionation may be important for the storage condition of the DF core.
The primary application of the record has been the orbital tuning of the ice-core age scales. In the future, high-precision and data of the Dome Fuji core may be obtained with our technique for precise orbital tuning of the ice core. The high-precision data may also provide non-insolation signals on the gases and eventually be useful for reconstructing past atmospheric oxygen and argon concentrations.
More observational and theoretical work is still needed for advancing our understanding of the mechanisms of gas movements in different zones in the ice sheet. For example, the current precisions of ice-core measurements of δ18O of O2 and δ40Ar are insufficient for detecting mass-dependent fractionation during bubble close-off and bubble–clathrate transformation processes (note that the mass-dependent fractionation of δ18O during bubble close-off was evidenced by the WAIS Divide firn–air data, Battle et al., 2011). Theoretical works including molecular dynamics simulations for different gases and ice conditions may shed light on the different relationships between and in different zones. Finally, the International Partnership for Ice Core Sciences regards the retrieval of an ice core containing ice older than 1 million years as highest priority (Fisher et al., 2013; Tsutaki et al., 2021). Our constraints on the permeation coefficients of the gases in ice might be useful for predicting the magnitude of diffusive smoothing of air composition in such an ice core.
The time-varying inputs for the model are temperature and thinning function. The temperature is used to calculate dissociation pressure and diffusion constants, and the thinning function is used to determine box size. There is no tunable parameter in the model.
A1 Parameters for Ar dissociation pressure
Because there are no published values for aAr and bAr, we found them by fitting the dissociation pressures of argon hydrate vs. temperature measured by Nagashima et al. (2018) with Eq. (4) (Fig. A1). The aAr and bAr are 3.63 and 739.5, respectively.
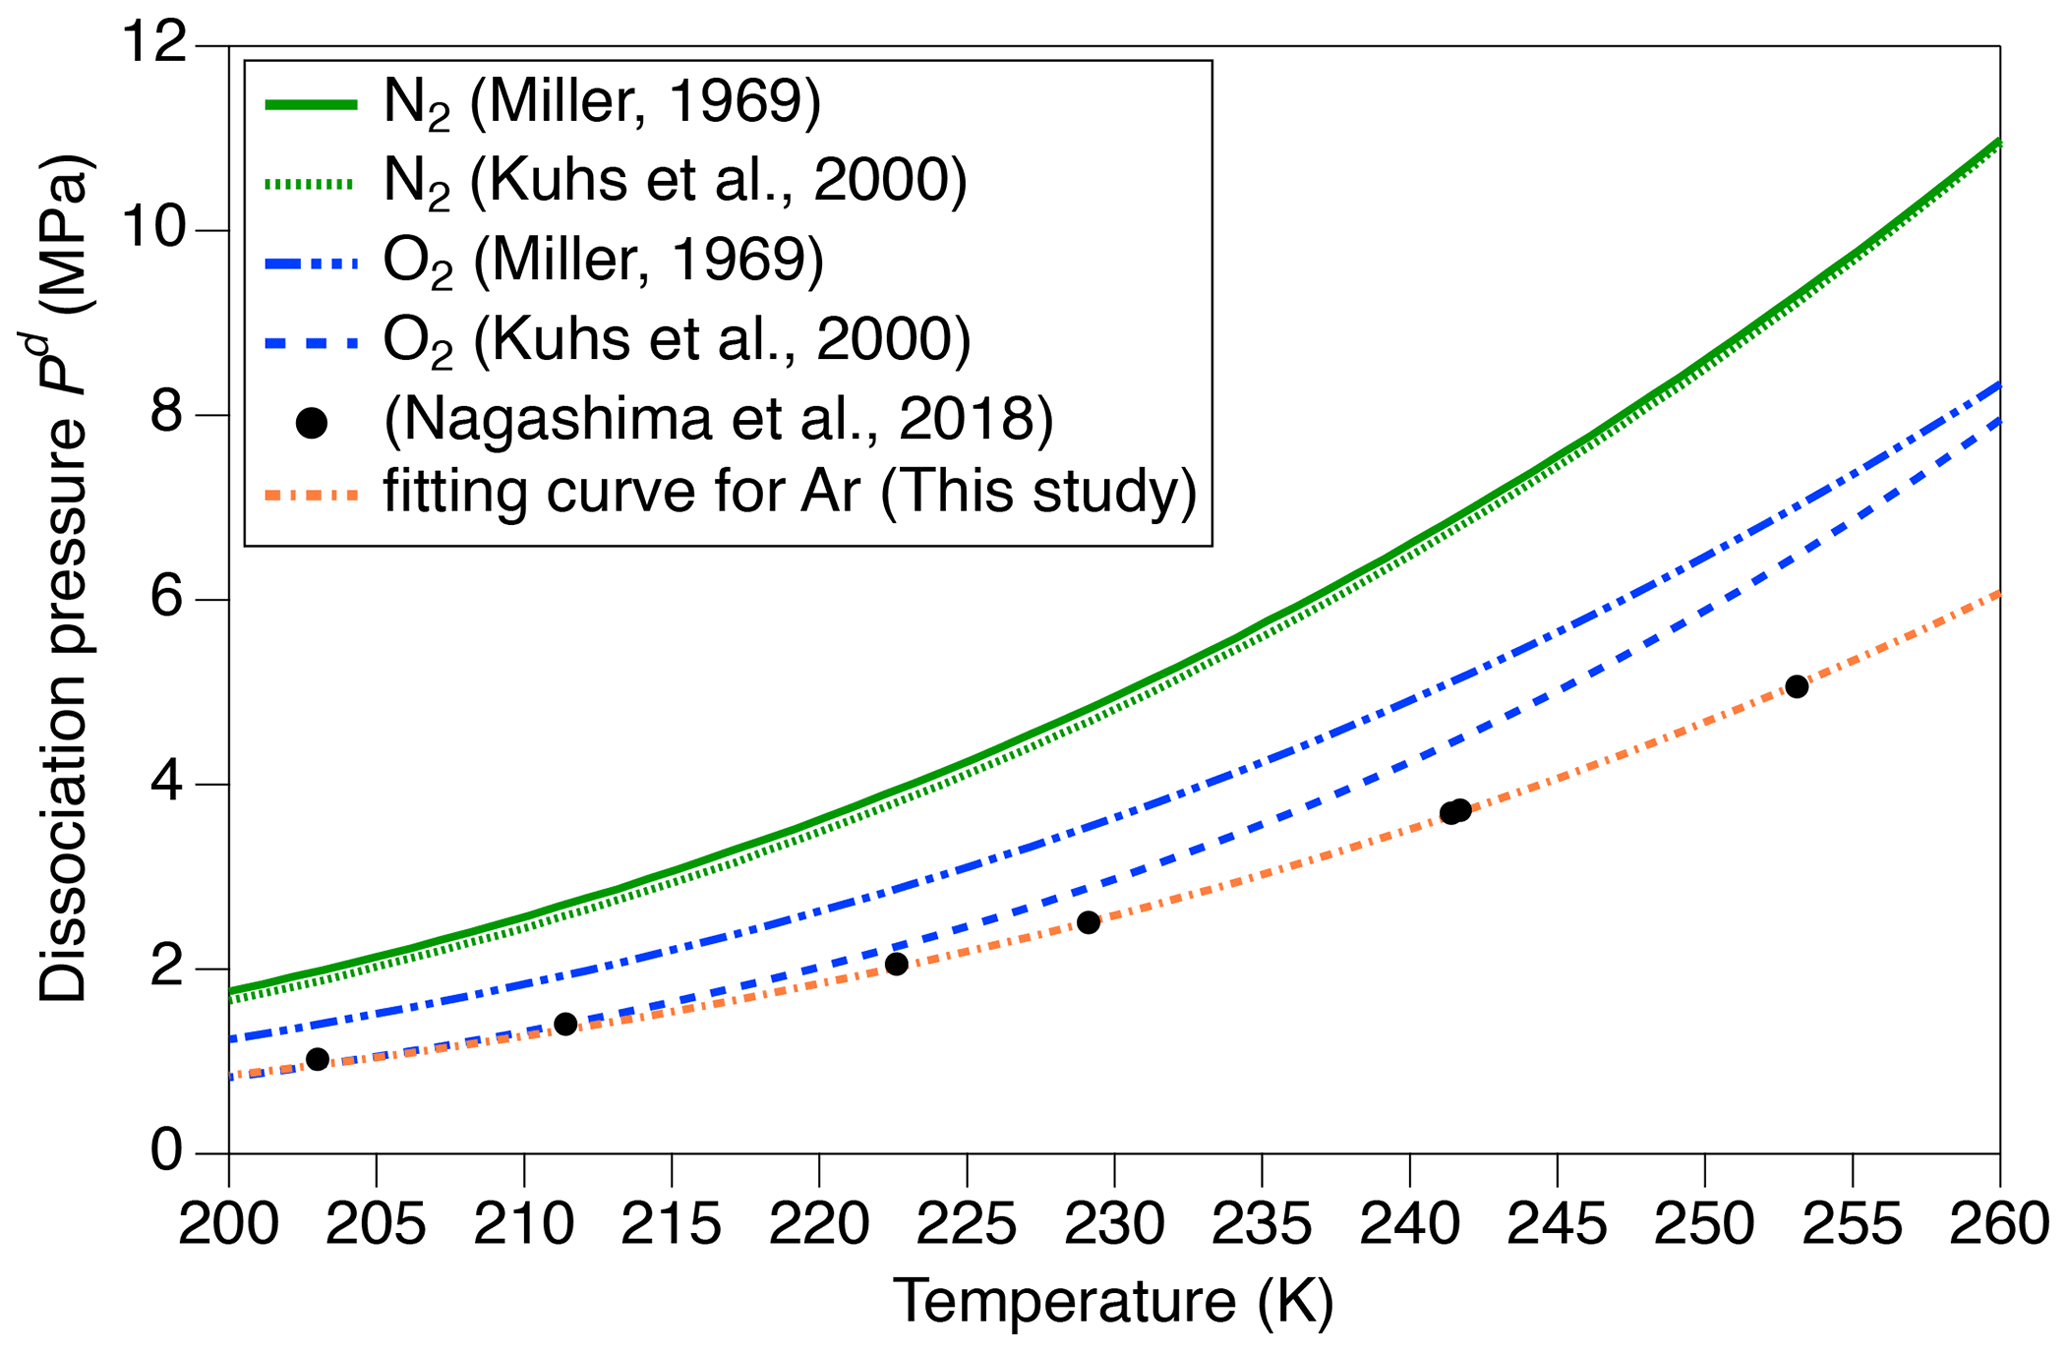
Figure A1Relationship between temperature and dissociation pressure for N2, O2 (Miller, 1969; Kuhs et al., 2000), and Ar hydrates (Nagashima et al., 2018). The data for Ar hydrate (solid circles) are fitted with an exponential function: log .
A2 Molar fraction of the m molecule in clathrate hydrate
The molar fraction of the m molecule in the clathrate hydrate is given by
where Um is the concentration of the m molecule in total air content. is the concentration of minor gases, which is assumed to be constant and given by
where U0 is concentration of total air content in ice, is concentration of the m molecule with the atmospheric ratio in the total air content, TAC is total air content, is molar mass of ice (H2O), VSTP is molar volume of a gas at standard temperature and pressure, and Rm is the atmospheric ratio of the m molecule.

Figure A2Thinning function (red, Nakano et al., 2016), temperature (blue, Buizert et al., 2021) and age (black, Kawamura et al., 2007) in the ice sheet at Dome Fuji used for the diffusion model. Gray shading indicates the depth range of the model run.
A3 Permeability
The diffusivity Dm, solubility Sm, or their product (permeability, km) for air molecules are taken from the literature (Ikeda-Fukazawa et al., 2001, 2005; Salamatin et al., 2001). Ikeda-Fukazawa et al. (2001) and Salamatin et al. (2001) estimated permeability of N2 and O2, which were constrained by observed of individual air inclusions in BCTZ. Ikeda-Fukazawa et al. (2005) estimated solubility and diffusivity of N2 and O2 based on molecular dynamics simulations, and the results were consistent with gas-loss fractionation for the Dome Fuji core. The permeability (m2 s−1) at T (K) and 1 MPa of Ikeda-Fukazawa et al. (2001) (hereafter IkFk01) is given by
where is a constant, is dissociation pressure of the m molecule, is activation energy of permeation for the m molecule, and R is the gas constant. The permeability (m2 s−1) at temperature T (K) and 1 MPa of Salamatin et al. (2001) (hereafter Salm01) is given by
where is dissociation pressure of the m molecule at 220 K. The diffusivity Dm or permeability km (m2 s−1) at temperature T (K) of Ikeda-Fukazawa et al. (2005) (hereafter IkFk05) is given by
The solubility at 1 MPa of Ikeda-Fukazawa et al. (2005) is given by
where is a constant for the m molecule, and is activation energy of solubility for the m molecule. We used those permeation parameters for our model (parameters are summarized in Table A2, and each permeability is shown in Fig. 2 and Table A3).
There are no published values of kAr; thus, we estimated it from and in Salamatin et al. (2001) with two formulations by Kobashi et al. (2015). The first one, kAr(I), uses diffusion coefficients of N2, O2, and Ar at 270 K from the molecular dynamic simulations by Ikeda-Fukazawa et al. (2004) (: m2 s−1, : m2 s−1 and : m2 s−1):
The second permeability, kAr(II), is based on the observations that is often depleted by about half of (e.g., Severinghaus et al., 2009). The permeability of Ar(II) is expressed as
A4 Discretization
The model uses the central differencing scheme. The downward diffusive flux (fm) of the m molecule per unit area at the top boundary of ith box is the product of the diffusivity and concentration gradient:
where Δz is the initial box height (0.5 mm) and τr is the relative thinning function (thinning function divided by the initial value at 1258 m). By substituting Eq. (3) into Eq. (A9), fm is expressed as
The net flux of the m molecule for ith box is
and the concentration change of the m molecule in total air content becomes
where Δt is time step (∼11.6 d).

Table A2Model parameters.

a Miller (1969). b Kuhs et al. (2000). c Ikeda-Fukazawa et al. (2001). d Salamatin et al. (2001). e Ikeda-Fukazawa et al. (2005).
Table A3Examples of dissociation pressure, diffusivity, solubility, and permeability (at 240 K).
a Miller (1969). b Kuhs et al. (2000).
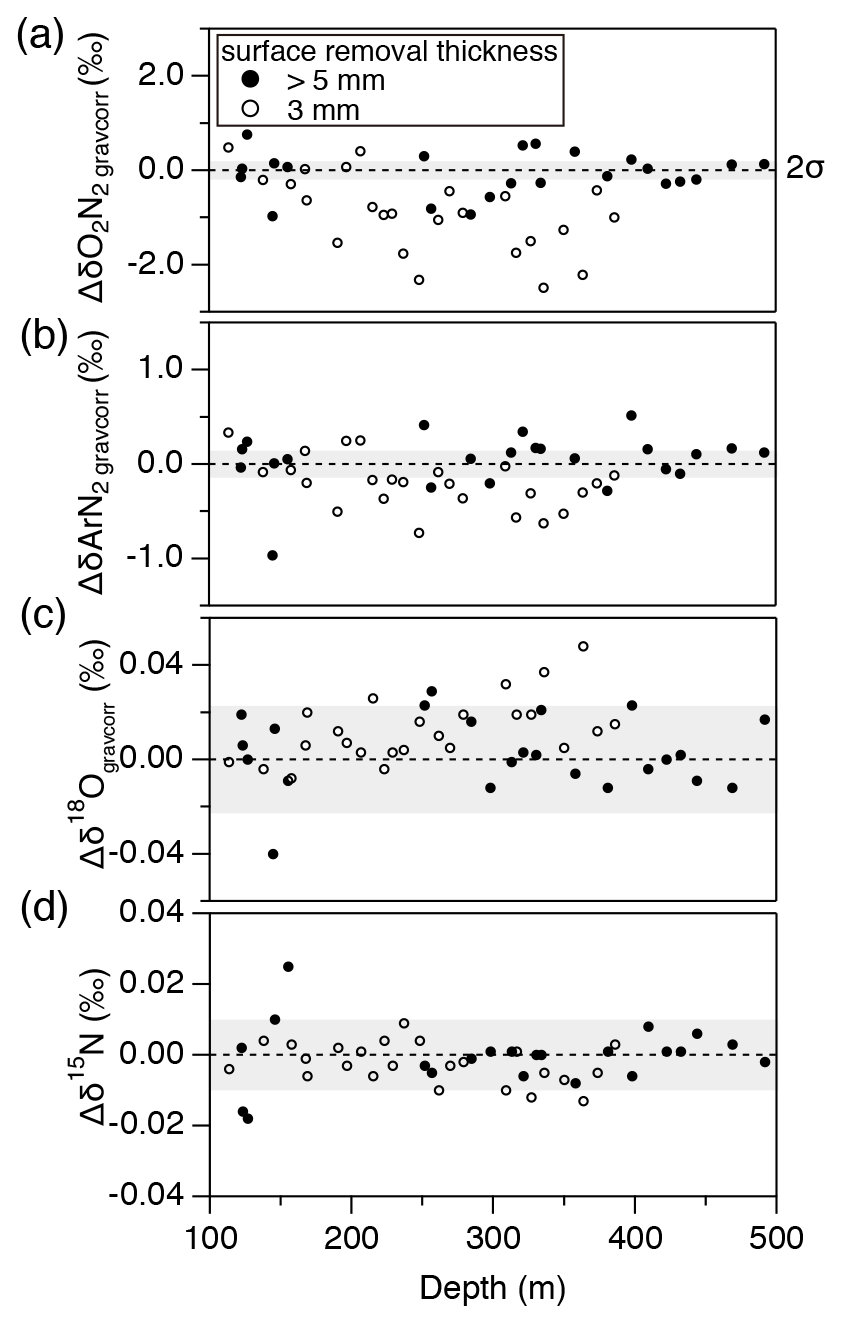
Figure B1Pair difference (“a2” piece minus “a1” piece, Fig. 1) in the bubbly ice for (a) , (b) , (c) δ18O, and (d) δ15N. Solid circles show the data from the samples after removing the outer ice by >5 mm thickness, and open circles show the data with ∼3 mm removal. Gray shadings are estimated 2σ uncertainty (twice the pooled standard deviations of the pair differences for clathrate hydrate ice below 1480 m).
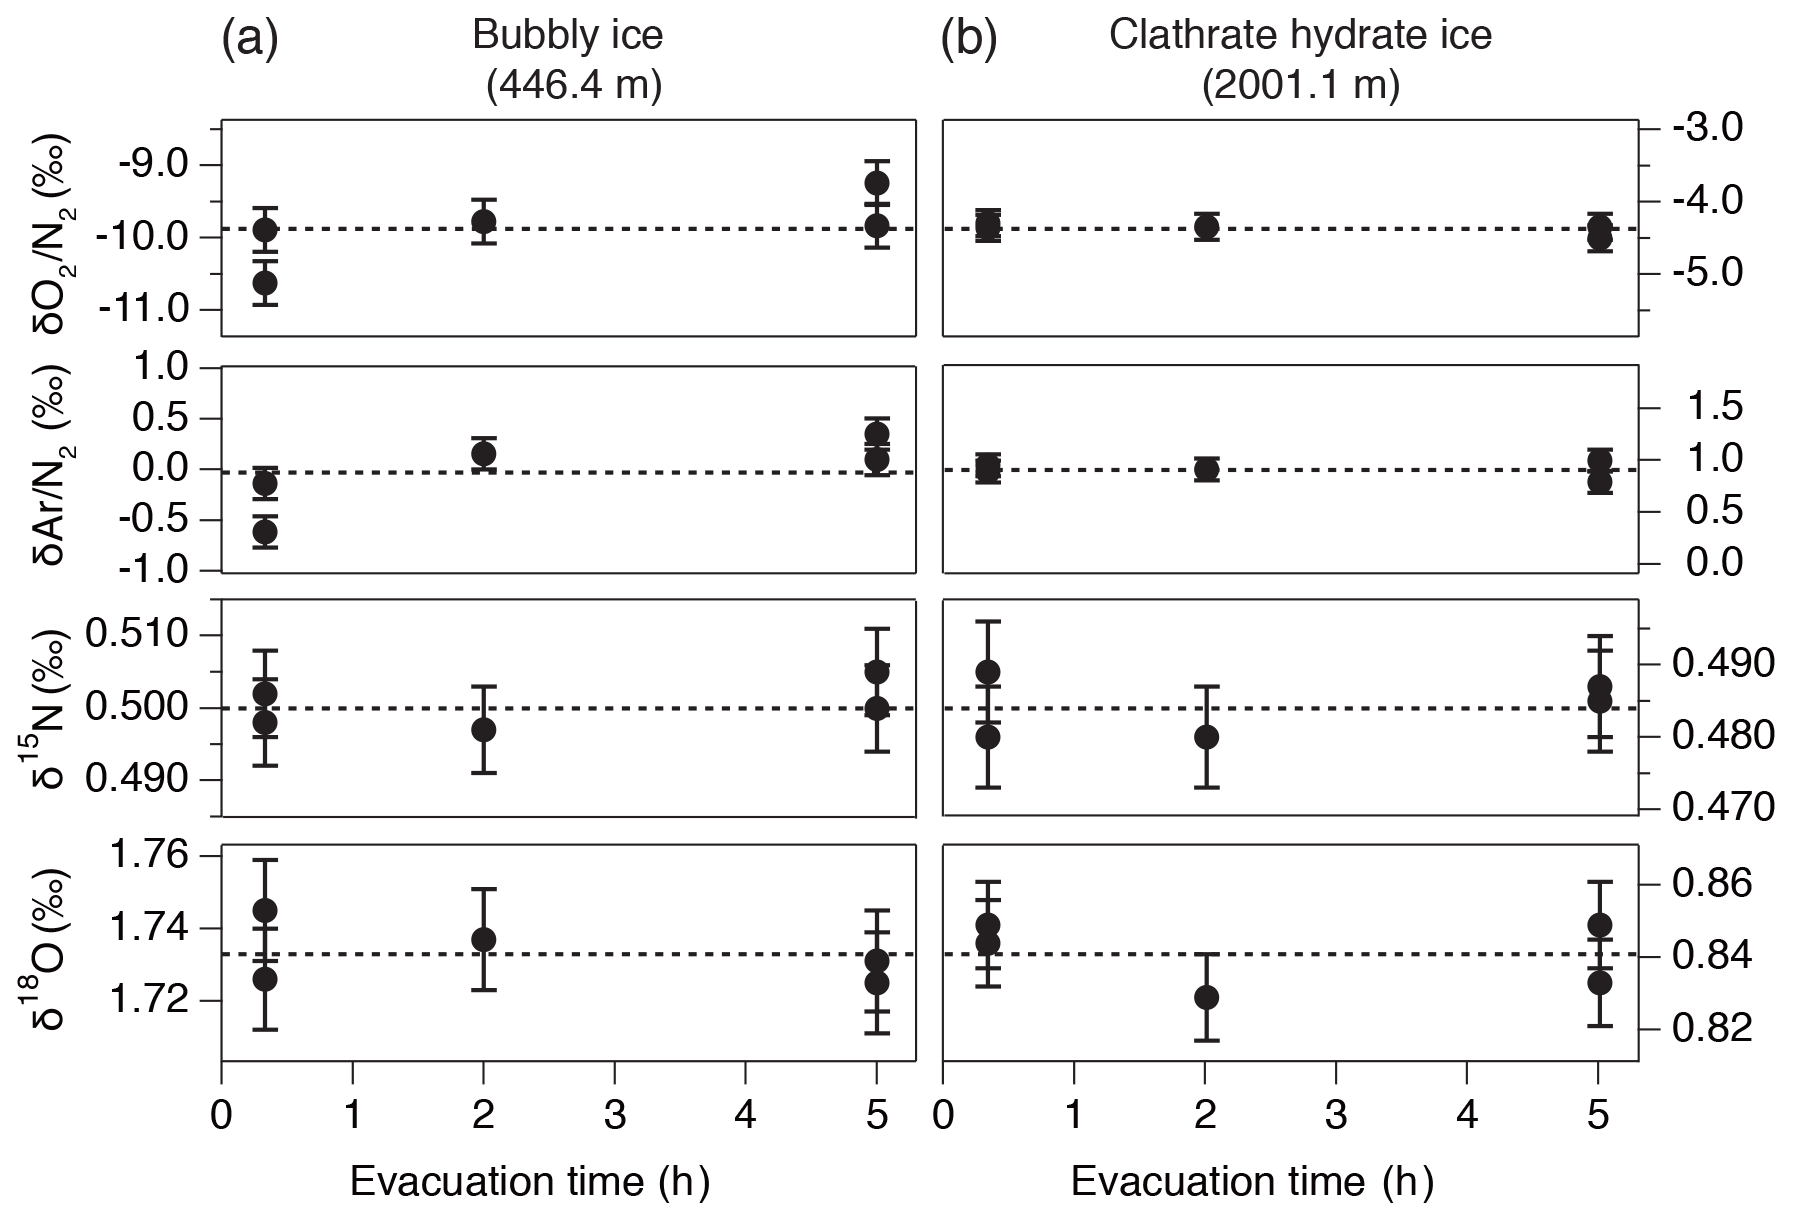
Figure B2Results of the evacuation experiment for , , δ15N, and δ18O in (a) bubbly ice (446.4 m) and (b) clathrate hydrate ice (2001.1 m). Dashed lines are the average of all five values.

Figure B3Absolute pair differences of (a) , (b) , (c) δ15N, and (d) δ18Ogravcorr. Gray shadings indicate 2σ uncertainty (same as Fig. B1).
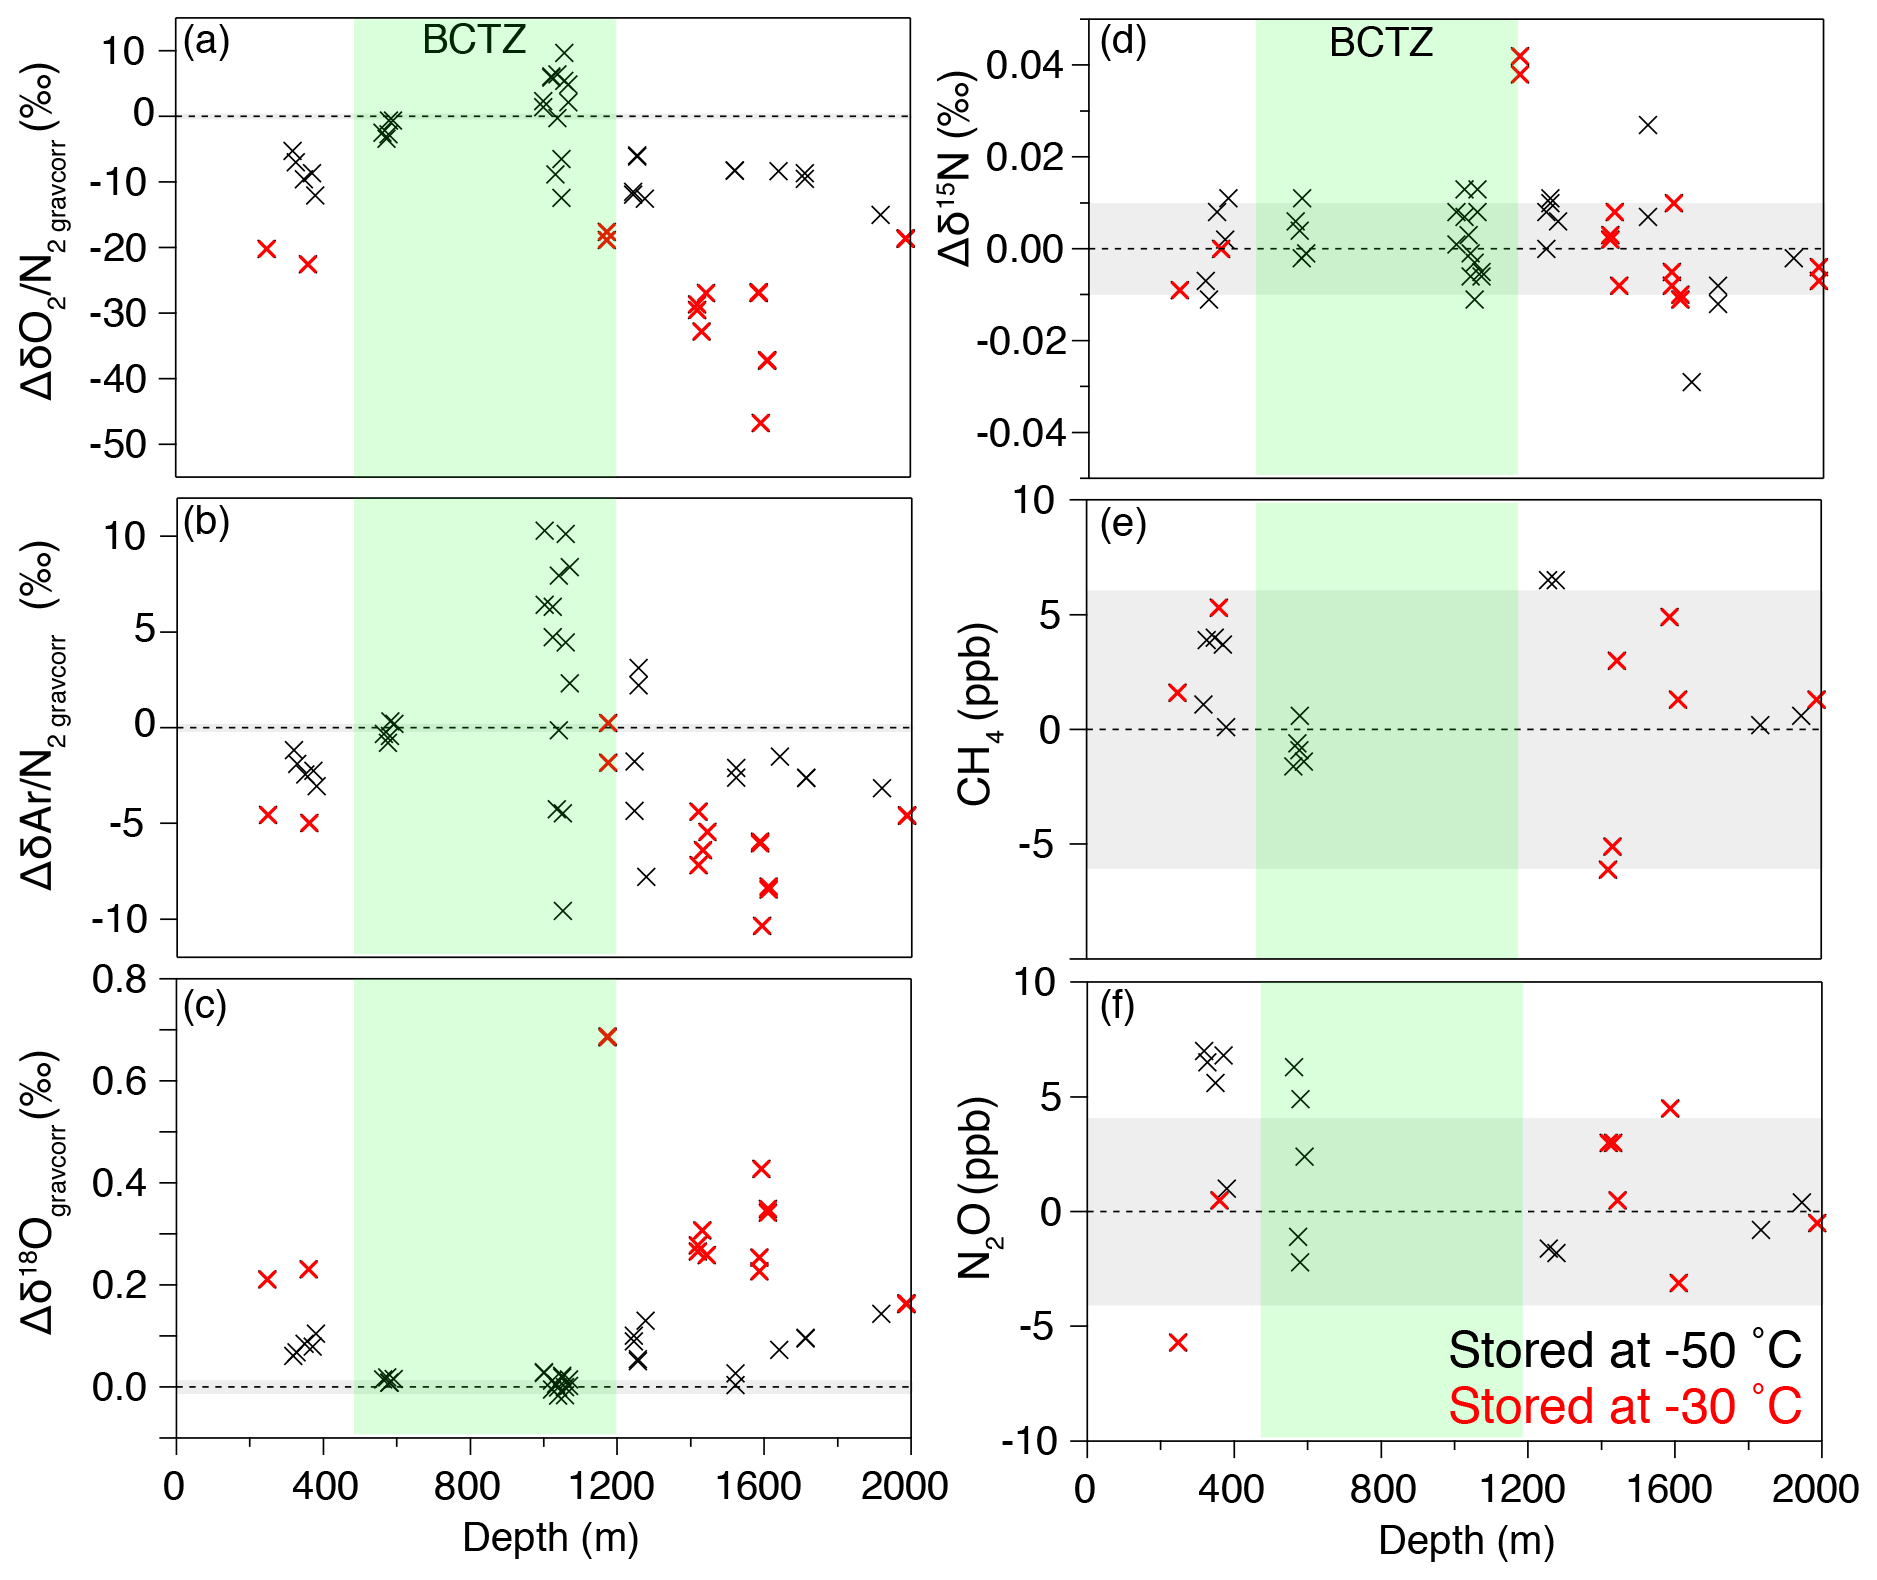
Figure B4Differences of the values in the outer and inner pieces (outer minus inner) for (a) , (b) , (c) δ18Ogravcorr, (d) δ15N, (e) CH4 concentration, and (f) N2O concentration. Gray shadings indicate 2σ uncertainty (same as Fig. B1). Black and red markers show the data using the outer samples stored at −50 and −30 ∘C, respectively.
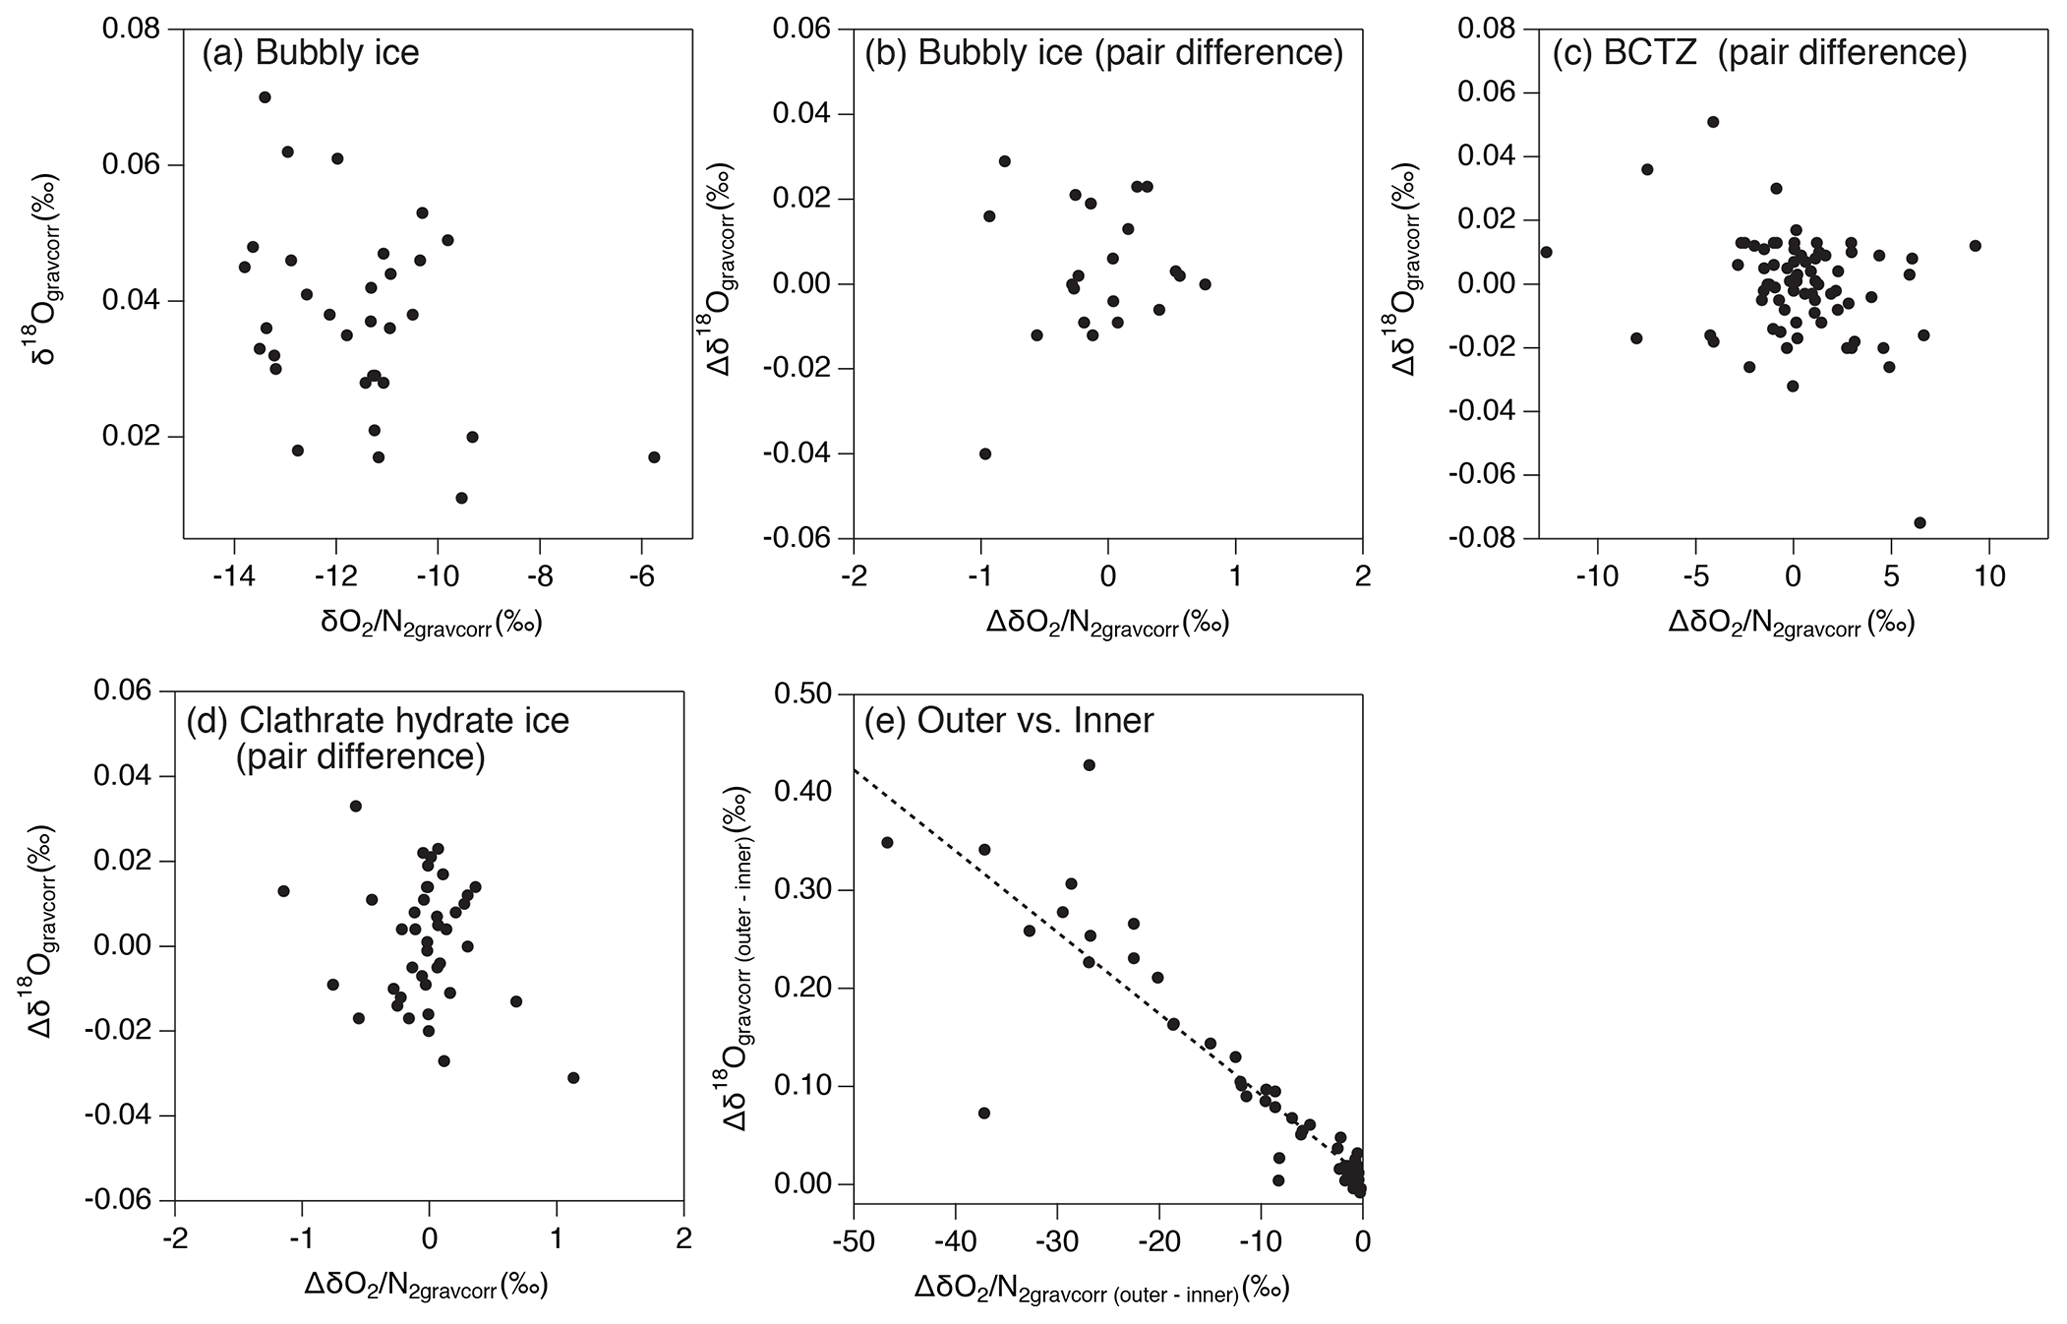
Figure B5Relationship between and δ18Ogravcorr for (a) the last 2000 years for bubbly ice, (b) pair differences in bubbly ice zone, (c) pair differences in BCTZ, (d) pair differences in clathrate hydrate ice zone, and (e) differences between the outer ice and inner ice (bubbly ice and clathrate hydrate ice). The dashed line represents linear fit to the data ().
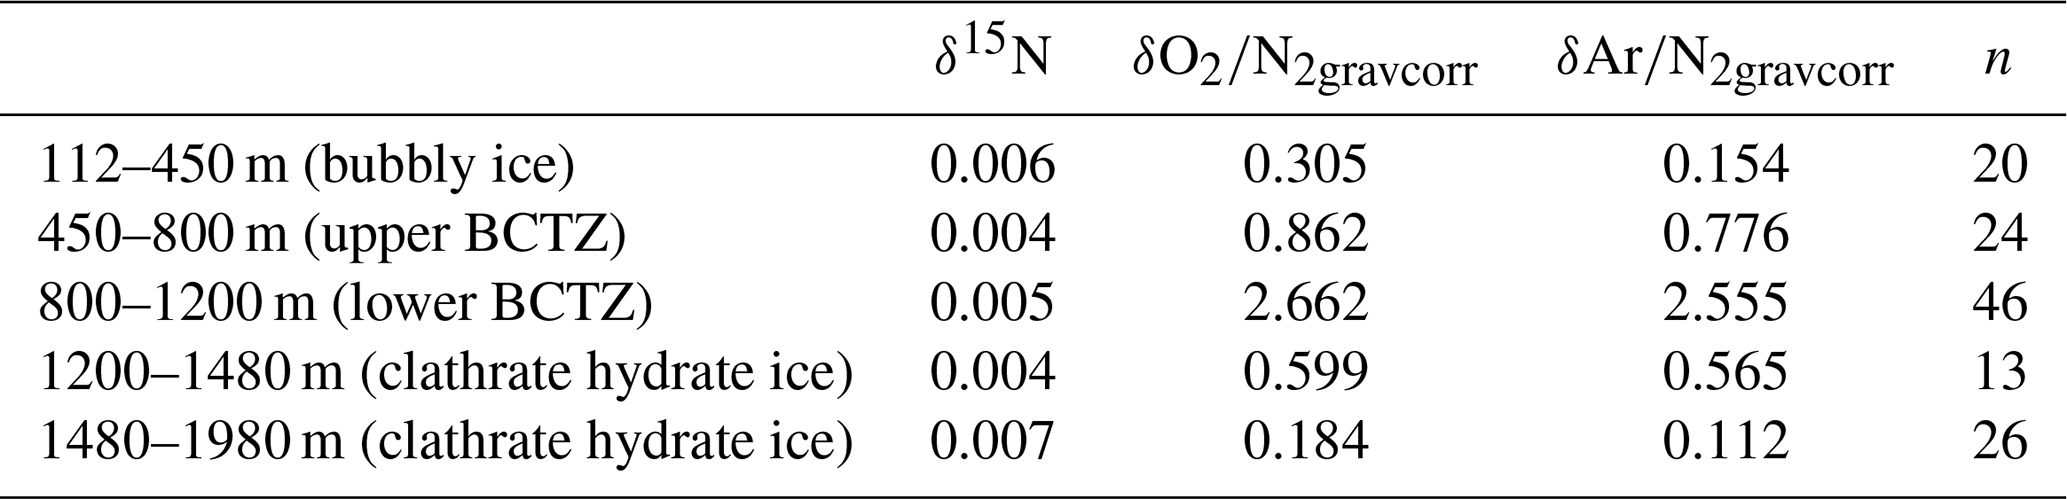
Table C2Slopes for vs. and for vs. .
* Byrd, Camp Century, Crete, Dominion Range, Dye 3, D10, D57, and Dome C ice cores.
All data presented in this study are available at the NIPR ADS data repository (https://ads.nipr.ac.jp/dataset/A20210430-001, last access: 7 December 2021; https://doi.org/10.17592/001.2021043001, Oyabu et al., 2021) and will be available on the NOAA paleoclimate database.
IO and KeK designed and led the study. IO, KeK, KyK, MH, SA, SM, and TN developed the methodologies and carried out the measurements. IO, KeK, and JDM worked directly with the data. IO, KeK, TU, SF, JPS, and JDM discussed the gas fractionation processes. IO and KeK wrote the manuscript with contributions from all co-authors. IO, KeK, and SF acquired funding.
The contact author has declared that neither they nor their co-authors have any competing interests.
Publisher's note: Copernicus Publications remains neutral with regard to jurisdictional claims in published maps and institutional affiliations.
We are grateful to Hiroshi Ohno of Kitami Institute of Technology for providing air inclusion data and comments; Tomoko Fukazawa of Meiji University for providing the Raman data; Kumiko Goto-Azuma of National Institute of Polar Research for the management of ice-core chemistry analyses; and Hirohisa Matsushima, Satoko Nakanishi, Mariko Hayakawa, Akito Tanaka, Satomi Oda, Maki Nakatani, Yasuko Fukagawa, Miho Arai, and Ryo Inoue for ice-core measurements. We acknowledge the Dome Fuji ice-core projects, the Japanese Antarctic Research Expedition, and the Ice Core Consortium. We are grateful to the two anonymous reviewers for their constructive comments.
This research has been supported by the Japan Society for the Promotion of Science (grant nos. 20H04327, 17K12816, 17J00769, 20H00639, 15KK0027, 26241011, and 18H05294), the Ministry of Education, Culture, Sports, Science and Technology (grant no. 17H06320), and the National Institute of Polar Research (grant no. KP305 and Senshin Project).
This paper was edited by Nanna Bjørnholt Karlsson and reviewed by two anonymous referees.
Azuma, N., Wang, Y., Yoshida, Y., and Narita, H.: Crystallographic analysis of the Dome Fuji ice core, Physics of Ice Core Records, 45–61, available at: http://hdl.handle.net/2115/32461 (last access: 7 December 2021), 2000.
Battle, M., Bender, M., Sowers, T., Tans, P. P., Butler, J. H., Elkins, J. W., Ellis, J. T., Conway, T., Zhang, N., Lang, P., and Clarke, A. D.: Atmospheric gas concentrations over the past century measured in air from firn at the South Pole, Nature, 383, 231-235, https://doi.org/10.1038/383231a0, 1996.
Battle, M. O., Severinghaus, J. P., Sofen, E. D., Plotkin, D., Orsi, A. J., Aydin, M., Montzka, S. A., Sowers, T., and Tans, P. P.: Controls on the movement and composition of firn air at the West Antarctic Ice Sheet Divide, Atmos. Chem. Phys., 11, 11007–11021, https://doi.org/10.5194/acp-11-11007-2011, 2011.
Bazin, L., Landais, A., Capron, E., Masson-Delmotte, V., Ritz, C., Picard, G., Jouzel, J., Dumont, M., Leuenberger, M., and Prié, F.: Phase relationships between orbital forcing and the composition of air trapped in Antarctic ice cores, Clim. Past, 12, 729–748, https://doi.org/10.5194/cp-12-729-2016, 2016.
Bender, M. L.: Orbital tuning chronology for the Vostok climate record supported by trapped gas composition, Earth Planet. Sc. Lett., 204, 275–289, https://doi.org/10.1016/S0012-821X(02)00980-9, 2002.
Bender, M., Sowers, T., Barnola, J.-M., and Chappellaz, J.: Changes in the ratio of the atmosphere during recent decades reflected in the composition of air in the firn at Vostok Station, Antarctica, J. Geophys. Res., 21, 189–192, https://doi.org/10.1029/93GL03548, 1994a.
Bender, M. L., Tans, P. P., Ellis, J. T., Orchardo, J., and Habfast, K.: A high precision isotope ratio mass spectrometry method for measuring the ratio of air, Geochim. Cosmochim. Ac., 58, 4751–4758, https://doi.org/10.1016/0016-7037(94)90205-4, 1994b.
Bender, M., Sowers, T., and Lipenkov, V.: On the concentrations of O2, N2, and Ar in trapped gases from ice cores, J. Geophys. Res., 100, 18651–18660, https://doi.org/10.1029/94JD02212, 1995.
Bereiter, B., Schwander, J., Luthi, D., and Stocker, T. F.: Change in CO2 concentration and ratio in ice cores due to molecular diffusion, Geophys. Res. Lett., 36, L05703–05705, https://doi.org/10.1029/2008GL036737, 2009.
Bereiter, B., Fischer, H., Schwander, J., and Stocker, T. F.: Diffusive equilibration of N2, O2 and CO2 mixing ratios in a 1.5-million-years-old ice core, The Cryosphere, 8, 245–256, https://doi.org/10.5194/tc-8-245-2014, 2014.
Buizert, C., Fudge, T. J., Roberts, W. H. G., Steig, E. J., Sherriff-Tadano, S., Ritz, C., Lefebvre, E., Edwards, J., Kawamura, K., Oyabu, I., Motoyama, H., Kahle, E. C., Jones, T. R., Abe-Ouchi, A., Obase, T., Martin, C., Corr, H., Severinghaus, J. P., Beaudette, R., Epifanio, J. A., Brook, E. J., Martin, K., Chappellaz, J., Aoki, S., Nakazawa, T., Sowers, T., Alley, R., Ahn, J., Sigl, M., Severi, M., Dunbar, N. W., Svensson, A., Fegyveresi, J., He, C., Liu, Z., Zhu, J., Otto-Bliesner, B., Lipenkov, V., Kageyama, M., and Schwander, J.: Antarctic-wide surface temperature and elevation during the Last Glacial Maximum, Science, 372, 1097–1101, https://doi.org/10.1126/science.abd2897, 2021.
Chazallon, B., Champagnon, B., Panczer, G., Pauer, F., Klapproth, A., and Kuhs, W. F.: Micro-Raman analysis of synthetic air clathrates, Eur. J. Mineral., 10, 1125–1134, 1998.
Craig, H. and Scarsi, P.: Helium isotope stratigraphy in the GISP2 ice core, Eos Trans. Am. Geophys. Union, 78, F7, 1997.
Craig, H., Horibe, Y., and Sowers, T.: Gravitational separation of gases and isotopes in polar ice caps, Science, 23, 1675–1678, https://doi.org/10.1126/science.242.4886.1675, 1988.
Extier, T., Landais, A., Bréant, C., Prié, F., Bazin, L., Dreyfus, G., Roche, D. M., and Leuenberger, M.: On the use of δ18Oatm for ice core dating, Quaternary Sci. Rev., 185, 244–257, https://doi.org/10.1016/j.quascirev.2018.02.008, 2018.
Fischer, H., Severinghaus, J., Brook, E., Wolff, E., Albert, M., Alemany, O., Arthern, R., Bentley, C., Blankenship, D., Chappellaz, J., Creyts, T., Dahl-Jensen, D., Dinn, M., Frezzotti, M., Fujita, S., Gallee, H., Hindmarsh, R., Hudspeth, D., Jugie, G., Kawamura, K., Lipenkov, V., Miller, H., Mulvaney, R., Parrenin, F., Pattyn, F., Ritz, C., Schwander, J., Steinhage, D., van Ommen, T., and Wilhelms, F.: Where to find 1.5 million yr old ice for the IPICS “Oldest-Ice” ice core, Clim. Past, 9, 2489–2505, https://doi.org/10.5194/cp-9-2489-2013, 2013.
Fujita, S., Okuyama, J., Hori, A., and Hondoh, T.: Metamorphism of stratified firn at Dome Fuji, Antarctica: A mechanism for local insolation modulation of gas transport conditions during bubble close off, J. Geophys. Res., 114, F03023, https://doi.org/10.1029/2008JF001143, 2009.
Fujita, S., Goto-Azuma, K., Hirabayashi, M., Hori, A., Iizuka, Y., Motizuki, Y., Motoyama, H., and Takahashi, K.: Densification of layered firn in the ice sheet at Dome Fuji, Antarctica, J. Glaciol., 62, 103–123, https://doi.org/10.1017/jog.2016.16, 2016.
Goto-Azuma, K., Hirabayashi, M., Motoyama, H., Miyake, T., Kuramoto, T., Uemura, R., Igarashi, M., Iizuka, Y., Sakurai, T., Horikawa, S., Suzuki, K., Suzuki, T., Fujita, K., Kondo, Y., Hattori, S., and Fujii, Y.: Reduced marine phytoplankton sulphur emissions in the Southern Ocean during the past seven glacials, Nat. Commun, 10, 3247, https://doi.org/10.1038/s41467-019-11128-6, 2019.
Hondoh, T. (Ed.): An Overview of Microphysical Processes in Ice Sheets: Toward Nanoglaciology, Low Temperature Science, Physics of Ice Core Records II, Institute of Low Temperature Science, Hokkaido University, Japan, available at: http://hdl.handle.net/2115/45404 (last access: 7 December 2021), 2009.
Hoshina, Y., Fujita, K., Nakazawa, F., Iizuka, Y., Miyake, T., Hirabayashi, M., Kuramoto, T., Fujita, S., and Motoyama, H.: Effect of accumulation rate on water stable isotopes of near-surface snow in inland Antarctica, J. Geophys. Res.-Atmos., 119, 274–283, https://doi.org/10.1002/2013JD020771, 2014.
Huber, C. and Leuenberger, M.: Measurements of isotope and elemental ratios of air from polar ice with a new on-line extraction method, Geochem. Geophy. Geosy., 5, 1–13, https://doi.org/10.1029/2004GC000766, 2004.
Huber, C., Beyerle, U., Leuenberger, M., Schwander, J., Kipfer, R., Spahni, R., Severinghaus, J. P., and Weiler, K.: Evidence for molecular size dependent gas fractionation in firn air derived from noble gases, oxygen, and nitrogen measurements, Earth Planet. Sc. Lett., 243, 61–73, https://doi.org/10.1016/j.epsl.2005.12.036, 2006.
Ikeda-Fukazawa, T., Hondoh, T., Fukumura, T., Fukazawa, H., and Mae, S.: Variation in ratio of occluded air in Dome Fuji antarctic ice, J. Geophys. Res., 106, 17799–17810, https://doi.org/10.1029/2000JD000104, 2001.
Ikeda-Fukazawa, T., Kawamura, K., and Hondoh, T.: Diffusion of nitrogen gas in ice Ih, Chem. Phys. Lett., 385, 467–471, https://doi.org/10.1016/j.cplett.2004.01.021, 2004.
Ikeda-Fukazawa, T., Fukumizu, K., Kawamura, K., Aoki, S., Nakazawa, T., and Hondoh, T.: Effects of molecular diffusion on trapped gas composition in polar ice cores, Earth Planet. Sc. Lett., 229, 183–192, https://doi.org/10.1016/j.epsl.2004.11.011, 2005.
Kawamura, K.: Variations of atmospheric components over the past 340 000 years from Dome Fuji deep ice core, Antarctica, PhD thesis, Tohoku University, Japan, available at: http://hdl.handle.net/10097/38833 (last access: 7 December 2021), 2001.
Kawamura, K., Parrenin, F., Lisiecki, L., Uemura, R., Vimeux, F., Severinghaus, J. P., Hutterli, M. A., Nakazawa, T., Aoki, S., Jouzel, J., Raymo, M. E., Matsumoto, K., Nakata, H., Motoyama, H., Fujita, S., Goto-Azuma, K., Fujii, Y., and Watanabe, O.: Northern Hemisphere forcing of climatic cycles in Antarctica over the past 360,000 years, Nature, 448, 912–916, https://doi.org/10.1038/nature06015, 2007.
Kobashi, T., Severinghaus, J. P., and Kawamura, K.: Argon and nitrogen isotopes of trapped air in the GISP2 ice core during the Holocene epoch (0–1, 500 B.P.): Methodology and implications for gas loss processes, Geochim. Cosmochim. Ac., 72, 4675–4686, https://doi.org/10.1016/j.gca.2008.07.006, 2008.
Kobashi, T., Ikeda-Fukazawa, T., Suwa, M., Schwander, J., Kameda, T., Lundin, J., Hori, A., Motoyama, H., Döring, M., and Leuenberger, M.: Post-bubble close-off fractionation of gases in polar firn and ice cores: effects of accumulation rate on permeation through overloading pressure, Atmos. Chem. Phys., 15, 13895–13914, https://doi.org/10.5194/acp-15-13895-2015, 2015.
Kuhs, W. F., Klapproth, A., and Chazallon, B.: Chemical physics of air clathrate hydrates, in: Physics of Ice Cores Records, edited by: Hondoh, T., Hokkaido University Press, Sapporo, 373–392, 2000.
Laskar, J., Robutel, P., Joutel, F., Gastineau, M., Correia, A. C. M., and Levrard, B.: A long-term numerical solution for the insolation quantities of the Earth, Astron. Astrophys., 428, 261–285, https://doi.org/10.1051/0004-6361:20041335, 2004.
Lipenkov, V. Y.: Air bubbles and air-hydrate crystals in the Vostok ice core, Physics of Ice Core Records, Hokkaido University Press, Hokkaido, Japan, 327–358, available at: http://hdl.handle.net/2115/32474 (last access: 7 December 2021), 2000.
Lüthi, D., Bereiter, B., Stauffer, B., Winkler, R., Schwander, J., Kindler, P., Leuenberger, M., Kipfstuhl, J., Capron, E., Landais, A., Fischer, H., and Stocker, T. F.: CO2 and variations in and just below the bubble–clathrate transformation zone of Antarctic ice cores, Earth Planet. Sc. Lett, 297, 226–233, https://doi.org/10.1016/j.epsl.2010.06.023, 2010.
Miller, S. L.: Clathrate hydrates of air in Antarctic ice, Science, 165, 489–490, https://doi.org/10.1126/science.165.3892.489, 1969.
Nagashima, H. D., Nemoto, K., and Ohmura, R.: Phase equilibrium for argon clathrate hydrate at the temperatures from 197.6 K to 274.1 K, J. Chem. Thermodynam., 127, 86–91, https://doi.org/10.1016/j.jct.2018.07.019, 2018.
Nakano, S., Suzuki, K., Kawamura, K., Parrenin, F., and Higuchi, T.: A sequential Bayesian approach for the estimation of the age–depth relationship of the Dome Fuji ice core, Nonlin. Processes Geophys., 23, 31–44, https://doi.org/10.5194/npg-23-31-2016, 2016.
Narita, H., Azuma, N., Hondoh, T., Fujii, M., Kawaguchi, M., Mae, S. J., Shoji, H., Kameda, T., and Watanabe, O.: Characteristics of air bubbles and hydrates in the Dome Fuji ice core, Antarctica, Ann. Glaciol., 29, 207–210, https://doi.org/10.3189/172756499781821300, 1999.
Ohno, H., Lipenkov, V., and Hondoh, T.: Air bubble to clathrate hydrate transformation in polar ice sheets: A reconsideration based on the new data from Dome Fuji ice core, Geophys. Res. Lett., 31, L21401, https://doi.org/10.1029/2004GL021151, 2004.
Ohno, H., Lipenkov, V. Y., and Hondoh, T.: Formation of air clathrate hydrates in polar ice sheets: heterogeneous nucleation induced by micro-inclusions, J. Glaciol., 56, 917–921 https://doi.org/10.3189/002214310794457317, 2010.
Ohno, H., Iizuka, Y., and Fujita, S.: Pure rotational Raman spectroscopy applied to N2/O2 analysis of air bubbles in polar firn, J. Glaciol., 67, 903–908, https://doi.org/10.1017/jog.2021.40, 2021.
Oyabu, I., Iizuka, Y., Uemura, R., Miyake, T., Hirabayashi, M., Motoyama, H., Sakurai, T., Suzuki, T., and Hondoh, T.: Chemical compositions of sulfate and chloride salts over the last termination reconstructed from the Dome Fuji ice core, inland Antarctica, J. Geophys. Res.-Atmos., 119, 14045–14058, https://doi.org/10.1002/2014JD022030, 2014.
Oyabu, I., Kawamura, K., Kitamura, K., Dallmayr, R., Kitamura, A., Sawada, C., Severinghaus, J. P., Beaudette, R., Orsi, A., Sugawara, S., Ishidoya, S., Dahl-Jensen, D., Goto-Azuma, K., Aoki, S., and Nakazawa, T.: New technique for high-precision, simultaneous measurements of CH4, N2O and CO2 concentrations, isotopic and elemental ratios of N2, O2 and Ar, and total air content in ice cores by wet extraction, Atmos. Meas. Tech., 13, 6703–6731, https://doi.org/10.5194/amt-13-6703-2020, 2020.
Oyabu, I., Kawamura, K., Kitamura, K., Hirabayashi, M., Aoki, S., Morimoto, S., and Nakazawa, T.: Dome Fuji ice core gas data (112–2001 m, 15N, , ), 1.00, Arctic Data archive System (ADS) [data set], https://doi.org/10.17592/001.2021043001, 2021.
Salamatin, A. N., Lipenkov, V., Ikeda-Fukazawa, T., and Hondoh, T.: Kinetics of air-hydrate nucleation in polar ice sheets, J. Cryst. Growth, 223, 285–305, https://doi.org/10.1016/S0022-0248(00)01002-2, 2001.
Seltzer, A. M., Buizert, C., Baggenstos, D., Brook, E. J., Ahn, J., Yang, J.-W., and Severinghaus, J. P.: Does δ18O of O2 record meridional shifts in tropical rainfall?, Clim. Past, 13, 1323–1338, https://doi.org/10.5194/cp-13-1323-2017, 2017.
Severinghaus, J. P.: South Pole (SPICECORE) 15N, 18O, and (Version 1), US Antarctic Program (USAP) Data Center [data set], https://doi.org/10.15784/601152, 2019.
Severinghaus, J. P. and Battle, M. O.: Fractionation of gases in polar ice during bubble close-off: New constraints from firn air Ne, Kr and Xe observations, Earth Planet. Sc. Lett., 244, 474–500, https://doi.org/10.1016/j.epsl.2006.01.032, 2006.
Severinghaus, J. P., Beaudette, R., Headly, M. A., Taylor, K., and Brook, E. J.: Oxygen-18 of O2 Records the Impact of Abrupt Climate Change on the Terrestrial Biosphere, Science, 324, 1431–1434, https://doi.org/10.1126/science.1169473, 2009.
Shackleton, S., Bereiter, B., Baggenstos, D., Bauska, T. K., Brook, E. J., Marcott, S. A., and Severinghaus, J. P.: Is the Noble Gas-Based Rate of Ocean Warming During the Younger Dryas Overestimated?, Geophys. Res. Lett., 46, 5928–5936, https://doi.org/10.1029/2019GL082971, 2019.
Sowers, T., Bender, M., and Raynaud, D.: Elemental and isotopic composition of occluded O2 and N2 in polar ice, J. Geophys. Res., 94, 5137–5150, https://doi.org/10.1029/JD094iD04p05137, 1989.
Suwa, M. and Bender, M. L.: Chronology of the Vostok ice core constrained by ratios of occluded air, and its implication for the Vostok climate records, Quaternary Sci. Rev., 27, 1093–1106, https://doi.org/10.1016/j.quascirev.2008.02.017, 2008a.
Suwa, M. and Bender, M. L.: ratios of occluded air in the GISP2 ice core, J. Geophys. Res.-Atmos., 113, D11119, https://doi.org/10.1029/2007JD009589, 2008b.
Tsutaki, S., Fujita, S., Kawamura, K., Abe-Ouchi, A., Fukui, K., Motoyama, H., Hoshina, Y., Nakazawa, F., Obase, T., Ohno, H., Oyabu, I., Saito, F., Sugiura, K., and Suzuki, T.: High-resolution subglacial topography around Dome Fuji, Antarctica, based on ground-based radar surveys conducted over 30 years, The Cryosphere Discuss. [preprint], https://doi.org/10.5194/tc-2021-266, in review, 2021.
Uchida, T., Hondoh, T., Mae, S., Shoji, H., and Azuma, N.: Optimized Storage Condition of Deep Ice Core Samples from a View Point of Air-Hydrate Analysis, Mem. Nat. Inst. Polar Res., 49, 320–327, 1994.
Uemura, R., Motoyama, H., Masson-Delmotte, V., Jouzel, J., Kawamura, K., Goto-Azuma, K., Fujita, S., Kuramoto, T., Hirabayashi, M., Miyake, T., Ohno, H., Fujita, K., Abe-Ouchi, A., Iizuka, Y., Horikawa, S., Igarashi, M., Suzuki, K., Suzuki, T., and Fujii, Y.: Asynchrony between Antarctic temperature and CO2 associated with obliquity over the past 720,000 years, Nat. Commun. 9, 961, https://doi.org/10.1038/s41467-018-03328-3, 2018.
Watanabe, O., Jouzel, J., Johnsen, S., Parrenin, F., Shoji, H., and Yoshida, N.: Homogeneous climate variability across East Antarctica over the past three glacial cycles, Nature, 422, 509–512, https://doi.org/10.1038/nature01525, 2003.