the Creative Commons Attribution 4.0 License.
the Creative Commons Attribution 4.0 License.
 | 08 Feb 2021
Annual and inter-annual variability and trends of albedo of Icelandic glaciers
Sigurdur M. Gardarsson
Finnur Pálsson
Tómas Jóhannesson
Óli G. B. Sveinsson
During the melt season, absorbed solar energy, modulated at the surface predominantly by albedo, is one of the main governing factors controlling surface-melt variability for glaciers in Iceland. Using MODIS satellite-derived daily surface albedo, a gap-filled temporally continuous albedo product is derived for the melt season (May to August (MJJA)) for the period 2000–2019. The albedo data are thoroughly validated against available in situ observations from 20 glacier automatic weather stations for the period 2000–2018. The results show that spatio-temporal patterns for the melt season have generally high annual and inter-annual variability for Icelandic glaciers, ranging from high fresh-snow albedo of about 85 %–90 % in spring to 5 %–10 % in the impurity-rich bare-ice area during the peak melt season. The analysis shows that the volcanic eruptions in 2010 and 2011 had significant impact on albedo and also had a residual effect in the following years. Furthermore, airborne dust, from unstable sandy surfaces close to the glaciers, is shown to enhance radiative forcing and decrease albedo. A significant positive albedo trend is observed for northern Vatnajökull while other glaciers have non-significant trends for the study period. The results indicate that the high variability in albedo for Icelandic glaciers is driven by climatology, i.e. snow metamorphosis, tephra fallout during volcanic eruptions and their residual effects in the post-eruption years, and dust loading from widespread unstable sandy surfaces outside the glaciers. This illustrates the challenges in albedo parameterization for glacier surface-melt modelling for Icelandic glaciers as albedo development is driven by various complex phenomena, which may not be correctly captured in conventional energy-balance models.
- Article
(17280 KB) - Full-text XML
- BibTeX
- EndNote


Surface albedo is defined as the unitless ratio of radiant flux reflected from the Earth’s surface to the incident flux. It is a controlling parameter, which governs the portioning of the shortwave radiative energy between the atmosphere and the surface and, therefore, a control of the surface energy balance modulated by the solar zenith angle, cloud optical thickness, cloud cover, and transmission properties of the atmosphere (Klein and Stroeve, 2002; Gardner and Sharp, 2010; Donohoe and Battisti, 2011). The evolution of albedo for impurity-free snow and ice is controlled by the snow metamorphism process where snow-grain size increases with time and lowers albedo at all wavelengths while fresh new snow increases albedo (Warren, 1982). Light-absorbing particles (LAPs), such as sand, mineral and volcanic dust/tephra, black carbon, soot, and algae, in the near-surface layers of the snow and ice further lower the albedo, enhancing the energy absorbed by the surface (Warren and Wiscombe, 1980; Box et al., 2012; Painter et al., 2012; Meinander et al., 2014; Peltoniemi et al., 2015; Dagsson-Waldhauserova et al., 2015; Stibal et al., 2017; Skiles et al., 2018; Zubko et al., 2019).
Optical satellite remote sensing offers a way to observe surface albedo continuously at large spatio-temporal scales but is limited to times of clear-sky overpasses. Various studies have shown that surface albedo over snow and ice can be successfully derived from visible and near-infrared satellite sensors (Stroeve et al., 1997; Reijmer et al., 1999; Stroeve, 2001; Klein and Stroeve, 2002; Liang et al., 2005; Stroeve et al., 2005, 2013). Since October 1978, regular polar coverage has been provided by the National Oceanographic and Atmospheric Administration (NOAA) satellites carrying the advanced very-high-resolution (AVHRR) radiometers (Stroeve et al., 1997; Xiong et al., 2018). The AVHRR sensor has visible, near-infrared, and thermal channels that observe the top-of-the-atmosphere (TOA) radiances under clear-sky conditions, which allows for conversions of narrow-band reflectance measurements to broadband albedo by applying an atmospheric correction and using a radiative transfer model with successful results over snow- and ice-covered surfaces (Lindsay and Rothrock, 1994; de Abreu et al., 1994; Stroeve et al., 1997; Reijmer et al., 1999). Spatial resolution is 4 and 1.1 km depending on the collection mode (global or local), allowing for sufficient representation of surface albedo for larger ice caps or sheets that encompass large areas such as Greenland (Steffen et al., 1993; Zhou et al., 2019) and the main ice caps of Iceland. Higher-spatial-resolution optical data have been obtained from the Landsat constellation (30 m spatial resolution) for albedo retrievals with capabilities to further resolve smaller-scale patterns, more detailed variability of albedo, and sub-pixel variability of large-footprint satellite sensors (Winther, 1993; Reijmer et al., 1999; Gascoin et al., 2017; Naegeli et al., 2017, 2019). Higher-spatial-resolution satellite data generally have the disadvantage of lower temporal resolution, which excludes the possibility of daily albedo observations.
Since February 2000, the Moderate Resolution Imaging Spectroradiometer (MODIS) instrument, on board the NASA Terra satellite, has collected daily multi-spectral radiance data (36 spectral bands) viewing the entire Earth's surface every 1 to 2 d at 500 m spatial resolution. Followed by the NASA Aqua satellite launch in July 2002, also carrying the MODIS sensors, MODIS data have significantly improved understanding of global earth and lower-atmosphere processes and dynamics. Various albedo products for snow- and ice-covered surfaces have been developed and analysed to further understand the inter-annual and seasonal variability of albedo for glaciers and ice sheets (Stroeve et al., 2005; Box et al., 2012; Möller et al., 2014; Gascoin et al., 2017).
Glacier research is important in Iceland for several reasons. Seasonal glacier melt is essential for hydropower production and meltwater storage in reservoirs as the energy system is strongly dependent on glacier and snowmelt, which provides over 72 % of the total average energy produced in Iceland (Hjaltason et al., 2018). The system isolation and high natural climate variability can pose a risk to the reliability of the energy system as drought conditions, low-flow periods, and years with low summer melt are difficult to predict. Volcanic activity in glacier-covered volcanoes can cause volcanic ash and tephra fallout on glaciers during explosive eruptions, leading to enhanced melt or in some cases isolation of the glacier surface, reducing melt significantly (Möller et al., 2014; Wittmann et al., 2017; ”oller et al., 2019). For Icelandic glaciers, surface albedo is the dominant factor governing the annual variability of surface melt (De Ruyter De Wildt et al., 2002; Guðmundsson et al., 2009), and the correct representation of surface albedo is critical for glacier melt modelling (Schmidt et al., 2017).
Reijmer et al. (1999) found that the temporal and spatial variations in the surface albedo of the Vatnajökull ice cap were reproduced fairly well by using AVHRR data for the 1996 melt season. To confirm this hypothesis, Reijmer et al. (1999) compared in situ data and higher-spatial-resolution remote sensing data from the Landsat 5 Thematic Mapper sensor. The results showed greater variability in surface albedo, implying that the scale of the albedo variations is larger than the AVHRR pixel (1.1 km) could resolve. De Ruyter De Wildt et al. (2002) assessed Vatnajökull glacier albedo using AVHRR images and found a strong correlation (R2: 0.87–0.94) between the mean albedo of the entire ice cap through the melting season and observed specific mass balance for the period 1991–1999. In the accumulation area, average albedo was found to decrease from 80 % down to 60 %, with a gradual decrease during the melt season, while in the ablation area, values as low as 10 % ranging up to 35 %, with considerable variation, were found. Gascoin et al. (2017) indicate a good ability of the MODIS MCD43A3 multi-look product to characterize seasonal and inter-annual albedo changes, with correlation coefficients ranging from 0.47 to 0.90, but high RMSE values in comparison with in situ data. Sub-pixel variability was also investigated using Landsat 5 and 7 data similar to Reijmer et al. (1999) with generally better results. Möller et al. (2014) investigated the influence of tephra depositions from the 2004 Grímsvötn eruption in Vatnajökull glacier using the MODIS MCD43A3 multi-look product in combination with daily observations from the MOD10A1 product. By developing an empirically based model to describe the albedo decrease across the glacier surface caused by the deposited tephra, they found that the tephra-induced albedo changes were largest and most widely distributed over the glacier surface during the 2005 summer season, when the observed albedo decrease reached 35 % compared with modelled undisturbed conditions. A study by Wittmann et al. (2017) for the 2012 melt season states that the positive radiative forcing of airborne dust on Brúarjökull can add up to an additional 1.1 m w.e. (water equivalent) of snowmelt (42 %) compared with a hypothetical clean glacier surface. This represents the influence of volcanic eruptions and airborne dust deposits on the mass balance of Icelandic glaciers. In most cases, dust, and tephra will amplify surface melt due to additional radiative forcing during the melt season, but in some cases, ash layers exceeding a certain critical thickness can cause insulation of the underlying snow and ice. Results by Dragosics et al. (2016) showed that this critical thickness ranged from 9 to 15 mm depending on grain size and material type.
Cloud cover is a major challenge for remote sensing in Iceland; even though data from both Aqua and Terra are used, the number of cloud-covered pixels is still high (Gunnarsson et al., 2019). For albedo derived from the MODIS MCD43A3 product, the strict processing criteria of the multi-look product reduce the number of usable pixels even further than collected by Aqua and Terra. This is especially true at higher elevations for Vatnajökull where persistent cloud cover is frequently observed, resulting in fewer valid albedo pixels during the melt season. Melt increase from dust and ash deposit events is observed to extend the active melt area of the glaciers, i.e. LAP deposit in the accumulation area, increasing melting. Therefore data from these areas are very important for monitoring and forecasting runoff from glaciers in Iceland. Lag times of MCD43A3 (14–16 d) make this less feasible for near-real-time monitoring and operational modelling, for example, in the case of a major dust deposit or volcanic eruption. Additionally, MCD43A3 is not gap-filled, requiring some post-processing prior to monitoring or hydrological modelling efforts.
This study aims to address some of the shortcomings of the MCD43A3 product for glaciers in Iceland and derive an albedo data set suitable for operational use as well as a scientific study of spatial and temporal variations in albedo. The daily M∗D10A1 products were chosen to increase temporal resolution, allowing for more flexibility in post-processing, statistical filtering, and near-real-time data posting. There are two main objectives of the study. The first objective is to create a gap-filled MODIS-based surface-albedo product for glaciers in Iceland for this time period from 2000 to 2019 validated with in situ data suitable for the monitoring and modelling of glaciers in an operational context. Second, the resulting gap-filled product was used to analyse and quantify spatio-temporal patterns of albedo for Icelandic glaciers for the time period, with monthly statistics and a detailed interpretation of the variation in albedo with elevation and trends over time.
Figure 1 shows a location map of the Icelandic glaciers referred to in the study. These were glaciers that are at least 2 km2 or eight unmixed MODIS pixels. For the larger glaciers, Vatnajökull, Langjökull, Hofsjökull, Mýrdalsjökull, and Drangajökull, smaller areas were defined to represent the main ice flow basins of the glaciers for more detailed analysis.
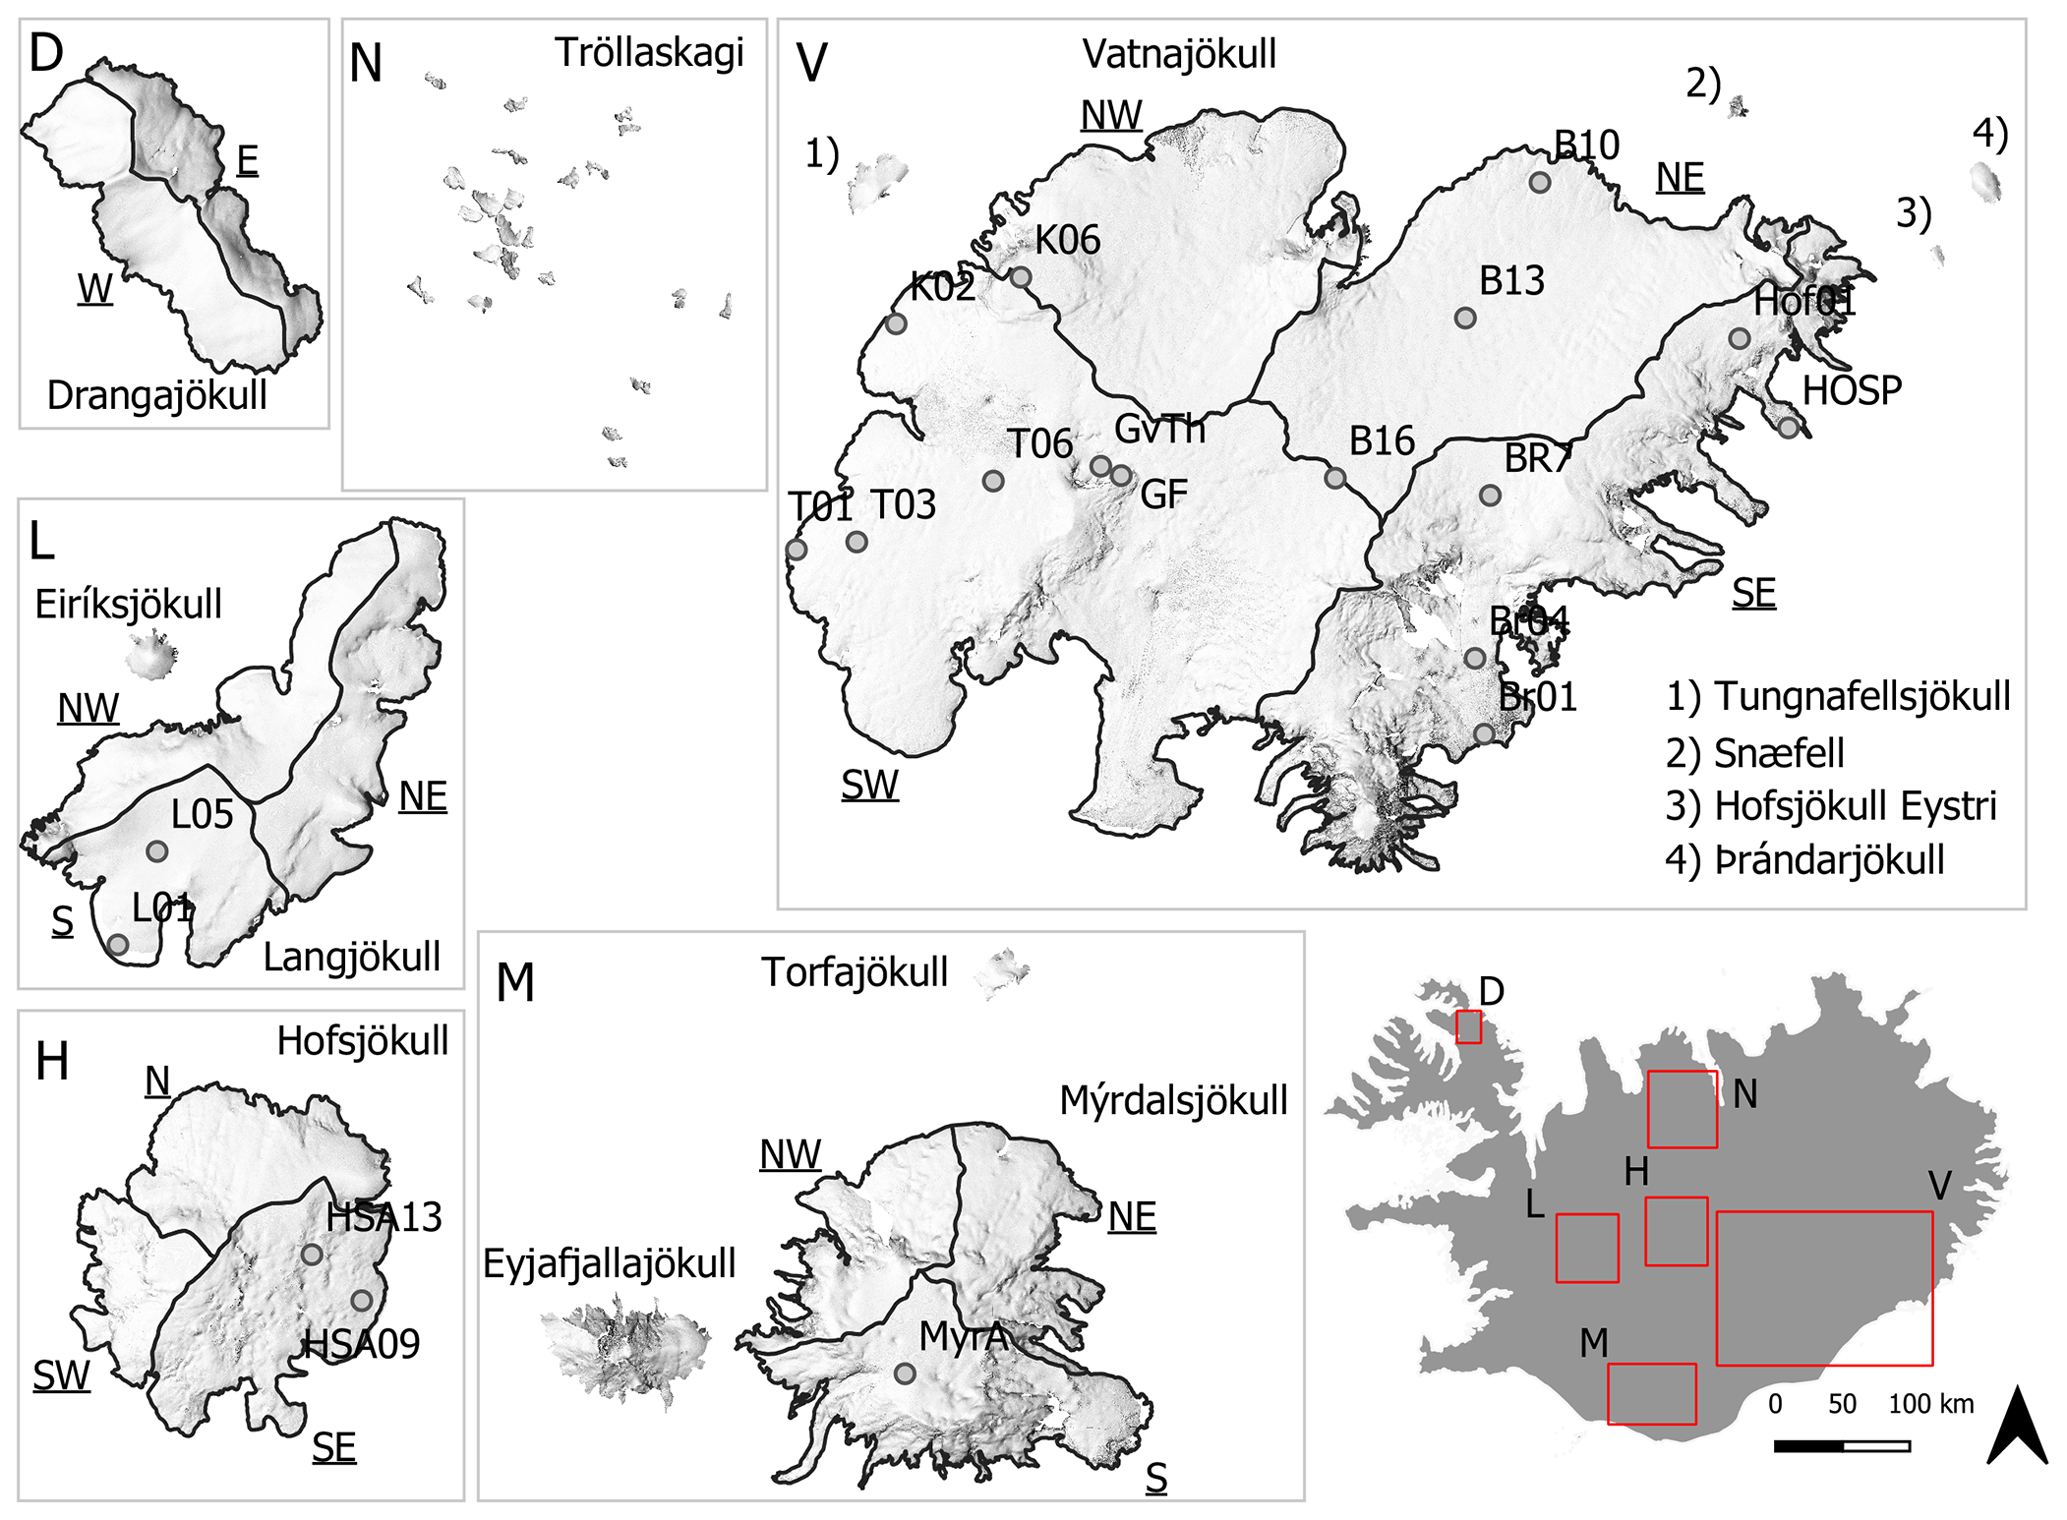
Figure 1Location map of Icelandic glaciers used in the study. These were glaciers that were at least 2 km2 or eight unmixed MODIS pixels. For the larger glaciers, Vatnajökull, Langjökull, Hofsjökull, Mýrdalsjökull, and Drangajökull, smaller areas are defined to the main ice flow basins of the glaciers for further analysis. These delineated areas are annotated with underlined text (e.g. NW for northwest). In total, 28 areas are processed, including the sub-areas, but small mountain glaciers in northern Iceland were merged into one processing unit. Available glacier automated weather stations are shown with grey dots. Further details of these stations are given in Table 1. A shaded relief representation of a glacier DEM is from Jóhannesson et al. (2013) and catchment delineation from Magnússon et al. (2016), for Drangajökull, Björnsson (1988) and Björnsson et al. (2000) for Hofsjökull and Mýrdalsjökull, and Pálsson et al. (2015, 2020a) for Langjökull and Vatnajökull.
2.1 MODIS products
Daily snow cover data products calculated from the MODIS spectroradiometer on the NASA Terra (MOD10A1 V006) and Aqua (MYD10A1 V006) platforms were obtained from the National Snow and Ice Data Center (NSIDC). The products provide daily estimates of snow cover and blue-sky albedo and a quality assessment at 500 m spatial resolution for cloud-free conditions at the satellite platform overpass (Hall and Riggs, 2016a, b). Daily albedo calculations use reflectances of the first seven visible and near-infrared bands of the MODIS spectroradiometer (459–2155 µm) which have been corrected for atmospheric effects. To correct for anisotropic scattering effects of snow and ice, the DIScrete Ordinates Radiative Transfer (DISORT) model is applied. The daily estimated blue-sky albedo corresponds to the broadband albedo for actual direct and diffusive illumination (Klein and Stroeve, 2002) and is therefore directly comparable to field observations with broadband radiometers (Stroeve et al., 2013). For comparison and validation purposes, the multi-look MCD43A3 albedo product V006 was obtained as well from LP DAAC (Schaaf and Wang, 2015). MCD43A3 provides daily albedo using 16 d of Terra and Aqua MODIS data at 500 m resolution. Data are temporally weighted to the ninth day of the 16 d. The MCD43A3 product provides black-sky albedo (directional hemispherical reflectance) and white-sky albedo (bihemispherical reflectance) data at local solar noon for the same bands as used in M∗D10A1 albedo products.
The quality of remotely sensed albedo retrievals decreases during autumn and winter as the incoming solar irradiance and solar incidence angle decreases. With an increase in solar zenith angles (SZAs) and especially beyond 70∘, the accuracy of satellite- and ground-based instruments declines for albedo retrievals. This results in cases where unrealistic and unexpected values are observed and often exceed expected maximum clear-sky snow albedo. Due to polar darkness (SZA >85∘), MODIS data are generally not available from mid-November until mid-January each year over Iceland (Dietz et al., 2012). Cloud cover in Iceland also poses a challenge when using optical remote sensing as average cloud cover ranges from 70 % to 90 % with little inter-annual variability (Gunnarsson et al., 2019).
The scope of this study was limited to the melt season of Icelandic glaciers, when SZAs are low and incoming solar irradiance is high (MJJA). Every granule from MODIS tile h17v02 was used in this project as it covered all the central highlands in Iceland and left out only a small portion of the western Snæfellsnes peninsula and the Westfjords.
2.2 Meteorological in situ data
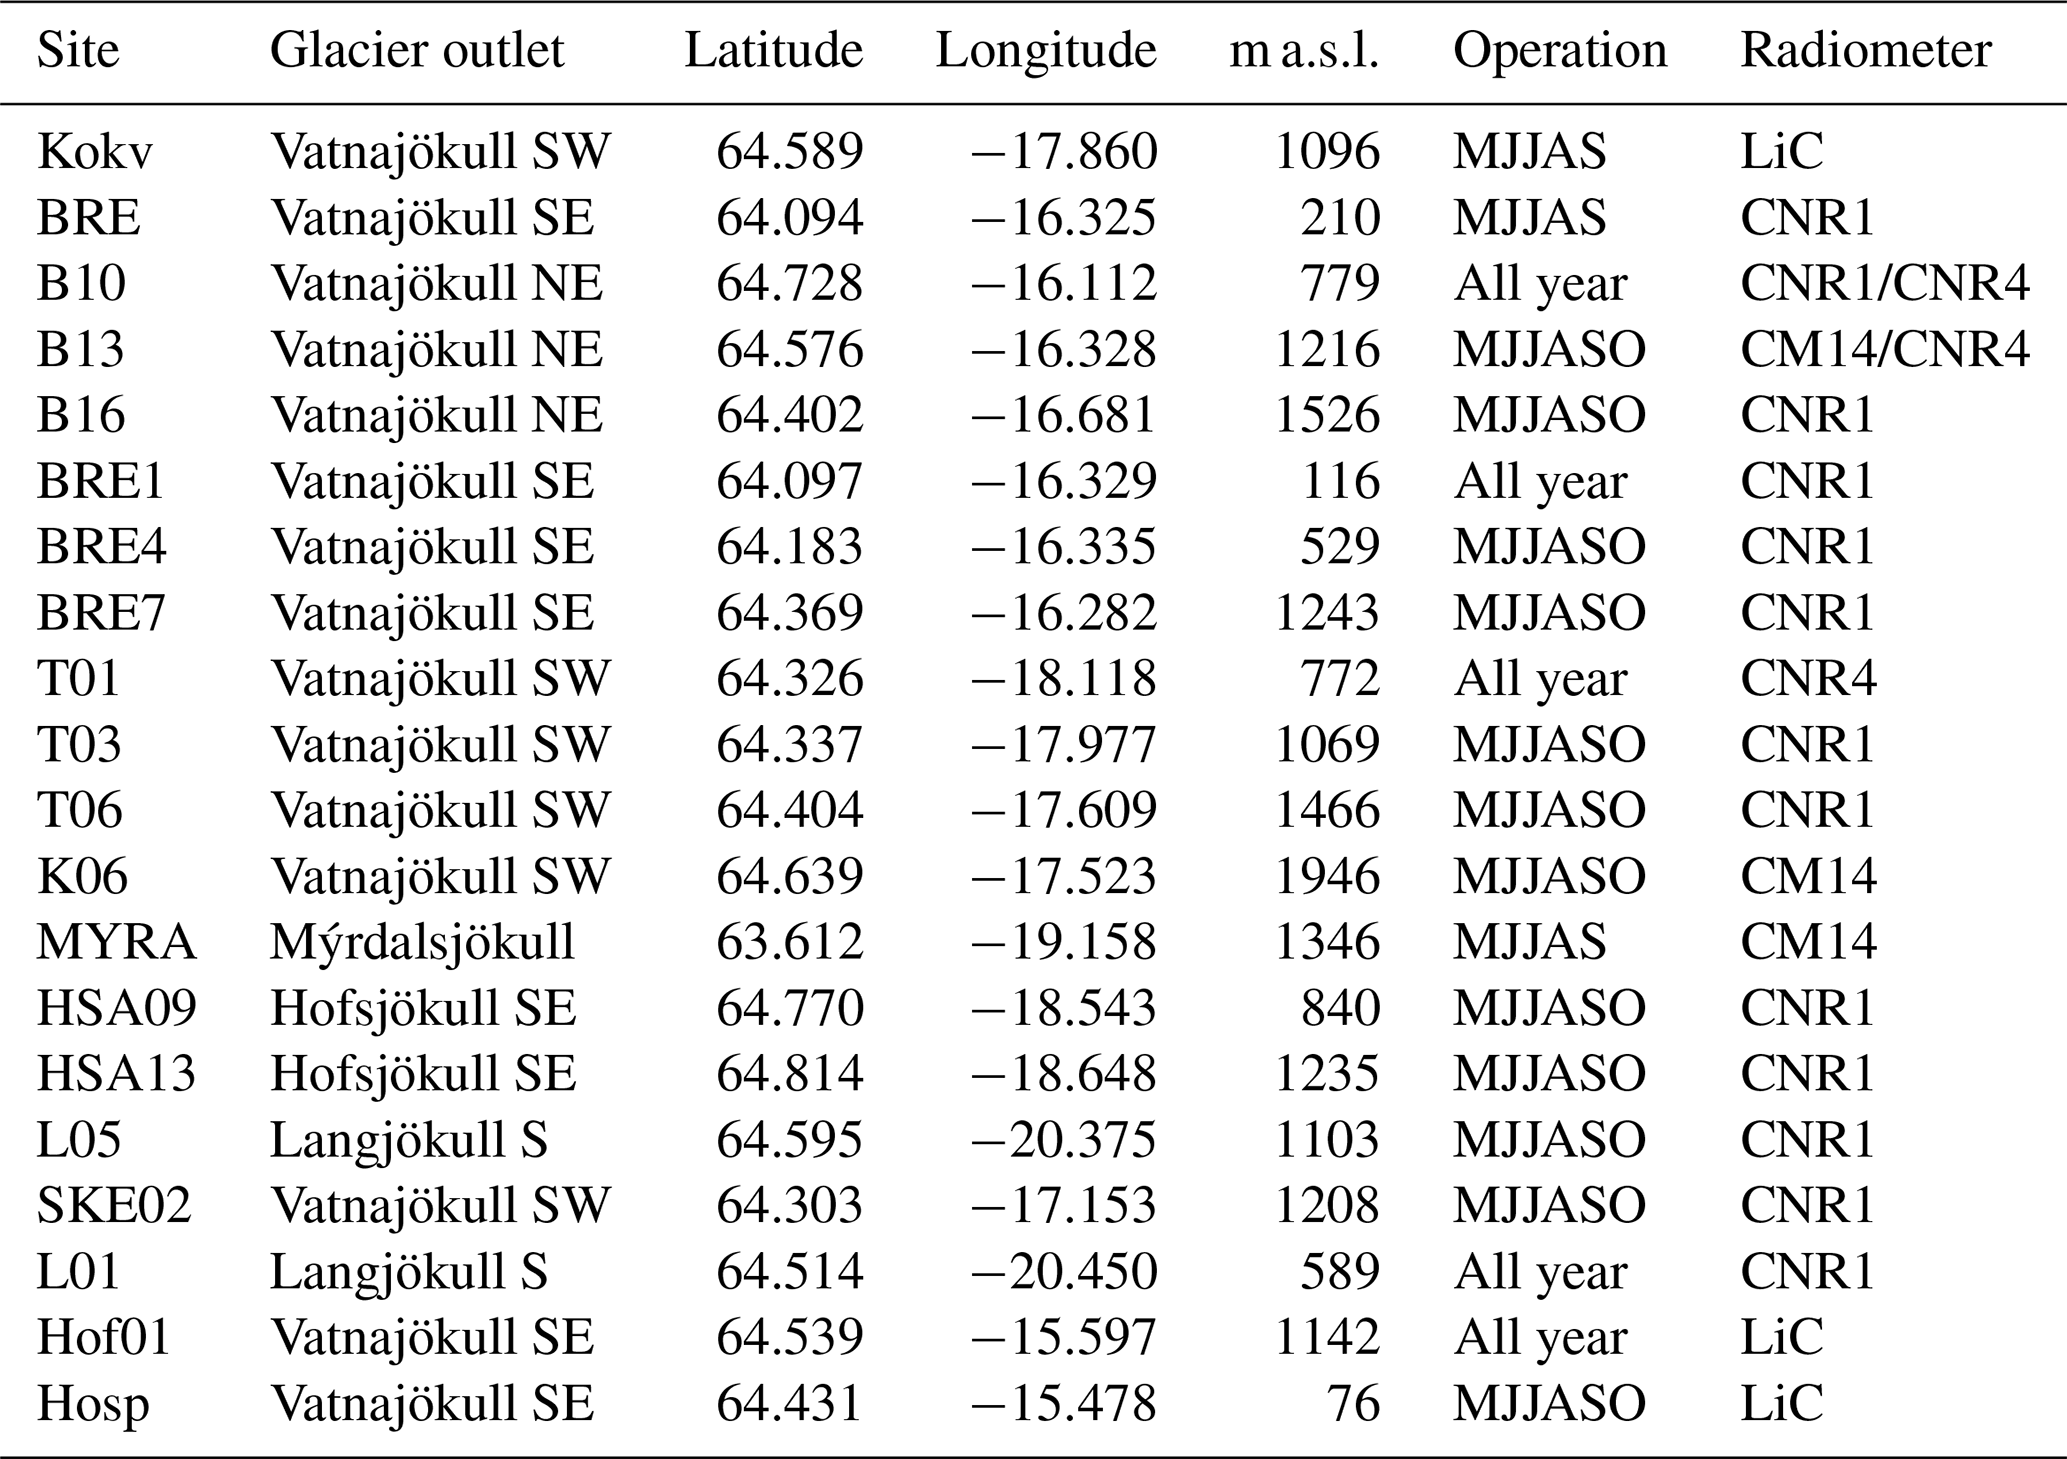
The Icelandic Glacier Automatic Weather Stations network (ICE-GAWS) has provided automatic weather-station observations from Vatnajökull, Langjökull, Hofsjökull, and Mýrdalsjökull since 1994, 2001, 2016, and 2015, respectively. Most stations in the network were operated during the extended melt season (MJJASO) annually, while a few sites were operated all year round. All sensors were tested and validated annually before deployment in the field in spring. Locations of the sites are shown in Fig. 1, and location, elevation, observation period, and radiometer instrumentation are shown in Table 1.
Radiation was measured with a net radiometer equipped with two pyranometers facing upward and downward, respectively, used to measure the incident (SW↓) and reflected shortwave radiation (SW↑) as a 10 min average. The ratio of both quantities allowed the bi-hemispherical albedo of the surface to be estimated. For comparison purposes in this study, daily integrated albedo is used instead of selecting the hourly-mean albedo measured closest in time to the satellite overpasses. Daily integrated albedo was calculated as the running 24 h sum of upward shortwave divided by the running 24 h sum of the downward shortwave. This method minimizes the effect of solar zenith angle on the accuracy of the albedo estimation and is less sensitive to radiometer level and cosine response errors since it integrates errors that partly cancel each other (Box et al., 2012). Daily integrated albedo has been shown to represent the daily variability of the glacier surface but only partially represent diurnal variability, such as onset of melt (Stroeve et al., 2005).
Most sites in the GAWS network used Kipp and Zonen CM14, CNR1, and CNR4 radiation sensors which have relatively uniform spectral response ranging from 0.3 to 2.8 µm with uncertainty that has been reported to be 3 to 10 % for daily totals over ice- and snow-covered surfaces (Van den Broeke et al., 2004b, a; Guðmundsson et al., 2009; Kipp and Zonen, 2019). The LI-COR 200 SZ pyranometers were used at a few sites. They have reduced spectral response (0.4 to 1.1 µm) compared with the Kipp and Zonen instruments. Tilting of the instruments with respect to the glacier surface was not monitored and could add to the uncertainty, especially in the ablation zone of the glaciers (Van den Broeke et al., 2004b). The incoming and reflected shortwave measurements from 20 AWSs during the period 2000–2018 were used to validate the MODIS remotely sensed albedo products.
Manual quality control of the data was done by screening shortwave and albedo data and removing obvious errors, periods when stations are buried in snow and calibration periods prior to site instalment in spring. Obvious cases of instrument failure were also rejected. Observations of upward solar irradiance exceeding downward solar irradiance were also removed. Quality control was carried out on the data at an hourly time step prior to aggregating to daily and monthly time steps. Daily albedo values were calculated from sums of hourly radiation averages if within each day at least 20-hourly values or more were available and monthly averages were calculated from daily values if within each month 24 daily values or more were available.
Table 1Overview of average location, elevation, average operating period, and radiometer instrument of the GAWS network used for validation. All stations have temperature probes while GV (Grímsvötn) and GF (Grímsfjall) only observe temperature and incoming shortwave irradiation. Location and elevation are based on the average location of the site for the observation period, i.e. mean location values for multi-year installations which might not be the exact same location from one year to another.
2.3 Data processing
2.4 MODIS data processing
From the MOD10A1 and MYD10A1 daily data tiles, the MOD Grid Snow 500 m grid and the grid variable Snow Albedo Daily Tile were used for the albedo analysis. Snow albedo is reported in the range 0–100 where the snow and ice cover mask in the M∗D10A1 product identifies whether a pixel is snow-covered or not. A processing pipeline for MODIS snow-albedo data was partly adopted from Box et al. (2012), with modifications and adoptions for Icelandic glaciers.
Temporal aggregation was applied to the MOD10A1 and MYD10A1 data to reduce the number of unclassified daily pixels due to clouds at the overpass time. The temporal aggregation range was set as the number of days backwards and forwards at each centre date (t=0) to merge to a single stack for further processing. A temporal aggregation range of 5 d backward and forward ( d) was selected; i.e. in total 11 d can contribute data to the temporally aggregated product. A total of 22 values are potentially available for each pixel (i.e. 11 d of MOD10A1 and 11 d of MYD10A1). This reduces by 66 % the number of pixels classified as no data (cloud cover, detector saturation, etc.). Extremely high MODIS albedo values from the original products (MOD10A1 and MYD10A1) (α>90 %) are excluded as these are considered unrealistic values under clear skies (Konzelmann and Ohmura, 1995; Box et al., 2012).
Cloud cover is known to be a major challenge in optical remote sensing of the Earth surface, especially for snow- and ice-covered surfaces. Various methods exist to differentiate between clouds and snow- and ice-covered surfaces (Ackerman et al., 1998; Sirguey, 2009), but omission errors are difficult to avoid completely, leading to misclassification of surface albedo and clouds. Manual inspection of the raw MODIS albedo data for Icelandic glaciers revealed misclassified pixels due to various artefacts such as cloud boundaries, cloud shadows, contrails, cirrus clouds, and fog, especially in the glacier terminus area. These artefacts create abrupt changes in the surface-albedo time series, making it possible to reject them based on the temporally aggregated data statistics. On a pixel-by-pixel basis, the method of Box et al. (2012) was applied to reject values exceeding 2 standard deviations from the 11 d temporally aggregated data stack. The method is only applied if 4 or more pixels in the data stack have valid albedo data. To prevent rejection of valid data, values within a certain threshold of the median were not rejected to account for albedo changes. The outlier thresholds were manually adjusted, mostly related to the elevation of the glaciers, ranging from 1 % to 4 %, for higher to lower elevation, respectively. This means that data from the 11 d temporal aggregate were not rejected, even if the difference between the albedo value and the median was greater than 2 standard deviations, if the difference falls within the pixel-defined threshold value. From the 22 potentially available values, the mean is calculated to represent the surface albedo, after median-based statistical rejection of outliers.
An important aspect of M∗D10A1 products is that they only provide albedo of pixels detected as snow covered while MCD43A3 provides albedo over all land masses. This does limit the application of the method presented here during or after an explosive volcanic eruption event with thick tephra depositions. Similarly, tephra plumes discharged into the atmosphere with high tephra concentrations might further induce misclassifications during explosive eruptions. In this study, during periods of volcanic eruptions, the outlier thresholds are not applied, allowing a greater range of expected albedo values, especially lower values at higher elevations where tephra deposits were observed. This applies to the melt seasons 2010 and 2011. Visual inspection of the gap-filled product during these periods was used to validate the performance of MCD11. In most cases, the method presented here was able to reconstruct albedo with acceptable accuracy, as shown in Sect. 3.1.
Figure A3 shows an example for a date after the eruption in Grímsvötn in 2011 (18 June 2020) with the original M∗D10A1 products, MCD43A3 and MCD11 after median-based outlier removal and gap filling. The performance of MCD11 is good while the figure also illustrates the challenge with pixel availability for MCD4A3. The gap-filling method is capable of reconstructing albedo values in areas with thick tephra deposits.
Finally, after temporal aggregation, outlier removal, and statistical filtering, the remaining pixels classified as clouds were classified statistically with four predicting variables, location (easting, northing), elevation (Z), and aspect, with a daily trained random forest model (Matlab, 2017). Topographic and masking data for ice-covered surfaces were obtained from the National Land Survey of Iceland. The original digital elevation model was a raster with a 10 m spatial resolution which is resampled to match the grid of the MODIS pixels using bilinear sampling (GDAL/OGR contributors, 2019). Aspect was then calculated for each pixel. To evaluate the model classification performance, 25 % of the classified data from the temporal aggregation were withheld for comparison purposes. The average RMSE of the classified data was 3.49 %, with a standard deviation of 0.80 %, for the period from May to August. On a monthly basis the lowest RMSE was observed in May (μ: 3.17 %, σ: 0.80 %) and the highest in August (μ: 4.03 %, σ: 0.83 %) while June and July fall in between. For individual years the RMSE values were highest in 2010 (μ: 4.02 %, σ: 1.42 %) and 2011 (μ: 4.73 %, σ: 1.32 %) for MJJA averages. This was most likely due to the volcanic eruptions in Eyjafjallajökull in 2010 and Grímsvötn in 2011. This resulted in volcanic tephra depositions on Icelandic glaciers that poorly correlate to topographic patterns of albedo as the random forest model was trained on location, elevation, and aspect. The final output, a daily gap-filled albedo grid, which was used for further processing, is hereafter referenced to as MCD11.
For MCD43A3 multi-look data to be comparable with GAWS data, the blue-sky albedo was calculated as the average between the black-sky albedo and the white-sky albedo tiles in the product, assuming a constant fraction of diffuse illumination as done by Möller et al. (2014) and Gascoin et al. (2017) in previous studies of Icelandic glaciers. For cloud cover estimations, daily valid pixels in MOD10A1 (AM overpass) and MYD10A1 (PM overpass) were merged into a single daily product, representing average daily cloud cover.
To quantify the changes in albedo over time, trends were calculated. The calculations are pixel-based from annual MJJA averages for the period 2000–2019. Significance of the estimated trends was calculated using the non-parametric Mann–Kendall test that detects the presence of a monotonic tendency in chronological data and identifies trends in data over time without an assumption of normality (Helsel and Hirsch, 2002). Trends are considered statistically significant when then the p value is lower than 0.05. For this study, glacier boundaries delineated in 2010 and 2012 were used for Vatnajökull, and boundaries in 2007 and 2008 were used for Langjökull and Hofsjökull, respectively. This was selected as a midpoint representing an average glacier area during the period 2000–2019. This needs to be considered when interpreting rapid changes at the glacier terminus, as some areas in 2000 were part of an active glacier but might in 2019 be dead ice or land.
3.1 MODIS albedo validation
Figure 2 shows the comparison results for MJJA for MCD11. Overall good visual and statistical agreement is found between the MODIS MCD11 data and in situ albedo from GAWS observations. For the whole period from May to August, the RMSE is 7.2 % with an R2 of 0.9. The GAWS observation network captures a wide range of melt season variability of albedo ranging from 6 % to 90 % which is well captured with the MODIS MCD11 product as demonstrated by the overall high correlation coefficients. Based on linear regression (red lines in Fig. 2) for all months, albedo was slightly underestimated for higher values (albedo ) and slightly overestimated at lower values by the MODIS MCD11 product. Various reasons could contribute to these differences, such as sensor accuracy and instrument installation configuration (i.e. tilting, riming on the sensor dome). In the ablation zone, where the lowest albedo values were observed, high melt rates (surface lowering of 3–7 m) can contribute to progressive tilting of the instruments over the ablation period. Large sand, dust and tephra-covered areas have been observed in the instrument footprint during field visits, as well as melt channels and small meltwater ponds offsetting the spectral properties of the surface compared with the spectral response of snow and ice, inducing errors in the comparison between in situ and remotely sensed albedo. The temporal aggregation of the remotely sensed data includes a dampening effect on the MCD11 data compared with the GAWS observations, which may partially explain outliers in July and August when the in situ observations are higher than the MCD11. Extensive snowfall events, occurring under cloud cover and limiting accurate data retrievals by the satellites, will lead to albedo that is not correctly represented in the MCD11 reconstruction due to the 11 d temporal aggregation.
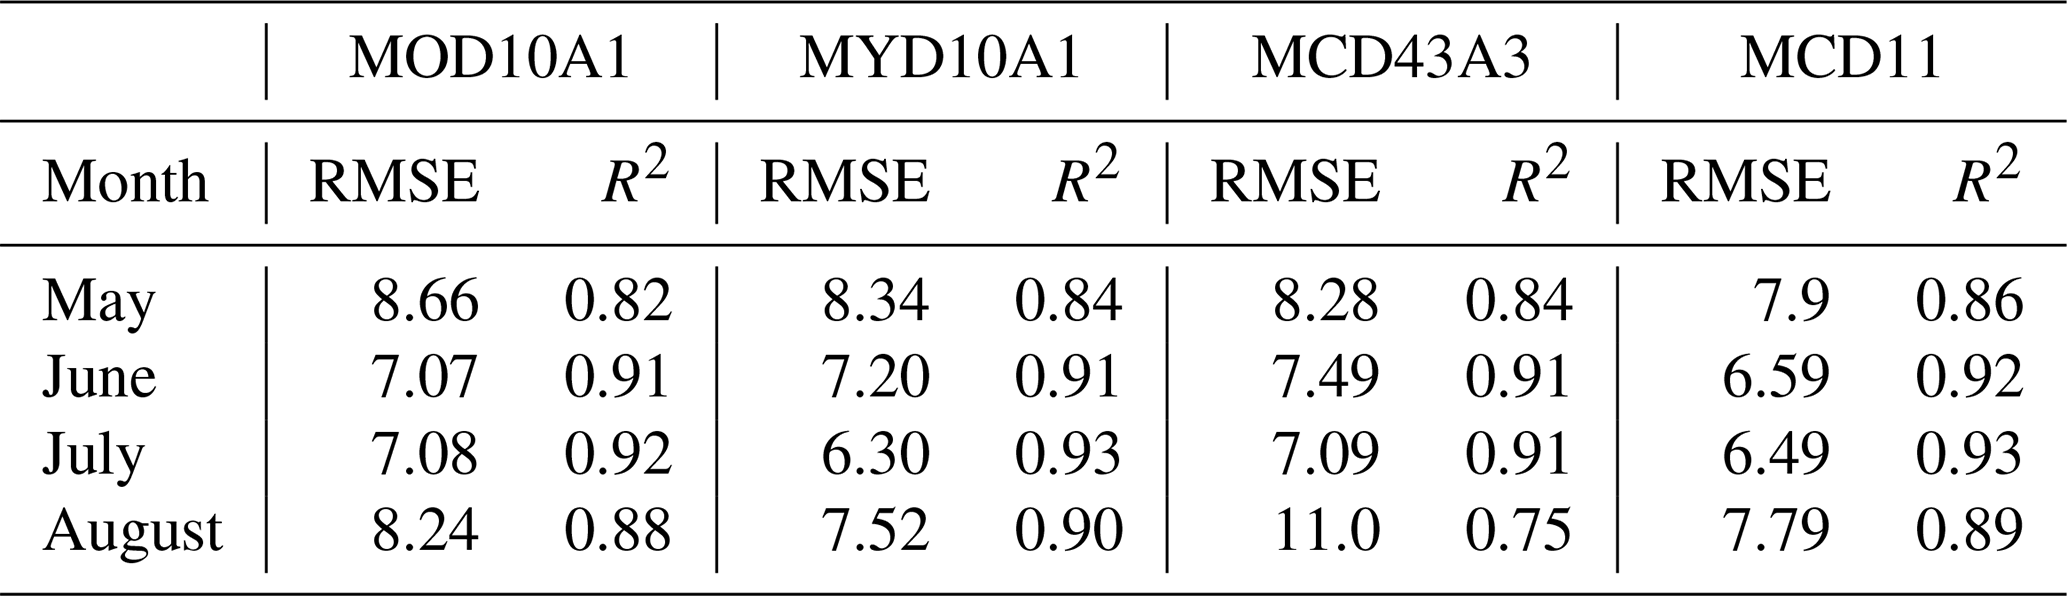
Table 2 shows a comparison of MCD11 with other albedo products from MODIS, i.e. MOD10A1, MYD10A1, and MCD43A3. In most cases, the MCD11 product had lower RMSE values and higher correlation coefficients, indicating successful removal of spurious values such as misclassified clouds, image stripes, and other artefacts in the original MODIS products. No correlation was found between RMSE and GAWS location (elevation or glacier/location). No further adjustments or calibrations are applied to the MCD11 product in the rest of this study. Table A1 shows validation results for individual stations for MOD10A1, MYD10A1, MCD43A3, and MCD11.
The comparison presented here is in fact similar to previous work on Icelandic glaciers by Gascoin et al. (2017) where the MCD43A3 was evaluated with RMSE values ranging from 8 % to 21 %, although the results from Gascoin et al. (2017) are based on daily values. Various studies in Greenland using in situ AWS report lower RMSE values, ranging from 2.8 % to 5.4 % on a monthly basis for MOD10A1 using 17 stations for validation by Box et al. (2012) and a total RMSE of 6.7 % in a study by Stroeve et al. (2013) using MCD43A3 high-quality retrievals. It is important to consider how representative point-based in situ observations are (observing ∼ 120–180 m2; Kipp and Zonen, 2019), compared with the spatial footprint of the MODIS data (0.25 km2), especially in glaciated areas with high spatial albedo variability and MODIS sub-pixel variability as is observed in the bare-ice areas of the Icelandic glaciers.
Sub-pixel variability has been investigated by Reijmer et al. (1999), Pope et al. (2016), and Gascoin et al. (2017) for Icelandic glaciers. The study by Reijmer et al. (1999) using AVHRR and Landsat TM data at Vatnajökull reported large systematic differences for some of the automatic weather stations on the ice, attributed to sub-pixel-scale variations in the albedo. Results implied that the scale of the albedo variations was smaller than the scale of the AVHRR and TM pixels. Pope et al. (2016) studied high-resolution (5 m) airborne multi-spectral data collected over Langjökull in 2007, with comparison to near-contemporaneous Landsat ETM+ and MODIS imagery showing albedo to be highly variable at small spatial scales. Work by Gascoin et al. (2017) suggested that the RMSE of the difference between the in situ automatic weather station data and MODIS data tends to increase when the corresponding Landsat sub-pixel spatial variability is higher. Lower standard deviation values were consistently obtained where the surface was less heterogeneous (accumulation areas).

Figure 2Comparison of monthly-averaged MODIS albedo with in situ GAWS albedo observations for May, June, July, and August for the period 2000–2019 where data were available for the MCD11 data product.
Table 2Comparison of MODIS albedo products (MOD10A1, MYD10A1, MCD43A1, and MCD11) with GAWS in situ albedo on a monthly timescale.
3.2 Gap-filled albedo
Figure 3 shows the average cloud cover for the main Icelandic glaciers from April to September, based on daily MODIS data from Aqua and Terra. This highlights the challenges for optical satellite remote sensing in Iceland due to cloud obscurity problems. The average cloud cover for glaciers was 73.8 % for MJJA and slightly higher for AMJJAS, at 74.4 %. Monthly variability within the melt season was low, with the highest values seen in April, July, and September (78 %, 76 %, and 75 %, respectively) and lower values in May, June, August, and October (73 %, 73.5 %, 72.8 %, and 72.8 %, respectively; individual months are shown in Fig. A1). The highest average cloud cover was observed for Eyjafjallajökull (80.3 %), Drangajökull (79.6 %) and Mýrdalsjökull (77 %) for melt season averages while the other glaciers have lower average cloud cover ranging from 71 % to 74 %.
A figure showing a similar pattern as Fig. 3 was presented by Gascoin et al. (2017). Figure A1 additionally shows average monthly cloud cover from May to September depicting how the cloudiness pattern varies within the melt season, indicating how cloud cover affects incoming short-wave radiation. The figure in Gascoin et al. (2017) also shows the mean annual number of days with missing data during the period 2001–2012 based on data available within a 16 d period in the MCD43A3 product. Their figure also highlights the data availability limitation of the MCD43A3 product, especially for Vatnajökull as previous discussed.
The average daily cloud cover in MOD10A1 data was 79 % and slightly lower for MYD10A1, at 78 %, based on data from April to October each year for the period 2000–2019. By joining these two products on a daily basis, cloud-obscured pixels were reduced to 74 %. Temporal aggregation (11 d) of the products had an exponential decaying shape of unclassified pixel reduction, with the highest benefit for aggregating 1 d. For this study, data were aggregated 5 d forward and backward, allowing 11 d of both Aqua and Terra MODIS albedo data to contribute to a daily average. This resulted in an average unclassified pixel reduction down to 12 %.
The main advantage of the temporal aggregation of the data was the reduction of cloud-obscured pixels, which provides a more spatially continuous product in a simple and computationally efficient way. This comes with the primary disadvantages of response dampening of rapid changes, experienced as a smoothing effect on the albedo time series. This could pose a limitation on daily near-real-time flow forecasting, while for weekly to monthly time scale applications, the product should be representative. Cloud detection in the MODIS products is based on the M∗D35−L2 cloud mask providing four categories for discrimination of clouds, i.e. cloudy, uncertain, probably clear, and confidently clear. Cloud and snow confusion is known to be present in MODIS data for many reasons, such as cold clouds with ice content, very similar spectral responses to snow of some cloud types, and cirrus clouds that are not detected (Sirguey et al., 2009; Box et al., 2012). The approach in this study to reduce cloud artefacts is based on robust statistics with a median-based outlier removal. The drawback of this approach is that with a too strict criterion for rejection, valid data could be rejected, with loss of good quality data, especially in cases where surface albedo changes rapidly.
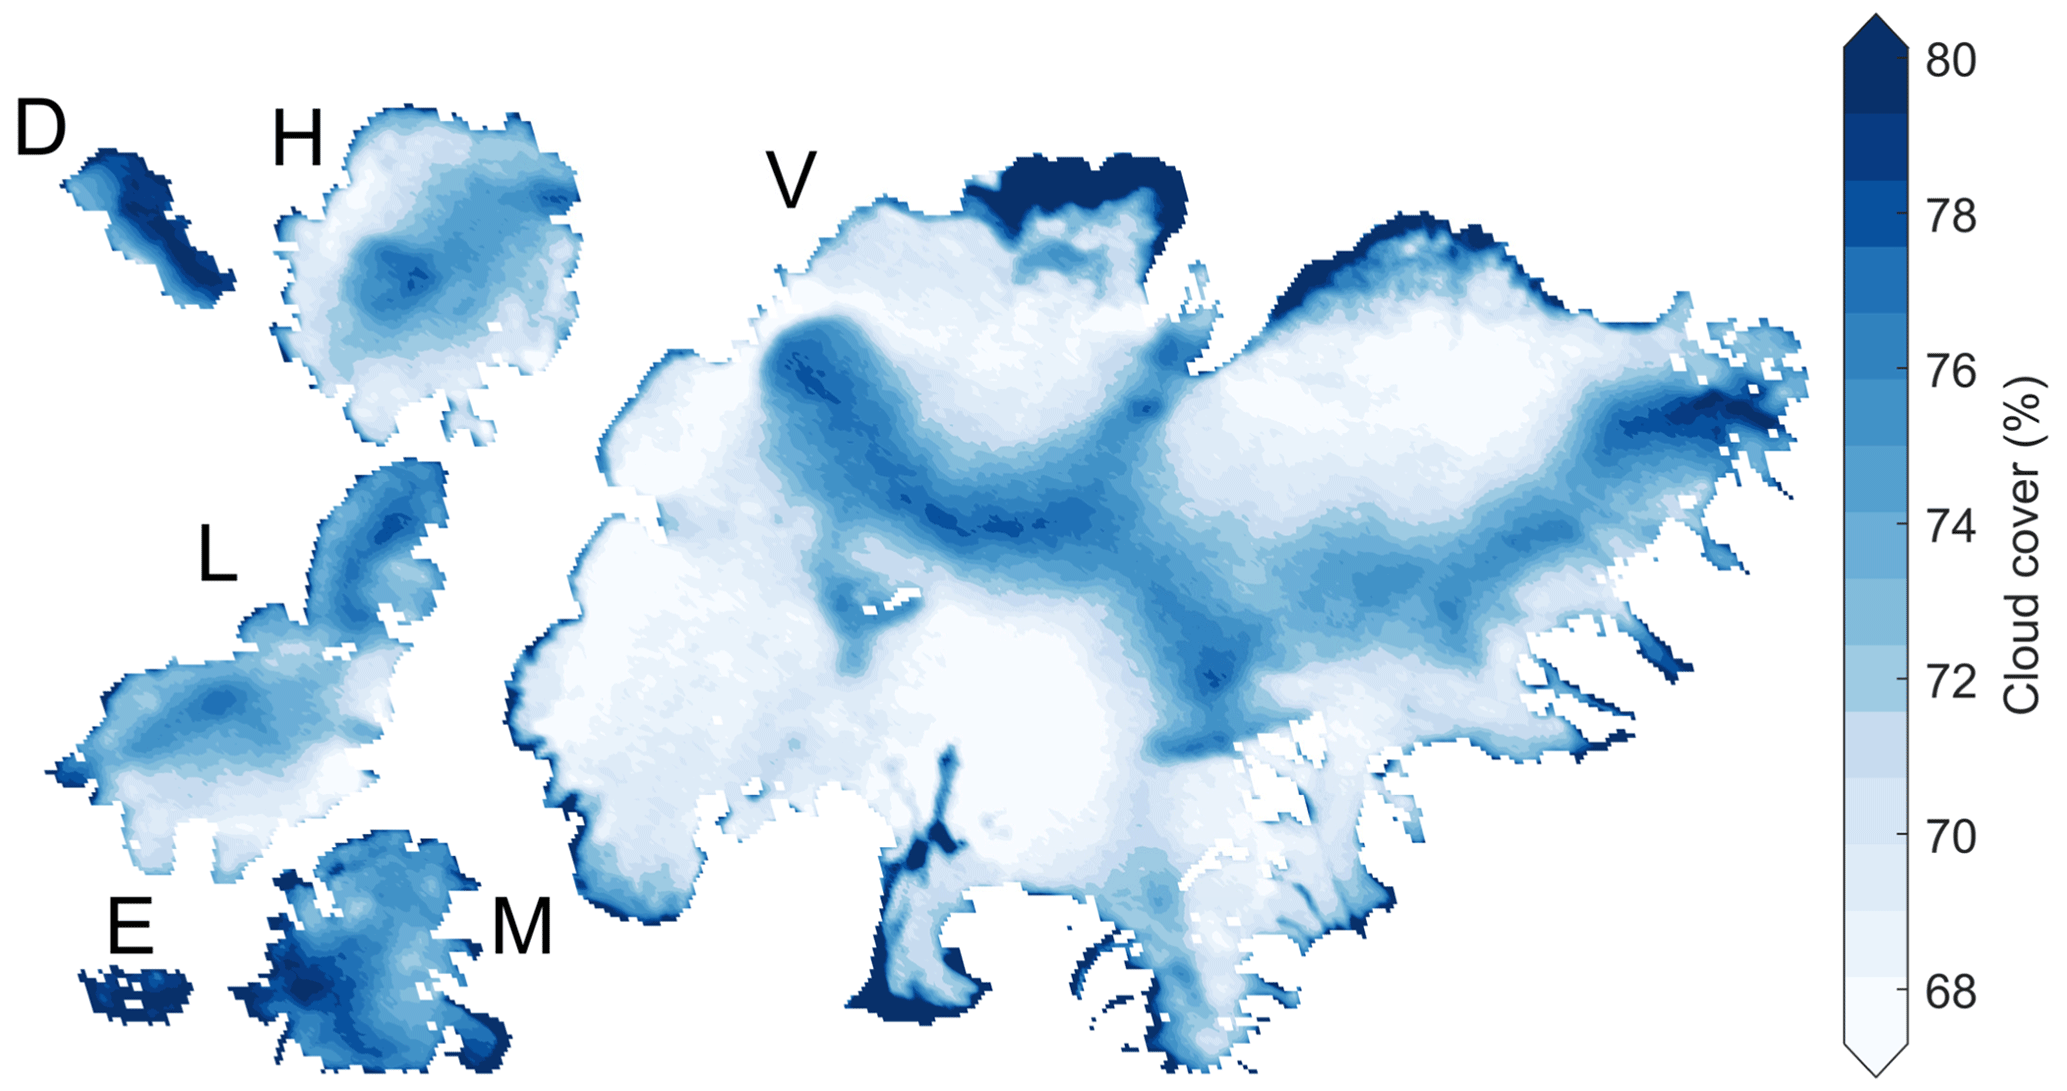
Figure 3Average cloud cover for the main Icelandic ice caps for the extended melt season from May to September each year from 2000–2019 (average: 73.8 %).
3.3 Annual and inter-annual variability of albedo
Inter-annual albedo variations for Icelandic glaciers were generally high. Figure 4 shows spatial patterns for melt season mean albedo for the investigated glaciers for the period 2000–2019 (MJJA). The lowest albedo values (<35 %) were found in bare-ice areas where the winter snow cover is generally completely ablated during summer, revealing dirty and impurity-rich bare ice. Higher albedo values (>45 %–50 %) were found in the accumulation areas associated with higher elevations and a shorter period of positive surface-energy balance during the melt season.
Figure 5 shows the average albedo distribution and relations to elevation in 100 m bands for the six largest ice caps and their sub-areas defined in Fig. 1. Above 1500 m a.s.l. at Vatnajökull there was limited regional variability while more distinctive patterns were seen between the northern and southern parts, especially in the southeast at lower elevations. In the southeast, the elevation of the glacier ranges all the way down to sea level while the glacier terminus was at a much higher elevation in the north (600–700 m a.s.l.). The average albedo–elevation relationship for Vatnajökull exhibits three elevation gradients. For elevations below 700 m a.s.l. the linear albedo gradient was ∼ 2.3 %/100 m, ∼ 5.1 %/100 m between 700–1300, and ∼ 0.5 %/100 m for elevations above 1300 m. For Hofsjökull, the albedo was generally lower in the southeast than in the northern and southwestern parts; the average albedo elevation gradient below 1400 m a.s.l. was 4 %/100 m and 1.5 %/100 m above 1400 m a.s.l. For Langjökull, the south and northeast areas had overall lower average albedo values compared with the northwestern part of the glacier. At Langjökull, the albedo elevation gradient was 3.5 %/100 m for the whole elevation range, which was similar to elevations below 1400 m a.s.l. at Hofsjökull, but note the start of a change towards a lower gradient at the higher elevations. The northwest part of Mýrdalsjökull had generally higher albedo compared to the southern part. The albedo gradient is 3 %/100 m for the whole elevation range. Distinctive patterns were observed for the east and south parts of Drangajökull, with lower average values for the south region. A very strong east–south cloud cover gradient also observed at Drangajökull (Fig. 3) could explain these differences, indicating that less SW↓ reaches the surface, accelerating the snow metamorphism and resulting in lower albedo. The average albedo elevation gradient was 3.0 %/100 m for Drangajökull and 2.7 %/100 m for Eyjafjallajökull. In general for Eyjafjallajökull, the southern parts of the main ice caps had a lower albedo. This was most likely controlled or strongly influenced by orographic generation of precipitation in the dominating SW–SE wind, providing more energy from rain and warmer temperatures at the surface, accelerating the snow metamorphism (Einarsson, 1984; Crochet et al., 2007; Björnsson et al., 2018). Local lower albedo gradients at Hofsjökull (SE), Langjökull (S), and Mýrdalsjökull (S) coincide with documented locations of severe or extremely severe dust source areas described in Arnalds et al. (2016).
Figure 6 shows the average distribution of albedo as a function of elevation bands (100 m intervals) and time for the period 2000–2019. The annual maximum albedo value for all elevation bands was generally observed in early April, associated with the last major winter snowfall. The lowest average albedo values were observed from mid-July to mid-August. For higher elevations (accumulation areas), the minimum values were associated with the first snowfall which increases albedo. For bare-ice areas with impurity-rich ice, these impurities can be washed away from the glacier surface by rain which leads to higher albedo without fresh snow, i.e. cleaner ice, with fewer impurities, in late summer.
Figure 7 shows average melt season mean albedo for the glaciers and sub-areas defined in Fig. 1. Glaciers were sorted from the highest to the lowest melt season mean albedo for the whole analysis period (highest at the top of the figure), revealing certain spatial, temporal, and feature position patterns. The lowest albedo values were observed for Mýrdalsjökull, Eyjafjallajökull, and Torfajökull, which cluster together at the south coast of Iceland (Fig. 1, box M). They were also all close to widespread unstable sandy surfaces subject to frequent high-velocity winds, driving numerous wind erosion events and dust production. These unstable erosive surfaces do not sustain seasonal snow cover far into the spring and summer, making them accessible for erosion earlier in the spring than similar areas in the north and east highlands close to Langjökull, Hofsjökull, and Vatnajökull. Dagsson-Waldhauserova et al. (2014, 2015, 2019) have also shown that dust events can occur frequently in southern parts of Iceland during winter given the right surface and meteorological conditions for dust transport. The Mýrdalsjökull, Eyjafjallajökull, and Torfajökull glaciers are also relatively small, indicating that dust-producing events can influence larger areas of the glaciers with dust deposits. Slightly higher annual average albedo was seen for small alpine and valley glaciers with smaller elevation range and surface area compared with the large ice caps.
The main ice caps in Iceland, Vatnajökull, Hofsjökull, and Langjökull, had relatively high average albedo compared with the other glaciers, with the exception of the northwestern part of Langjökull which was close to the Flosaskarð area known for extremely severe erosion (Arnalds et al., 2016). Drangajökull had the highest observed albedo; its location is far from unstable surfaces that produce airborne dust, and volcanic eruptions (2010, 2011) seem to have a minimal effect compared with other Icelandic glaciers. Albedo development at Drangajökull is likely mostly driven by snow metamorphism where snow grain size increases with time and energy input, resulting in lowering of albedo.
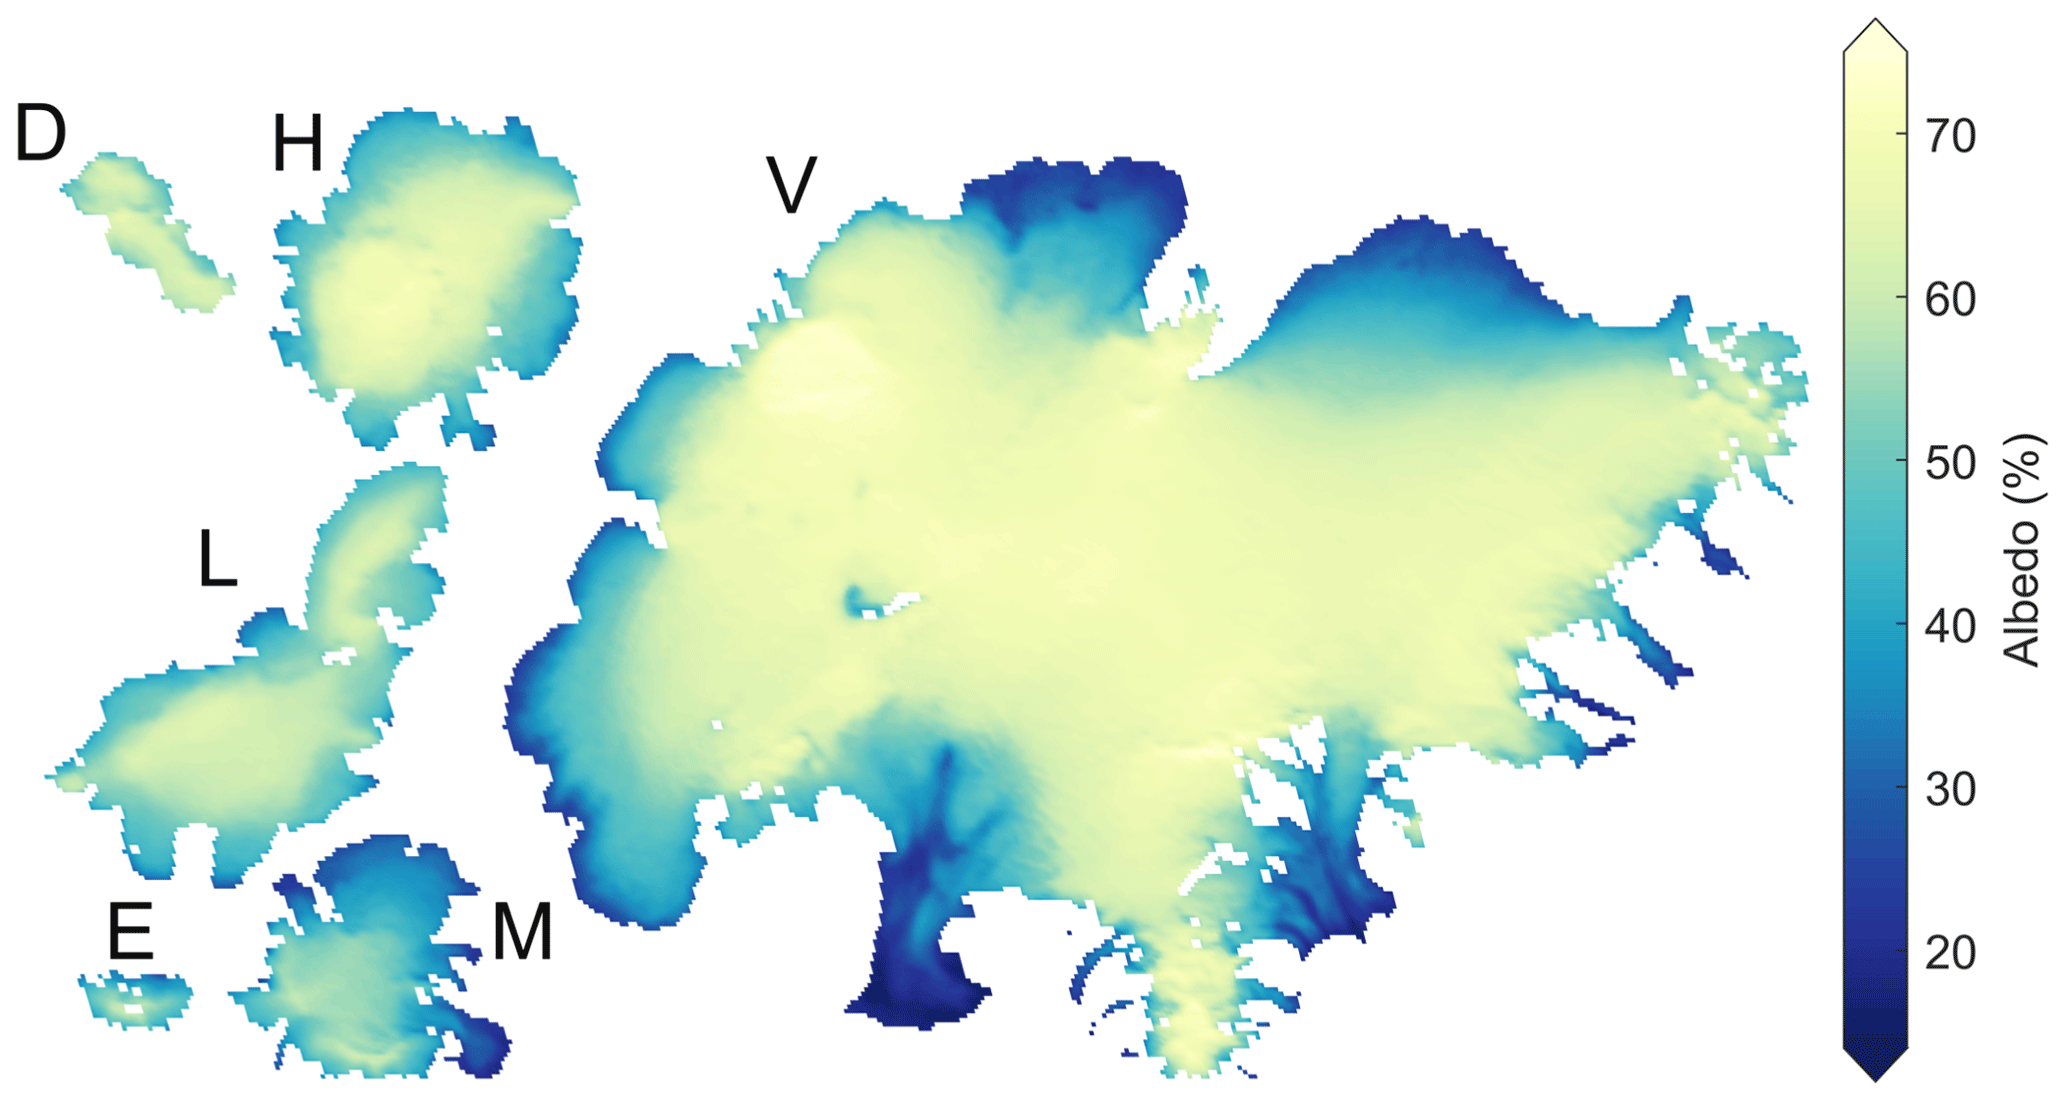
Figure 4Spatial patterns of mean albedo for the period 2000–2019 (MJJA). D: Drangajökull; H: Hofsjökull; V: Vatnajökull; L: Langjökull; E: Eyjafjallajökull; M: Mýrdalsjökull.
On the temporal scale, various events influencing the melt season mean albedo are observed in Fig. 7. For the south coast glaciers (Fig. 1, box M), the influence of the 2010 volcanic eruption in Eyjafjallajökull and the post-eruption influence in 2011 and 2012 were obvious, and there were also influences on other Icelandic glaciers, with the possible exception of Drangajökull, Hofsjökull Eystri, Snæfell, and Norðurlandsjöklar in the north. The influence on albedo due to the 2011 volcanic eruption in Grímsvötn was seen in south-west Vatnajökull isolating the glacier surface, constricting surface melt in about 420 km2. Generally albedo was lower for most glaciers in that year, excluding Drangajökull. In 2015, a cold spring and summer, with prolonged snow cover in the highlands, delayed the onset of melt, as well as limiting the capabilities for airborne dust and tephra to be transported to the glacier surface. The highest melt season mean albedo observed during the study period was in 2015 for all glaciers, while the lowest albedo was seen in 2010. The 2019 melt season was furthermore seen to be quite unique. Due to an early winter snow cover melt in the highlands in late April, the earliest and most extensive snow cover depletion for 20 years (MODIS period) (Gunnarsson et al., 2019), followed by a prolonged period with limited precipitation, great amounts of dust and sand from unstable sandy surfaces were transported to the glaciers, providing LAPs that further enhance surface melt. Although similar singular events had been observed historically during the MODIS period, this development was observed at all Icelandic glaciers. Note must be taken when melt season average values are interpreted that they are influenced by the areal elevation distribution of each glacier or sub-area.
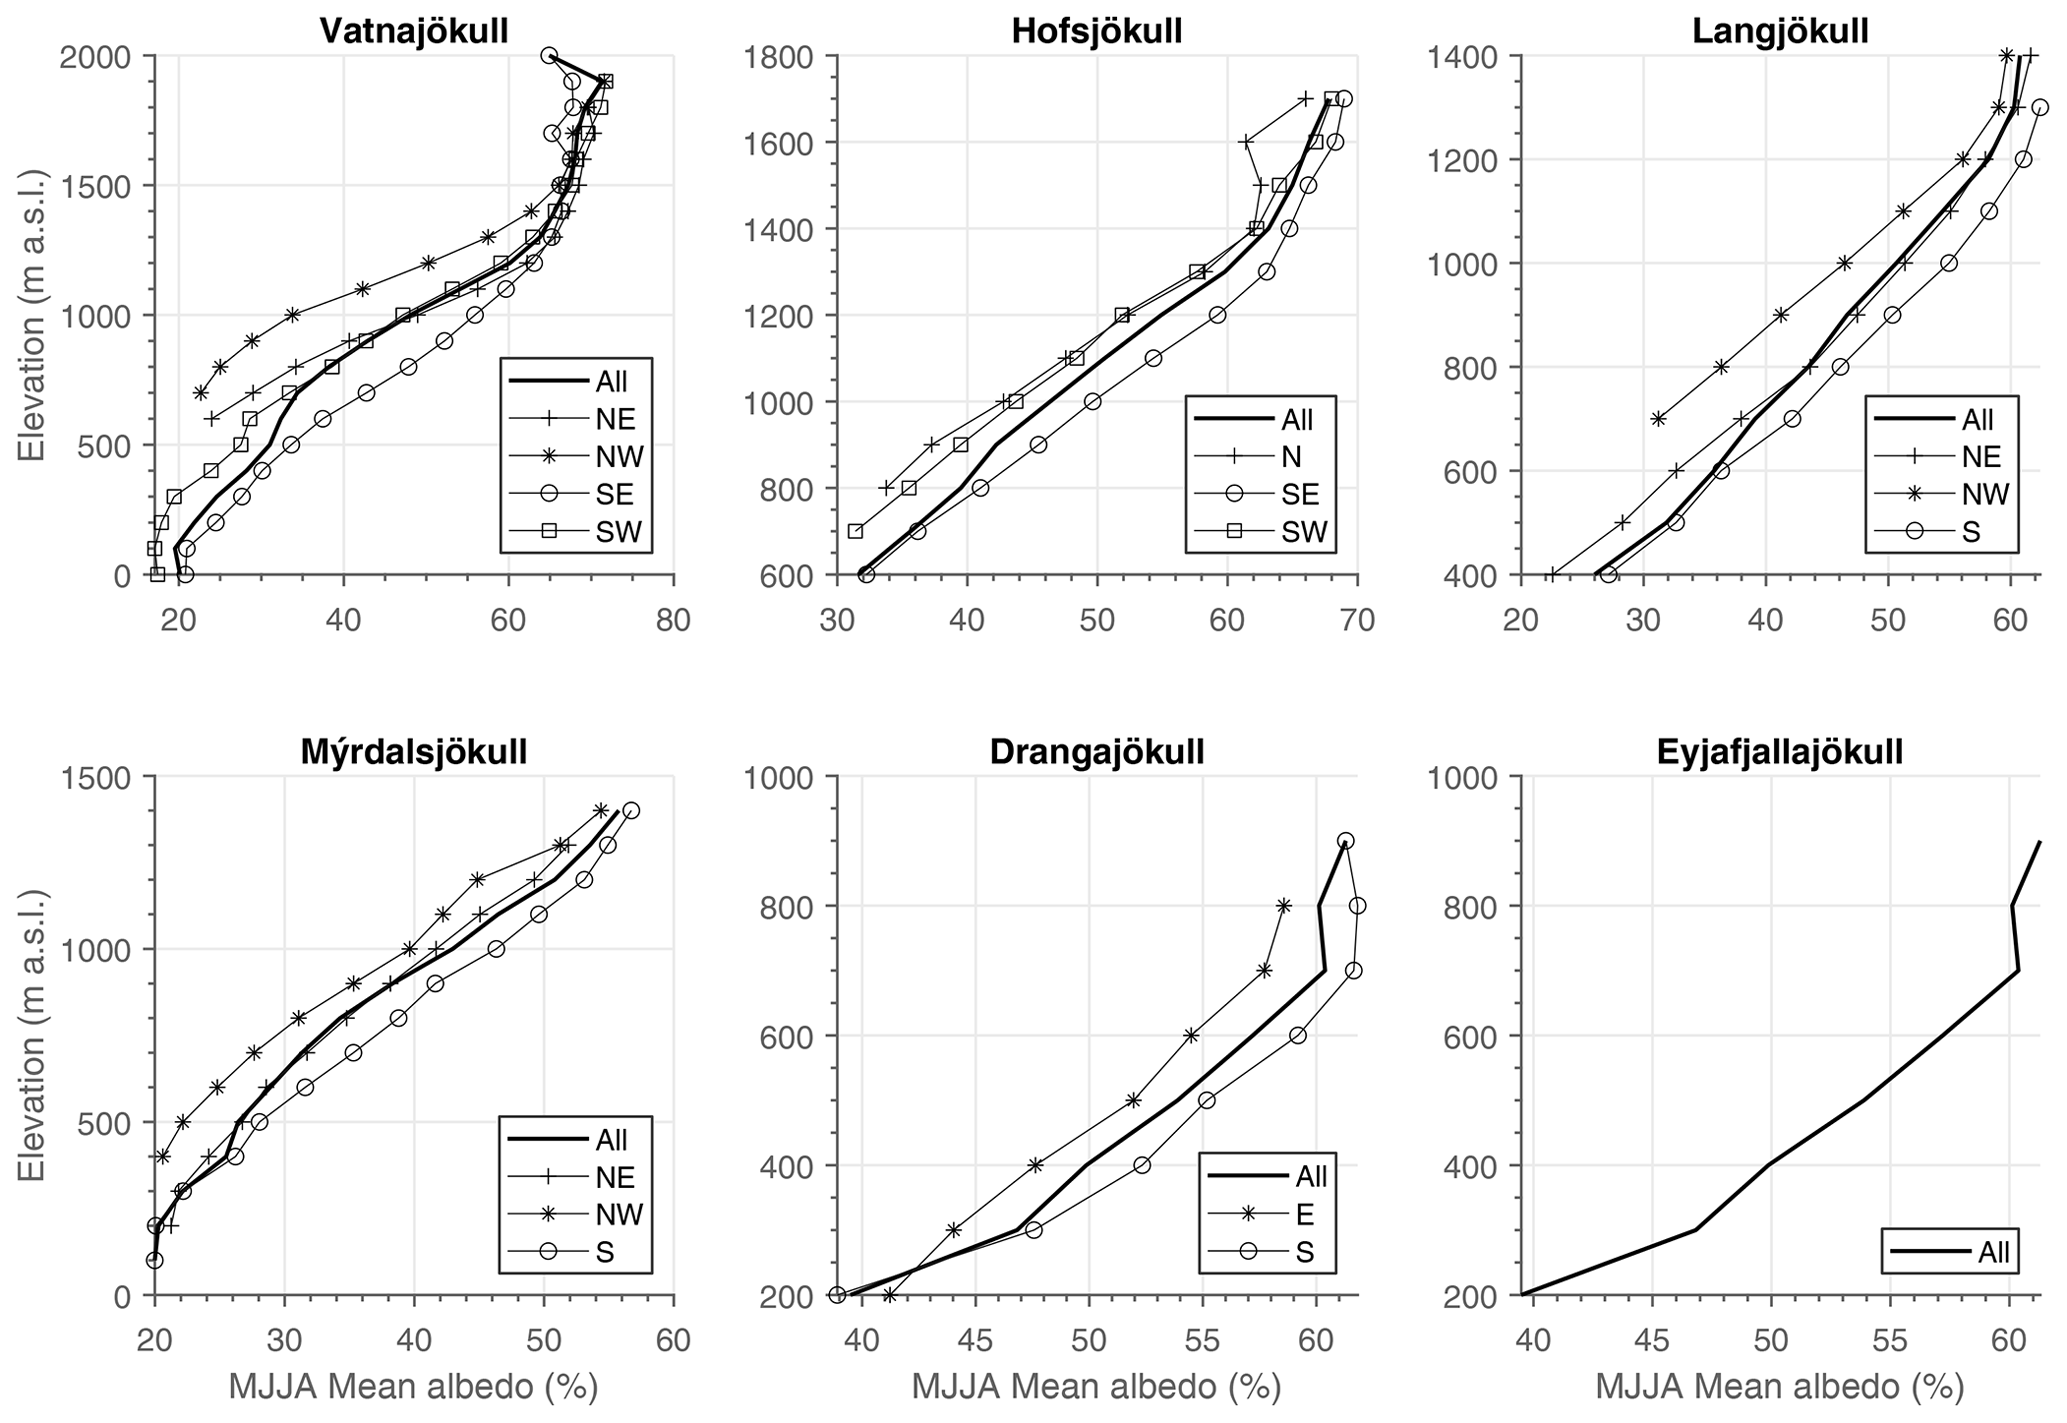
Figure 5Average albedo for the period as a function of elevation for the period 2000–2019. Data are shown for the six largest ice caps for the whole glaciers (All) as well as for the sub-areas defined in Fig. 1. Note the elevation range varies between figure axes (y axis).
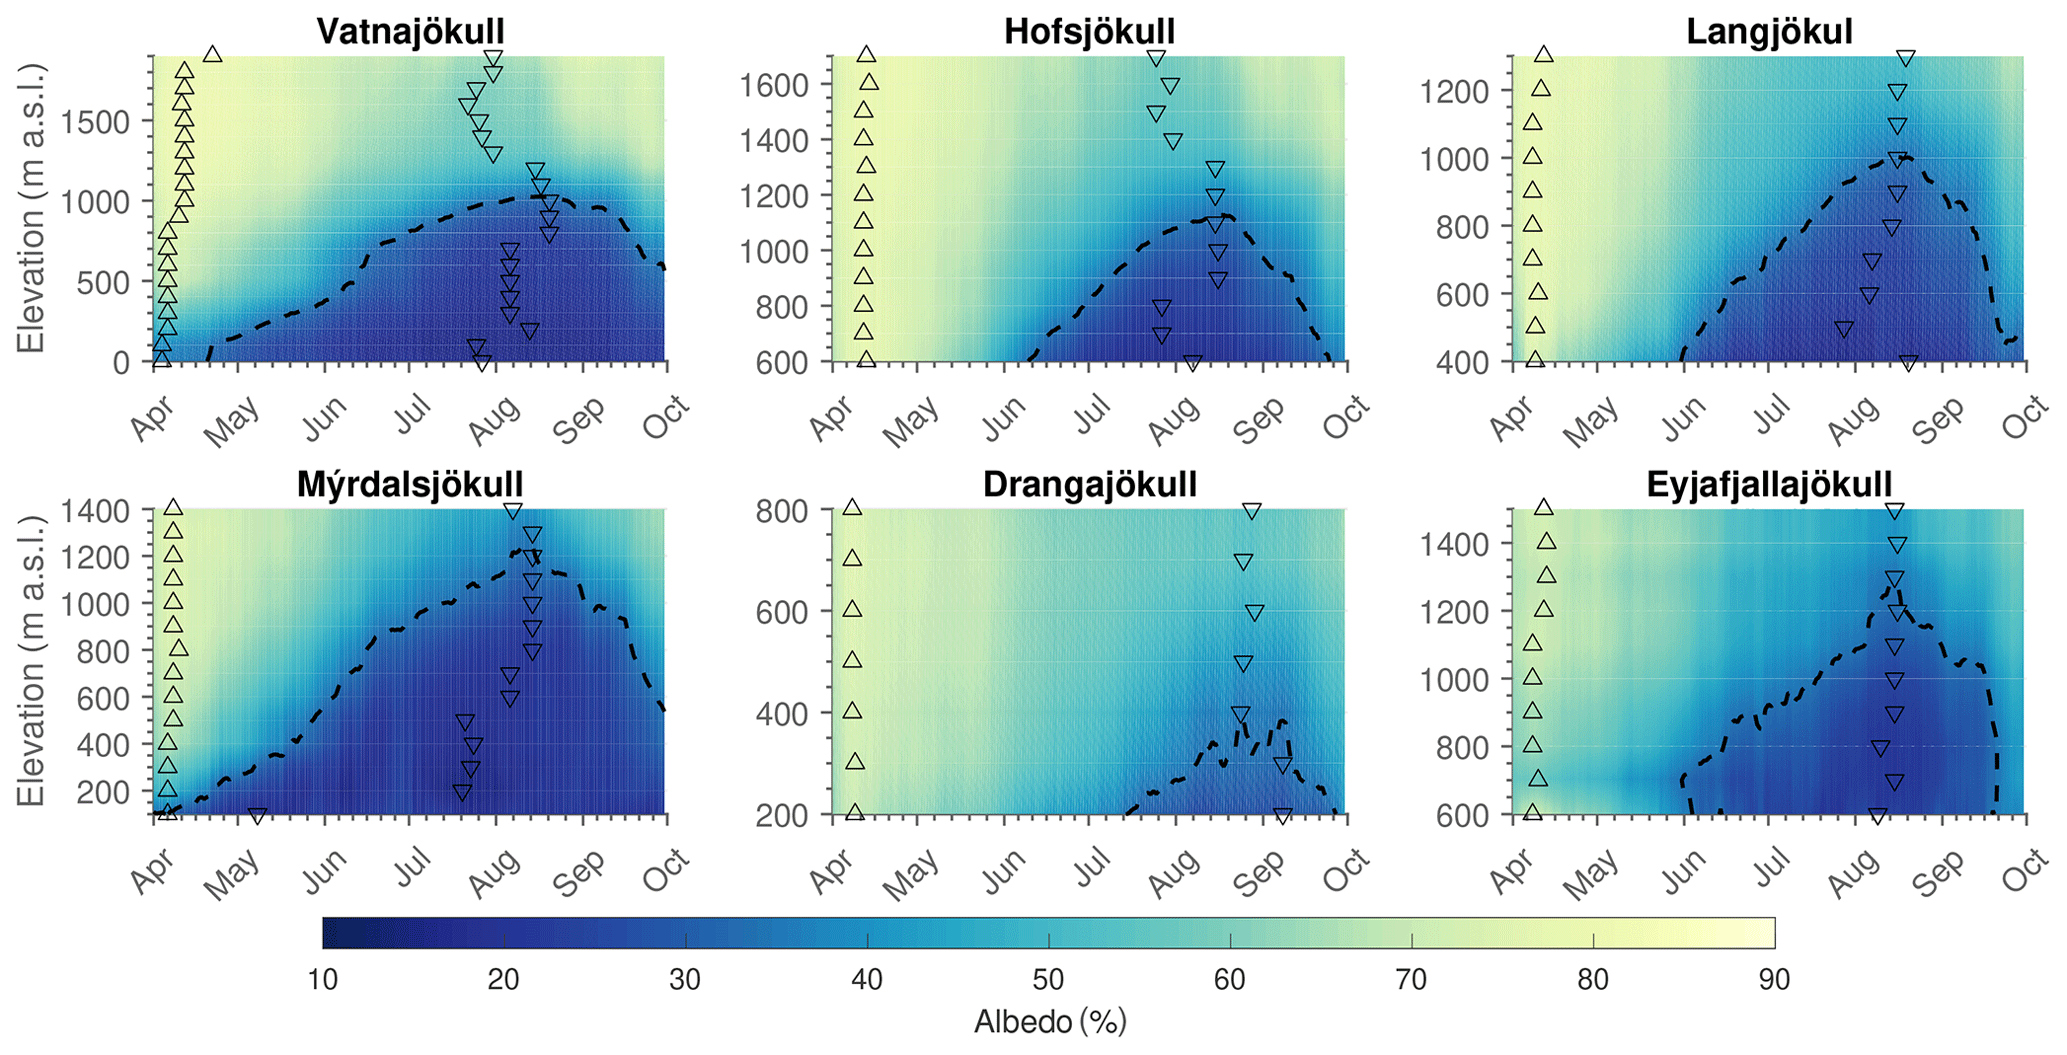
Figure 6Albedo as a function of elevation and time for the period 2000–2019. Triangles show the max–min values associated with each elevation band, and the dotted black line shows the isoline for 34 % albedo, as defined by Cuffey and Paterson (2010) for bare glacier ice.
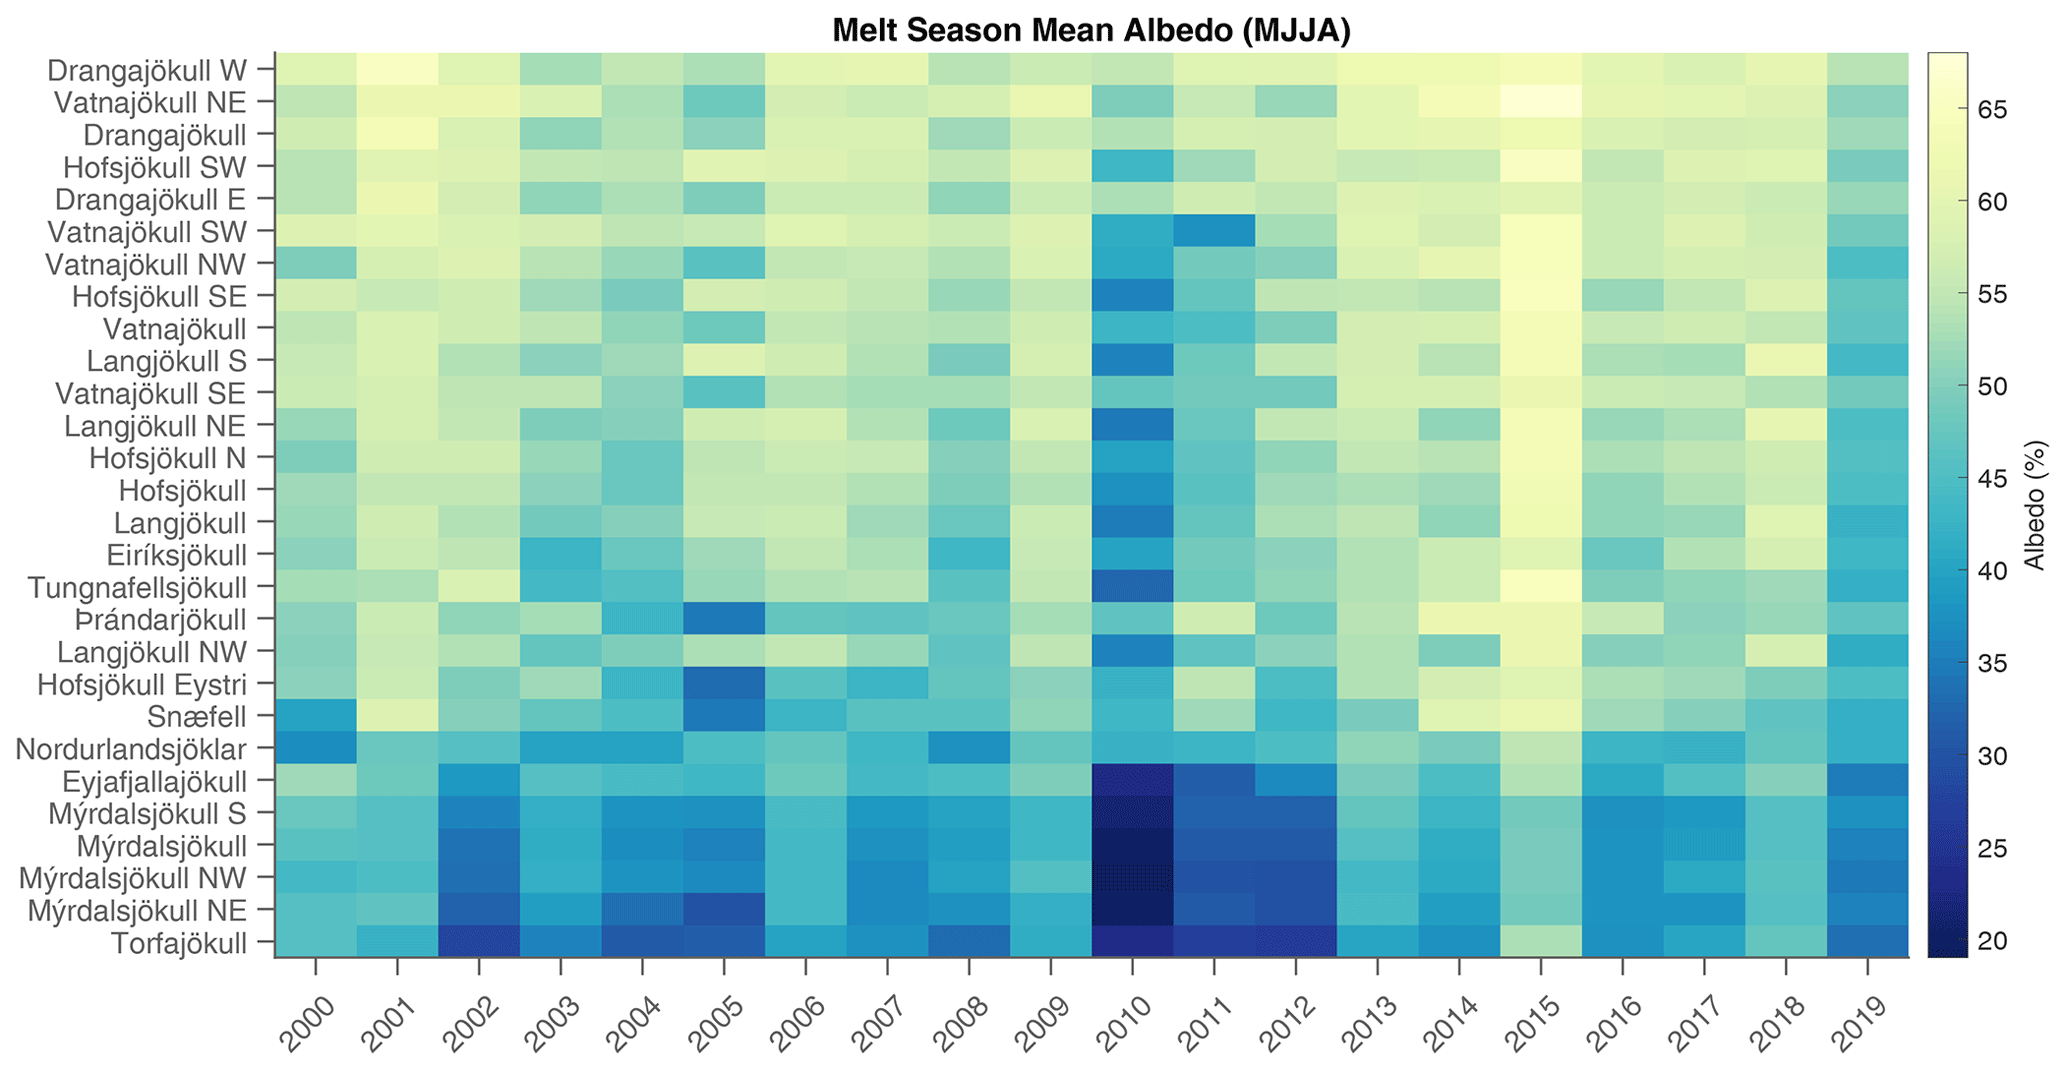
Figure 7Average melt season albedo for the studied glaciers. The glaciers are sorted from the lowest 2000–2019 melt season average albedo to the highest. For the larger glaciers, data are provided for individual ice flow basins; see Fig. 1.
Seasonal variability of albedo for Icelandic glaciers was generally high. Figure 8 shows glacier average seasonal albedo distribution for 2000–2019 plotted together with selected years for Vatnajökull, Hofsjökull, Langjökull, Mýrdalsjökull, Eyjafjallajökull, and Drangajökull. The average albedo generally declines from the maximum observed in the first 2 weeks of April each year (70 %–80 %) to an annual minimum in August. The average minimum observed value is 40 %–45 % for Vatnajökull, Hofsjökull, Langjökull, and Drangajökull but reaches lower values at Mýrdalsjökull and Eyjafjallajökull (<30 %). Glacier runoff generally peaks in late June and July (midsummer) (Schmidt et al., 2018), with low albedo and maximum incoming shortwave irradiance near the summer solstice. The variability similarly gradually increased in June, July, and August and was generally highest in August. In the autumn, seasonal weather patterns in Iceland shift with lowering temperatures and an increase in precipitation following shorter days due to a gradual increase in solar zenith angles (Einarsson, 1984; Hanna et al., 2004; Björnsson et al., 2007, 2018). Frequently in the latter half of August and beginning of September, the first snowfall is observed to increase albedo with fresh highly reflective snow. It was not uncommon to see the albedo lower again after the first snowfall due to liquid precipitation or other events that melt the fresh snow cover over the bare glacier ice. This affects the variation in albedo in August and September.
Figure 8 also shows how albedo develops through the melt season for selected abnormal years. The influence of explosive volcanic eruptions in Grímsvötn in Vatnajökull is shown in 2005 (the eruption took place in November 2004) and 2011 and the Eyjafjallajökull eruption in 2010. These events generally influence the albedo of Icelandic glaciers as tephra is discharged into the atmosphere and transported by wind over wide areas. In 2015, seasonal mass balance programmes for Vatnajökull, Langjökull, and Hofsjökull reported unusually thick winter snow cover followed by a cold and cloudy spring and summer which resulted in a positive net surface mass balance, for the first time in 20 years (Pálsson et al., 2020a, b; Þorsteinsson et al., 2017). Figure 8 shows the development of albedo in 2015 to the highest average values for the study period.
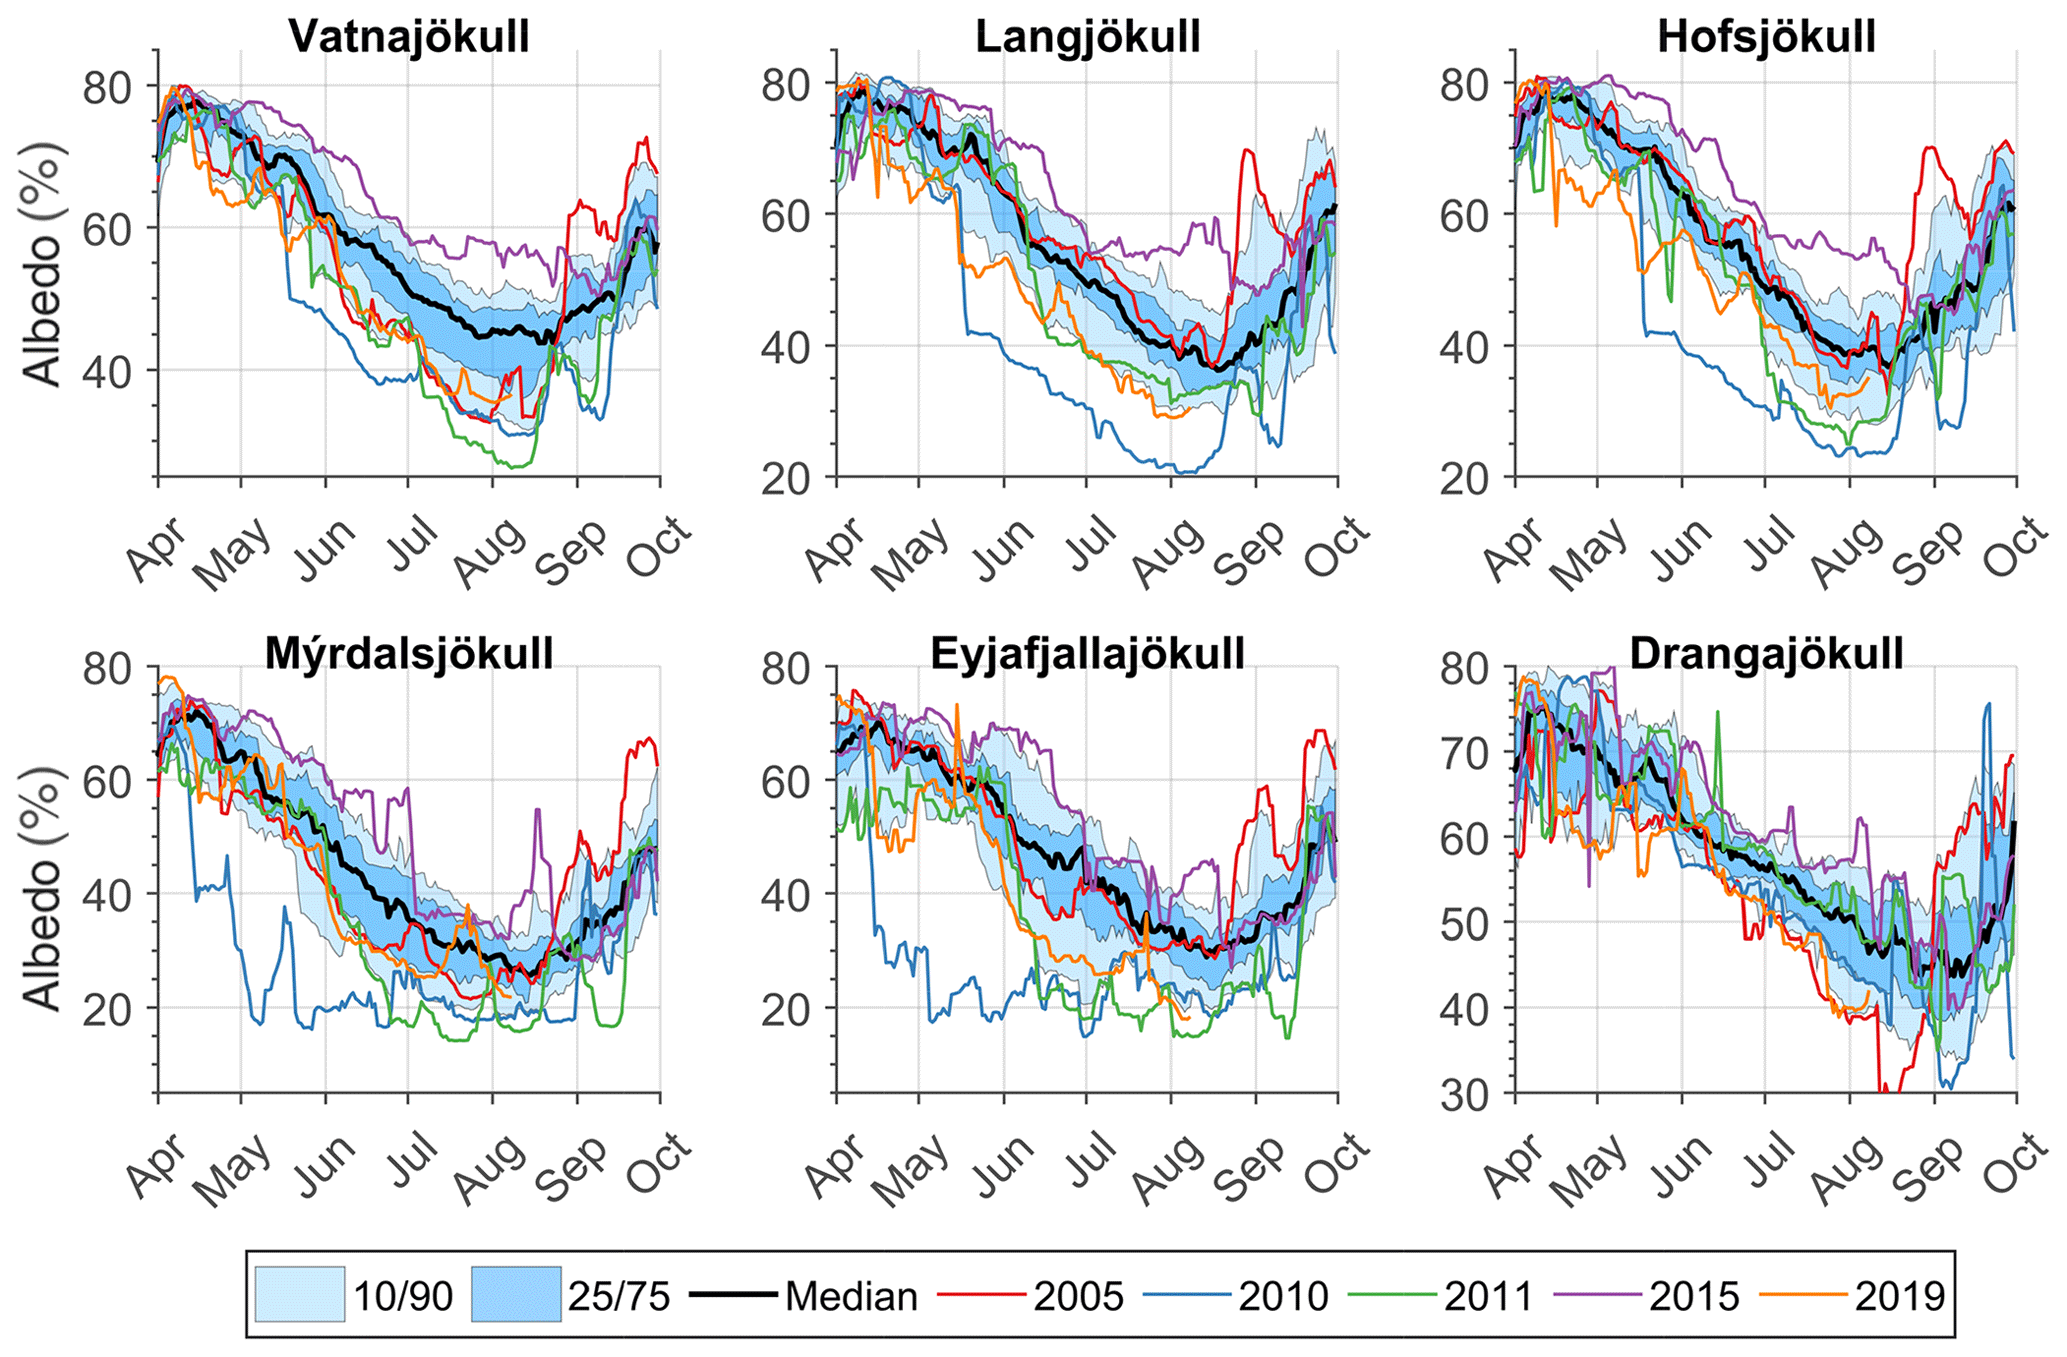
Figure 8Seasonal variations in average albedo for selected Icelandic glaciers from the MCD11 product for April to October 2000–2019.
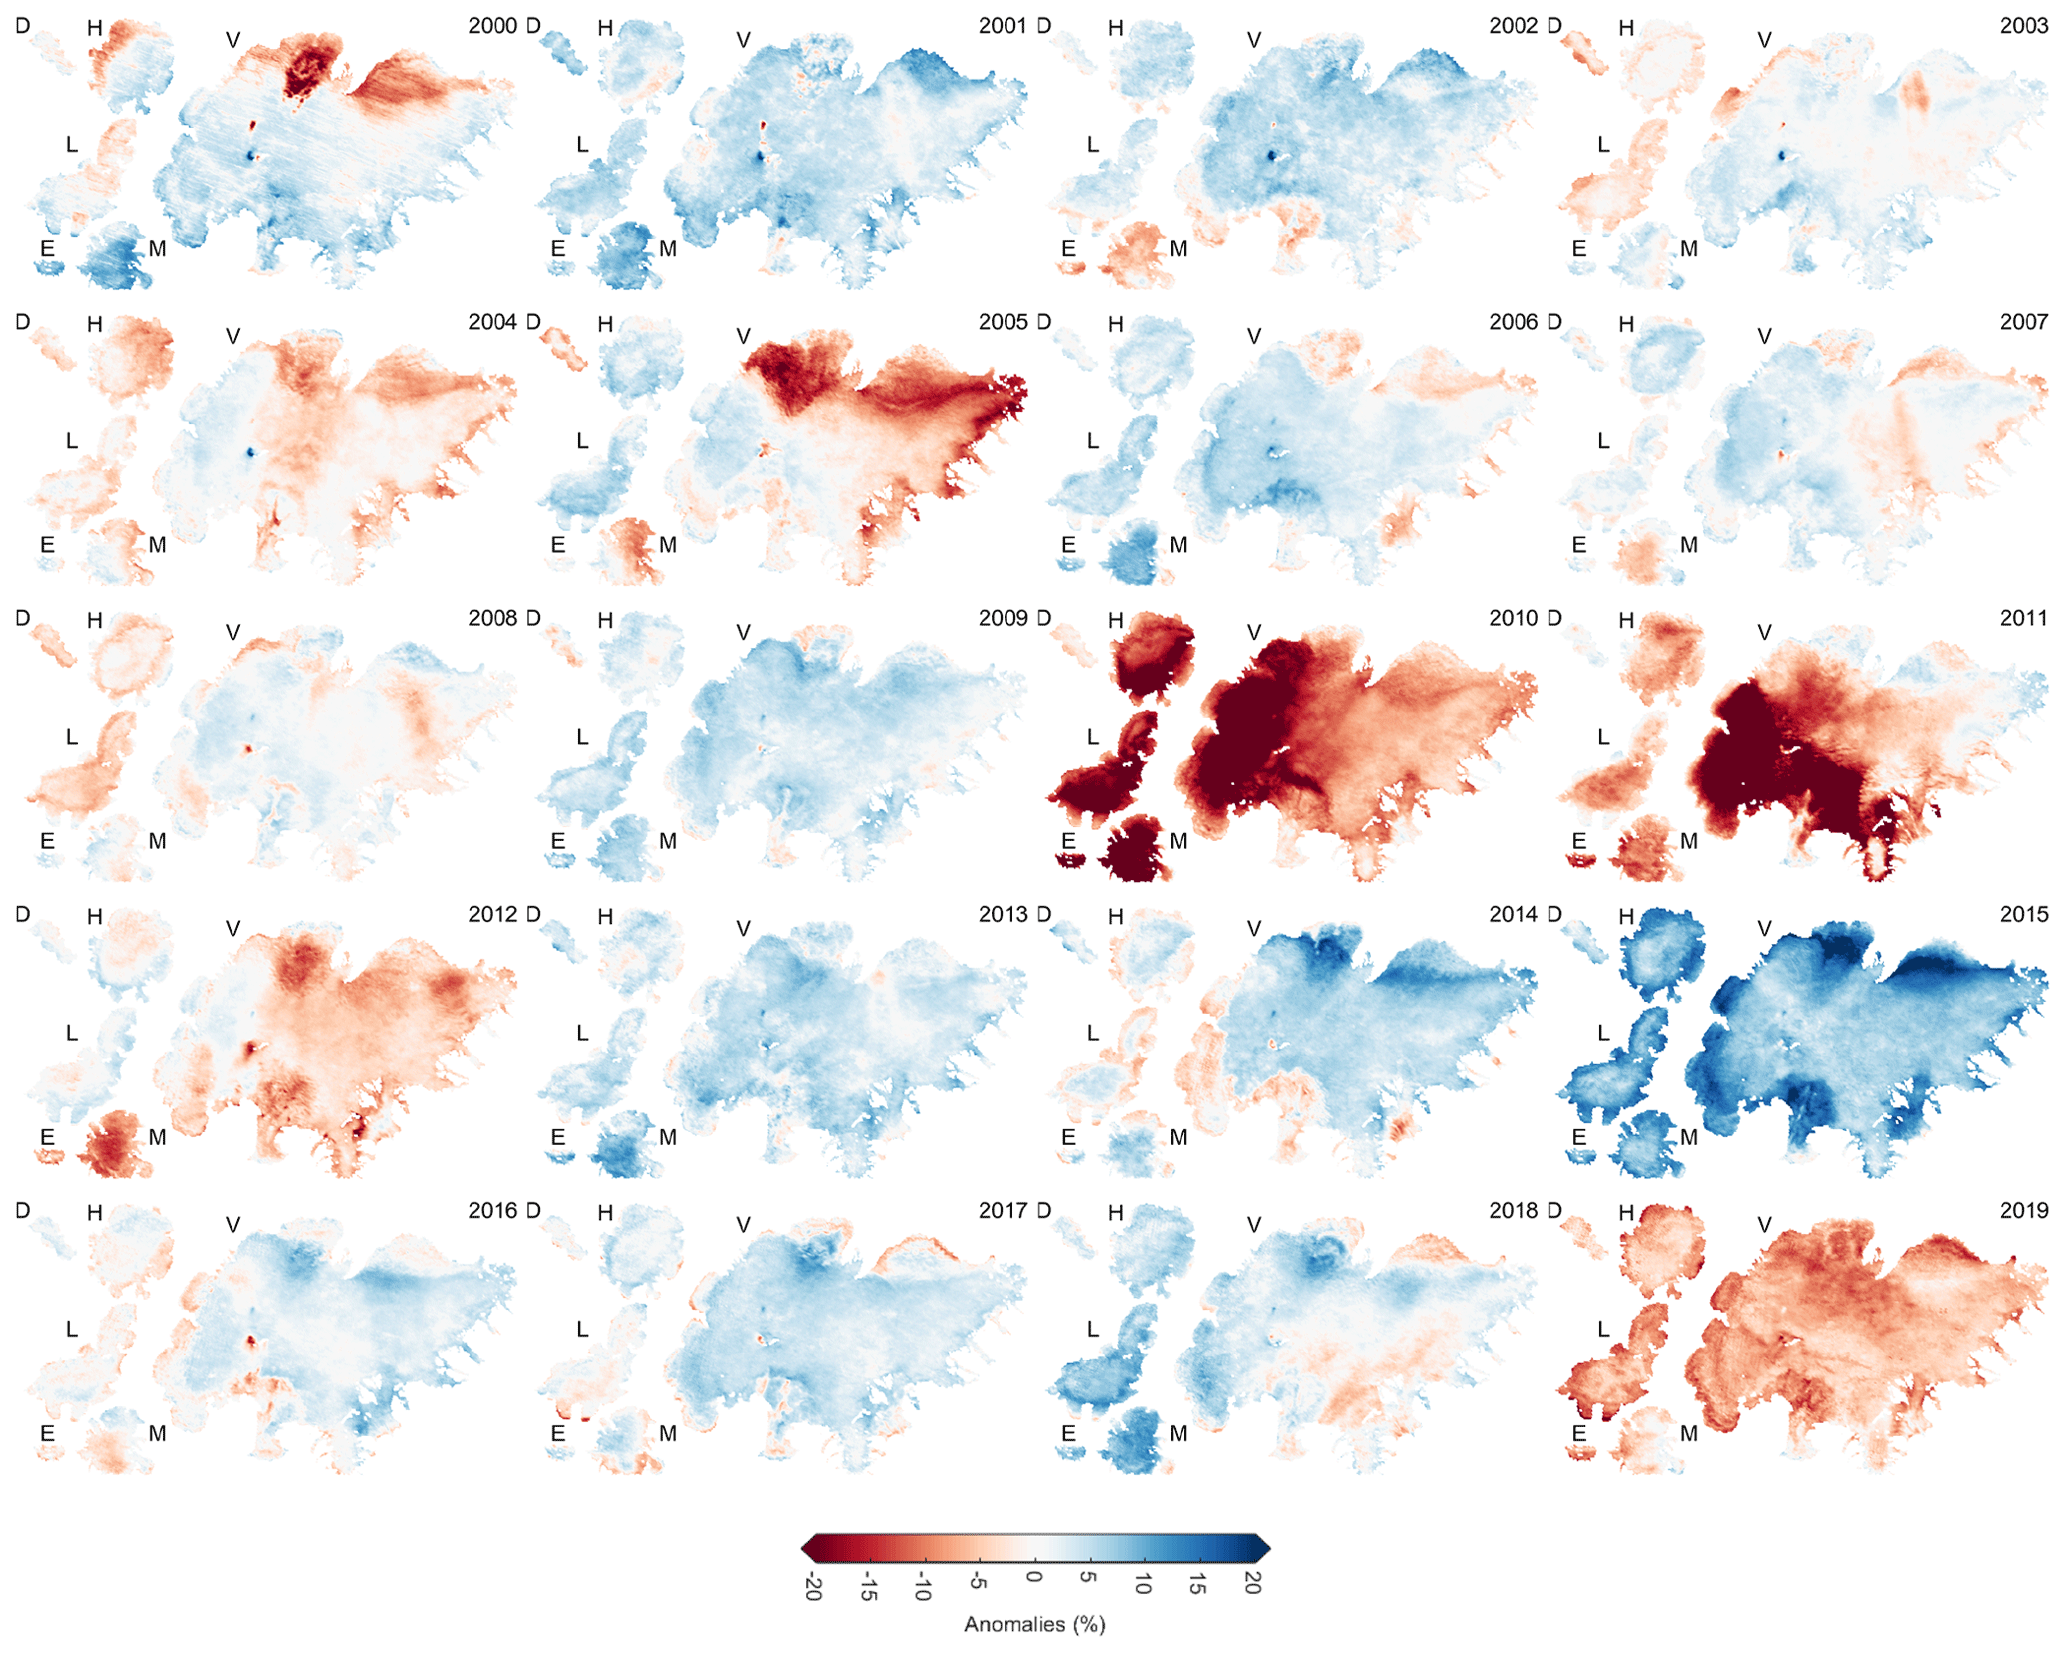
Figure 9Annual spatial patterns for melt season (MJJA) albedo anomalies for 2000–2019.
Figure 9 shows the spatial distribution of seasonal average albedo as anomalies from the mean. Blue colours represent anomalies above the mean, i.e. higher albedo values, while red areas represent values below the mean. Decisive negative patterns were observed in 2010 and 2011. These are related to the volcanic eruptions in Eyjafjallajökull (2010) and Grímsvötn (2011) as tephra dispersal from explosive eruptions produces high volumes of airborne tephra (Gudmundsson et al., 1997; Guðmundsson et al., 2012; Tesche et al., 2012). Airborne tephra and dust can be transported by high plumes that can extend several kilometres into the atmosphere and be transported great distances, up to several hundred kilometres (Guðmundsson et al., 2012; Watson et al., 2016; Đorđević et al., 2019; Dagsson-Waldhauserova et al., 2019). Tephra dispersal and fallout patterns from explosive eruptions depend on many factors, including plume height, particle size distribution, and wind direction and velocity. No eruption occurred in 2012, but residual effects were observed as ash deposits from previous eruptions were carried with the prevailing wind directions and high dust storm activity reported in the area, enhancing melt due to the lowering of albedo (”oller et al., 2019; Butwin et al., 2019). These effects were most clear for Eyjafjallajökull and Mýrdalsjökull but also contribute to negative anomalies for Vatnajökull. The impact of dust deposition on albedo in 2012 for Vatnajökull was investigated by Wittmann et al. (2017) using dust-mobilization models to calculate dust emission and a dispersion model to simulate atmospheric dust dispersion and deposition on the glacier surface. The main conclusion was that the influence of dust on albedo could lead to an increase in melt of up to 40 %, which confirms the influence of these events on seasonal glacier melt.
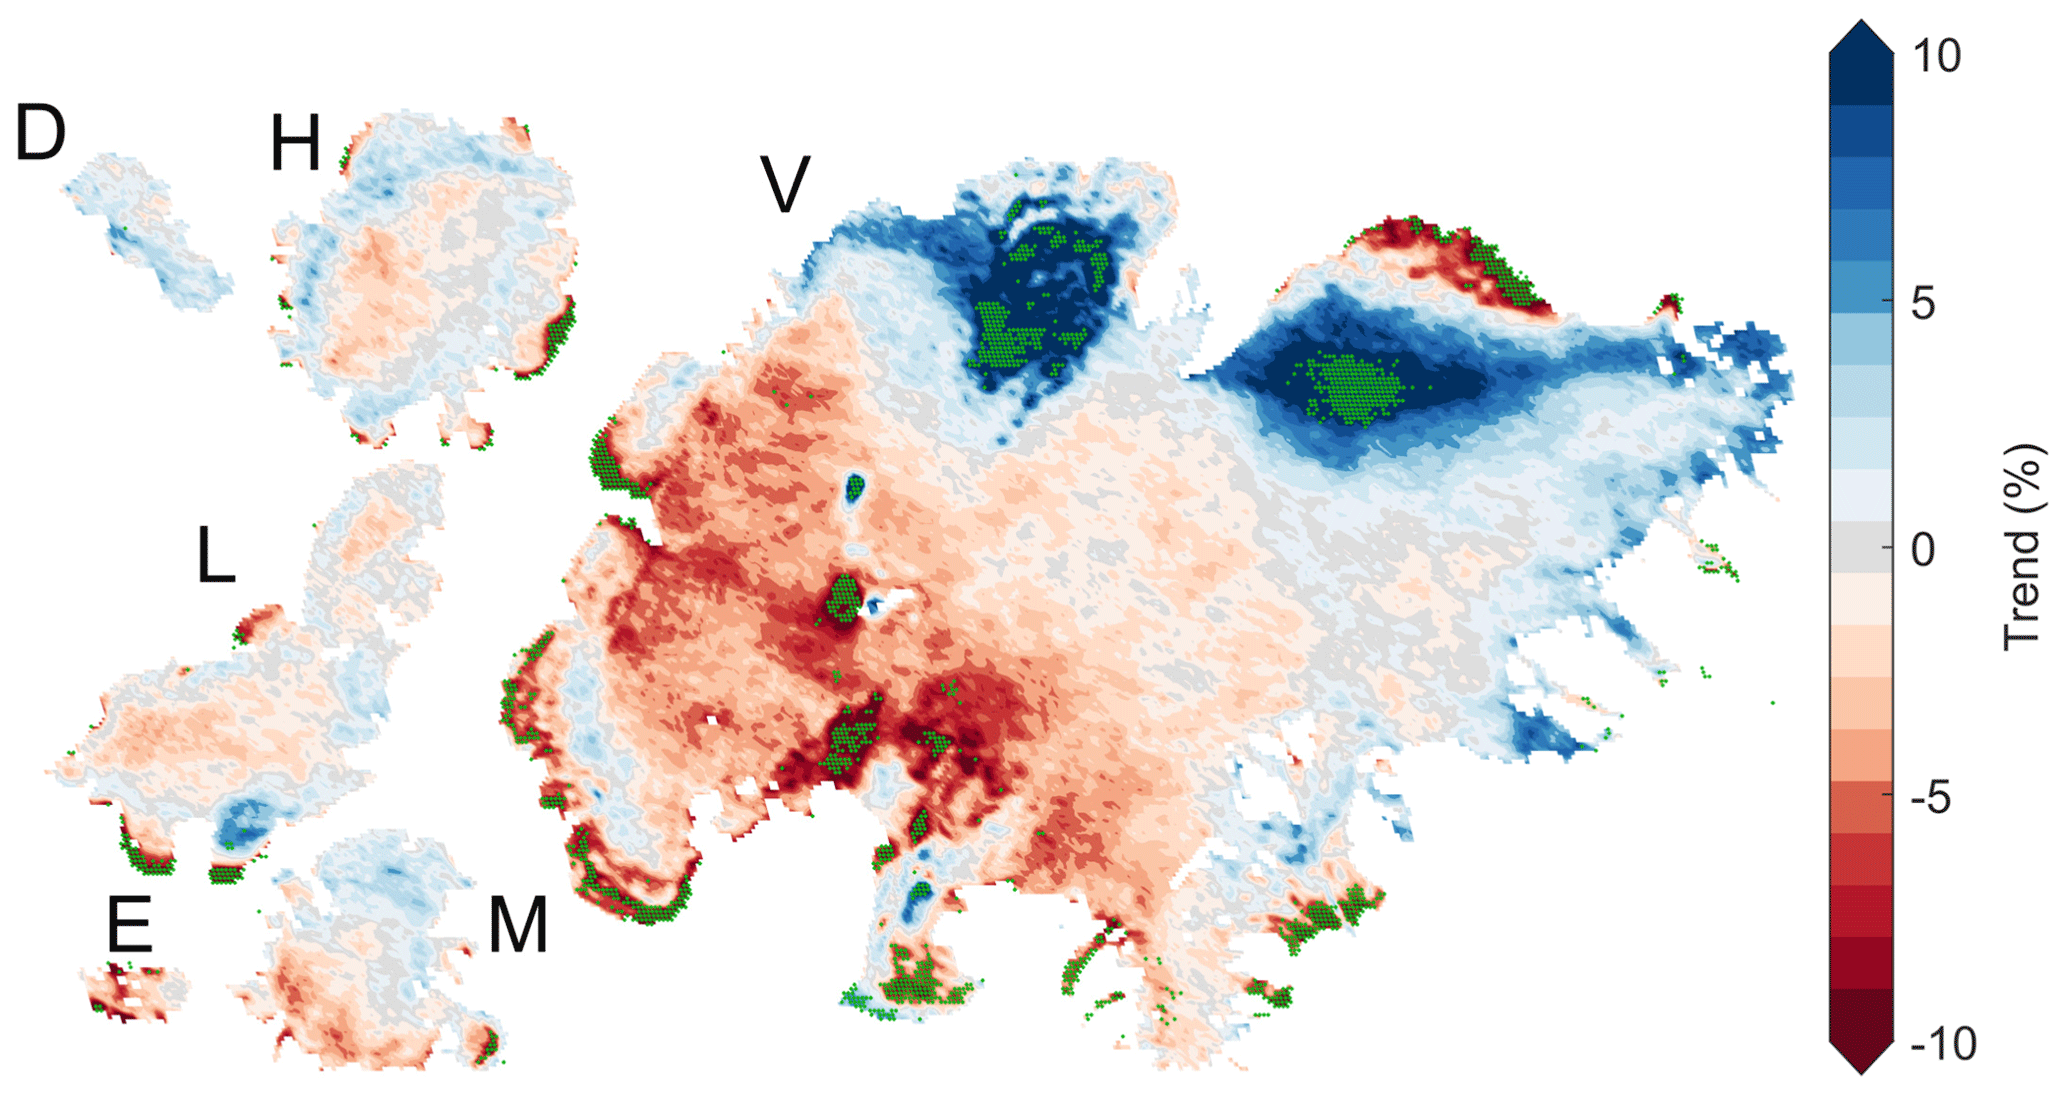
Figure 10Spatial patterns for albedo trends during the melt season (MJJA) for the period 2000–2019 in terms of the total change of a least-square fit to the albedo over the period. Green stipples indicate areas where significant changes were found.

Figure 11Average monthly mean albedo for the main ice caps in Fig. 8. The mean, standard deviation, and trend (Δy) are shown. Linear trend determined from all years is shown with black lines while red lines exclude the 2010 and 2011 data to omit the influence of volcanic tephra and ash.
Another influencing factor for negative albedo anomalies was dust, sand, and other LAPs transported from the proglacial areas and sandy deserts which cover more than 22 % of Iceland (Arnalds et al., 2016; Wittmann et al., 2017). Plume-shaped patterns could be identified in particular for the northern part of Vatnajökull, indicating airborne LAP deposits on the glacier surface. For example, in 2001, 2003, 2007, 2008, and 2013, such patterns were observed in the northern part of Vatnajökull (Brúarjökull glacier outlet) extending from the Kverkfjöll mountain range high in the accumulation area as local negative albedo anomalies. These were unlikely to be linked to local climatology, resulting in such distinctive anomalies, as such events or dominating patterns would influence larger areas. In 2014–2015, the lava flow field of the Holuhraun non-explosive eruption covered about 84 km2 of volcaniclastic sandy desert and proglacial areas north of Vatnajökull. Since then, similar plume-shaped albedo anomalies have not been observed in the data. It is probable that the extent of the lava flow field reduces the dust production of this area significantly, although this cannot be quantified at this point in time; more data over a range of climatologies are needed to fully understand the impact of the Holuhraun eruption on dust production. Figure 9 also shows an interesting anomaly pattern for 2019. All the major ice caps had largely negative anomalies driven by dust and mineral deposits with an early onset in the spring. The events leading up to these anomalies have already been discussed above. In 2000, large negative anomalies were seen in Dyngjujökull and Brúarjökull (northern Vatnajökull). These are unlikely to be linked to the 2000 Hekla eruption and are presumed to be a combination of residual effects from the Gjálp eruption in 1996 and dust transported from the proglacial areas near the glacier terminus. Landsat images from summer 2000 show the tephra-covered surroundings of Gjálp to be a possible dust source in combination with proglacial areas.
3.4 Trends of albedo
Figure 10 shows the spatial pattern of melt season (MJJA) trends in terms of the total change of a least-square fit to the albedo during 2000–2019. For Vatnajökull, negative albedo melt season trends were found in the lowest areas of the glacier with the exception of the northwestern part (Dyngjujökull). Negative trends at the terminus of glaciers were expected due to glacier retreat in recent decades, with associated debris deposits on dead ice (Einarsson, 2018; Hannesdóttir et al., 2020). In general, negative trends extend farther into the accumulation area in the southwest while a growing positive trend was observed in the upper part of the ablation area in the northern part with the exception of the terminus area of Brúarjökull. Positive trends in the upper part of the ablation area in the northern part (Brúarjökull and Dyngjujökull) of the ice cap are significant over most of the area. Positive melt season trends were also seen near the equilibrium line elevation at Hofsjökull, for most of Drangajökull, in the northern part of Mýrdalsjökull and distributed parts of Langjökull, suggesting a trend towards either increased snowfall or decreased snowmelt at these glacier outlets. As a melt season average trend (Fig. 10) these positive trends are only significant in the ablation area in the northern part of Vatnajökull. Negative trends were identified at many glacier termini due to the steady glacier retreat in recent decades, with reduction in the duration of snow cover over low-albedo bare ice, while for the accumulation area in southwest Vatnajökull the trend is strongly controlled by volcanic ash fallout in 2010 and 2011.
Figure 11 shows average monthly-mean albedo for the main ice caps for the study period, the associated linear trends, and the average linear slope of the trend. For all the glaciers with the exception of Drangajökull in June, the average linear slope for May and June was negative, i.e. lower average albedo earlier in the spring. For Vatnajökull, Hofsjökull, and Langjökull, the trend was strongly influenced by low May and June albedo in 2017 and 2019. These trends indicate that more incoming shortwave energy is absorbed at the surface during these months with lower albedo. In July and August, the trend was in general positive, trending towards higher mean albedo. The trends in July and August were only statistically significant for Drangajökull and in July for Hofsjökull. Positive trends could indicate more extensive or earlier snowfall in July and August, with fresh highly reflecting snow. Extensive dust transport to the glacier surface, as seen in the 2019 melt season, had a similar overall albedo-lowering effect to that in the eruption years 2010 and 2011 for Vatnajökull, Langjökull, Eyjafjallajökull, and Drangajökull specifically. It is, however, noted that following volcanic eruptions albedo lowering is generally more localized while extensive dust transport tends to affect larger areas.
In this study, a gap-filled satellite-observed albedo data set for Icelandic glaciers (MCD11) was produced from daily MODIS Aqua and Terra observations from early 2000 until 2019 at a 500 m spatial resolution. Overall, good visual and statistical agreement was found between the MCD11 data and in situ albedo from GAWS observations over a range of elevations and glacier locations. Overall, higher RMSE values were found in the ablation zone, which could be related to higher albedo variability within a MODIS pixel for impurity-rich bare ice in the ablation zone, indicating that care must be taken when comparing point-based in situ observations with data with a larger spatial footprint.
The main results show that the large seasonal and inter-annual variability in surface albedo for Icelandic glaciers was captured by the MCD11 data, although limited in situ data were available for the smaller glaciers. Icelandic glacier albedo was observed to be influenced by variability in climate, tephra deposits from volcanic eruptions, and airborne dust from widespread unstable sandy surfaces which are subject to frequent wind erosion and dust production. Details are provided regarding spatial patterns and temporal trends, relations to elevation, and monthly statistics adding to previous work by Gascoin et al. (2017) for 2000 to 2012.
The good visual and statistical agreement that was found between the MCD11 data and in situ albedo from GAWS observations indicates that the gap-filling method applied in this study is able to provide good quality daily albedo estimates both spatially and temporally. This illustrates the main strength of the spatio-temporal MCD11 data set, which is obtained without sacrificing quality compared with other data sources.
Significant positive albedo trends over the study period were found in northern Vatnajökull while other areas and glaciers have a glacier-wide non-significant trend. Average linear trends for monthly data indicate that albedo generally decreased over the study period in May and June whereas a general albedo increase was observed in July and August, although, statistically non-significant in all cases with the exception of Hofsjökull in July and Drangajökull in July and August. The incorporation of the MCD11 albedo product provides capabilities to improve surface mass balance and runoff forecasting from glaciers. In the case of future volcanic eruptions, the presented methodology allows for rapid assessment of glacier albedo changes in near-real time and the associated influence on melt, which has a direct impact on hydropower production in Iceland and possibly civil infrastructure in some cases. A limitation related to estimating the impact of tephra fallout on a glacier surface from optical data is the assessment of tephra thickness, as very low observed albedo could indicate melt increase due to more surface energy absorbed by the surface but could also indicate an isolating layer limiting melt due to a thick tephra layer.
The methodology allows for predictive and retrospective modes (Dozier et al., 2008), depending on the application. To use the albedo data for runoff forecasting for example, surface albedo estimations using only data until the present (newest MODIS data) can be provided by applying the statistical filtering and gap-filling routines from today and backwards. Alternatively, in retrospective mode, the best estimations can be provided for every day in a period.
Finally, it is noted that the methodology applied in the study, based on MODIS data, can be applied to other satellite albedo products, such as VIIRS and Sentinel-3 as well as future missions, to extend the temporal range beyond the MODIS mission, allowing for short-term as well as long-term monitoring of albedo variations for glaciers in Iceland.
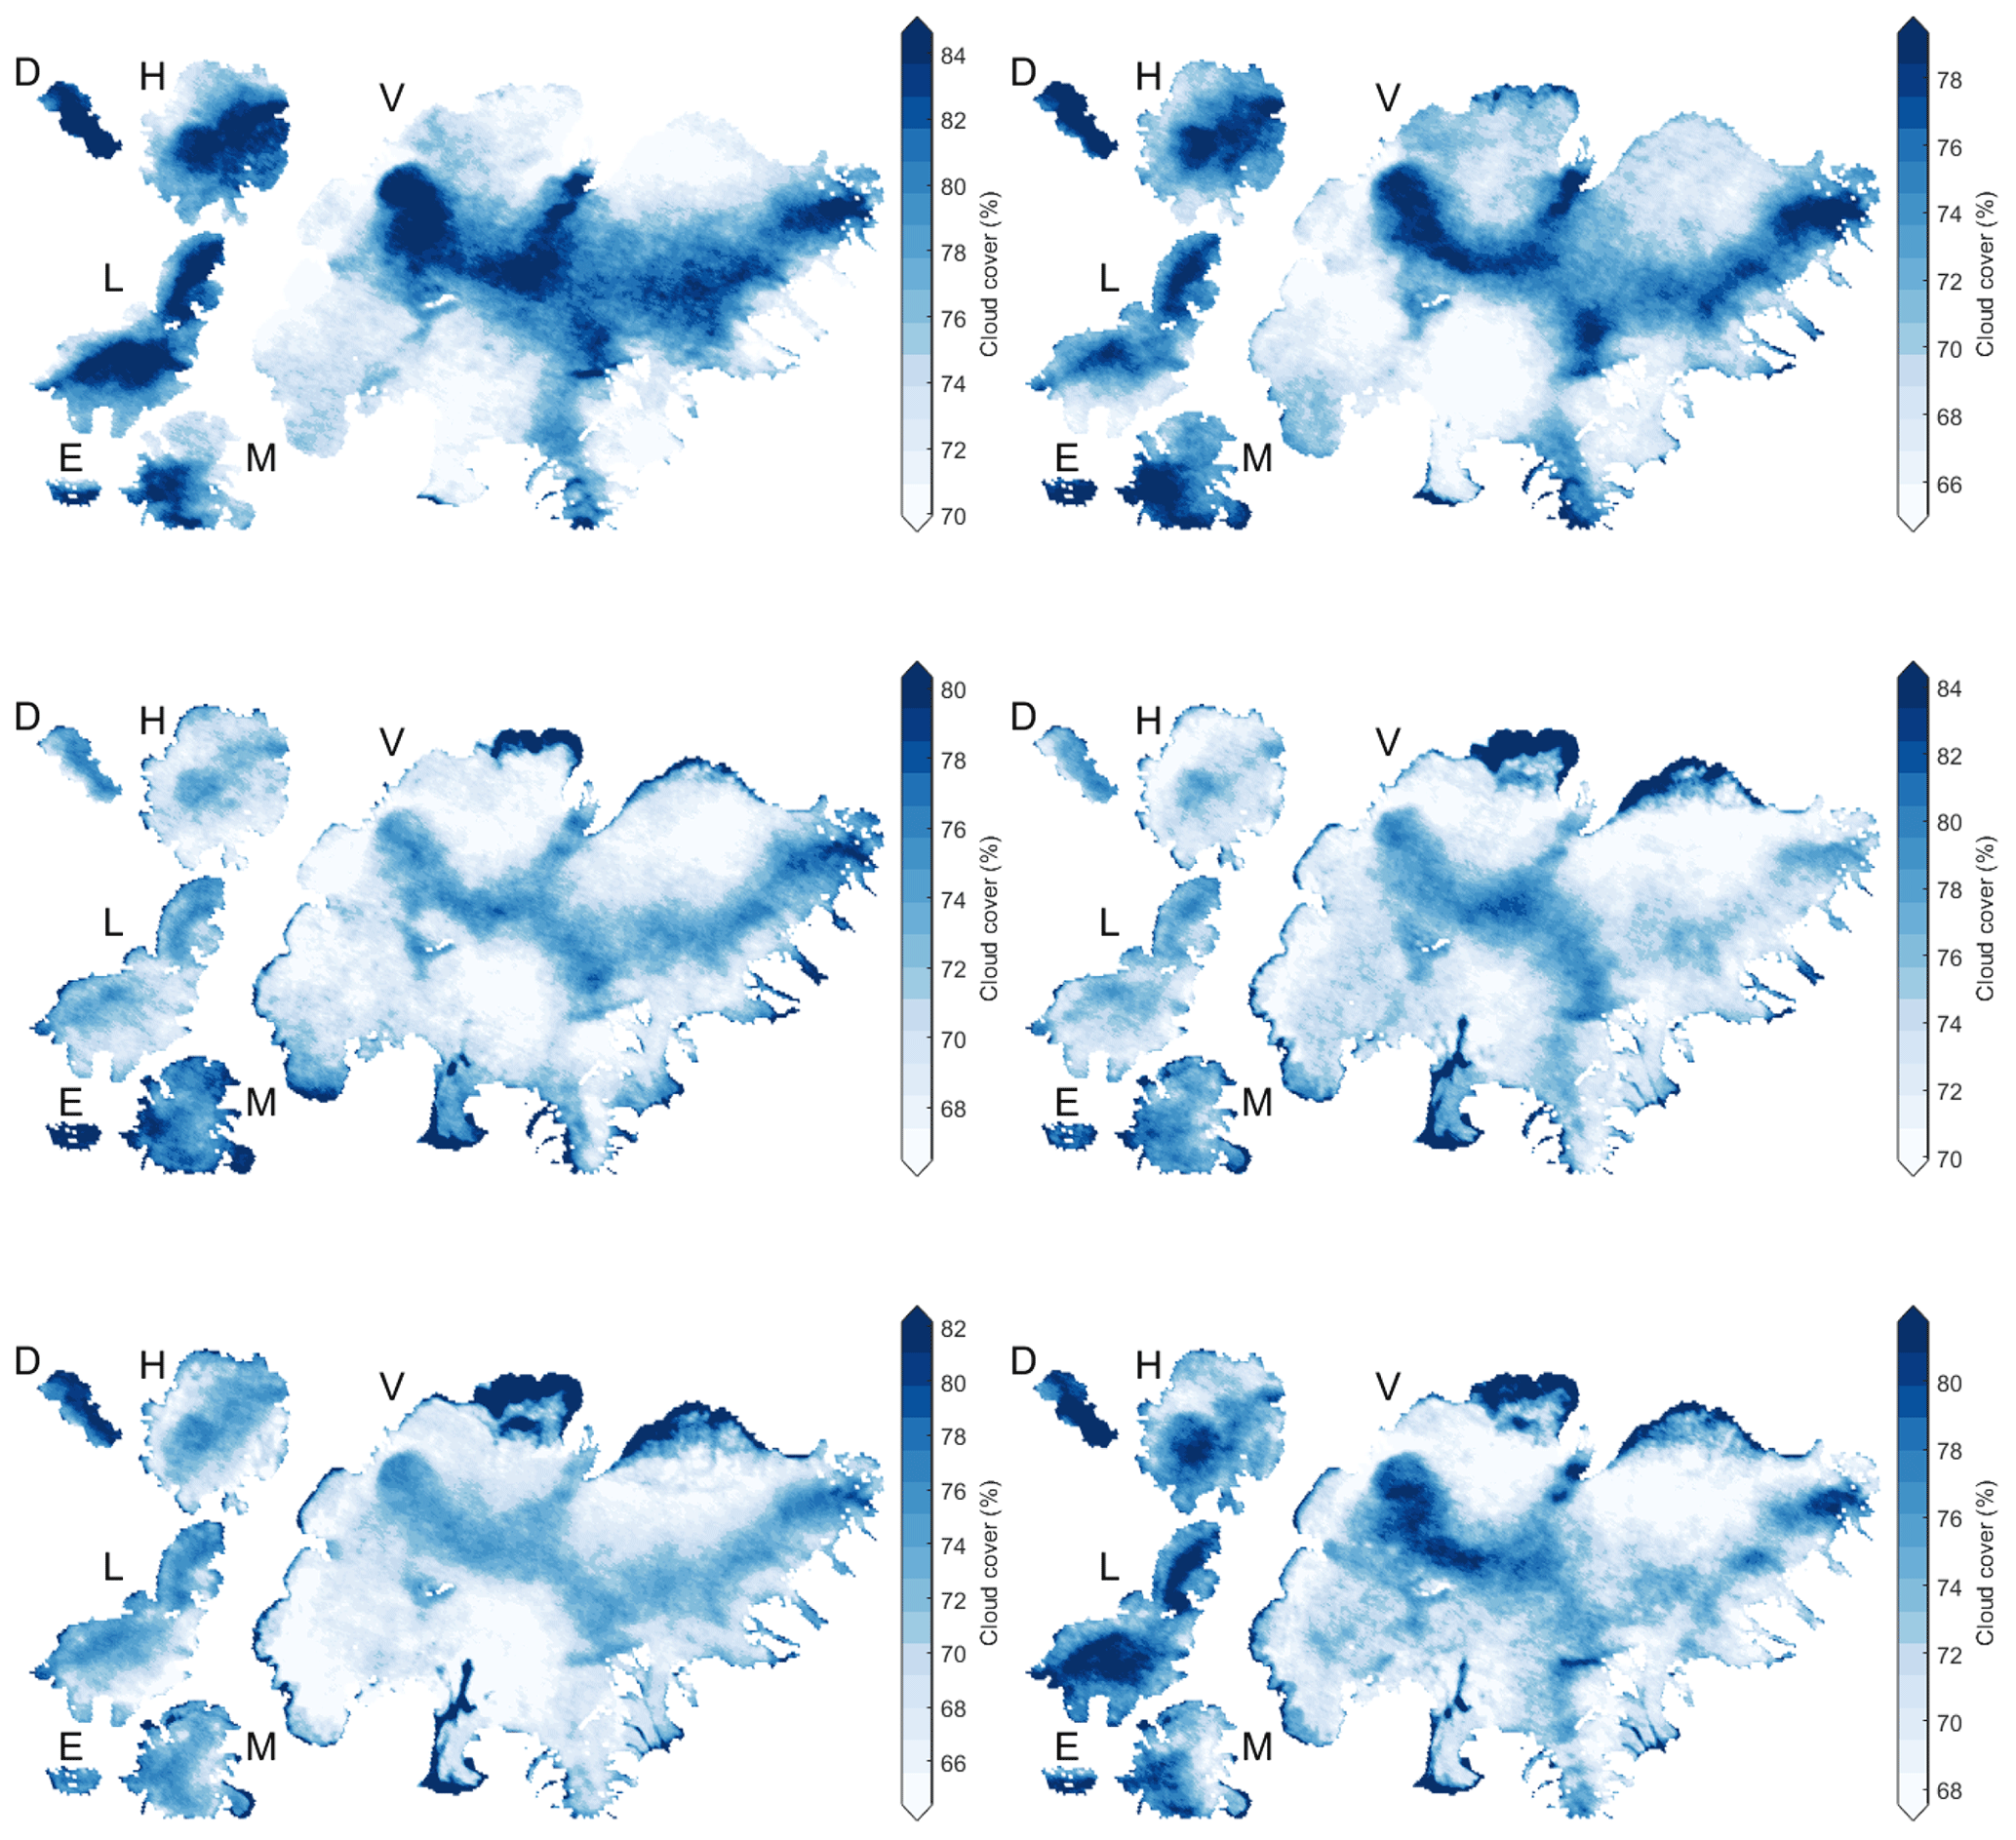
Figure A1Monthly average cloud cover for selected glaciers in Iceland in April (top left), May (top right), June (middle left), July (middle right), August (bottom left), and September (bottom right).
Table A1RMSE, R2 values, and number of months of overlapping data (n) for individual station comparison on a monthly time scale for MOD10A1, MYD10A1, MCD43A, and MCD11.

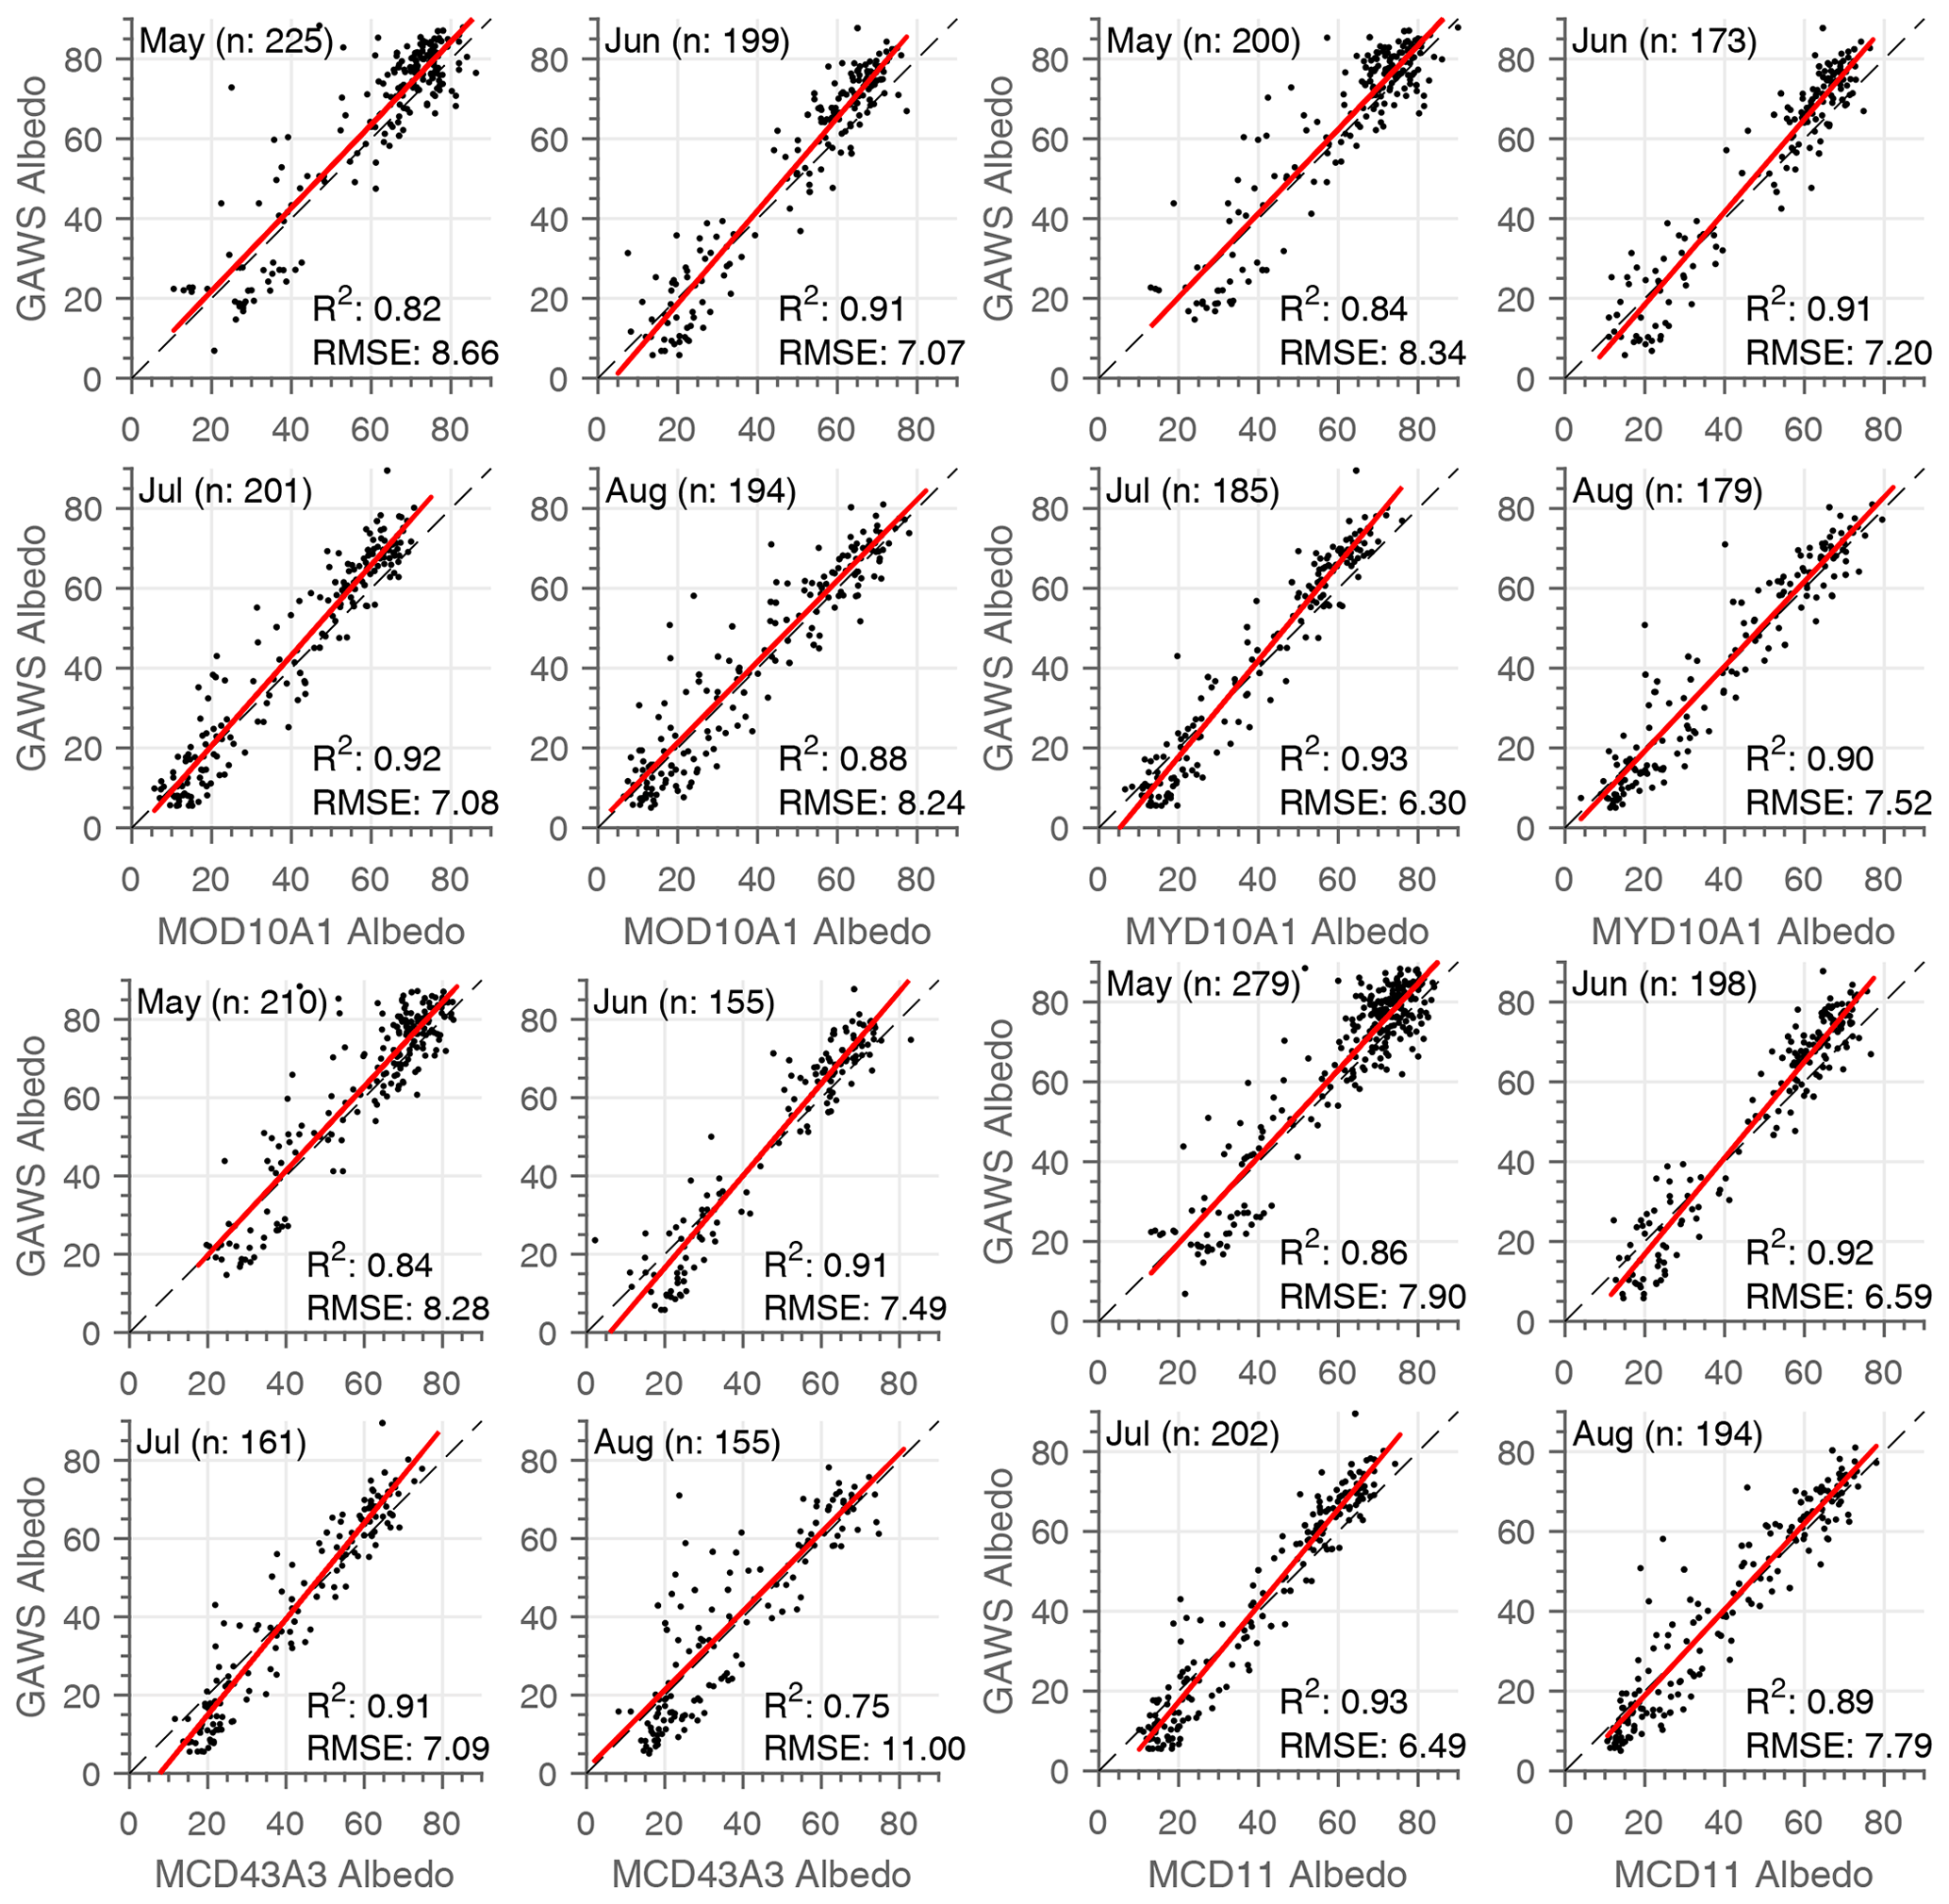
Figure A2Albedo comparison results from monthly averaged MODIS data for May, June, July, and August for the period from 2000–2019 where data were available for MOD10A1, MYD10A1, MCD43, and MCD11 data products.
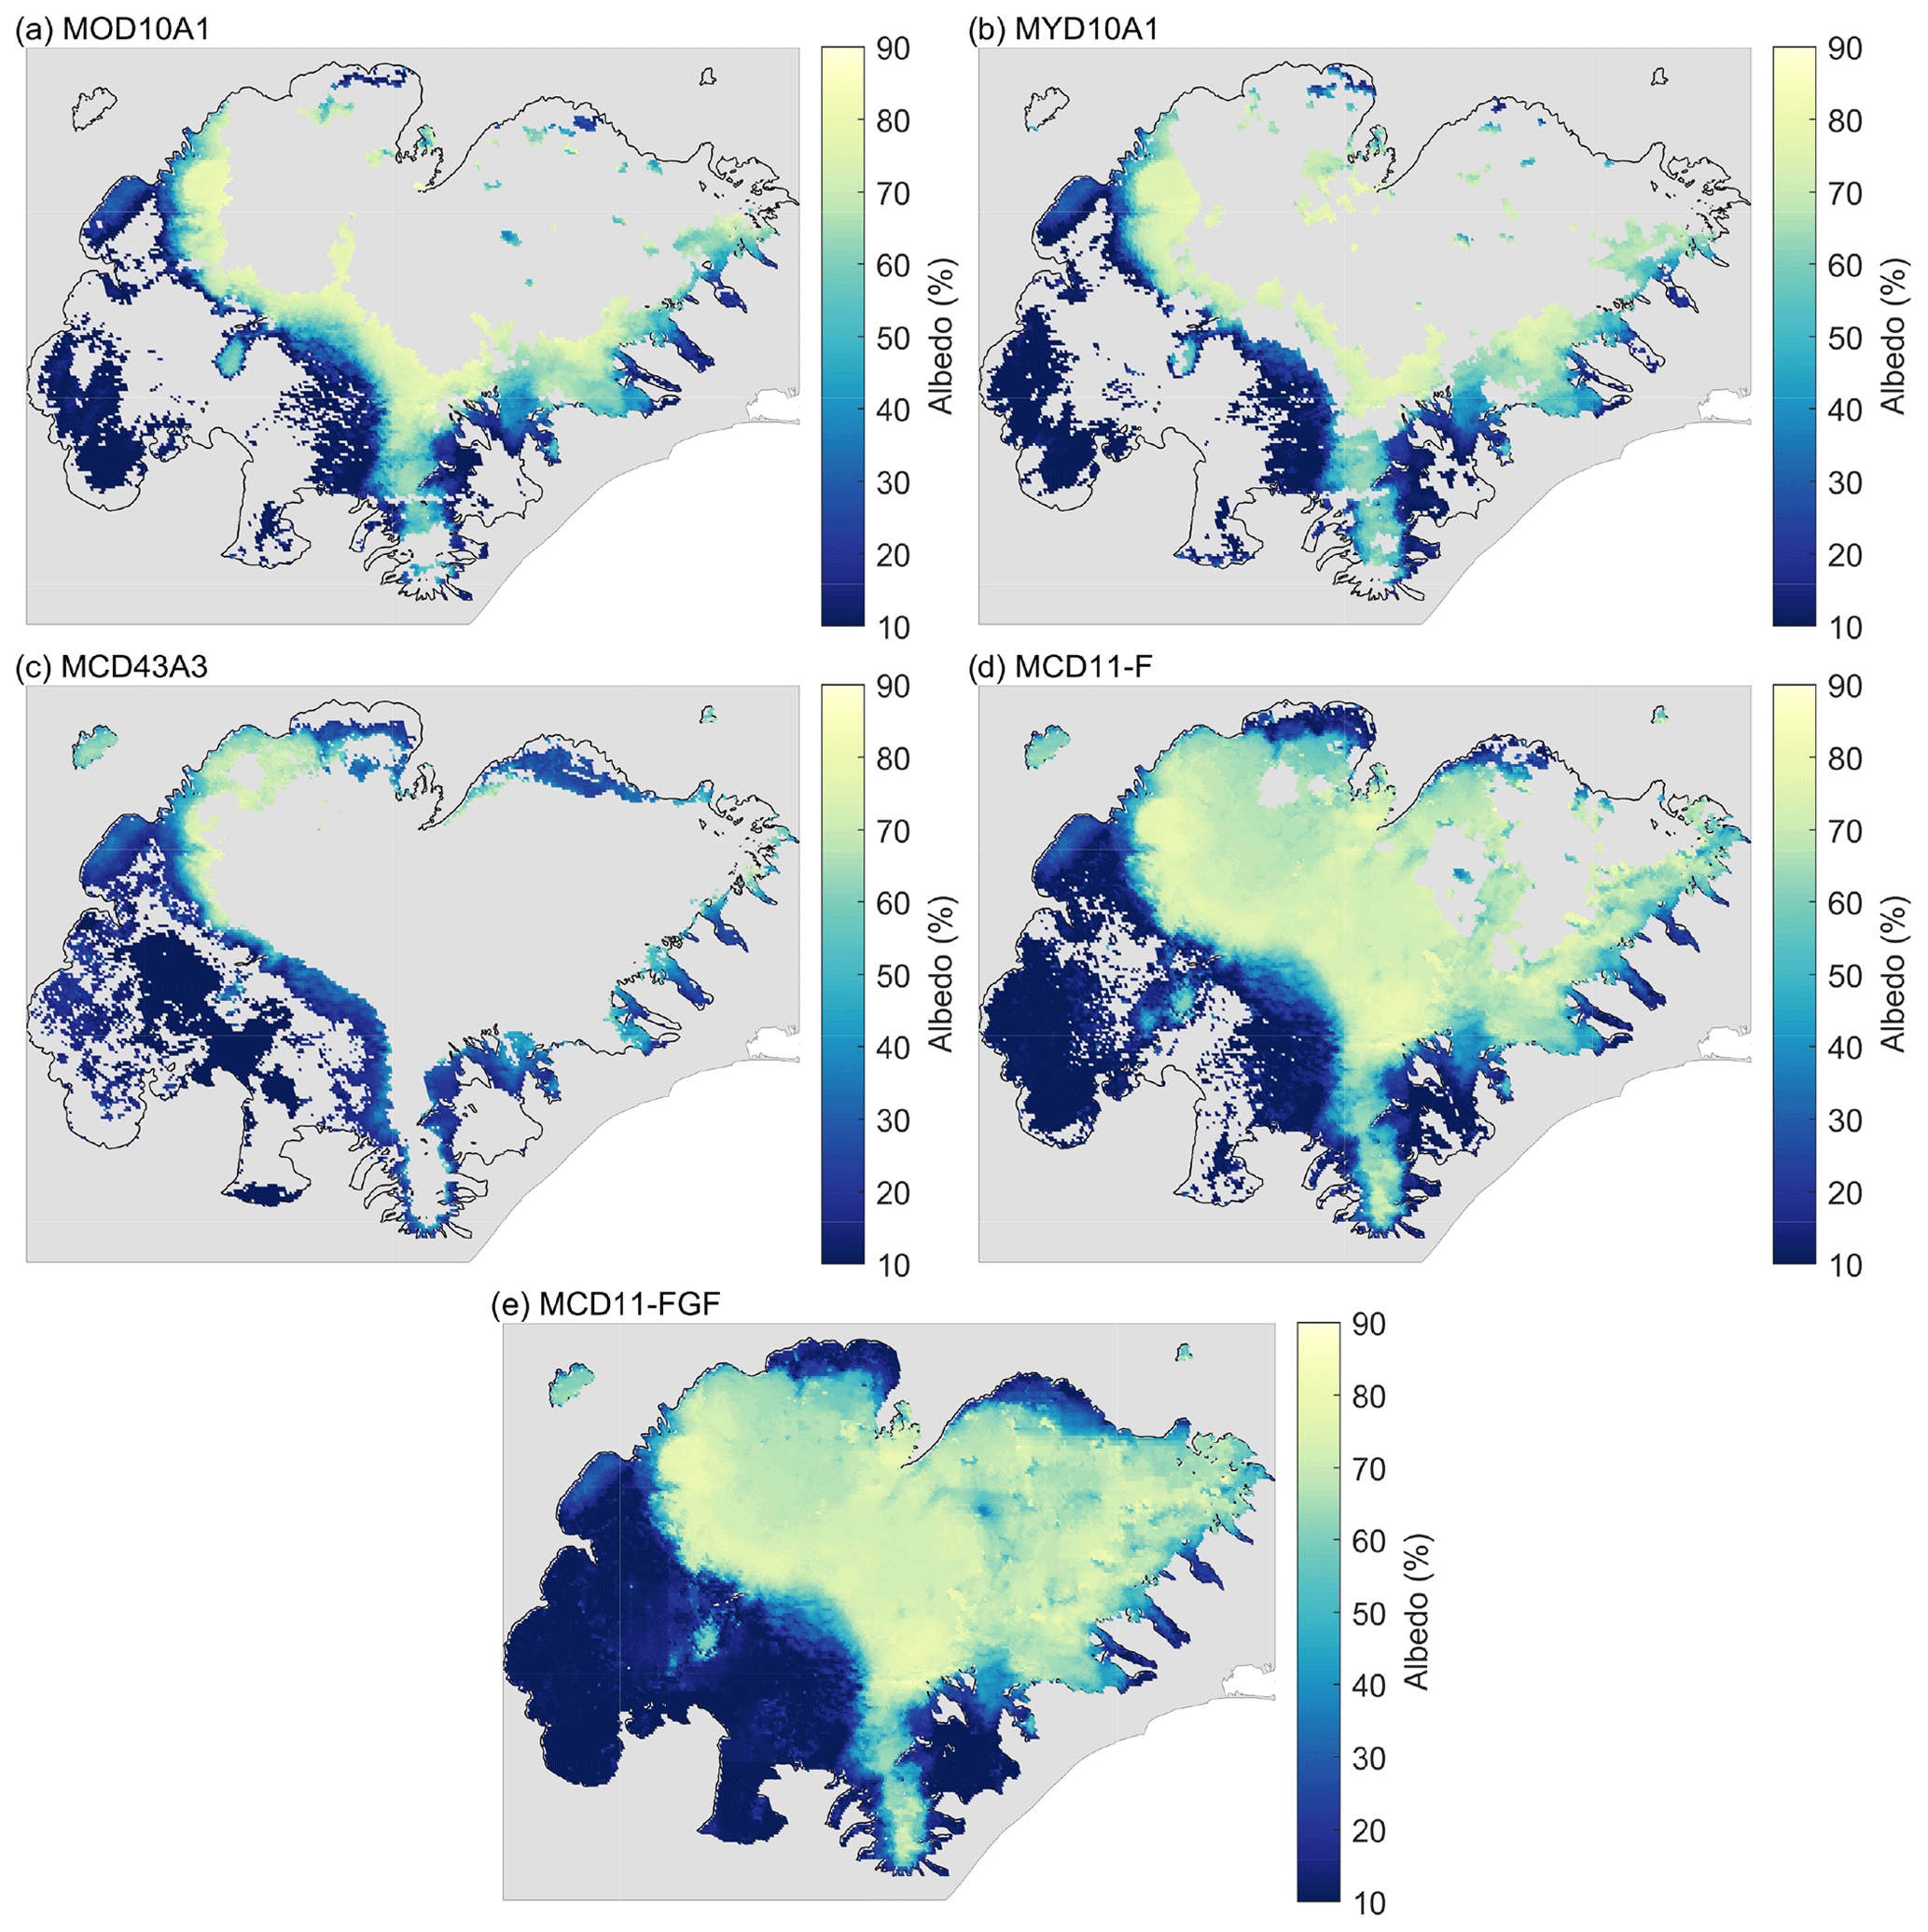
Figure A3Albedo maps for different processing and products post-eruption at Grímsvötn. Data are shown for 18 June 2011. Panels (a) and (b) show the original albedo tiles (Snow Albedo Daily Tile) for the original MODIS products (M∗D10A1). Panel (c) shows albedo data for MCD43A3 (Albedo BSA shortwave). Panel (d) shows the MCD11 product (MCD11-F) after median-based outlier removal, and (e) shows the final MCD11 (MCD11-FGF) product after median-based outlier removal and gap filling as described in Sect. 2.
Code used in the project to process data is available at https://github.com/andrigunn/aig2 (last access: 30 December 2019) and https://doi.org/10.5281/zenodo.4445245 (Gunnarsson, 2021). MODIS data are available from https://nsidc.org/data (Hall and Riggs, 2016a, b). Geospatial data for Iceland are available from the National Land Survey of Iceland at https://atlas.lmi.is (NLSI, 2019). Glacier automatic weather station data are available upon request.
AG conceived and designed the study, performed the analyses, and prepared the manuscript. SMG contributed to the study design, interpretation of the results, and writing of the manuscript. FP, TJ, and ÓGBS contributed to the interpretation of the results and writing and reviewing of the manuscript.
The authors declare that they have no conflict of interest.
The authors would like to thank the editor Marie Dumont, and two reviewers, Simon Gascoin and Pavla Dagsson-Waldhauserova, for their review, and comments, improving the manuscript.
This paper was edited by Marie Dumont and reviewed by Simon Gascoin and Pavla Dagsson Waldhauserova.
Ackerman, S. A., Strabala, K. I., Menzel, W. P., Frey, R. A., Moeller, C. C., and Gumley, L. E.: Discriminating clear sky from clouds with MODIS, J. Geophys. Res.-Atmos., 103, 32141–32157, https://doi.org/10.1029/1998JD200032, 1998. a
Arnalds, O., Dagsson-Waldhauserova, P., and Ólafsson, H.: The Icelandic volcanic aeolian environment: Processes and impacts – A review, Aeolian Res., 20, 176–195, https://doi.org/10.1016/j.aeolia.2016.01.004, 2016. a, b, c
Björnsson, H.: Hydrology of ice caps in volcanic regions, Reykjavik Societas Scientarium Islandica, University of Iceland, Polar Record, 26, 132–132, https://doi.org/10.1017/S0032247400011293, 1988. a
Björnsson, H., Pálsson, F., and Guðmundsson, M. T.: Surface and bedrock topography of the Mýrdalsjökull ice cap, Iceland: The Katla caldera, eruption sites and routes of jökulhlaups, Jökull, 49, 29–46, 2000. a
Björnsson, H., Jónsson, T., Gylfadóttir, S. S., and Ólason, E. Ö.: Mapping the annual cycle of temperature in Iceland, Meteorol. Z., 16, 45–56, https://doi.org/10.1127/0941-2948/2007/0175, 2007. a
Björnsson, H., Sigurðsson, B. D., Davíðsdóttir, B., Ólafsson, Ástþórsson, J., Ólafsdóttir, S., Baldursson, T., and Jónsson, T.: Loftslagsbreytingar og áhrif þeirra á Íslandi: skýrsla vísindanefndar um loftslagsbreytingar 2018. (Climate Change and it's impact on Iceland – Report of the scientific committee on Climate), available at: https://www.vedur.is/media/loftslag/Skyrsla-loftslagsbreytingar-2018-Vefur-NY.pdf (last access: 30 December 2019), 2018. a, b
Box, J. E., Fettweis, X., Stroeve, J. C., Tedesco, M., Hall, D. K., and Steffen, K.: Greenland ice sheet albedo feedback: thermodynamics and atmospheric drivers, The Cryosphere, 6, 821–839, https://doi.org/10.5194/tc-6-821-2012, 2012. a, b, c, d, e, f, g, h
Butwin, M. K., Löwis, S. V., Pfeffer, M. A., and Thorsteinsson, T.: The effects of volcanic eruptions on the frequency of particulate matter suspension events in Iceland, J. Aerosol Sci., 128, 99–113, https://doi.org/10.1016/j.jaerosci.2018.12.004, 2019. a
Crochet, P., Jóhannesson, T., Jónsson, T., Sigurðsson, O., Björnsson, H., Pálsson, F., and Barstad, I.: Estimating the Spatial Distribution of Precipitation in Iceland Using a Linear Model of Orographic Precipitation, J. Hydrometeorol., 8, 1285–1306, https://doi.org/10.1175/2007JHM795.1, 2007. a
Cuffey, K. and Paterson, W.: The Physics of Glaciers, Elsevier Science, 2010. a
Dagsson-Waldhauserova, P., Arnalds, O., and Olafsson, H.: Long-term variability of dust events in Iceland (1949–2011), Atmos. Chem. Phys., 14, 13411–13422, https://doi.org/10.5194/acp-14-13411-2014, 2014. a
Dagsson-Waldhauserova, P., Arnalds, O., Olafsson, H., Hladil, J., Skala, R., Navratil, T., Chadimova, L., and Meinander, O.: Snow–Dust Storm: Unique case study from Iceland, March 6–7, 2013, Aeolian Res., 16, 69–74, https://doi.org/10.1016/j.aeolia.2014.11.001, 2015. a, b
Dagsson-Waldhauserova, P., Renard, J.-B., Olafsson, H., Vignelles, D., Berthet, G., Verdier, N., and Duverger, V.: Vertical distribution of aerosols in dust storms during the Arctic winter, Sci. Rep., 9, 16122, https://doi.org/10.1038/s41598-019-51764-y, 2019. a, b
de Abreu, R. A., Key, J., Maslanik, J. A., Serreze, M. C., and Ledrew, E. F.: Comparison of in Situ and AVHRR-Derived Broadband Albedo over Arctic Sea Ice, Arctic, 47, 288–297, 1994. a
De Ruyter De Wildt, M. S., Oerlemans, J., and Björnsson, H.: A method for monitoring glacier mass balance using satellite albedo measurements: application to Vatnajökull, Iceland, J. Glaciol., 48, 267–278, https://doi.org/10.3189/172756502781831458, 2002. a, b
Dietz, A. J., Wohner, C., and Kuenzer, C.: European Snow Cover Characteristics between 2000 and 2011 Derived from Improved MODIS Daily Snow Cover Products, Remote Sensing, 4, 2432–2454, https://doi.org/10.3390/rs4082432, 2012. a
Donohoe, A. and Battisti, D. S.: Atmospheric and Surface Contributions to Planetary Albedo, J. Climate, 24, 4402–4418, https://doi.org/10.1175/2011JCLI3946.1, 2011. a
Đorđević, D., Tošić, I., Sakan, S., Petrović, S., Đuričić-Milanković, J., Finger, D. C., and Dagsson-Waldhauserová, P.: Can Volcanic Dust Suspended From Surface Soil and Deserts of Iceland Be Transferred to Central Balkan Similarly to African Dust (Sahara)?, Front. Earth Sci., 7, 142, https://doi.org/10.3389/feart.2019.00142, 2019. a
Dozier, J., Painter, T. H., Rittger, K., and Frew, J. E.: Time–space continuity of daily maps of fractional snow cover and albedo from MODIS, Adv. Water Res., 31, 1515–1526, https://doi.org/10.1016/j.advwatres.2008.08.011, 2008. a
Dragosics, M., Meinander, O., Jónsdóttír, T., Dürig, T., De Leeuw, G., Pálsson, F., Dagsson-Waldhauserová, P., and Thorsteinsson, T.: Insulation Effects of Icelandic Dust and Volcanic Ash on Snow and Ice, Arab. J. Geosci., 9, 126, https://doi.org/10.1007/s12517-015-2224-6, 2016. a
Þorsteinsson, Þ., Jóhannesson, T., Sigurðsson, O., and Einarsson, B.: Afkomumælingar á Hofsjökli 1988–2017, Veðurstofa Íslands, Reykjavík, 2017-016, 82, 2017. a
Einarsson, B.: Jöklabreytingar (glacier variations) 1930–1970, 1970–1995, 1995–2016 og 2016–2017, Jökull, 68, 95–99, 2018. a
Einarsson, M. Á.: Climates of the oceans, edited by: Van Loon, H., Vol. 15 of World Survey of Climatology, Elsevier, J. Climatol., 5, 673–697, https://doi.org/10.1002/joc.3370050110, 1984. a, b
Gardner, A. S. and Sharp, M. J.: A review of snow and ice albedo and the development of a new physically based broadband albedo parameterization, J. Geophys. Res.-Earth, 115, F01009, https://doi.org/10.1029/2009JF001444, 2010. a
Gascoin, S., Guðmundsson, S., Aðalgeirsdóttir, G., Pálsson, F., Schmidt, L., Berthier, E., and Björnsson, H.: Evaluation of MODIS Albedo Product over Ice Caps in Iceland and Impact of Volcanic Eruptions on Their Albedo, Remote Sensing, 9, 399, https://doi.org/10.3390/rs9050399, 2017. a, b, c, d, e, f, g, h, i, j, k
GDAL/OGR contributors: GDAL/OGR Geospatial Data Abstraction software Library, Open Source Geospatial Foundation, available at: https://gdal.org (last access: 30 December 2019), 2019. a
Gudmundsson, M. T., Sigmundsson, F., and Björnsson, H.: Ice–volcano interaction of the 1996 Gjálp subglacial eruption, Vatnajökull, Iceland, Nature, 389, 954–957, https://doi.org/10.1038/40122, 1997. a
Guðmundsson, M. T., Þórðarson, Þ., Höskuldsson, Á., Larsen, G., Björnsson, H., Prata, F. J., Oddsson, B., Magnússon, E., Högnadóttir, Þ., Petersen, G. N., Hayward, C. L., Stevenson, J. A., and Jónsdóttir, I.: Ash generation and distribution from the April–May 2010 eruption of Eyjafjallajökull, Iceland, Sci. Rep., 2, 572, https://doi.org/10.1038/srep00572, 2012. a, b
Guðmundsson, S., Björnsson, H., Pálsson, F., and Haraldsson, H. H.: Comparison of energy balance and degree–day models of summer ablation on the Langjökull ice cap, SW-Iceland, Jökull, 59, 1–18, 2009. a, b
Gunnarsson, A.: andrigunn/aig2: open (Version 1), Zenodo, https://doi.org/10.5281/zenodo.4445245, 2021. a
Gunnarsson, A., Garðarsson, S. M., and Sveinsson, Ó. G. B.: Icelandic snow cover characteristics derived from a gap-filled MODIS daily snow cover product, Hydrol. Earth Syst. Sci., 23, 3021–3036, https://doi.org/10.5194/hess-23-3021-2019, 2019. a, b, c
Hall, D. K. and Riggs, G. A.: MODIS/Aqua Snow Cover Daily L3 Global 500m Grid, Version 6, Tech. rep., NASA National Snow and Ice Data Center Distributed Active Archive Center, Boulder, Colorado USA, https://doi.org/10.5067/MODIS/MYD10A1.006, 2016a. a, b
Hall, D. K. and Riggs, G. A.: MODIS/Terra Snow Cover Daily L3 Global 500m Grid, Version 6, Tech. rep., NASA National Snow and Ice Data Center Distributed Active Archive Center, Boulder, Colorado USA, https://doi.org/10.5067/MODIS/MOD10A1.006, 2016b. a, b
Hanna, E., Jónsson, T., and Box, J. E.: An analysis of Icelandic climate since the nineteenth century, International Journal of Climatology, 24, 1193–1210, https://doi.org/10.1002/joc.1051, 2004. a
Hannesdóttir, H., Sigurðsson, O., Þrastarson, R., Guðmundasson, S., Belart, J., Pálsson, F., Magnússon, E., Víkingsson, S., and Jóhannesson, T.: Variations in glacier extent in Iceland since the end of the Little Ice Age, Jökull, 1–34, 2020. a
Helsel, D. and Hirsch, R.: Statistical Methods in Water Resources Techniques of Water Resources Investigations, Tech. Rep. Book 4, Chapter A3, U.S. Geological Survey, 2002. a
Hjaltason, S., Guðmundsdóttir, M., Haukdal, J. Á., and Guðmundsson, J. R.: Energy Statistics in Iceland 2017, Energy Statistics in Iceland, Orkustofnun, available at: https://orkustofnun.is/gogn/Talnaefni/OS-2019-T009-01.pdf (last access: 30 December 2019), 2018. a
Jóhannesson, T., Björnsson, H., Magnússon, E., Guðmundsson, S., Pálsson, F., Sigurðsson, O., Thorsteinsson, T., and Berthier, E.: Ice-volume changes, bias estimation of mass-balance measurements and changes in subglacial lakes derived by lidar mapping of the surface of Icelandic glaciers, Ann. Glaciol., 54, 63–74, https://doi.org/10.3189/2013AoG63A422, 2013. a
Kipp and Zonen: Instruction Manuel CNR1 Net Radiometer, available at: https://s.campbellsci.com/documents/cn/manuals/cnr4.pdf, last access: 11 September 2019. a, b
Klein, A. G. and Stroeve, J.: Development and Validation of a Snow Albedo Algorithm for the MODIS Instrument, Ann. Glaciol., 34, 45–52, https://doi.org/10.3189/172756402781817662, 2002. a, b, c
Konzelmann, T. and Ohmura, A.: Radiative Fluxes and Their Impact on the Energy Balance of the Greenland Ice Sheet, J. Glaciol., 41, 490–502, https://doi.org/10.3189/S0022143000034833, 1995. a
Liang, S., Stroeve, J., and Box, J. E.: Mapping Daily Snow/Ice Shortwave Broadband Albedo from Moderate Resolution Imaging Spectroradiometer (MODIS): The Improved Direct Retrieval Algorithm and Validation with Greenland in Situ Measurement, J. Geophys. Res.-Atmos., 110, D10109, https://doi.org/10.1029/2004JD005493, 2005. a
Lindsay, R. W. and Rothrock, D. A.: Arctic Sea Ice Albedo from AVHRR, J. Climate, 7, 1737–1749, https://doi.org/10.1175/1520-0442(1994)007<1737:ASIAFA>2.0.CO;2, 1994. a
Magnússon, E., Belart, J. M. C., Pálsson, F., Anderson, L. S., Gunnlaugsson, A., Berthier, E., Ágústsson, H., and Geirsdóttir, A.: The subglacial topography of Drangajökull ice cap, NW-Iceland, deduced from dense RES-profiling, Jökull, 66, 1–26, 2016. a
Matlab: R2017a, The Mathworks Inc., Natick, Massachusetts, 2017. a
Meinander, O., Kontu, A., Virkkula, A., Arola, A., Backman, L., Dagsson-Waldhauserová, P., Järvinen, O., Manninen, T., Svensson, J., de Leeuw, G., and Leppäranta, M.: Brief communication: Light-absorbing impurities can reduce the density of melting snow, The Cryosphere, 8, 991–995, https://doi.org/10.5194/tc-8-991-2014, 2014. a
Möller, R., Möller, M., Björnsson, H., Gudmundsson, S., Pálsson, F., Oddsson, B., Kukla, P., and Schneider, C.: MODIS-derived albedo changes of Vatnajökull (Iceland) due to tephra deposition from the 2004 Grimsvötn eruption, Int. J. Appl. Earth Obs., 26, 256–269, https://doi.org/10.1016/j.jag.2013.08.005, 2014. a, b, c, d
Möller, R., Dagsson-Waldhauserova, P., Möller, M., Kukla, P. A., Schneider, C., and Gudmundsson, M. T.: Persistent albedo reduction on southern Icelandic glaciers due to ashfall from the 2010 Eyjafjallajökull eruption, Remote Sens. Environ., 233, 111396, https://doi.org/10.1016/j.rse.2019.111396, 2019. a, b
Naegeli, K., Damm, A., Huss, M., Wulf, H., Schaepman, M., and Hoelzle, M.: Cross-Comparison of Albedo Products for Glacier Surfaces Derived from Airborne and Satellite (Sentinel-2 and Landsat 8) Optical Data, Remote Sensing, 9, 110, https://doi.org/10.3390/rs9020110, 2017. a
Naegeli, K., Huss, M., and Hoelzle, M.: Change detection of bare-ice albedo in the Swiss Alps , The Cryosphere, 13, 397–412, https://doi.org/10.5194/tc-13-397-2019, 2019. a
National Land Survey of Iceland (NLSI): IS 50V geospatial data, available at: https://atlas.lmi.is, last access: 30 December 2019. a
Painter, T. H., Bryant, A. C., and Skiles, S. M.: Radiative forcing by light absorbing impurities in snow from MODIS surface reflectance data, Geophys. Res. Lett., 39, L17502, https://doi.org/10.1029/2012GL052457, 2012. a
Pálsson, F., Gunnarsson, A., Pálsson, H. S., and Steinþórsson, S.: Afkomu- og hraðamælingar á Langjökli jökulárið 2012–2013, Landsvirkjun, Reykjavík, LV-2015-076, 37, 2015. a
Pálsson, F., Gunnarsson, A., Jónsson, G., Pálsson, H. S., and Steinþórsson, S.: Vatnajökull: Mass balance, meltwater drainage and surface velocity of the glacial year 2018–19, Landsvirkjun, Reykjavík, RH-01-20/LV-2020-016, 56, 2020a. a, b
Pálsson, F., Gunnarsson, A., Pálsson, H. S., and Steinþórsson, S.: Afkomu-og hraðamælingar á Langjökli jökulárið 2018–2019, Landsvirkjun, Reykjavík, RH-10-20/LV-2020-017, 27, 2020b. a
Peltoniemi, J. I., Gritsevich, M., Hakala, T., Dagsson-Waldhauserová, P., Arnalds, Ó., Anttila, K., Hannula, H.-R., Kivekäs, N., Lihavainen, H., Meinander, O., Svensson, J., Virkkula, A., and de Leeuw, G.: Soot on Snow experiment: bidirectional reflectance factor measurements of contaminated snow, The Cryosphere, 9, 2323–2337, https://doi.org/10.5194/tc-9-2323-2015, 2015. a
Pope, E. L., Willis, I. C., Pope, A., Miles, E. S., Arnold, N. S., and Rees, W. G.: Contrasting snow and ice albedos derived from MODIS, Landsat ETM+ and airborne data from Langjökull, Iceland, Remote Sens. Environ., 175, 183–195, https://doi.org/10.1016/j.rse.2015.12.051, 2016. a, b
Reijmer, C. H., Knap, W. H., and Oerlemans, J.: The Surface Albedo Of The Vatnajökull Ice Cap, Iceland: A Comparison Between Satellite-Derived And Ground-Based Measurements, Bound.-Lay. Meteorol., 92, 123–143, https://doi.org/10.1023/A:1001816014650, 1999. a, b, c, d, e, f, g, h
Schaaf, C. K. and Wang, Z.: MCD43A3/MODIS/Terra+Aqua BRDF/Albedo Daily L3 Global – 500m V006 500m Grid, Version 6, Tech. rep., NASA EOSDIS Land Processes DAAC, Boulder, Colorado USA, https://doi.org/10.5067/MODIS/MCD43A3.006, 2015. a
Schmidt, L., Langen, P., Aðalgeirsdóttir, G., Pálsson, F., Guðmundsson, S., and Gunnarsson, A.: Sensitivity of Glacier Runoff to Winter Snow Thickness Investigated for Vatnajökull Ice Cap, Iceland, Using Numerical Models and Observations, Atmosphere, 9, 11, https://doi.org/10.3390/atmos9110450, 2018. a
Schmidt, L. S., Aðalgeirsdóttir, G., Guðmundsson, S., Langen, P. L., Pálsson, F., Mottram, R., Gascoin, S., and Björnsson, H.: The importance of accurate glacier albedo for estimates of surface mass balance on Vatnajökull: evaluating the surface energy budget in a regional climate model with automatic weather station observations, The Cryosphere, 11, 1665–1684, https://doi.org/10.5194/tc-11-1665-2017, 2017. a
Sirguey, P.: Simple correction of multiple reflection effects in rugged terrain, Int. J. Remote Sens., 30, 1075–1081, https://doi.org/10.1080/01431160802348101, 2009. a
Sirguey, P., Mathieu, R., and Arnaud, Y.: Subpixel monitoring of the seasonal snow cover with MODIS at 250 m spatial resolution in the Southern Alps of New Zealand: Methodology and accuracy assessment, Remote Sens. Environ., 113, 160–181, https://doi.org/10.1016/j.rse.2008.09.008, 2009. a
Skiles, S. M., Flanner, M., Cook, J. M., Dumont, M., and Painter, T. H.: Radiative Forcing by Light-Absorbing Particles in Snow, Nature Climate Change, 8, 964, https://doi.org/10.1038/s41558-018-0296-5, 2018. a
Steffen, K., Abdalati, W., and Stroeve, J.: Climate sensitivity studies of the Greenland ice sheet using satellite AVHRR, SMMR, SSM/I and in situ data, Meteorol. Atmos. Phys., 51, 239–258, https://doi.org/10.1007/BF01030497, 1993. a
Stibal, M., Box, J. E., Cameron, K. A., Langen, P. L., Yallop, M. L., Mottram, R. H., Khan, A. L., Molotch, N. P., Chrismas, N. A. M., Calì Quaglia, F., Remias, D., Smeets, C. J. P. P., van den Broeke, M. R., Ryan, J. C., Hubbard, A., Tranter, M., van As, D., and Ahlstrøm, A. P.: Algae Drive Enhanced Darkening of Bare Ice on the Greenland Ice Sheet, Geophys. Res. Lett., 44, 11463–11471, https://doi.org/10.1002/2017GL075958, 2017. a
Stroeve, J.: Assessment of Greenland Albedo Variability from the Advanced Very High Resolution Radiometer Polar Pathfinder Data Set, J. Geophys. Res.-Atmos., 106, 33989–34006, https://doi.org/10.1029/2001JD900072, 2001. a
Stroeve, J., Nolin, A., and Steffen, K.: Comparison of AVHRR-Derived and in Situ Surface Albedo over the Greenland Ice Sheet, Remote Sens. Environ., 62, 262–276, https://doi.org/10.1016/S0034-4257(97)00107-7, 1997. a, b, c
Stroeve, J., Box, J. E., Gao, F., Liang, S., Nolin, A., and Schaaf, C.: Accuracy Assessment of the MODIS 16-Day Albedo Product for Snow: Comparisons with Greenland in Situ Measurements, Remote Sens. Environ., 94, 46–60, https://doi.org/10.1016/j.rse.2004.09.001, 2005. a, b, c
Stroeve, J., Box, J. E., Wang, Z., Schaaf, C., and Barrett, A.: Re-Evaluation of MODIS MCD43 Greenland Albedo Accuracy and Trends, Remote Sens. Environ., 138, 199–214, https://doi.org/10.1016/j.rse.2013.07.023, 2013. a, b, c
Tesche, M., Glantz, P., Johansson, C., Norman, M., Hiebsch, A., Ansmann, A., Althausen, D., Engelmann, R., and Seifert, P.: Volcanic ash over Scandinavia originating from the Grímsvötn eruptions in May 2011, J. Geophys. Res.-Atmos., 117, D09201, https://doi.org/10.1029/2011JD017090, 2012. a
Van den Broeke, M., Reijmer, C. H., and Van De Wal, R. S.: A study of the surface mass balance in Dronning Maud Land, Antarctica, using automatic weather stations, J. Glaciol., 50, 565–582, https://doi.org/10.3189/172756504781829756, 2004a. a
Van den Broeke, M., van As, D., Reijmer, C., and Wal, R.: Assessing and Improving the Quality of Unattended Radiation Observations in Antarctica, J. Atmos. Ocean. Tech., 21, 1417–1431, https://doi.org/10.1175/1520-0426(2004)021<1417:AAITQO>2.0.CO;2, 2004b. a, b
Warren, S. G.: Optical Properties of Snow, Rev. Geophys., 20, 67–89, https://doi.org/10.1029/RG020i001p00067, 1982. a
Warren, S. G. and Wiscombe, W. J.: A Model for the Spectral Albedo of Snow. II: Snow Containing Atmospheric Aerosols, J. Atmos. Sci., 37, 2734–2745, https://doi.org/10.1175/1520-0469(1980)037<2734:AMFTSA>2.0.CO;2, 1980. a
Watson, E., Swindles, G., Stevenson, J., Savov, I., and Lawson, I.: The transport of Icelandic volcanic ash: insights from northern European cryptotephra records: Cryptotephra records of volcanic ash, J. Geophys. Res.-Sol. Ea., 121, 7177–7192, https://doi.org/10.1002/2016JB013350, 2016. a
Winther, J.-G.: Landsat TM derived and in situ summer reflectance of glaciers in Svalbard, Polar Res., 12, 37–55, https://doi.org/10.3402/polar.v12i1.6702, 1993. a
Wittmann, M., Groot Zwaaftink, C. D., Steffensen Schmidt, L., Guðmundsson, S., Pálsson, F., Arnalds, O., Björnsson, H., Thorsteinsson, T., and Stohl, A.: Impact of dust deposition on the albedo of Vatnajökull ice cap, Iceland, The Cryosphere, 11, 741–754, https://doi.org/10.5194/tc-11-741-2017, 2017. a, b, c, d
Xiong, X., Butler, J., Cao, C., and Wu, X.: 1.13 – Optical Sensors–VIS/NIR/SWIR, in: Comprehensive Remote Sensing, edited by: Liang, S., Elsevier, Oxford, 353–375, https://doi.org/10.1016/B978-0-12-409548-9.10325-2, 2018. a
Zhou, C., Zhang, T., and Zheng, L.: The Characteristics of Surface Albedo Change Trends over the Antarctic Sea Ice Region during Recent Decades, Remote Sensing, 11, 821, https://doi.org/10.3390/rs11070821, 2019. a
Zubko, N., Muñoz, O., Zubko, E., Gritsevich, M., Escobar-Cerezo, J., Berg, M. J., and Peltoniemi, J.: Light scattering from volcanic-sand particles in deposited and aerosol form, Atmos. Environ., 215, 116813, https://doi.org/10.1016/j.atmosenv.2019.06.051, 2019. a