the Creative Commons Attribution 4.0 License.
the Creative Commons Attribution 4.0 License.
 | 29 Oct 2021
Wind-induced seismic noise at the Princess Elisabeth Antarctica Station
Baptiste Frankinet
Thomas Lecocq
Thierry Camelbeeck
Icequakes are the result of processes occurring within the ice mass or between the ice and its environment. Studying icequakes provides a unique view on ice dynamics, specifically on the basal conditions. Changes in conditions due to environmental or climate changes are reflected in icequakes. Counting and characterizing icequakes is thus essential to monitor them. Most of the icequakes recorded by the seismic station at the Belgian Princess Elisabeth Antarctica Station (PE) have small amplitudes corresponding to maximal displacements of a few nanometres. Their detection threshold is highly variable because of the rapid and strong changes in the local seismic noise level. Therefore, we evaluated the influence of katabatic winds on the noise measured by the well-protected PE surface seismometer. Our purpose is to identify whether the lack of icequake detection during some periods could be associated with variations in the processes generating them or simply with a stronger seismic noise linked to stronger wind conditions. We observed that the wind mainly influences seismic noise at frequencies greater than 1 Hz. The seismic noise power exhibits a bilinear correlation with the wind velocity, with two different slopes at a wind velocity lower and greater than 6 m s−1 and with, for example at a period of 0.26 s, a respective variation of 0.4 dB (m −1 s) and 1.4 dB (m −1 s). These results allowed a synthetic frequency and wind-speed-dependent noise model to be presented that explains the behaviour of the wind-induced seismic noise at PE, which shows that seismic noise amplitude increases exponentially with increasing wind speed. This model enables us to study the influence of the wind on the original seismic dataset, which improves the observation of cryoseismic activity near the PE station.
- Article
(7670 KB) - Full-text XML
- BibTeX
- EndNote


The study of icequakes provides insights into the different processes linked to ice dynamics. Icequakes, or cryoseisms, originate from the formation of crevasses, basal sliding, hydrofracturing, iceberg calving, englacial fracturing, and glacial seismicity triggered by an earthquake. A synthesis of the main types of icequakes and their causes is presented by Podolskiy and Walter (2016). Cryoseismic sources can have seismic signatures that are difficult to distinguish one from another. For example, the crevasse formation represents very short events (<1 s) over a large frequency band (10–50 Hz). Crevasse formation events have a propagation velocity of 0.01 up to 30 m s−1 and generally do not exceed 10 µm in amplitude (Podolskiy and Walter, 2016), making them close in amplitude to microseismic noise or to wind-induced ground motion that can cause a similar seismic signature and amplitude (Bormann and Wielandt, 2013; Naderyan et al., 2016; Withers et al., 1996). Cryoseismology has not been studied thoroughly in all regions of Antarctica, but thanks to the improvement of instrumentation and the increasing number of seismic stations in Antarctica, numerous studies linking seismology to glaciology have been published in the last decade: from linking the microseismicity induced by tides in the grounding line of East Antarctica (Barruol et al., 2013), focusing on tremors from stick-slip motions in the Whillans ice stream (Winberry et al., 2013), studying specific cryoseismic events observed at Ekström Ice Shelf, Antarctica (Hammer et al., 2015), to observing thermally induced icequakes and their origins on blue ice in East Antarctica (Lombardi et al., 2019).
1.1 The Belgian Princess Elisabeth Antarctica Station and seismic stations
The Belgian Princess Elisabeth Antarctica Station (PEAS) was built during the first International Polar Year 2007–2008 and completed in 2008–2009. It is situated 300 m north of Usteinen nunatak (71∘57′ S, 23∘20′ E) on a small flat granite ridge, a few kilometres north of the Sør Rondane mountain range. The Usteinen nunatak is approximately 700 m long and 20–30 m wide and is composed of massive coarse-grained granite with minor xenolithic blocks of metamorphic rocks (Kojima and Shiraishi, 1986). To the south, the Sør Rondane mountain peaks have an elevation up to 4000 m and form part of the eastern Antarctica Precambrian shield (Pattyn et al., 1992). The PEAS allowed for the investigation of meteorites in the field as spotting them in the emptiness of Antarctica is simpler than when they are mixed up with vegetation and rocks, as well as studying microbiology (Peeters et al., 2011; Pushkareva et al., 2018), glaciology (Callens et al., 2015; Pattyn et al., 2010), and meteorology (clouds, aerosols, temperature) (Gossart et al., 2019a, 2019b; Herenz et al., 2019; Souverijns et al., 2018). In parallel, the Royal Observatory of Belgium installed a permanent broadband seismic station (BE.ELIS) on the bedrock near the base in February 2012 (Camelbeeck et al., 2019). This station increases the sparse coverage of seismic stations in the Sør Rondane mountain range in Antarctica. Indeed, the closest seismometer is located at the Russian Novolazarevskaya base, 430 km west of PEAS. To the east of PEAS, the closest station is the Japanese Syowa site (680 km away). Because of its location, the station gave a new source of information for global seismic studies, as well as for inferring the crustal structure beneath it (Camelbeeck et al., 2019). The addition of a temporary seismic network during the 2014 austral summer (see Table 1 and Fig. 1) has highlighted seismic activity within a radius of 150 km around the station (Camelbeeck et al., 2019). This seismic activity is related to the interaction between ice and bedrock or from within the ice.
1.2 Icequakes and seismic noise
Most icequakes induce elastic deformation which can be detected by seismometers, while the resulting plastic damage and movements of the ice sheet and associated glaciers can be observed by other geophysical or geodetic means, such as GPS (Capra et al., 1998) or radar interferometry (Mohr et al., 1998; Rignot et al., 2011). Cryoseismic catalogues and seismic observations can be correlated with numerical models of eastern Antarctic ice dynamics to constrain subglacial properties of a specific area (Lipovsky and Dunham, 2015; Pattyn, 2010; Smith, 1997, 2006). These icequakes mostly have a very low seismic amplitude (few nanometres of displacement) but can still be detected owing to the very low seismic noise observed in Antarctica. Icequakes' signal-to-noise ratios (SNRs) decrease when the noise increases; hence it is important to identify the noise sources and their power to impact the catalogue completeness before concluding the ice dynamics. At PEAS, a few anthropogenic noise sources exist year-round like wind turbines and seasonal human activities outside and inside the buildings during the summer. The region is also subjected to rough meteorological conditions, composed of katabatic winds with velocities sometimes higher than 25 m s−1 (Pattyn et al., 2010). Such high-velocity winds have been known to affect the seismic data (Johnson et al., 2019; Lott et al., 2017) because the kinetic energy in the wind is converted to mechanical energy on reaching the instrument enclosure, thus contributing noise to the seismic record (Walker and Hedlin, 2010). This wind-induced seismic noise depends on wind velocity (Johnson et al., 2019). Understanding the effect of wind-induced seismic noise is crucial in monitoring icequakes and understanding its potential to obscure icequakes.
The PEAS and its permanent seismometer (ELIS) are relatively well protected from the strongest katabatic winds from the Antarctic plateau by a mountain range. ELIS is located on the same flat granite ridge as the Princess Elisabeth Station and inside a shelter 350 m from the base. Compared to ELIS, the temporary seismometers installed in 2014 (Fig. 1) are less protected and more prone to wind noise. If ELIS sees an increase in seismic amplitude related to wind, the temporary seismic stations should therefore have an increased wind-induced ground motion. The base is powered by solar panels and nine Proven Energy 6 kW wind turbines (WTs) (Belspo, 2007). Each consists of a 9 m high tower with a three-blade rotor that adapts the angle of the blades with the wind speed to generate the maximum amount of power from low-velocity winds and reduce the amount from high-speed winds. When the wind speed is low, the angle of the three blades is reduced up to 5∘, and when the wind speed is the highest, the angle can increase up to 45∘, which reduces by half the 5.5 m rotor diameter and the resulting rotational speed. The effect of wind turbines on seismic records has also been studied in the past and often results in noise increases in discrete frequency bands related to their shape, structure, height, the number of blades, and rotational speed (Mucciarelli et al., 2005; Stammler and Ceranna, 2016; Withers et al., 1996). Wind-induced seismic energy has a wide range of frequencies (1–60 Hz and below 0.05 Hz), and its amplitude decreases rapidly with depth (Withers et al., 1996). Wind-induced seismic noise characteristic frequencies and amplitudes also depend on wind interaction with man-made constructions (Hillers et al., 2015; Johnson et al., 2019; McNamara, 2004; Stammler and Ceranna, 2016). In Antarctica, given the lack of trees, the seismic noise induced by the wind should likely originate from the interaction with the base's buildings, wind turbines, and topography.
In this paper, we present an analysis of the influence of the wind velocity on the seismic data from the ELIS seismometer at the Princess Elisabeth Station. As reported in Johnson et al. (2019) and Lepore et al. (2016), by sorting seismic data for different wind speeds, we quantify the relationship between wind energy and seismic ground motions. We present a model of the noise baseline when there is no wind and its increase for each increment of wind speed in all frequency bands. Using this model, we compute a model of the wind-induced seismic noise for ELIS. We applied a similar model to each station of the temporary seismic network (ANT). Finally, we used these models to evaluate the impact of the wind noise on the detectability of icequakes.
Our dataset includes seismic and wind velocity measurements at the PEAS base and seismic signals recorded between January and April 2014 by five temporary seismic stations, the ANT network, installed in the Sør Rondane Mountains (Fig. 1). The seismic data at the PEAS come from the broadband seismic station (ELIS) installed in February 2012 (Camelbeeck et al., 2019; Lombardi et al., 2019). This station worked irregularly up to the end of 2016 due to difficulties providing continuous power supply during the austral winter, but recordings are continuous for the years 2017, 2018, 2019, and 2020. The data collected by the ANT stations concern the period from January to April 2014. ELIS, as well as the other temporary stations except for ANT4, uses Trillium 120P 120 s seismometers that sample at 100 Hz, giving a recording bandwidth from 0.008 to 50 Hz, allowing us to record small local seismic events, as well as the teleseismic earthquakes (Camelbeeck et al., 2019). ANT4 is a Streckeisen STS-2 gen3 120 s seismometer (see Table 1).
The wind data come from an automated weather station (AWS) designed by the Institute for Marine and Atmospheric Research, Utrecht University (UU/IMAU) (van den Broeke, 2004), and is provided by the AEROCLOUD project (http://ees.kuleuven.be/hydrant/aerocloud/, last access: 6 October 2021.) (Gorodetskaya et al., 2010). The AWS is installed 300 m from the Princess Elisabeth Station, close to the ELIS seismometer site (see Fig. 1 and Table 1). It has been working since February 2009 and was replaced by a new AWS in December 2015, which is still in operation. The AWS is designed to work for long periods without being serviced and offers the opportunity to measure meteorological variables in remote areas and harsh weather conditions. These stations register wind speed, direction, temperature, humidity, and atmospheric pressure at 2.0 m above the ground surface, averaged over an hour window. The AWS records wind speeds from 0 to 60 m s−1 (±0.3 m s−1) and 0 to 360∘ direction (). We use the seismic data from the ELIS station for the period 1 January–31 December 2017 to extract hourly power spectral density (PSD), which describes the seismic power in the signal as a function of frequency. Probabilistic PSD represents a statistical distribution of the PSDs (McNamara, 2004). PSDs are computed using the ObsPy package (Beyreuther et al., 2010) based on the McNamara method (McNamara, 2004) which estimates the PSD via a finite-range fast Fourier transform (FFT) of the original data. The ground motion time series are corrected for the instrument response and calculated to PSDs (in dB m2 s2/,Hz−1) to allow for the comparison with the new high and low Peterson noise models (Peterson, 1993). We apply the same processing to compute the hourly PSDs for the five stations of the ANT network. We compute PSDs for every hour segment of the entire year to match the time step of the wind data of the AWS station. The PSD is calculated with a low smoothing of th of an octave at each central frequency or period. This is important to allow us to identify characteristics buried in the noise such as weak narrow seismic peaks. Due to the sampling rate of the ANT network (100 Hz), we limited our computations to 50 Hz: the Nyquist frequency.
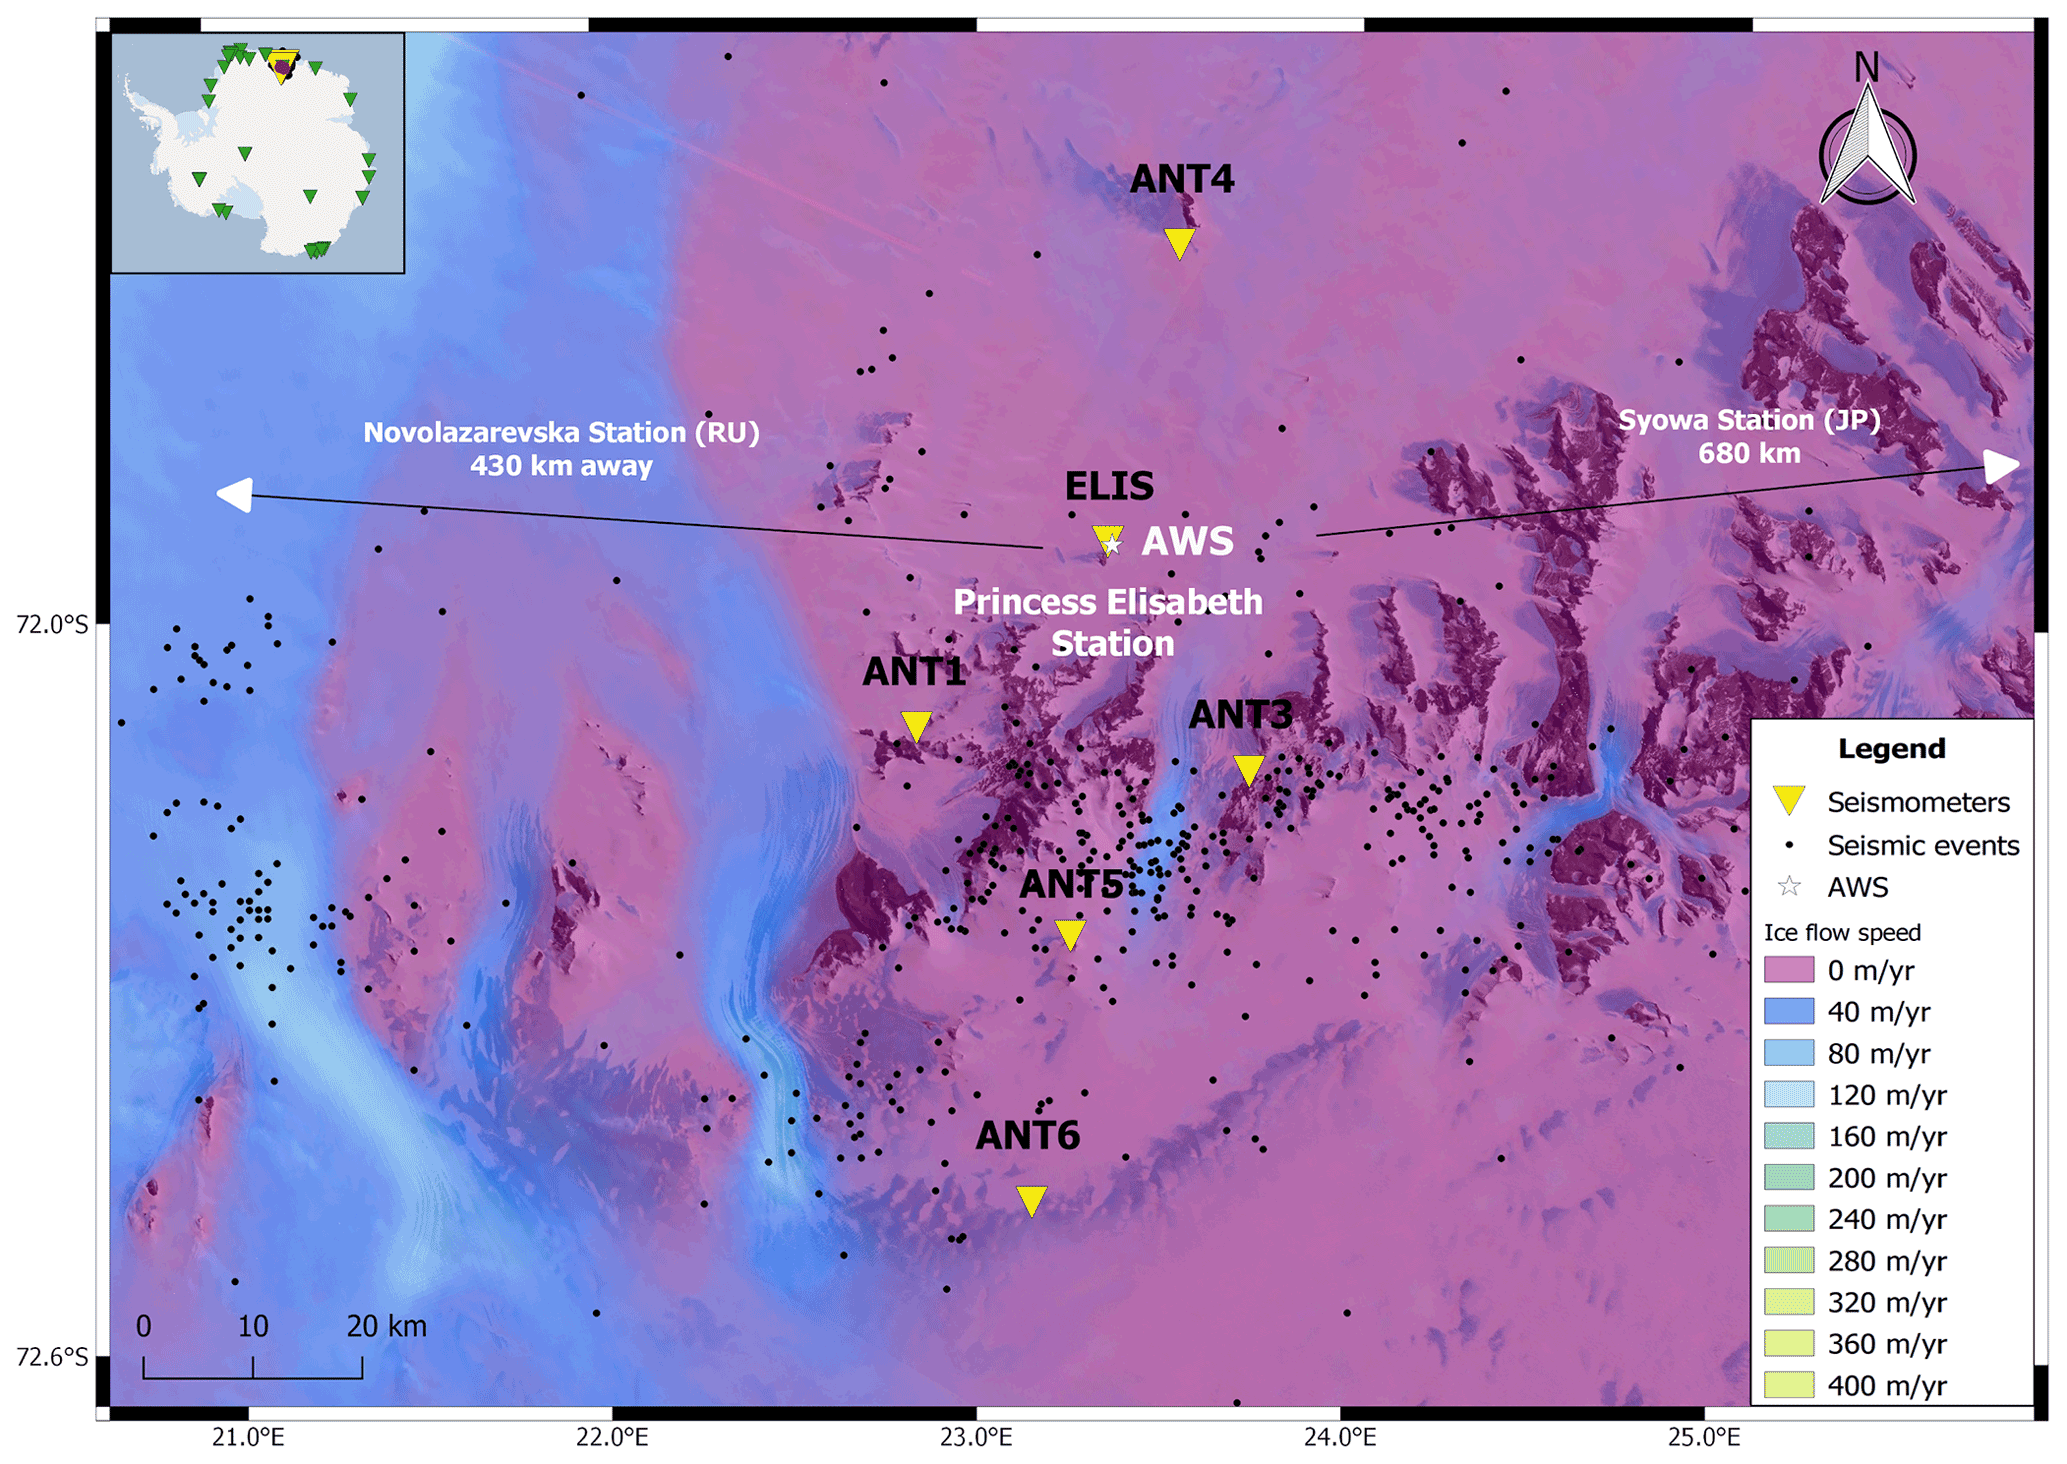
Figure 1Network of instruments used in this study: one permanent (ELIS) and five temporary (ANT-) seismic stations. Other seismic stations in Antarctica reported by the International Seismograph Station Registry (http://www.isc.ac.uk/registries, last access: 6 October 2021.) are shown on the context map (green triangles), and the two closest from Princess Elisabeth Station are pointed towards with a white arrow: Novolazarevskaya (RU) and Syowa (JP). The cryoseismic activity (Camelbeeck et al., 2019) registered by a minimum of four stations during the working time of the ANT network (January–May 2014) is shown by the small dark dots (ice flow speed from Mouginot et al., 2019).
Table 1Belgian Antarctica seismometer information and automatic weather station (AWS) information from the AEROCLOUD project.

3.1 Wind-induced noise model for ELIS
To quantify the link between wind velocity and seismic noise at the PEAS base, we computed hourly PSDs of the ELIS vertical seismometer for the whole year 2017 extracting the 5th percentile amplitude for every 0.25 m s−1 wide bin of wind speed between 0 and 25 m s−1 (Fig. 2). The wind speed used in this study is the 1 h average of the maximum wind speed recorded by the AWS every 10 min. The 5th percentile is preferred over the average to define base noise levels for each wind speed step without taking outliers into account. The wind speed steps and their base noise amplitude exhibit (Fig. 2) an increase in noise amplitude at all periods, but the effect is stronger below 2 s and above 10 s.
The seismic noise levels increase with the wind velocity and exhibit two different behaviours for wind velocity greater and smaller than 6 m s−1. The increase in seismic noise is moderate for wind velocity from 0 to 6 m s−1 and larger above 6 m s−1. At 0.1 s (10 Hz) there is a 42 dB difference between 0 and 25 m s−1 which corresponds to a ground acceleration increase of 100 times. The wind-noise effect is higher on the horizontal components than on the vertical component of the seismometer. This has already been observed and is due to the direct interaction of the wind travelling horizontally inducing tilt noise on the seismometer (Mucciarelli et al., 2005). To create the synthetic noise model, we need to quantify seismic noise changes at each frequency with respect to the wind speed amplitude. For each period band, two linear relationships are determined between 0 and 6 m s−1 and above 6 m s−1 (slopes al1 and al2 in Fig. 3a), explained by Eq. (1). Although the two linear regressions are computed independently, they do predict very similar values for 6 m s−1 at all periods (difference lower than 0.01 dB), making the bilinear relationship continuous.
Equation (1) describes the bilinear relationship f(x) predicting the amplitude (in dB m2 s−4 Hz−1) using x, the wind speed (in m s−1), as well as the slope and intercept parameters al1, al2 and bl1, bl2 obtained from the linear regressions.
The data used for the weighted regression are the 5th percentile of wind speeds binned by 0.25 m s−1 with a minimum of 10 observations per bin. The weights are defined as the inverse of the standard deviation within each bin. For example, Fig. 3b shows the two linear regressions at the 0.26 s period (dashed vertical line in Fig. 3a): the wind-induced noise increases by approximately 2 dB from 0 to 6 m s−1, and after 6 dB it increases by 1.5 dB m−1 s−1. The lower number of occurrences of wind speeds above 10 m s−1 could lead to instability of the regression, but between 6 and 10 m s−1 it is robust and fits the observations at higher wind speed. The linear regressions are computed for every frequency and therefore describe the behaviour of the seismic noise induced by the wind at ELIS.
Once the linear parameters are determined for each period of the spectrum, using Eq. (1), we can run the model for any theoretical wind speed to obtain a synthetic PSD spectrum. For different wind speeds, we generate a synthetic frequency and wind-speed-dependent noise model (Fig. 4a). Transforming the synthetic PSDs to ground velocity amplitude requires the integration to PSDs of velocity and the application of Parseval's theorem that links the power spectrum and the RMS (root mean square) of a signal. The RMS velocity calculated in the 1–50 Hz frequency band (Fig. 4b), i.e. the band where most cryoseismicity is expected to occur, shows an exponential increase from 0.2 to 2.8 µm s−1 between 0 and 25 m s−1 wind speed. Figure 4b also shows the frequency band (8–50 Hz) and the RMS amplitudes (smaller than 0.3 µm s−1) of the icequake signals studied by Lombardi et al. (2019). This illustrates that, based on our model, Lombardi et al. (2019) are vulnerable to missing seismic events when the wind speed exceeds 10 m s−1.
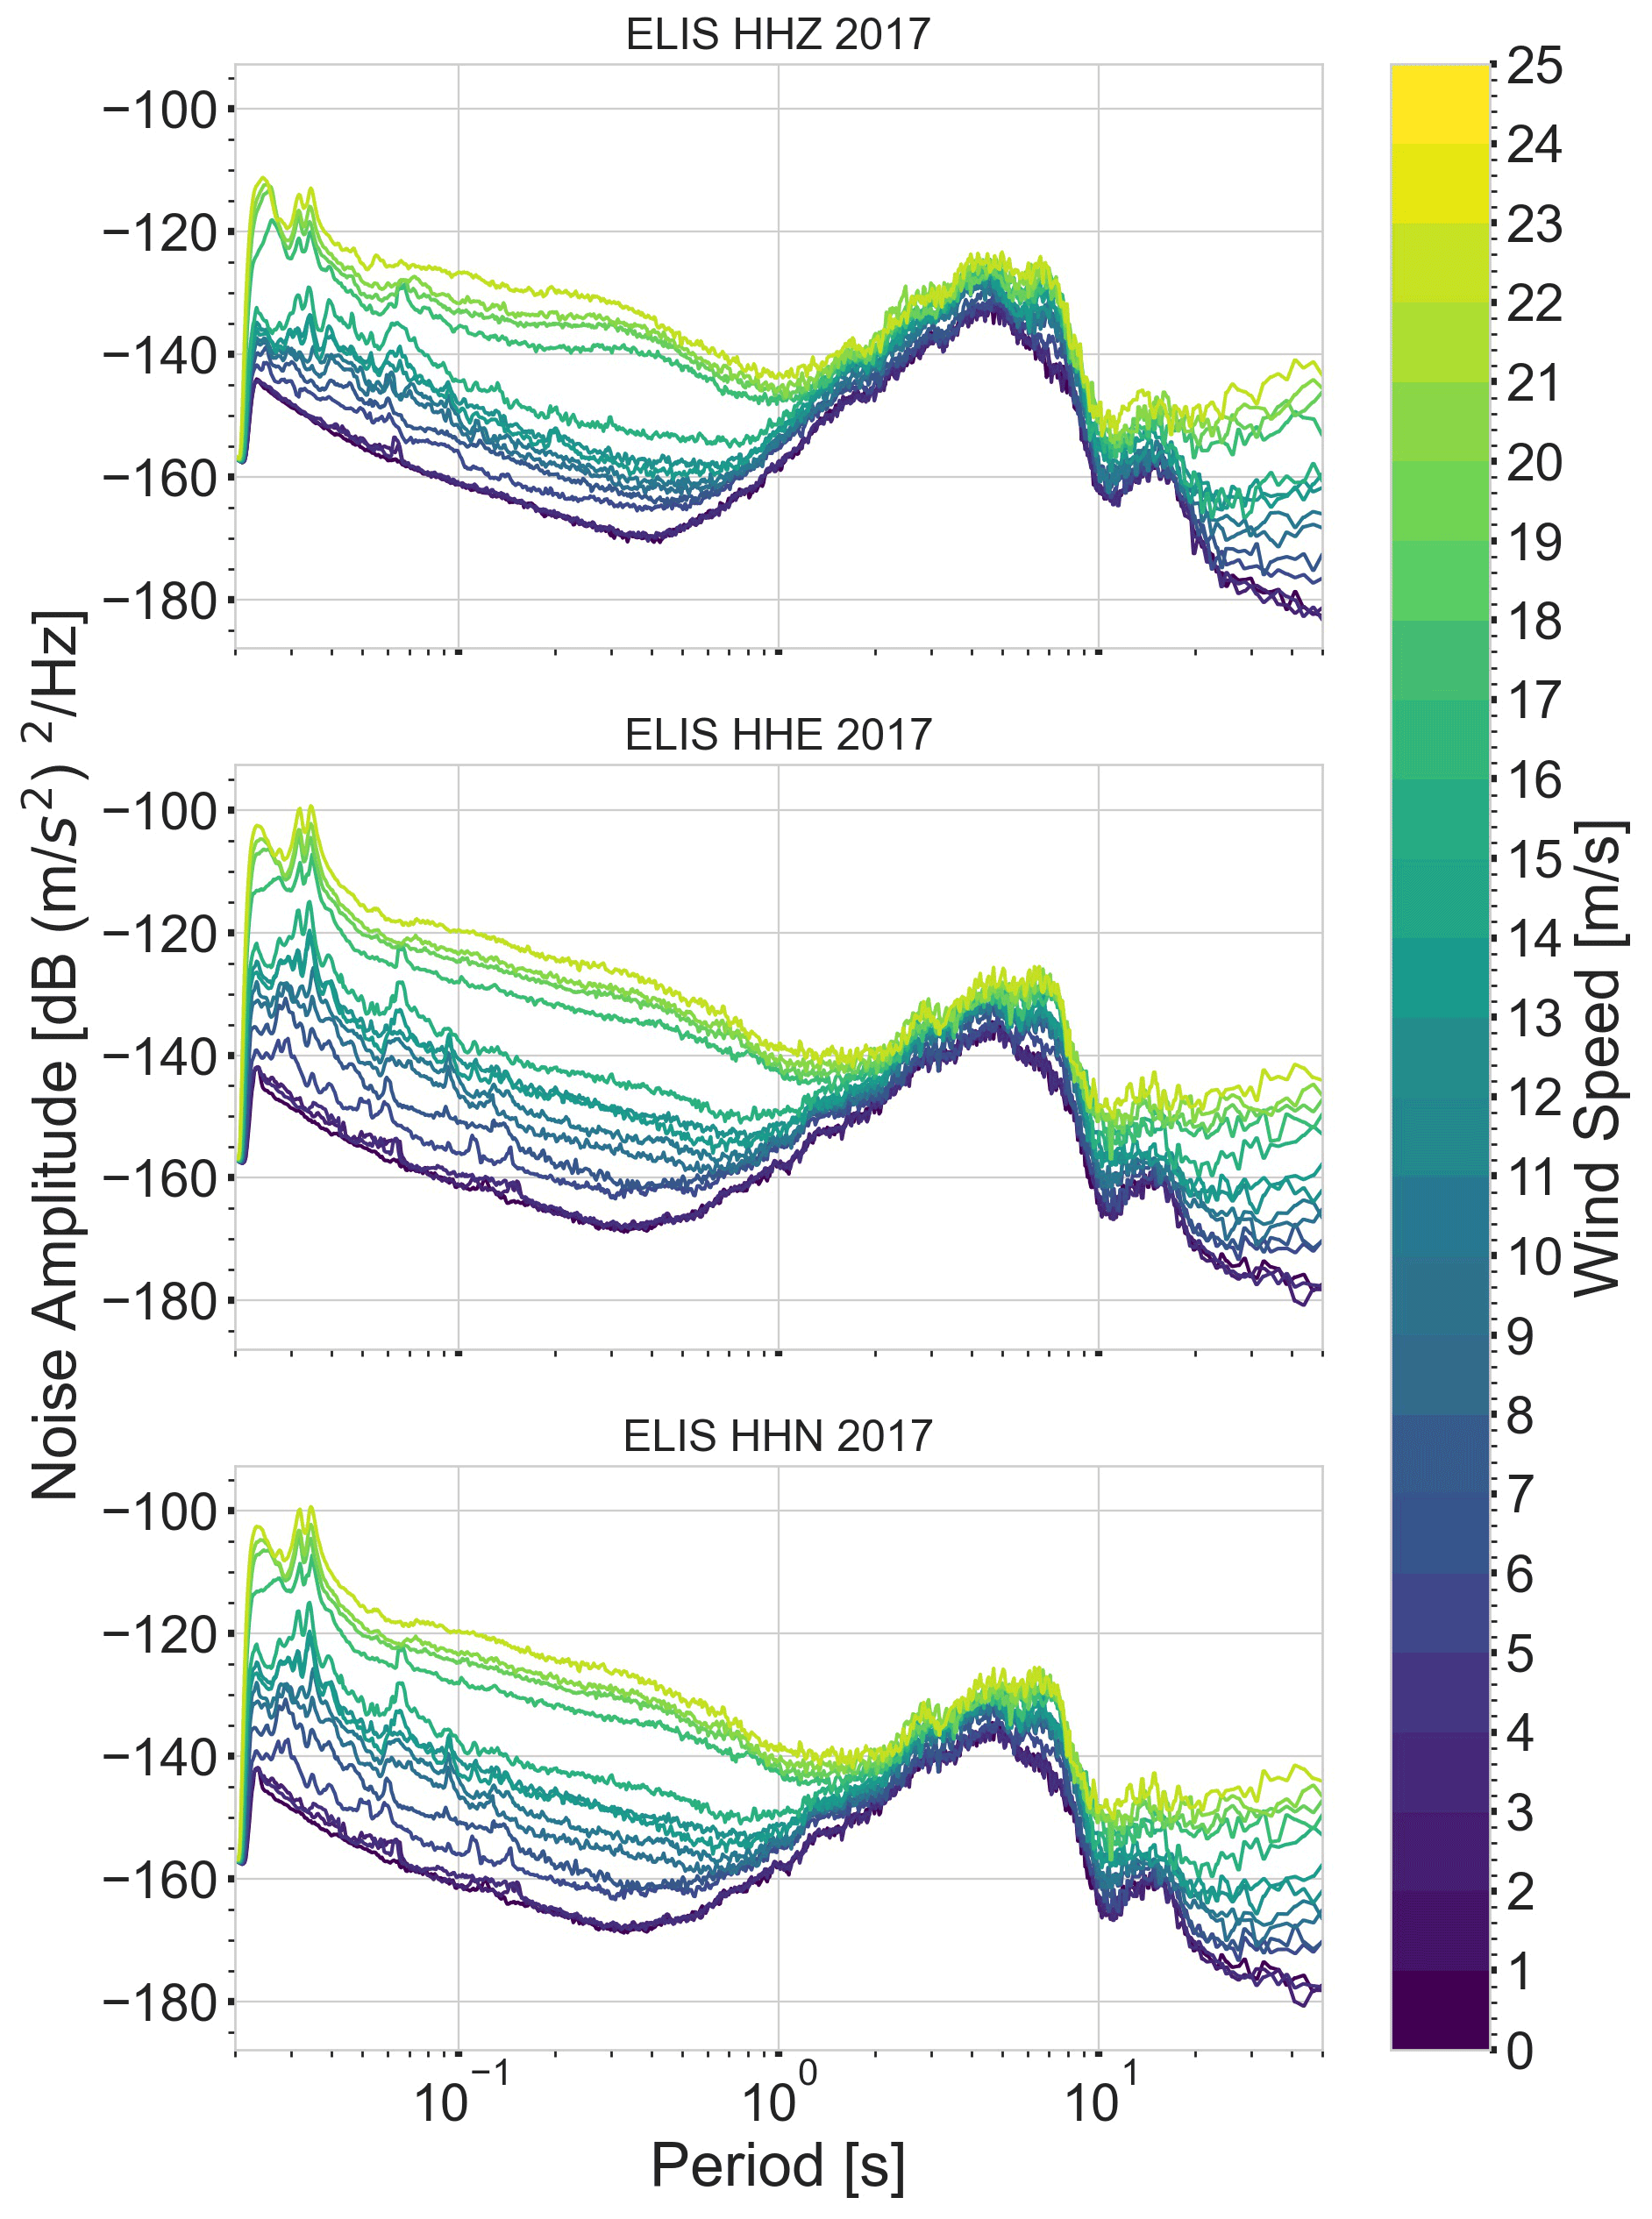
Figure 2The 2017 ELIS PSDs computed for 0–25 m s−1 wind speed. HHZ, HHE, and HHN are the vertical, east–west, and north–south channels, respectively.
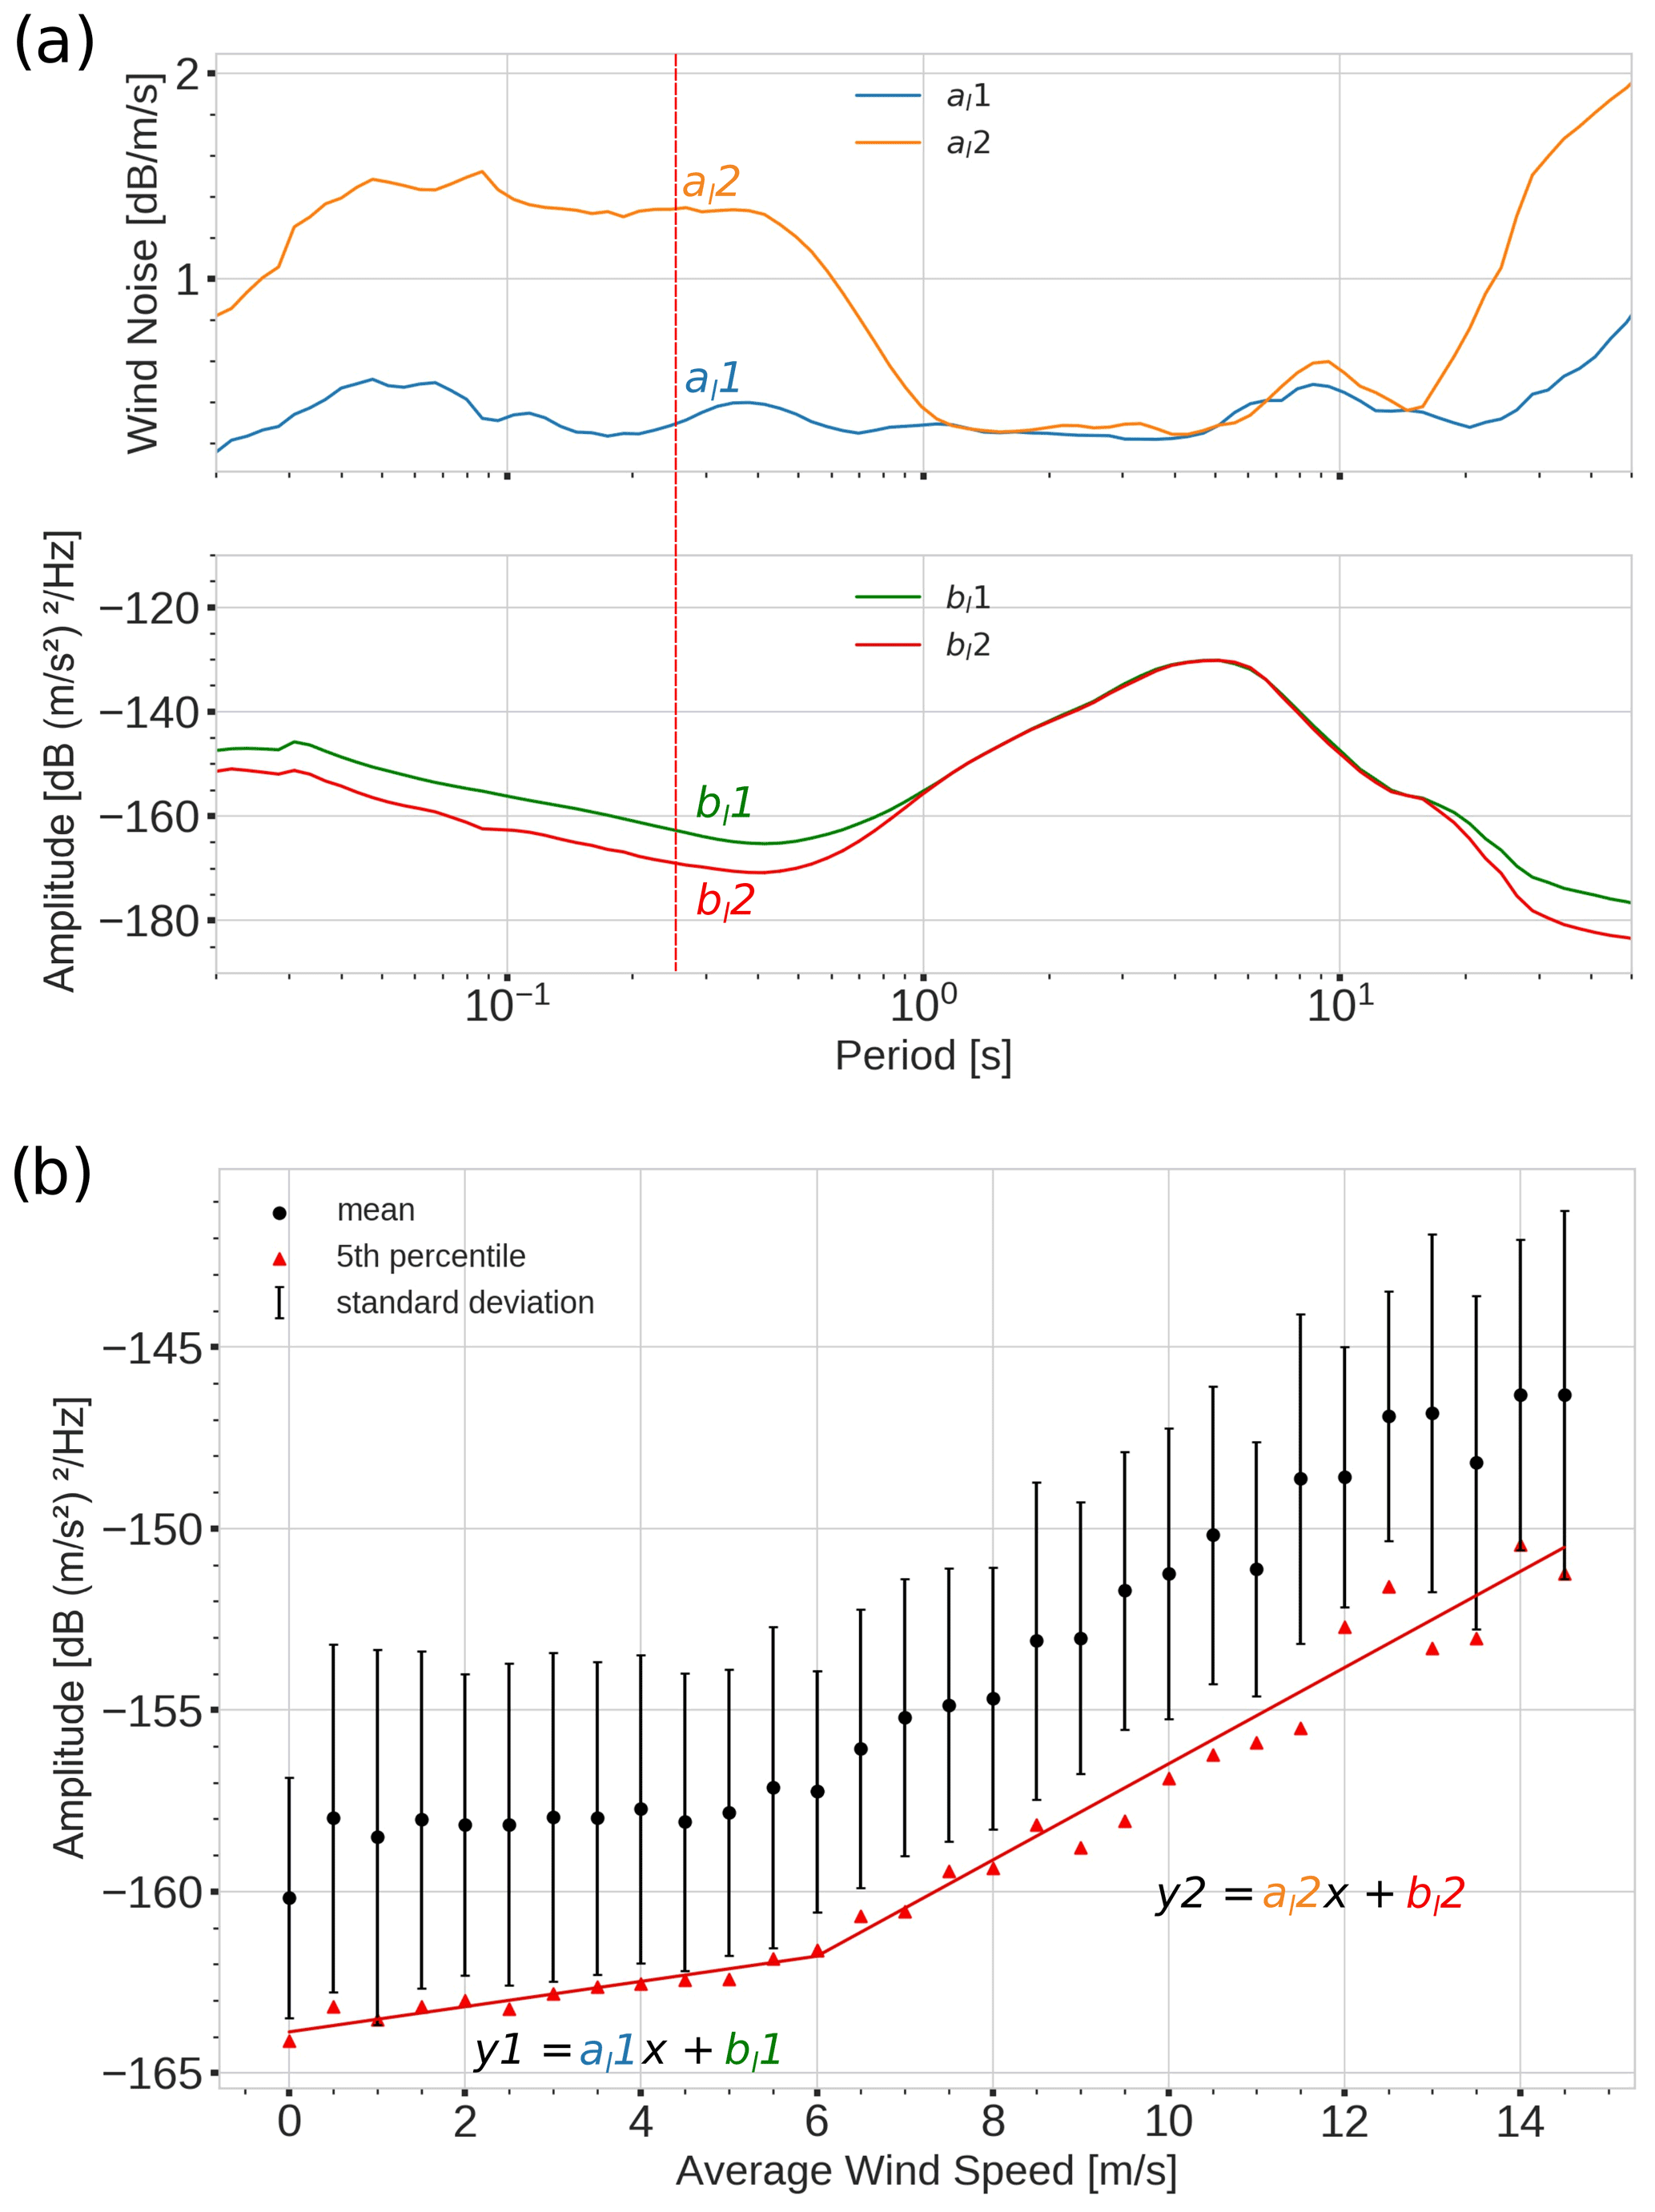
Figure 3(a) Wind-induced noise model describing the parameters of two linear functions for every period of ELIS HHZ in 2017: the first panel represents the “a” parameter in the linear regression , and the second shows the “b” parameter. Those two different linear relation parameters are until 6 m s−1 (all1) and after 6 m s−1 (all2). (b) Behaviour of the 5th percentile (red) and mean (black) noise amplitude vs. the average wind speed (m s−1) for the 0.26 s period (red dotted line in Fig. 3a). There are two different red linear functions: before 6 m s−1 (y1) and after 6 m s−1 (y2).
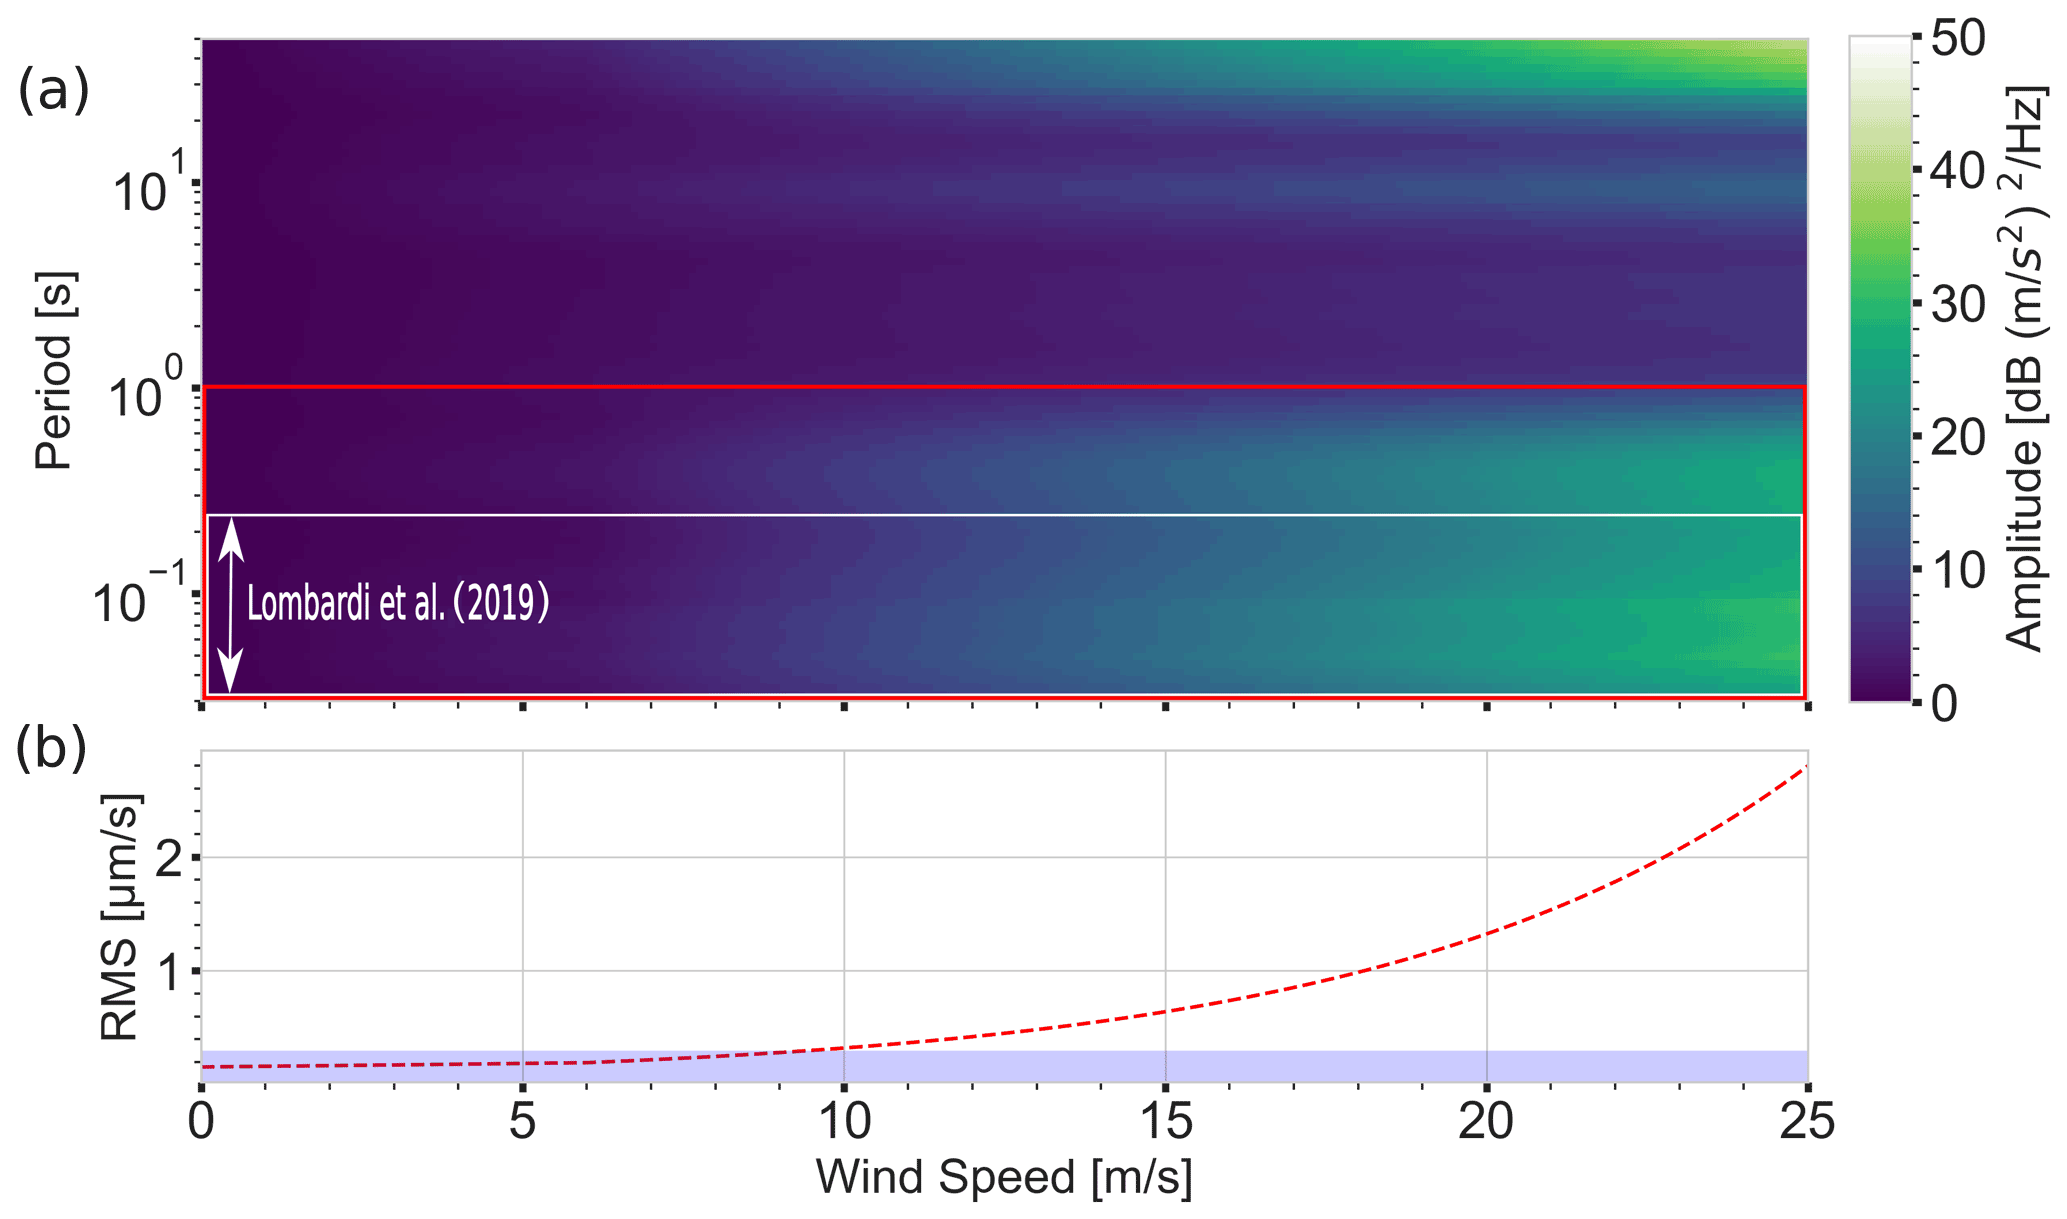
Figure 4(a) Synthetic frequency and wind-speed-dependent noise model representing wind-induced noise increase; in white is the frequency range of the thermally induced icequakes observed by Lombardi et al. (2019). (b) The 1–50 Hz RMS ground speed at ELIS HHZ extracted from the red rectangle in panel (a) and in light blue the amplitude range of these icequakes.
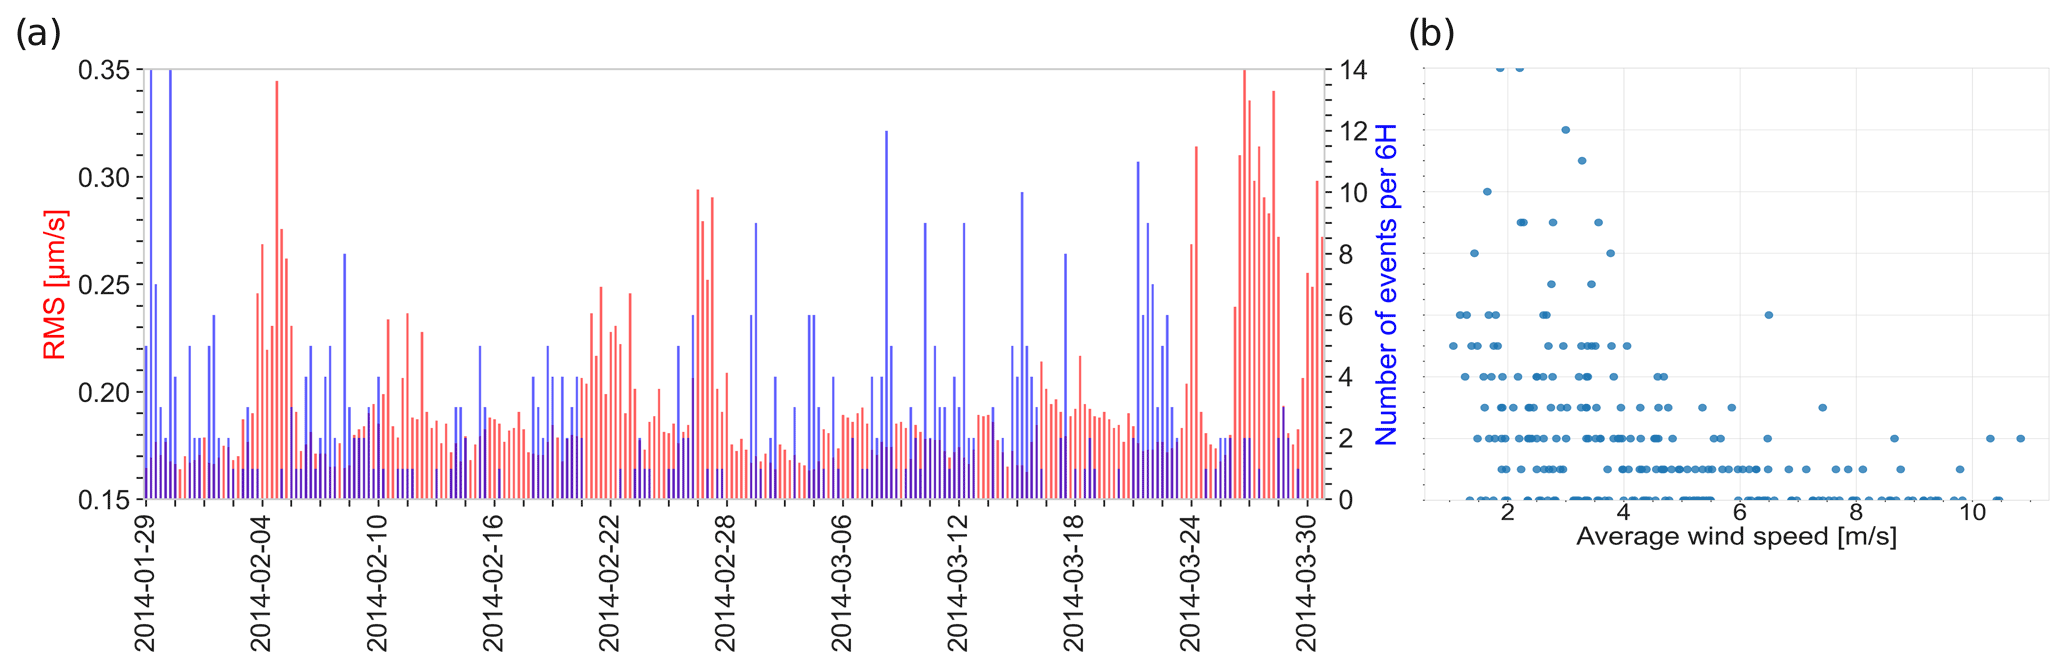
Figure 5(a) RMS per 6 h calculated from the average wind speed and the noise model seen at ELIS vs. the icequake rate per 6 h (seismic rate) by Camelbeeck et al. (2019). (b) Icequake rate per 6 h vs. average wind speed (m s−1).
3.2 Seismic noise for the ANT network
We used our model to evaluate the completeness of the catalogue of icequakes identified between January and April 2014 by the ANT temporary seismic network, including the ELIS station. The icequake rate detected per 6 h, located by Camelbeeck et al. (2019), shows an inverse correlation with the seismic noise level deduced by our model (RMS) from the wind speed measured at PEAS (Fig. 5). This RMS is calculated from the mean wind speed registered by the AWS averaged per 6 h using our model (shown in Fig. 4b). This inverse correlation suggests that the variation in the icequake rate would be directly related to seismic noise conditions induced by the wind. For example, from 3 to 4 February 2014 (A), the RMS increases from 0.17 to 0.35 µm s−1 at the maximum peak. Over the period presented in Fig. 5 (29 January–30 March 2014), 472 events were detected by Lombardi et al. (2019). If these events were equally distributed over the time period, ∼7.9 events could be detected each day, but the number of events found over this period was not that. For example, on 3 February five events were detected, whereas on 4 February not a single event was recorded, which could be a result of the drastic RMS increase.
ELIS is located in an area where the ice sheet moves very slowly. Therefore, the ice sheet movements did not contribute greatly to the recorded seismic noise level at the ELIS seismic station. Using the 2014 data from the AWS, we could compute a synthetic noise amplitude for the wind-generated noise during the deployment of the temporary ANT network. In the case that the wind field and its effects on ELIS would be identical at the other seismometers, we could obtain “clean” spectrograms by withdrawing the frequency-dependent noise increase due to wind. Because of the large dimension and different geographical contexts of each station, this assumption might not necessarily hold. Figure 6a–f show the spectrograms for the six stations, which highlight the contribution of the cryoseismic activity of the East Antarctic ice sheet and potentially wind-generated noise in the seismic data of each station. Figure 6g–l represent the RMS velocity of the ELIS station. For comparison, the average wind speed and temperature recorded at ELIS (Fig. 6h–i) are shown.
The periods when the RMS velocity of the stations shows significant cryoseismic activity are indicated by blue arrows labelled A1 to A7 (Fig. 6l). Some stations, and particularly ANT3 and ANT6, do also exhibit a correlation between the increase in wind speed and their recorded noise amplitude.
Between 8 and 20 January (A1), there is a small co-increase in wind speed and noise amplitude, especially at ANT3. The same thing happens during the 8–15 February (A2) and 20–26 February (A3) intervals. The 1–7 March period (A4) shows noise amplitude peaks for all stations except for ELIS, ANT1, and ANT4. The 13–15 March period (A5) starts with strong activity at ANT3 and then an increase at the other stations, including strong peaks at ANT6. The 18–20 March period (A6) has more energy at ANT3 than the other stations. The 23–27 February period (A7) is again dominated by strong energy at ANT3, but other stations peak during that period too (ANT6 and ANT1 particularly). The activity of ANT3 seems, in general, to be higher than at the other stations between 1–28 February and after 15 March (end of A5) until the rest of the deployment.
In addition to the activity spanning over several days, the six stations had a strong diurnal activity which was shown to be linked to temperature variation that lead to thermally induced icequakes (Lombardi et al., 2019). Its intensity is larger at ANT6 throughout the deployment period. At all stations but especially at ELIS and ANT1, the diurnal effect seems to lessen after 8 March 2014 (A4).
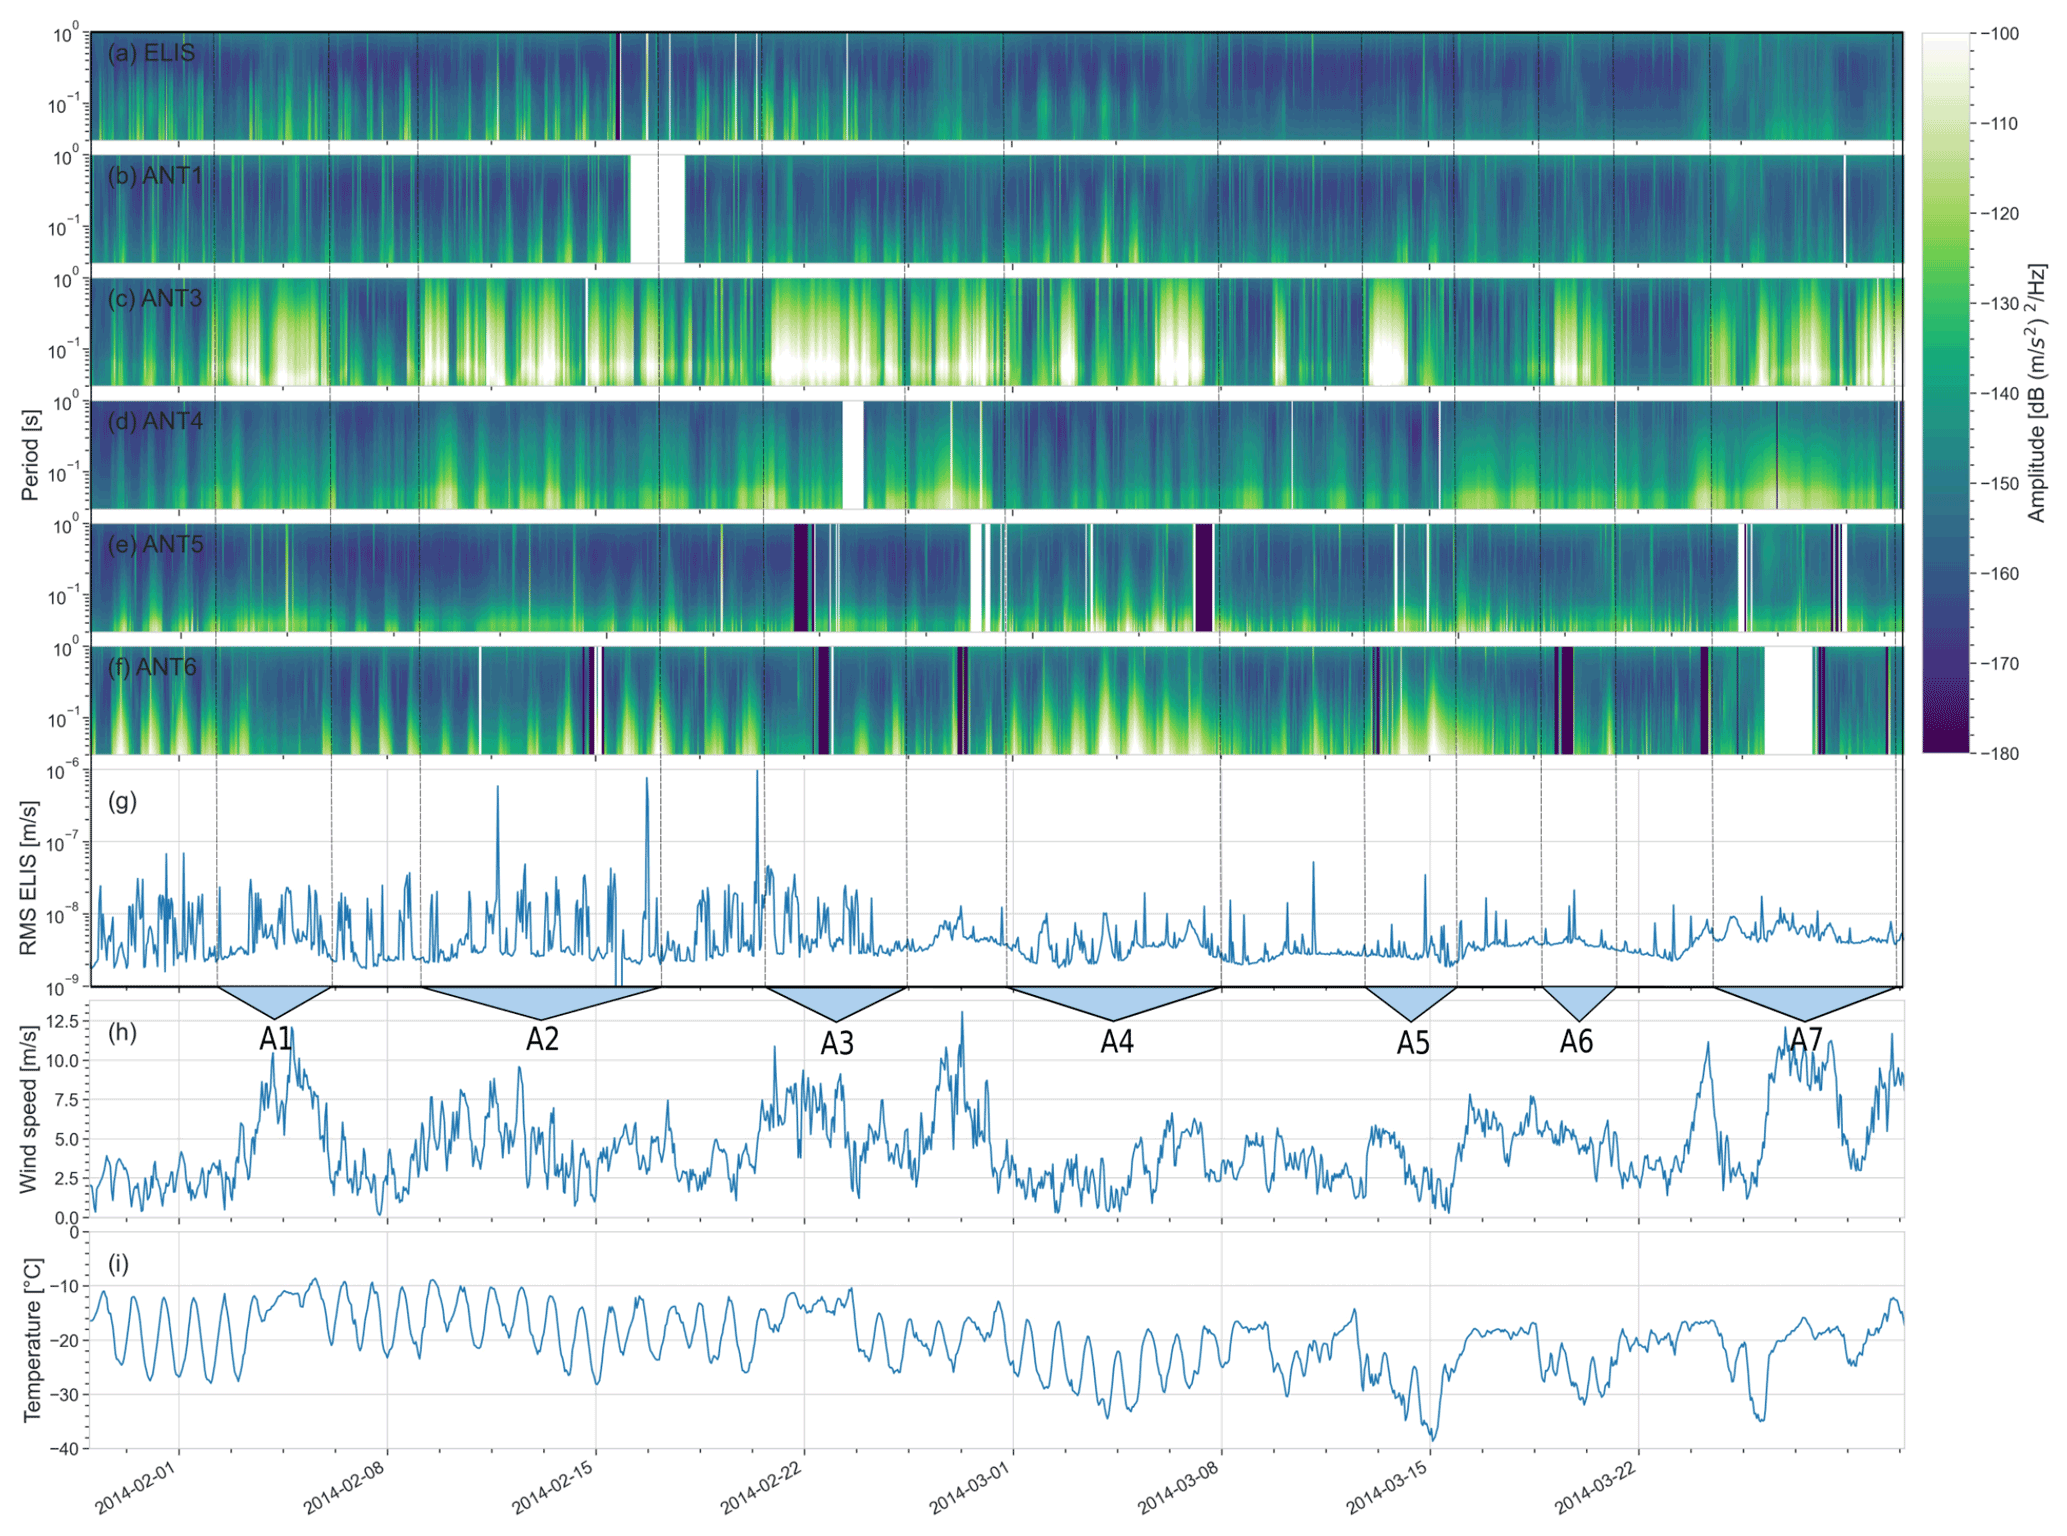
Figure 6Belgian Antarctica network spectrograms (1–50 Hz) without wind noise for the 29 January–30 March 2014 period with the RMS for ELIS and the average wind speed (m s−1) and temperature (∘C) for the same period from the AWS station at ELIS. A1–A7 represent periods of increased amplitude.
The origin of the diurnal activity could come from thermally induced icequakes resulting from diurnal temperature differences as observed and studied at ELIS (Lombardi et al., 2019; Winter et al., 2021). At all stations but especially at ANT5 and ANT6, there is a greater diurnal activity during A4 and A5, which correlates from a sudden drop of temperature and a greater temperature difference of 10 ∘C between the daytime and nighttime (Fig. 6). This also suggests that part of the greater activity seen at ANT3 and ANT4 is most likely caused by a greater cryoseismic activity induced by the temperature change between the daytime and nighttime. During A6 and A7, the same effect is observed, and the activity greatly increased at ANT3, together with temperature deltas of about 10 ∘C. The stronger diurnal activity at ANT6 can be explained by its setting: it is placed on blue ice and is, therefore, better coupled to register crevassing and thermally induced icequakes than the other stations on rock (Trnkoczy et al., 2012). This diurnal activity at ANT5 has a higher frequency that the other stations, and most of its energy release is above 30 Hz.
The ANT3 station has a much higher amplitude of seismic noise than any other station from the network. The activity at ANT3 seems to correlate with the wind for at least the A1, A2, A3, and A7 periods. This indicates that to a certain extent the wind field at this station could be the same as at ELIS but that the wind strength and/or its effect on the seismic noise is greater. Nevertheless, certain peaks have a high amplitude that seems hard to link to the wind activity, at least not the same wind as the one measured at ELIS. For example, using our model, to reach the peaks at 1.0 µm s−1 seen at ANT3 in A2, A3, and A4, the local wind speed needs to reach at least 17.5 m s−1, which was not observed at ELIS during the period when the ANT network was deployed. The maximum wind speed during that period was 14 m s−1. Another cause of the difference in energy could be linked to the insulation or coupling difference of the seismometer at the different stations. In the case of ANT3, part of the explanation for site-specific winds could come from its location close to an outlet glacier, which could channelize the winds originating from the plateau to the south.
The continuously higher energy at ANT4 follows the same general long-term trends as the wind speed. This could be caused either by slightly stronger local winds or a slightly steeper relationship between wind and noise caused by coupling or installation settings. Stronger continuous cryoseismic activity could also explain the observations; however, according to Lombardi et al. (2019) we would expect to see more diurnal variation if that activity is thermally induced. From the stations in the network, ANT1, ANT3, and ANT5 are the closest to the two most seismogenic zones, i.e. the collision zone between the glaciers and the mountains, as well as the channelized glaciers with greater ice flow speed (Fig. 1).
In agreement with Lott et al. (2017) and their wind-induced noise study in the Dead Sea Valley, our results at PEAS show similar traits such as a linear increase in PSD in decibels (dB) with wind speed that affects all observed frequencies (1–50 Hz). At PEAS and in the Dead Sea Valley, wind speeds as low as 5 m s−1 affect the detection of small seismic events due to increased noise levels by about 5 dB. The effect of wind speed is negligible in the microseism band at frequencies between 0.1 and 1 Hz (Fig. 3a), as also observed in the Dead Sea Valley; it is therefore likely that microseism monitoring is not adversely impacted by this noise, which is encouraging for microseism noise-based imaging or monitoring of the area.
Near the Princess Elisabeth Station, we observe wind-induced seismic noise that in some cases prevents the detection of icequakes. The detection of icequakes can be adversely impacted by wind speed as low as 5 m s−1 as they will be hidden in the wind-induced noise. When these winds reach their highest speeds of up to 25 m s−1, the seismometer registers an increase of 15 times the ground velocity of a stand-still moment (0.2 to 3 µm s−1), making most of the small icequakes undetectable. Understanding the effect of wind-induced seismic noise is therefore crucial in monitoring icequakes, as well as understanding missing icequakes in the data. To mitigate wind-induced noise and improve the quality and detectability of icequakes, we suggest, whenever possible, preferentially installing seismometers into boreholes far from structures that could be affected by wind and in a wind-protected area. In all cases, we recommend installing a meteorological station next to each instrument site to obtain local measurements of the fields.
Using the data from the permanent seismic station ELIS, we provide a synthetic model that simulates the ground motion spectrum for different wind speeds. For half of the period during which the temporary ANT network was deployed, the ANT3 seismometer exhibits greater amplitude than the other stations which can only be partially explained by greater local wind speeds. We found that seismic noise levels at different stations is mostly independent of the wind speed and probably related to local icequake activity.
As observed elsewhere, we suggest that the diurnal changes in energy observed are linked to cycles of cryoseismic activity induced by the large diurnal temperature delta. If the icequakes were very shallow events due to thermal expansion of ice, then those are maybe not relevant for, for example, basal processes, but they nonetheless inform us about a diurnal ice process. The longer-lasting energy releases, on the other hand, could have different causes related or not to wind. They could originate either from different wind fields, wind speeds, or couplings or from an increased cryoseismic activity occurring in the vicinity of the station, independent of the diurnal and thermal effects, for example, crevasses or basal stick-slip events. The diurnal seismic energy at a higher frequency at ANT5 could result from different source mechanisms, with smaller, shorter icequakes occurring in the direct vicinity of the station. This could be confirmed by comparing the icequake signatures at the different stations in future work.
The PSDs and CSVs were calculated using the latest development version of MSNoise (https://doi.org/10.1785/0220130073, Lecocq et al., 2014) available from https://github.com/ROBelgium/MSNoise (last access: 12 October 2021). The PSDs and CSVs were then processed by the codes of Frankinet and Lecocq (2021) (https://doi.org/10.5281/zenodo.5571547).
The seismic data from the permanent ELIS station, as well as from the ANT array, should be made available via the ORFEUS data centre soon, but in the meantime, access can be given directly from the Royal Observatory of Belgium (ROB) FDSN web services or FTP, upon direct request to Thomas Lecocq.
BF and TL designed the research. BF designed the model, analysed the data, carried out the implementation, and performed the calculations. BF and TL wrote the manuscript with input from TC.
The contact author has declared that neither they nor their co-authors have any competing interests.
Publisher’s note: Copernicus Publications remains neutral with regard to jurisdictional claims in published maps and institutional affiliations.
We acknowledge the AEROCLOUD project (https://ees.kuleuven.be/hydrant/aerocloud/, last access: 6 October 2021.) for providing the wind data from the automated weather station (AWS) located at the Princess Elisabeth Station in Antarctica. We acknowledge Denis Lombardi for installing the ANT network and Giovanni Rapagnani for maintaining and providing the data and metadata at the ROB.
We also acknowledge the ETH-Zurich that owns the ANT4 Streckeisen STS-2 gen3 120 s seismometer.
We thank QGIS and the Quantarctica module (Matsuoka et al., 2013) with which we drew the Fig. 1 map.
This research has been supported by the Royal Observatory of Belgium (grant no. 3FullCost). This research has benefited from the financial support of the Belgian Science Policy (BELSPO) contract nos. EA/33/2A and EA/33/2B (GIANT–LISSA Project) and BR/132/PI/SMEAIS (SMEAIS Project).
This paper was edited by Adam Booth and reviewed by two anonymous referees.
Barruol, G., Cordier, E., Bascou, J., Fontaine, F. R., Legrésy, B., and Lescarmontier, L.: Tide-induced microseismicity in the Mertz glacier grounding area, East Antarctica: Mertz Glacier Tide-Modulated Icequakes, Geophys. Res. Lett., 40, 5412–5416, https://doi.org/10.1002/2013GL057814, 2013.
Belspo.: Construction and operation of the new Belgian Research Station, Dronning Maud Land, Antarctica: Final Comprehensive Environmental Evaluation Report (CEE), 135, Belgium, March 2007.
Beyreuther, M., Barsch, R., Krischer, L., Megies, T., Behr, Y., and Wassermann, J.: ObsPy: A Python Toolbox for Seismology, Seismol. Res. Lett., 81, 530–533, https://doi.org/10.1785/gssrl.81.3.530, 2010.
Bormann, P. and Wielandt, E.: Seismic Signals and Noise, New Manual of Seismological Observatory Practice 2, Potsdam, Deutsches GeoForschungszentrum GFZ; IASPEI, (NMSOP2), 62, 2013.
Callens, D., Thonnard, N., Lenaerts, J. T. M., Van Wessem, J. M., Van de Berg, W. J., Matsuoka, K., and Pattyn, F.: Mass balance of the Sør Rondane glacial system, East Antarctica, Ann. Glaciol., 56, 63–69, https://doi.org/10.3189/2015AoG70A010, 2015.
Camelbeeck, T., Lombardi, D., Collin, F., Rapagnani, G., Martin, H., and Lecocq, T.: Contribution of the seismic monitoring at the Belgian Princess Elisabeth base to East Antarctica ice sheet dynamics and global seismicity studies, Bulletin Des Séances-Académie Royale Des Sciences d'outre-Mer, 63, 163-179, https://doi.org/10.5281/zenodo.3693877, 2019.
Capra, A., Frezzotti, M., Mancini, F., Radicioni, F., and Vittuari, L.: GPS for ice sheet movement monitoring and grounding line detection, in: Geodesy on the Move, edited by: Forsberg, R., Feissel, M., and Dietrich, R., Vol. 119, pp. 486–491, Berlin, Heidelberg, Springer Berlin Heidelberg, https://doi.org/10.1007/978-3-642-72245-5_82, 1998.
Frankinet, B. and Lecocq, T.: ThomasLecocq/2021_Frankinet_AntNoise: Frankinet et al, 2021 – v1.0 (1.0), Zenodo [code], https://doi.org/10.5281/zenodo.5571547, 2021.
Gorodetskaya, I., van Lipzig, N., van den Broeke, M., Boot, W., Reijmeer, C., Mangold, A., Kneifel, S., Crewell, S., and Schween, J.: Meteorological and cloud measurements at the Princess Elisabeth Belgian Antarctic Research Station, Dronning Maud Land, paper presented at the 5th Antarctic Meteorological Observation, Modeling and Forecasting Workshop, Byrd Polar Res. Cent., Ohio State Univ., Columbus, Ohio, 12–14 July 2010.
Gossart, A., Helsen, S., Lenaerts, J. T. M., Broucke, S. V., van Lipzig, N. P. M., and Souverijns, N.: An Evaluation of Surface Climatology in State-of-the-Art Reanalyses over the Antarctic Ice Sheet, J. Climate, 32, 6899–6915, https://doi.org/10.1175/JCLI-D-19-0030.1, 2019a.
Gossart, A., Palm, S. P., Souverijns, N., Lenaerts, J. T. M., Gorodetskaya, I. V., Lhermitte, S., and van Lipzig, N. P. M.: Blowing snow in East Antarctica: comparison of ground-based and space-borne retrievals, The Cryosphere Discuss., https://doi.org/10.5194/tc-2019-25, 2019b.
Hammer, C., Ohrnberger, M., and Schlindwein, V.: Pattern of cryospheric seismic events observed at Ekström Ice Shelf, Antarctica, Geophys. Res. Lett., 42, 3936–3943, https://doi.org/10.1002/2015GL064029, 2015.
Herenz, P., Wex, H., Mangold, A., Laffineur, Q., Gorodetskaya, I. V., Fleming, Z. L., Panagi, M., and Stratmann, F.: CCN measurements at the Princess Elisabeth Antarctica research station during three austral summers, Atmos. Chem. Phys., 19, 275–294, https://doi.org/10.5194/acp-19-275-2019, 2019.
Hillers, G., Ben-Zion, Y., Campillo, M., and Zigone, D.: Seasonal variations of seismic velocities in the San Jacinto fault area observed with ambient seismic noise, Geophys. J. Int., 202, 920–932, https://doi.org/10.1093/gji/ggv151, 2015.
Johnson, C. W., Meng, H., Vernon, F., and Ben-Zion, Y.: Characteristics of Ground Motion Generated by Wind Interaction With Trees, Structures, and Other Surface Obstacles, J. Geophys. Res.-Sol. Ea., 124, 8519–8539, https://doi.org/10.1029/2018JB017151, 2019.
Kojima, S. and Shiraishi, K.: Note on the geology of the western part of the Soer Rondane Mountains, East Antarctica, Memoirs of National Institute of Polar Research, 43, 116–131, 1986.
Lecocq, T., Caudron, C., and Brenguier, F.: MSNoise, a Python Package for Monitoring Seismic Velocity Changes Using Ambient Seismic Noise, Seismol. Res. Lett., 85, 715–726, https://doi.org/10.1785/0220130073, 2014.
Lepore, S., Markowicz, K., and Grad, M.: Impact of wind on ambient noise recorded by seismic array in northern Poland, Geophys. J. Int., 205, 1406–1413, https://doi.org/10.1093/gji/ggw093, 2016.
Lipovsky, B. P. and Dunham, E. M.: Tremor during ice-stream stick slip, The Cryosphere, 10, 385–399, https://doi.org/10.5194/tc-10-385-2016, 2016.
Lombardi, D., Gorodetskaya, I., Barruol, G., and Camelbeeck, T.: Thermally induced icequakes detected on blue ice areas of the East Antarctic ice sheet, Ann. Glaciol., 60, 45–56, https://doi.org/10.1017/aog.2019.26, 2019.
Lott, F. F., Ritter, J. R. R., Al-Qaryouti, M., and Corsmeier, U.: On the Analysis of Wind-Induced Noise in Seismological Recordings: Approaches to Present Wind-Induced Noise as a Function of Wind Speed and Wind Direction, Pure Appl. Geophys., 174, 1453–1470, https://doi.org/10.1007/s00024-017-1477-2, 2017.
Matsuoka, K., Skoglund, A., Roth, G., Pomereu, J. de, Griffiths, H., Headland, R., Herried, B., Katsumata, K., Brocq, A. L., Licht, K., Morgan, F., Neff, P. D., Ritz, C., Scheinert, M., Tamura, T., Putte, A. V. de, Broeke, M. van den, Deschwanden, A. von, Deschamps-Berger, C., Liefferinge, B. V., Tronstad, S., and Melvær, Y.: Quantarctica, an integrated mapping environment for Antarctica, the Southern Ocean, and sub-Antarctic islands, 140, 105015, https://doi.org/10.1016/j.envsoft.2021.105015, 2021.
McNamara, D. E.: Ambient Noise Levels in the Continental United States, B. Seismol. Soc. Am, 94, 1517–1527, https://doi.org/10.1785/012003001, 2004.
Mohr, J. J., Reeh, N., and Madsen, S. N.: Three-dimensional glacial flow and surface elevation measured with radar interferometry, Nature, 391, 273–276, https://doi.org/10.1038/34635, 1998.
Mouginot, J., Rignot, E., and Scheuchl, B.: Continent-Wide, Interferometric SAR Phase, Mapping of Antarctic Ice Velocity, Geophys. Res. Lett., 46, 9710–9718, https://doi.org/10.1029/2019GL083826, 2019.
Mucciarelli, M., Gallipoli, M. R., Di Giacomo, D., Di Nota, F., and Nino, E.: The influence of wind on measurements of seismic noise, Geophys. J. Int., 161, 303–308, https://doi.org/10.1111/j.1365-246X.2004.02561.x, 2005.
Naderyan, V., Hickey, C. J., and Raspet, R.: Wind-induced ground motion, J. Geophys. Res.-Sol. Ea., 121, 917–930, https://doi.org/10.1002/2015JB012478, 2016.
Pattyn, F.: Antarctic subglacial conditions inferred from a hybrid ice sheet/ice stream model, Earth Planet. Sc. Lett., 295, 451–461, https://doi.org/10.1016/j.epsl.2010.04.025, 2010.
Pattyn, F., Decleir, H., and Huybrechts, P.: Glaciation of the central part of the Soer Rondane, Antarctica: glaciological evidence, in: Recent Progress in Antarctic Earth Science, edited by: Yoshida, Y. Kaminuma, K., and Shiraishi, K., Terrapub, ISBN 4887041098, Tokyo, 669–678, 1992.
Pattyn, F., Matsuoka, K., and Berte, J.: Glacio-meteorological conditions in the vicinity of the Belgian Princess Elisabeth Station, Antarctica, Antarct. Sci., 22, 79, https://doi.org/10.1017/S0954102009990344, 2010.
Peeters, K., Ertz, D., and Willems, A.: Culturable bacterial diversity at the Princess Elisabeth Station (Utsteinen, Sør Rondane Mountains, East Antarctica) harbours many new taxa, Syst. Appl. Microbiol., 34, 360–367, https://doi.org/10.1016/j.syapm.2011.02.002, 2011.
Peterson, J.: Observations and modeling of seismic background noise, U.S. Geological Survey (Open-File Report), https://doi.org/10.3133/ofr93322, 1993.
Podolskiy, E. A. and Walter, F.: Cryoseismology, Rev. Geophys., 54, 708–758, https://doi.org/10.1002/2016RG000526, 2016.
Pushkareva, E., Pessi, I. S., Namsaraev, Z., Mano, M.-J., Elster, J., and Wilmotte, A.: Cyanobacteria inhabiting biological soil crusts of a polar desert: Sør Rondane Mountains, Antarctica, Syst. Appl. Microbiol., 41, 363–373, https://doi.org/10.1016/j.syapm.2018.01.006, 2018.
Rignot, E., Mouginot, J., and Scheuchl, B.: Ice Flow of the Antarctic Ice Sheet, Science, 333, 1427–1430, https://doi.org/10.1126/science.1208336, 2011.
Smith, A. M.: Basal conditions on Rutford Ice Stream, West Antarctica, from seismic observations, J. Geophys. Res.-Sol. Ea., 102, 543–552, https://doi.org/10.1029/96JB02933, 1997.
Smith, A. M.: Microearthquakes and subglacial conditions, Geophys. Res. Lett., 33, L24501, https://doi.org/10.1029/2006GL028207, 2006.
Souverijns, N., Gossart, A., Gorodetskaya, I. V., Lhermitte, S., Mangold, A., Laffineur, Q., Delcloo, A., and van Lipzig, N. P. M.: How does the ice sheet surface mass balance relate to snowfall? Insights from a ground-based precipitation radar in East Antarctica, The Cryosphere, 12, 1987–2003, https://doi.org/10.5194/tc-12-1987-2018, 2018.
Stammler, K. and Ceranna, L.: Influence of Wind Turbines on Seismic Records of the Gräfenberg Array, Seismol. Res. Lett., 87, 1075–1081, https://doi.org/10.1785/0220160049, 2016.
Trnkoczy, E., Bormann, P., Hanka, W., Holcomb, L., Nigbor, R., Shinohara, M., Suyehiro, K., and Shiobara, H.: New manual of seismological observatory practice, chapter 7: Site Selection, Preparation and Installation of Seismic Stations, IASPEI, GFZ German Research Center for Geosciences, Potsdam, https://doi.org/10.2312/GFZ.NMSOP-2, 2012.
van den Broeke, M., Reijmer, C., and van de Wal, R.: Surface radiation balance in Antarctica as measured with automatic weather stations, 109, D09103, https://doi.org/10.1029/2003JD004394, 2004.
Walker, K. T. and Hedlin, M. A. H.: A Review of Wind-Noise Reduction Methodologies, in: Infrasound Monitoring for Atmospheric Studies, edited by: Le Pichon, A., Blanc, E., and Hauchecorne, A., pp. 141–182, Dordrecht: Springer Netherlands, https://doi.org/10.1007/978-1-4020-9508-5_5, 2010.
Winberry, J. P., Anandakrishnan, S., Wiens, D. A., and Alley, R. B.: Nucleation and seismic tremor associated with the glacial earthquakes of Whillans Ice Stream, Antarctica: GLACIAL SEISMIC TREMOR, Geophys. Res. Lett. 40, 312–315, https://doi.org/10.1002/grl.50130, 2013.
Winter, K., Lombardi, D., Diaz-Moreno, A., and Bainbridge, R.; Monitoring Icequakes in East Antarctica with the Raspberry Shake, Seismol. Res. Lett., 92, 2736–2747, https://doi.org/10.1785/0220200483, 2021.
Withers, M. M., Aster, R. C., Young, C. J., and Chael, E. P.: High-Frequency Analysis of Seismic Background Noise as a Function of Wind Speed and Shallow Depth, B. Seismol. Soc. Am., 9, 1507–1515, https://doi.org/10.1785/BSSA0860051507, 1996.