the Creative Commons Attribution 4.0 License.
the Creative Commons Attribution 4.0 License.
 | 29 Sep 2021
The role of grain size evolution in the rheology of ice: implications for reconciling laboratory creep data and the Glen flow law
David L. Goldsby
Greg Hirth
Viscous flow in ice is often described by the Glen flow law – a non-Newtonian, power-law relationship between stress and strain rate with a stress exponent n ∼ 3. The Glen law is attributed to grain-size-insensitive dislocation creep; however, laboratory and field studies demonstrate that deformation in ice can be strongly dependent on grain size. This has led to the hypothesis that at sufficiently low stresses, ice flow is controlled by grain boundary sliding, which explicitly incorporates the grain size dependence of ice rheology. Experimental studies find that neither dislocation creep (n ∼ 4) nor grain boundary sliding (n ∼ 1.8) have stress exponents that match the value of n ∼ 3 in the Glen law. Thus, although the Glen law provides an approximate description of ice flow in glaciers and ice sheets, its functional form is not explained by a single deformation mechanism. Here we seek to understand the origin of the n ∼ 3 dependence of the Glen law by using the “wattmeter” to model grain size evolution in ice. The wattmeter posits that grain size is controlled by a balance between the mechanical work required for grain growth and dynamic grain size reduction. Using the wattmeter, we calculate grain size evolution in two end-member cases: (1) a 1-D shear zone and (2) as a function of depth within an ice sheet. Calculated grain sizes match both laboratory data and ice core observations for the interior of ice sheets. Finally, we show that variations in grain size with deformation conditions result in an effective stress exponent intermediate between grain boundary sliding and dislocation creep, which is consistent with a value of n = 3 ± 0.5 over the range of strain rates found in most natural systems.
- Article
(2707 KB) - Full-text XML
-
Supplement
(50 KB) - BibTeX
- EndNote


Glaciers and ice sheets deform via gravity-driven viscous flow. The most widely employed constitutive description of ice flow is the grain-size-independent Glen law, a power-law expression between strain rate () and stress (σ) of the form , where B is a temperature-dependent constant that embodies the Arrhenius dependence of creep. The Glen law is characterized by a stress exponent n of ∼ 3 and is based on the classic laboratory experiments of Glen (1952, 1955) and numerous subsequent experiments on coarse-grained polycrystalline ice. Applications of the Glen law to natural settings have found that it provides a reasonably good description of flow in glaciers and ice sheets (e.g., Weertman, 1983). For example, it has been shown that the flow-line morphology of the Greenland and west Antarctic ice sheets (Cuffey, 2006), as well as smaller Antarctic ice caps (Martin and Sanderson, 1980; Hamley et al., 1985; Young et al., 1989), is consistent with a stress exponent of ∼ 3. Further, the relationship between stress and strain rate in spreading ice shelves (Thomas, 1973; Jezek et al., 1985), as well as borehole tilt measurements in temperate glaciers (Raymond, 1973, 1980) and ice sheets (Paterson, 1983), also supports the lab-derived value of n ∼ 3.
Yet despite Glen law's widespread adoption in ice-flow models, several lines of evidence indicate that it is an oversimplification of the rheological behavior of ice. Indeed, while reported n values are typically within an error of ∼ 3, there is considerable variability in the observational constraints. For example, using data from Taylor Glacier, Antarctica, Cuffey and Kavanaugh (2011) found a range in n from 2.6–5.1, with a best fitting value of 3.5. Further, flow line observations from East Antarctica compiled by Budd and Jacka (1989) are consistent with n values between 3–4. Intriguingly, although many studies acknowledge this degree of uncertainty in n, the canonical value of 3 is still used to infer variability in other parameters that influence the creep behavior of ice, such as grain size, fabric development, impurities, and water content (e.g., Cuffey and Paterson, 2010). These effects are often parameterized with an enhancement factor, which modifies the B term in the Glen law, but not the stress exponent. In particular, grain size variations have been shown to influence creep rates in basal ice in cores from Greenland and Antarctica (e.g., Cuffey et al., 2000).
From the laboratory perspective, the Glen law fails to describe ice rheology over a wide range of stresses (Pimienta et al., 1987; Duval and Castelnau, 1995; Durham and Stern, 2001; Goldsby and Kohlstedt, 2001; Montagnat and Duval, 2004), with an observed stress exponent n > 3 at high stress and n < 3 at low stress (Fig. 1). Indeed, Glen (1952) originally determined a value of n = 4 based on early experimental data at stresses of 0.2–1 MPa. The low-n regime suggested by more recent laboratory data for samples of comparatively coarse grains sizes (∼ 0.1 mm) is of particular importance for glaciology because it indicates a potential transition to a low-n creep mechanism at typical glacier stresses (≤ ∼ 0.1 MPa). Values of n ∼ 2 are often associated with creep mechanisms that involve dislocation-accommodated grain boundary sliding (GBS), which are strongly dependent on grain size. Mechanisms involving GBS are characterized by increasing strain rate with decreasing grain size, i.e., , where d is grain size and the grain size exponent m has a value of 1–3 depending on the mechanisms that accommodate GBS creep (e.g., Poirier, 1985; Langdon, 1994).
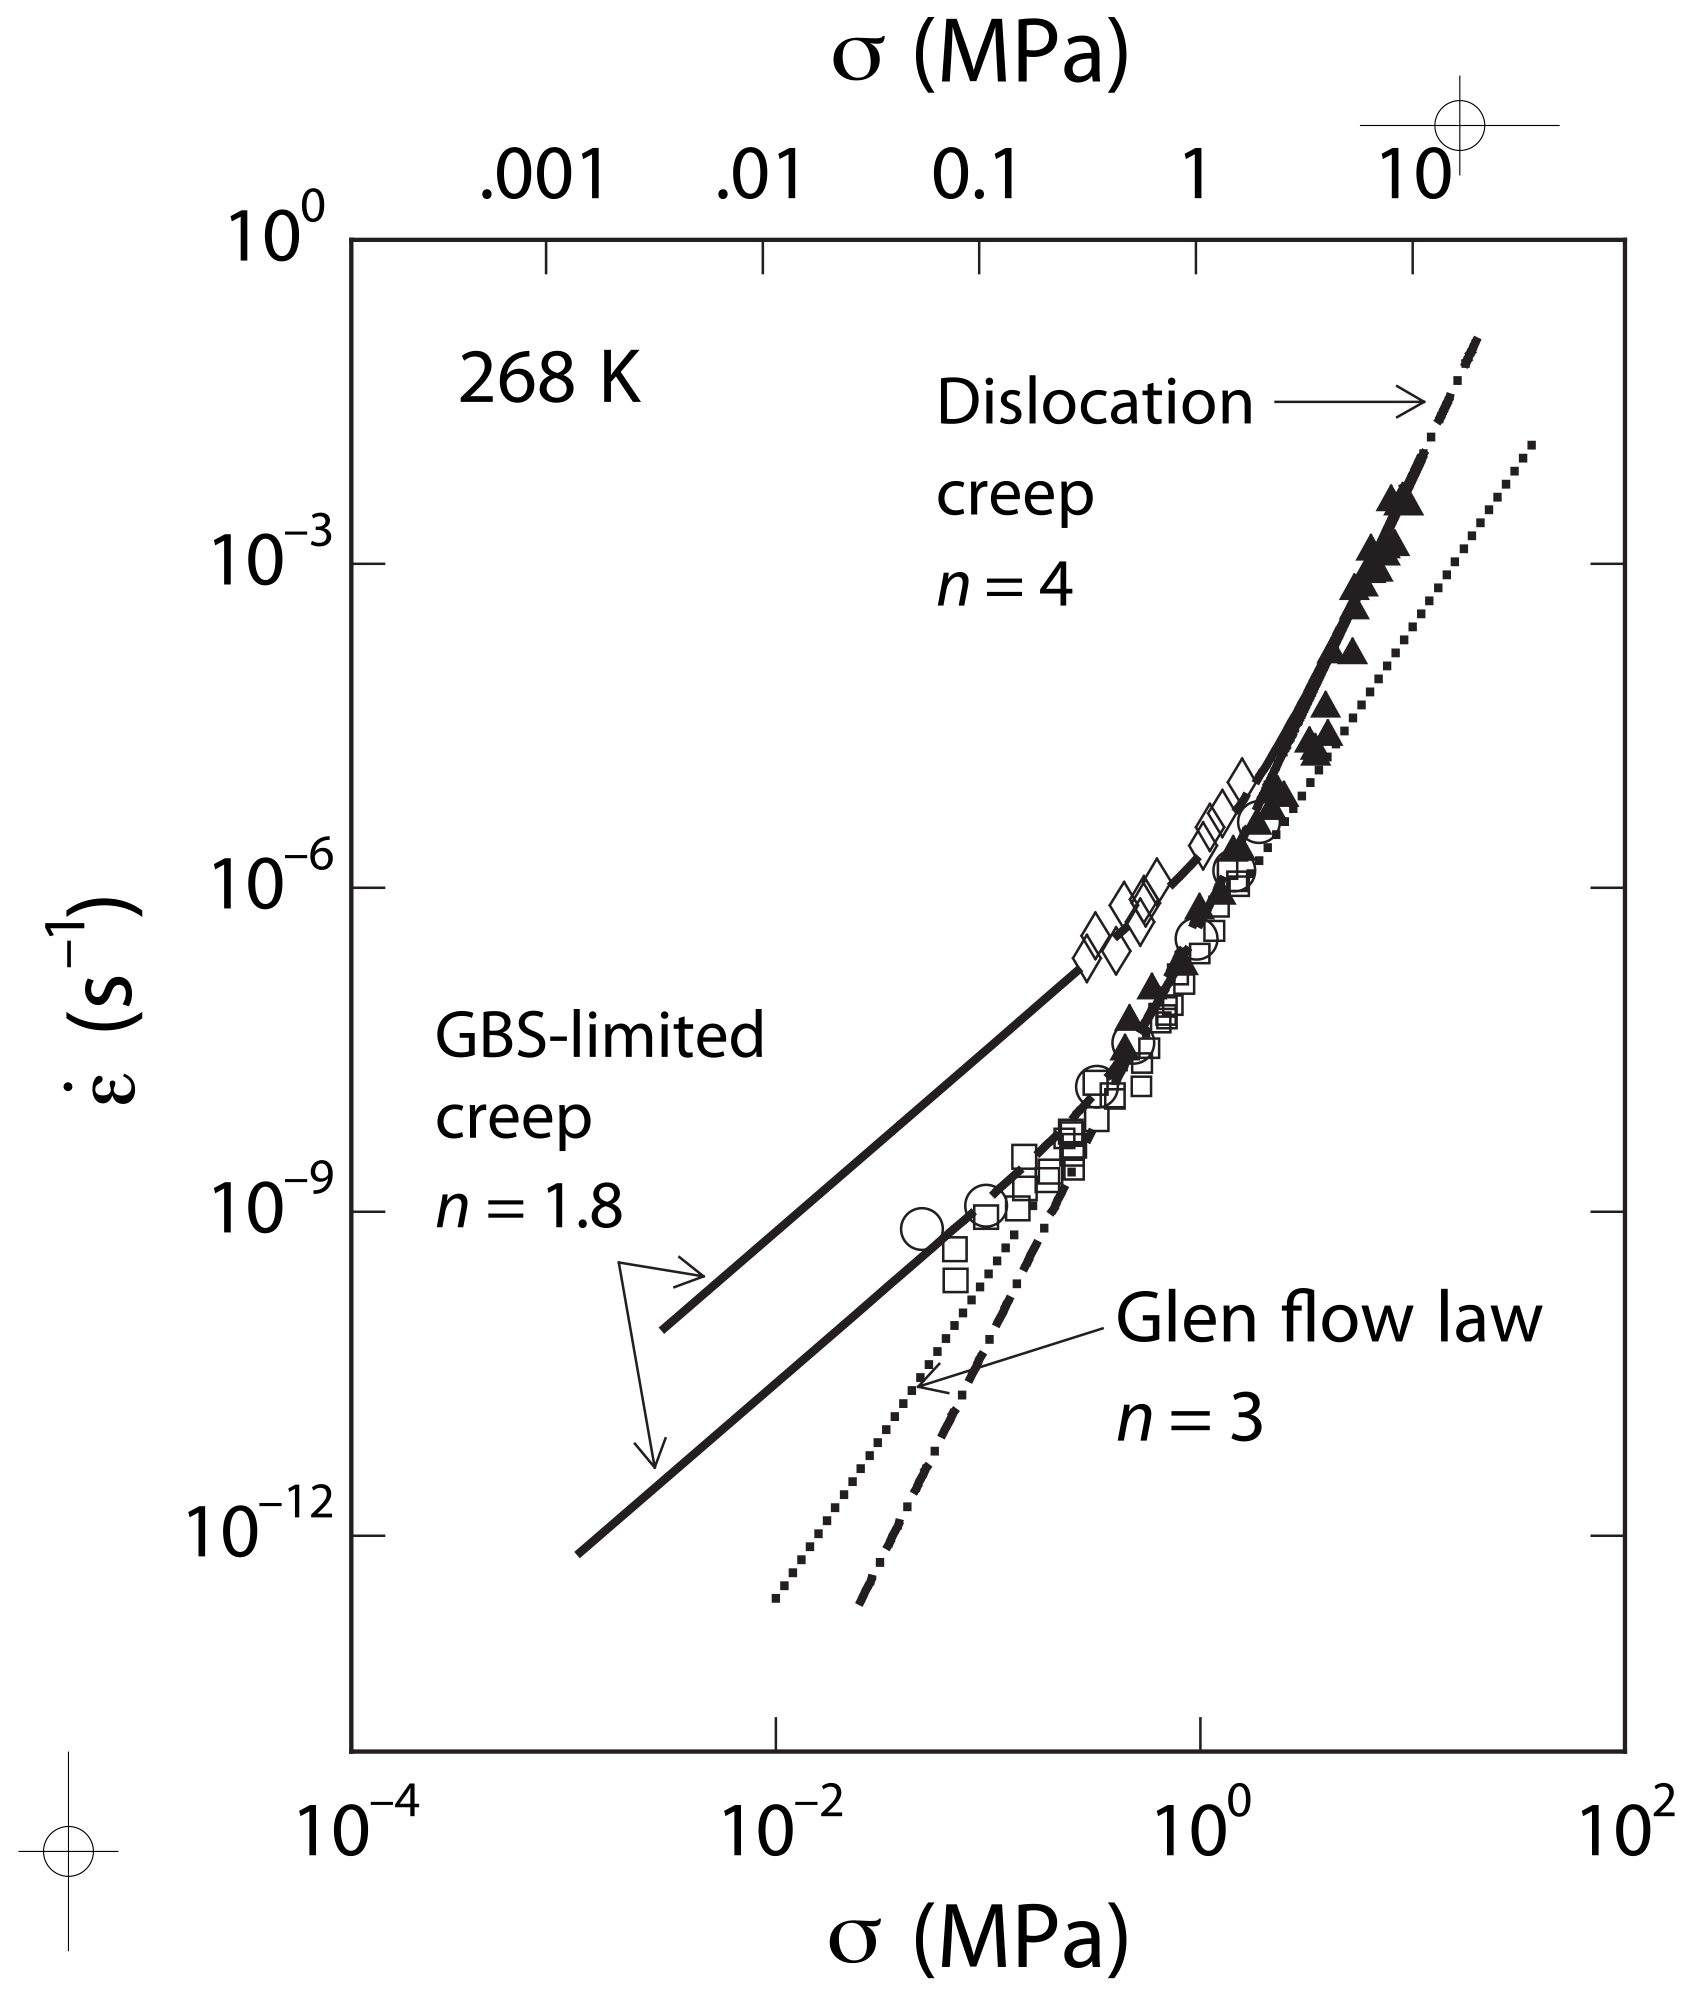
Figure 1Strain rate versus stress compiled from laboratory experiments on coarse-grained ice revealing the existence of the dislocation creep regime (n = 4) and GBS-limited creep regime (n = 1.8) at high and low stress, respectively. The upper and lower solid lines show a grain boundary sliding flow law calculated for grain sizes of 0.2 and 2 mm, respectively; the dashed–dotted line shows the dislocation creep flow law; the dotted line depicts the Glen law. Data are from ambient pressure tests at 268 K: d = 0.2 mm (diamonds) (Goldsby and Kohlstedt, 2001); d ≥ 1 mm (squares) (Steinemann, 1958); d ≥ 1 mm (circles) (Mellor and Smith, 1966); d ≥ 1 mm (triangles; Barnes et al., 1971). Note that the Glen law fails to adequately describe the flow of ice over a wide range of stresses. Figure adapted from Goldsby (2006).
Most early laboratory experiments on ice, such as those by Glen (1952, 1955), focused on polycrystalline samples with grain sizes typical of natural settings (1–10 mm). However, these data are difficult to interpret in terms of a GBS creep mechanism at low stresses because it is hard to separate to steady state from transient creep (Weertman, 1983). Access to low-stress (low-n) creep mechanisms on a practical timeframe requires fabrication of specimens with grain sizes that are much smaller than typically found in terrestrial ice (Goldsby and Kohlstedt, 2001; Durham et al., 2001). Creep experiments on such samples reveal a stress exponent of n = 4 at high stresses with no grain size dependence and are interpreted to reflect a dislocation creep mechanism (Goldsby and Kohlstedt, 2001). By contrast, with decreasing stress the data reveal the existence of a creep regime characterized by n = 1.8 (Fig. 1) and a marked dependence on grain size with m = 1.4. These values of n and m are consistent with a GBS creep mechanism in which GBS is accommodated by dislocation motion (Nieh et al., 1997).
These laboratory data lead to a paradox for interpreting the behavior of ice flow in natural settings – namely, the laboratory-derived stress exponents for neither dislocation creep (n ∼ 4) nor dislocation-accommodated GBS (n ∼ 1.8) match the value of n ∼ 3 in the Glen law. One possible explanation for this discrepancy is that variations in ice grain size will influence the relative contributions of GBS and dislocation creep, leading to a transitional regime between these two creep mechanisms (Peltier et al., 2000; Goldsby, 2006). To evaluate this hypothesis, it is necessary to quantify how grain size evolves spatially and temporally within glaciers and ice sheets. A number of studies have investigated the competing effects of grain growth and dynamic recrystallization on grain size in ice (e.g., Alley, 1992; Alley et al., 1995; Duval and Castelnau, 1995; De La Chapelle et al., 1998; Montagnat and Duval, 2000; Durand et al., 2006; Roessiger et al., 2011; Ng and Jacka, 2017). Faria et al. (2014a) proposed a fully coupled model in which steady-state grain size is described as a function of temperature and strain rate, but in deriving an expression for steady-state grain size they assumed the grain-size-independent Glen law. Here, we develop a unified description of grain size and deformation that explicitly accounts for the experimental constraints on grain-size-sensitive creep.
We build on the framework for grain size evolution proposed by Faria et al. (2014a). We do so by adapting the “wattmeter” (Austin and Evans, 2007, 2009), originally developed to quantify grain size evolution in crustal and mantle rocks, to calculate grain sizes in ice. The wattmeter is based on the concept that grain size in any solid crystal aggregate is controlled by the balance of the mechanical work required for grain growth and dynamic recrystallization. Coupling the wattmeter with a composite flow law that incorporates both GBS and dislocation creep, we (1) develop a model that provides a self-consistent description of deformation and grain size evolution in ice and (2) test our model using constraints from laboratory data and natural settings. Lastly, we show that grain size evolution in response to deformation leads to an effective stress exponent that is intermediate between grain boundary sliding and dislocation creep, consistent with the n ∼ 3 value of the Glen law.
Several models have been proposed to quantify the evolution of grain size in pure ice. The simplest of these models is the piezometric relationship, in which grain size is related directly to the inverse of stress (e.g., Azuma and Higashi, 1983; Jacka and Li, 1994). However, while the piezometer considers the competition between grain growth and grain size reduction due to strain (Jacka and Li, 1994), it only considers grain size at steady state and does not take into account how these two processes vary with the evolving deformation conditions. Near the surface, ice core data show a monotonic increase in grain size with depth, indicating that grain growth is the dominant process controlling grain size (Gow et al., 1997). However, at greater depths, grain sizes often stabilize, suggesting a steady state in which the rate of recrystallization balances the rate of grain growth (e.g., Roessinger et al., 2011; Faria et al., 2014b). Similar processes are thought to occur in crustal and mantle rocks and have led to models that assume grain growth and recrystallization are balanced at the field boundary between grain-size-sensitive (e.g., diffusion or GBS) creep and grain-size-insensitive (e.g., dislocation) creep (de Bresser et al., 2001). In crust and mantle rocks, the force for grain boundary reduction becomes negligible when diffusion creep dominates (Evans et al., 2001). However, this is not applicable for the field boundary between GBS and dislocation creep in ice, where easy slip on the basal plane of ice will produce intracrystalline deformation, similar to observations in olivine (e.g., Hansen et al., 2012).
Another class of models derived to study crustal and mantle rocks explicitly calculate the rates of grain growth and grain size reduction (e.g., Hall and Parmentier, 2003; Montési and Hirth, 2003; Bercovici and Ricard, 2014). A particularly successful model, which accurately predicts grain sizes in a range of natural samples (e.g., calcite, quartz, olivine), is the wattmeter (Austin and Evans, 2007, 2009). The wattmeter posits that the mean grain size, d, of a volume of rock or ice is controlled by the balance of mechanical work required for grain growth and dynamic recrystallization. Specifically, the wattmeter calculates the rate of grain size evolution from the competing rates of grain growth and dynamic recrystallization:
where is the change in mean grain size with respect to time, is the rate of grain growth, and is the rate of grain size reduction or “polygonization” (Alley et al., 1995).
Below we describe our approach for calculating the rates of grain growth and grain size reduction and how the grain size evolution law in Eq. (1) can be coupled with a composite flow law that includes both GBS and dislocation creep to predict the effective stress exponent for ice.
2.1 Grain growth
Following Alley et al. (1986), we assume that grain growth can be described by a relationship of the form
where K follows an Arrhenius relation:
In these equations do is an initial grain size, p is the grain growth exponent, t is time, Kgg is the grain growth constant, Qgg is the activation enthalpy for grain growth, R is the universal gas constant, and T is temperature. Substituting Eq. (3) into Eq. (2) and differentiating with respect to time allows us to write an expression for the rate of grain growth:
Equation (4) provides a general expression for grain growth; however, the values of the grain growth parameters p, Kgg, and Qgg are not well constrained in natural systems and depend on the presence of microparticles, bubbles, and/or other impurities in the ice (e.g., Alley et al., 1986). In Sect. 2.5 we will describe our approach for estimating these parameters using a combination of laboratory and ice core data.
2.2 Grain size reduction
The wattmeter posits that the rate of grain size reduction is controlled by the rate of mechanical work and the rate at which this work is dissipated (Austin and Evans, 2007, 2009; Bercovici and Ricard, 2012). Specifically, the rate of mechanical work per unit volume, , is defined as
where σ is von Mises equivalent stress and is strain rate (assuming that the rate of stress change is negligible over the timescale of grain size evolution). This work rate must be balanced by the rate at which the internal energy of the system, , increases plus the rate at which energy is dissipated, :
The increase in internal energy can be related to the increase in grain boundary area:
where γ is the grain boundary energy and c is a geometrical factor (π for spherical grains). The rate of dissipation in Eq. (6) is related to the fraction, λ, of the total work rate that is responsible for increases in internal energy:
Here we note a difference in the application of the wattmeter to ice compared to crustal and mantle rocks. In most terrestrial minerals, the two primary creep mechanisms are diffusion and dislocation creep. Because grain growth during diffusion creep was shown to be the same as that during static conditions (Karato et al., 1986), the work done by diffusion creep is assumed to be completely dissipated (i.e., λdiff=0), and only dislocation creep leads to grain size reduction. By contrast, under Earth-like pressure and temperature conditions, ice deformation proceeds primarily by a combination of GBS and dislocation creep (Goldsby and Kohlstedt, 2001). Because some fraction of the work done by both GBS and dislocation creep will lead to grain size reduction (i.e., λdisl & λGBS>0), the dissipation rate can be rewritten as
where
Here we assume that the total work rate can be expressed as the sum of the contributions from the individual deformation mechanisms:
Substituting Eqs. (7) and (9) into Eq. (6) we derive an expression relating the rate of grain size reduction to the total work rate:
The final grain size evolution equation can then be assembled from Eqs. (1), (4), and (12):
It is often useful to define a steady-state grain size, dss, which occurs when :
The concept of a steady-state grain size is analogous to that derived by Faria et al. (2014a), with the exception that they assumed creep was governed exclusively by the Glen law and grain size was related to stress only (e.g., Jacka and Li, 1994) rather than to the work rate (Eq. 6). In practice the steady-state grain size may not be achieved if there is insufficient time for grains to fully evolve to be in equilibrium with the surrounding deformation conditions. In these situations, Eq. (13) must be solved and coupled with the governing equations and constitutive relationships.
The values of λGBS and λdisl are uncertain and have not been determined independently. Therefore, for simplicity we assume that , thereby lumping the effects of grain boundary energy, grain geometry, and λ into a single “scaling factor” in Eq. (14) (Austin and Evans, 2009). In the following sections, we vary λ to elucidate the behavior of the model with respect to variations in any of these three parameters. We emphasize that the wattmeter models the rate of change in the internal energy and relates this to the grain size reduction rate (and thus increase in internal energy owing to increase in grain boundary area). A key assumption is that the rate of change in grain size is greater than the rate of change in stress – thus the dislocation density can be considered constant for a given stress (Austin and Evans, 2007, 2009).
Finally, we note that the wattmeter approximates mean grain size, d, as the diameter of a circular grain of ice. Comparing these theoretical values to grain sizes in natural systems can be challenging because grains are irregular and are typically measured in a 2-D cross section (e.g., thin section) through a 3-D sample. In our comparisons to data below, natural grain sizes were estimated using the line intercept technique of Alley and Woods (1996). In this approach, the average distance between grain boundaries along a series of lines through a sample is measured and then scaled by a correction factor of the order of 1 (1.5 for circular grains; Gifkens, 1970) in order to account for the fact that when making a thin section many grains are cut near their edge as opposed to near their center (Gow, 1969). Further, because this approach is also used in the measurement of grain sizes in the derivation of the flow laws (Goldsby and Kohlstedt, 2001), it allows us to compare our calculated grain sizes to ice core data in a self-consistent manner.
2.3 Composite rheology for ice
To apply the grain size evolution model defined by Eq. (13) to natural systems, we calculate the relative rates of deformation by GBS and dislocation creep. To do so, we formulate a two-mechanism composite flow law that contains additive contributions from each creep mechanism of the form
This composite law has been used to model the rheology of ice satellites (Barr and McKinnon, 2007) and the relative contribution of GBS and dislocation creep in ice sheets (Kuiper et al., 2020). Here the creep mechanisms are assumed to be independent and each term on the right-hand-side of Eq. (15) is expressed as a flow law of the general form
where Ai is a material constant, mi is the grain size exponent for creep, ni is the stress exponent, and Qi is the activation energy. The subscript i denotes the parameters that depend on the deformation mechanism (e.g., GBS or dislocation creep). We note that Goldsby and Kohlstedt (2001) presented a more complicated composite law that includes a term for creep limited by basal dislocation slip and also a theoretical flow law for diffusion creep. However, extrapolations to grain sizes typical of glaciers and ice sheets demonstrate that neither of these additional creep mechanisms are likely to be important for the flow of terrestrial ice bodies. A list of flow law parameters required to extrapolate Eq. (16) to the full temperature range (up to the melting point) is given in Goldsby and Kohlstedt (2001).
2.4 Model setup
To solve for grain size evolution in ice, we consider two scenarios: (1) deformation in a shear zone under an imposed velocity contrast Vsz and (2) deformation in a 1-D vertical column of ice with an assumed surface slope, α. For the case of a shear zone with no along-strike pressure and/or viscosity gradients, the shear stress, τ, will be constant and a function of only the viscosity and velocity contrast:
where η is the viscosity, v is the velocity parallel to the shear zone, and w is the direction perpendicular to the strike of the shear zone. Integrating Eq. (17) over the width of the shear zone, wo, allows us to write stress in terms of the imposed velocity:
The viscosity can be reformulated from the flow law (Eq. 16) in terms of the stress:
In the case of deformation within a column of ice with a zero-slip basal boundary condition, the shear stress is calculated from the surface slope and increases linearly as a function of depth, z, in the ice sheet:
Here ρ is the density of ice, g is the gravitational acceleration, and H is the thickness of the ice sheet. Note that in practice we relate the shear stress to the von Mises equivalent stress in the wattmeter (Eq. 13) and flow law (Eq. 16) through the square root of the second invariant of the stress tensor, which in this geometry reduces to .
2.5 Calibration of grain growth parameters
Before using the wattmeter to predict grain sizes in natural systems, we must first constrain the grain growth parameters used in the model as they will directly control the balance between grain growth and grain size reduction. As noted above, grain growth rates in ice are highly sensitive to the presence of impurities, both soluble (e.g., bubbles, ions) and insoluble (e.g., dust/microparticles) (Alley et al., 1986). While the expressions for grain size evolution derived above do not explicitly account for the effects of impurities, we can parameterize their effects through their influence on grain growth. To constrain the grain growth parameters (p, Kgg, and Qgg) in Eq. (4), we turn to a combination of laboratory and ice core data. Azuma et al. (2012) measured grain growth rates in laboratory samples both with and without bubbles and found that the grain growth exponent for bubble-free ice was relatively small (p ∼ 2) but was significantly larger (p ∼ 7–9) in ice containing bubbles (Fig. 2). The increase in the grain growth exponent in the presence of bubbles was interpreted to reflect the role of “impurity drag”.
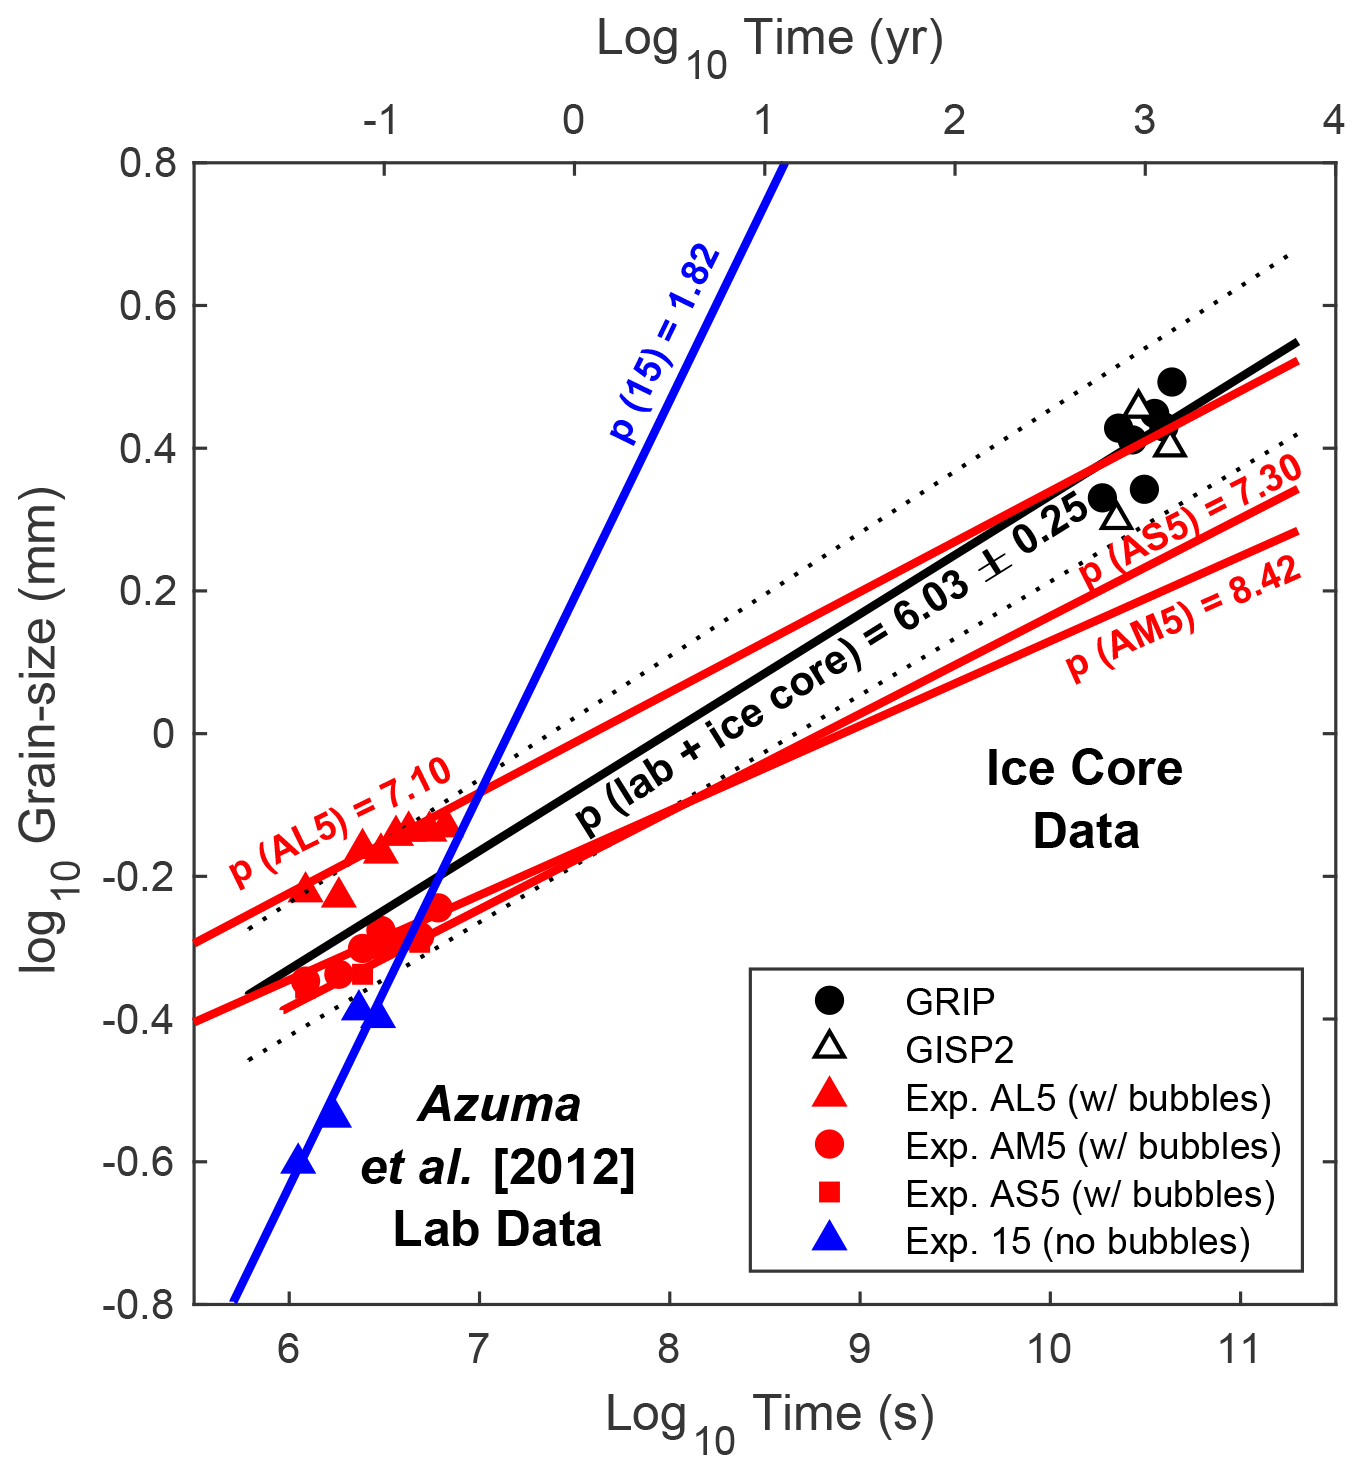
Figure 2Comparison of grain growth rates derived from laboratory and ice core data. Data from individual laboratory experiments by Azuma et al. (2012) with and without bubbles are shown by red and blue symbols, respectively. Grain sizes for the GRIP (black circles; Thorsteinsson et al., 1997) and GISP2 (open triangles; Gow et al., 1997) ice cores are plotted as a function of time based on the age models of Dansgaard et al. (1993) and Ram et al. (2000), respectively. Only ice core data between 150–300 m depth where grain growth dominates are used (see text). Red and blue curves show the fit to individual experiments conducted at a temperature equivalent to the ice core data (243 K); grain growth exponents (labeled) are calculated following the methodology in Bons et al. (2001). The black curve shows the fit calculated using all three laboratory experiments that contain bubbles and the GRIP ice core data. Dotted black lines show the 1σ error estimate on fit to lab and ice core data.
To investigate the applicability of these experimentally derived grain growth rates to natural systems, we compared them to grain sizes in the shallow portions of the GRIP and GISP2 ice cores where recrystallization rates are expected to be small and the increase in grain size with depth dominantly reflects the rate of grain growth (Gow et al., 1997). We use only grain sizes from the depth range between 150 m (∼ 500 years; taken to represent the depth at which the ice is fully compacted) and 300 m (∼ 1500 years; below which grain sizes no longer increase at a constant rate, indicative of the influence of recrystallization). For comparison with the laboratory data, depth was converted to time for the GRIP and GISP2 cores based on the age models of Dansgaard et al. (1993) and Ram et al. (2000), respectively.
Using experiments conducted at the temperature conditions found between 150–300 m depth in the GRIP and GISP2 ice cores (243 K; Hvidberg et al., 1997), we first refit the Azuma et al. (2012) experimental data for the grain growth parameters p and Kgg using the approach of Bons et al. (2001). We find grain growth exponents in the range of 7.1–8.4 for experiments with bubbles and p = 1.8 for the single experiment without bubbles (red and blue curves in Fig. 2). Extrapolating these parameters to timescales applicable to glaciers and ice sheets (e.g., 103–105 years), we show that (1) the grain growth parameters derived for ice with bubbles provide a significantly better fit to the ice core data compared to the grain growth rates for bubble-free ice (compare red vs. blue curves in Fig. 2), and (2) the parameters derived from experiment AL5 provide the best overall fit to the ice core data. However, there is some variability in the experimental data – possibly reflecting differences in bubble content and/or the difficulty in extrapolating grain growth parameters determined on timescales of hours to days in the laboratory to timescales of thousands of years in natural systems. In an attempt to address these issues, we refit the Azuma et al. (2012) data from all three experiments containing bubbles at 243 K (AL5, AM5, and AS5) jointly with the GRIP ice core data. We do not include the GISP2 data in this fit, as we will calculate grain size as a function of depth throughout the entire GISP2 core in Sect. 3.3 below. The joint fit results in a grain growth exponent p of 6.03 ± 0.25 (solid black line in Fig. 2), slightly less than the values derived from the individual laboratory experiments.
Our goal in fitting the grain growth exponent in this way is to derive an “empirical” p value that, in conjunction with the corresponding values of Kgg and Qgg, fits a wide range of observations and can be applied to natural settings. We note that additional parameters have been shown to influence grain growth. For example, Arena et al. (1997) showed that the presence of pores can be thought of as changing the Kgg value in the grain growth law. Further, the evolution of microstructure during deformation (compared to static grain growth) can result in changes in Kgg (Roessiger et al., 2014). Thus, if Kgg varies with the microstructure (bubble size/bubble topology), and this scales with grain size, then Kgg will be proportional to some function of grain size f(d). In our formulation, we essentially lump all these effects into the empirically fit p value, which is mathematically similar to a Kgg term with a power-law relationship to grain size.
Below we use the grain growth parameters derived exclusively both from the experiment AL5 and from the joint fit between the experimental and ice core data (Table 1) in our application of the wattmeter and discuss the influence of the grain growth exponent on the derived effective stress exponent for creep in ice.
As described above we have used the theoretical framework of the wattmeter (Austin and Evans, 2007, 2009) to develop a new grain size evolution model for ice. In the following section, we will apply this grain size evolution model (loosely referred to as the wattmeter) to estimate grain size in several simplified systems where deformation is driven by either an imposed velocity contrast across a 1-D shear zone or a variation in stress with depth associated with a fixed surface slope.
3.1 Steady-state grain size in a shear zone
We first use the wattmeter to predict grain size in a steady-state shear zone deforming at a fixed strain rate. This setup is analogous to constant strain rate laboratory experiments, such as those by Piazolo et al. (2013) discussed in the following Section. In this end-member, we calculate steady-state grain size by iterating between Eqs. (14) and (18) and assuming the grain growth parameters from our joint fit of the Azuma et al. (2012) experiments and the GRIP ice core data. In practice, we set an initial shear stress and grain size. Using these values, we calculate viscosity and use Eq. (18) to make a new estimate of the shear stress. Based on our new estimate of shear stress and the corresponding strain rate (calculated from the flow law), we use the wattmeter to calculate an updated steady-state grain size (Eq. 14). These new estimates for stress and grain size are then used to recalculate viscosity, which is in turn fed back in Eq. (18) for the next iteration. We continue to iterate in this manner until the shear stress varies by less than 0.1 %.
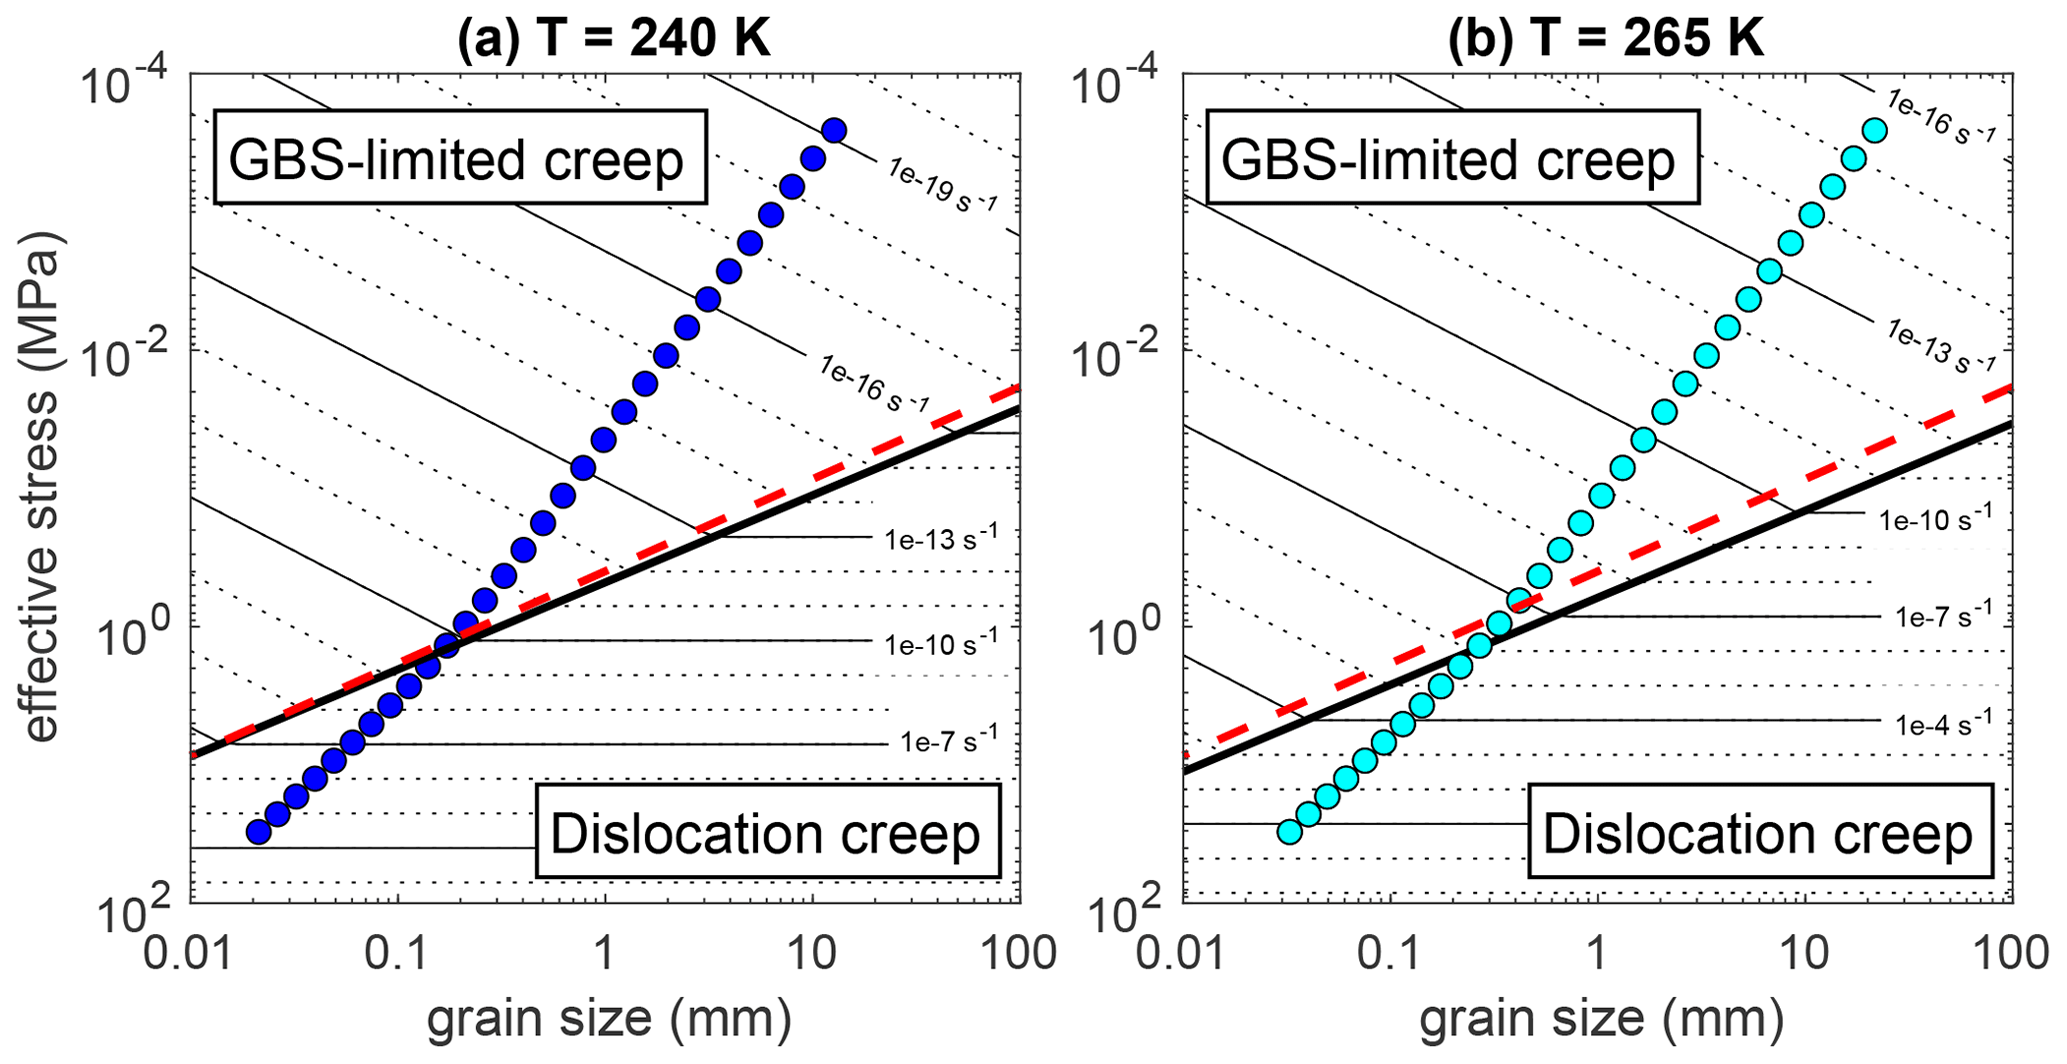
Figure 3Effective stress vs. grain size at (a) 240 K and (b) 265 K calculated for a shear zone of fixed width using the wattmeter. Dark and light blue symbols correspond to the steady-state grain size predicted from a single model simulation at a given strain rate. Dashed red lines show location of the piezometer (Jacka and Li, 1994). Model results are overlain on a deformation mechanism map for ice calculated at the appropriate temperature using the flow law parameters from Goldsby and Kohlstedt (2001). Background contours correspond to strain rate; the thick black line indicates the boundary between GBS-limited creep (upper left) and dislocation creep (lower right). Under these conditions the location of the field boundary and piezometer are very similar.
The result is an estimate of stress and grain size within the shear zone for any imposed strain rate; Fig. 3a and b show these estimates calculated at temperatures of 240 and 265 K, respectively. As noted above, the dominant deformation mechanism in ice is sensitive to both grain size and stress, with higher stresses and larger grain sizes favoring dislocation creep and lower stresses and smaller grain sizes favoring GBS-limited creep (Fig. 1). We illustrate the transition between dislocation and GBS creep (often referred to as the “field boundary”) using a deformation mechanism map (Fig. 3). Here we assume that a deformation mechanism acting in kinetic parallel with other creep mechanisms is the dominant mechanism if it yields the fastest creep rate. By overlaying the stresses and grain sizes predicted from the wattmeter on deformation maps calculated at the corresponding temperature, we show how variations in strain rate lead to a transition in the dominant deformation mechanism (Fig. 3).
The relationship between grain size and stress predicted by the wattmeter does not change significantly as a function of temperature but has a steeper slope compared to either the field boundary or the piezometer (Jacka and Li, 1994). For example, both the 240 and 265 K shear zones predict a transition from dislocation to GBS-limited creep at a grain size of 0.2–0.3 mm and a stress of 1–2 MPa (Fig. 3). By contrast, the strain rate at which the shear zone is predicted to cross the field boundary varies from 3 × 10⁻⁹ to 1 × 10⁻⁶ s−1 for temperatures of 240 and 265 K, respectively. These results indicate that when grain size is allowed to vary with the evolving deformation conditions, the dominant deformation mechanism will not be strongly affected by variations in temperature, but the strain rate corresponding to a specific grain size (and stress) will vary due to the Arrhenius behavior of creep (Eq. 16).
We also examine the relationship between stress and strain rate in the shear zone, comparing cases with a fixed grain size to those in which grain size evolves according to the wattmeter (Fig. 4a). Consistent with the laboratory experiments shown in Fig. 1, the fixed grain size calculations show a distinct change in slope corresponding to the transition from a stress exponent of n = 1.8 in the GBS-limited creep regime to a value of n = 4 in the dislocation creep regime (Fig. 4b). By contrast, the wattmeter predicts a more subdued change in slope in the GBS-limited field corresponding to a higher effective stress exponent (∼ 2.5) than the lab-derived value of n = 1.8. At higher strain rates and stresses the wattmeter converges to the dislocation creep stress exponent (Fig. 4b). We discuss the origin of these differences in the effective stress exponent in Sect. 4.1.
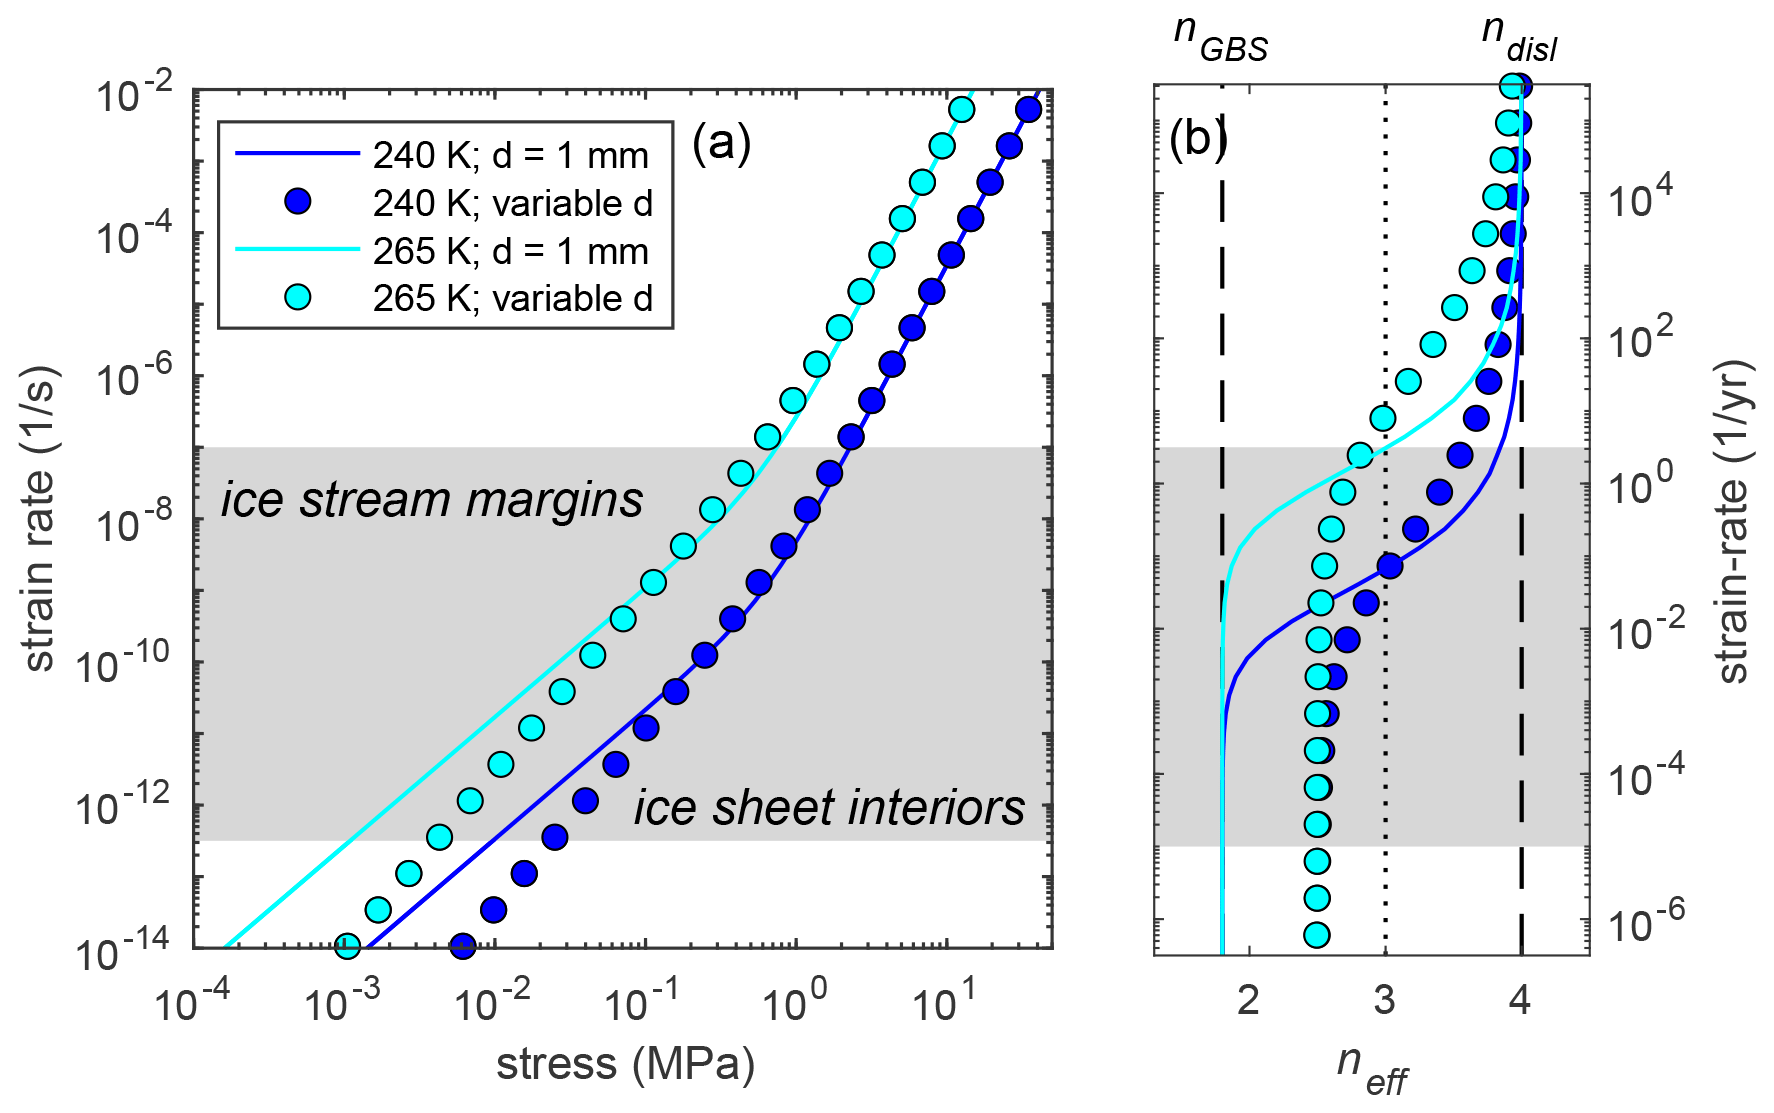
Figure 4(a) Comparison of strain rate vs. stress predicted for a constant grain size of 1 mm (colored lines) to those predicted by the steady-state grain size calculated from the wattmeter (colored symbols). Dark blue and light blue colors correspond to temperatures of 240 and 265 K, respectively. Wattmeter calculations correspond to those shown in Fig. 3 for a shear zone of fixed width. (b) Effective stress exponent as a function of strain rate predicted from the model. The effective stress exponent is calculated from the slope of the strain rate vs. stress curve shown in panel (a). For cases with a fixed grain size, the stress exponent transitions from the experimentally derived value for GBS-limited creep (at low strain rate) to the value for dislocation creep (at high strain rate). The effective stress exponent in the GBS-limited creep regime calculated from the wattmeter is higher than the experimentally determined value and remains closer to the Glen law value of ∼ 3 for strain rates typical of natural systems.
3.2 Application of the shear zone model to laboratory experiments
Piazolo et al. (2013) investigated grain size changes as a function of strain in a series of experiments conducted at different strain rates. These experiments are ideal for benchmarking and calibrating the wattmeter as we can compare the final grain size to the steady-state value in Eq. (14) and also evaluate the evolution of grain size as a function of time (determined from the strain given an imposed strain rate) using Eq. (13). Here we investigate a series of cases using the grain growth parameters from the joint fit of the Azuma et al. (2012) experiments and the GRIP ice core data, as well as those derived exclusively from experiment AL5 (Fig. 5). Further, we vary the fraction of the total work rate that is responsible for increases in internal energy assuming . Following the experimental setup of Piazolo et al. (2013), we assume an initial grain size of 0.5 mm and use Eq. (13) to calculate grain size as a function of strain for the strain rates used in the experiments. Simulations were performed to a strain of 0.2, by which time all cases have achieved a steady-state grain size.
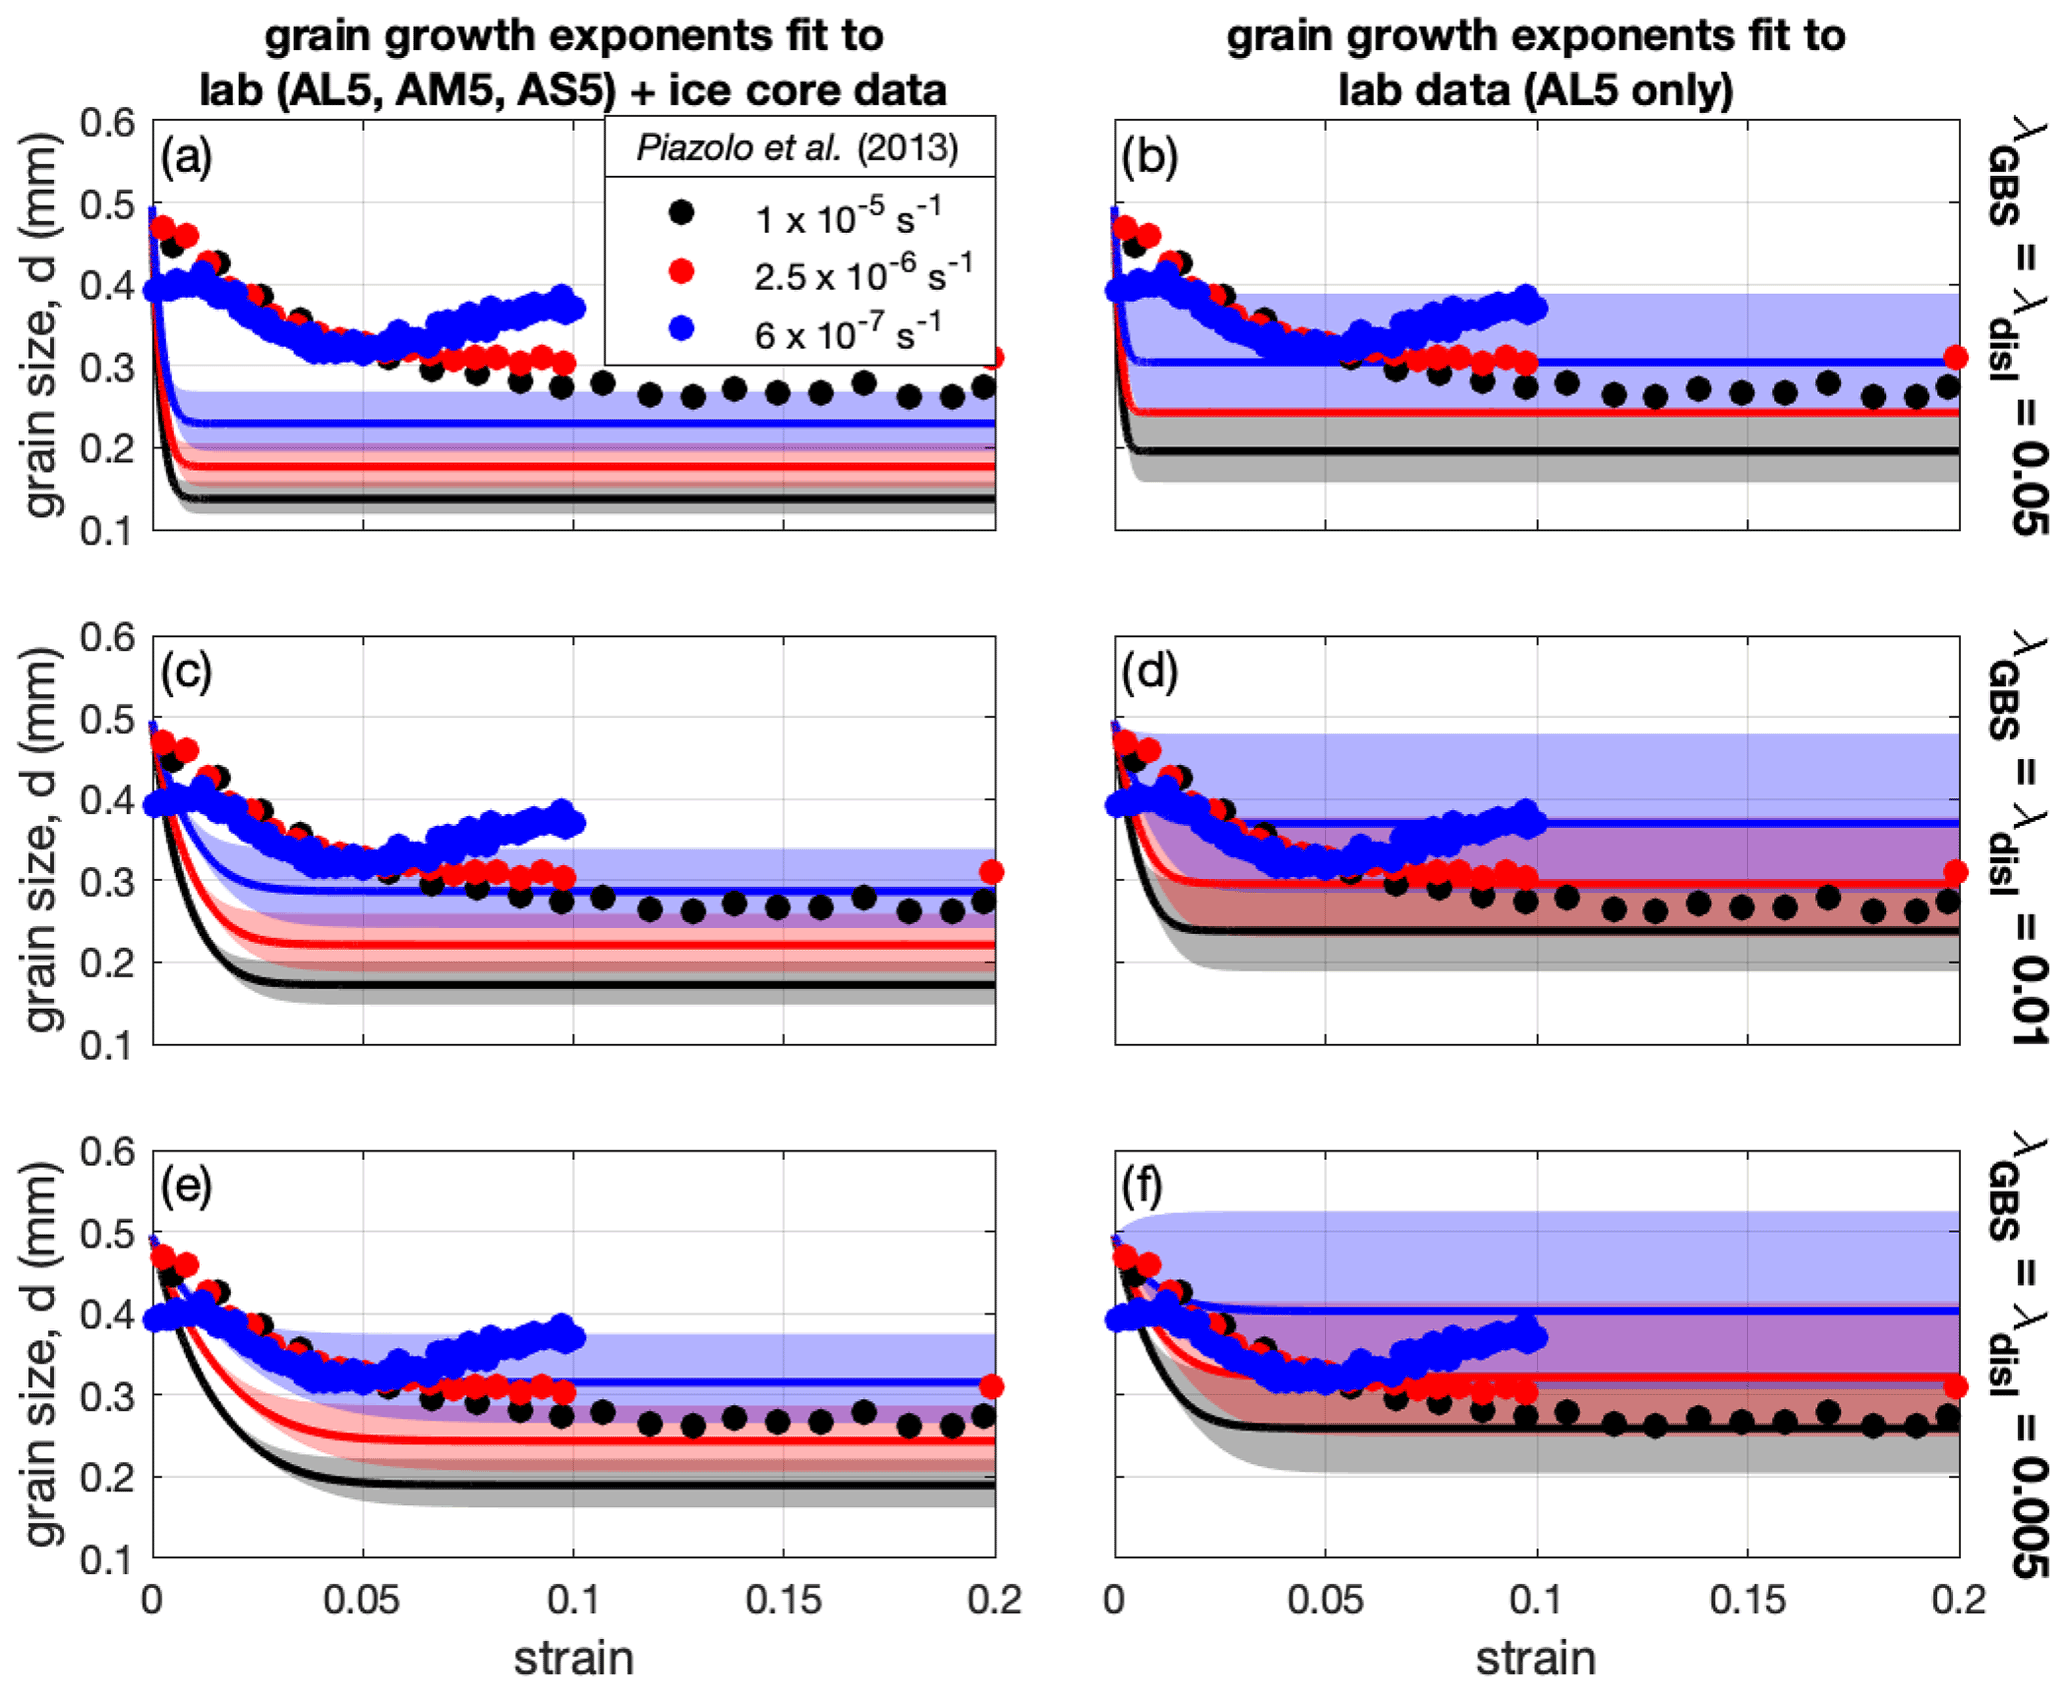
Figure 5Comparison of wattmeter to experimental data on grain size evolution from Piazolo et al. (2013). Calculations are performed assuming a shear zone with an imposed strain rate corresponding to the laboratory experiments (1 × 10⁻⁵ s−1 black; 2.5 × 10⁻⁶ s−1 red; 6 × 10⁻⁷ s−1 blue). Initial grain size is set to 0.5 mm, and grain size evolution is calculated as a function of time and strain using Eq. (13). Panels (a), (c), and (e) show results using the grain growth parameters from the joint fit between the laboratory and ice core data (black line in Fig. 2); panels (b), (d), and (f) show results using the grain growth parameters from Azuma et al. (2012) experiment AL5. Rows indicate calculations using different values for λ = λGBS = λdisl ranging from (a, b) 0.05, (c, d) 0.01, to (e, f) 0.005.
As expected, increasing λ results in a smaller steady-state grain size and a more rapid convergence to the steady-state value with increasing strain (Fig. 5). In general, all cases produce the relative variations in grain size as a function of strain rate shown by the experimental data; however, the grain growth parameters derived from experiment AL5 combined with λ=0.005–0.01 provide better fits to the data (Fig. 5e, f).
3.3 Steady-state grain size in a 1-D vertical column of ice
We next investigate predictions of the wattmeter for a 1-D vertical column of ice in which stress as a function of depth is controlled by the surface slope and ice density (Eq. 20). This setup is analogous to deformation within a deforming ice body and thus can be directly compared with grain size values derived from ice cores. We first simulate a theoretical 1 km column of ice with a surface slope of 2∘, ice density of 920 kg m−3, and constant temperature of 253 K. We calculate the steady-state grain size, velocity, strain rate, and effective stress exponent as a function of depth assuming (Fig. 6a). The effective stress exponent is calculated from the numerical solution using the local gradient in stress and strain rate with depth. Grain size decreases with depth due to the increase in stress lower in the column (which drives recrystallization), while grain growth dominates near the surface. Compared to cases with a constant grain size, grain size evolution produces larger gradients in velocity and strain rate with depth as the fine-grained ice softens near the bed (Fig. 6b, c). Calculations with grain growth parameters derived from either the joint fit of the experimental and ice core data or exclusively from experiment AL5 result in similar grain size profiles, with the joint fit predicting slightly smaller grain sizes and correspondingly higher strain rates at the base of the column.
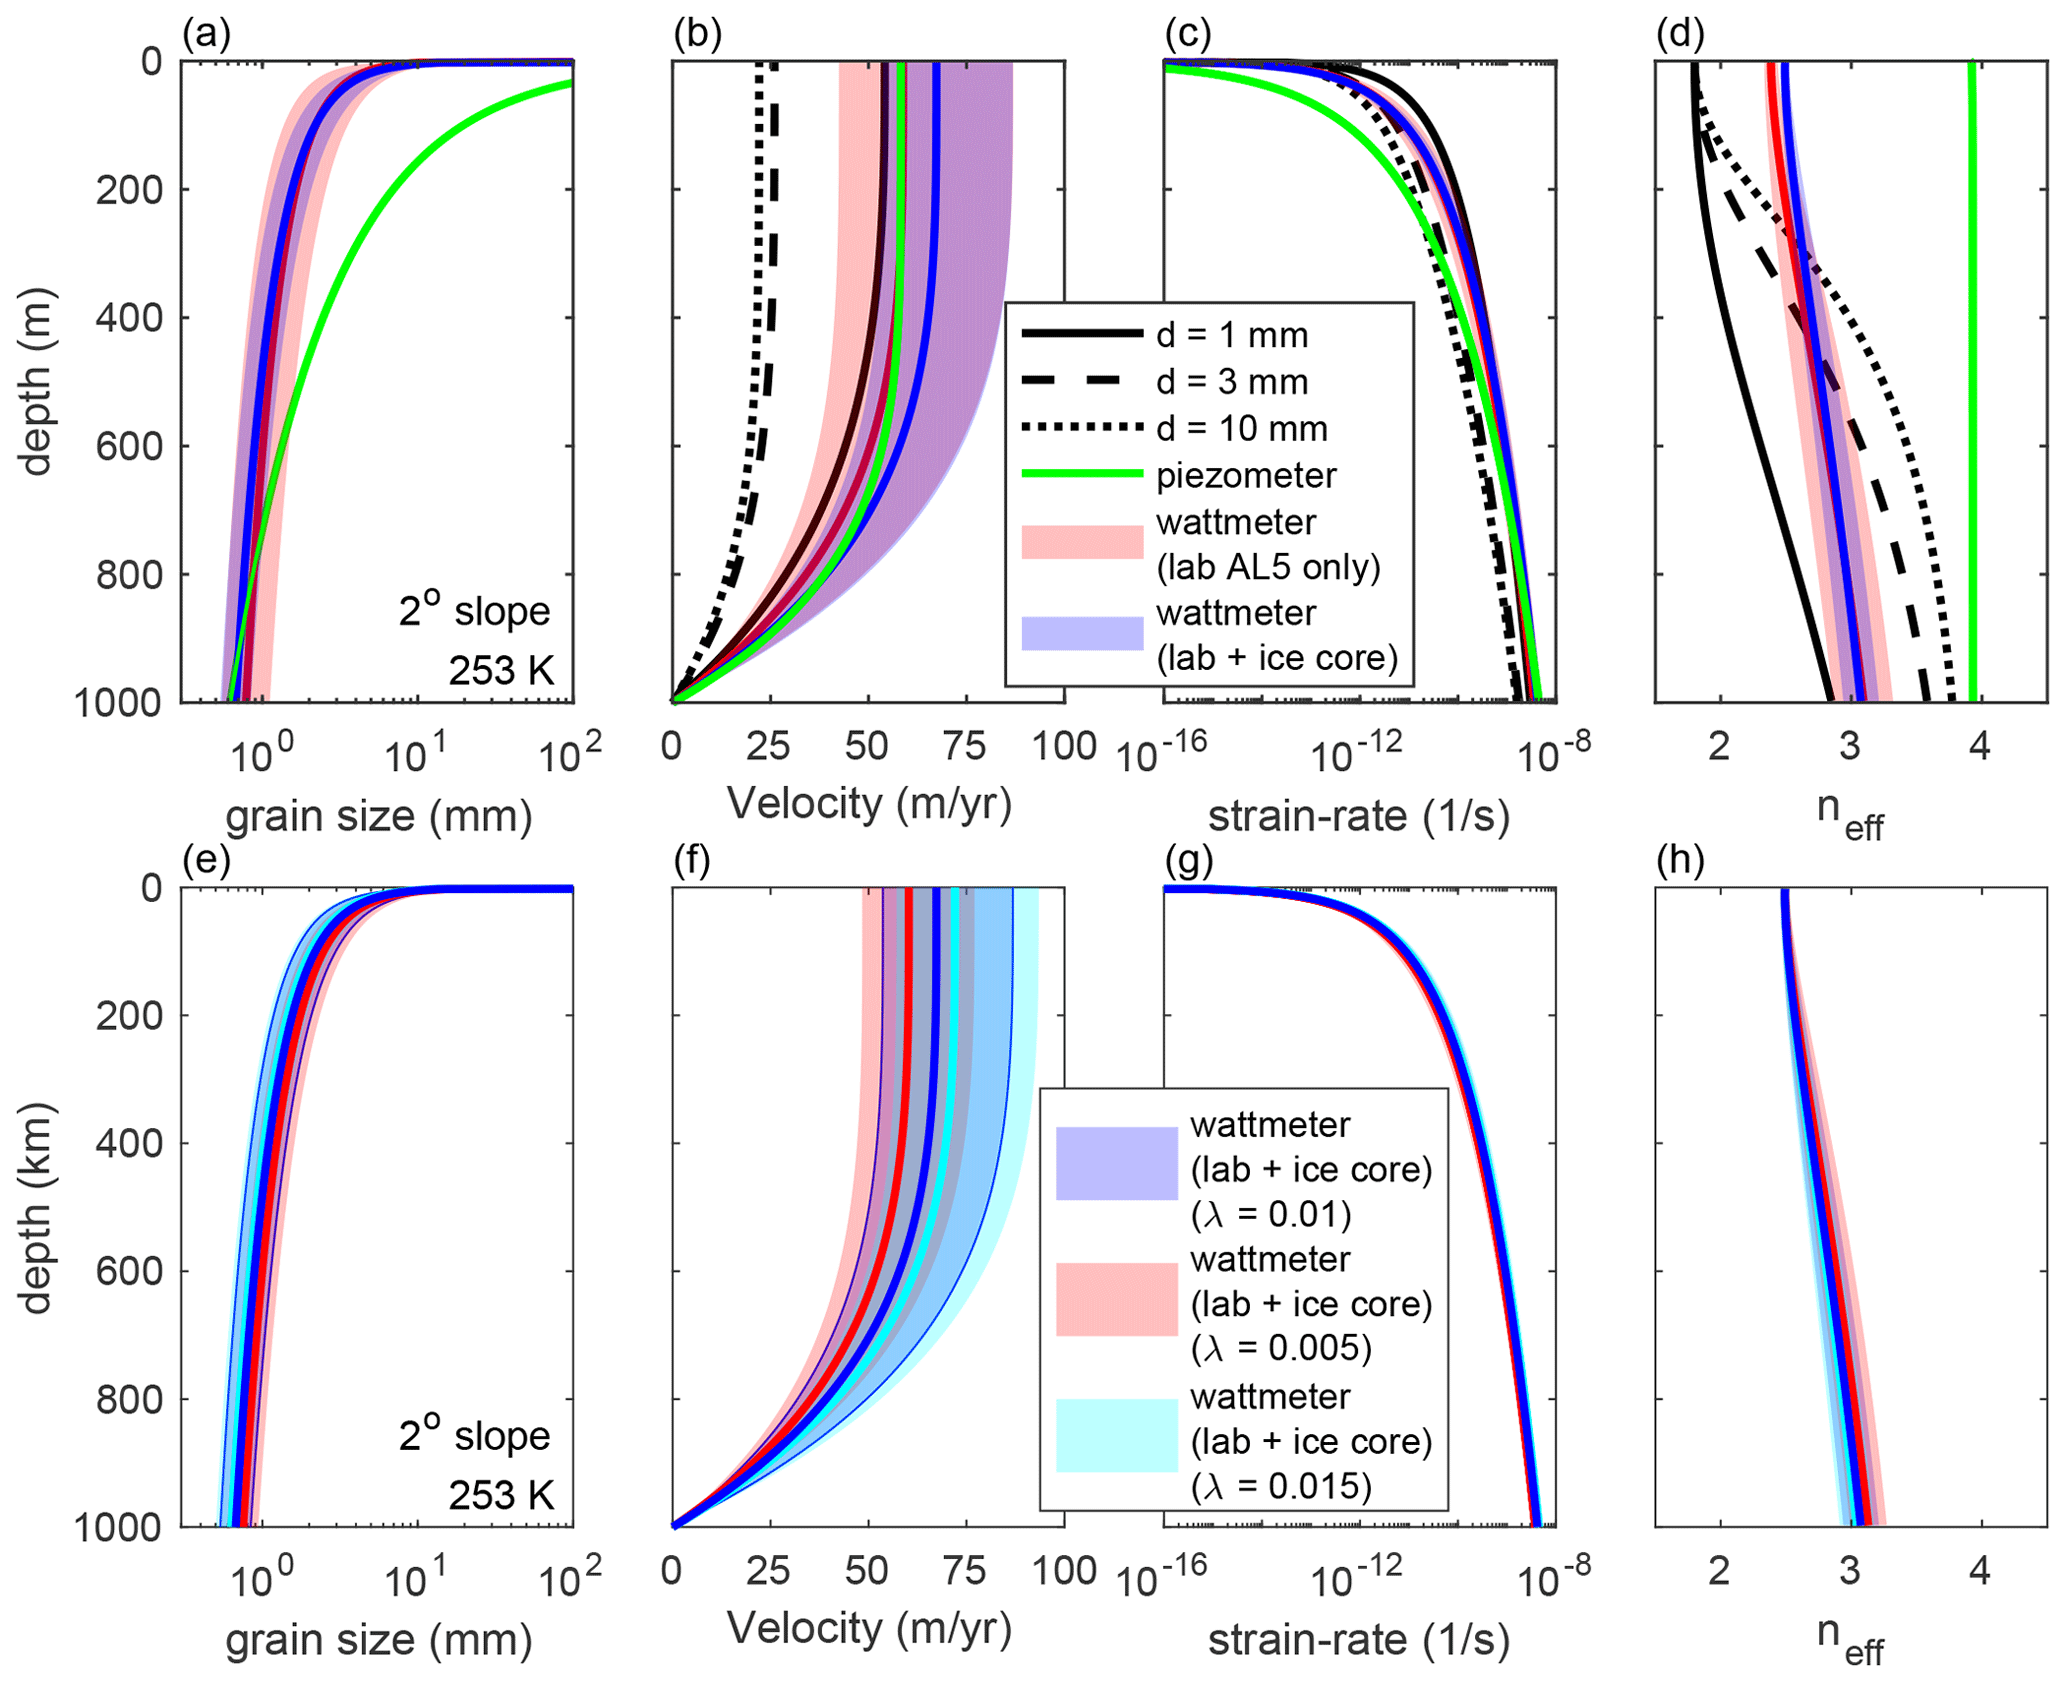
Figure 6(a) Steady-state grain size, (b) velocity, (c) strain rate, and (d) effective stress exponent, neff calculated as a function of depth. The effective stress exponent is calculated from our model using the local gradients in stress and strain rate. Red and blue curves correspond to calculations using the grain growth parameters from the Azuma et al. (2012) experiment AL5 and the joint fit of the experimental and ice core data, respectively; shading denotes error bounds based on uncertainty in fit of the grain growth data. Black curves show constant grain sizes of 1 mm (solid), 3 mm (dashed), and 10 mm (dotted). The green curve shows calculations based on the piezometer of Jacka and Li (1994). Note that the effective stress exponents calculated using the wattmeter fall in a range similar to the Glen law (neff = 2.5–3). (e–h) Same as panels (a)–(d), comparing cases using different values for λ = λGBS = λdisl.
Further, we explore the sensitivity of our results to the range in λ used in our comparison to the laboratory data ( = 0.005–0.015). Although λ is poorly constrained (Austin and Evans, 2007, 2009), these values are in the range determined by applying the wattmeter to recrystallization of quartzite (Tokle and Hirth, 2021) and olivine (Holtzman et al., 2018). In general, we find that the differences in the wattmeter predictions due to the uncertainty in λ (Fig. 6e–h) are smaller than the variations associated with the uncertainty in the grain growth parameters (Fig. 6a–d).
The profiles of velocity and strain rate have a similar functional form to those calculated for a fixed grain size; however, the effective stress exponent varies significantly between the fixed grain size cases and those with grain size evolution. With a fixed grain size, the effective stress exponent varies from neff = 1.8 at the surface to neff = 2.6 to 3.7 at the bed for grain sizes of 1 and 10 mm (Fig. 6d). By contrast, the wattmeter predicts an effective stress exponent that varies from ∼ 2.5 at the surface to ∼ 3 at the bed. This result is insensitive to the choice of λ (Fig. 6h). Thus, similar to the fixed-width shear zone models, the 1-D vertical column predicts effective stress exponents more similar to the Glen law value compared to cases with a fixed grain size.
Finally, we compare the wattmeter predictions to those using a piezometric relationship relating grain size directly to stress (Jacka and Li, 1994). The piezometer predicts significantly larger grain sizes in the shallow portion of the column compared to the wattmeter but reaches similar values near the bed (green curves in Fig. 6). Overall, the piezometer results in smaller strain rates throughout most of the column and a significantly higher effective stress exponent (neff ∼ 3.9), similar to the experimental value for dislocation creep.
3.4 Application of 1-D ice column model to ice core data
To investigate how well the wattmeter predicts grain sizes observed in natural ice cores, we next apply the 1-D vertical column model to grain sizes measured in the GISP2 ice core (Gow et al., 1997) using the linear intercept method (Alley and Woods, 1996). For comparison to GISP2, we assume a column thickness of 3 km and the temperature profile of Clow et al. (1995, 1996), which varies from ∼ 241 K at the surface to 263 K at the bed. Stress is calculated using a constant ice density of 920 kg m−3 (Gow et al., 1997) and a surface slope of 0.11∘ (Hvidberg et al., 1997). We assume given the success in using these values to reproduce the Piazolo et al. (2013) experimental data.
One important caveat of the 1-D column models shown in Fig. 6 is that the timescale to reach a steady-state grain size, particularly in the shallow portion of the column where strain rates are small, may be greater than 104−5 years. Thus, to compare our model predictions with the ice core data, where the shallowest ice is the youngest ice, we use the time-dependent formulation in Eq. (13) and calculate grain size as a function of time at each depth assuming a fixed surface slope. The age of the ice at each depth is taken from Ram et al. (2000). Incorporating time dependence into our 1-D column calculations does not change the predicted grain sizes near the base of the column where the ice is sufficiently old for grain size to reach steady state. However, it significantly reduces grain sizes in the shallow part of the column, where the young ice does not have sufficient time to reach steady state (dotted curves, Fig. 7).
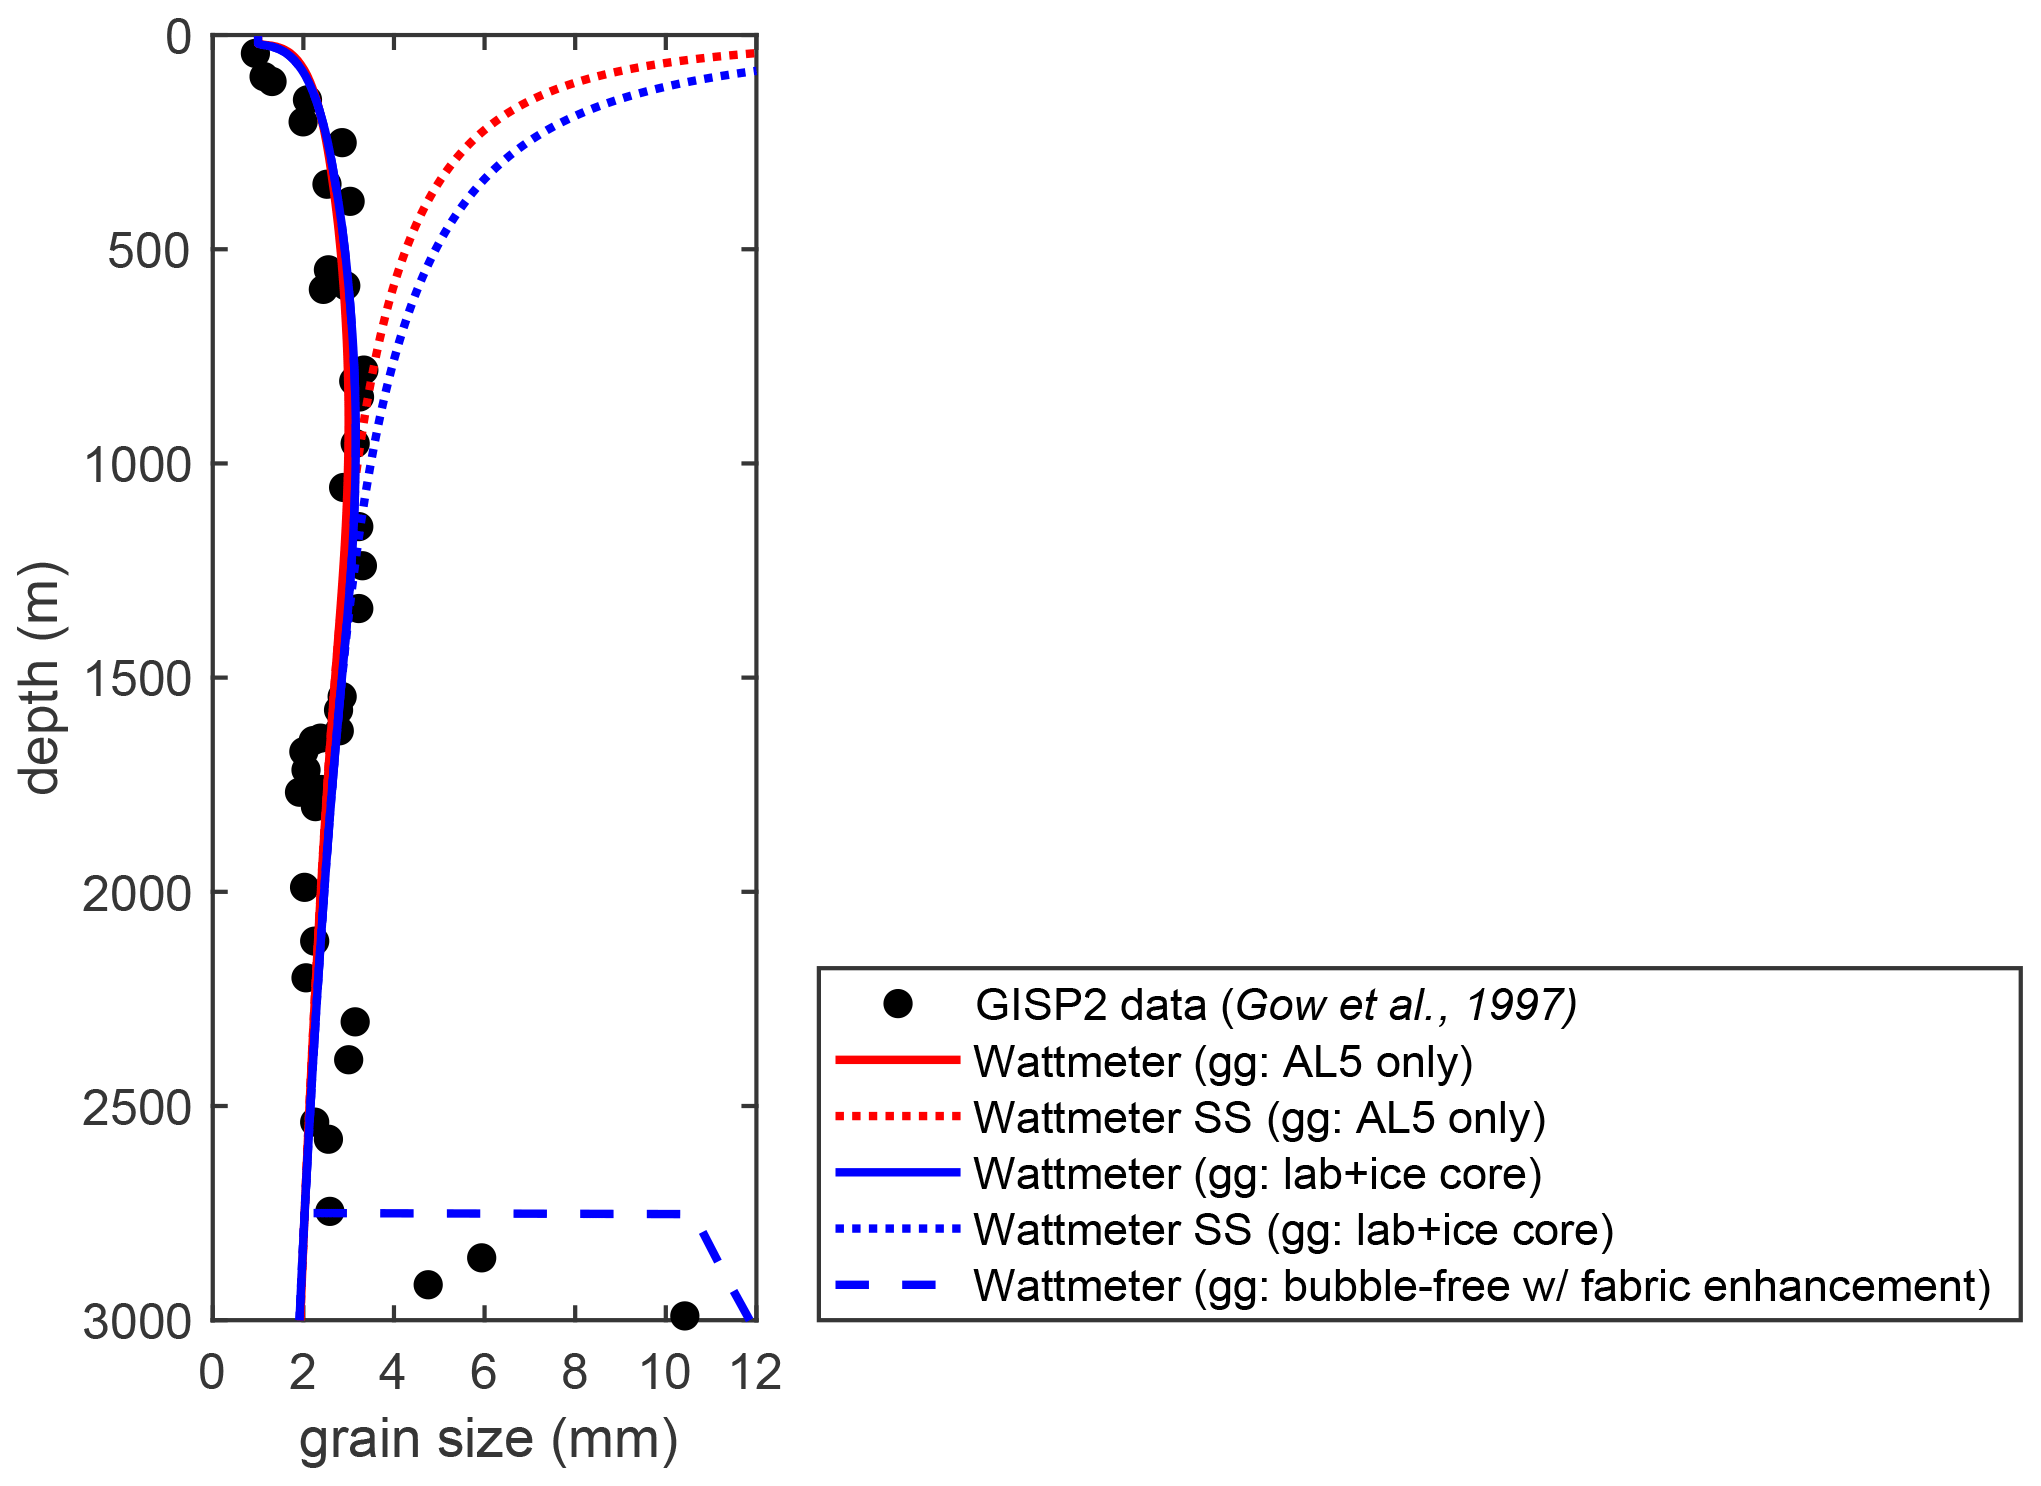
Figure 7Grain size calculated as a function of depth within the GISP2 ice core. Red and blue curves correspond to calculations using the grain growth parameters from Azuma et al. (2012) experiment AL5 and the joint fit of the experimental and ice core data, respectively. Solid curves show time-dependent grain size calculations; dashed curves are the steady-state grain size. The dashed curve shows the calculation in which we use the bubble-free grain growth parameters from Exp. 15 of Azuma et al. (2012) and enhance dislocation creep by a factor of 10 in the lowermost 200 m of ice. The enhancement in dislocation creep is meant to simulate the development of fabric in the basal ice. Black dots show observed grain sizes taken from Gow et al. (1997).
Overall, we find a good fit between the grain sizes predicted by the wattmeter and those recorded in the GISP2 ice core. Surface velocities predicted by the wattmeter (∼ 1 m yr−1) are also in agreement with those observed near the GISP2 site (Hvidberg et al., 1997). There is little sensitivity to using the grain growth parameters from the Azuma et al. (2012) AL5 experiment only (red curves, Fig. 7) versus the joint fit to all experiments and the ice core data (blue curves, Fig. 7). The one major deviation between the grain size predictions of the wattmeter and the observed grain sizes occurs at the very base of the core. In this region, observed grain sizes increase up to ∼ 10 mm at the bed, while the wattmeter predicts grain sizes that monotonically decrease to a value of ∼ 2 mm. These deviations are discussed in Sect. 4.2 below.
Grain size is a key microphysical property of ice, controlling not only its creep behavior but also its fracture toughness, melt permeability, and seismic attenuation and wave speeds. Thus, knowledge of its variability is critical to interpreting the physical properties and dynamic behavior of ice sheets and glaciers. The success of the wattmeter in predicting the grain sizes observed in both the Piazolo et al. (2013) shear zone experiments (Fig. 5) and the GISP2 ice core data (Fig. 7) provides a strong indication that the wattmeter captures the first-order physics of grain size evolution in ice. We emphasize that the fit of the model to these two very different systems is achieved using the same model parameters and requires no setting-specific tuning of the model. In the discussion below, we first consider the implications of grain size evolution in reconciling the laboratory creep data with the Glen law. Second, we explore the application of our model to the interpretation of grain size in ice core data. Finally, we discuss the implications of grain size evolution on strain enhancement and strain localization in ice sheets and glaciers.
4.1 Implications for the Glen law and the stress exponent in ice
As illustrated in both the steady-state shear zone models (Fig. 4b) and the simulations of a 1-D column of ice deforming due to a surface slope (Fig. 6b), the wattmeter results in an effective stress exponent that is intermediate between the lab-derived values for dislocation and GBS-limited creep and approaches the n = 3 value of the Glen law. To interpret these results, we reconsider the end-member cases of deformation accommodated solely by either dislocation or GBS-limited creep. In the dislocation creep regime, deformation is not sensitive to grain size (i.e., mdisl = 0 in Eq. 16), and we expect no difference in creep behavior or the effective stress exponent as a function of grain size. By contrast, in GBS-limited creep, strain rate is sensitive to both stress and grain size. Further, the steady-state grain size calculated by the wattmeter will vary as a function of stress and strain rate (Eq. 14). Thus, substituting the expression for steady-state grain size, dss in Eq. (14), into the flow law (Eq. 16) we find that strain rate can be related to stress through an effective stress exponent neff that is proportional to nGBS, mGBS, and the grain growth exponent p:
Using laboratory-determined values for nGBS and mGBS (Table 1) and the grain growth exponent fit by the laboratory and ice core data (p = 6.2), we find neff for GBS-limited creep is equal to ∼ 2.5. This value corresponds to the effective stress exponent calculated in the shear zone at low stress and strain rate (Fig. 4b) and is higher than the laboratory-derived value at a constant grain size.
We note that this expression for the effective stress exponent is only valid in the limit of steady-state grain size. Processes that limit a change of grain size in the GBS regime will result in a stress exponent closer to the lab-derived value. For example, some experiments have shown that grain growth may be limited during GBS creep (Goldsby and Kohlstedt, 2001; Caswell and Cooper, 2017); moreover, in natural ice impurities may also limit grain growth (e.g., Alley and Woods, 1996). Future experiments under different conditions (e.g., initial grain size, impurity and bubble distribution, deformation mechanism) are necessary to further constrain these effects on grain growth.
Comparison of the constant grain size shear zone models to those using the wattmeter shows that both predict a transition in the effective stress exponent near the field boundary at strain rates of 10−2 to 102 yr−1 (Fig. 4b). When grain size is fixed and does not evolve, neff varies from the lab-derived values for GBS (1.8) and dislocation creep (4) and only coincides with the Glen law (n = 3 ± 0.5) over a narrow range of strain rates (e.g., 3 × 10⁻¹–3 × 10⁻² yr−1 for a shear zone temperature of 240 K; Fig. 4b). By contrast, the variation in neff derived for steady-state grain size from the wattmeter varies less dramatically with strain rate and is within the range of 3 ± 0.5 for all strain rates found in natural systems. Thus, the stress dependence of grain size evolution, when coupled to the composite flow law (Eq. 15), provides an explanation for why the effective stress exponent in ice is consistent with the Glen law, even though neither dislocation nor GBS creep have stress exponents of ∼ 3.
Further, when grain size evolves according to the wattmeter, smaller values of the grain growth exponent p will result in larger values of neff (Eq. 21), which becomes infinite when p = (mGBS−1). For example, if p = 2 the effective stress exponent for GBS-limited creep becomes 4.25. In this scenario, neither dislocation creep nor GBS-limited creep would result in an effective stress exponent that is consistent with the Glen law value. As noted above, some observations support a stress exponent > 3 (Budd and Jacka, 1989; Cuffey and Kavanaugh, 2011). These data could be consistent with grain-size-insensitive dislocation creep or grain-size-sensitive creep with a p value around 2, similar to bubble-free ice (Azuma et al., 2012). However, with p = 2 the wattmeter underpredicts the grain size in the laboratory experiments and significantly overpredicts the grain size in the GISP2 ice core. This supports our application of the wattmeter using a p value consistent with the larger grain growth exponents inferred from bubble-rich experiments (Azuma et al., 2012). Intriguingly in the theoretical limit of grain growth in the presence of inclusions (p = 3–4; Evans et al., 2001) the effective stress exponent becomes 3.3–2.9 for steady-state grain size in the GBS regime.
Equation (21) can also be used to predict the effective stress exponent for creep in other geologic materials that undergo grain-size-sensitive creep and whose grain size evolution can be predicted by the wattmeter. For example, Hansen et al. (2012) found that at a constant grain size GBS creep in olivine is described by flow law parameters n = 4.1 and m = 0.73. However, in high-strain experiments when grain size evolution occurred, the effective stress exponent increased to n = 5. Plugging the constant grain size parameters for GBS creep into Eq. (21) and assuming a grain growth exponent of p = 3 for olivine (Karato, 1989), we calculate an effective stress exponent of neff = 5.1, consistent with the experimentally determined value from the Hansen et al. (2012) experiments. This provides additional evidence that the wattmeter can be used to capture the physics of grain-size-sensitive creep.
4.2 Implications for grain size in ice cores
Ice cores show three primary grain size regimes (e.g., Gow and Williamson, 1976; Herron and Langway, 1982; Thorsteinson et al., 1997): (1) a zone of increasing grain size in the upper several hundred meters of ice, (2) a region of relatively constant to slightly decreasing grain size at intermediate depths, and (3) a zone of rapidly increasing grain size near the bed. These variations have frequently been interpreted in terms of the tripartite paradigm or three-stage model (e.g., Alley, 1988, 1992; De la Chapelle et al., 1998), in which Regime 1 is associated with normal grain growth, Regime 2 reflects a balance between normal grain growth and polygonization, and Regime 3 is attributed to migration recrystallization. The later process reflects a combination of rapid grain boundary migration and the nucleation of new grains when temperatures exceed 263 K (Duval and Castelnau, 1995).
More recent studies (e.g., Faria et al., 2014a) have argued that the tripartite model may be an oversimplification, as other processes besides normal grain growth appear to be operating at shallow depths (Kipfstuhl et al., 2006, 2009). Faria et al. (2014a) refer to the process by which grains coarsen while simultaneously undergoing deformation as “dynamic grain growth”. The wattmeter inherently captures the balance between grain growth and grain size reduction, predicting grain sizes that vary continuously between Regimes 1 and 2. However, as noted above, the wattmeter does not explain the increase in grain size observed in Regime 3 near the base of the GISP2 core (Fig. 7) and other ice cores, such as Byrd (Gow and Williamson, 1976), GRIP (Thorsteinsson, et al., 1997), and Law dome (Li et al., 1998). The reason is that the higher stresses and higher strain rates near the bed promote grain size reduction, which dominates the temperature dependence of grain growth even as ice temperatures approach 263 K. One possible explanation for this discrepancy is that grain growth kinetics change as ice enters the pre-melting regime at temperatures > 263 K due to enhanced grain boundary mobility and the role of migration recrystallization in the formation of new grains (Duval and Castelnau, 1995; Hamann et al., 2007). Further, micro-particles on grain boundaries may become more mobile, possibly reducing their pinning effect and leading to enhanced grain growth (Evans et al., 2001).
As a simple test of this hypothesis, we substituted the bubble-free grain growth kinetics from Azuma et al. (2012) experiment T15 (conducted at 263 K) into the lowermost 200 m of our model for GISP2. The result is to increase grain sizes in the basal ice to ∼ 100 mm. This is approximately an order of magnitude greater than the maximum observed values. However, fabric development can lead to significant weakening in regions of high strain, such as near the bed. Approximating this weakening effect by multiplying the pre-exponential term in the dislocation creep law by an enhancement factor of 10 (Cuffey and Paterson, 2010) and using the bubble-free grain growth kinetics provides a good fit to the observations as shown by the dashed line in Fig. 7. While these results are suggestive, future work on grain growth kinetics in the pre-melting regime and the feedback between grain size evolution and strain rate enhancement due to fabric development is needed to fully explore these effects.
Another caveat of our predictions for grain size is that we have made no attempt to incorporate local-scale heterogeneities in impurity contents. The role of impurities is well known to influence grain size in ice cores on multiple spatial and temporal scales. At the centimeter scale, “forest-fire” bands characterized by high ammonium contents and low electrical conductivities are observed to correlate with local reductions in grain size (e.g., Alley and Woods, 1996). Major climatic transitions, such as that associated with the Holocene and Last Glacial Maximum (LGM), are also seen to correlate with variations in grain size (e.g., Duval and Lorius, 1980; Herron et al., 1985; Gow et al., 1997; Li et al., 1998) and zones of enhanced strain rate (e.g., Fisher and Koerner, 1986). Indeed, Durand et al. (2006) argue that grain growth pinned by a combination of dust, bubbles and clathrates is the dominant control on grain size variability in the Dome Concordia core. While incorporating heterogeneous impurity contents is beyond the immediate scope of this study, the wattmeter provides a framework to include such heterogeneities through the use of variable grain growth parameters tuned for different impurity contents. This further highlights the need for additional grain growth experiments under various impurity contents and temperature conditions.
4.3 Grain size evolution and the origin of enhancement factors to the Glen law
While the Glen law provides an excellent description of ice flow in many settings, certain systems are characterized by larger strain rates than predicted. In such cases, an ad hoc strain enhancement factor is often incorporated into the pre-exponential term of the Glen law to account for the combined effects of grain size, impurities, fabric development, and shear heating (see Cuffey and Paterson, 2010). For example, matching velocity profiles across ice streams (e.g., Echelmeyer et al., 1994; Jackson and Kamb, 1997) and through Pleistocene ice near the base of the Greenland ice sheet (Dahl-Jensen and Gunderstrup, 1987; Shoji and Langway, 1988; Lüthi et al., 2002; Ryser et al., 2014) often requires enhancement factors in the range of 2–10. Cuffey et al. (2000) attempted to quantify the role of grain size in the enhancement factor based on deformation recorded in Meserve Glacier, Antarctica. The grain size evolution model developed here provides additional constraints on the role of grain size in enhanced flow and strain localization in ice.
To illustrate this point, we model deformation within Drill Site D in fast-moving ice near Jakobshavn Isbrae in western Greenland (Iken et al., 1993; Lüthi et al., 2002). This site experiences surface velocities of ∼ 600 m yr−1, and tiltmeter data indicate enhanced strain rates in temperate ice below the Holocene–LGM transition near the bed. Lüthi et al. (2002) developed a thermomechanical model for deformation in the borehole and found that after incorporating the temperature dependence of ice viscosity, enhancement factors of 1.7–2.6 were required to match the observations in the pre-Holocene ice below 680 m. Although neither grain size nor impurity contents were measured in the Site D core, Lüthi et al. (2002) interpreted the enhanced strain rates to reflect smaller grain sizes associated with higher impurity contents below the Holocene–LGM transition.
In Fig. 8 we apply the wattmeter to model deformation with Site D using the same approach as for the GISP2 core (Sect. 3.3) assuming a surface slope of 2∘, an ice thickness of 830 m, downhole temperatures from Iken et al. (1993), and the age model of Lüthi et al. (2002). Calculated grain sizes vary from ∼ 2 mm near the surface to ∼ 0.5 mm near the bed (Fig. 8a). Comparing the corresponding strain rates to those calculated for a case using a constant grain size of 1 mm, we predicted enhancement factors of 1.9–2.5 in ice below ∼ 700 m depth (Fig. 8c). Further, while there are no constraints on grain size for direct comparison, the surface velocity calculated from our model compares favorably with those observed at the Site D location (Fig. 8b). Thus, without invoking additional pinning effects beyond those incorporated in the grain growth exponents extrapolated from the laboratory and GRIP ice core data (Fig. 2), the wattmeter provides a good match to the available observations.
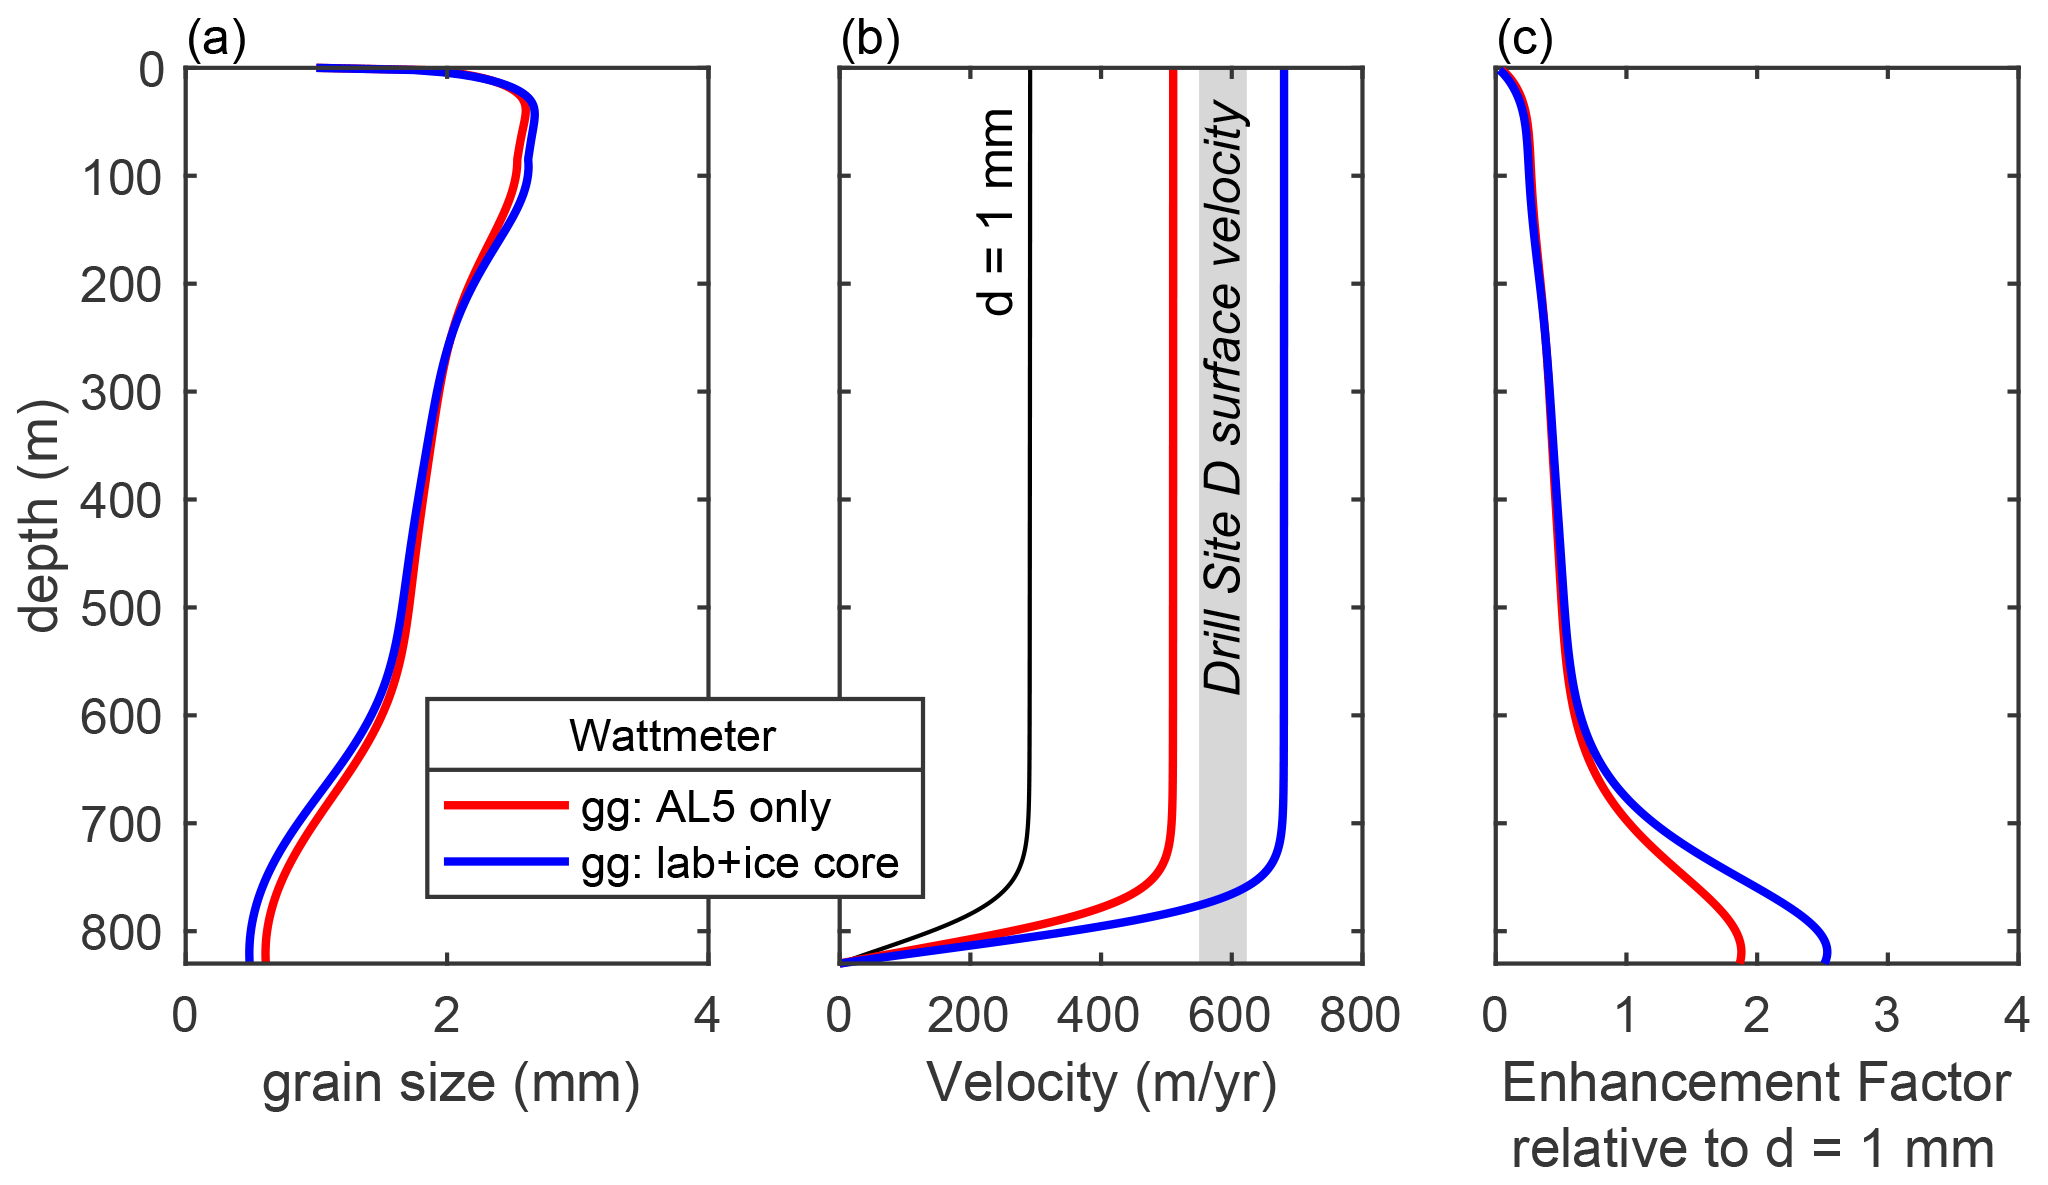
Figure 8(a) Grain size, (b) velocity, and (c) strain rate enhancement factor calculated as a function of depth for Drill Site D (Lüthi et al., 2002). Red and blue curves correspond to calculations using the grain growth parameters from Azuma et al. (2012) experiment AL5 and the joint fit of the experimental and ice core data, respectively. The black curve in panel (b) corresponds to a case with a constant grain size of 1 mm. Enhancement factor is calculated as the ratio of the strain rate determined by the wattmeter to the strain rate calculated assuming a constant grain size of 1 mm.
We stress that these results are not meant to imply that elevated impurity contents have no influence on grain size and deformation rates but simply that first-order variations in these parameters are successfully captured by the wattmeter. Moreover, the enhanced strain rates associated with grain size reduction illustrate the potential importance of grain size evolution on strain localization. Indeed, the extreme strain localization in ice stream margins (e.g., Harrison et al., 1998) may be partially accommodated by grain size reduction, in combination with shear heating (e.g., Suckale et al., 2014; Perol and Rice, 2015). Further, the development of crystal fabric in the shear plane will weaken ice (Duval et al., 1983), resulting in a larger strain rate for the same stress. In the 1-D ice column models, stress is fixed by the surface slope, resulting in a positive feedback in which enhanced fabric development will drive further grain size reduction (due to the enhanced work rate). Future studies that simultaneously measure deformation, grain size, crystal fabric, and impurity contents – ideally in regions of high strain rates – will be critical to improving coupled models of deformation and grain size evolution in ice sheets and glaciers.
We used the wattmeter (Austin and Evans, 2007, 2009) to calculate the balance between the mechanical work required for grain growth and for dynamic grain size reduction. Combining the wattmeter with a composite flow law for dislocation and GBS creep, we developed a system of coupled equations that can be used to predict grain size evolution in terms of temperature, stress, and strain rate. Applying this methodology to grain sizes recorded in laboratory shear deformation experiments and the GISP2 borehole, we show that this approach successfully predicts grain size over a wide range of conditions.
When grain size evolution is accounted for using the wattmeter, we find that ice deforms with an effective stress exponent of n = 3.0 ± 0.5 at most natural conditions. This provides an explanation for the long-standing paradox of why the Glen law so successfully describes flow in glaciers and ice sheets, even though laboratory experiments show that neither dislocation creep nor GBS creep have stress exponents consistent with n = 3. Further, the wattmeter provides a framework for interpreting settings where the observed stress exponent is either higher or lower than 3, reflecting deformation conditions favoring dislocation or GBS creep, respectively. Additionally, grain size variations driven by local deformation conditions can cause strain rate enhancement in regions where the Glen law alone cannot explain observed variations in ice flow. In conclusion, the coupling of grain size evolution and grain-size-sensitive creep provides a potentially powerful tool for understanding strain localization and the effective stress exponent in ice, as well as other geologic materials.
MATLAB® code to reproduce the model runs in this study is provided as a Supplement.
GISP2 and GRIP ice core data are available at https://doi.org/10.1594/PANGAEA.870454 (GRIP Members, 2017). Grain growth data were taken from Table 2 of Azuma et al. (2012); ice deformation data were digitized from Fig. 3 of Piazolo et al. (2014).
The supplement related to this article is available online at: https://doi.org/10.5194/tc-15-4589-2021-supplement.
All authors participated in the formulation of the grain size evolution model for ice. MDB developed the model code and performed the simulations. DLG and GH assisted in the interpretation of the model results. MDB prepared the manuscript with contributions from all co-authors.
The authors declare that they have no conflict of interest.
Publisher’s note: Copernicus Publications remains neutral with regard to jurisdictional claims in published maps and institutional affiliations.
We thank Andrew Cross for suggestions on an earlier version of this paper and Josh Rines, Ludovic Räss, and Thibault Duretz for a careful reading of our paper and code. Thoughtful reviews by Paul Bons, the anonymous reviewer, and the editor Carlos Martin greatly improved this study.
This research was supported by the National Science Foundation (grant nos. OPP-18-38410, EAR-16-6524109, and EAR-16-24178) and the NASA Solar System Workings program (grant no. NNX15AM69G).
This paper was edited by Carlos Martin and reviewed by Paul D. Bons and one anonymous referee.
Alley, R.: Flow-law hypotheses for ice-sheet modeling, J. Glaciol., 38, 245–256, https://doi.org/10.3189/S0022143000003658, 1992.
Alley, R., Perepezko, H., and Bentley, C.: Grain growth in polar ice: 1. Theory, J. Glaciol., 32, 415–424, https://doi.org/10.3189/S0022143000012120, 1986.
Alley, R. B.: Fabrics in Polar Ice Sheets: Development and Prediction, Science, 240, 493–495, https://doi.org/10.1126/science.240.4851.493, 1988.
Alley, R. B. and Woods, G. A.: Impurity influence on normal grain growth in the GISP2 ice core, Greenland, J. Glaciol., 42, 255–260, https://doi.org/10.3189/S0022143000004111, 1996.
Alley, R. B., Gow, A. J., and Meese, D. A.: Instruments and Methods Mapping c-axis fabrics to study physical processes in ice, J. Glaciol., 41, 197–203, https://doi.org/10.1017/S0022143000017895, 1995.
Arena, L., Nasello, O. B., and Levi, L.: Effect of Bubbles on Grain Growth in Ice, J. Phys. Chem. B, 101, 6109–6112, 1997.
Austin, N. and Evans, B.: The kinetics of microstructural evolution during deformation of calcite, J. Geophys. Res., 114, B09402, https://doi.org/10.1029/2008JB006138, 2009.
Austin, N. J. and Evans, B.: Paleowattmeters: A scaling relation for dynamically recrystallized grain size, Geol., 35, 343, https://doi.org/10.1130/G23244A.1, 2007.
Azuma, N. and Higashi, A.: Effects of the hydrostatic pressure on the rate of grain growth in Antarctic polycrystalline ice, J. Phys. Chem., 87, 4060–4064, https://doi.org/10.1021/j100244a012, 1983.
Azuma, N., Miyakoshi, T., Yokoyama, S., and Takata, M.: Impeding effect of air bubbles on normal grain growth of ice, J. Struc. Geol., 42, 184–193, https://doi.org/10.1016/j.jsg.2012.05.005, 2012.
Barnes, P., Tabor, D., and Walker, J. C. F.: The Friction and Creep of Polycrystalline Ice, P. Roy. Soc. Lond. A Mat., 324, 127–155, https://doi.org/10.1098/rspa.1971.0132, 1971.
Barr, A. C. and McKinnon, W. B.: Convection in ice I shells and mantles with self-consistent grain size, J. Geophys. Res., 112, E02012, https://doi.org/10.1029/2006JE002781, 2007.
Bercovici, D. and Ricard, Y.: Mechanisms for the generation of plate tectonics by two-phase grain-damage and pinning, Phys. Earth Planet. Int., 202–203, 27–55, https://doi.org/10.1016/j.pepi.2012.05.003, 2012.
Bercovici, D. and Ricard, Y.: Plate tectonics, damage and inheritance, Nature, 508, 513–516, https://doi.org/10.1038/nature13072, 2014.
Bons, P. D., Jessell, Mark. W., Evans, L., Barr, T., and Stüwe, K.: Modeling of anisotropic grain growth in minerals, in: Tectonic Modeling: A Volume in Honor of Hans Ramberg, Geological Society of America, Boulder, Colorado, 2001.
Budd, W. F. and Jacka, T. H.: A review of ice rheology for ice sheet modelling, Cold Reg. Sci. Technol., 16, 107–144, 1989.
Caswell, T. E. and Cooper, R. F.: Grain size evolution in icy satellites, New experimental constraints, Lunar Planet. Sci. Conf., 47, p. 2000, The Woodlands, Texas, 20–24 March 2017.
Clow, G. D., Saltus, R. W., and Waddington, E. D.: High-precision temperature logging at GISP2, Greenland, May 1992, U.S. Geological Survey Open File Report 95-490, 1995.
Clow, G. D., Saltus, R. W., and Waddington, E. D.: A new high-precision borehole-temperature logging system used at GISP2, Greenland, and Taylor Dome, Antarctica, J. Glaciol., 42, 576–584, 1996.
Cuffey, K. M.: Manifestations of Ice Microphysical Processes at the Scale of Whole Ice Sheets, in: Glacier Science and Environmental Change, edited by: Knight, P. G., Blackwell Publishing, Malden, MA, USA, 2006.
Cuffey, K. M. and Kavanaugh, J. L.: How nonlinear is the creep deformation of polar ice? A new field assessment, Geology, 39, 1027–1030, 2011.
Cuffey, K. M. and Paterson, W. S. B.: Physics of Glaciers, 4th edn., Elsevier, Amsterdam, the Netherlands, 2010.
Cuffey, K. M., Thorsteinsson, T., and Waddington, E. D.: A renewed argument for crystal size control of ice sheet strain rates, J. Geophys. Res., 105, 27889–27894, https://doi.org/10.1029/2000JB900270, 2000.
Dahl-Jensen, D. and Gundestrup, N. S.: Constitutive properties of ice at Dye 3, Greenland, in: The Physical Basis of Ice Sheet Modelling (Proceedings of the Vancouver Symposium, August 1987), IAHS Publ. no. 170, Washington, DC, USA, 31–43, 1987
Dansgaard, W., Johnsen, S. J., Clausen, H. B., Dahl-Jensen, D., Gundestrup, N. S., Hammer, C. U., Hvidberg, C. S., Steffensen, J. P., Sveinbjörnsdottir, A. E., Jouzel, J., and Bond, G.: Evidence for general instability of past climate from a 250-kyr ice-core record, Nature, 364, 218–220, https://doi.org/10.1038/364218a0, 1993.
de Bresser, J., Ter Heege, J., and Spiers, C.: Grain size reduction by dynamic recrystallization: can it result in major rheological weakening?, Int. J. Earth Sci., 90, 28–45, https://doi.org/10.1007/s005310000149, 2001.
De La Chapelle, S., Castelnau, O., Lipenkov, V., and Duval, P.: Dynamic recrystallization and texture development in ice as revealed by the study of deep ice cores in Antarctica and Greenland, J. Geophys. Res., 103, 5091–5105, https://doi.org/10.1029/97JB02621, 1998.
Durand, G., Weiss, J., Lipenkov, V., Barnola, J., Krinner, G., Parrenin, F., Delmonte, B., Ritz, C., Duval, P., and Röthlisberger, R.: Effect of impurities on grain growth in cold ice sheets, J. Geophys. Res., 111, F01015, https://doi.org/10.1029/2005JF000320, 2006.
Durham, W. and Stern, L.: Rheological Properties of Water Ice – Applications to Satellites of the Outer Planets, Annu. Rev. Earth Planet. Sci., 29, 295–330, https://doi.org/10.1146/annurev.earth.29.1.295, 2001.
Durham, W. B., Stern, L. A., and Kirby, S. H.: Rheology of ice I at low stress and elevated confining pressure, J. Geophys. Res., 106, 11031–11042, https://doi.org/10.1029/2000JB900446, 2001.
Duval, P. and Castelnau, O.: Dynamic Recrystallization of Ice in Polar Ice Sheets, J. Phys. IV, 05, C3-197–C3-205, https://doi.org/10.1051/jp4:1995317, 1995.
Duval, P. and Lorius, C.: Crystal size and climatic record down to the last ice age from Antarctic ice, Earth Planet. Sci. Lett., 48, 59–64, https://doi.org/10.1016/0012-821X(80)90170-3, 1980.
Duval, P., Ashby, M. F., and Andermant, I.: Rate-controlling processes in the creep of polycrystalline ice, J. Phys. Chem., 87, 4066–4074, https://doi.org/10.1021/j100244a014, 1983.
Echelmeyer, K. A., Harrison, W. D., Larsen, C., and Mitchell, J. E.: The role of the margins in the dynamics of an active ice stream, J. Glaciol., 40, 527–538, https://doi.org/10.3189/S0022143000012417, 1994.
Evans, B., Renner, J., and Hirth, G.: A few remarks on the kinetics of static grain growth in rocks, Int. J. Earth Sci., 90, 88–103, https://doi.org/10.1007/s005310000150, 2001.
Faria, S. H., Weikusat, I., and Azuma, N.: The microstructure of polar ice. Part I: Highlights from ice core research, J. Struc. Geol., 61, 2–20, https://doi.org/10.1016/j.jsg.2013.09.010, 2014a.
Faria, S. H., Weikusat, I., and Azuma, N.: The microstructure of polar ice. Part II: State of the art, J. Struc. Geol., 61, 21–49, https://doi.org/10.1016/j.jsg.2013.11.003, 2014b.
Fisher, D. A. and Koerner, R. M.: On the special rheological properties of ancient microparticle-laden northern hemisphere ice as derived from bore-hole and core measurements, J. Glaciol., 32, 501–510, https://doi.org/10.3189/S0022143000012211, 1986.
Gifkens, R. C.: Optical Microscopy of Metals, American Elsevier, New York, USA, 208 pp., 1970.
Glen, J. W.: Experiments on the Deformation of Ice, J. Glaciol., 2, 111–114, https://doi.org/10.3189/S0022143000034067, 1952.
Glen, J. W.: The creep of polycrystalline ice, Proceedings of the Royal Academy of London Series A, 228, 519–538, https://doi.org/10.1098/rspa.1955.0066, 1955.
Goldsby, D. L.: Superplastic Flow of Ice Relevant to Glacier and Ice-Sheet Mechanics, in: Glacier Science and Environmental Change, edited by: Knight, P. G., Blackwell Publishing, Malden, MA, USA, 308–314, 2006.
Goldsby, D. L. and Kohlstedt, D.: Superplasticdeformation of ice: Experimental observations, J. Geophys. Res., 106, 11017–11030, https://doi.org/10.1029/2000JB900336, 2001.
Gow, A. J.: On the rate of growth of grains and crystals in south polar firn, J. Glaciol., 8, 241–252, 1969.
Gow, A. J. and Williamson, T.: Rheological implications of the internal structure and crystal fabrics of the West Antarctic ice sheet as revealed by deep core drilling at Byrd Station, GSA Bull., 87, 1665–1677, https://doi.org/10.1130/0016-7606(1976)87<1665:RIOTIS>2.0.CO;2, 1976.
Gow, A. J., Meese, D. A., Alley, R. B., Fitzpatrick, J. J., Anandakrishnan, S., Woods, G. A., and Elder, B. C.: Physical and structural properties of the Greenland Ice Sheet Project 2 ice core: A review, J. Geophys. Res., 102, 26559–26575, https://doi.org/10.1029/97JC00165, 1997.
GRIP/GISP; GRIP Members: Greenland Summit Ice Cores CD-ROM as zip-archive, PANGAEA [data set], https://doi.org/10.1594/PANGAEA.870454, 2017.
Hall, C. E. and Parmentier, E. M.: Influence of grain size evolution on convective instability, Geochem. Geophys. Geosys., 4, 1029, https://doi.org/10.1029/2002GC000308, 2003.
Hamann, I., Weikusat, C., Azuma, N., and Kipfstuhl, S.: Evolution of ice crystal microstructure during creep experiments, J. Glaciol., 53, 479–489, https://doi.org/10.3189/002214307783258341, 2007.
Hamley, T. C., Smith, I. N., and Young, N. W.: Mass–Balance and Ice–Flow–Law Parameters for East Antarctica, J. Glaciol., 31, 334–339, https://doi.org/10.3189/S0022143000006675, 1985.
Hansen, L. N., Zimmerman, M. E., and Kohlstedt, D. L.: The influence of microstructure on deformation of olivine in the grain-boundary sliding regime, J. Geophys. Res., 117, B09201, https://doi.org/10.1029/2012JB009305, 2012.
Harrison, W. D., Echelmeyer, K. A., and Larsen, C. F.: Measurement of temperature in a margin of Ice Stream B, Antarctica: implications for margin migration and lateral drag, J. Glaciol., 44, 615–624, https://doi.org/10.3189/S0022143000002112, 1998.
Herron, M. M. and Langway, C. C. J.: Chloride, nitrate, and sulfate in the Dye 3 and Camp Century, Greenland ice cores, Geophys. Monog. Ser., 33, 77–84, https://doi.org/10.1029/GM033p0077, 1985.
Herron, S. L., Langway, C. C., and Brugger, K. A.: Ultrasonic velocities and crystalline anisotropy in the ice core from Dye 3, Greenland, in: Geophysical Monograph Series, edited by: Langway, C. C., Oeschger, H., and Dansgaard, W., American Geophysical Union, Washington, DC, USA, vol. 33, 23–31, 1985.
Holtzman, B. K., Chrysochoos, A., and Daridon, L.: A thermodynamical framework for analysis of microstructural evolution: Application to olivine rocks at high temperature, J. Geophys. Res.-Sol. Ea., 123, 8474–8507, https://doi.org/10.1029/2018JB015613, 2018.
Hvidberg, C. S., Dahl-Jensen, D., and Waddington, E. D.: Ice flow between the Greenland Ice Core Project and Greenland Ice Sheet Project 2 boreholes in central Greenland, J. Geophys. Res., 102, 26851–26859, https://doi.org/10.1029/97JC00268, 1997.
Iken, A., Echelmeyer, K., Harrison, W., and Funk, M.: Mechanisms of fast flow in Jakobshavns Isbræ, West Greenland. I: Measurements of temperature and water level in deep boreholes, J. Glaciol., 39, 15–25, https://doi.org/10.3189/S0022143000015689, 1993.
Jacka, T. H. and Li, J.: The steady-state crystal size of deforming ice, Ann. Glaciol., 20, 13–18, https://doi.org/10.3189/1994AoG20-1-13-18, 1994.
Jackson, M. and Kamb, B.: The marginal shear stress of Ice Stream B, West Antarctica, J. Glaciol., 43, 415–426, https://doi.org/10.3189/S0022143000035000, 1997.
Jezek, K. C., Alley, R. B., and Thomas, R. H.: Rheology of glacier ice, Science, 227, 1335–1338, https://doi.org/10.1126/science.227.4692.1335, 1985.
Karato, S.-I.: Grain growth kinetics in olivine aggregates, Tectonophys., 168, 255–273, https://doi.org/10.1016/0040-1951(89)90221-7, 1989.
Karato, S.-I., Paterson, M. S., and FitzGerald, J. D.: Rheology of synthetic olivine aggregates: Influence of grain size and water, J. Geophys. Res., 91, 8151–8176, https://doi.org/10.1029/JB091iB08p08151, 1986.
Kipfstuhl, S., Hamann, I., Lambrecht, A., Freitag, J., Faria, S. H., Grigoriev, D., and Azuma, N.: Microstructure mapping: a new method for imaging deformation-induced microstructural features of ice on the grain scale, J. Glaciol., 52, 398–406, https://doi.org/10.3189/172756506781828647, 2006.
Kipfstuhl, S., Faria, S. H., Azuma, N., Freitag, J., Hamann, I., Kaufmann, P., Miller, H., Weiler, K., and Wilhelms, F.: Evidence of dynamic recrystallization in polar firn, J. Geophys. Res., 114, B05204, https://doi.org/10.1029/2008JB005583, 2009.
Kuiper, E.-J. N., Weikusat, I., de Bresser, J. H. P., Jansen, D., Pennock, G. M., and Drury, M. R.: Using a composite flow law to model deformation in the NEEM deep ice core, Greenland – Part 1: The role of grain size and grain size distribution on deformation of the upper 2207 m, The Cryosphere, 14, 2429–2448, https://doi.org/10.5194/tc-14-2429-2020, 2020.
Langdon, T. G.: A unified approach to grain boundary sliding in creep and superplasticity, Acta Metall. Mater., 42, 2437–2443, https://doi.org/10.1016/0956-7151(94)90322-0, 1994.
Li, J., Jacka, T. H., and Morgan, V.: Crystal-size and microparticle record in the ice core from Dome Summit South, Law Dome, East Antarctica, Ann. Glaciol., 27, 343–348, https://doi.org/10.3189/1998AoG27-1-343-348, 1998.
Lüthi, M., Funk, M., Iken, A., Gogineni, S., and Truffer, M.: Mechanisms of fast flow in Jakobshavn Isbræ, West Greenland: Part III. Measurements of ice deformation, temperature and cross-borehole conductivity in boreholes to the bedrock, J. Glaciol., 48, 369–385, https://doi.org/10.3189/172756502781831322, 2002.
Martin, P. J. and Sanderson, T. J. O.: Morphology and Dynamics of Ice Rises, J. Glaciol., 25, 33–46, https://doi.org/10.3189/S0022143000010261, 1980.
Mellor, M. and Smith, J. H.: Creep of snow and ice, CRREL Res. Rep., 220, 13 pp., 1966.
Montagnat, M. and Duval, P.: Rate controlling processes in the creep of polar ice, influence of grain boundary migration associated with recrystallization, Lithos, 183, 179–186, https://doi.org/10.1016/S0012-821X(00)00262-4, 2000.
Montagnat, M. and Duval, P.: The viscoplastic behaviour of ice in polar ice sheets: experimental results and modelling, C. R. Phys., 5, 699–708, https://doi.org/10.1016/j.crhy.2004.06.002, 2004.
Montési, L. G. J., and Hirth, G.: Grain size evolution and the rheology of ductile shear zones: from laboratory experiments to postseismic creep, Earth Planet. Sci. Lett., 211, 97–110, https://doi.org/10.1016/S0012-821X(03)00196-1, 2003.
Ng, F. and Jacka, T. H.: A model of crystal-size evolution in polar ice masses, J. Glaciol., 60, 463–477, https://doi.org/10.3189/2014JoG13J173, 2017.
Nieh, T. G., Wadsworth, J., and Sherby, O. D.: Superplasticity in Metals and Ceramics, 1st edn., Cambridge University Press, New York, USA, 1997.
Paterson, W. S. B.: Deformation within polar ice sheets: An analysis of the Byrd Station and Camp Century borehole-tilting measurements, Cold Reg. Sci. Tech., 8, 165–179, https://doi.org/10.1016/0165-232X(83)90007-1, 1983.
Peltier, W. R., Goldsby, D. L., Kohlstedt, D. L., and Tarasov, L.: Ice-age ice-sheet rheology: constraints from the Last Glacial Maximum form of the Laurentide ice sheet, Ann. Glaciol., 30, 163–176, https://doi.org/10.3189/172756400781820859, 2000.
Perol, T. and Rice, J. R.: Shear heating and weakening of the margins of West Antarctic ice streams, Geophys. Res. Lett., 42, 3406–3413, https://doi.org/10.1002/2015GL063638, 2015.
Piazolo, S., Wilson, C. J. L., Luzin, V., Brouzet, C., and Peternell, M.: Dynamics of ice mass deformation: Linking processes to rheology, texture, and microstructure, Geochem. Geophys. Geosys., 14, 4185–4194, https://doi.org/10.1002/ggge.20246, 2013.
Pimienta, P., Duval, P., and Lipenkov, V.: Mechanical behavior of anisotropic polar ice, in: The Physical Basis of Ice Sheet Modelling (Proceedings of the Vancouver Symposium, August 1987), IAHS Publ. no. 170, Washington, DC, USA, 57–66, 1987.
Poirier, J.-P.: Creep of Crystals: High-Temperature Deformation Processes in Metals, Ceramics and Minerals, 1st edn., Cambridge University Press, New York, USA, 1985.
Ram, M., Donarummo, J., Stolz, M. R., and Koenig, G.: Calibration of laser-light scattering measurements of dust concentration for Wisconsinan GISP2 ice using instrumental neutron activation analysis of aluminum: Results and discussion, J. Geophys. Res., 105, 24731–24738, https://doi.org/10.1029/2000JD900321, 2000.
Raymond, C. F.: Inversion of flow Measurements for Stress and Rheological Parameters in a Valley Glacier, J. Glaciol., 12, 19–44, https://doi.org/10.1017/S0022143000022681, 1973.
Raymond, C. F.: Temperate Valley Glaciers, in: Dynamics of Snow and Ice Masses, Academic Press Inc., New York, USA, 79–139, 1980.
Roessiger, J., Bons, P. D., Griera, A., Jessell, M. W., Evans, L., Montagnat, M., Kipfstuhl, S., Faria, S. H., and Weikusat, I.: Competition between grain growth and grain-size reduction in polar ice, J. Glaciol., 57, 942–948, https://doi.org/10.3189/002214311798043690, 2011.
Roessiger, J., Bons, P. D., and Faria, S. H.: Influence of bubbles on grain growth in ice, J. Struct. Geol., 61, 123–132, 2014.
Ryser, C., Lüthi, M. P., Andrews, L. C., Hoffman, M. J., Catania, G. A., Hawley, R. L., Neumann, T. A., and Kristensen, S. S.: Sustained high basal motion of the Greenland ice sheet revealed by borehole deformation, J. Glaciol., 60, 647–660, https://doi.org/10.3189/2014JoG13J196, 2014.
Shoji, H. and Langway, C. C.: Flow-Law Parameters of the Dye 3, Greenland, Deep Ice Core, Ann. Glaciol., 10, 146–150, https://doi.org/10.3189/S026030550000433X, 1988.
Steinemann, S.: Experimentelle Untersuchungen zur Plastizität von Eis, Application/pdf, ETH Zurich, https://doi.org/10.3929/ETHZ-A-000096707, 1958.
Suckale, J., Platt, J. D., Perol, T., and Rice, J. R.: Deformation‐induced melting in the margins of the West Antarctic ice streams, J. Geophys. Res.-Earth, 119, 1004–1025, 2014.
Thomas, R. H.: The Creep of Ice Shelves: Interpretation of Observed Behaviour, J. Glaciol., 12, 55–70, https://doi.org/10.1017/S002214300002270X, 1973.
Thorsteinsson, T., Kipfstuhl, J., and Miller, H.: Textures and fabrics in the GRIP ice core, J. Geophys. Res., 102, 26583–26599, https://doi.org/10.1029/97JC00161, 1997.
Tokle, L. and Hirth, G.: Assessment of quartz grain growth and the application of the wattmeter to predict recrystallized grain sizes, J. Geophys. Res., 126, e2020JB021475, https://doi.org/10.1029/2020JB021475, 2021.
Weertman, J.: Creep deformation of ice, Ann. Rev. Earth Planet. Sci., 11, 215–240, https://doi.org/10.1146/annurev.ea.11.050183.001243, 1983.
Young, N. W., Goodwin, I. D., and Hazelton, N.: Measured velocities and ice flow in Wilkes Land, Antarctica, Ann. Glaciol., 12, 192–197, https://doi.org/10.3189/S0260305500007187, 1989.