the Creative Commons Attribution 4.0 License.
the Creative Commons Attribution 4.0 License.
 | 22 Jul 2021
Lateral thermokarst patterns in permafrost peat plateaus in northern Norway
Léo C. P. Martin
Jan Nitzbon
Johanna Scheer
Kjetil S. Aas
Trond Eiken
Moritz Langer
Simon Filhol
Bernd Etzelmüller
Sebastian Westermann
Subarctic peatlands underlain by permafrost contain significant amounts of organic carbon. Our ability to quantify the evolution of such permafrost landscapes in numerical models is critical for providing robust predictions of the environmental and climatic changes to come. Yet, the accuracy of large-scale predictions has so far been hampered by small-scale physical processes that create a high spatial variability of thermal surface conditions, affecting the ground thermal regime and thus permafrost degradation patterns. In this regard, a better understanding of the small-scale interplay between microtopography and lateral fluxes of heat, water and snow can be achieved by field monitoring and process-based numerical modeling. Here, we quantify the topographic changes of the Šuoššjávri peat plateau (northern Norway) over a three-year period using drone-based repeat high-resolution photogrammetry. Our results show thermokarst degradation is concentrated on the edges of the plateau, representing 77 % of observed subsidence, while most of the inner plateau surface exhibits no detectable subsidence. Based on detailed investigation of eight zones of the plateau edge, we show that this edge degradation corresponds to an annual volume change of 0.13±0.07 m3 yr−1 per meter of retreating edge (orthogonal to the retreat direction).
Using the CryoGrid3 land surface model, we show that these degradation patterns can be reproduced in a modeling framework that implements lateral redistribution of snow, subsurface water and heat, as well as ground subsidence due to melting of excess ice. By performing a sensitivity test for snow depths on the plateau under steady-state climate forcing, we obtain a threshold behavior for the start of edge degradation. Small snow depth variations (from 0 to 30 cm) result in highly different degradation behavior, from stability to fast degradation. For plateau snow depths in the range of field measurements, the simulated annual volume changes are broadly in agreement with the results of the drone survey. As snow depths are clearly correlated with ground surface temperatures, our results indicate that the approach can potentially be used to simulate climate-driven dynamics of edge degradation observed at our study site and other peat plateaus worldwide. Thus, the model approach represents a first step towards simulating climate-driven landscape development through thermokarst in permafrost peatlands.
- Article
(12273 KB) - Full-text XML
-
Supplement
(25796 KB) - BibTeX
- EndNote


Observations show that permafrost is warming at a global scale (Biskaborn et al., 2019). Its thawing has major consequences on arctic and boreal ecosystems and landscapes (Beck et al., 2015; Farquharson et al., 2019; Liljedahl et al., 2016) and potentially represents an important climate feedback through the decomposition of thawed organic matter (Koven et al., 2015; Schuur et al., 2009, 2015). Carbon emissions from permafrost regions towards the atmosphere are already observed (Natali et al., 2019); field measurements show that these emissions are influenced by the timing of the active layer deepening (Morgalev et al., 2017) and by the state of degradation of the permafrost terrains (Langer et al., 2015; Nwaishi et al., 2020; Serikova et al., 2018). In particular, abrupt thawing of ice-rich permafrost is expected to become a significant factor for carbon emissions, potentially offsetting the negative feedback by increased ecosystem productivity that is expected for gradual thaw (McGuire et al., 2018; Turetsky et al., 2020).
As such, our ability to quantify and represent the physical evolution of permafrost landscapes is critical to provide robust predictions of the environmental and climatic changes to come (Aas et al., 2019; Andresen et al., 2020; Teufel and Sushama, 2019). While permafrost affects about 14 million square kilometers in the Northern Hemisphere (Obu et al., 2019), the ground thermal response to climatic signal and morphological changes of permafrost are governed by processes occurring within a spatial scale of a few meters (Gisnås et al., 2014; Jones et al., 2016; Martin et al., 2019; Way et al., 2018). Indeed, lowland permafrost landscapes (such as peat plateaus and polygonal tundra) are characterized by low amplitude (0–3 m vertically) and high frequency (10–100 m horizontally) spatial variations of their topography, often referred to as microtopography (French, 2018). This microtopography drives the lateral redistribution of snow, liquid water and heat, which can dramatically modify the ground thermal regime and water content (Martin et al., 2019). In many cases, the microtopography results from the presence of excess ice in the ground, i.e., the volume of ice that exceeds the total pore volume that the ground would have under unfrozen conditions (NSIDC glossary), so permafrost thawing results in surface subsidence (“thermokarst”; Göckede et al., 2017, 2019; Nitzbon et al., 2019, 2020). In models, the representation of this feedback between small-scale fluxes and dynamical topography is still in its infancy and large-scale permafrost modeling studies usually lack these processes (Park et al., 2015). Robust predictions of the physical state of permafrost landscapes thus require further field observations and model development to improve our understanding of these phenomena.
Peat plateaus are permafrost landforms covering extensive regions throughout the boreal and arctic realms that store nearly 200 Pg of carbon (Lindgren et al., 2018). They are mainly located in the sporadic permafrost zone (Seppälä, 1972; Sollid and Sørbel, 1998) and are typically associated with a climatic envelope characterized by a mean annual ground temperature around 0 ∘C and precipitation below 800 mm yr−1 (Aalto et al., 2017; Parviainen and Luoto, 2007). Thus, permafrost underneath peat plateaus is relatively warm and its distribution is highly sensitive to climate changes (Aalto et al., 2014, 2017; Fronzek et al., 2010; Luoto et al., 2004). The limit of continuous and discontinuous permafrost in the Northern Hemisphere is already moving northward (Thibault and Payette, 2009) and peat plateau degradation is observed in North America (Jones et al., 2016; Mamet et al., 2017; Payette et al., 2004), Fennoscandia (Borge et al., 2017; Sannel and Kuhry, 2011) and western Siberia (Jones et al., 2016; Sherstyukov and Sherstyukov, 2015). In northern Norway, the analysis of aerial imagery showed a decrease between 33 % and 71 % (depending on the site) in the lateral extent of the peat plateaus since the 1950s (Borge et al., 2017), with the largest lateral changes since the 2000s. These results suggest that “lateral erosion” of plateau edges (as coined by Borge et al., 2017), plays a crucial role in permafrost degradation. In this study, we use the term “lateral thermokarst” instead of lateral erosion to highlight that the lateral shrinkage of peat plateaus is governed by thermokarst processes.
The ongoing degradation of Fennoscandian peat plateaus is a potential analogue for the future of much larger peat plateau areas found in Russia, Canada and Alaska. It provides the opportunity to conduct field measurements and test process-based model approaches to further understand the local drivers of permafrost peatland dynamics. Both field measurements and numerical modeling experiments have contributed to our understanding of how microtopography drives the lateral fluxes of heat, water and snow and impacts the ground thermal regime (Martin et al., 2019; Sannel, 2020; Sannel et al., 2016; Sjöberg et al., 2016). Transport of snow and water from the plateau to the surrounding mire are critical factors leading to lower ground temperatures in the peat plateaus (mean annual temperature at 1 m depth is 2 to 3 ∘C colder than in the mire; Martin et al., 2019), which enables the presence of permafrost even in regions where the mean annual air temperature is above 0 ∘C (Jones et al., 2016; Martin et al., 2019; Sannel and Kuhry, 2011). However, a comprehensive model that can simulate the landscape evolution (including observed lateral thermokarst patterns) in a quantitative and process-based fashion is lacking.
In this study, we quantify volume changes of a peat plateau in northern Norway using repeat digital elevation models compiled from drone aerial imagery. Using photogrammetry, the surface topography of the plateau was reconstructed and compared for the years 2015 and 2018. Subsequently, we adapt the laterally coupled, tiled version of the CryoGrid3 model (Langer et al., 2016; Nitzbon et al., 2019; Westermann et al., 2016) to reproduce observed patterns of microtopography change, including an analysis of model sensitivity towards snow depth. The work presented here builds on field observations and simulations for peat plateaus in northern Norway (Martin et al., 2019) and other arctic landscapes (Aas et al., 2019; Nitzbon et al., 2019, 2020, 2021).
The Šuoššjávri peat plateau (69.38∘ N, 24.25∘ E, around 310 m a.s.l.; Fig. 1) is situated in Finnmarksvidda, northern Norway and extends over approximately 23 ha. A detailed description of the Šuoššjávri peat plateaus can be found in Martin et al. (2019), and a map detailing the geomorphological context around the study site is presented in Appendix A2 (Fig. A2). The climate of Finnmarksvidda is continental. The Cuovddatmohkki station nearby the site shows that in the last decade, mean annual air temperatures ranged from −2 to 0 ∘C, with yearly precipitation from 350 to 500 mm (Fig. 1). The average air temperature is −2.0 ∘C for the 1967–2019 period, −1.0 ∘C for the 2010–2019 period and −0.1 ∘C for the 2015–2016 hydrological year (the year used for modeling in this study). The average yearly precipitation is 392 mm for the 1967–2019 period, 453 mm for the 2010–2019 period and 472 mm for the 2015–2016 hydrological year.
The Šuoššjávri site consists of a laterally incised peat plateaus and smaller peat mounds surrounded by wet mires and ponds. These peat bodies extend over meters to several tens of meters with irregular geometries and rise 1 to 3 m above the surrounding wet mire (Fig. 2). At many locations, the peat plateau edges show signs of advanced degradation and lateral erosion.
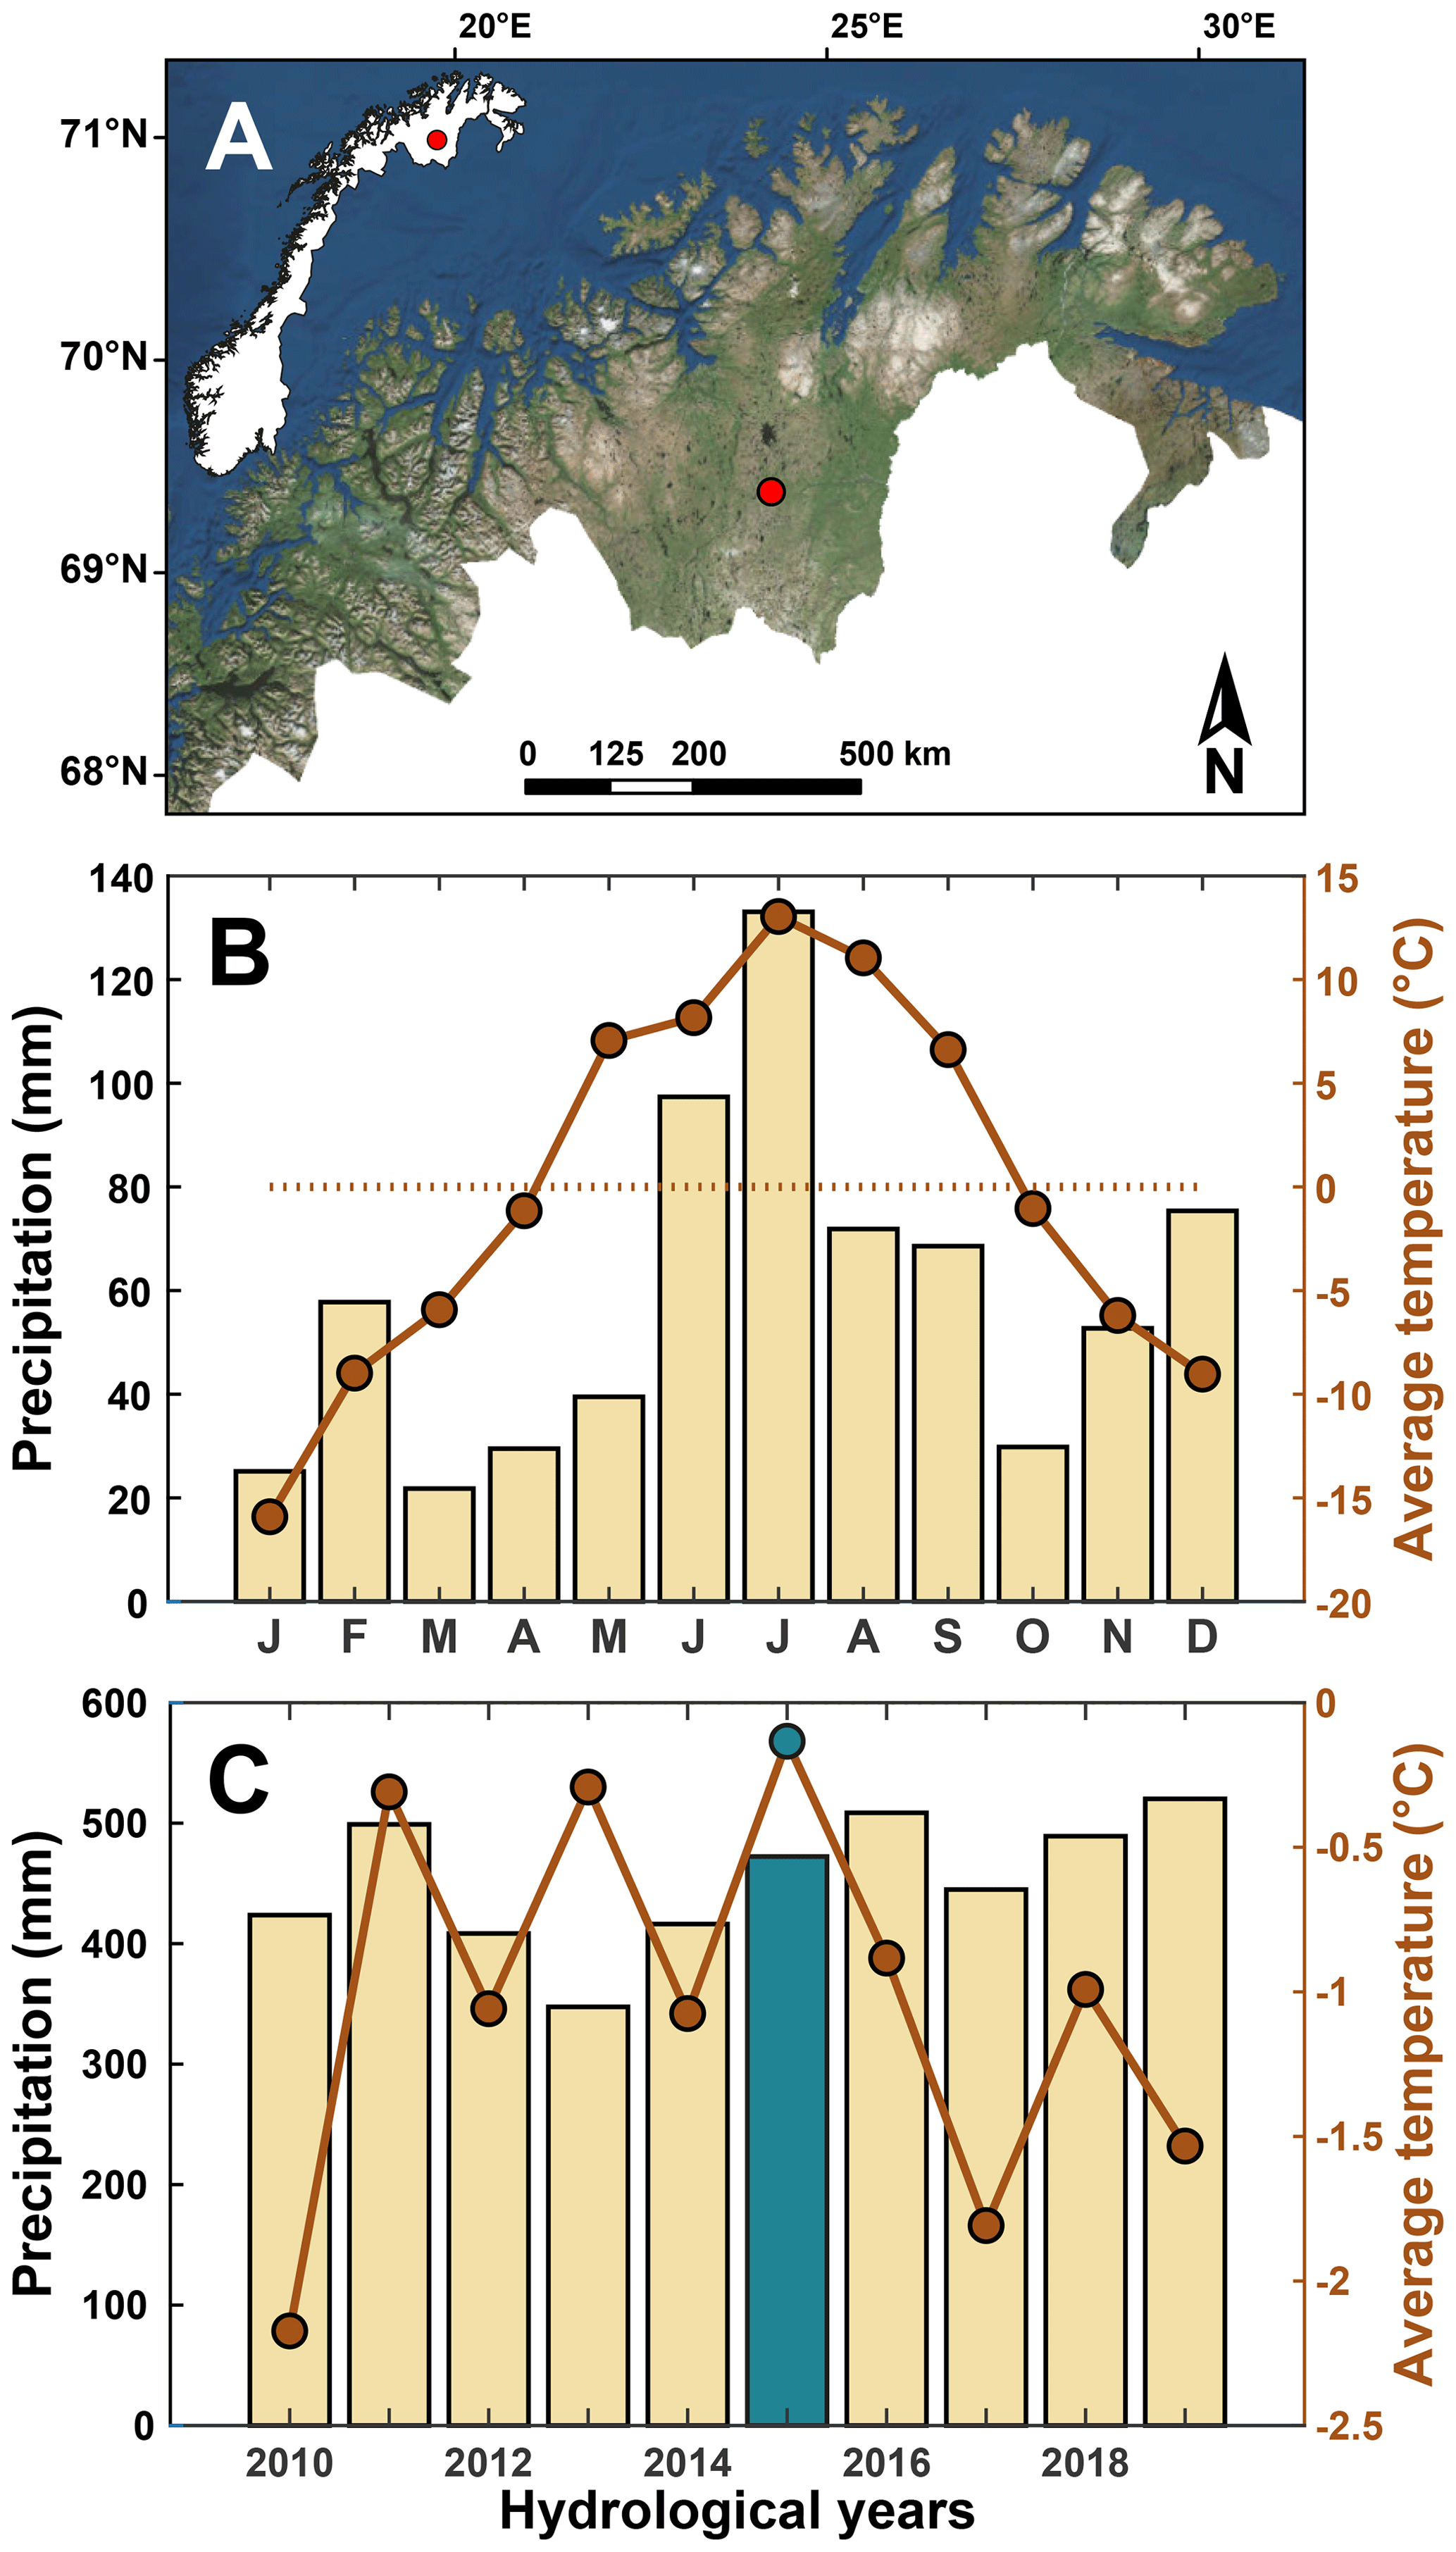
Figure 1(a) Location of Šuoššjávri in northern Norway. (b) Monthly data of the model forcing to simulate the hydrological year 2015–2016. (c) Yearly data from the Cuovddatmohkki station located at 286 m a.s.l., 7 km east from Šuoššjávri (310 m a.s.l.). The green bar and point indicate the hydrological year 2015–2016. Panel (a) is modified from Martin et al. (2019); a Landsat image is used for the background.
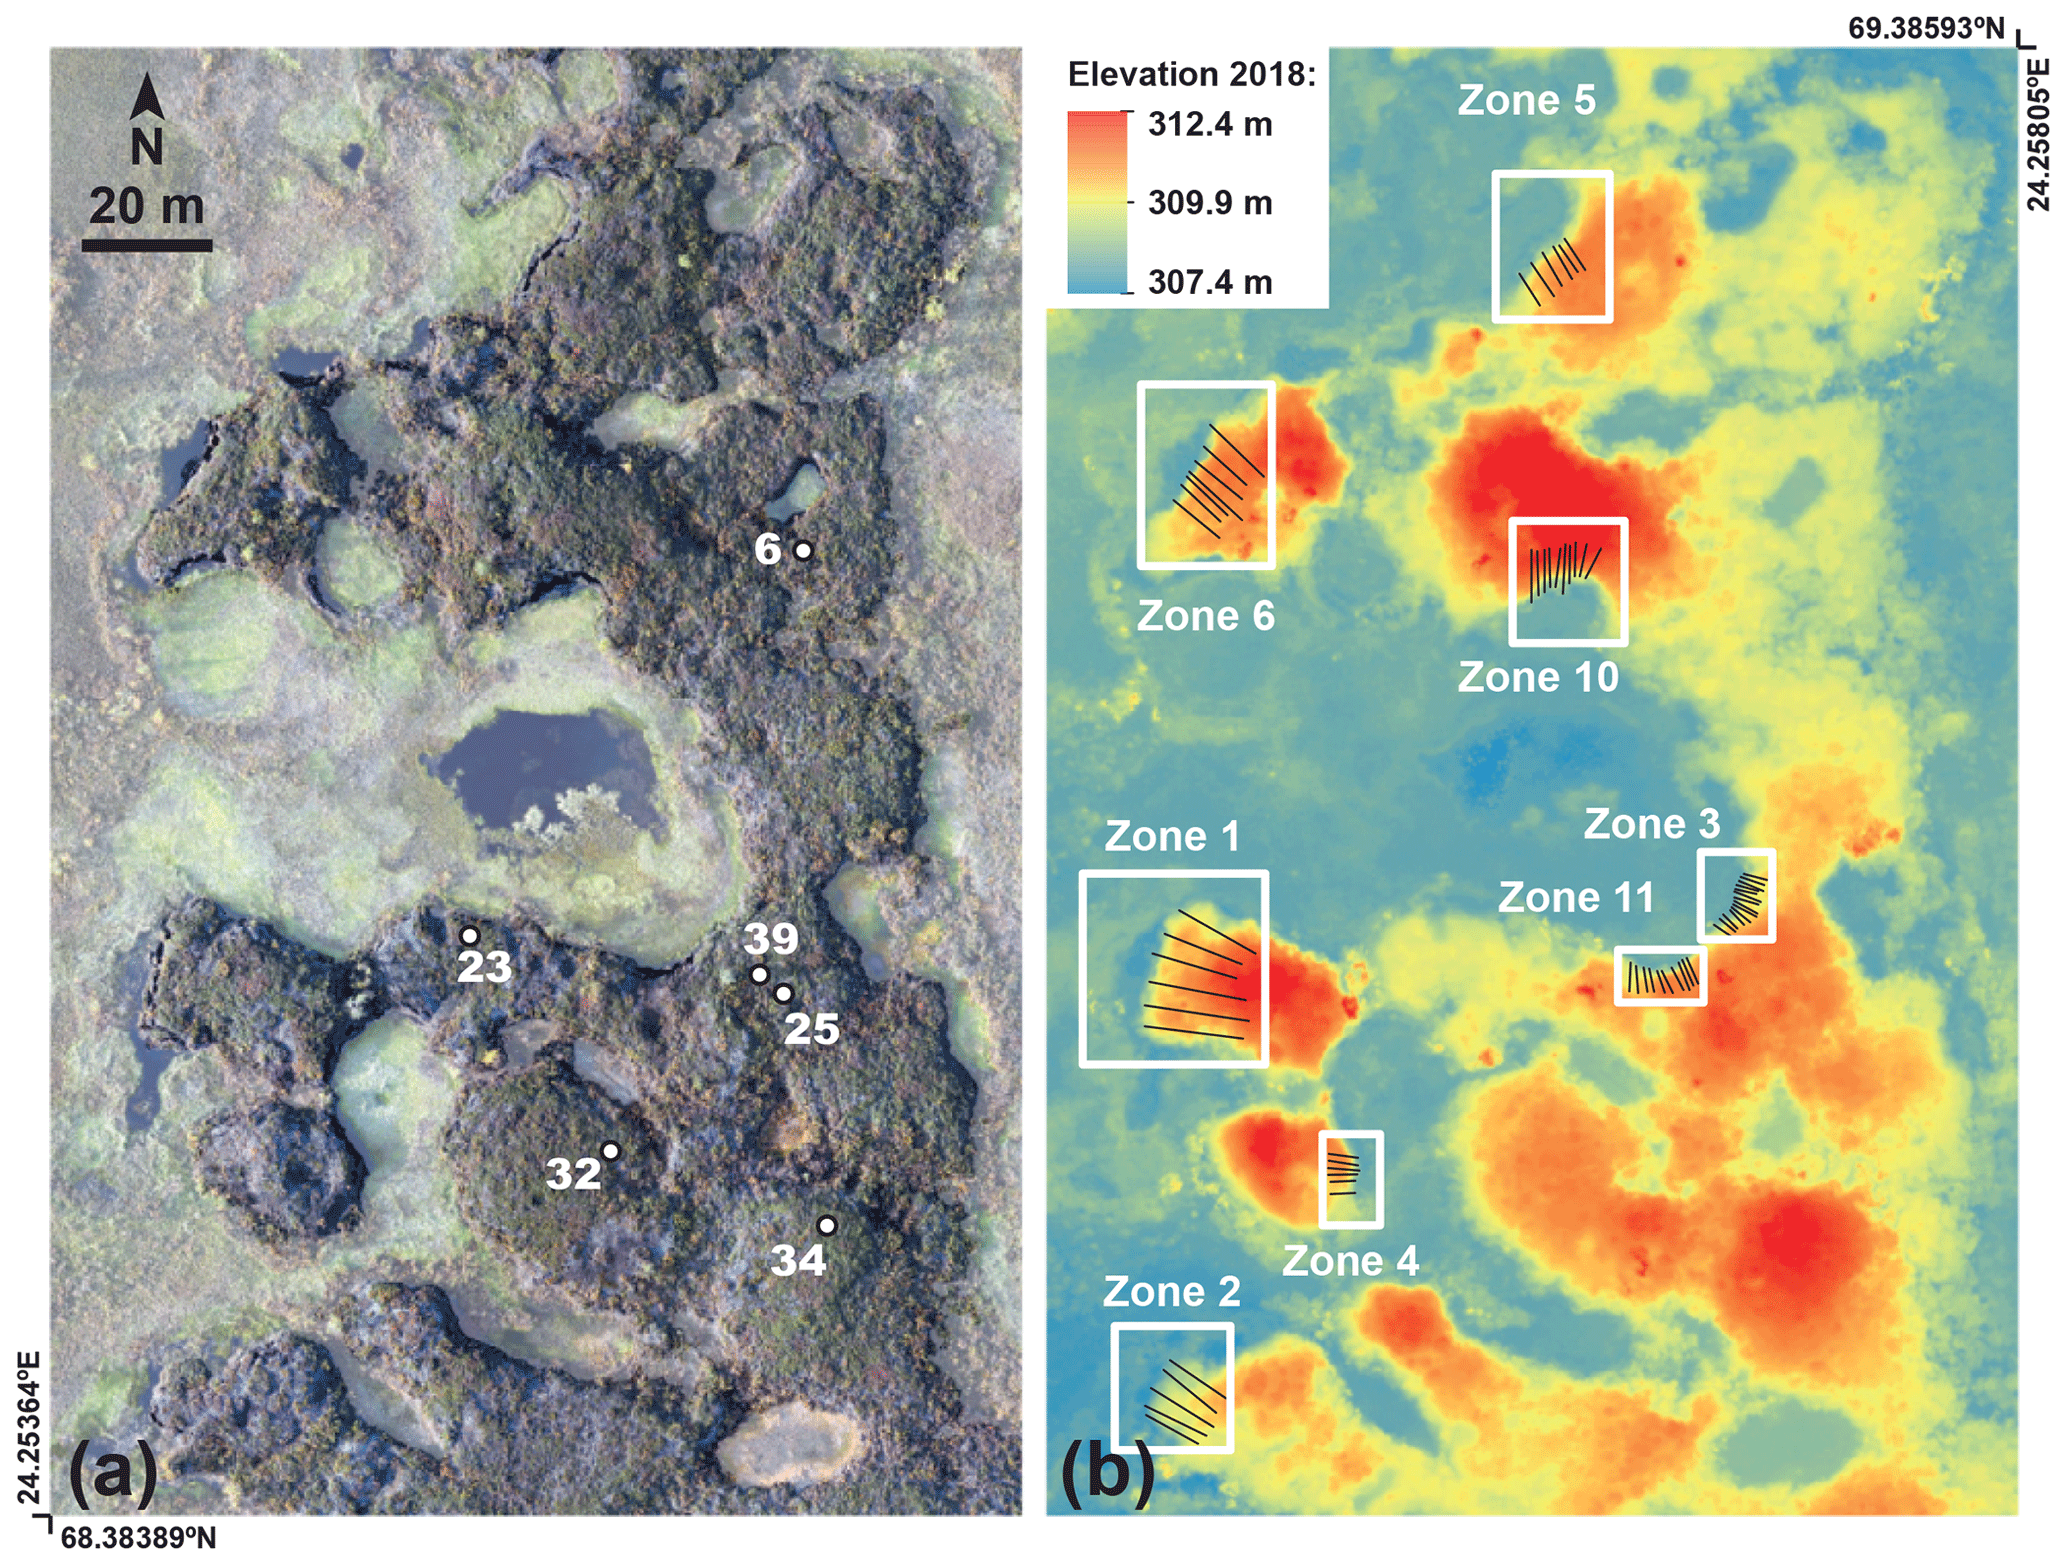
Figure 2(a) Orthophoto of the peat plateau (transparent white shading applied to the mire to better distinguish it from the plateau). The white dots indicate the location of snow measurements presented in Fig. 3. (b) Digital elevation model of the plateau in 2018. The edge transect areas on which this study focuses are indicated by white boxes. The black lines indicate the profiles used to derive the edge retreat metric described in Sect. 3.2.
3.1 Field measurements
We used drone-based structure from motion photogrammetry to compute a high-resolution digital elevation model (DEM) of the Šuoššjávri peat plateau. Aerial imagery was acquired by a NIKON COOLPIX A digital camera mounted on a Camflight C8 drone during two flights in September 2015 and 2018 (2 September 2015 and 5 September 2018). Aerial surveys were conducted from an altitude of 120 m above the ground, with a side overlap of 40 % and a forward overlap of 80 %. Horizontal and vertical coordinates of 54 natural and artificial ground control points were acquired with a differential GPS (dGPS) to support georeferencing and DEM generation using the Agisoft Photoscan software (version 1.2.6). The final DEMs have a grid resolution of 0.1 m. The average elevation difference between ground control points and the DEM is 2.6 cm. To guarantee a meaningful subsidence signal, we only considered subsidence values exceeding 5 cm in this study.
Measurements of snow depths for winter 2016, as presented in Martin et al. (2019), were extended to the winters of 2017 and 2018 for selected points on the plateau top. Snow depths were measured at the end of March with an avalanche probe at the same points in all years using a dGPS system to define the locations within 5–10 cm accuracy. In March, the elevated peat plateaus are commonly covered with 10 to 40 cm of snow, with most of the values between 10 and 30 cm (Fig. 3). We used these observations to design numerical simulations with four idealized snow scenarios in which maximum snow depth on the plateau is limited to 0, 5–10, 10–20 and 20–30 cm (Sect. 3.3.2).
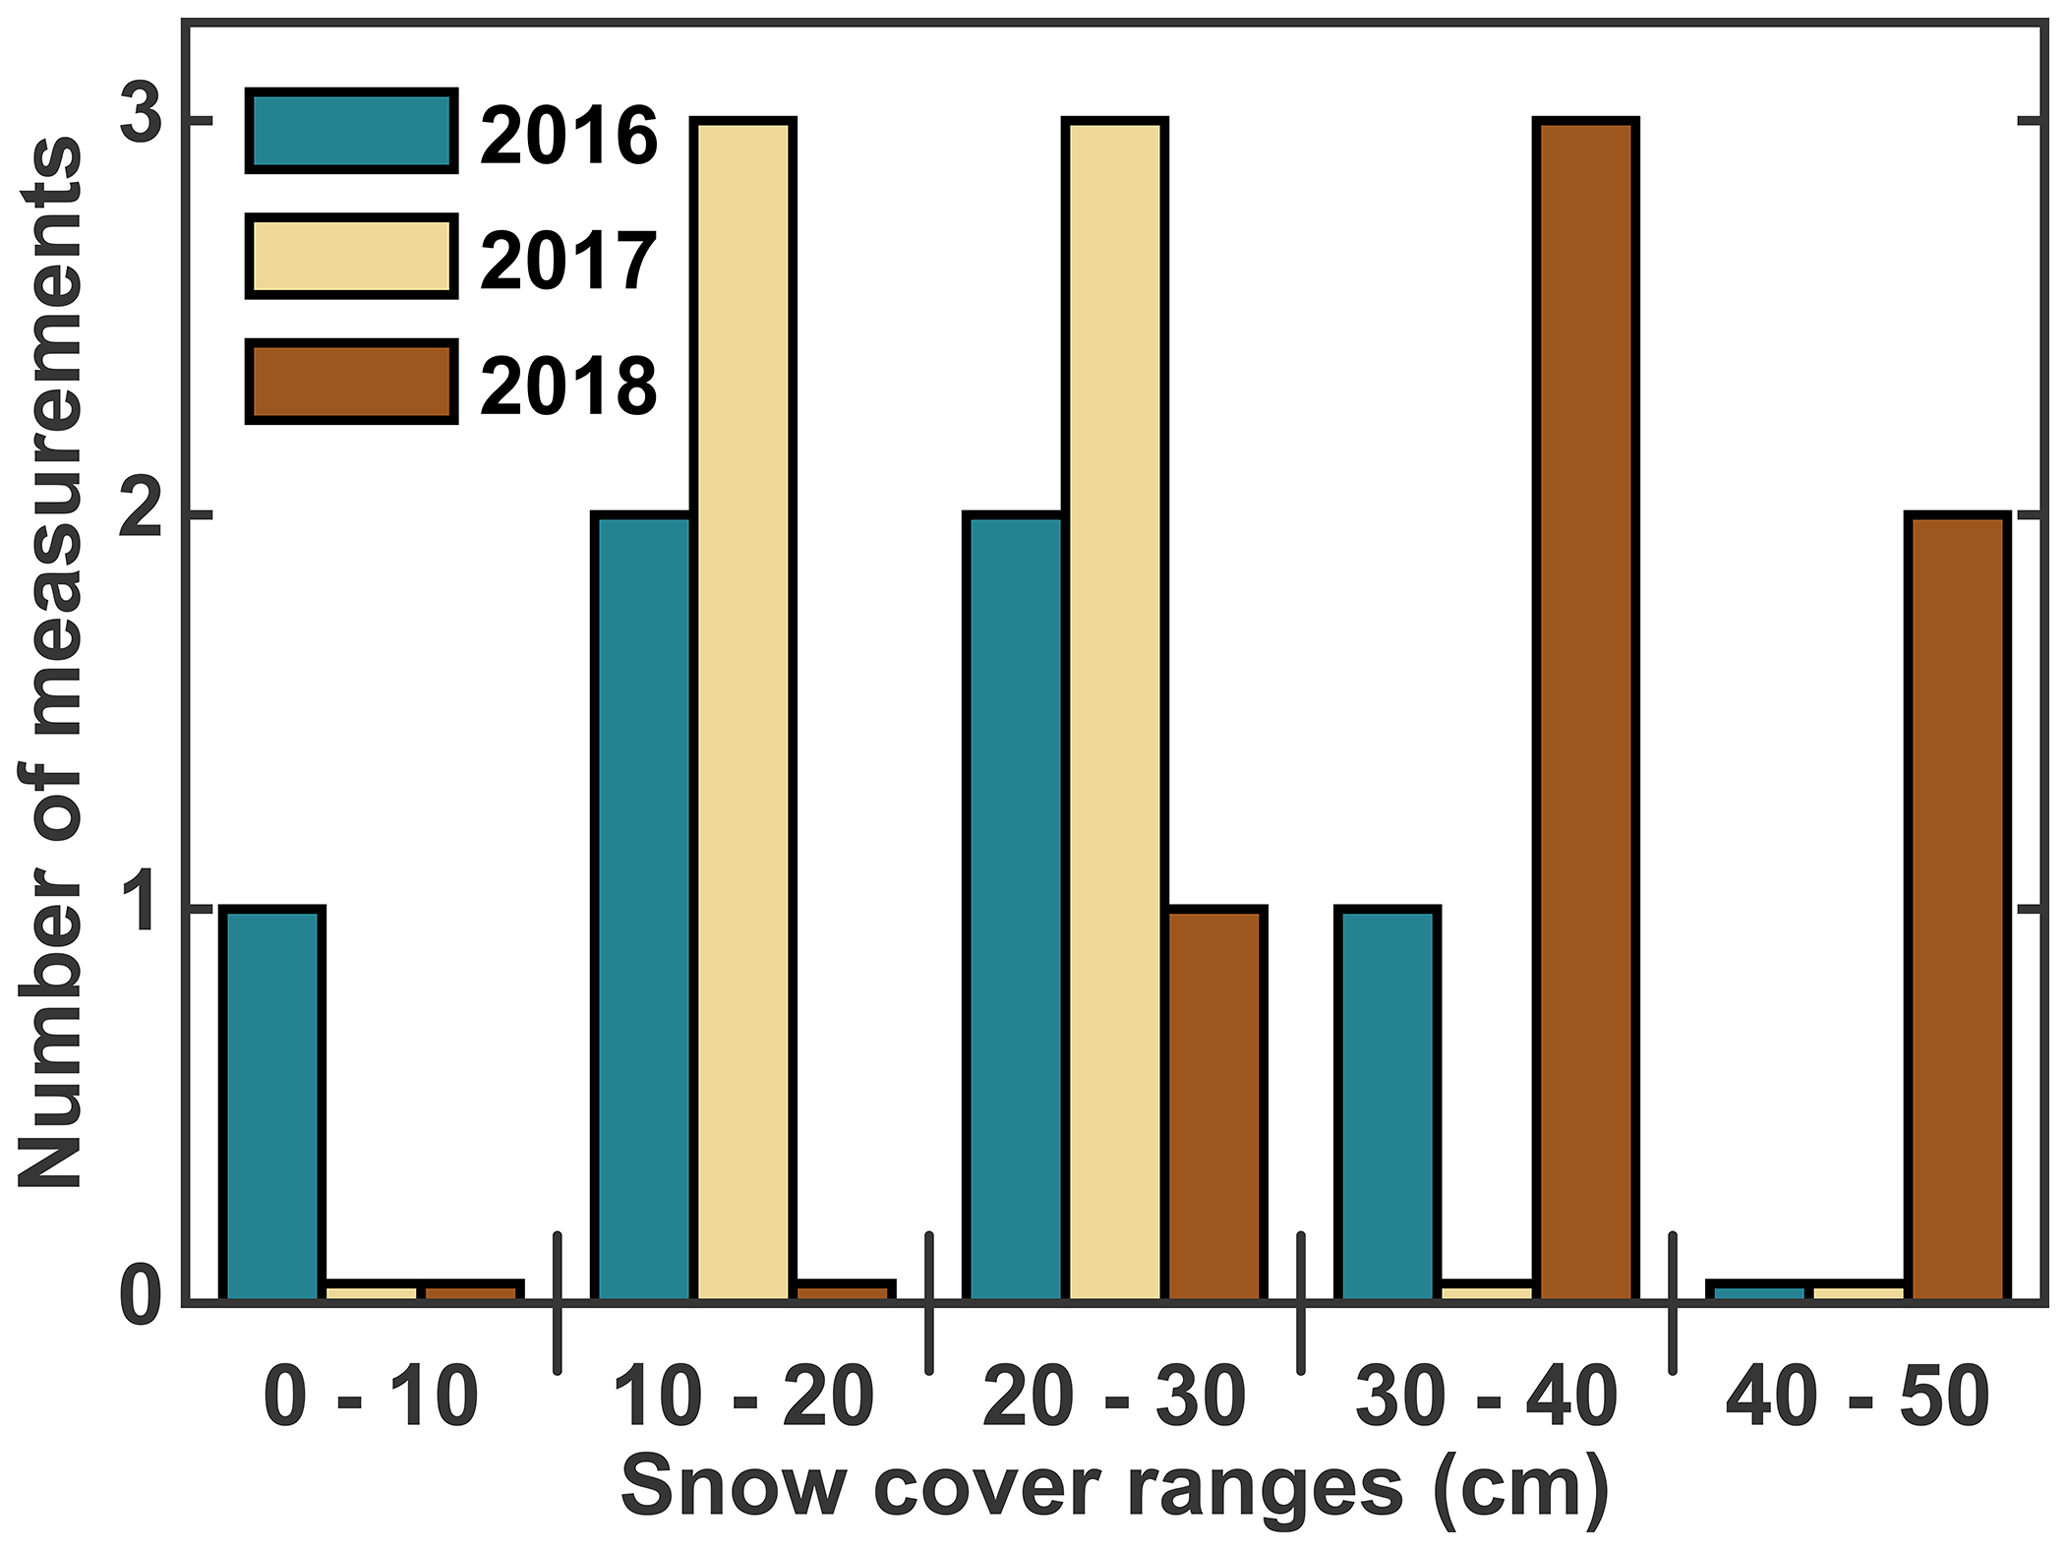
Figure 3March snow depth distribution on top of the Šuoššjávri peat plateau for 2016, 2017 and 2018. Data for 2016 are from Martin et al. (2019). Measurement locations are displayed in Fig. 2.
3.2 Quantification of lateral thermokarst patterns
Our drone-based photogrammetric approach (Sect. 3.1) enabled us to derive repeat DEMs of the peat plateau for September 2015 and 2018. We computed the elevation difference (elevation from 2018 minus elevation from 2015) to quantify the spatial pattern of elevation changes throughout the plateau. From this elevation difference map, we selected eight degrading zones (referred to as edge transect areas) with 10–30 m length and roughly straight lateral extent for comparison with modeling results (Sect. 3.3). Based on the elevation changes and lateral extent of the plateau between 2015 and 2018, we used the eight edge transect areas (Fig. 2) to calculate the normalized annual volume change (the annual volume change normalized by the length of the retreating edge orthogonal to the retreat direction; in units of m3 yr−1 m−1). Because elevation changes occurred in the mire due to water level variations between the two dates, we relied on an estimation of the elevation of the plateau edge inflection point (around 309.7–309.8 m a.s.l.; yellow color in Fig. 2b) to delineate the plateau from the mire and thus identify elevation changes associated with the plateau.
Permafrost degradation in peatlands creates different subsidence patterns depending on the size of the ice-rich features. Small structures like palsas tend to sink uniformly from the edge to the top, while peat plateaus show stability of their top part and pronounced lateral retreat. To distinguish between these two types of thermokarst patterns, we introduce a so-called horizontal vs. vertical (HvsV) shape index that we can apply to both field observations and model results. The basic concept of the HvsV index is illustrated in Fig. 4. To compute the HvsV index, the plateau edge elevation is averaged over five points, from its base (z1) to the point where its flat top is reached (z5). The elevation difference between 2015 and 2018 (Δz) for z1, z2, z4 and z5 is then used as follows:
For the field observations, the HvsV index was obtained by first laterally averaging the slope of each edge transect area using five to 14 parallel elevation profiles across the zone for the 2015 and 2018 DEMs (Fig. 1). For these synthetic elevation profiles, the points z1 to z5 were determined so that the HvsV index could be calculated based on the elevation differences.
For the simulation results (Sect. 4.2), a 10 m long window was used to capture the topography from the base of the plateau to its flat top. For these 10 m profiles, the five required points were determined and the HvsV index was computed over three-year-long time periods.
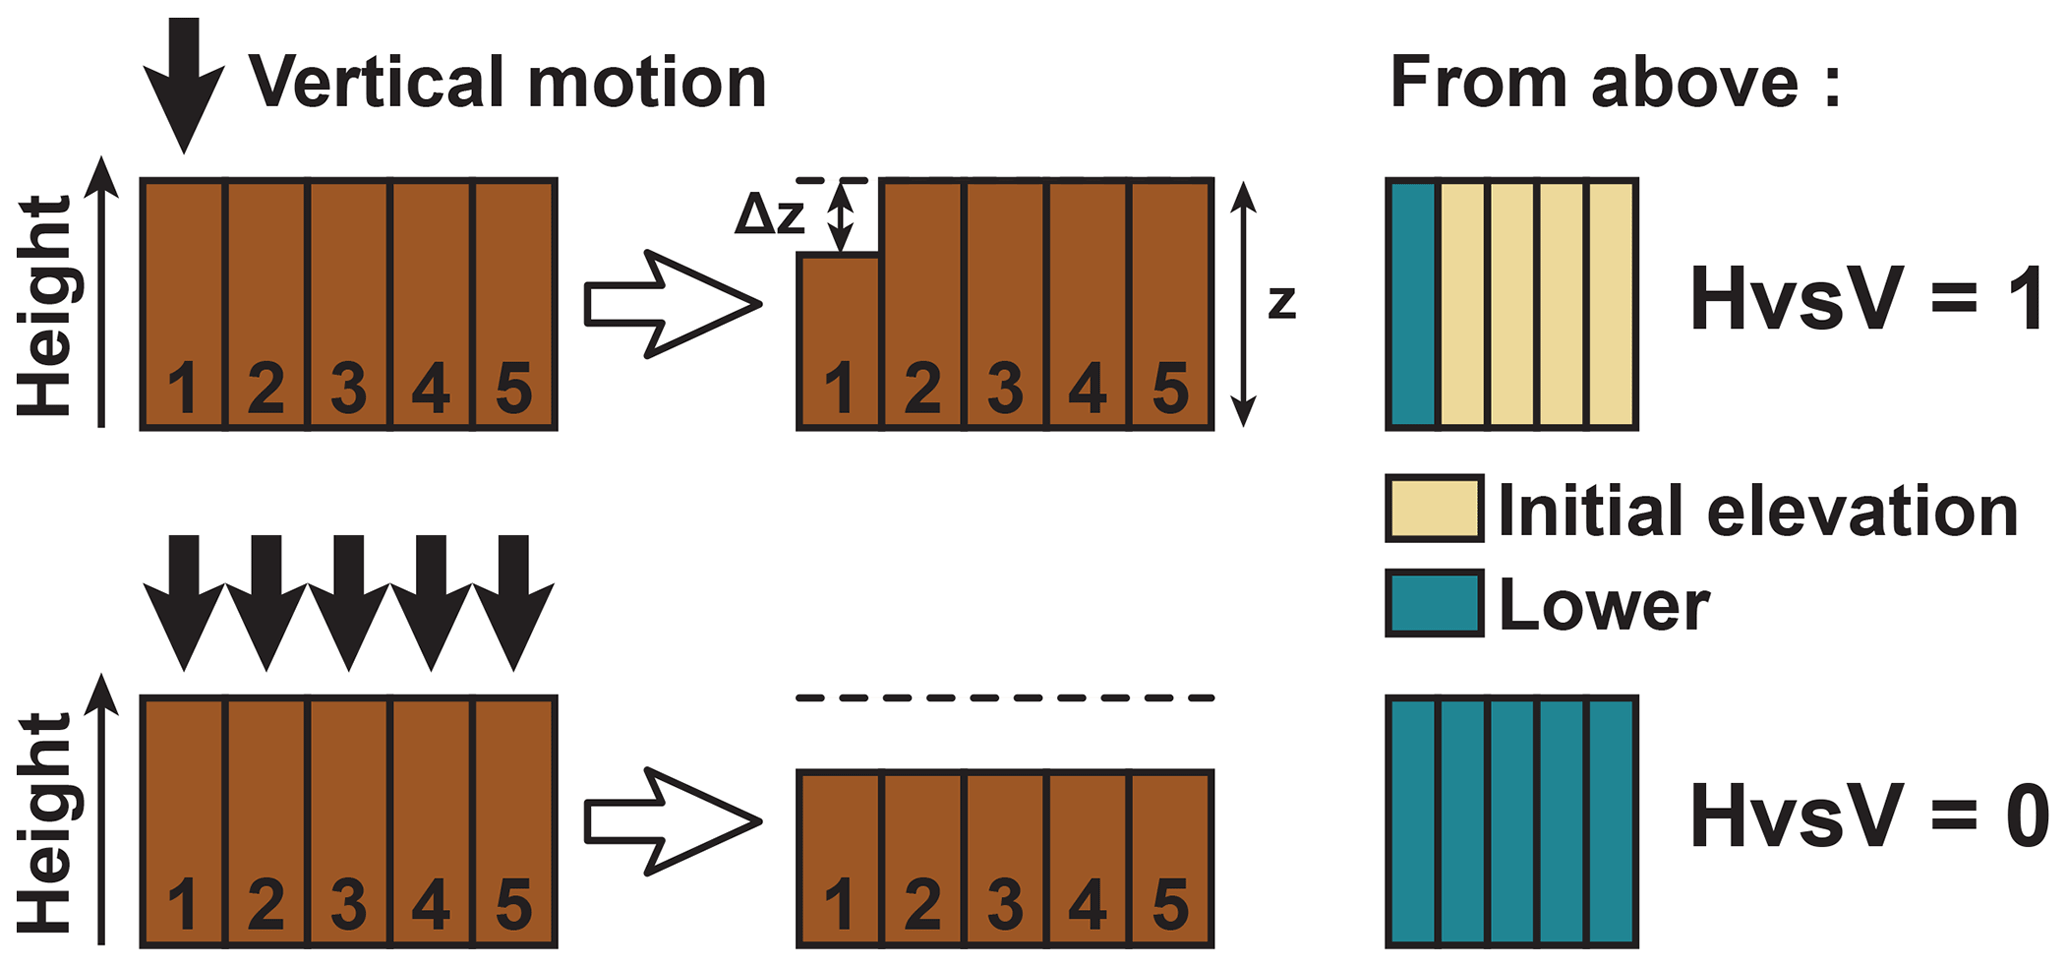
Figure 4Schematic representation of the HvsV index used to quantify the observed and simulated thermokarst patterns. The index ranges from 1, when the plateau undergoes pure lateral edge retreat (subsidence restricted to the areas at contact with the mire), to 0, when it experiences uniform subsidence.
3.3 Modeling climate-induced changes of peat plateau topography
3.3.1 The CryoGrid3 model
We simulate the ground thermal regime and related topographic evolution of the Šuoššjávri peat plateau using the CryoGrid3 model (Westermann et al., 2016). CryoGrid3 is a land surface model designed for permafrost modeling, which consists of a physically based description of 1D heat transfer in the soil column, including freeze–thaw processes of soil water or ice. The model features a simple snowpack module, which includes heat conduction, dynamic buildup, melt, sublimation, water infiltration and refreezing. At the upper boundary, the model uses the surface energy balance module to calculate the ground surface temperature. The turbulent fluxes of sensible and latent heat are calculated using a Monin–Obukhov approach (Monin and Obukhov, 1954). Computation of dynamic soil moisture is accomplished with a bucket scheme (Martin et al., 2019, Nitzbon et al., 2019) in which each grid cell can hold water up to its field capacity, while excess water is moved to the next grid cell until a water table on top of the permafrost (or bedrock layer) is reached. Evapotranspiration is adjusted by soil moisture availability and the water loss is distributed vertically, so it decreases exponentially with depth.
CryoGrid3 can represent ground subsidence resulting from the melt of the excess ice in the ground (see Westermann et al., 2016). The subsidence calculation is based on soil stratigraphy, in particular volumetric ice content and natural porosity, i.e., the porosity of the soil matrix in unfrozen conditions. When excess ice melts in a grid cell, the grid cell size shrinks accordingly. This excess ice scheme was first implemented by Westermann et al. (2016) and later used in Nitzbon et al. (2019, 2020, 2021) to represent the transient evolution of polygonal tundra landscapes for different future climate scenarios. In the present study, this scheme is adapted to simulate microtopography changes and thermokarst patterns of the Šuoššjávri peat plateau.
Following Nitzbon et al. (2019, 2020), CryoGrid3 includes a parallel framework to simultaneously compute several 1D tiles that can exchange water, snow and heat at defined time steps. This approach, denoted as laterally coupled tiling, allows us to couple 1D tiles with different stratigraphies or topographies to simulate the effect of microtopography and spatial heterogeneity within a landscape. With this method, the spatial variability within polygonal tundra (Nitzbon et al., 2019) or the stratigraphy differences between Yedoma and Holocene deposits (Nitzbon et al., 2020) have been simulated. The scheme can capture lateral fluxes of snow, subsurface water and heat at the meter scale, all of which are key drivers of the ground thermal regime and thermokarst patterns. As described in detail in Nitzbon et al. (2019), the lateral heat flux calculation is based on the temperature gradient between neighboring cells of different tiles. If topographic differences expose the side of a tile, lateral heat fluxes between the tile and the atmosphere are not taken into account.
The snow depth is a major control for the ground thermal regime (Gisnås et al., 2014; Martin et al., 2019; Sannel, 2020; Sannel et al., 2016). Strong wind redistribution of snow from the plateau to the lower-lying mire leads to a shallow snow cover on the plateaus (Sect. 3.1). In the laterally coupled tiling approach of CryoGrid3, wind drift of snow is not computed in a physically based way. Instead, fresh snow is redistributed at regular time intervals between all tiles based on the relative surface elevations of the snow covered tiles. Tiles gain or loose snow proportional to the difference between their surface elevation and the average surface elevation of all tiles in a mass-conserving scheme. Thereby, snow is redistributed between all the tiles without taking their relative location into account. To represent immobile snow trapped by vegetation and/or rough surfaces, snow is only considered movable if its depth exceeds the “immobile snow height”, which can be adjusted as a model parameter. In the setup used for this study, the elevation difference between the plateau and the mire leads to complete redistribution of snow that exceeds the immobile snow height from the plateau to the mire. The immobile snow height can therefore be used to adjust the overall snow depth on the plateau in our modeling experiments.
3.3.2 Model setup
The present-day topography of the peat plateau is clear evidence that the long-term evolution is not only governed by lateral thermokarst at the plateau edges but also by thermokarst processes in the interior of the plateau, with pond formation and drainage as well as drainage gully development and deepening. As a fully 3D simulation of these phenomena is beyond the capability of our model approach, we focus on the simplified situation of a laterally homogenous peat plateau edge, for which all fluxes in the third spatial dimension are assumed zero (translational symmetry). For this purpose, we couple 40 tiles in a linear configuration, with subsurface water and heat transfer only allowed between neighboring cells (Fig. 5). The wet mire is divided into three tiles with widths of 50, 2 and 0.5 m at a surface elevation of 300 m a.s.l. They are composed of a 3 m thick layer of unfrozen saturated peat above a 7 m thick silty mineral layer that also extends below the plateau. The outermost mire tile is linked to a hydrologic reservoir (Nitzbon et al., 2019) at 300 m a.s.l. to ensure a stable water level with permanently water-saturated conditions. The peat plateau tiles are 0.3 m wide so the initial width of the plateau amounts to 11.1 m. They contain the same total amount of peat above the mineral base layer as the mire tiles but include additional excess ice, which increases their surface elevation. In line with observations (Table 1), the initial excess ice content is adjusted so that the flat top of the plateau is located 2 m above the wet mire at 302 m a.s.l. The excess ice is initially distributed homogeneously between the mineral base layer and the bottom of the active layer (assumed 0.7 m deep). The selected peat and excess ice stratigraphy implicitly ensures that the plateau surface reaches the surface elevation of the mire when the excess ice has fully melted. Our setup leads to an initial excess ice content of 47 % (volume of excess ice/volume of unfrozen soil) in the plateau, which is in the range of commonly reported field values (Bockheim and Hinkel, 2012; Kokelj and Burn, 2003; Lacelle et al., 2013; Morse et al., 2009; Subedi et al., 2020).
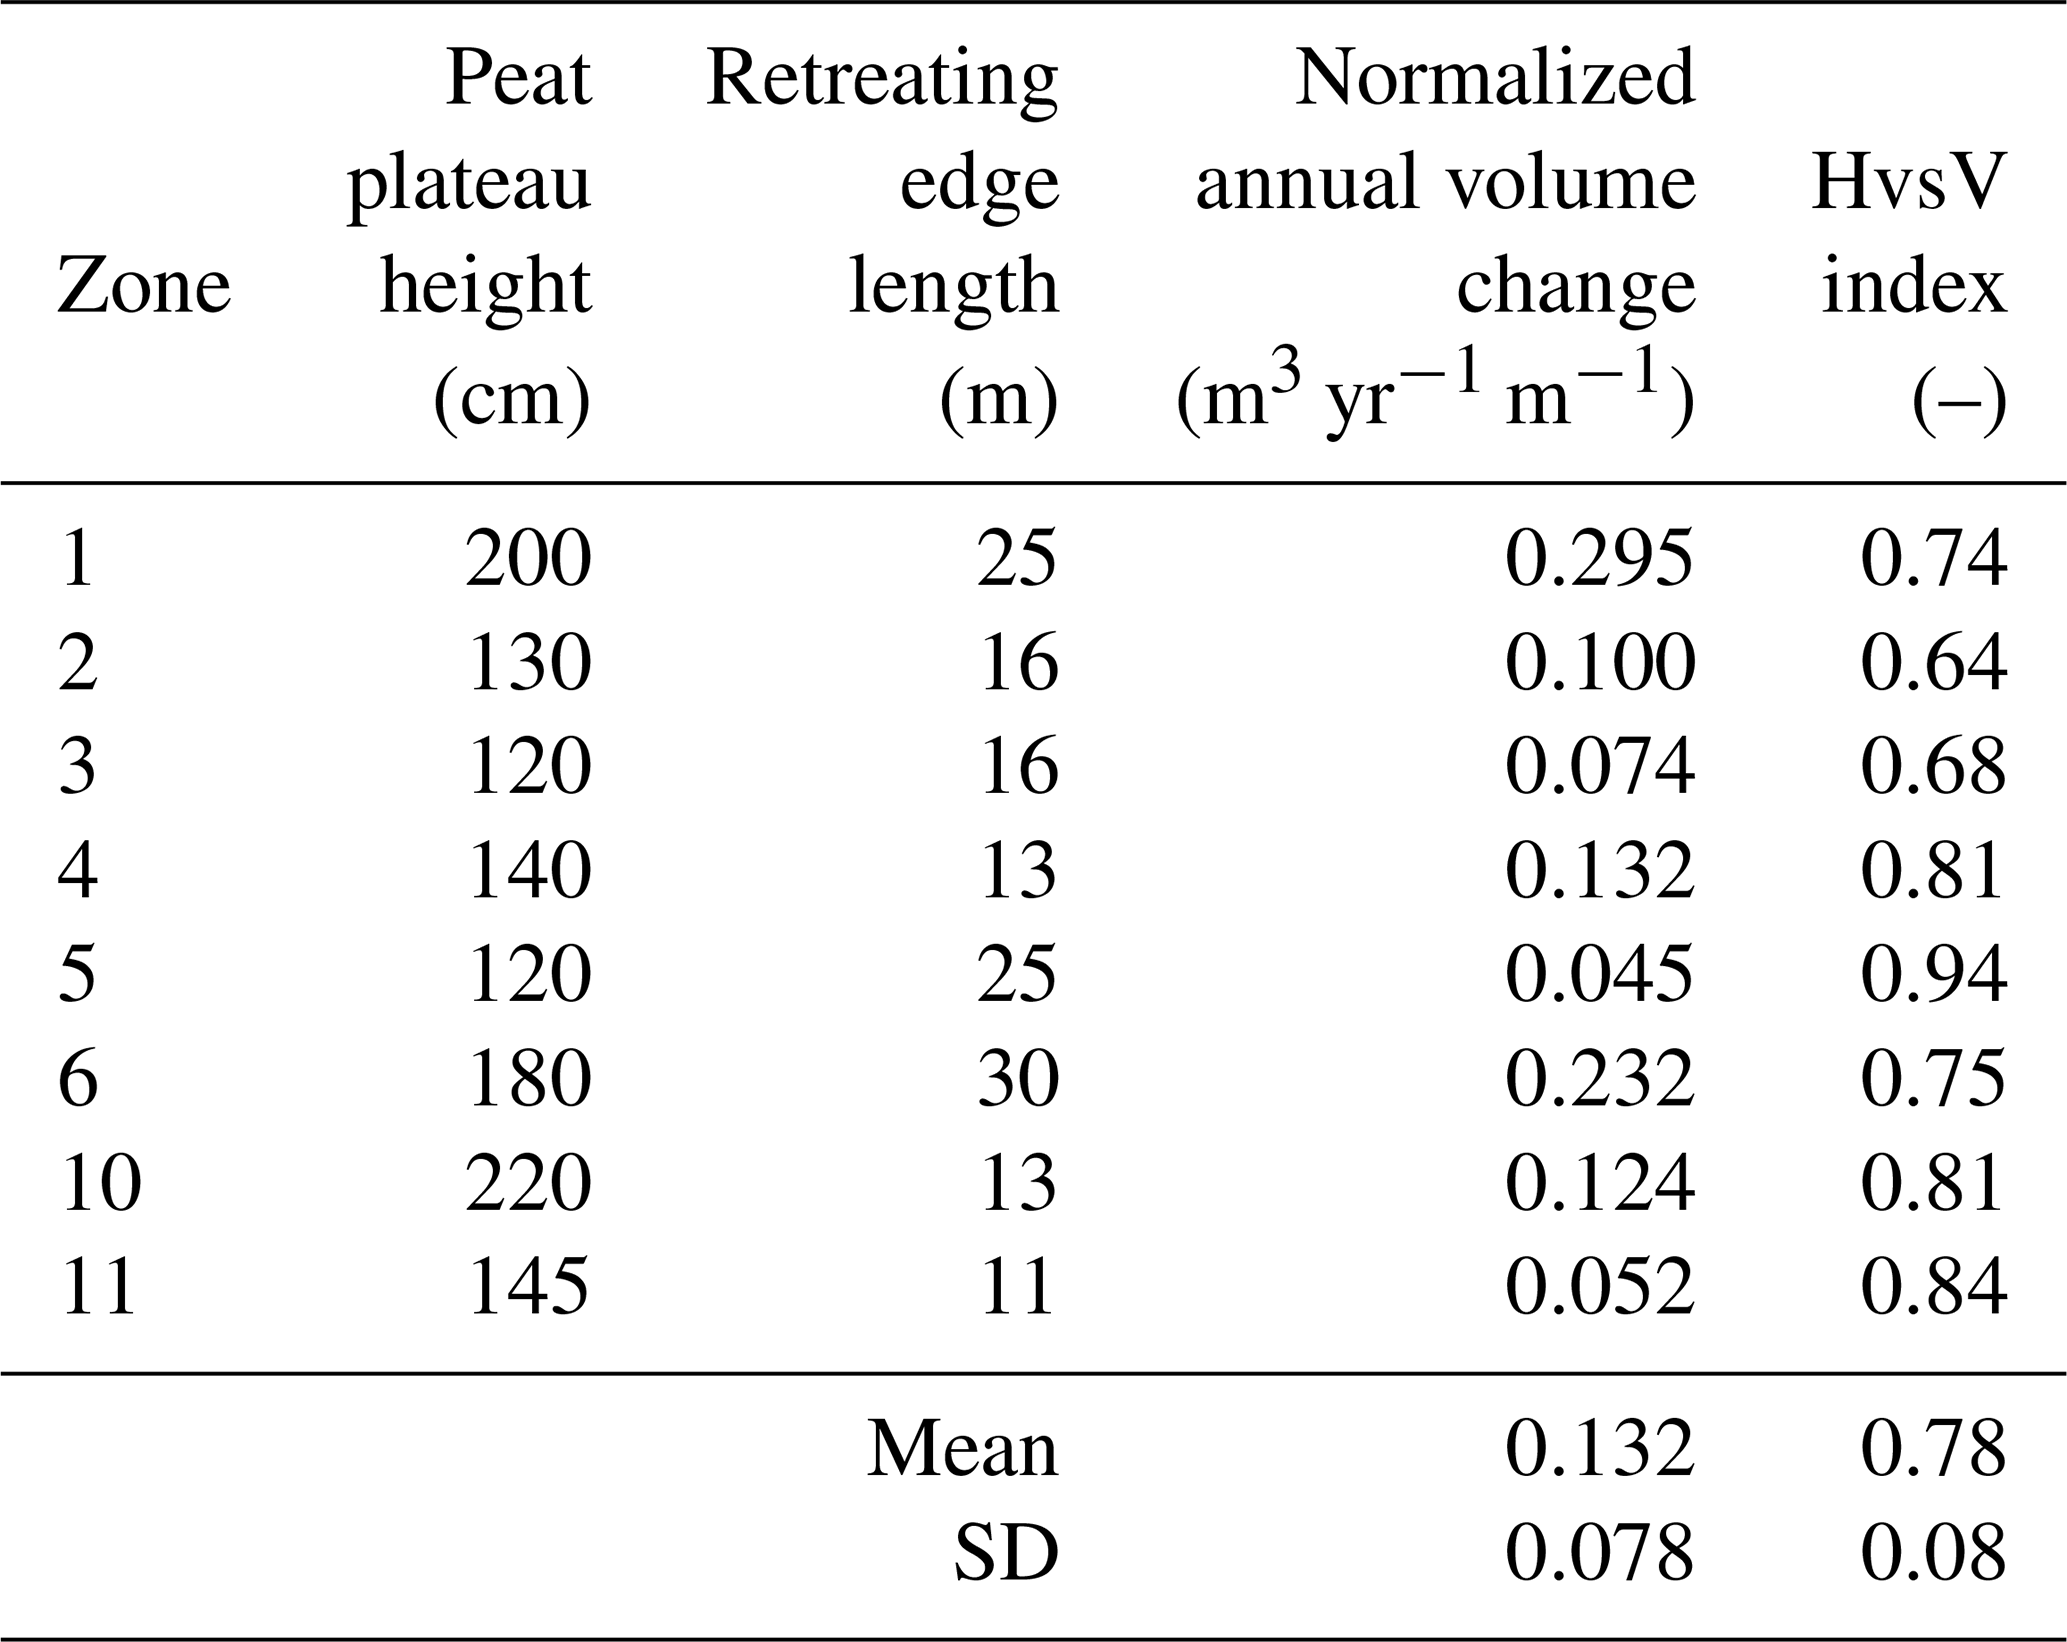
Table 1Field observations at the eight edge transect areas presented in Fig. 2. Elevation changes and surface measurements are derived from the digital elevation models. The normalized annual volume changes are obtained by dividing the annual volume changes by the length of the retreating edge in the zone. The HvsV shape index (Fig. 4) was calculated according to Eq. (1). See Sect. 3.2 for more details.
While this is clearly an idealized setup, it is still possible to compare the magnitudes of modeled volumetric plateau degradation with field observations for sufficiently straight sections of the plateau edge (Sect. 3.2, Fig. 2). As field observations of snow depth show a considerable spread of snow depths on the plateau (that cannot be reproduced by modeling), we investigate model sensitivity towards snow depths on the plateau by adjusting the immobile snow height using four different values within a realistic range. In each configuration, the same immobile snow height was applied to all tiles. During the simulations, the snow depth on the plateau varied within ranges of 5–10 cm due to snow fall, snow drift and snow melt. Therefore, we named the scenarios based on their snow depth range, i.e., 0 cm snow, 5–10 cm snow, 10–20 cm snow and 20–30 cm snow.
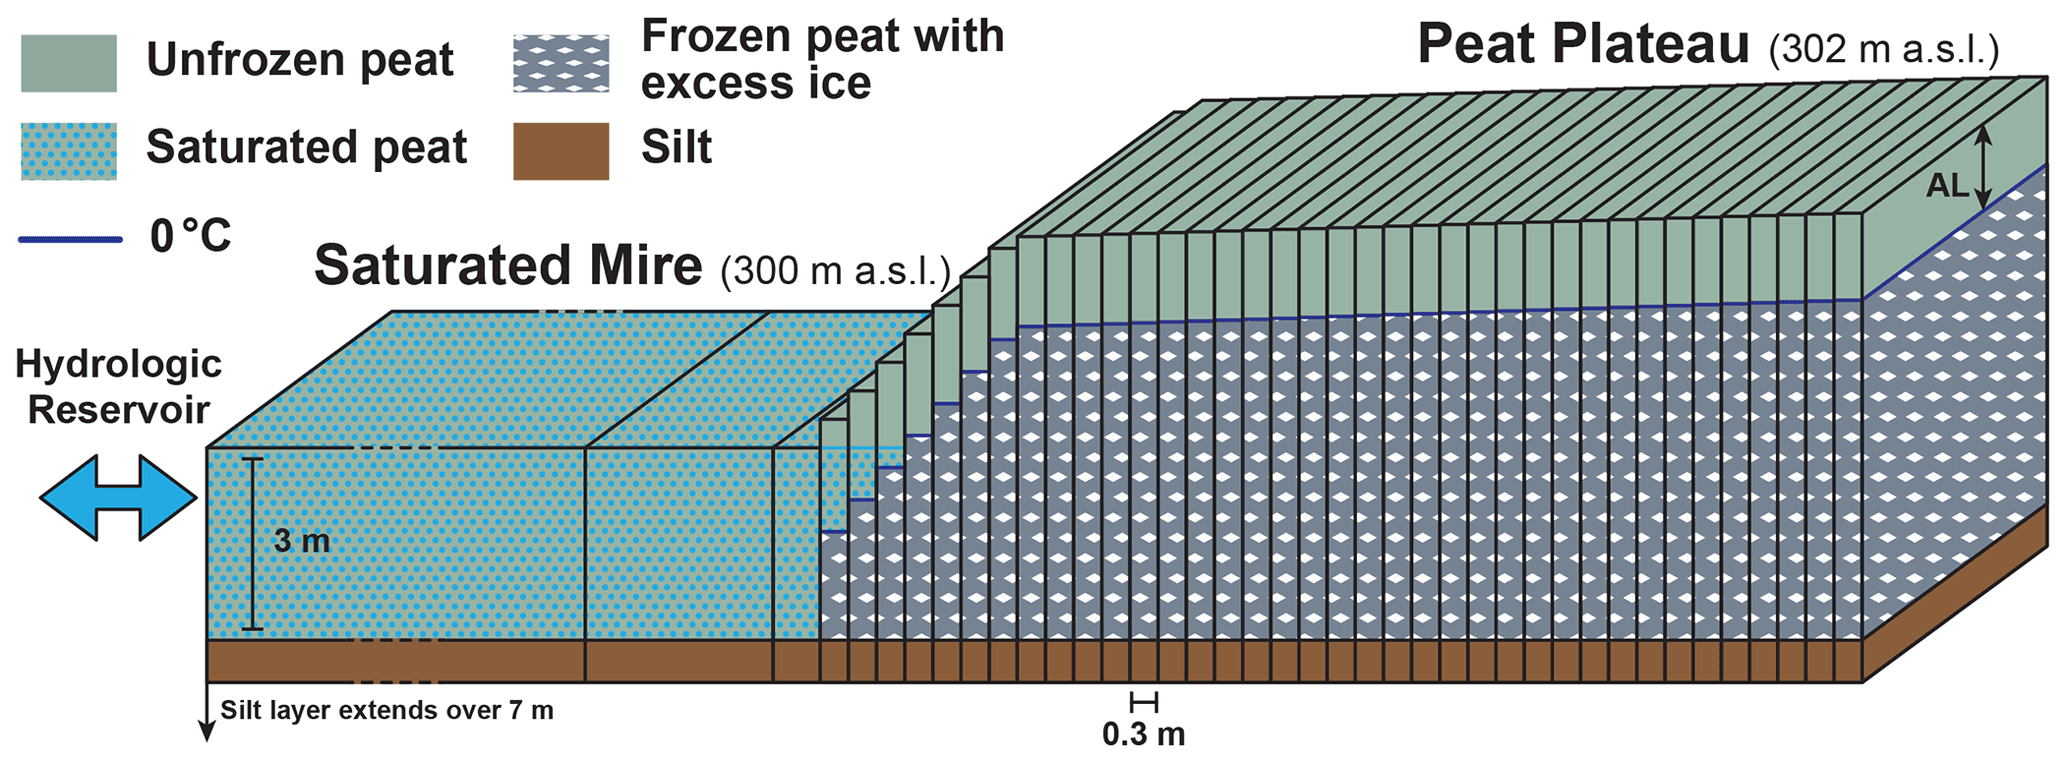
Figure 5Setup used to simulate peat plateau degradation. We coupled 40 CryoGrid3 tiles to reproduce the contact between the mire and the peat plateau. The surface elevation was linearly interpolated between 300 and 302 m a.s.l. over a lateral distance of 2.4 m to represent a typical geometry of peat plateau edge. AL stands for active layer. We linearly interpolated them between 0.9 (leftmost tile) and 0.7 m (rightmost tile). The model implements lateral fluxes of snow, subsurface water and heat between the tiles as well as ground subsidence due to excess ice melt. The bottom part of the setup has been truncated because it consist of silt over 7 m for all tiles. This setup is an idealized setup derived from our field observations. It does not aim to represent one particular natural setup of the edge transect areas detailed in this study.
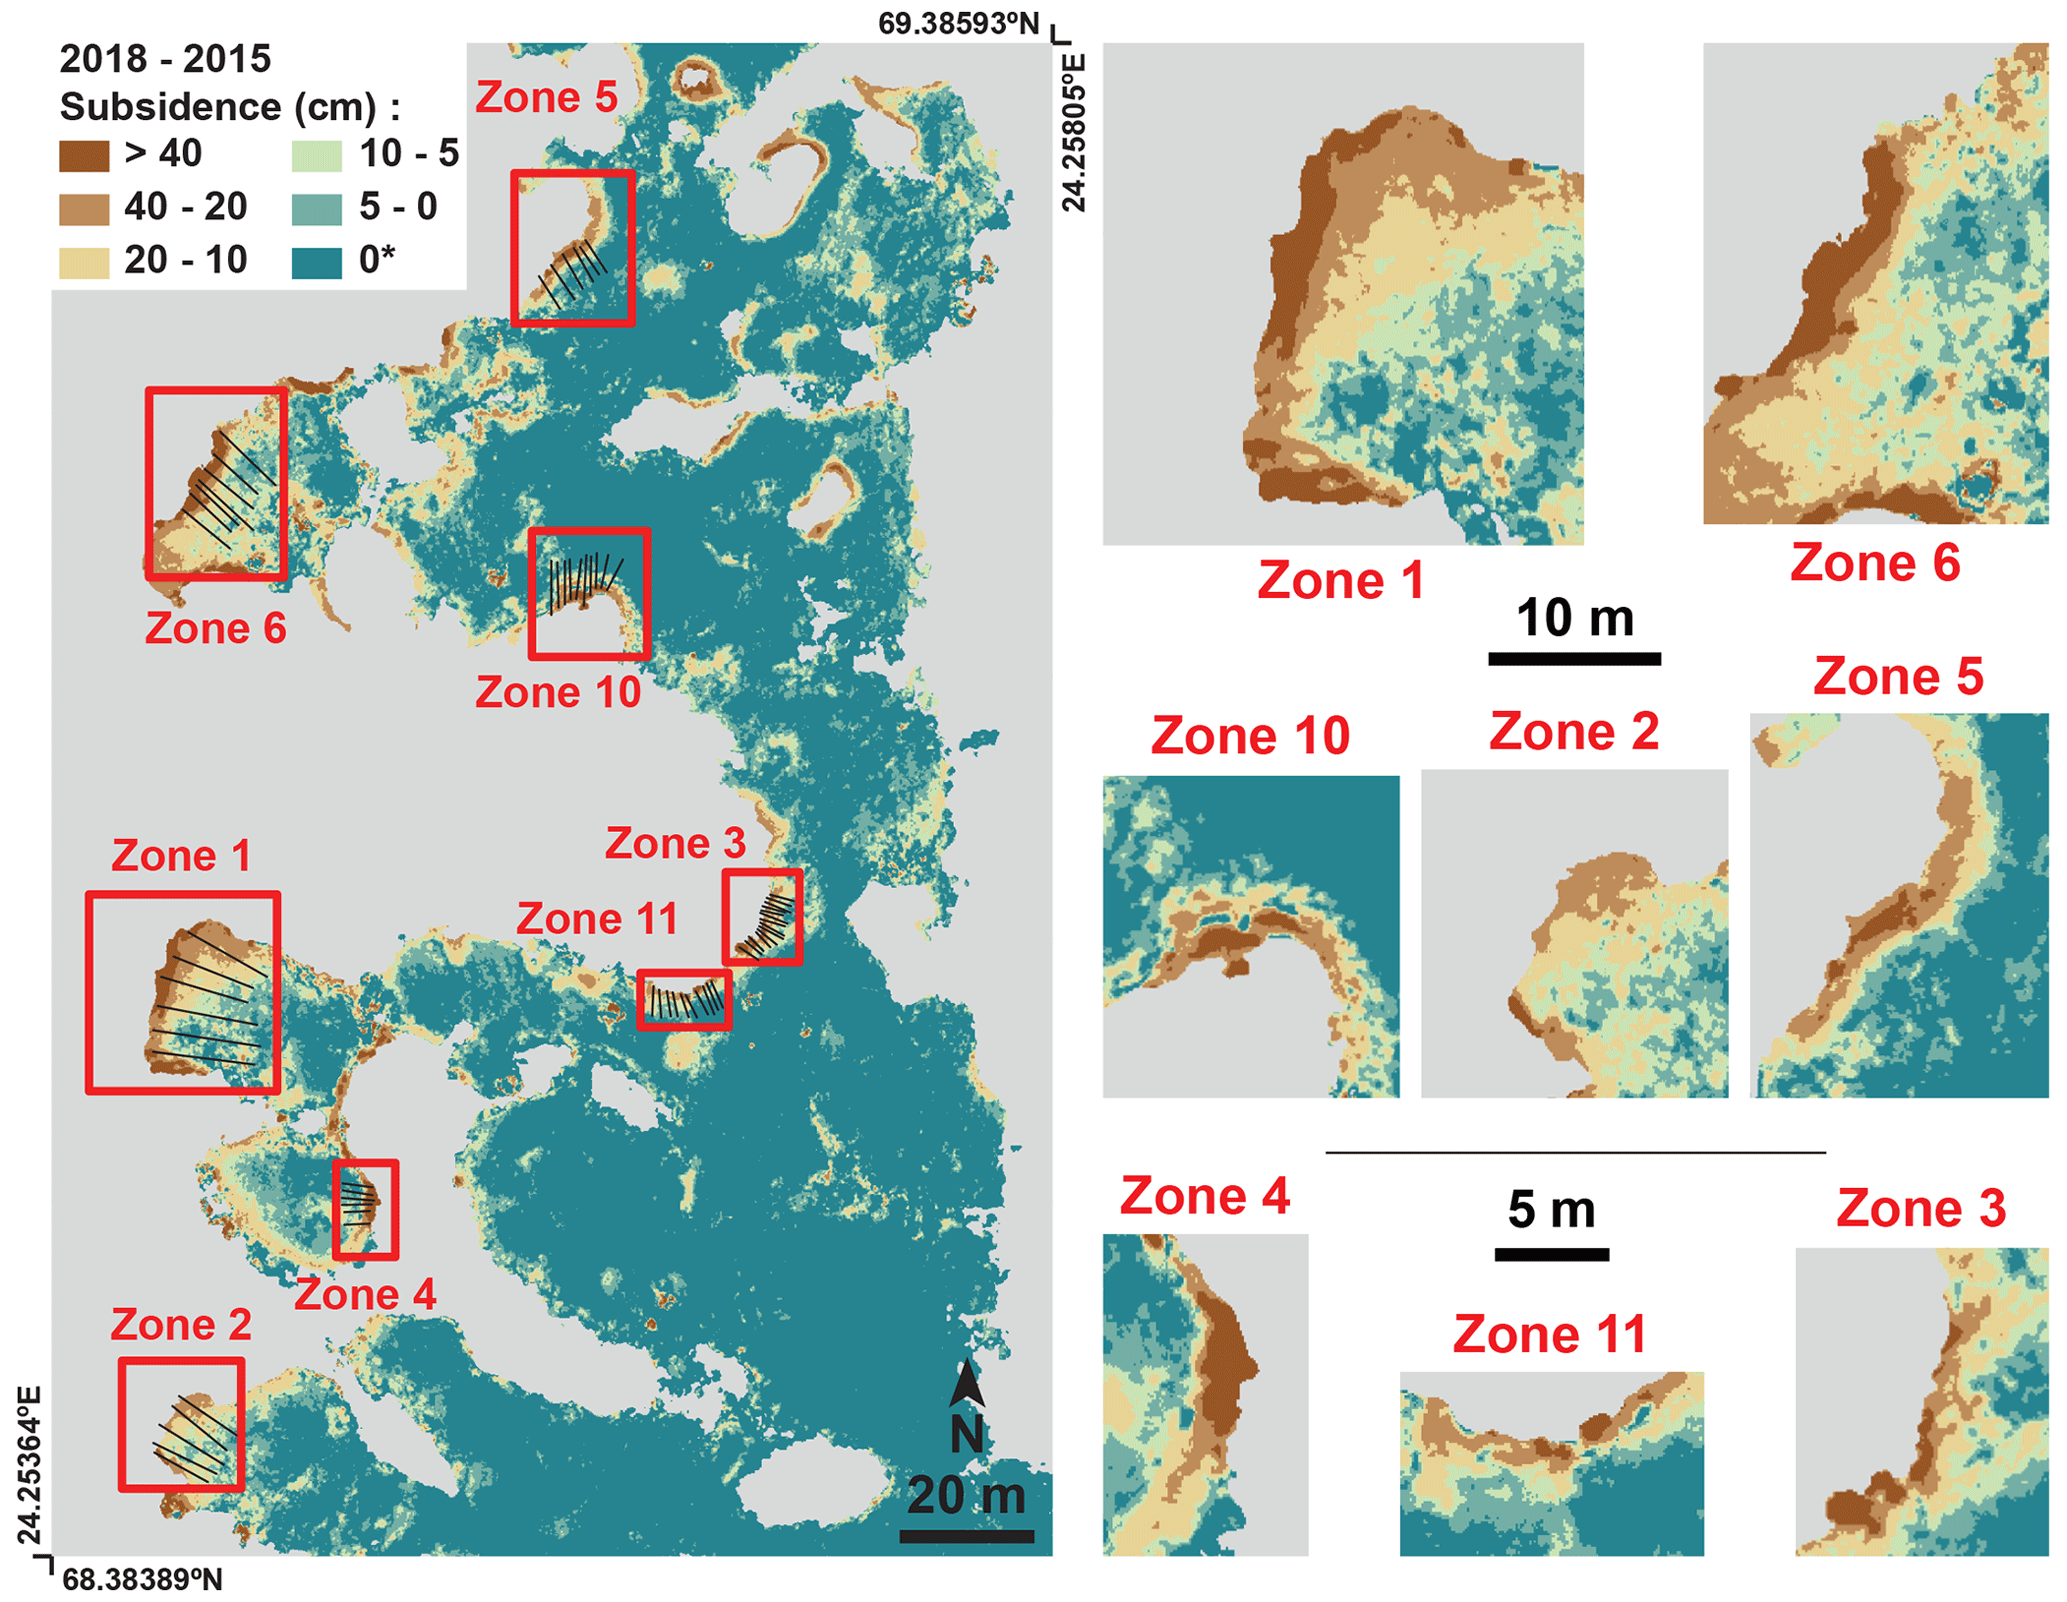
Figure 6Left: subsidence over the Šuoššjávri peat plateau. The black lines indicate the profiles used to derive the edge retreat metric described in Sect. 3.2 (HvsV index). Note that the color scale is truncated for subsidence values higher than 40 cm and lower than 0 cm (which corresponds to an increase in surface elevation, generally due to vegetation change between the two years). Right: edge transect areas of the plateau used to compare observed and simulated lateral thermokarst patterns (Sect. 3.2).
3.3.3 Model parameters
As described in Martin et al. (2019), field measurements from the Iškoras peat plateau (40 km east of the site of the present study) were used to establish the soil stratigraphy. The peat layer in the mire has total volumetric contents of 5 % mineral and 15 % organic material and a porosity of 80 %. It is underlain by a saturated mineral silt layer with 50 % porosity above a mineral bedrock layer (3 % porosity, as in Westermann et al., 2013). Over the Šuoššjávri plateau, the soil stratigraphy features a significant spatial variability. The stratigraphy assumed in the model matches the western parts of the plateau, where strong subsidence is observed and from where annual volume changes for model comparison are obtained. In the eastern and southern parts (Fig. 2), the organic soil thickness is only shallow with morainic deposits close to the surface. This part is comparably stable and not targeted by our modeling.
Snow and soil parameters are based on the field measurements and the sensitivity tests from Martin et al. (2019). The simulations use a snow density of 230 kg m−3, consistent with measurements on top of the peat plateaus. Similarly, the soil field capacity used for the simulations is set to 55 %. Peat soil field capacity can display a pronounced variability (20 % to 60 % of the volumetric content; Walczak and Rovdan, 2002), and our value is consistent with field observations, e.g., from southern Siberian peatlands (Motorin et al., 2017). All other parameters (e.g., the surface energy balance parameterization) were selected as in Martin et al. (2019) and are presented in Appendix A4.
3.3.4 Steady-state climatic forcing and model spin-up
As presented in Martin et al. (2019), we use model forcings for the hydrological year 2015–2016 that have been compiled by dynamical downscaling of the ERA-Interim reanalysis (Dee et al., 2011) with the Weather Research and Forecasting model (WRF v.3.8.1; Skamarock and Klemp, 2008). The WRF model was run in two nested domains with 15 and 3 km grid spacings from August 2015 to July 2016. To generate the model forcing for CryoGrid3, we used 3-hourly output from the nearest grid point in the 3 km domain. The other model parameters for WRF were selected as in Aas et al. (2016), with the exception of slightly higher vertical resolution (45 model layers compared to 40) and excluding the climatic mass balance glacier module. The one-year forcing data are looped to generate a 100-year time series with steady-state climate forcing. To also achieve a realistic initial temperature profile in deeper layers, a 100-year spin-up is performed for all simulations using the /textit0 cm snow scenario for which the peat plateau is stable (Sect. 4.2). Note that the other snow scenarios cannot be used for model spin-up, as the plateau edge starts to retreat instantly so a true steady state cannot be reached. As shown in Fig. 1, the hydrological year 2015–2016 was relatively warm. It is 0.9 ∘C warmer and 4 % wetter than the decadal average from 2010 to 2019 (Sect. 2).
4.1 Measurements of microtopography evolution
The topographic changes of the Šuoššjávri peat plateau between September 2015 and September 2018 are presented in Fig. 6. From the DEM difference, we found that 19 % of the plateau displays 5 cm or more subsidence (i.e., the sensitivity threshold of the measurements), which consequently implies that 81 % of the plateau is stable during the observation period. The mean subsidence value (considering values larger than 5 cm) is 17±15 cm (1σ) and the median is 12 cm, with 1.2 % of the total plateau surface subsiding by more than 40 cm. The maximum observed subsidence is a 1 m2 patch in Zone 6, showing between 1.5 and 1.7 m of subsidence over the 3 years.
We extracted the outermost 2 m of the plateau edge which corresponds to one third of the total plateau surface but represents 77 % of the total subsidence (including the rims of the depressions within the plateau). The distribution of subsidence values for the whole plateau and the 2 m edge zone are presented in Fig. 7.
Due to the spatial variability in the peat plateau stratigraphy described in Sect. 3.3.3, the west side of the plateau features higher subsidence values than the east side. On the east side, ground subsidence is lower due to the limited thickness of the peat layer, with mineral soils at a depth of less than 1 m below the surface. A description of the eight edge transect areas and their subsidence between 2015 and 2018 is presented in Table 1. For these eight zones, the normalized annual volume change is 0.13±0.08 m3 yr−1 m−1. The mean HvsV shape index (Sect. 3.2) is 0.78±0.08, which suggests a dominance of edge degradation over uniform ground subsidence.
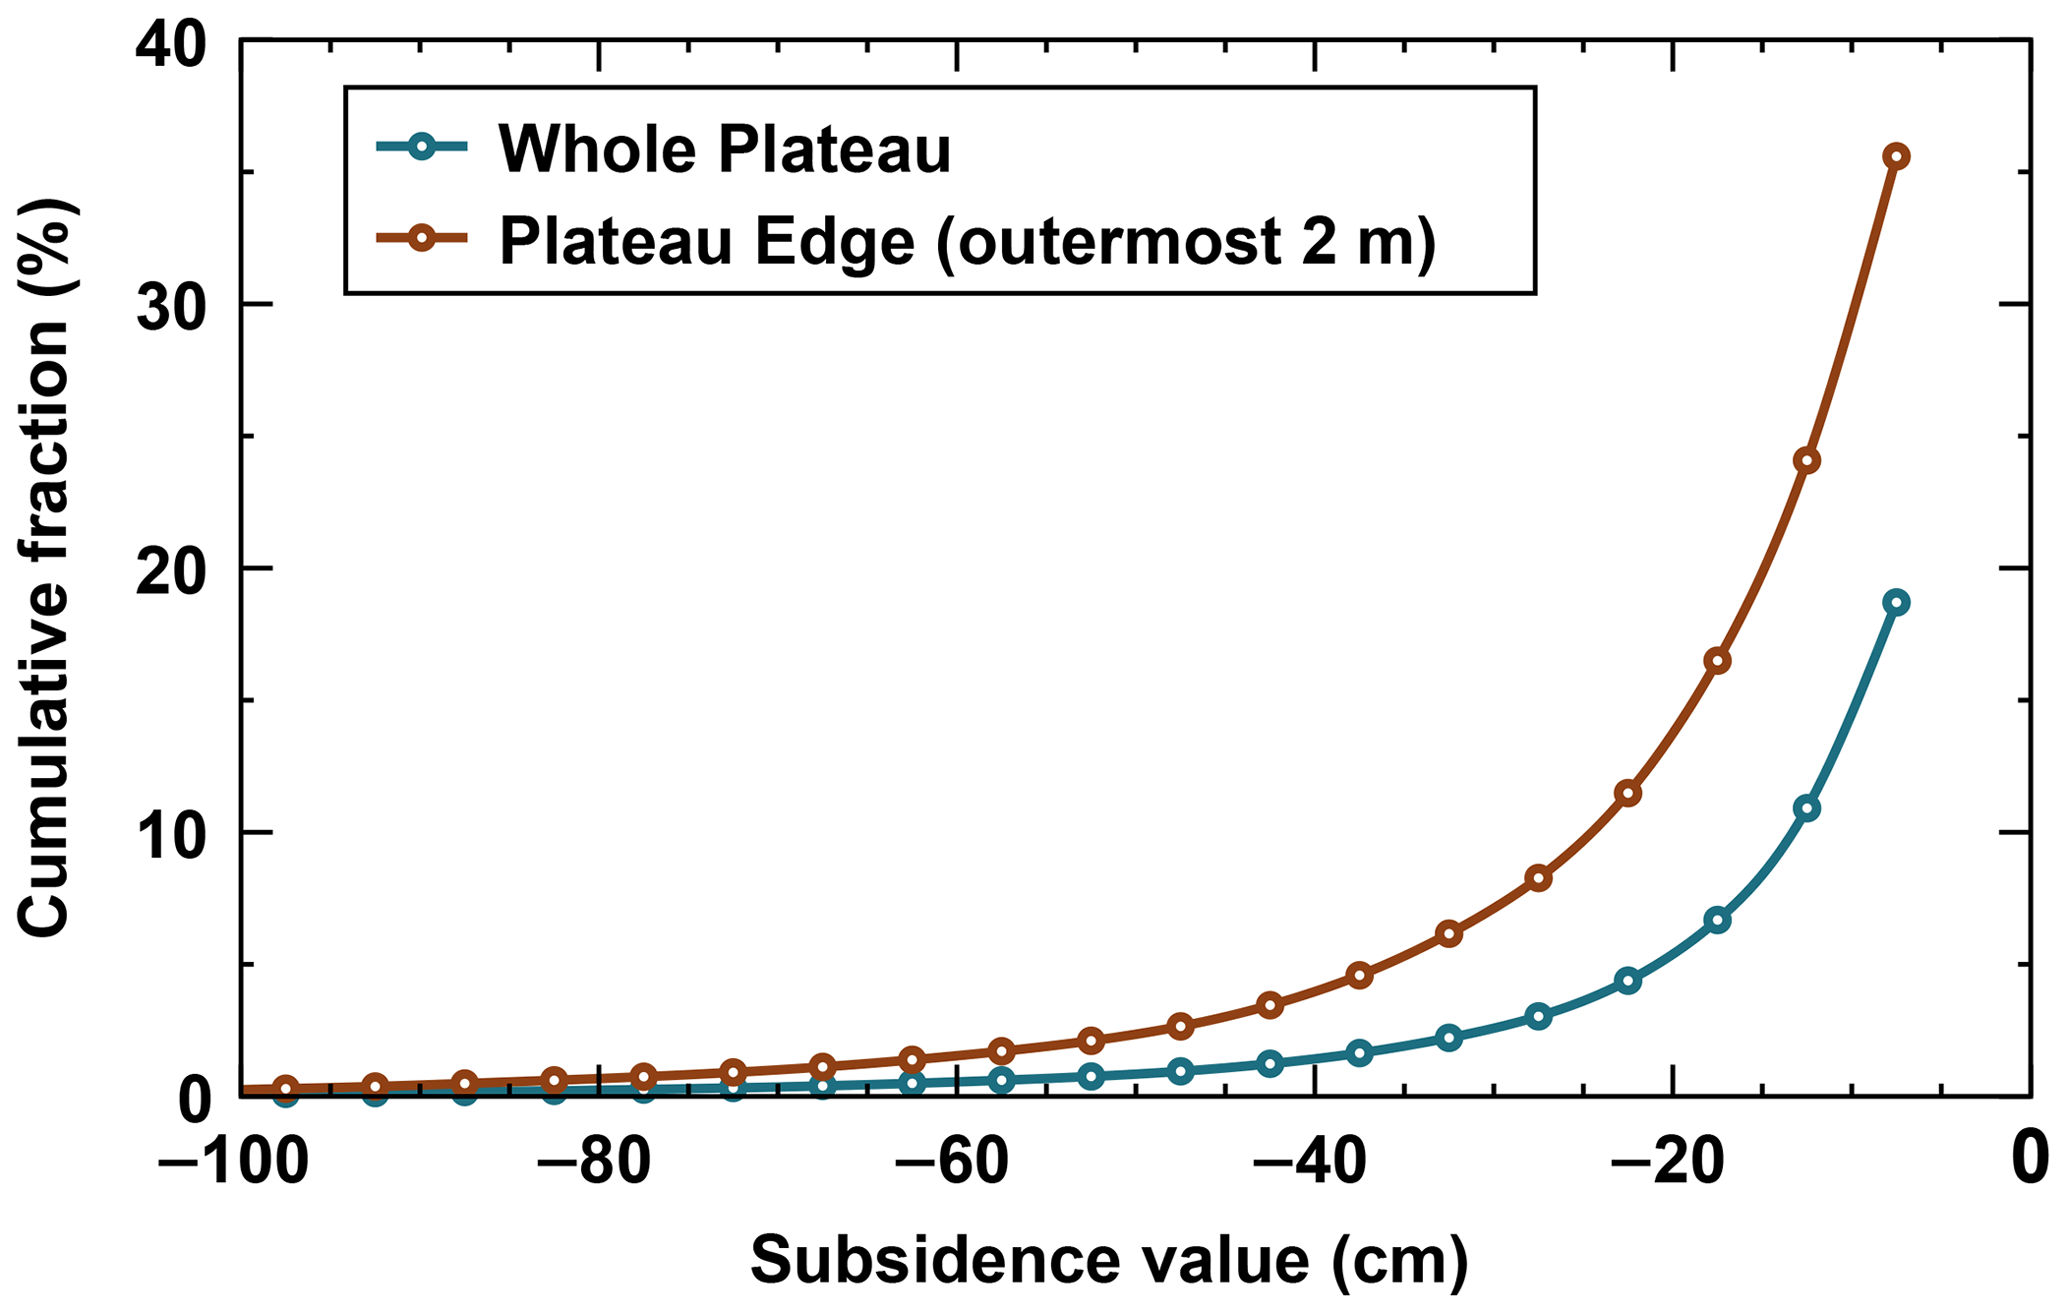
Figure 7Subsidence distribution for the Šuoššjávri peat plateau. The edge is taken as the outermost 2 m of the plateau. Only subsidence values greater than 0.05 m are considered in this graph to guarantee a meaningful subsidence signal. Data are derived from the topography difference between 2015 and 2018. The percentages indicate which proportion of the total area (whole plateau or plateau edge) is affected by a subsidence higher than or equal to (in absolute value) a given subsidence value (e.g., 36 % of the edge exhibits a subsidence higher than or equal to 5 cm).
4.2 Simulations of microtopography evolution
Results from the model simulations are presented in Fig. 8. The temporal evolution of the peat plateau microtopography shows an edge retreat, while a large part of the plateau is stable, as is observed in the DEM difference (Sect. 4.1). The temporal evolution and patterns of simulated edge retreat show a pronounced dependence on the snow depth on the peat plateau. The 0 cm snow simulation (with complete transport of the snow from the plateau towards the mire) shows no lateral thermokarst of the plateau, whereas the simulation with the thinnest snow depth (5–10 cm snow) triggers an edge retreat of 4 to 5 m over the 100 years of the simulation. For the 10–20 cm snow and 20–30 cm snow simulations, the plateau fully degrades within the simulation time, with notable differences in profile evolution between simulations. While the plateau fully degrades at the end of the 100 years of the simulation for the 10–20 cm snow simulation, it occurs within 40 years for the 20–30 cm snow simulation.
From the evolution of the idealized topography in the three simulations, we can identify three different types of simulated lateral thermokarst. For both the 5–10 cm snow and 10–20 cm snow simulations, the plateau degradation first shows a phase of slope adjustment during which the slope angle gradually decreases over time. We denote this phase as the “initial slope adjustment” (ISA; Figs. 8 and 9). This phase lasts for 40 years in the 5–10 cm snow simulation and 30 years for the 10–20 cm snow simulation. Following the initial slope adjustment, lateral thermokarst affects the slope in a more uniform way in these two simulations, and the plateau edge retreats at a constant rate without changes of the slope angle. We denote this phase the “constant edge degradation” (CED; Figs. 8 and 9), which lasts for 60 years for the 5–10 cm and for 20 years for the 10–20 cm snow simulation. During the second half of the 10–20 cm snow simulation, both the edge and the top of the plateau subside. We denote this phase as “plateau collapse” (PC; Figs. 8 and 9). Contrary to the 10-20 cm snow simulation, the 20—30 cm snow simulation does not show the phases of initial slope adjustment and constant edge degradation but only the plateau collapse phase.

Figure 8Surface elevation profiles of the peat plateaus as simulated with CryoGrid3 for different snow depths on top of the plateau in time increments of 10 years. Three phases are identified (see text): initial slope adjustment (slope modifications along time), constant edge degradation (slope conserved) and plateau collapse (subsidence over the full plateau). Note that the /textit0 cm snow simulation (not shown) did not produce any changes to the initial topography.
The top panel of Fig. 9 presents the normalized annual volume change. For the 5–10 cm snow simulation, this volume change is constant at around 0.06 to 0.08 m3 yr−1 m−1. For the 10–20 cm snow simulation, the volume change during the initial slope adjustment and the constant edge degradation phases show a steady increase from 0.08 to 0.28 m3 yr−1 m−1. During the plateau collapse phase, this volume change steadily decreases to 0.12 m3 yr−1 m−1 at the end of the simulation. For the 20–30 cm snow simulation, the volume change reaches 0.28 m3 yr−1 m−1 in the first decades and stabilizes at this value for 10–20 years before increasing rapidly to 0.35 m3 yr−1 m−1, at which point it stabilizes until the end of the simulation. A comparison between simulated and measured ground surface temperatures (time series from Martin et al., 2019) is presented in Appendix A1 (Fig. A1), showing an overall good agreement.
4.3 Comparison of model results and topographic measurements
A comparison of the Šuoššjávri peat plateau lateral thermokarst patterns between field data and simulations is presented in the two bottom panels of Fig. 9. Field values represent average and standard deviation of the field measurements of the measured variables (Sect. 3.3 and Table 1). For each simulation, we average the volume loss and shape index over the ISA, CED and PC phases(Sect. 4.2).
Overall, field-based and simulated volume changes are in a similar range. The mean field value of 0.13±0.08 m3 yr−1 m−1 is compatible with the different degradation phases observed for the 5–10 cm snow and 10–20 cm snow simulations. The 5–10 cm snow simulation shows little spread and smaller values than the average field value (< 0.1 m3 yr−1 m−1 in absolute value), whereas the 10–20 cm snow simulation displays a greater spread and larger volume changes than the average field value (between 0.1 and 0.25 m3 yr−1 m−1). The 20–30 cm snow simulation displays volume losses substantially higher than the field values (> 0.25 m3 yr−1 m−1).
For the HvsV shape index, the initial slope adjustment phases for both the 5–10 cm snow and the 10–20 cm snow simulations show values of 1, slightly larger than the field-derived value (0.84±0.09). Both constant edge degradation phases are in line with field observations with a larger spread within the simulations than the field values. Because both are characterized by simultaneous edge degradation and subsidence of the entire plateau surface, the two plateau collapse phases (for the 10–20 cm snow and 20–30 cm snow simulations) feature HvsV values significantly smaller than the field values (< 0.6).
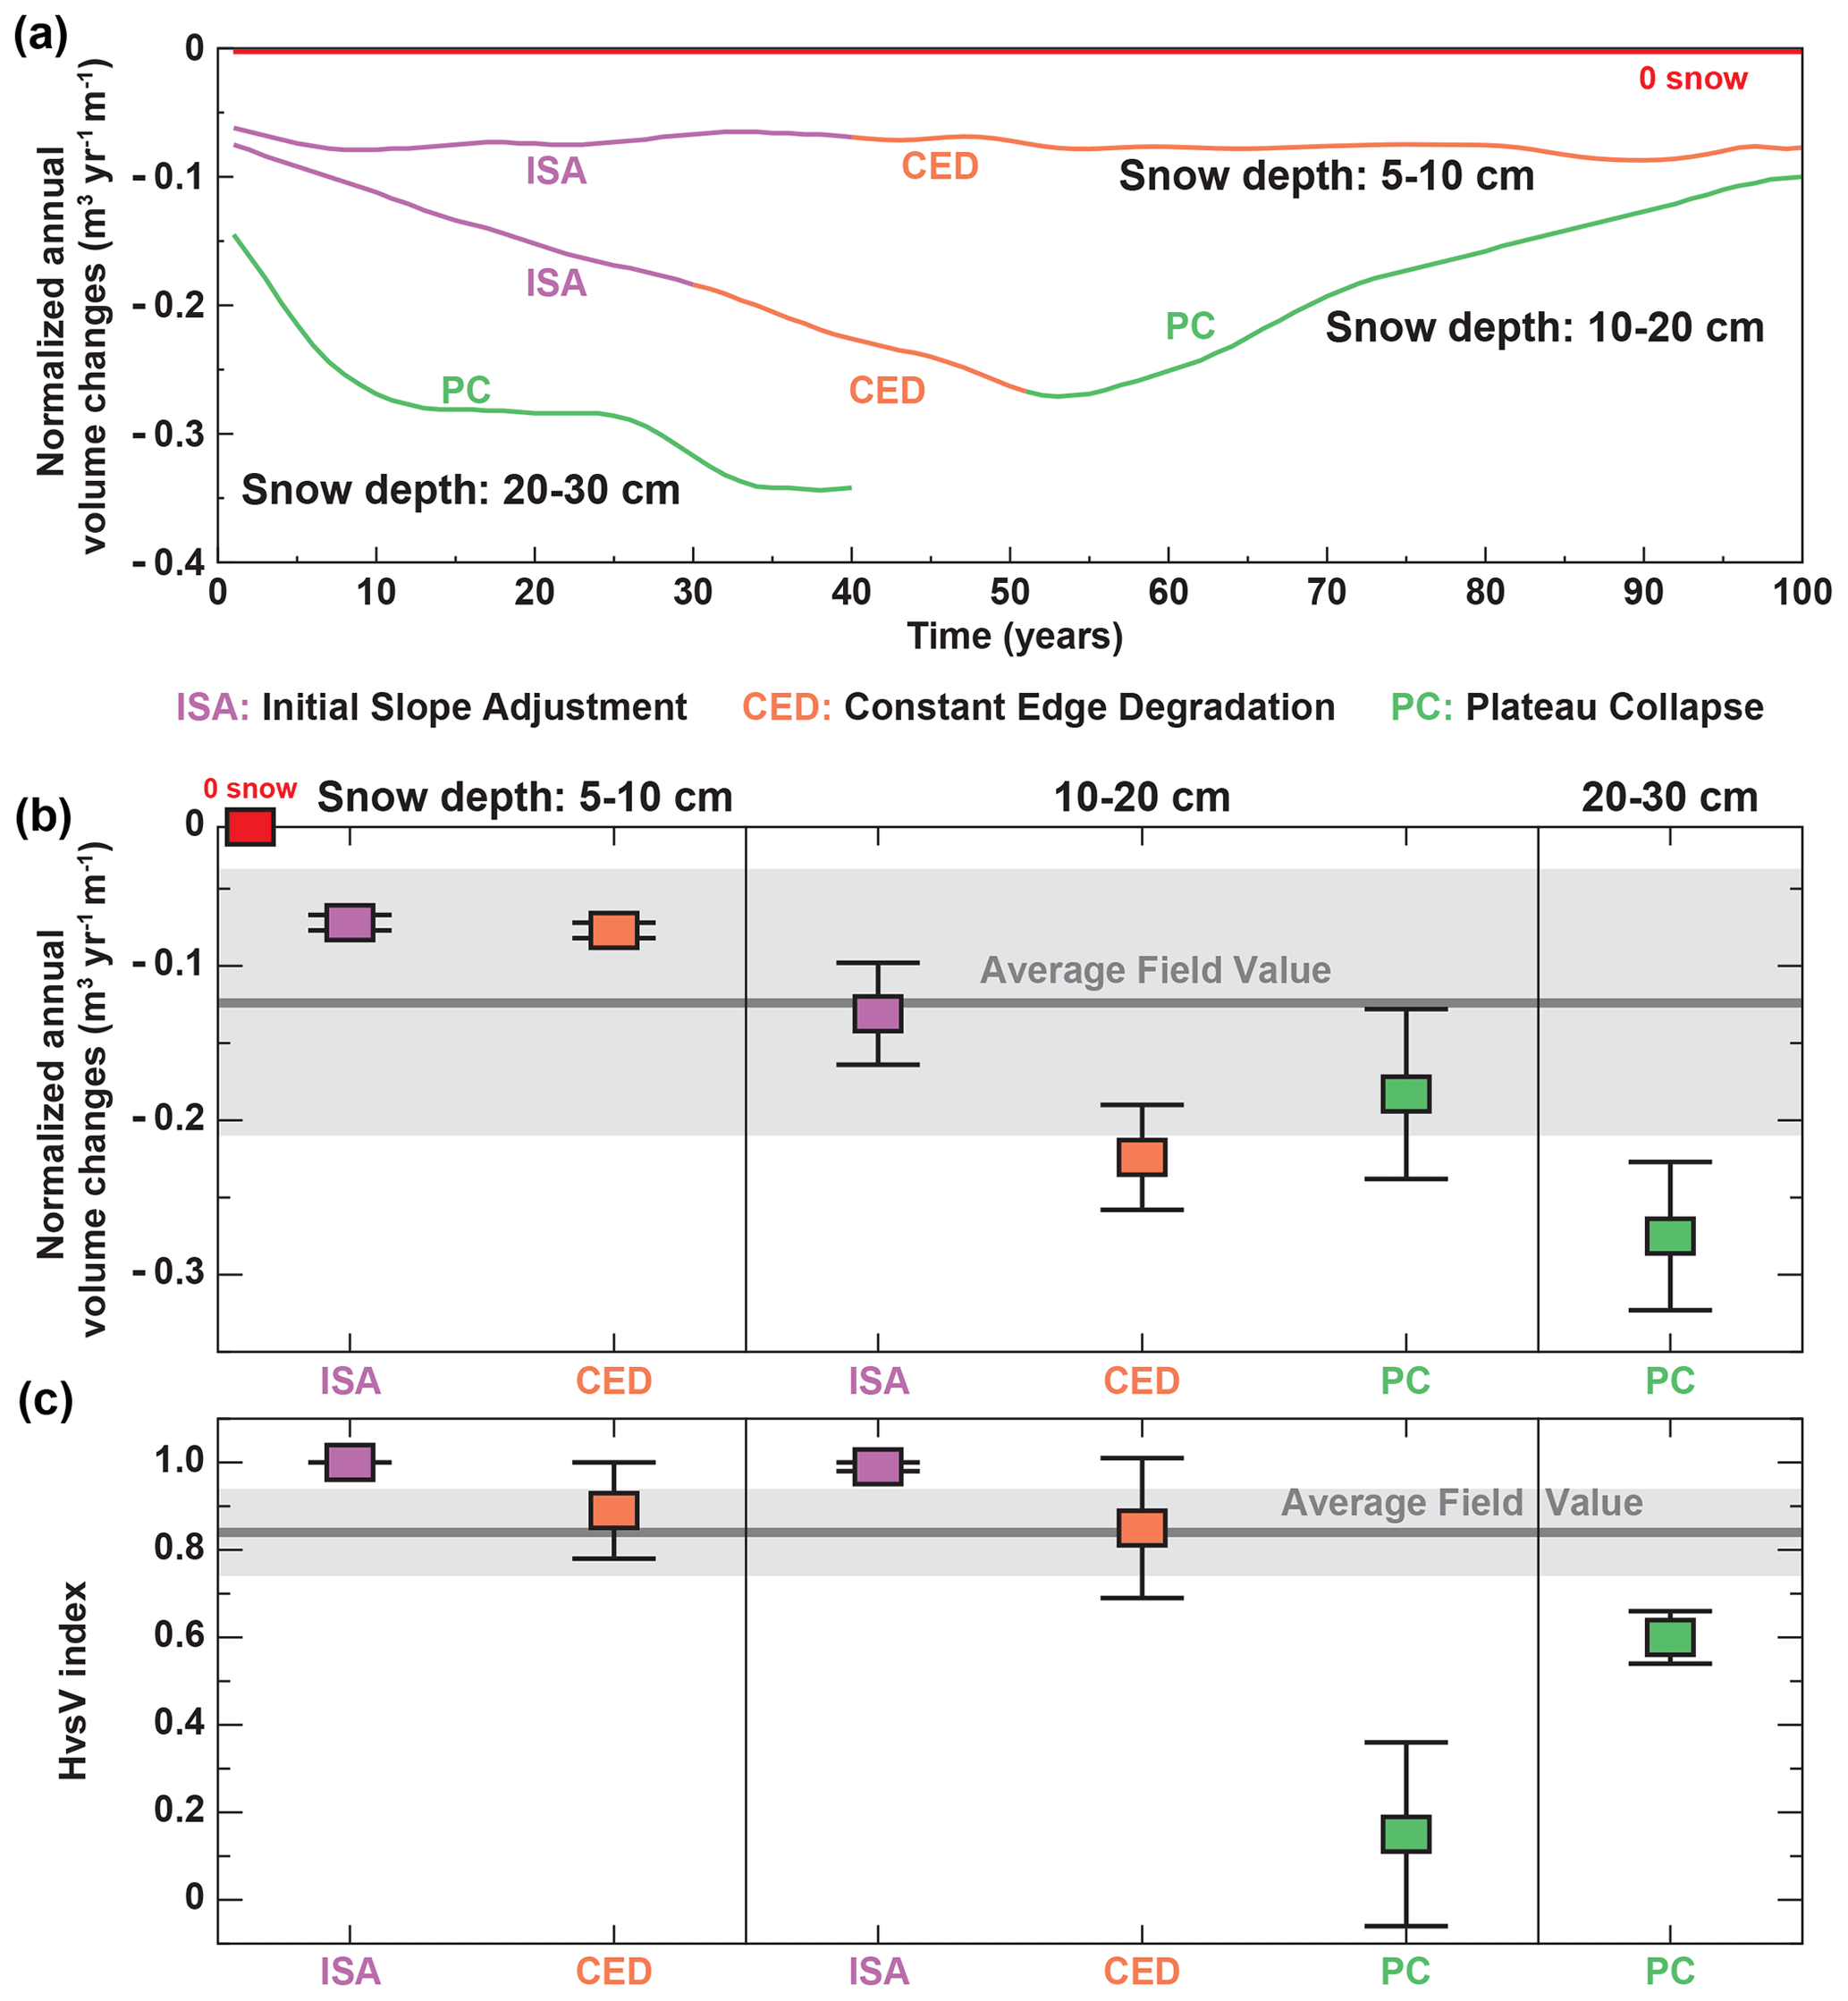
Figure 9(a) Normalized annual volume changes for the three snow scenarios. (b) Comparison of volume changes and shape index between observations and simulations. Observations (gray line and shading) are means and standard deviations of the variables in the eight edge transect areas presented in Table 1. The values derived from simulations are mean and standard deviations taken over the different periods of the simulations. See Fig. 8 and Sect. 4.2. for a description of the three degradation phases. No subsidence occurred for the 0 snow simulation (red square).
5.1 Field measurements
Based on dGPS measured ground control points, the vertical accuracy of the drone-based DEMs is estimated at 2.6 cm (Sect. 3.1), but shadows, changing cloudiness or strong reflectance contrasts near water bodies can create artifacts in the acquisitions, which locally might cause larger deviations. When comparing elevation differences between two DEMs, vegetation growth, the presence or absence of leaves and water level variations can add noise to the results. To account for these possible flaws when computing elevation differences, we only considered variations higher than 5 cm, which is double that of the mean difference between the elevation of the ground control points (measured with a dGPS) and their counterpart on the DEMs (2.6 cm). This value finds good consistency with values from the literature (Forlani et al., 2018; Jaud et al., 2016). In comparison, our results show that actively degrading zones of the plateau are associated with subsidence values higher than 20 cm that can reach 1 m and more. These values are significantly higher than the 2.6 cm average discrepancy between the DEMs and dGPS measured ground control points, so the DEM accuracy does not affect the volume changes strongly (Table 1). Yet, the evaluation of elevation accuracy derived from this technique will benefit from additional studies confirming these results. Additionally, as described in Sect. 3.2, we acquired the volume changes for the plateau based on an estimation of the elevation of the inflection point of its edge, from which we derived its contour in the 2015 and 2018 DEMs. In case of high vegetation and uneven or gentle slopes, this method to delineate the peat plateau contours can introduce additional uncertainty. However, we carefully checked that this was not the case for the sections analyzed in Table 1.
At the western edge of the Šuoššjávri plateau, subsidence is highly variable, ranging from 0 to more than 1 m within 3 years. This pattern highlights the highly complex and irregular behavior of ice-rich permafrost landscapes (Nitzbon et al., 2019; Osterkamp et al., 2009). When an initial perturbation, for example intense rainfall or above-average snow accumulation, triggers subsidence (Seppälä, 1988, 2011), both the snow redistribution and the subsurface drainage towards the mire are affected, which creates warmer surface conditions and, in return, results in more subsidence. Considering the complex geometry of the Šuoššjávri plateau edges, meter-scale variability of the snow and hydrological conditions likely contribute to observed variability of ground subsidence. Furthermore, heat transfer between the wet mire and the plateau is likely influenced by the geometry of the plateau-mire interface. As an example, zones 1, 2, 4 and 6 belong to convex features of the plateau edges and show particularly high subsidence rates. Finally, the distribution of the excess ice in the ground plays an important role for the timing and magnitude of subsidence. Heterogeneous excess ice distribution throughout the plateau may be an important driver of the observed spatial variability of the edge degradation.
Our results confirm that edge degradation is a major degradation pathway of peat plateaus with 77 % of the total subsidence occurring within the outermost 2 m of the Šuoššjávri plateau. This result shows consistency with Jones et al. (2016) who reported that 85 % of the degradation of forested permafrost plateaus was due to lateral degradation along the margins. Between 2015 and 2018, we find that the Šuoššjávri plateau lost 3.2 % of its surface area. Applying Eq. (A1) (Appendix A5), the aerial change corresponds to an average annual rate of surface loss of 1.1 % yr−1. Reconstructing the Šuoššjávri peat plateau extent from 1956 to 2011 with aerial imagery, Borge et al. (2017) observed annual loss rates with the peat plateau extent of the year 1956 as reference. Using Eq. (A1), we compute the average annual rate of surface loss from their data to be 0.5 % yr−1 from 1956 to 1982, 0.8 % yr−1 from 1982 to 2003 and 1.4 % yr−1 from 2003 to 2011. Hence, the retreat rate found in this study rate is in good agreement with the long-term retreat rates. Note that Borge et al. (2017) also included small palsas in the surrounding area in their assessments, which show faster degradation rates than the peat plateau, so the two values cannot be compared in a strict sense.
5.2 Model results
5.2.1 Simulated plateau degradation through lateral thermokarst
Our modeling framework relies on an idealized geometry and steady-state climate forcing, so the full variety of the observed thermokarst patterns cannot be reproduced. However, the comparison between model results and observations clearly shows that the numerical model framework can capture the correct order of magnitude of the degradation processes, while also reproducing key patterns in the observed ground temperature regime (Appendix A1, Fig. A1).
Among the different degradation phases (initial slope adjustment, constant edge degradation and plateau collapse), the CED phase is most relevant for the comparison to field observations, as it is characterized by steady edge retreat in response to the steady-state climate forcing while the bulk of the peat plateau remains stable. On the other hand, the ISA phase is essentially an adjustment to the change in snow depth conditions from the no snow scenario used for initialization to the scenarios with non-zero snow depth, which are characterized by edge retreat. The PC phase corresponds to the sustained collapse of a plateau with ground subsidence in all parts, which is not observed for the Šuoššjávri peat plateau but regularly occurs for smaller circular palsas in the vicinity. As palsas are often small rounded peat bodies, the assumption of translational symmetry inherent in our model setup (Fig. 5) is not valid. For these features, simulations should be performed for cylindrical symmetry, which better describes the geometry of small palsas (as done in simulations by Aas et al., 2019). This suggests that our simulations are indeed most realistic during the CED phase, whereas changes of the overall geometry of the peat plateau must be taken into account to model the final stages of degradation.
5.2.2 Sensitivity of lateral thermokarst to snow depth
Our simulations confirm the crucial role of snow on the ground thermal regime and peat plateau degradation. They show that a stability threshold is crossed between zero (stability) and 10 cm snow depth (lateral thermokarst). Even though the absolute value of this threshold cannot be generalized due to our simplistic snow model and the interplay of climatic parameters, it is broadly consistent with field experiments involving human-made snow clearance in permafrost-free mire areas in northern Scandinavia, which resulted in the formation of new palsas (Seppälä, 1982, 1995). However, it is possible that our simulations slightly overestimate the sensitivity of edge retreat to snow depth variations, with the true stability threshold at higher snow depths. While measured March snow depths in 2015–2018 regularly exceeded 20–30 cm (Fig. 3), our simulations show higher than measured volume changes for the 20–30 cm snow scenario (Fig. 9). This behavior could at least be partly related to above average air temperature of the hydrological year 2015–2016 used to force the model (Fig. 1), which should be clarified with transient simulations in future studies (Sect. 5.3.2).
Our idealized model approach assumes snow depths to be constant on the entire peat plateau, which does not capture the significant spatial and interannual variability of snow depths on the plateau observed in measurements (Fig. 3). In particular, the complex geometry of snow drift patterns along the plateau edges, with snow drifts forming on lee sides, is not captured by the simple snow redistribution model implemented in CryoGrid3. Field observations show that snow drifts along the plateau edges feature considerably higher snow depths than the surrounding wet mire, thus introducing additional winter warming in the zone of maximum change. Additionally, persistent wind patterns can strongly influence the distribution of snowdrifts. In CryoGrid3, on the other hand, snow removed from the plateau is evenly distributed over the entire mire, not taking edge effects into account.
Furthermore, our model assumes a fixed snow density and thus snow thermal properties, while snow densities in reality vary with, e.g., snow depth and time. A density increase from 200 to 300 kg m−3 may correspond to a doubling of thermal conductivity, depending on the snow type (Sturm et al., 1997). Measurements of snow density in Šuoššjávri showed that the snow on top of palsas is slightly less dense than in the mire. This could be due to a thinner snowpack leading to greater kinetic metamorphism (snow metamorphism driven by strong temperature gradient in the snowpack) and the formation of depth hoar crystals, which are characterized by high porosity and low effective thermal conductivity (Colbeck, 1982; Schneebeli and Sokratov, 2004). A thinner snowpack also implies a lower overburden pressure and therefore less compaction. Such limitations could be moderated by using more sophisticated snow models taking snow microphysics and the transient evolution of snow density into account, such as CROCUS (Vionnet et al., 2012) or SNOWPACK (Bartelt and Lehning, 2002). Yet, even these models show limitations to reproduce the thermal characteristics of snow deposited in Arctic regions as they do not account for the vapor fluxes in the snow pack, which significantly affect the snow thermal conductivity profile (Domine et al., 2016).
5.3 Implications for simulations of climate-driven changes of permafrost landscapes
5.3.1 Sensitivity to climate forcing and perturbations
In this study, we demonstrate that the snow depth on the plateau exerts a strong control on subsidence patterns. Our experiment shows that snow depth alone can drive important surface temperature changes and permafrost disappearance. This result illustrates that permafrost disappearance is not only a function of temperature (Chadburn et al., 2017) and that plateau systems can react sensitively to different climatic parameters affecting surface temperature. As such, snow precipitation and wind speed variations (which both affect snow pack buildup) should also be regarded as important drivers of the evolution of peat plateaus. In this regard, future precipitation patterns are expected to show an increase of rainfall, partially at the expense of snowfall because of atmospheric warming (Bintanja and Andry, 2017). Yet at the regional level, these changes are highly uncertain (O'Gorman, 2014) but must be taken into account when projecting the future evolution of peat plateaus in the subarctic.
The presented model approach (including excess ice and small-scale representation of lateral fluxes) is clear evidence of the importance of a small-scale thaw feedback mechanism on permafrost degradation. The feedback between the dynamic microtopography and the lateral fluxes of water, heat and snow shows how a limited increase in snow cover (e.g., from the 10–20 cm snow to the 20–30 cm snow scenario) results in a strongly increased degradation rate. This sensitivity to small perturbation has been observed in a range of permafrost settings when artificially increasing snow depth with a fence (Hinkel and Hurd, 2006), when building linear road infrastructures (Schneider von Deimling et al., 2021) or due to heavy vehicle traffic in Alaskan lowlands (Raynolds et al., 2020).
5.3.2 Future model improvements
Our simple approach is not able to capture the complex patterns of different subsidence rates that are observed around the edges of the plateau (Fig. 6). In addition to small-scale variations of ground stratigraphy, excess ice content and plateau heights, our observations suggest that the irregular plateau outline with both concave and convex shapes affects the lateral fluxes of heat, water and snow, which in turn exert a control on the edge dynamics (Sect. 5.1). While computationally demanding, our multi-tile approach could be embedded in an ensemble framework to represent a range of edge geometries and other critical parameters, yielding a range of different degradation scenarios and therefore capture the high spatial variability of subsidence at the plateau scale. Further sensitivity tests with steady-state climate forcing should focus on the role of air temperature (colder or warmer), total precipitation and excess ice content on peat plateau stability and lateral thermokarst patterns.
In our experiment, the modeling scheme shows a sensitivity of the plateau retreat to different surface temperatures resulting from the different prescribed snow depths. Because other climatic parameters than snow depth can affect surface temperature, this indicates that our scheme may also be able to simulate the plateau response to a temperature increase, paving the way for climate change simulations. Transient simulations should ideally be initialized with a model spin-up for a period during which the peat plateau is stable; otherwise, lateral thermokarst will already occur during the model spin-up phase. For Scandinavia, the ideal period would be the Little Ice Age, when most of the present-day peat plateaus were formed (Kjellman et al., 2018). Future studies should therefore investigate if the simple multi-tile setup can capture changes in peat plateau stability in the transition from the Little Ice Age to the warmer conditions of the 20th century during which peat plateaus in Finnmark likely entered their current state of accelerating degradation (e.g., Borge et al., 2017). Further benchmark simulations with the multi-tile model could focus on peat plateau areas in colder climates that are still stable today. A significant challenge, in particular for model simulations on long timescales (e.g., extending to the Little Ice Age), is to obtain accurate enough model forcing, as biases in the model forcing could shift or even mask climatic thresholds for peat plateau stability.
5.3.3 Permafrost modeling with Earth system model land surface schemes
Most land surface models (LSMs) that simulate the future response of permafrost to climate change rely on simplified 1D implementations of permafrost thaw dynamics, which ignore subsidence and only reflect gradual top-down thawing of the frozen ground (Andresen et al., 2020; Burke et al., 2020). Excess ice melt and the resulting microtopography changes exert a major control on the evolution of hydrologic conditions, which in turn strongly influence the timing of permafrost degradation, as demonstrated for polygonal tundra (Nitzbon et al., 2019, 2020). Aas et al. (2019) presented a similar approach for peat plateaus in northern Norway. It is based on two tiles (one for the wet mire, one for the plateau) and reproduces both climate-induced stability and degradation. However, in this approach, the plateau subsides as a whole when a climate-related threshold is exceeded and excess ice begins to melt. This contrasts with our field observations, which show ongoing edge retreat on decadal timescales, while the plateau interior is largely stable. Our approach uses a larger number of tiles to explicitly represent the temperature and soil moisture gradients across the plateau edges, which causes excess ice melt to only occur in a narrow zone at the plateau edge, in agreement with observations. Over longer timescales, on the other hand, this process leads to the reshaping and finally the complete collapse of the entire peat plateau. In Earth system model frameworks, implementing a multi-tile approach for the land surface scheme is challenging due to its complexity and computational demands. Yet, parameterized approaches could eventually be developed based on sensitivity tests with future generations of higher-complexity multi-tile frameworks (Sect. 5.3.2). In particular, future studies should investigate to what extent the two-tile approach demonstrated by Aas et al. (2019) can emulate the results of a multi-tile model, especially when not only applied to single sites, but to the entire sub-Arctic where peat plateaus occur today. However, our multi-tile setup clearly produces different thaw dynamics at the scale of individual sites, which might affect the modeled carbon balance. To investigate this issue further, a multi-tile model coupled to a carbon cycling scheme would be required.
We present field measurements and numerical modeling of lateral thermokarst patterns of the Šuoššjávri peat plateau in northern Norway. We use high-resolution digital elevation models derived from drone-based photogrammetry to quantify changes of surface elevations of the plateau between September 2015 and 2018. The study shows that the edges of the peat plateau are hot spots for thermokarst, where 77 % of the total measured volume change occurred, while most of the total plateau surface does not show detectable changes in surface elevation. Lateral thermokarst is therefore the main pathway for the degradation of the peat plateau. We show that this retreat corresponds to a normalized annual volumetric loss of 0.13±0.07 m3 yr−1 m−1 for the zones we studied.
Using the CryoGrid3 land surface model we show that these thermokarst patterns can be reproduced numerically in a framework that implements lateral redistribution of snow, subsurface water and heat, as well as excess ice-melt-triggered subsidence. Overall, the modeled annual volume changes are on the same order of magnitude as the measurements. Based on a steady-state climate forcing, our simulations demonstrate the importance of the shallow snow cover on the plateau due to wind drift of snow to the lower-lying mire areas. The modeled peat plateau is fully stable when all snow on its top is removed towards the mire (0 cm snow depth on the plateau), whereas its edges retreat at increasing rates with increasing snow depths. For the model forcing applied in our simulations, a maximum of 5–10 cm of snow on the plateau only triggers an edge retreat of 4–5 m within 100 years. A snow cover of 10–20 cm depth fully degrades the plateau (assumed 11 m wide) in 100 years, while this time is reduced to 40 years for an even higher snow cover of 20–30 cm.
These results highlight the fast dynamics and high spatial variability of permafrost landscape evolution in response to climate change. They also show that the related changes in microtopography and the thermal and hydrological regime can be represented in numerical models, thus showing a way forward towards substantial improvements in simulating permafrost landscape evolution and its impact on greenhouse gas emissions.
A1 Comparison of model output and field measurements
Figure A1 compares the mean annual ground surface temperatures (MAGSTs) and the active layer thickness (ALT), as they are simulated in this study and in Martin et al. (2019) with field measurements from the same study. Note that Martin et al. (2019) used a 1D model, which did not include the possibility to simulate thermokarst processes. Overall, our simulations show good agreement with field measurements. However, they feature a smaller variability than the observations because the variability of the simulations is diagnosed for one idealized peat plateau profile, whereas the variability in the observations is derived from individual points distributed over the plateau, which each feature different overall conditions (e.g., snow cover buildup, drainage regime). As discussed in Sect. 5.3.2 ensembles of simulations exploring different geometries and parameter sets would be required to match the variability of the observations.
While MAGSTs from the present study are in good agreement with the measurements on the peat plateau, the model underestimates temperatures in the mire slightly (0.5 ∘C too cold). The active layer thickness is overestimated by 20 to 30 cm for snow depths smaller than 10 cm. This could be due to potentially omitted processes in the model such as the formation of segregation ice at the bottom of the active layer in winter.
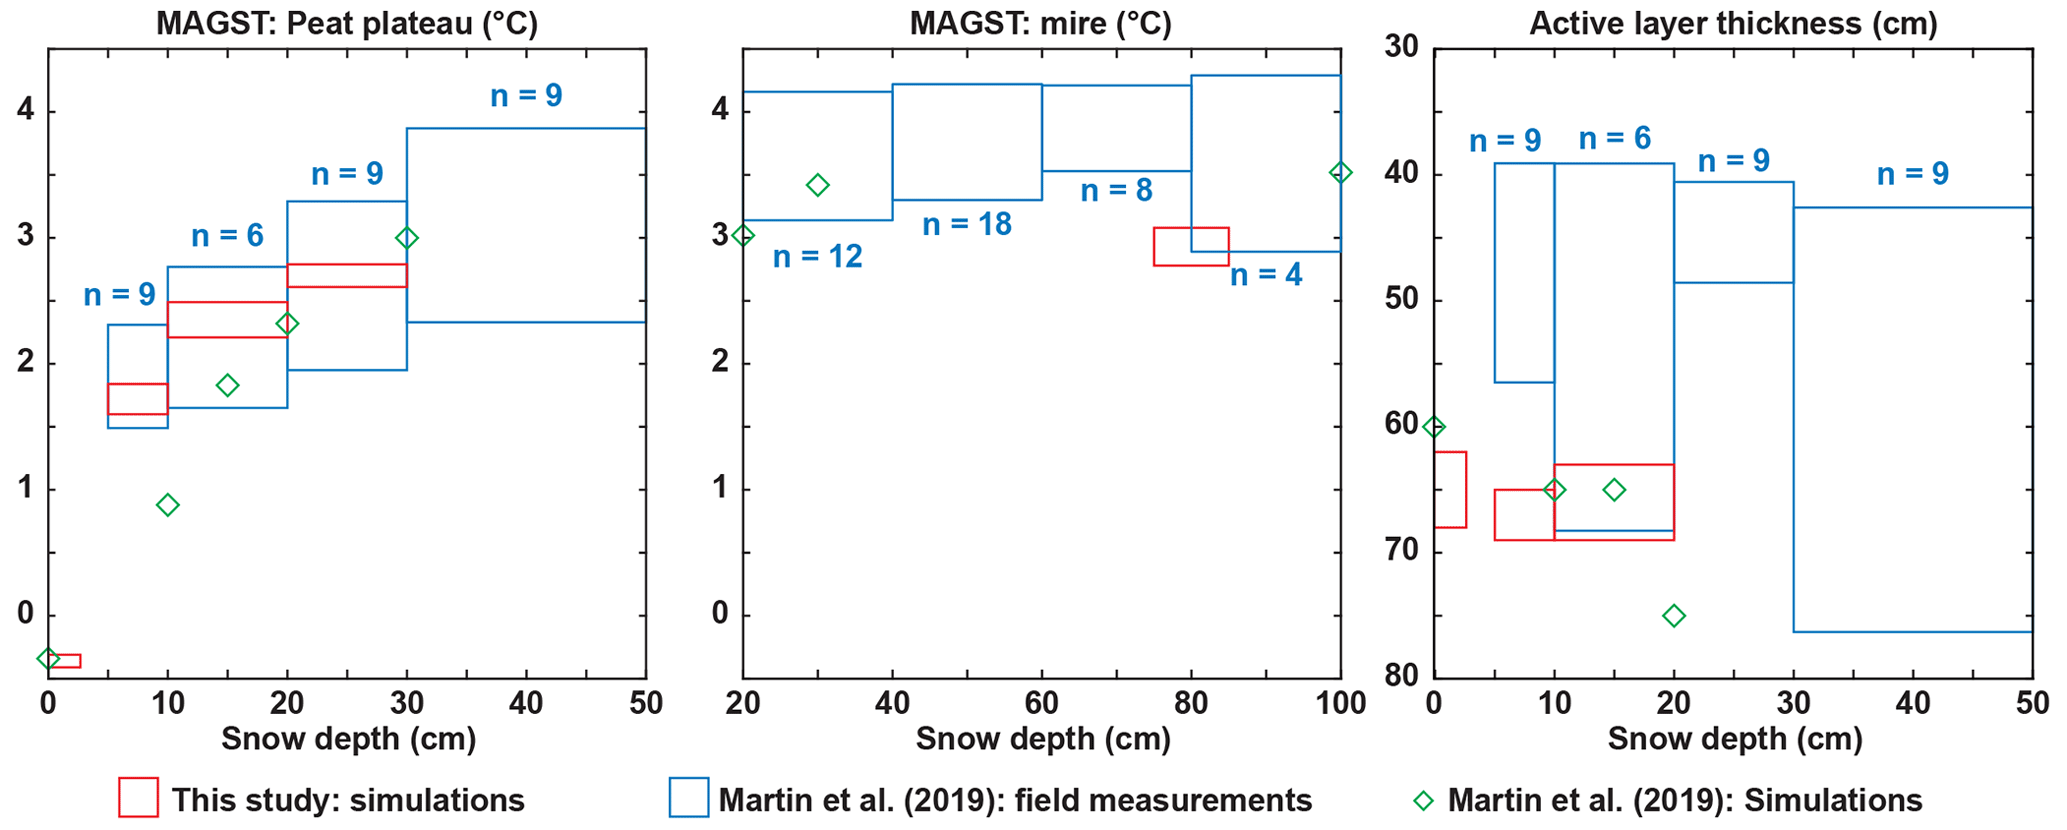
Figure A1Mean annual ground surface temperature (MAGST) and active layer thickness as they are simulated in this study and in Martin et al. (2019) compared to the field measurements from Martin et al. (2019) for the same region. Values indicated with the letter n correspond to the number of field observations in Martin et al. (2019). The snow ranges on the x axis are those used for the modeling work of the present study. Observations from Martin et al. (2019) have been distributed in these ranges for comparison. Vertically, MAGST and ALT values span over the mean ±1 standard deviation range for both observations (variability among observations) and simulations (variability among the tiles of a simulation).
A2 Geomorphological settings
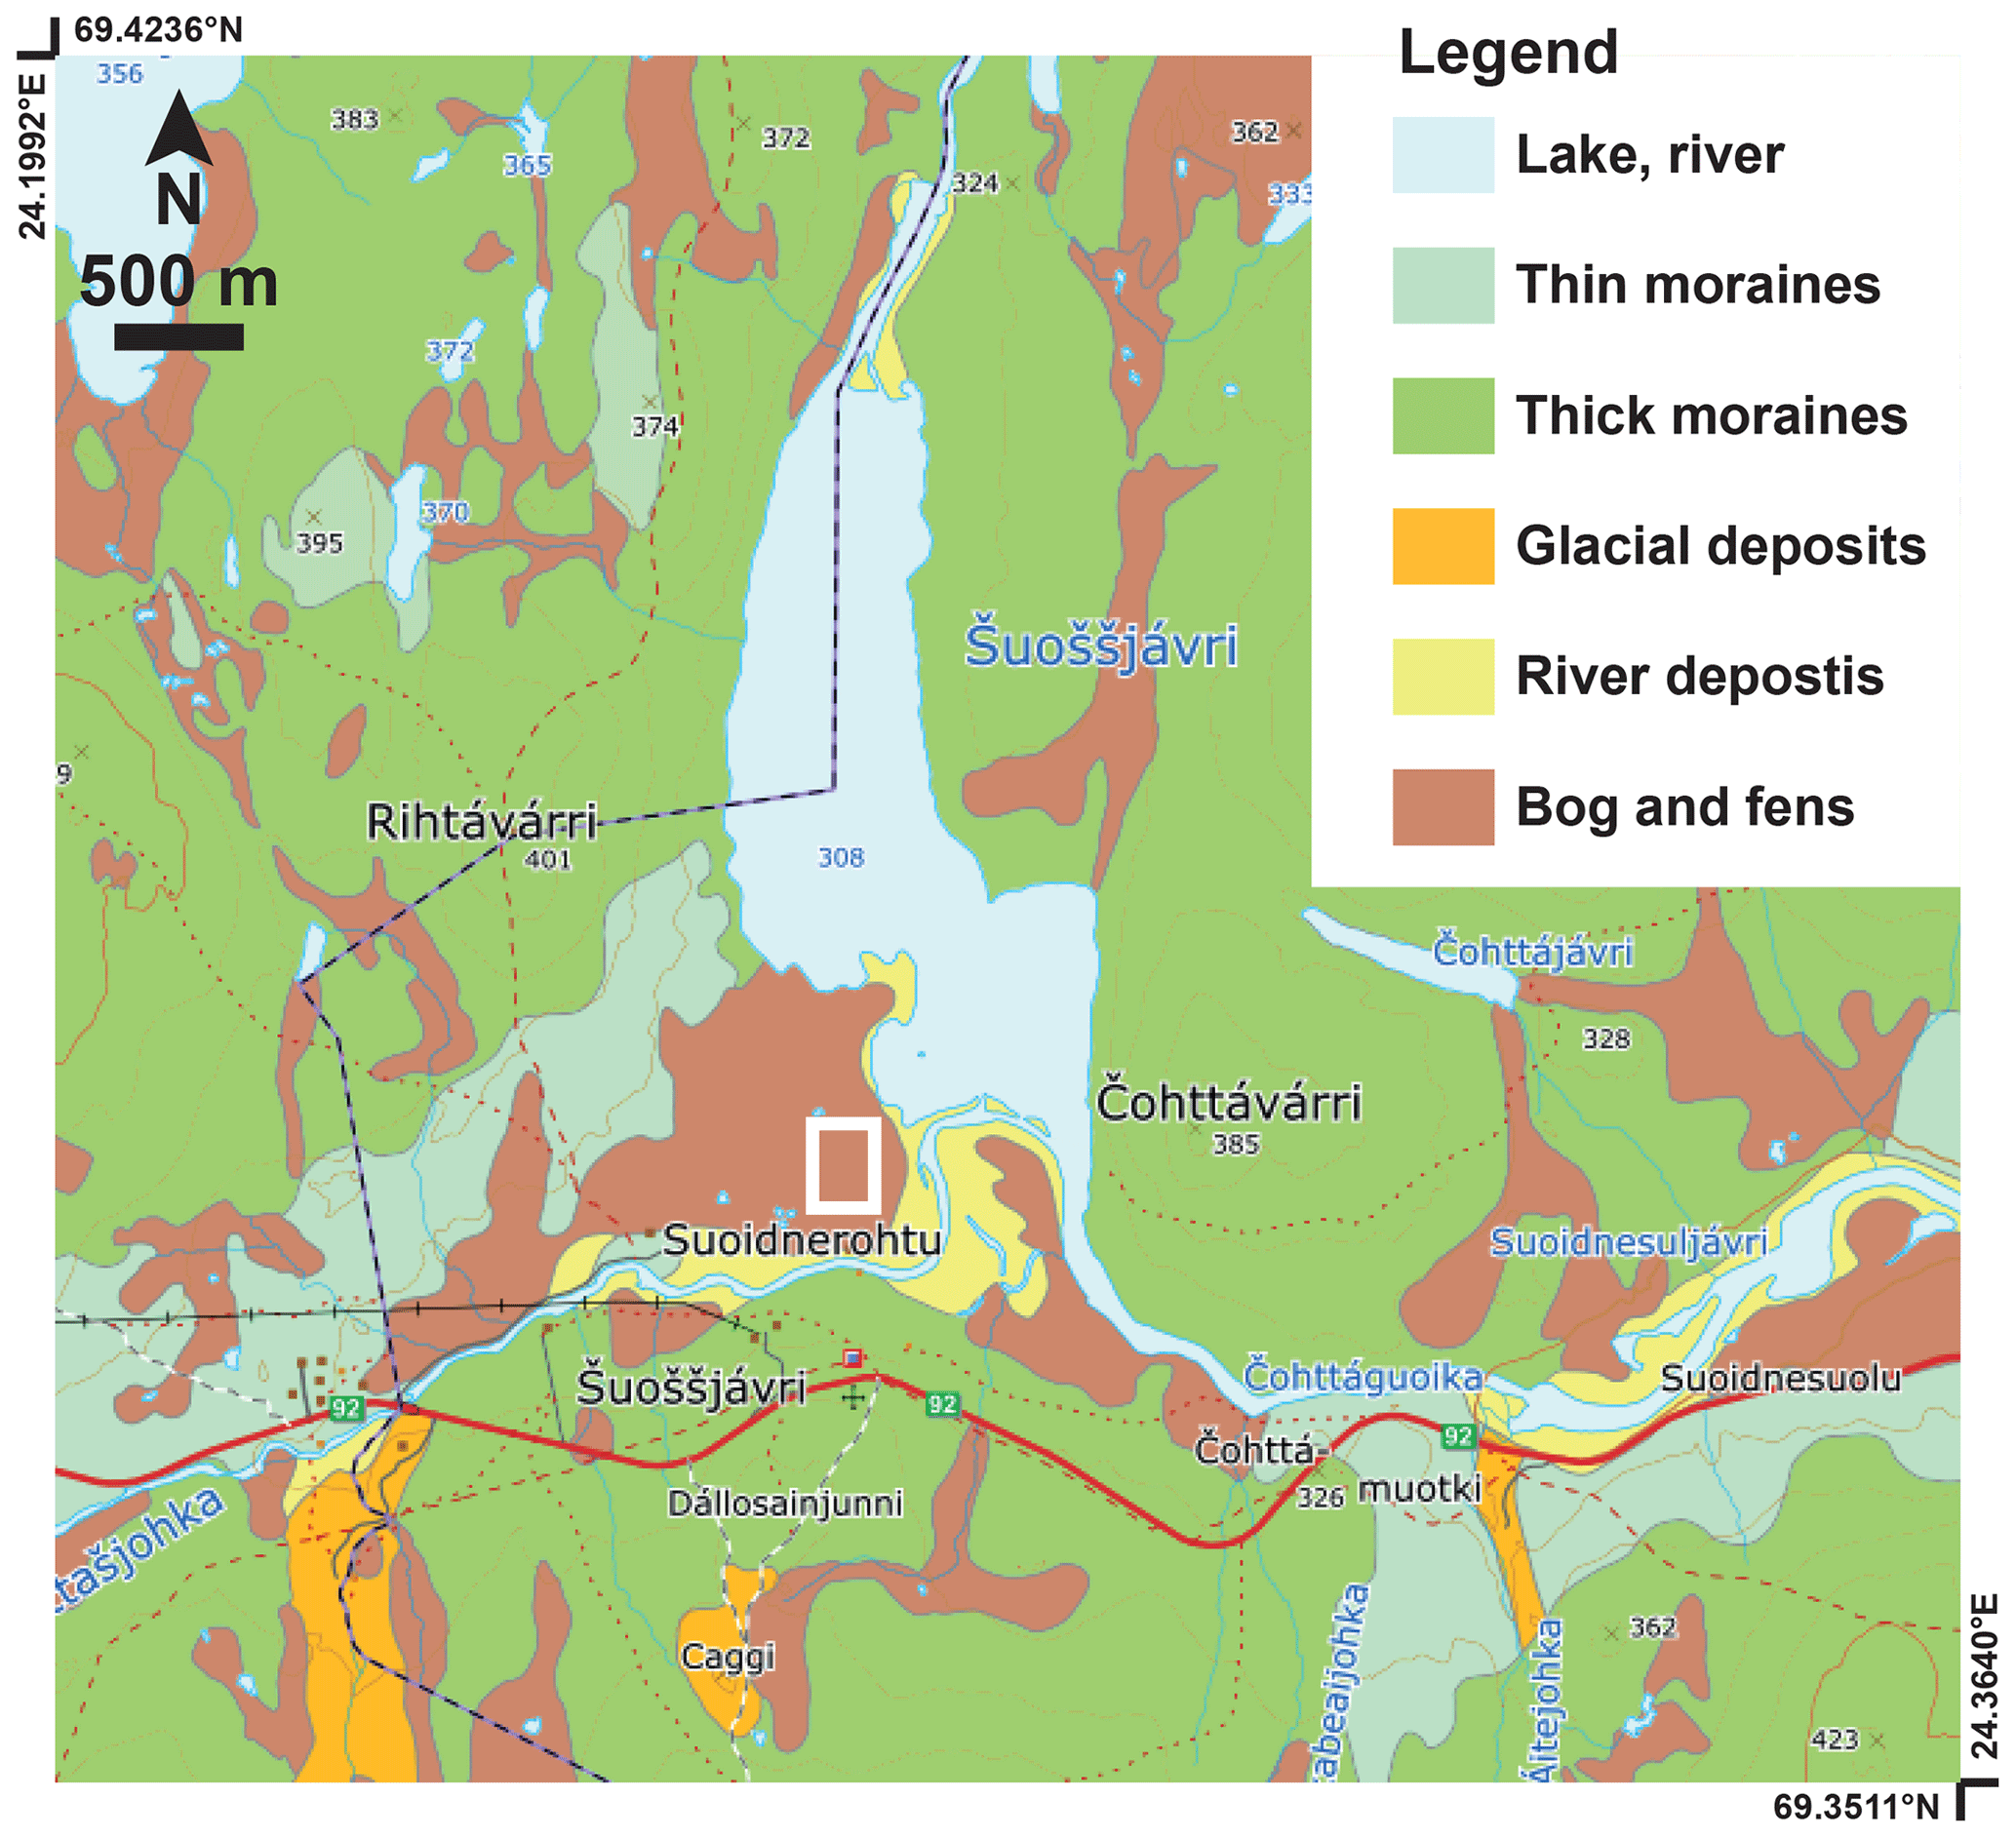
Figure A2Geomorphological map of the surroundings of the study site. The white rectangle indicates the study site. Source: Geological Survey of Norway (NGU).
A3 Evaluation of the forcing data
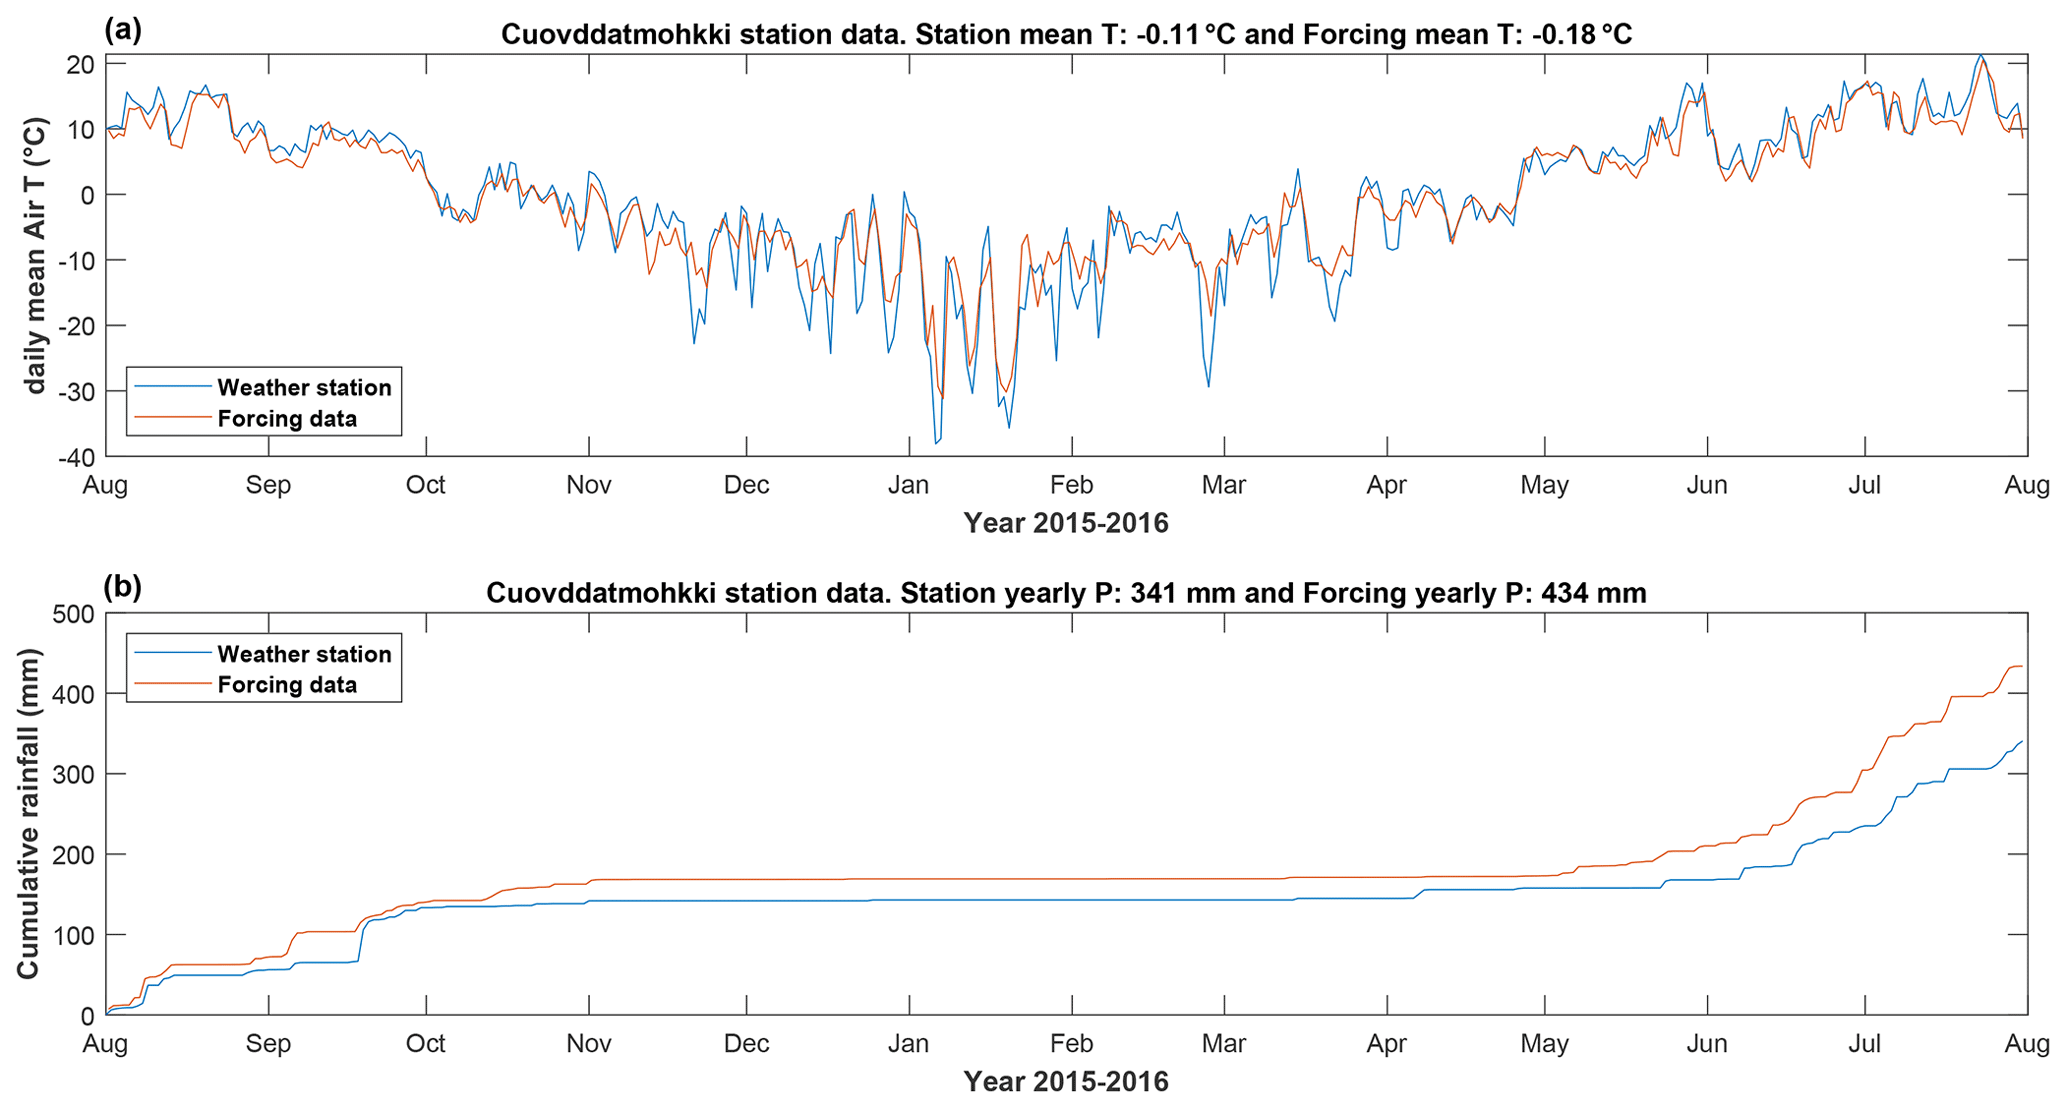
Figure A3Comparison between the weather station and forcing data. (a) Daily mean temperature of the air 2 m above the surface. (b) Cumulative rainfall. The station is Cuovddatmohkki station located at 286 m a.s.l., 7 km east from Šuoššjávri (310 m a.s.l.).
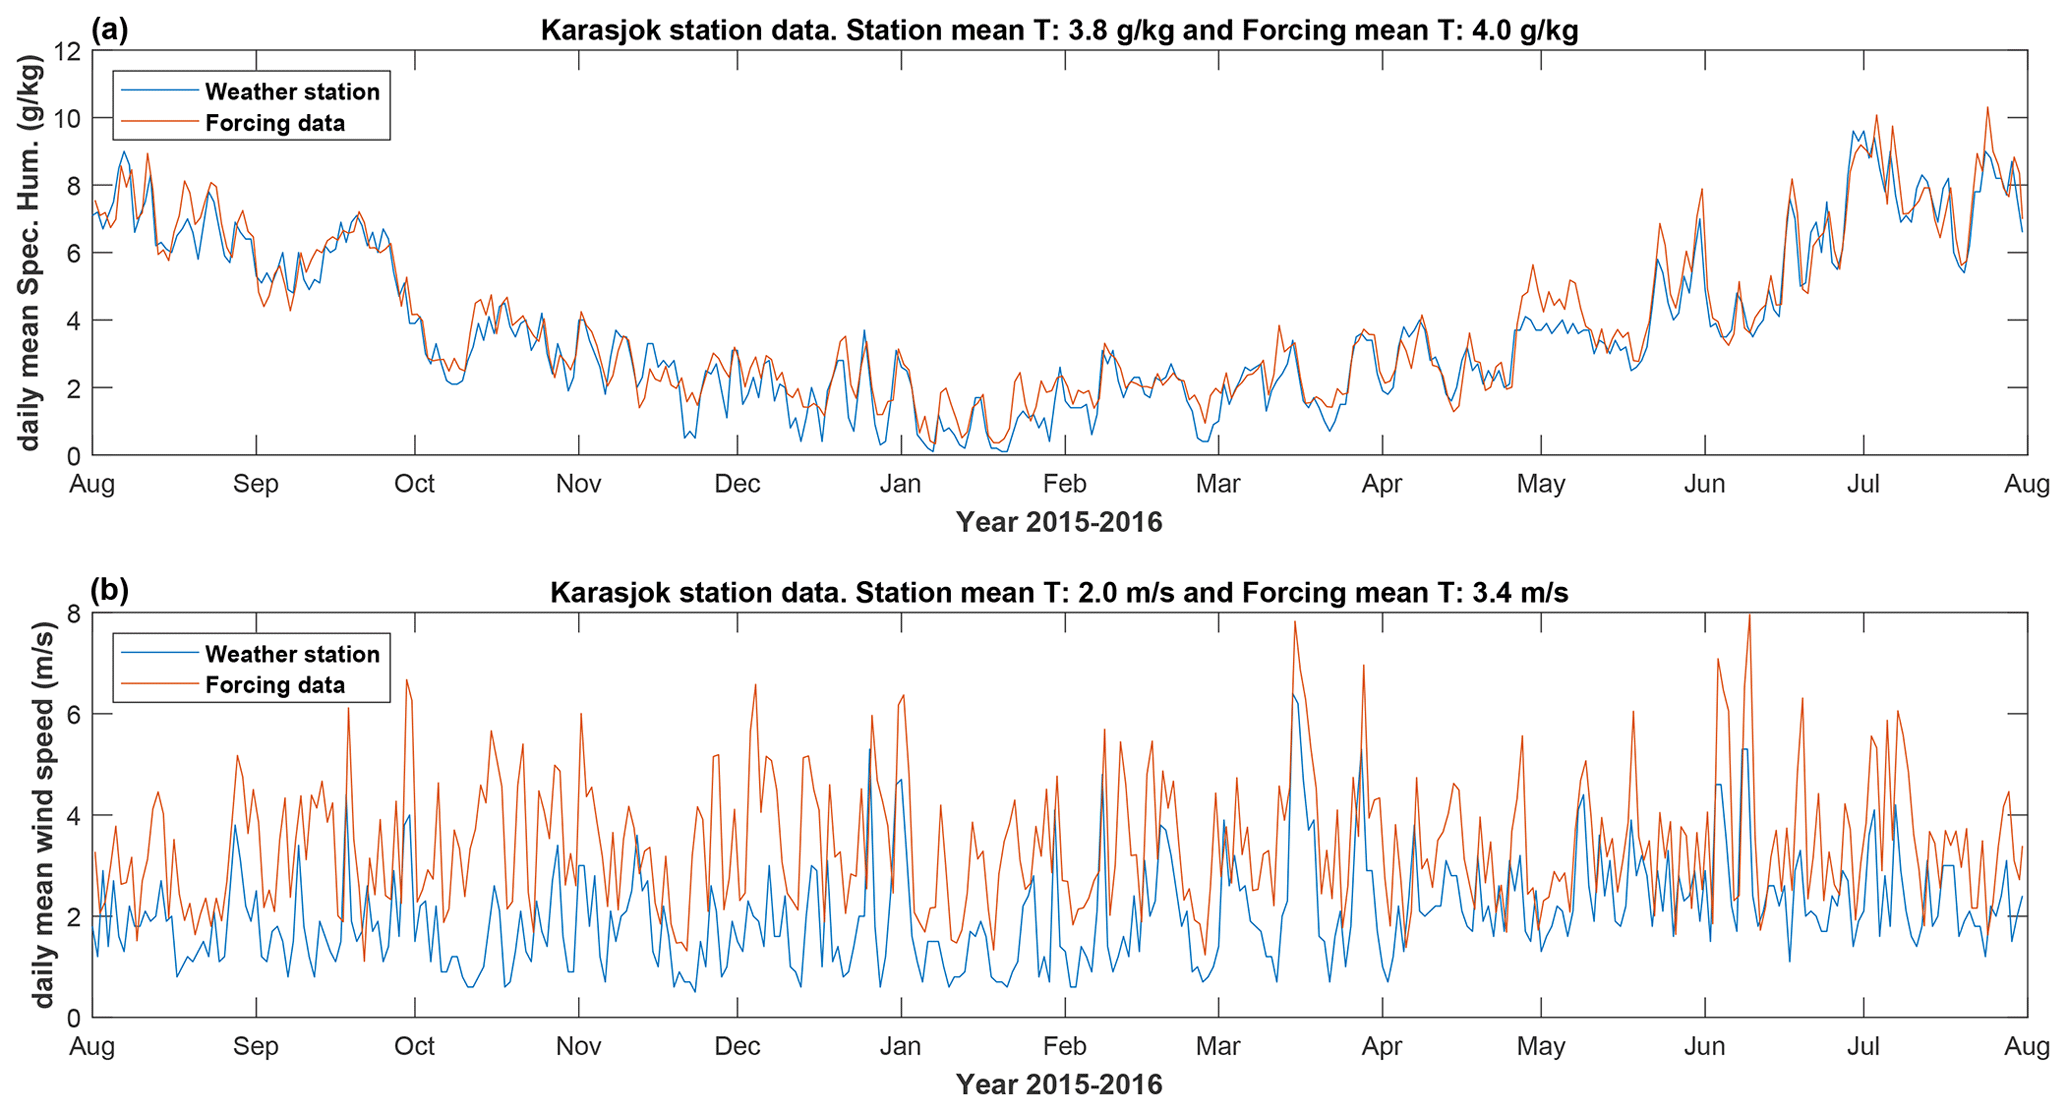
Figure A4Comparison between the weather station and forcing data. (a) Specific humidity (grams of water vapor per kilogram of air). (b) Wind speed. The station is Karasjok-Markannjarga station, 131 m a.s.l., 50 km east from Šuoššjávri, which is 310 m a.s.l. This station is located in an urbanized area with a higher surface roughness that likely promotes lower wind speeds.
A4 Model parameters
| Soil surface and bottom | ||
| Albedo | 0.2 | – |
| Emissivity | 0.97 | – |
| Roughness | 1E-03 | m |
| Resistance to evaporation | 50 | m−1 |
| Geothermal heat flux | 0.05 | W m−2 |
| Bedrock thermal conductivity | 3 | W m−1 K−1 |
| Water | ||
| Albedo | 0.07 | – |
| Emissivity | 0.99 | – |
| Roughness | 5E-04 | m |
| Resistance to evaporation | 0 | m−1 |
| Snow | ||
| Light extinction coefficient | 4.5 | m−1 |
| Max albedo | 0.85 | – |
| Min albedo | 0.5 | – |
| Emissivity | 0.99 | – |
| Roughness | 5E-04 | m |
| Resistance to evaporation | 0 | m−1 |
| Density | 230 | kg m−3 |
| Light extinction coefficient | 25 | m−1 |
| Soil hydrology | ||
| Field capacity | 0.55 | – |
| Evaporation depth | 0.05 | m |
| Root depth | 0.2 | m |
| Ratio ET | 0.5 | – |
| Hydraulic conductivity | 1E-05 | m s−1 |
| Max infiltration depth | 2 | m |
| Ice | ||
| Albedo | 0.2 | – |
| Emissivity | 0.98 | – |
| Roughness | 5E-04 | m |
| Resistance to evaporation | 0 | m−1 |
A5 Comparison with Borge et al. (2017)
To compare with previous studies that only report aerial (and not volume) changes (Sect. 5.1), we define an average annual rate of surface loss of a plateau (Eq. A1). The percentage of annual loss of plateau area is (Si is the surface area in year i), so the average annual rate r (in % yr−1) over an observation period of n years between the two observations can be expressed as
Sn is the plateau surface at the end of the observation period and S0 the plateau surface at the beginning of the period.
The model code and settings used for the simulations are permanently deposited at https://doi.org/10.5281/zenodo.4915955 (Martin et al., 2021). The code is published under the GNU General Public License v3.0.
The data presented in this article are permanently deposited in the Norwegian research data archive NIRD at https://doi.org/10.11582/2021.00052 (Westermann, 2021).
The supplement related to this article is available online at: https://doi.org/10.5194/tc-15-3423-2021-supplement.
LM and SW designed the study and conducted the numerical simulations. LM led the manuscript preparations. SW, ML, JN and LM contributed to the model development. TE, SW, LM and JS acquired field data. TE processed the DEMs. KA provided forcing data. LM and SF analyzed field data. All authors contributed to result interpretation and to manuscript preparation.
The authors declare that they have no conflict of interest.
Publisher's note: Copernicus Publications remains neutral with regard to jurisdictional claims in published maps and institutional affiliations.
This work was funded by PERMANOR (Norwegian Research Council, KLIMAFORSK program, NFR project 255331), Nunataryuk (EU grant agreement no. 773421), ESA Permafrost_CCI (https://climate.esa.int/en/projects/permafrost/, last access: 14 June 2021) and the Department of Geosciences of the University of Oslo, Norway. WRF simulations were performed on the Abel high-performance computing facility with resources provided by the Department of Geosciences of Oslo University. The land surface simulations were performed on resources provided by UNINETT Sigma2, the National Infrastructure for High Performance Computing and Data Storage in Norway, under grant NN9606K. All data are available in the manuscript or Appendices. We are especially grateful to the two anonymous reviewers who provided thorough feedback to improve the manuscript.
This research has been supported by the Norges Forskningsråd (grant no. 255331) and the Horizon 2020 (grant no. Nunataryuk (773421)).
This paper was edited by Christian Hauck and reviewed by two anonymous referees.
Aalto, J., Venäläinen, A., Heikkinen, R. K., and Luoto, M.: Potential for extreme loss in high-latitude Earth surface processes due to climate change, Geophys. Res. Lett., 41, 3914–3924, https://doi.org/10.1002/2014GL060095, 2014.
Aalto, J., Harrison, S., and Luoto, M.: Statistical modelling predicts almost complete loss of major periglacial processes in Northern Europe by, Nat. Commun., 8, 515, https://doi.org/10.1038/s41467-017-00669-3, 2017.
Aas, K. S., Dunse, T., Collier, E., Schuler, T. V., Berntsen, T. K., Kohler, J., and Luks, B.: The climatic mass balance of Svalbard glaciers: a 10-year simulation with a coupled atmosphere–glacier mass balance model, The Cryosphere, 10, 1089–1104, https://doi.org/10.5194/tc-10-1089-2016, 2016.
Aas, K. S., Martin, L., Nitzbon, J., Langer, M., Boike, J., Lee, H., Berntsen, T. K., and Westermann, S.: Thaw processes in ice-rich permafrost landscapes represented with laterally coupled tiles in a land surface model, The Cryosphere, 13, 591–609, https://doi.org/10.5194/tc-13-591-2019, 2019.
Andresen, C. G., Lawrence, D. M., Wilson, C. J., McGuire, A. D., Koven, C., Schaefer, K., Jafarov, E., Peng, S., Chen, X., Gouttevin, I., Burke, E., Chadburn, S., Ji, D., Chen, G., Hayes, D., and Zhang, W.: Soil moisture and hydrology projections of the permafrost region – a model intercomparison, The Cryosphere, 14, 445–459, https://doi.org/10.5194/tc-14-445-2020, 2020.
Bartelt, P. and Lehning, M.: A physical SNOWPACK model for the Swiss avalanche warning, Cold Reg. Sci. Technol., 35, 123–145, https://doi.org/10.1016/S0165-232X(02)00074-5, 2002.
Beck, I., Ludwig, R., Bernier, M., Strozzi, T., and Boike, J.: Vertical movements of frost mounds in subarctic permafrost regions analyzed using geodetic survey and satellite interferometry, Earth Surf. Dynam., 3, 409–421, https://doi.org/10.5194/esurf-3-409-2015, 2015.
Bintanja, R. and Andry, O.: Towards a rain-dominated Arctic, Nat. Clim. Chang., 7, 263–267, https://doi.org/10.1038/nclimate3240, 2017.
Biskaborn, B. K., Smith, S. L., Noetzli, J., Matthes, H., Vieira, G., Streletskiy, D. A., Schoeneich, P., Romanovsky, V. E., Lewkowicz, A. G., Abramov, A., Allard, M., Boike, J., Cable, W. L., Christiansen, H. H., Delaloye, R., Diekmann, B., Drozdov, D., Etzelmüller, B., Grosse, G., Guglielmin, M., Ingeman-Nielsen, T., Isaksen, K., Ishikawa, M., Johansson, M., Johannsson, H., Joo, A., Kaverin, D., Kholodov, A., Konstantinov, P., Kröger, T., Lambiel, C., Lanckman, J.-P., Luo, D., Malkova, G., Meiklejohn, I., Moskalenko, N., Oliva, M., Phillips, M., Ramos, M., Sannel, A. B. K., Sergeev, D., Seybold, C., Skryabin, P., Vasiliev, A., Wu, Q., Yoshikawa, K., Zheleznyak, M., and Lantuit, H.: Permafrost is warming at a global scale, Nat. Commun., 10, 264, https://doi.org/10.1038/s41467-018-08240-4, 2019.
Bockheim, J. G. and Hinkel, K. M.: Accumulation of Excess Ground Ice in an Age Sequence of Drained Thermokarst Lake Basins, Arctic Alaska, Permafr. Periglac. Process., 23, 231–236, https://doi.org/10.1002/ppp.1745, 2012.
Borge, A. F., Westermann, S., Solheim, I., and Etzelmüller, B.: Strong degradation of palsas and peat plateaus in northern Norway during the last 60 years, The Cryosphere, 11, 1–16, https://doi.org/10.5194/tc-11-1-2017, 2017.
Burke, E. J., Zhang, Y., and Krinner, G.: Evaluating permafrost physics in the Coupled Model Intercomparison Project 6 (CMIP6) models and their sensitivity to climate change, The Cryosphere, 14, 3155–3174, https://doi.org/10.5194/tc-14-3155-2020, 2020.
Chadburn, S. E., Burke, E. J., Cox, P. M., Friedlingstein, P., Hugelius, G. and Westermann, S.: An observation-based constraint on permafrost loss as a function of global warming, Nat. Clim. Chang., 7, 340–344, https://doi.org/10.1038/nclimate3262, 2017.
Colbeck, S. C.: An overview of seasonal snow metamorphism, Rev. Geophys., 20, 45–61, https://doi.org/10.1029/RG020i001p00045, 1982.
Domine, F., Barrere, M., and Sarrazin, D.: Seasonal evolution of the effective thermal conductivity of the snow and the soil in high Arctic herb tundra at Bylot Island, Canada, The Cryosphere, 10, 2573–2588, https://doi.org/10.5194/tc-10-2573-2016, 2016.
Farquharson, L. M., Romanovsky, V. E., Cable, W. L., Walker, D. A., Kokelj, S. V., and Nicolsky, D.: Climate Change Drives Widespread and Rapid Thermokarst Development in Very Cold Permafrost in the Canadian High Arctic, Geophys. Res. Lett., 46, 6681–6689, https://doi.org/10.1029/2019GL082187, 2019.
Forlani, G., Dall'Asta, E., Diotri, F., di Cella, U. M., Roncella, R., and Santise, M.: Quality Assessment of DSMs Produced from UAV Flights Georeferenced with On-Board RTK Positioning, Remote Sens., 10, 311, https://doi.org/10.3390/rs10020311, 2018.
French, H. M.: The periglacial environment, 4th edn., John Wiley & Sons Ltd., Chichester, England, ISBN: 978-1-119-13278-3 2018.
Fronzek, S., Carter, T. R., Räisänen, J., Ruokolainen, L., and Luoto, M.: Applying probabilistic projections of climate change with impact models: a case study for sub-arctic palsa mires in Fennoscandia, Clim. Change, 99, 515–534, https://doi.org/10.1007/s10584-009-9679-y, 2010.
Gisnås, K., Westermann, S., Schuler, T. V., Litherland, T., Isaksen, K., Boike, J., and Etzelmüller, B.: A statistical approach to represent small-scale variability of permafrost temperatures due to snow cover, The Cryosphere, 8, 2063–2074, https://doi.org/10.5194/tc-8-2063-2014, 2014.
Göckede, M., Kittler, F., Kwon, M. J., Burjack, I., Heimann, M., Kolle, O., Zimov, N., and Zimov, S.: Shifted energy fluxes, increased Bowen ratios, and reduced thaw depths linked with drainage-induced changes in permafrost ecosystem structure, The Cryosphere, 11, 2975–2996, https://doi.org/10.5194/tc-11-2975-2017, 2017.
Göckede, M., Kwon, M. J., Kittler, F., Heimann, M., Zimov, N., and Zimov, S.: Negative feedback processes following drainage slow down permafrost degradation, Glob. Chang. Biol., 25, 3254–3266, https://doi.org/10.1111/gcb.14744, 2019.
Hinkel, K. M. and Hurd, J. K.: Permafrost destabilization and thermokarst following snow fence installation, Barrow, Alaska, USA, Arctic, Antarct. Alp. Res., 38, 530–539, https://doi.org/10.1657/1523-0430(2006)38[530:PDATFS]2.0.CO;2, 2006.
Jaud, M., Passot, S., Le Bivic, R., Delacourt, C., Grandjean, P., and Le Dantec, N.: Assessing the Accuracy of High Resolution Digital Surface Models Computed by PhotoScan® and MicMac® in Sub-Optimal Survey Conditions, Remote Sens., 8, 465, https://doi.org/10.3390/rs8060465, 2016.
Jones, B. M., Baughman, C. A., Romanovsky, V. E., Parsekian, A. D., Babcock, E. L., Stephani, E., Jones, M. C., Grosse, G., and Berg, E. E.: Presence of rapidly degrading permafrost plateaus in south-central Alaska, The Cryosphere, 10, 2673–2692, https://doi.org/10.5194/tc-10-2673-2016, 2016.
Kokelj, S. V. and Burn, C. R.: Ground ice and soluble cations in near-surface permafrost, Inuvik, Northwest Territories, Canada, Permafr. Periglac. Process., 14, 275–289, https://doi.org/10.1002/ppp.458, 2003.
Koven, C. D., Schuur, E. A. G., Schädel, C., Bohn, T. J., Burke, E. J., Chen, G., Chen, X., Ciais, P., Grosse, G., Harden, J. W., Hayes, D. J., Hugelius, G., Jafarov, E. E., Krinner, G., Kuhry, P., Lawrence, D. M., MacDougall, A. H., Marchenko, S. S., McGuire, A. D., Natali, S. M., Nicolsky, D. J., Olefeldt, D., Peng, S., Romanovsky, V. E., Schaefer, K. M., Strauss, J., Treat, C. C., and Turetsky, M.: A simplified, data-constrained approach to estimate the permafrost carbon–climate feedback, Philos. T. Roy. Soc. A, 373, 20140423, https://doi.org/10.1098/rsta.2014.0423, 2015.
Lacelle, D., Davila, A. F., Fisher, D., Pollard, W. H., DeWitt, R., Heldmann, J., Marinova, M. M., and McKay, C. P.: Excess ground ice of condensation–diffusion origin in University Valley, Dry Valleys of Antarctica: Evidence from isotope geochemistry and numerical modeling, Geochim. Cosmochim. Acta, 120, 280–297, https://doi.org/10.1016/j.gca.2013.06.032, 2013.
Langer, M., Westermann, S., Walter Anthony, K., Wischnewski, K., and Boike, J.: Frozen ponds: production and storage of methane during the Arctic winter in a lowland tundra landscape in northern Siberia, Lena River delta, Biogeosciences, 12, 977–990, https://doi.org/10.5194/bg-12-977-2015, 2015.
Langer, M., Westermann, S., Boike, J., Kirillin, G., Grosse, G., Peng, S., and Krinner, G.: Rapid degradation of permafrost underneath waterbodies in tundra landscapes-Toward a representation of thermokarst in land surface models, J. Geophys. Res.-Earth Surf., 121, 2446–2470, https://doi.org/10.1002/2016JF003956, 2016.
Liljedahl, A. K., Boike, J., Daanen, R. P., Fedorov, A. N., Frost, G. V., Grosse, G., Hinzman, L. D., Iijma, Y., Jorgenson, J. C., Matveyeva, N., Necsoiu, M., Raynolds, M. K., Romanovsky, V. E., Schulla, J., Tape, K. D., Walker, D. A., Wilson, C., Yabuki, H., and Zona, D.: Pan-Arctic ice-wedge degradation in warming permafrost and influence on tundra hydrology, Nat. Geosci., 9, 312–318, https://doi.org/10.1038/ngeo2674, 2016.
Lindgren, A., Hugelius, G., and Kuhry, P.: Extensive loss of past permafrost carbon but a net accumulation into present-day soils, Nature, 560, 219–222, https://doi.org/10.1038/s41586-018-0371-0, 2018.
Luoto, M., Fronzek, S., and Zuidhoff, F. S.: Spatial modelling of palsa mires in relation to climate in northern Europe, Earth Surf. Process. Land., 29, 1373–1387, https://doi.org/10.1002/esp.1099, 2004.
Mamet, S. D., Chun, K. P., Kershaw, G. G. L., Loranty, M. M., and Peter Kershaw, G.: Recent Increases in Permafrost Thaw Rates and Areal Loss of Palsas in the Western Northwest Territories, Canada, Permafr. Periglac. Process., 28, 619–633, https://doi.org/10.1002/ppp.1951, 2017.
Martin, L. C. P., Nitzbon, J., Aas, K. S. S., Etzelmüller, B., Kristiansen, H., and Westermann, S.: Stability Conditions of Peat Plateaus and Palsas in Northern Norway, J. Geophys. Res.-Earth Surf., 124, 705–719, https://doi.org/10.1029/2018JF004945, 2019.
Martin, L. C. P., Nitzbon, J., Langer, M., and Westerman, S.: CryoGrid/CryoGrid3: Model setup for representing lateral thermokarst in a peat plateau (Version v1.0.2), Zenodo, https://doi.org/10.5281/zenodo.4915955, 2021.
McGuire, A. D., Lawrence, D. M., Koven, C., Clein, J. S., Burke, E., Chen, G., Jafarov, E., MacDougall, A. H., Marchenko, S., Nicolsky, D., Peng, S., Rinke, A., Ciais, P., Gouttevin, I., Hayes, D. J., Ji, D., Krinner, G., Moore, J. C., Romanovsky, V., Schädel, C., Schaefer, K., Schuur, E. A. G. G., and Zhuang, Q.: Dependence of the evolution of carbon dynamics in the northern permafrost region on the trajectory of climate change, P. Natl. Acad. Sci. USA, 115, 3882–3887, https://doi.org/10.1073/pnas.1719903115, 2018.
Monin, A. S. and Obukhov, A. M.: Basic laws of turbulent mixing in the surface layer of the atmosphere, Contrib. Geophys. Inst. Acad. Sci. USSR, 151, 163–187, 1954.
Morgalev, Y. N., Lushchaeva, I. V., Morgaleva, T. G., Kolesnichenko, L. G., Loiko, S. V., Krickov, I. V., Lim, A., Raudina, T. V., Volkova, I. I., Shirokova, L. S., Morgalev, S. Y., Vorobyev, S. N., Kirpotin, S. N., and Pokrovsky, O. S.: Bacteria primarily metabolize at the active layer/permafrost border in the peat core from a permafrost region in western Siberia, Polar Biol., 40, 1645–1659, https://doi.org/10.1007/s00300-017-2088-1, 2017.
Morse, P. D., Burn, C. R., and Kokelj, S. V.: Near-surface ground-ice distribution, Kendall Island Bird Sanctuary, western Arctic coast, Canada, Permafr. Periglac. Process., 20, 155–171, https://doi.org/10.1002/ppp.650, 2009.
Motorin, A. S., Bukin, A. V., and Iglovikov, A. V.: Water-physical properties of drained peat soils of Northern Trans-Ural forest-steppe zone, IOP Conf. Ser. Earth Environ. Sci., 90, 012053, https://doi.org/10.1088/1755-1315/90/1/012053, 2017.
Natali, S. M., Watts, J. D., Rogers, B. M., Potter, S., Ludwig, S. M., Selbmann, A.-K., Sullivan, P. F., Abbott, B. W., Arndt, K. A., Birch, L., Björkman, M. P., Bloom, A. A., Celis, G., Christensen, T. R., Christiansen, C. T., Commane, R., Cooper, E. J., Crill, P., Czimczik, C., Davydov, S., Du, J., Egan, J. E., Elberling, B., Euskirchen, E. S., Friborg, T., Genet, H., Göckede, M., Goodrich, J. P., Grogan, P., Helbig, M., Jafarov, E. E., Jastrow, J. D., Kalhori, A. A. M., Kim, Y., Kimball, J. S., Kutzbach, L., Lara, M. J., Larsen, K. S., Lee, B.-Y., Liu, Z., Loranty, M. M., Lund, M., Lupascu, M., Madani, N., Malhotra, A., Matamala, R., McFarland, J., McGuire, A. D., Michelsen, A., Minions, C., Oechel, W. C., Olefeldt, D., Parmentier, F.-J. W., Pirk, N., Poulter, B., Quinton, W., Rezanezhad, F., Risk, D., Sachs, T., Schaefer, K., Schmidt, N. M., Schuur, E. A. G., Semenchuk, P. R., Shaver, G., Sonnentag, O., Starr, G., Treat, C. C., Waldrop, M. P., Wang, Y., Welker, J., Wille, C., Xu, X., Zhang, Z., Zhuang, Q., and Zona, D.: Large loss of CO2 in winter observed across the northern permafrost region, Nat. Clim. Chang., 9, 852–857, https://doi.org/10.1038/s41558-019-0592-8, 2019.
Nitzbon, J., Langer, M., Westermann, S., Martin, L., Aas, K. S., and Boike, J.: Pathways of ice-wedge degradation in polygonal tundra under different hydrological conditions, The Cryosphere, 13, 1089–1123, https://doi.org/10.5194/tc-13-1089-2019, 2019.
Nitzbon, J., Westermann, S., Langer, M., Martin, L. C. P., Strauss, J., Laboor, S., and Boike, J.: Fast response of cold ice-rich permafrost in northeast Siberia to a warming climate, Nat. Commun., 11, 2201, https://doi.org/10.1038/s41467-020-15725-8, 2020.
Nitzbon, J., Langer, M., Martin, L. C. P., Westermann, S., Schneider von Deimling, T., and Boike, J.: Effects of multi-scale heterogeneity on the simulated evolution of ice-rich permafrost lowlands under a warming climate, The Cryosphere, 15, 1399–1422, https://doi.org/10.5194/tc-15-1399-2021, 2021.
Nwaishi, F. C., Morison, M. Q., Van Huizen, B., Khomik, M., Petrone, R. M., and Macrae, M. L.: Growing season CO2 exchange and evapotranspiration dynamics among thawing and intact permafrost landforms in the Western Hudson Bay lowlands, Permafr. Periglac. Process., 31, 509–523, https://doi.org/10.1002/ppp.2067, 2020.
O'Gorman, P. A.: Contrasting responses of mean and extreme snowfall to climate change, Nature, 512, 416–418, https://doi.org/10.1038/nature13625, 2014.
Obu, J., Westermann, S., Bartsch, A., Berdnikov, N., Christiansen, H. H., Dashtseren, A., Delaloye, R., Elberling, B., Etzelmüller, B., Kholodov, A., Khomutov, A., Kääb, A., Leibman, M. O., Lewkowicz, A. G., Panda, S. K., Romanovsky, V., Way, R. G., Westergaard-Nielsen, A., Wu, T., Yamkhin, J., and Zou, D.: Northern Hemisphere permafrost map based on TTOP modelling for 2000–2016 at 1 km2 scale, Earth-Sci. Rev., 193, 299–316, https://doi.org/10.1016/j.earscirev.2019.04.023, 2019.
Osterkamp, T. E., Jorgenson, M. T., Schuur, E. A. G., Shur, Y. L., Kanevskiy, M. Z., Vogel, J. G., and Tumskoy, V. E.: Physical and ecological changes associated with warming permafrost and thermokarst in Interior Alaska, Permafr. Periglac. Process., 20, 235–256, https://doi.org/10.1002/ppp.656, 2009.
Park, H., Fedorov, A. N., and Walsh, J. E.: Effect of snow cover on pan-Arctic permafrost thermal regimes, Clim. Dynam., 44, 2873–2895, https://doi.org/10.1007/s00382-014-2356-5, 2015.
Parviainen, M. and Luoto, M.: Climate envelopes of mire complex types in Fennoscandia, Geogr. Ann. Ser. A Phys. Geogr., 89, 137–151, https://doi.org/10.1111/j.1468-0459.2007.00314.x, 2007.
Payette, S., Delwaide, A., Caccianiga, M., and Beauchemin, M.: Accelerated thawing of subarctic peatland permafrost over the last 50 years, Geophys. Res. Lett., 31, L18208, https://doi.org/10.1029/2004GL020358, 2004.
Raynolds, M. K., Jorgenson, J. C., Jorgenson, M. T., Kanevskiy, M., Liljedahl, A. K., Nolan, M., Sturm, M., and Walker, D. A.: Landscape impacts of 3D-seismic surveys in the Arctic National Wildlife Refuge, Alaska, Ecol. Appl., 30, e02143, https://doi.org/10.1002/eap.2143, 2020.
Sannel, A. B. K.: Ground temperature and snow depth variability within a subarctic peat plateau landscape, Permafr. Periglac. Process., 31, 255–263, https://doi.org/10.1002/ppp.2045, 2020.
Sannel, A. B. K. and Kuhry, P.: Warming-induced destabilization of peat plateau/thermokarst lake complexes, J. Geophys. Res.-Biogeo., 116, G03035, https://doi.org/10.1029/2010JG001635, 2011.
Sannel, A. B. K., Hugelius, G., Jansson, P., and Kuhry, P.: Permafrost Warming in a Subarctic Peatland – Which Meteorological Controls are Most Important?, Permafr. Periglac. Process., 27, 177–188, https://doi.org/10.1002/ppp.1862, 2016.
Schneebeli, M. and Sokratov, S. A.: Tomography of temperature gradient metamorphism of snow and associated changes in heat conductivity, Hydrol. Process., 18, 3655–3665, https://doi.org/10.1002/hyp.5800, 2004.
Schneider von Deimling, T., Lee, H., Ingeman-Nielsen, T., Westermann, S., Romanovsky, V., Lamoureux, S., Walker, D. A., Chadburn, S., Trochim, E., Cai, L., Nitzbon, J., Jacobi, S., and Langer, M.: Consequences of permafrost degradation for Arctic infrastructure – bridging the model gap between regional and engineering scales, The Cryosphere, 15, 2451–2471, https://doi.org/10.5194/tc-15-2451-2021, 2021.
Schuur, E. A. G., Vogel, J. G., Crummer, K. G., Lee, H., Sickman, J. O., and Osterkamp, T. E.: The effect of permafrost thaw on old carbon release and net carbon exchange from tundra, Nature, 459, 556–559, https://doi.org/10.1038/nature08031, 2009.
Schuur, E. A. G., McGuire, A. D., Grosse, G., Harden, J. W., Hayes, D. J., Hugelius, G., Koven, C. D., and Kuhry, P.: Climate change and the permafrost carbon feedback, Nature, 520, 171–179, https://doi.org/10.1038/nature14338, 2015.
Seppälä, M.: The term “palsa”, Z. Geomorphol., 16, 463, 1972.
Seppälä, M.: An experimental study of the formation of palsas, 4th Can. Permafr. Conf., Calgary, Alberta, 2–6 March 1981, 36–42, 1982.
Seppälä, M.: Palsas and related forms, Adv. Periglac. Geomorphol., 247–278, 1988.
Seppälä, M.: How to make a palsa: a field experiment on permafrost formation, Z. Geomorphol., 99, 91–96, https://doi.org/10.1127/zfgsuppl/99/1995/91, 1995.
Seppälä, M.: Synthesis of studies of palsa formation underlining the importance of local environmental and physical characteristics, Quat. Res., 75, 366–370, https://doi.org/10.1016/j.yqres.2010.09.007, 2011.
Serikova, S., Pokrovsky, O. S., Ala-Aho, P., Kazantsev, V., Kirpotin, S. N., Kopysov, S. G., Krickov, I. V., Laudon, H., Manasypov, R. M., Shirokova, L. S., Soulsby, C., Tetzlaff, D., and Karlsson, J.: High riverine CO2 emissions at the permafrost boundary of Western Siberia, Nat. Geosci., 11, 825–829, https://doi.org/10.1038/s41561-018-0218-1, 2018.
Sherstyukov, A. B. and Sherstyukov, B. G.: Spatial features and new trends in thermal conditions of soil and depth of its seasonal thawing in the permafrost zone, Russ. Meteorol. Hydrol., 40, 73–78, https://doi.org/10.3103/S1068373915020016, 2015.
Sjöberg, Y., Coon, E., K. Sannel, A. B., Pannetier, R., Harp, D., Frampton, A., Painter, S. L., and Lyon, S. W.: Thermal effects of groundwater flow through subarctic fens: A case study based on field observations and numerical modeling, Water Resour. Res., 52, 1591–1606, https://doi.org/10.1002/2015WR017571, 2016.
Skamarock, W. C. and Klemp, J. B.: A time-split nonhydrostatic atmospheric model for weather research and forecasting applications, J. Comput. Phys., 227, 3465–3485, https://doi.org/10.1016/j.jcp.2007.01.037, 2008.
Sollid, J. and Sørbel, L.: Palsa Bogs as a Climate Indicator-Examples, Ambio, 27, 287–291, 1998.
Sturm, M., Holmgren, J., König, M., and Morris, K.: The thermal conductivity of seasonal snow, J. Glaciol., 43, 26–41, https://doi.org/10.1017/S0022143000002781, 1997.
Subedi, R., Kokelj, S. V., and Gruber, S.: Ground ice, organic carbon and soluble cations in tundra permafrost soils and sediments near a Laurentide ice divide in the Slave Geological Province, Northwest Territories, Canada, The Cryosphere, 14, 4341–4364, https://doi.org/10.5194/tc-14-4341-2020, 2020.
Teufel, B. and Sushama, L.: Abrupt changes across the Arctic permafrost region endanger northern development, Nat. Clim. Chang., 9, 858–862, https://doi.org/10.1038/s41558-019-0614-6, 2019.
Thibault, S. and Payette, S.: Recent permafrost degradation in bogs of the James Bay area, northern Quebec, Canada, Permafr. Periglac. Process., 20, 383–389, https://doi.org/10.1002/ppp.660, 2009.
Turetsky, M. R., Abbott, B. W., Jones, M. C., Anthony, K. W., Olefeldt, D., Schuur, E. A. G., Grosse, G., Kuhry, P., Hugelius, G., Koven, C., Lawrence, D. M., Gibson, C., Sannel, A. B. K., and McGuire, A. D.: Carbon release through abrupt permafrost thaw, Nat. Geosci., 13, 138–143, https://doi.org/10.1038/s41561-019-0526-0, 2020.
Vionnet, V., Brun, E., Morin, S., Boone, A., Faroux, S., Le Moigne, P., Martin, E., and Willemet, J.-M.: The detailed snowpack scheme Crocus and its implementation in SURFEX v7.2, Geosci. Model Dev., 5, 773–791, https://doi.org/10.5194/gmd-5-773-2012, 2012.
Westermann, S.: Research data for “Thermal erosion patterns of permafrost peat plateaus in northern Norway” [Data set], Norstore, https://doi.org/10.11582/2021.00052, 2021.
Walczak, R. and Rovdan, E.: Water retention characteristics of peat and sand mixtures, Int. Agrophysics, 16, 161–165, 2002.
Way, R. G., Lewkowicz, A. G., and Zhang, Y.: Characteristics and fate of isolated permafrost patches in coastal Labrador, Canada, The Cryosphere, 12, 2667–2688, https://doi.org/10.5194/tc-12-2667-2018, 2018.
Westermann, S., Langer, M., Boike, J., Heikenfeld, M., Peter, M., Etzelmüller, B., and Krinner, G.: Simulating the thermal regime and thaw processes of ice-rich permafrost ground with the land-surface model CryoGrid 3, Geosci. Model Dev., 9, 523–546, https://doi.org/10.5194/gmd-9-523-2016, 2016.