the Creative Commons Attribution 4.0 License.
the Creative Commons Attribution 4.0 License.
 | 01 Jul 2021
Three in one: GPS-IR measurements of ground surface elevation changes, soil moisture, and snow depth at a permafrost site in the northeastern Qinghai–Tibet Plateau
Jiahua Zhang
Ground surface elevation changes, soil moisture, and snow depth are all essential variables for studying the dynamics of the active layer and permafrost. GPS interferometric reflectometry (GPS-IR) has been used to measure surface elevation changes and snow depth in permafrost areas. However, its applicability to estimating soil moisture in permafrost regions has not been assessed. Moreover, these variables were usually measured separately at different sites. Integrating their estimates at one site facilitates the comprehensive utilization of GPS-IR in permafrost studies. In this study, we run simulations to elucidate that the commonly used GPS-IR algorithm for estimating soil moisture content cannot be directly used in permafrost areas, because it does not consider the bias introduced by the seasonal surface elevation changes due to active layer thawing. We propose a solution to improve this default method by introducing modeled surface elevation changes. We validate this modified method using the GPS data and in situ observations at a permafrost site in the northeastern Qinghai–Tibet Plateau (QTP). The root-mean-square error and correlation coefficient between the GPS-IR estimates of soil moisture content and the in situ ones improve from 1.85 % to 1.51 % and 0.71 to 0.82, respectively. We also propose a framework to integrate the GPS-IR estimates of these three variables at one site and illustrate it using the same site in the QTP as an example. This study highlights the improvement to the default algorithm, which makes the GPS-IR valid in estimating soil moisture content in permafrost areas. The three-in-one framework is able to fully utilize the GPS-IR in permafrost areas and can be extended to other sites such as those in the Arctic. This study is also the first to use GPS-IR to estimate environmental variables in the QTP, which fills a spatial gap and provides complementary measurements to ground temperature and active layer thickness.
- Article
(6853 KB) - Full-text XML
-
Supplement
(744 KB) - BibTeX
- EndNote


Permafrost refers to the ground where the temperature remains at or below 0 ∘C for at least 2 consecutive years. On top of the permafrost is the active layer, which undergoes seasonal freezing–thawing cycles (Dobinski, 2011). In the Qinghai–Tibet Plateau (QTP), permafrost occupies around 40 % of its area (Zou et al., 2017) and has been warming and degrading over the last several decades (Zhao et al., 2010, 2020). The ground temperature at 15 m depth increased at a rate varying from 0.02 ∘C per decade in Hoh Xil to 0.26 ∘C per decade in the Kunlun Mountains and Liangdaohe during 2001–2017. Thickening of the active layer was also observed. Based on the records at 10 sites, the average thickening rate was 19.5 cm per decade from 1981 to 2018 (Zhao et al., 20120). The dynamics of the active layer and permafrost (collectively called frozen ground alternatively) has a crucial impact on geomorphological, hydrological, ecological processes, and infrastructures (Wu et al., 2002; Cheng and Wu, 2007; Yang et al., 2010; Gao et al., 2018).
Ground surface elevation changes, soil moisture, and snow depth are all essential variables for studying frozen ground dynamics, as they are all related to the thermal and hydrological changes in the frozen ground. The ground surface in permafrost areas is subject to uplift/subsidence, mainly due to the phase changes between ice and water in the active layer freezing–thawing cycles. Surface deformation can indicate the variation in the active layer and permafrost. Numerous studies have been conducted to use surface elevation changes (e.g., interferometric synthetic aperture radar (InSAR) measurements) to infer the variation of active layer thickness and permafrost degradation in the QTP (Chen et al., 2018; Wang et al., 2018; Reinosch et al., 2020; Daout et al., 2020). Soil moisture affects soil thermal properties and then the ground thermal regime; for instance, in well-drained areas with peat layers, decreasing soil moisture content lowers the soil thermal conductivity, as a large amount of pore space is filled with air. Such a layer functions as an insulator, retarding the heat transfer between the atmosphere and the lower ground and thereby impeding the downward movement of the thawing front (Shiklomanov et al., 2010; Göckede et al., 2019). Surface soil moisture also regulates the exchange of water and energy between the atmosphere and frozen ground by evapotranspiration (Seneviratne et al., 2010). Zhang et al. (2016) investigated the influence of soil moisture on the thermal and hydrological properties of the active layer in the Tanggula Mountains in the central QTP. Snow cover also has a significant influence on the ground thermal regime due to its high albedo, low thermal conductivity, and the large amount of latent heat absorbed when melting (Zhang, 2005). The timing and duration of snow cover, snow depth, and snow density and texture affect frozen ground dynamics. The variations of snow cover and their impact on the thermal and hydrological conditions of the frozen ground in the QTP have been studied extensively (Flanner and Zender, 2005; Che et al., 2008; Gao et al., 2012; Xu et al., 2017; Deng et al., 2017; Qi et al., 2019).
GPS interferometric reflectometry (GPS-IR) is a method which exploits the interference between direct and reflected GPS signals to estimate ground surface elevation changes, surface soil moisture, and snow depth (Larson, 2019). Such interference can be reflected by signal-to-noise ratio (SNR) data at low satellite elevation angles recorded by GPS receivers. SNR observations (alternatively called as SNR interferograms) oscillate quasi-sinusoidally when the reflecting surface is relatively smooth and horizontal. The frequency of such an oscillation (hereafter referred to simply as “frequency”) can be used to measure the vertical distance between the antenna and reflecting surface, which is then converted into snow depth when the ground is covered by snow and ground surface elevation changes in snow-free seasons (Larson et al., 2009; Larson and Small, 2016; Liu and Larson, 2018). The phase of the oscillation (hereafter referred to simply as “phase”) can be used to estimate surface soil moisture content within the layer of 0–5 cm (Larson et al., 2008; Chew et al., 2014, 2016). GPS-IR can provide daily and continuous measurements at continuously operating sites. Their spatial coverages are antenna-height dependent, e.g., ∼ 1000 m2 for a 2 m high antenna. Such an order of magnitude makes the GPS-IR measurements bridge the point observations and regional-scale remote sensing ones.
The applicability of GPS-IR for estimating soil moisture content in permafrost areas has not been assessed. We run simulations to elucidate that it could not be applied directly to permafrost areas as it does not consider the bias introduced by the seasonal surface elevation changes due to active layer thawing. Moreover, measuring ground surface elevation changes, soil moisture content, and snow depth at a single site can fully utilize GPS-IR in permafrost areas, which has not been conducted to date. Driven by these motivations, our objectives in this study are (1) to improve the default GPS-IR algorithm for estimating soil moisture content to make it valid in permafrost areas; (2) to implement a three-in-one framework, i.e., integrating the GPS-IR measurements of surface elevation changes, soil moisture, and snow depth at one site, and illustrate it by using a permafrost site within the northeastern QTP as an example; and (3) to provide GPS-IR measurements at the QTP site.
The significance of this study relies on the improvement made to the default algorithm, which can correct the bias introduced by the seasonal surface deformation. In summer, as the thawing front advances downwards, surface subsidence accumulates and leads to a bias with larger magnitude. The bias would likely mislead the interpretation of soil moisture variation by superimposing a seasonal trend. Moreover, this study is the first to use GPS-IR for estimating environmental variables in the QTP. Although numerous GPS stations (e.g., the stations of the Crustal Movement Observation Network of China, https://data.earthquake.cn/datashare/report.shtml?PAGEID=siteInfo_quyu, last access: 24 June 2021) are continuously operating in the QTP, none of them have been previously used for GPS-IR studies. Furthermore, permafrost is extensive in the QTP, but the monitoring sites (e.g., boreholes) are few and unevenly distributed (Zou et al., 2017). Our study site can fill a spatial gap in the QTP, although it was initially designed to study hydrological processes. In addition, our GPS-IR measurements are complementary to the existing observations, such as ground temperature, to provide fresh insights into frozen ground dynamics. The three-in-one framework is the first of its kind to fully utilize GPS-IR in permafrost studies. The Plate Boundary Observatory (PBO) H2O is a similar but much-larger-scale project, which estimates snow depth, soil moisture content, and vegetation water content at the GPS sites of the PBO network (Larson, 2016). However, the PBO H2O project was not explicitly designed for studying permafrost and already ended in fall 2017. Our three-in-one framework is the first one dedicated to a comprehensive use of GPS-IR for permafrost.
In Sect. 2, we briefly describe the study site and instrumentation. In Sect. 3, we first summarize the GPS-IR principles for retrieving surface elevation changes, soil moisture, and snow depth. We then illustrate the default algorithm's limitations for estimating soil moisture in permafrost areas by simulations and introduce our solution for improvement. We then propose a three-in-one framework. We finally present the datasets used in this study. In Sect. 4, we show the results, i.e., the improvement of our method and the GPS-IR estimates of these three variables at the site in the QTP. In Sect. 5, we discuss the merits and possible error sources of the improved algorithm and the benefits of the three-in-one framework to permafrost studies. We conclude this study in Sect. 6.
The study site, Binggou (38.01∘ N, 100.24∘ E; 4120 m a.s.l.), is located in the northeastern region of the QTP (Fig. 1a). The mean annual ground surface temperature is around −3.5 ∘C. Permafrost is present at this site with a thickness of 25–30 m (Ran et al., 2018). The active layer thickness is ∼ 1.6 m, based on ground temperature observations. The biome at this site is alpine steppe. As for the soil texture profile, in the upper 0.2 m, the soil is dominantly sandy silt. At depths between 0.2 and 0.5 m, it is a mixture of sand, silt, and gravel. The soil becomes mainly gravel below the depth of 0.5 m. This general soil texture description was kept when installing the GPS monument. The soil moisture content is ∼ 40 % in the upper 0.4 m, decreases to 20 % at the depth of 0.8 m, and remains relatively stable to the depth of 1.6 m (Che et al., 2019).
A GPS station, called QLBG, has been operating in Binggou since November 2016. Figure 1b shows a ground photo of QLBG. Its antenna height is ∼ 2 m above the ground surface, and the monument foundation is ∼ 1.5 m deep. The foundation depth is slightly shallower than the active layer base. It implies that the monument might settle in late summer when the soil around the foundation starts to thaw (or heave up at the beginning of freezing season when the foundation freezes). However, the magnitude of such a movement is expected to be negligible, as the layer between the foundation depth and the active layer base is as thin as ∼ 10 cm. Given that the soil moisture content is ∼ 20 %, the thawing of this layer causes a subsidence of only ∼ 0.2 cm. Such a magnitude is at least 1 order less than that of the standard deviation of the GPS-IR measurement (more in Sect. 3.1). The monument can be regarded as stable in the thawing season considered in this study (see the detailed discussion in Sect. S1 in the Supplement). The antenna of QLBG is mounted onto a galvanized steel pipe anchored to a concrete foundation. The GPS receiver type is CHC N72, and the antenna is CHCC220GR with a CHCD radome. An integrated weather station exists close to QLBG, which records various environmental variables, including soil moisture and ground temperature (Che et al., 2019). They are both measured up to a depth of 1.6 m. Due to the open and relatively horizontal and smooth surface and abundant weather records, QLBG is usable for GPS-IR studies.
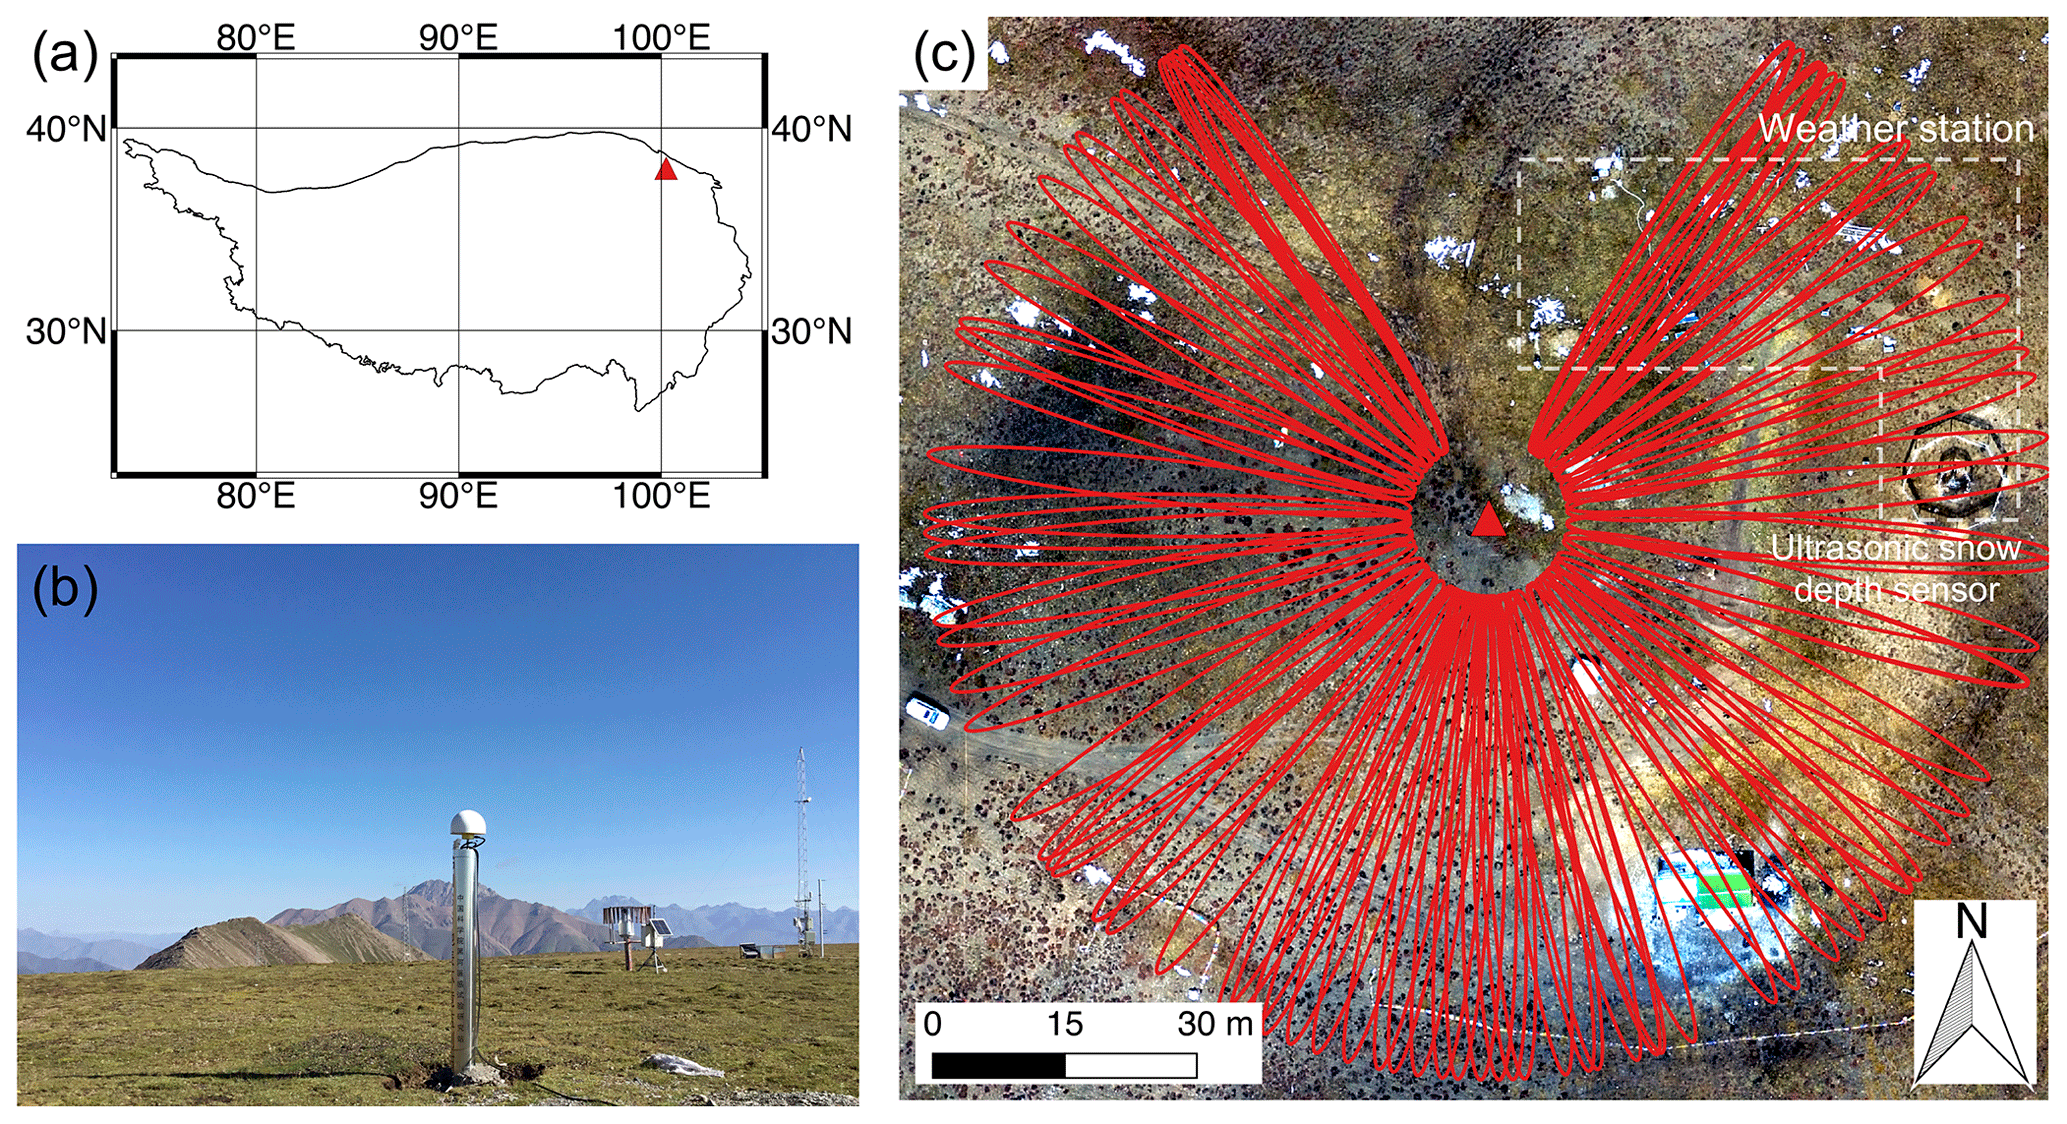
Figure 1(a) Location of the study site, Binggou, in the northeastern Qinghai–Tibet Plateau. (b) Ground photo of the GPS station QLBG. (c) Orthophoto of the Binggou site showing the surface condition, QLBG (red triangle), and the integrated weather station. Red elliptic curves indicate the footprints of the reflected L1 GPS signals at the satellite elevation angle of 5∘.
3.1 GPS-IR
The input of GPS-IR is SNR data, which can reflect the interference pattern between the direct and reflected signals at low satellite elevation angles. When a GPS station is located above a horizontal and smooth surface (e.g., Fig. 2), the SNR interferogram, corresponding to a rising/setting satellite track, can be simply expressed as (Larson, 2019):
where A(e) is the oscillation amplitude varying with satellite elevation angle e; f is the oscillation frequency of the SNR interferogram; H is the vertical distance between the antenna and the reflecting surface, conventionally called the reflector height; λ is the carrier wavelength of GPS signals; and ϕ(e) is the phase varying with satellite elevation angle as well. The frequencies of SNR interferograms are used to obtain reflector heights by Eq. (2) and then surface elevation changes in the snow-free season and snow depth on snow-cover days (Larson et al., 2009; Liu and Larson, 2018). In addition, the phases are used to estimate soil moisture content (Larson et al., 2008).
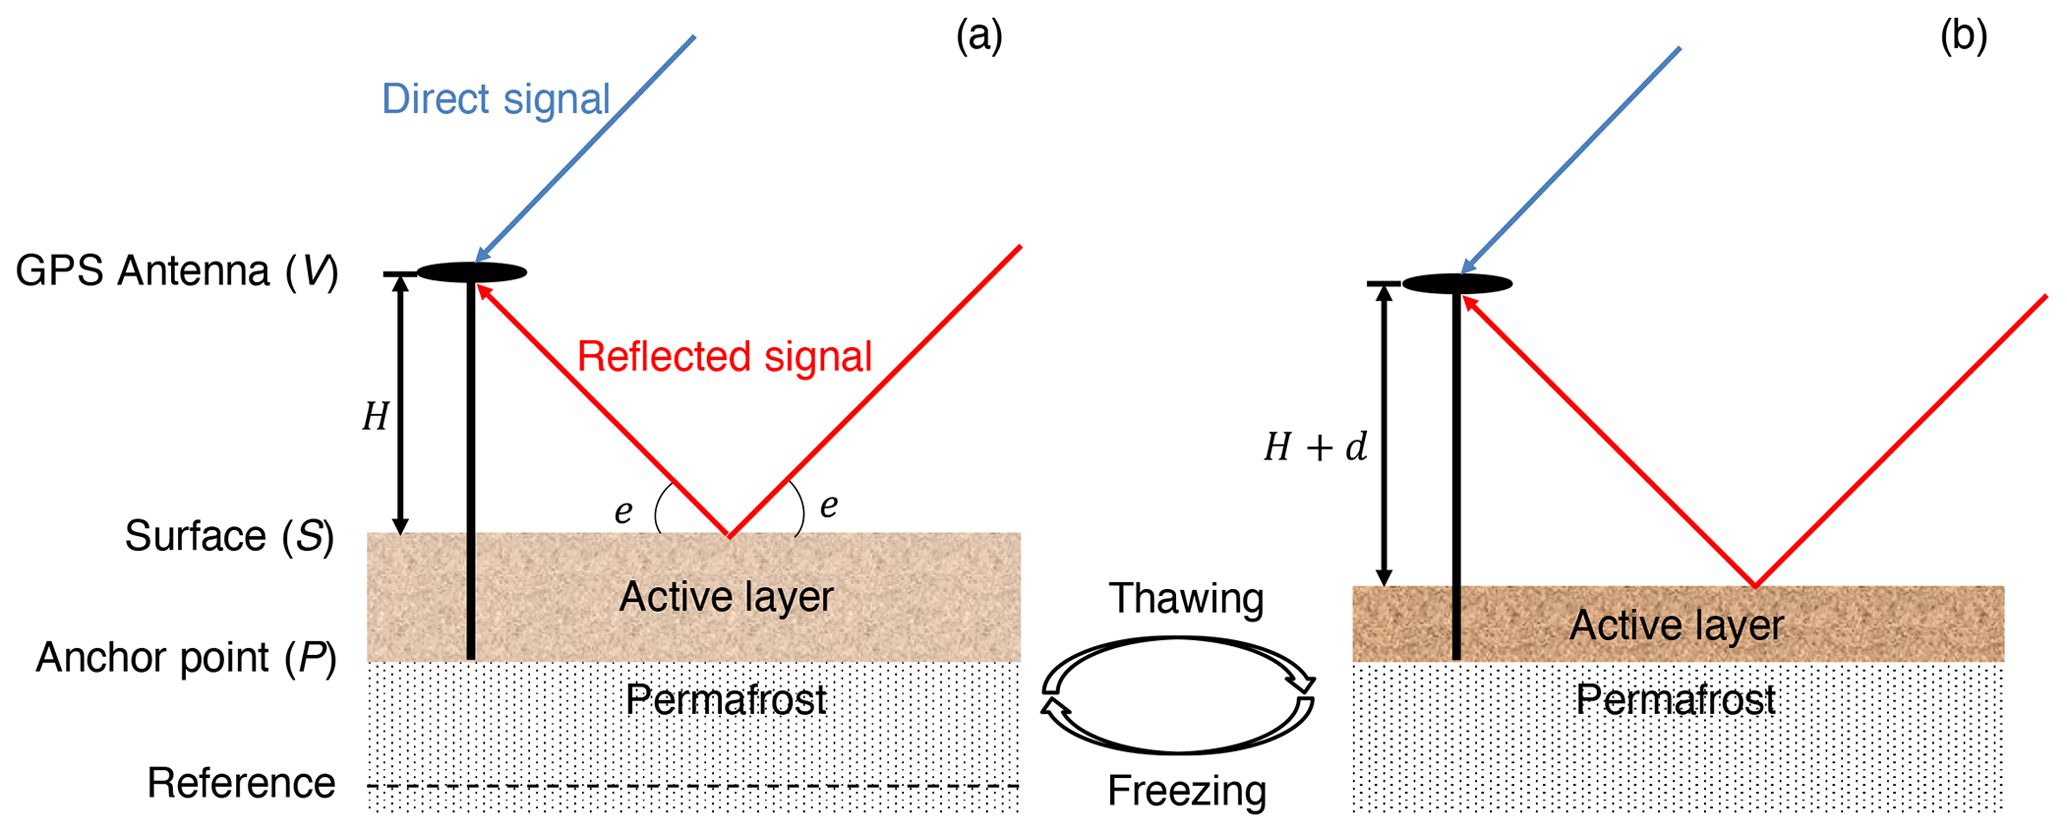
Figure 2Diagrams showing the geometries of GPS-IR in the thawing/freezing active layer conditions. We use the symbols V, S, and P to denote the vertical positions of the GPS antenna, reflecting surface, and the monument anchor point, respectively, with respect to an arbitrary reference in the deep permafrost marked by a dashed line; H denotes reflector height; d represents surface deformation due to active layer freezing/thawing.
In the geometry of GPS-IR (Fig. 2), the reflector height H depends on the vertical positions of the GPS antenna (V) and the reflecting surface (S) with respect to the deep permafrost as a reference, which is in the form of
Given the monument with a length of L, the position of the monument anchor point is
Incorporating Eq. (4) into Eq. (3), we can derive the surface position as
If the monument is stable with respect to the deep permafrost, the variation of P relative to the reference is zero, and Eq. (5) is reduced to
Assuming a constant L, surface elevation changes are negative to the reflector height variations. In practice, to obtain reflector height, for any given SNR interferogram at low elevation angles (i.e., 5–15∘ in this study), we first remove its second-order polynomial fit and use the residuals, which are mainly contributed by the interference between direct and reflected signals. We then conduct Lomb–Scargle periodogram on the residuals to obtain the frequency spectrum. We use the peak value of this spectrum to represent f and convert it to H by Eq. (2). On any given day, we retrieve H from all available SNR interferograms. Then, we average them to obtain the daily reflector height and calculate the standard deviation of the mean value. In the snow-free season, based on Eq. (6), we remove the mean from the negative daily reflector heights and use the residuals to represent ground surface elevation changes. When the ground is covered by snow acting as the reflector, we can derive the snow depth as the difference between the reflector height of snow surface and the one of ground surface.
Here, we describe the default algorithm of estimating phases and then retrieving soil moisture content by GPS-IR. Practically, A(e) and ϕ(e) of an SNR interferogram are assumed to be constants, as their variations with elevation angle are small (Zavorotny et al., 2010; Chew et al., 2014). Fixing H to an a priori reflector height (H0), we can determine the phase by least-squares estimation (LSE). In previous studies such as Larson et al. (2010) and Chew et al. (2014), H0 is the mean value of the daily reflector heights over the data time span of interest. On any given day within the time span, the same H0 is used to estimate phases of SNR interferograms. After retrieving the phases, we offset the phase time series of different satellite tracks by subtracting the mean value of the lowest 15 %. Then, we use the mean values of the offset phases to represent the daily ones and compute their standard deviations. Then, we convert the phases into soil moisture content based on their empirical linear relationship (Chew et al., 2016; Small et al., 2016). For cases with no significant vegetation influence, the slope of soil moisture content versus phase is 1.48 cm3 cm−3 per degree (Chew et al., 2014). The intercept (also called the residual soil moisture content in the literature) can be determined by in situ measurements or public datasets (e.g., US Geological Survey's STATSGO, Schwarz and Alexander, 1995).
3.2 Modifying the default method for estimating soil moisture in permafrost areas
3.2.1 Limitation of the default method
Using a constant H0 to estimate phases in permafrost areas might not be valid, as the ground surface is subject to moves vertically due to active layer thawing/freezing. To illustrate this limitation and its impact on the phase estimation, we run simulations by using the multipath simulator (Nievinski and Larson, 2014). We initially set the reflector height H as 2 m, which is the typical monument height of most GPS stations. Then, we introduce a surface deformation d. Positive (negative) means surface subsidence (uplift). In the simulations, d varies from −5 to 5 cm at a step of 1 cm. Not knowing the antenna gain pattern of CHCC220GR CHCD used in this study, we alternatively use the one of TRM29659.00 with the radome of SCIT. Other key parameters used in the simulations are listed in Table 1.
In Fig. 3a, we show an example of the simulated SNR with d of 2 cm, whose third-order polynomial fit has been removed. We use LSE to estimate the phase and amplitude by using H and H+d, respectively. From the inset plot of Fig. 3a, we can observe that using H introduces a phase bias of around −14∘. Figure 3b shows the simulated bias corresponding to various d. The bias is approximately proportional to the surface deformation.
In summer, surface subsidence accumulates with the downward movement of the thawing front, which leads to bias with larger magnitude. The bias may mislead the interpretation of soil moisture variation, with a seasonal trend superimposed on the soil moisture estimates. Thus, such a bias needs to be corrected when using GPS-IR to estimate soil moisture content in permafrost areas. To solve this problem, we propose a solution in Sect. 3.2.2.
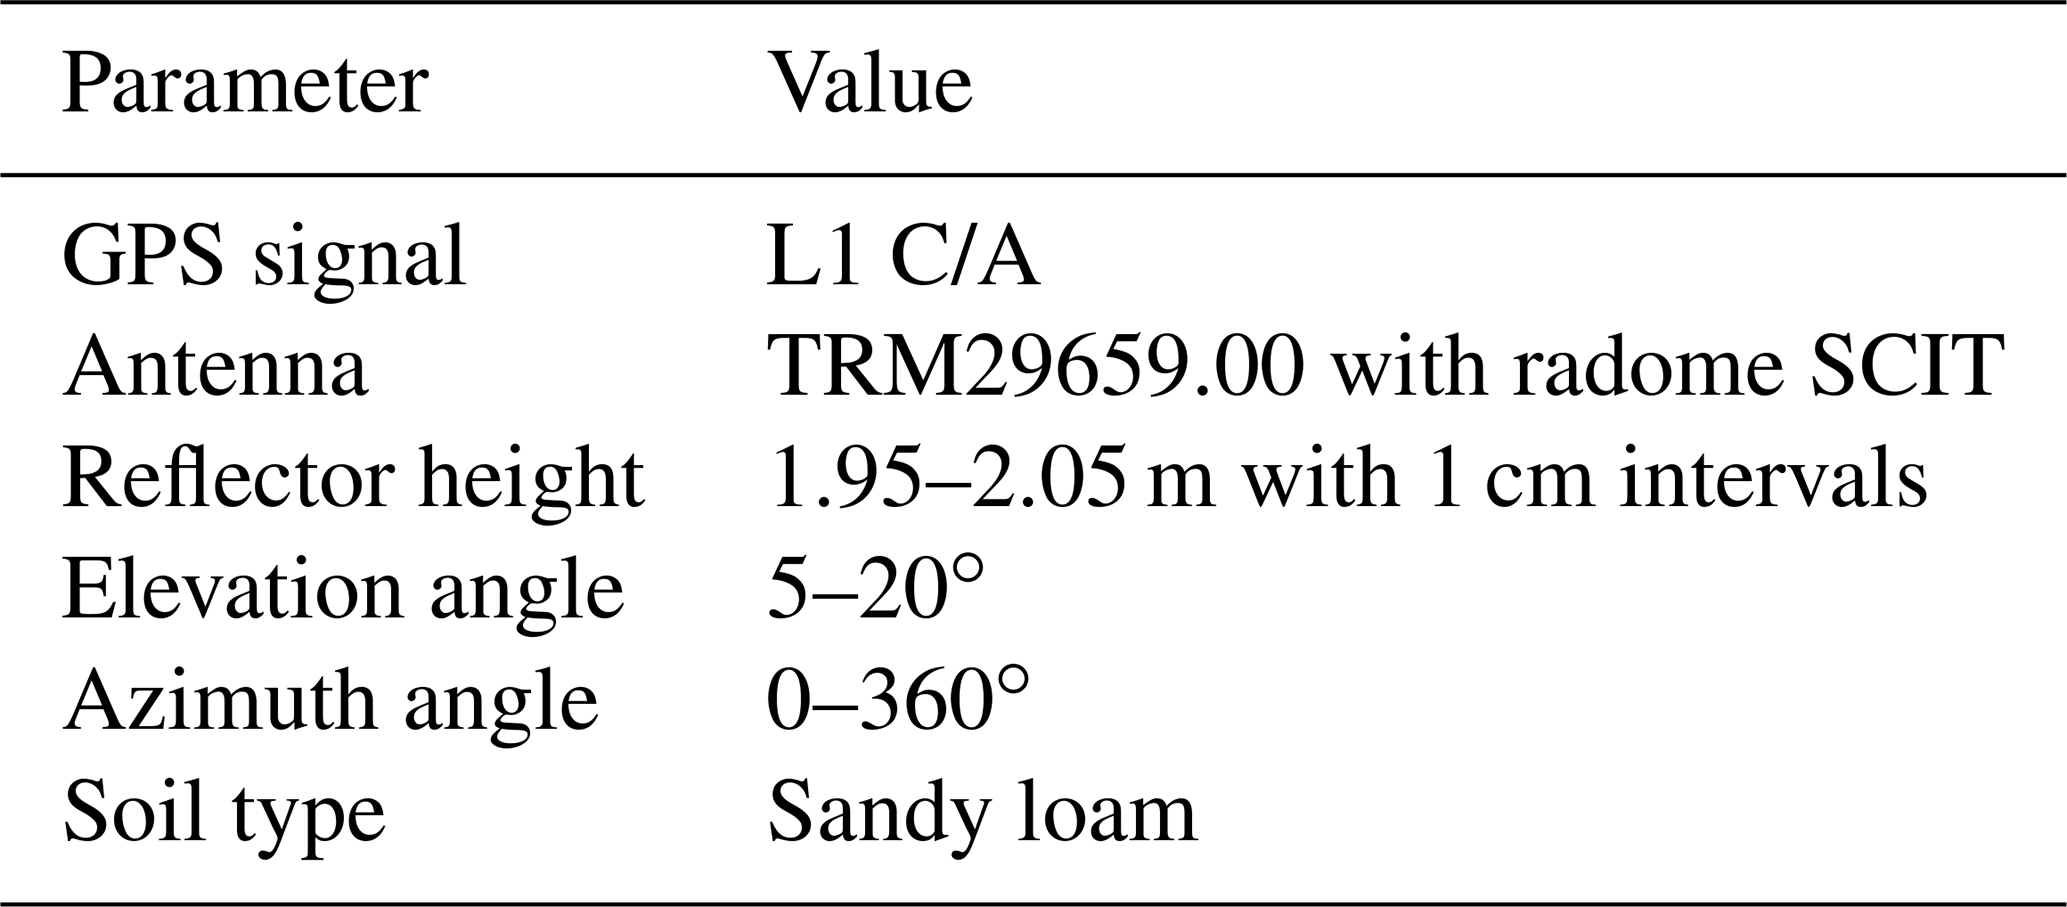
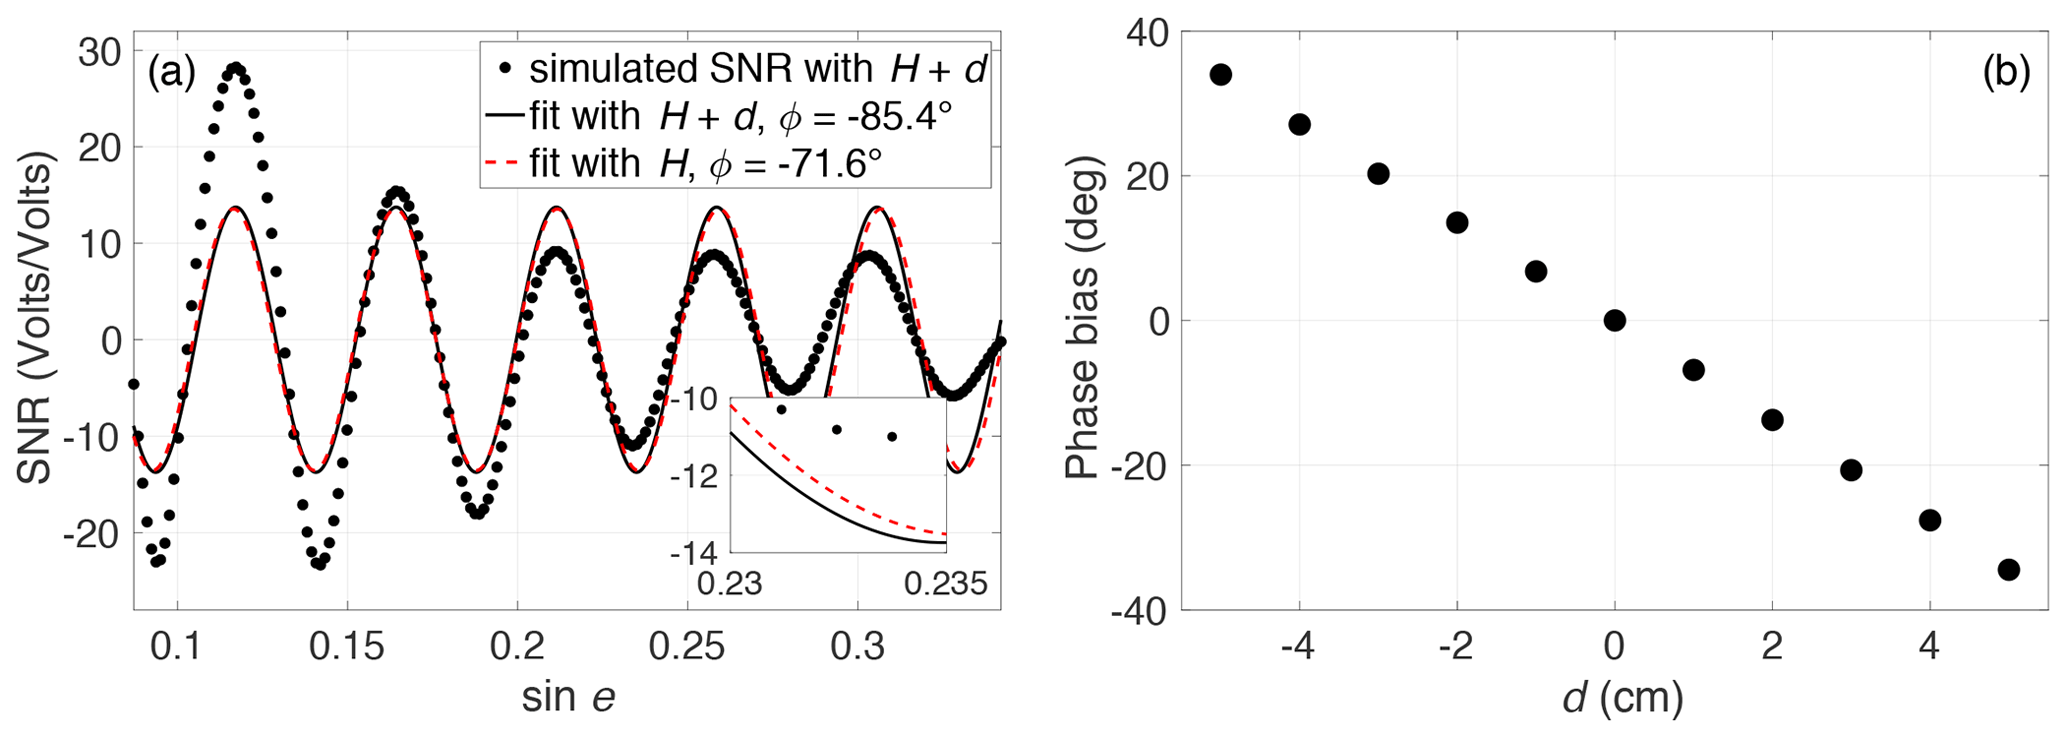
Figure 3(a) Simulated SNR with H+d and their fits based on H+d and H, respectively. In this simulation, H and d are fixed as 2 m and 2 cm, respectively. The inset plot shows that the phases of these two fits are different. (b) The simulated phase bias when using various d.
3.2.2 Solution: introducing modeled ground surface elevation changes
To address the problem illustrated above, we propose a solution of introducing modeled ground surface elevation changes. We add the modeled values to the constant H0 to derive the time-varying reflector height , which approximates the true daily changes in reflector height. For any given day, we use its corresponding reflector height to estimate phases. We need to note that the daily reflector heights derived by the Lomb–Scargle periodogram cannot be used directly. Except for abrupt changes due to thermokarst processes, wildfires, or human disturbance, the ground surface in cold regions typically undergoes progressive movement. As the reflector heights exhibit relatively large daily oscillations, they cannot reveal the evolution of surface elevation changes at daily intervals.
We simulate the ground surface elevation changes based on the Stefan-equation-based model of Liu et al. (2012). It can estimate surface deformation on any given day from the onset of the thawing season by using the GPS-IR-measured ground surface vertical deformation and thermal indices. The model is expressed as
where d(t) is the surface deformation on the day of t; ds denotes the seasonal subsidence; represents the normalized thermal index IT(t) by its maximum value; and IT(t) is the square root of degree days of thawing, AT(t), from the onset of the thawing season, calculated based on the ground surface temperature T.
We use the GPS-IR-measured ground surface elevation changes and normalized thermal indices to inverse the parameters of ds and d0. They are then used together with the normalized thermal indices to simulate the ground surface elevation changes and then obtain , which are used in turn to estimate phases. As in situ soil moisture observations are available, we directly compare them to the phases to obtain the mapping function, which is then used to convert the phases to soil moisture content.
3.3 Framework of integrating GPS-IR measurements of ground surface elevation changes, soil moisture, and snow depth
We propose a three-in-one framework, i.e., integrating the GPS-IR measurements of ground surface elevation changes, soil moisture, and snow depth at one single GPS site in permafrost regions. We show a conceptual diagram of this framework in Fig. 4. We first process the SNR interferograms during the data time span to obtain daily reflector heights, based on the steps described in Sect. 3.1. We then separate them into two groups, one in the snow season and the other in the snow-free season. Reflector heights in the snow season are converted into snow depth. The ones in snow-free days are used to obtain ground surface elevation changes and the constant H0. We then use the surface elevation changes and thermal indices to model the surface deformation and calculate the time-varying . Lastly, we use and SNR data to estimate the phases, which are converted to soil moisture content.
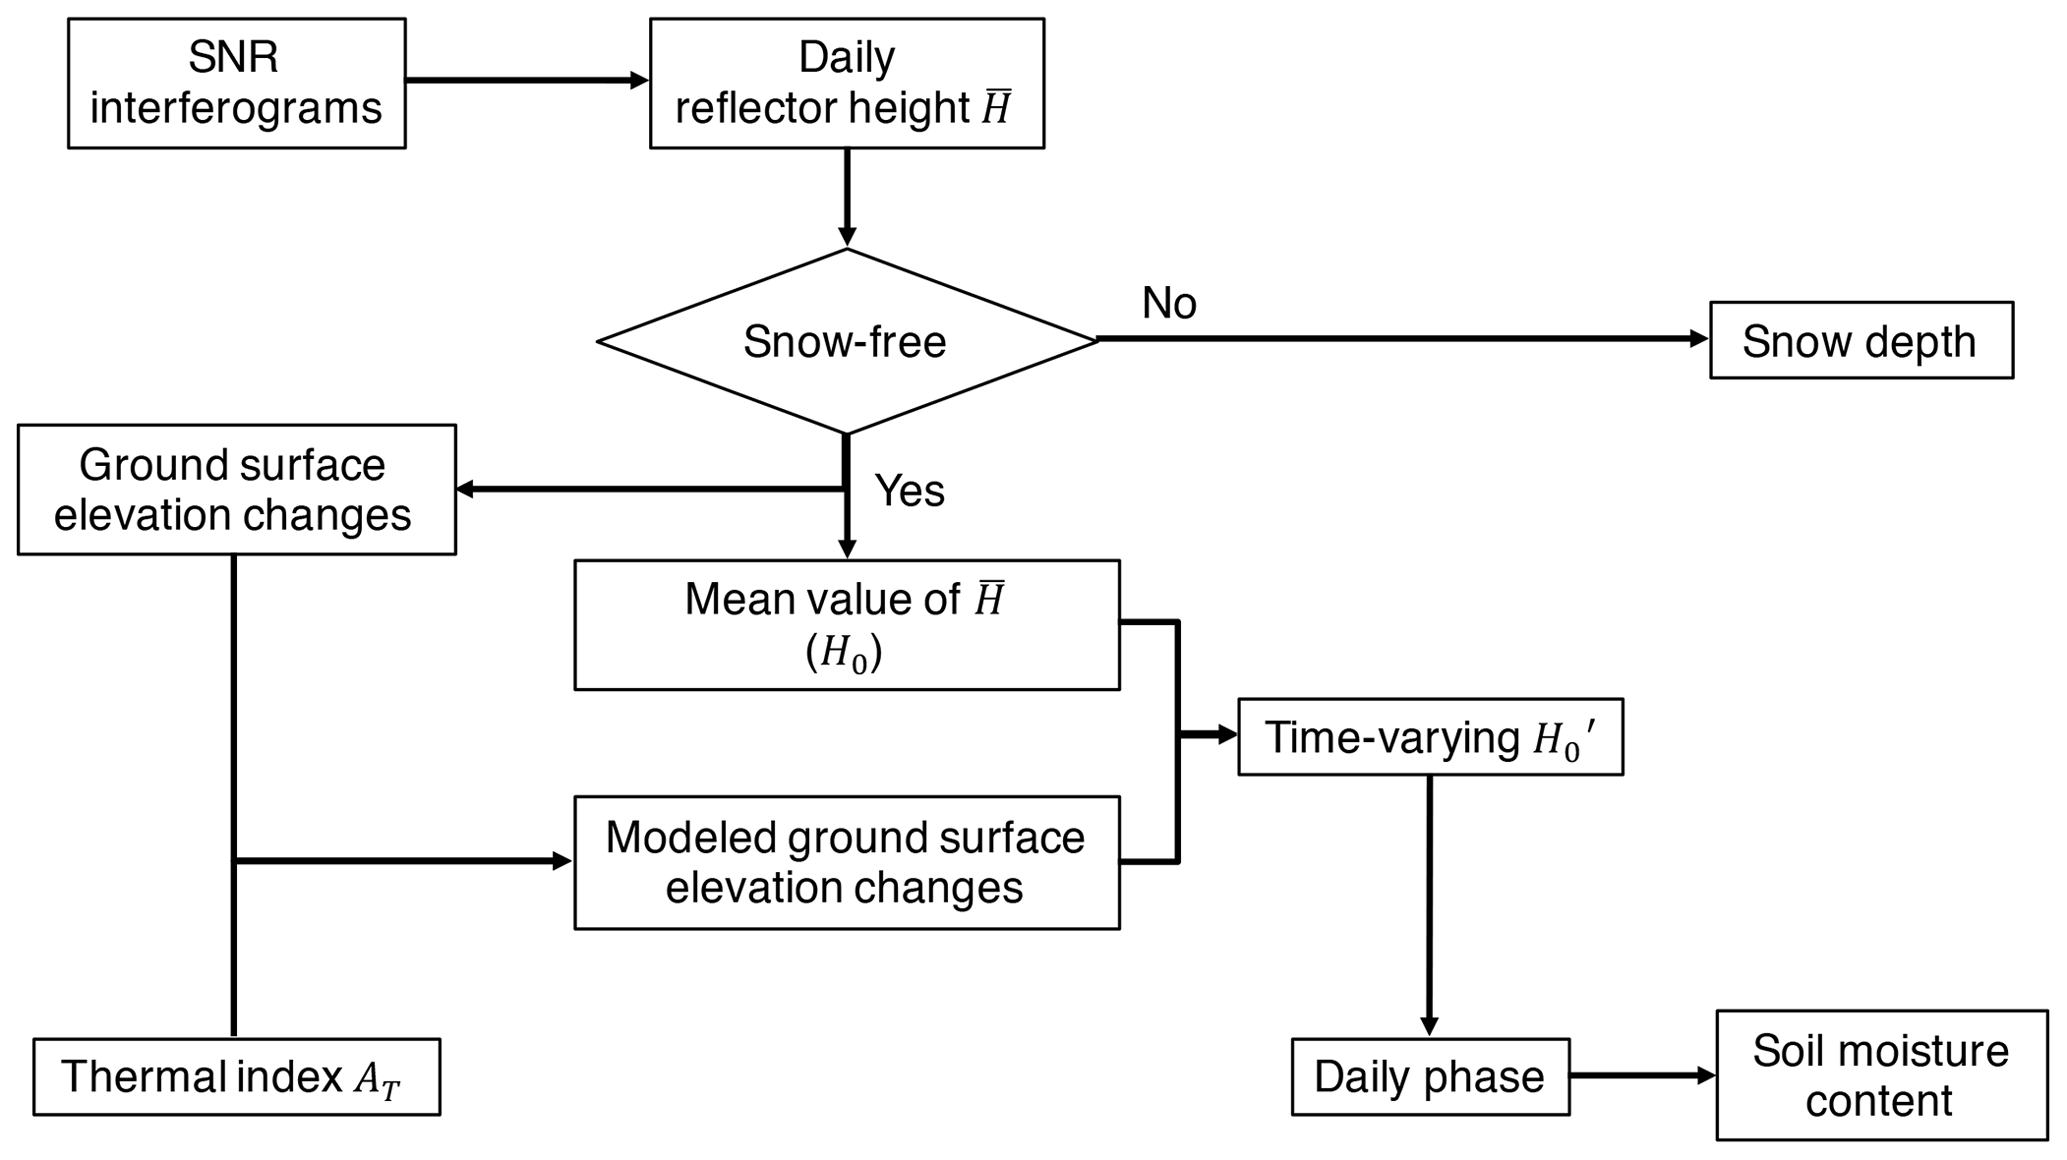
Figure 4Diagram of the three-in-one framework for integrating the GPS-IR measurements of ground surface elevation changes, soil moisture, and snow depth at one site.
3.4 Data
Manual snow depth was measured during DOY 112–156 in 2017. It was measured daily at 10 points, randomly distributed southeast of QLBG and close to the ultrasonic snow depth sensor, which are generally within the azimuth range of 90–135∘. We average them to obtain the daily measurements and calculate their standard deviations. We use the manual observations to validate our GPS-IR measurements. We do not use the ultrasonic measurements as they are not calibrated.
In situ soil moisture and ground surface temperature in 2017 and 2018 are used as well. We use the ground temperatures to determine the onset and duration of thaw seasons. We also use them to calculate the thermal index AT. We use the soil moisture observations to convert phases to soil moisture content and validate our modified GPS-IR algorithm.
SNR data of the GPS L1 C/A signals recorded by QLBG are available from November 2016 to April 2019 (Fig. 5). They have frequent large gaps, such as DOY 57–111 and DOY 191–215 in 2017 and DOY 77–180 in 2018, due to instrumentation problems. Considering the continuity of SNR data and availability of in situ measurements, we use the SNR data within the azimuth range of 90–135∘ during DOY 167–173 in 2017 (as the beginning of thaw season) to obtain the reflector height of ground surface to be the reference and the ones during DOY 112–156 in 2017 to estimate snow depth. The SNR data within the azimuth range of 0–360∘ during DOY 182–243 in 2018 are used to measure ground surface elevation changes and soil moisture content. We show an example of SNR interferogram in Fig. 5b, which exhibits a clear quasi-sinusoidal pattern. The sampling rate of SNR data is 15 s. SNR data are recorded as integers. L2C signals are not recorded.
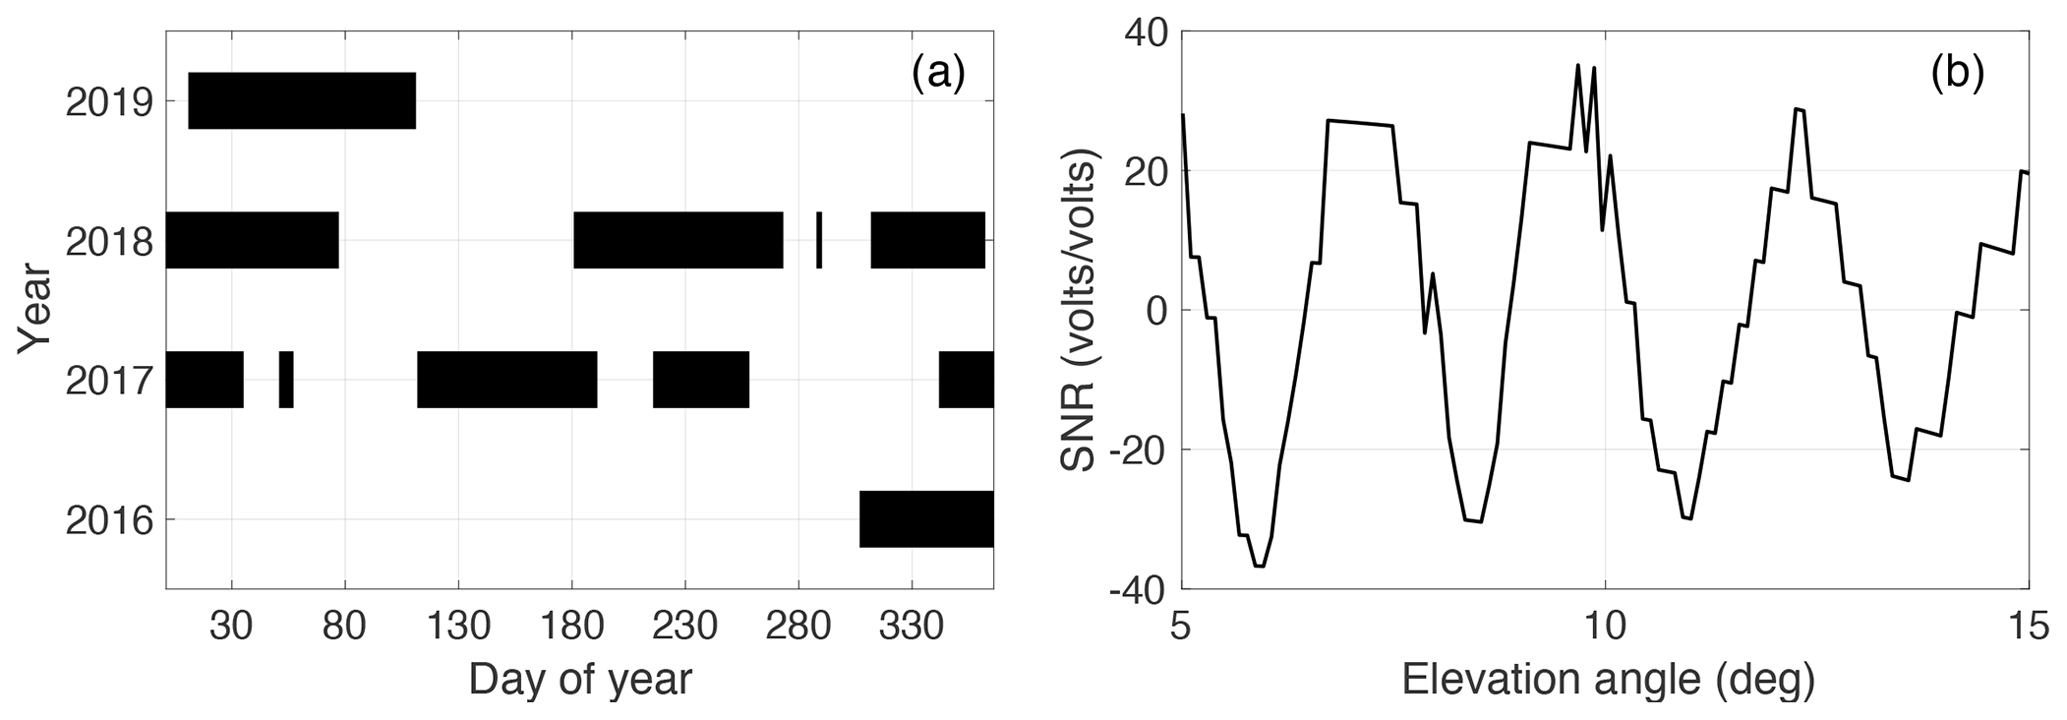
Figure 5(a) Availability of the SNR data of the GPS L1 C/A signals recorded by QLBG during 2016–2019. (b) SNR observations with elevation angles of 5–15∘ of the GPS-02 satellite on DOY 220 in 2018. The second-order polynomial has been removed.
4.1 Ground surface elevation changes
We obtain the daily reflector height measurements during DOY 182–243 in 2018. We then remove the mean value from the minus reflector heights and use the residuals to represent the ground surface elevation changes, which are shown in Fig. 6a. Their standard deviations are on the order of 1–2 cm. Surface elevation changes show a progressive subsidence trend, which is mainly caused by ground ice melting within the thawing active layer.
We compare the surface elevation changes to the normalized thermal indices and build their best linear fit to obtain the model parameters based on Sect. 3.2.2 (Fig. 6b). The parameters ds and d0 are −1.7 ± 0.8 and 1.2 ± 0.6 cm, respectively. We then use these parameters and the normalized thermal indices to simulate the ground surface elevation changes, which are presented in Fig. 6a as a curve superimposed on the GPS-IR measurements. The simulated surface deformation is used to compute the time-varying , to estimate the phases and then soil moisture content, which will be presented in Sect. 4.2.
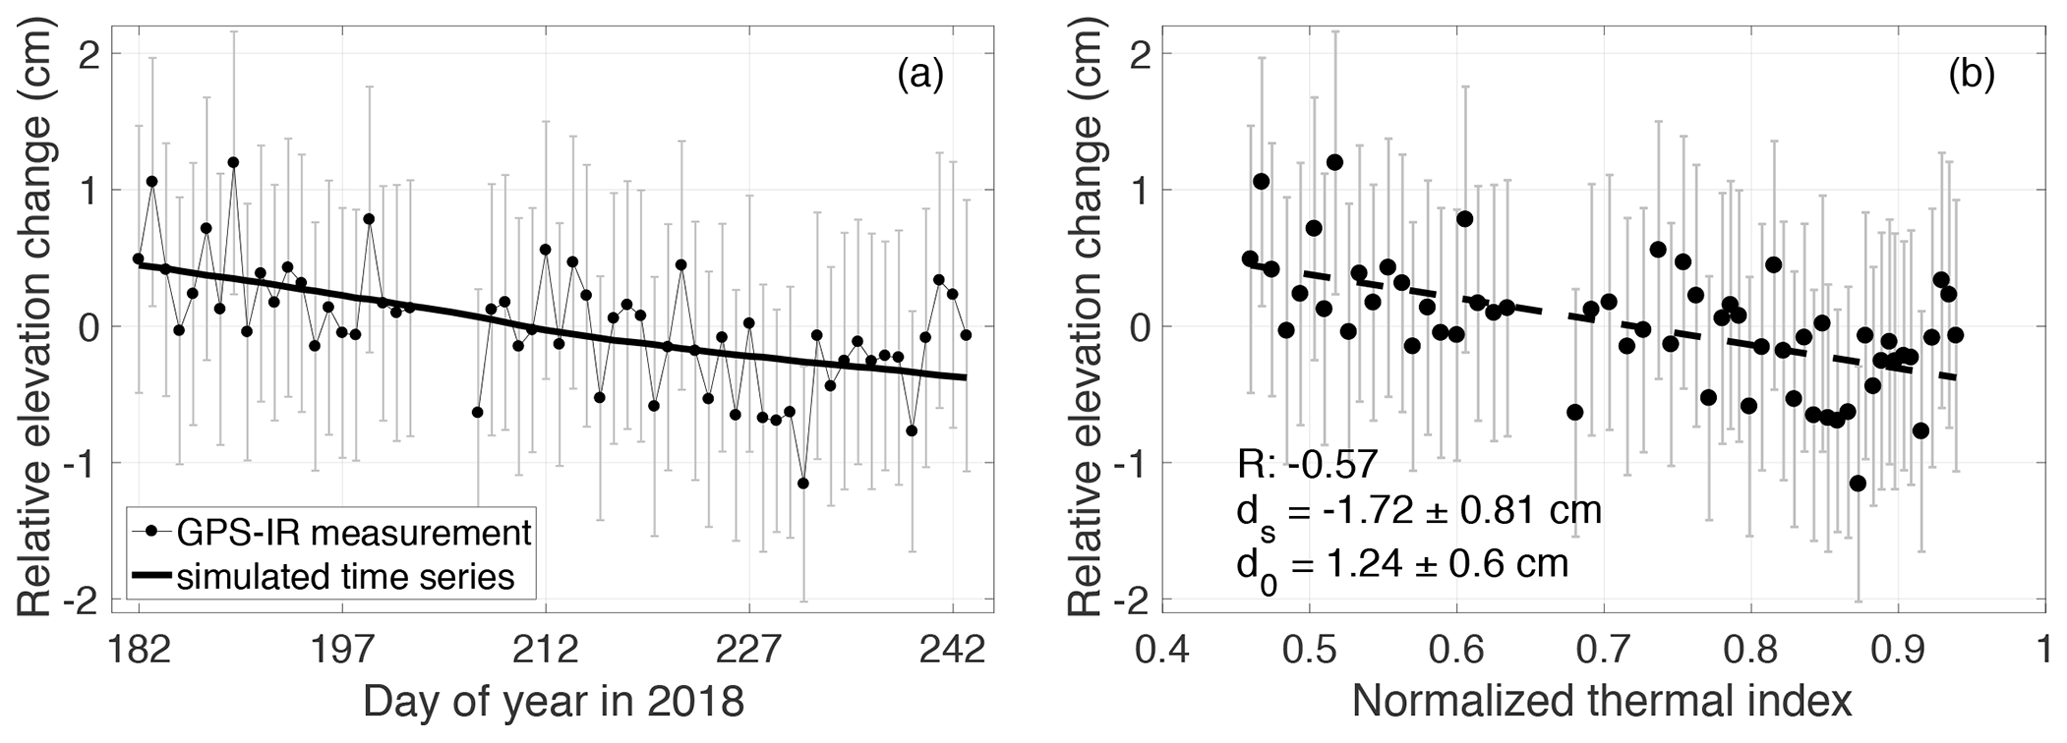
Figure 6(a) Time series of GPS-IR measurements of ground surface elevation changes and the simulated ones based on the model parameters ds and d0 in (b) during DOY 182–243 in 2018. (b) Scatter plot between the ground surface elevation changes and the normalized thermal indices and their best linear fit (dashed line). ds and d0 are the slope and intercept of this fit line.
4.2 Validation of the improved method and soil moisture content
We use the time-varying as obtained in Sect. 4.1 to estimate the daily phases during DOY 182–243 in 2018 (Fig. 7a). For comparison, we also obtain the phases by the default method (Fig. 7c). We compare the phases to in situ soil moisture measurements to obtain the best linear fits as mapping functions. The fit line for the modified method has a slope of 1.73 % ± 0.07 % per degree and an intercept of 22.2 % ± 0.6 % (Fig. 7b). The one for the default method has a slope of 0.84 % ± 0.04 % per degree and intercept of 30 % ± 0.39 % (Fig. 7d). We use these parameters to convert the phases to soil moisture content shown in Fig. 8.
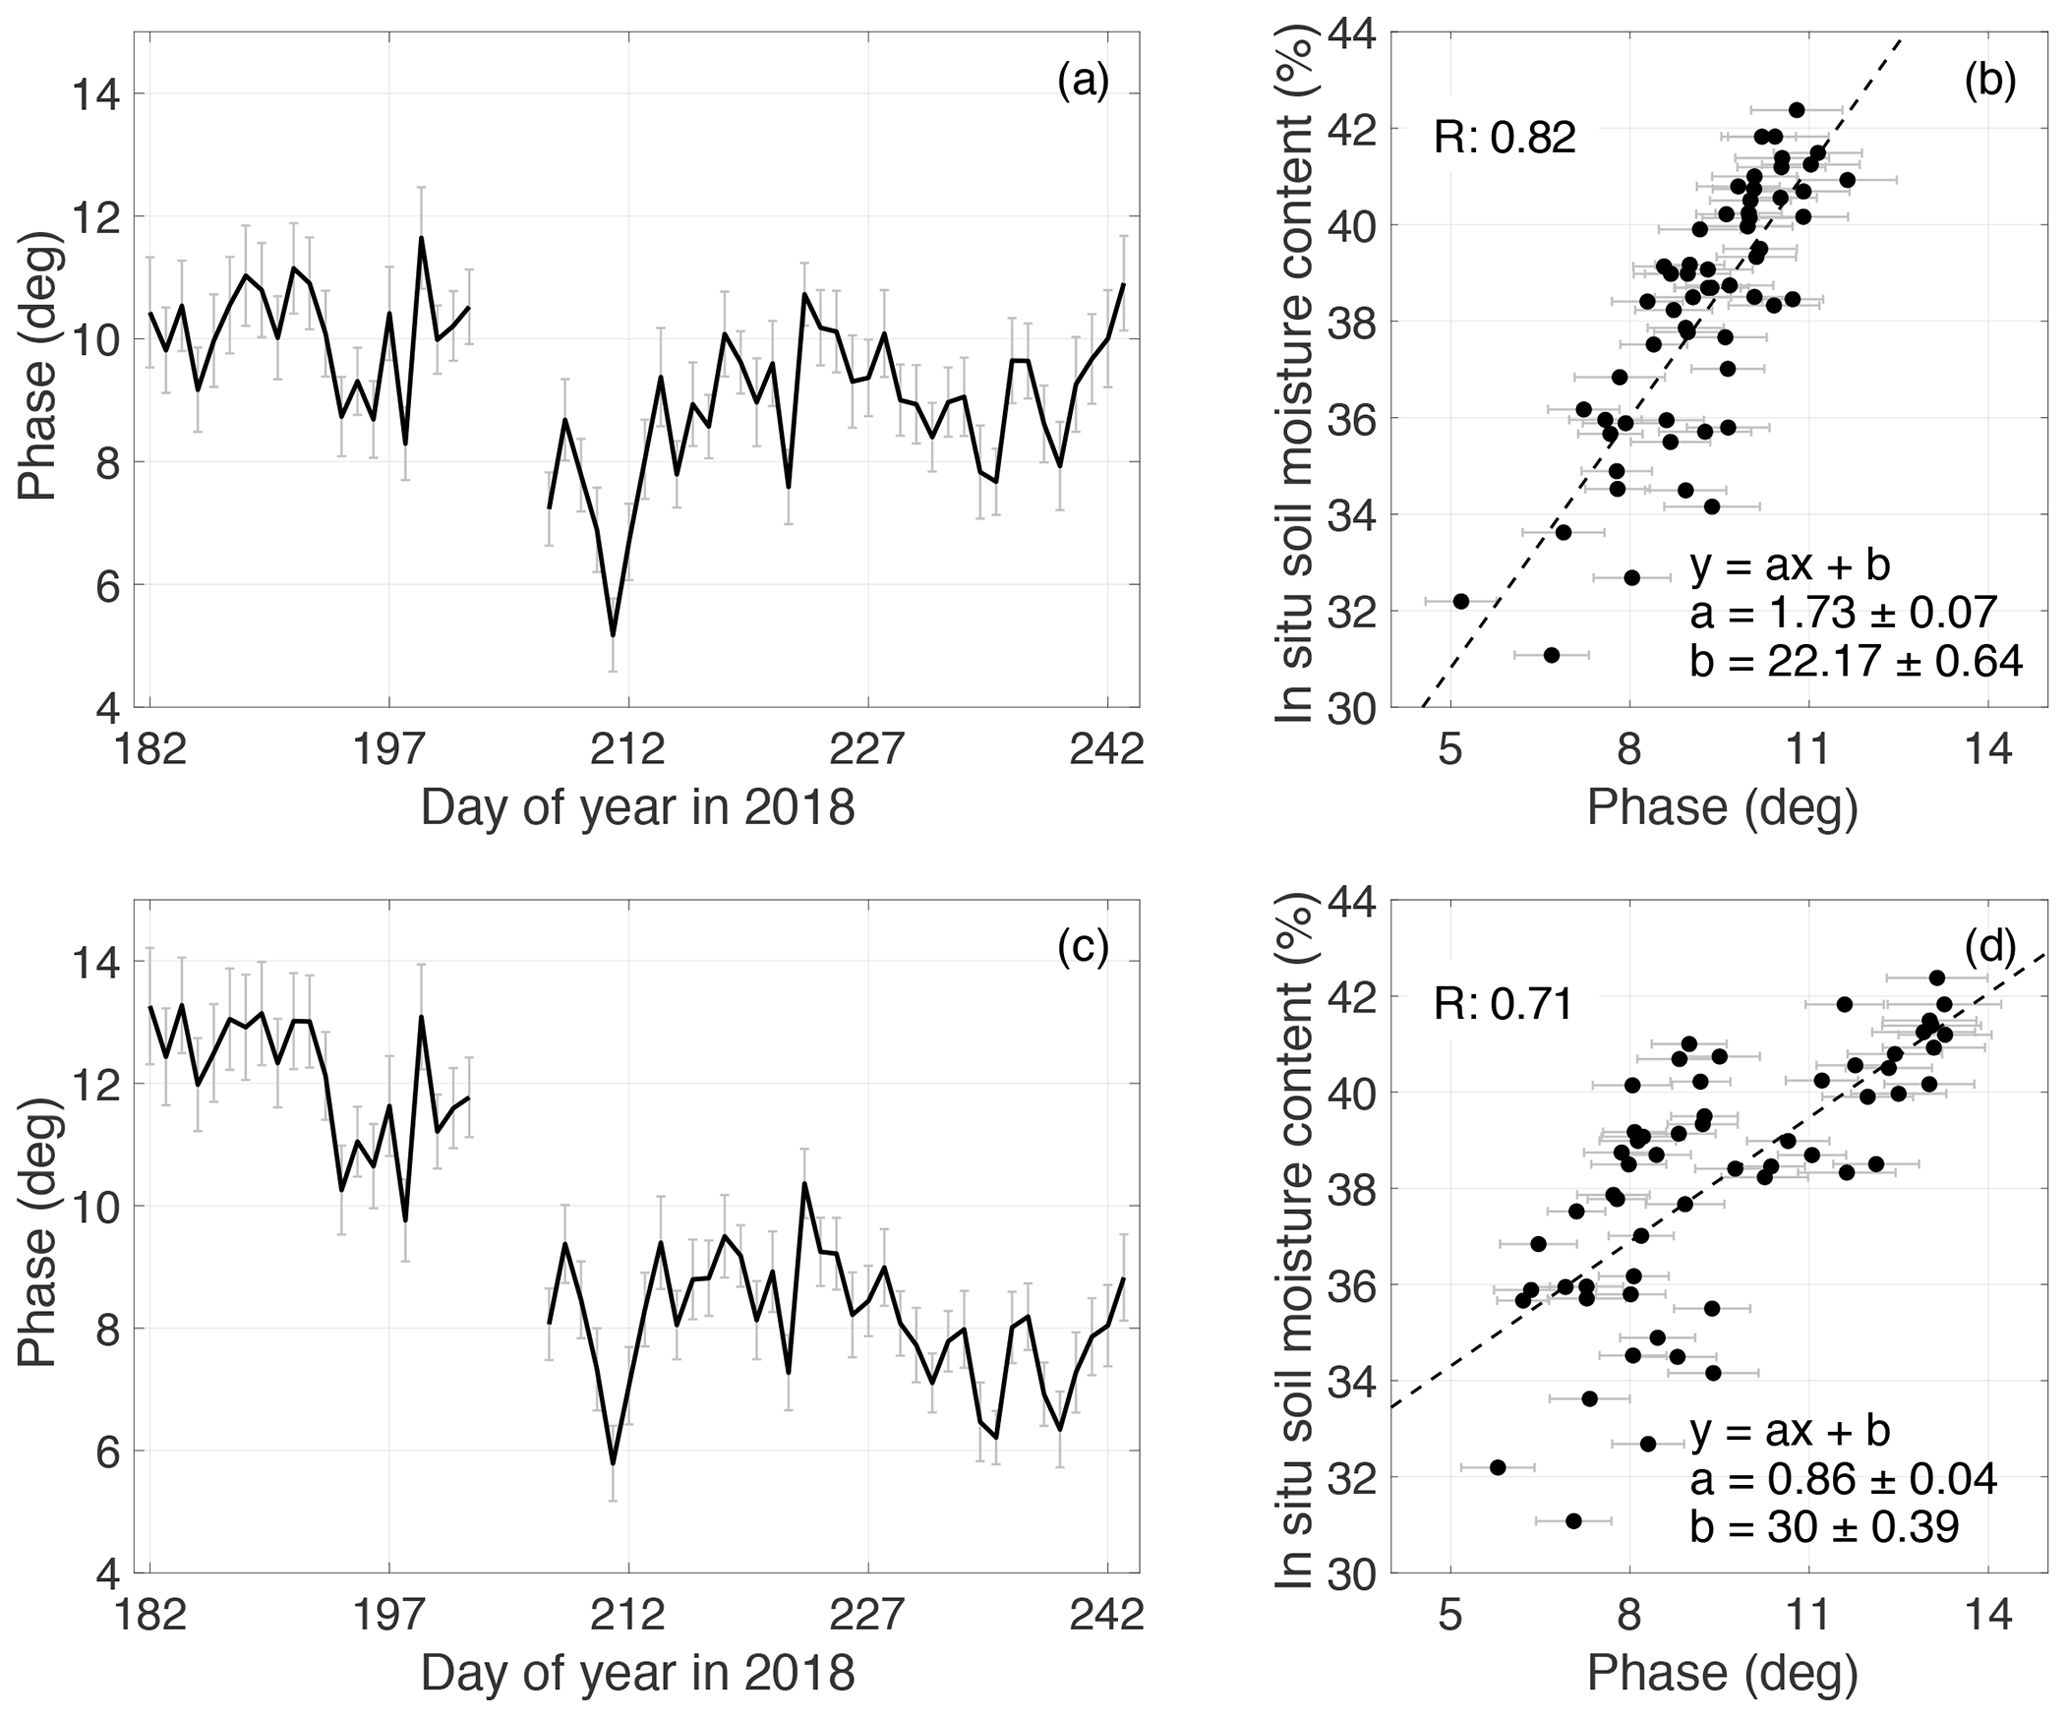
Figure 7(a) Time series of the phases derived by our method during DOY 182–243 in 2018. Error bars denote their uncertainties represented by the standard deviations of the mean values. (b) Scatter plot between phases in panel (a) and in situ soil moisture and their best linear fit shown as a dashed line. The slope and intercept of the fit line are presented. We also show the goodness of fit as R. Panels (c) and (d) are similar to panels (a) and (b) respectively but for the results of the default method. The data gap during DOY 203–206 is due to the absence of SNR data.
From the in situ measurements in Fig. 8, we observe that surface soil underwent several drying–wetting cycles during DOY 182–243 in 2018, especially the one during DOY 201–218 with a magnitude of ∼ 10 %. The soil moisture estimated by our method agrees well with the in situ ones (Fig. 8a). They capture the prominent drying–wetting feature and other cycles as well. The in situ measurements and the estimates by our method have a correlation coefficient of 0.82 and a root-mean-squared error (RMSE) of 1.51 %. In contrast, for the soil moisture derived by the default algorithm, we barely recognize the significant drying-wetting phenomenon during DOY 201–218. Furthermore, they exhibit an obvious descending trend. Based on the simulations in Sect. 3.2.1, the phase bias is nearly proportional to surface deformation, and surface subsidence introduces a negative bias. In summer, when the thawing front advances deeper, the surface subsidence accumulates, and then the bias decreases (with increasing absolute value). Accumulating surface subsidence gives rise to a decreasing trend of soil moisture estimates. The soil moisture estimates by the default method and in situ measurements have a correlation coefficient of 0.71 and RMSE of 1.85 %. In summary, by comparing the GPS-IR estimates and in situ observations, our method outperforms the default one. Furthermore, soil moisture was estimated by GPS-IR at 11 sites with various vegetation conditions by Small et al. (2016). The RMSEs of their estimated soil moisture at these 11 sites range from 1.5 % to 5.1 %. Our results obtained by the improved algorithm in this study achieve comparable accuracy.

Figure 8Time series of in situ soil moisture content and those measured by (a) our method and (b) the default method. The shaded areas denote the uncertainties of GPS-IR estimates. Root-mean-square error (RMSE) and correlation coefficient (R) are presented.
4.3 Snow depth
We obtain the GPS-IR-measured snow depth during DOY 112–156 in 2017 (Fig. 9). Their standard deviations are on the order of several centimeters as well. We compare them to the manual observations. From the manual measurements, we can observe that snow cover underwent several cycles of accumulation–ablation, e.g., the one during DOY 140–147. Consistently, GPS-IR measurements capture these processes. Figure 9b shows the scatter plot between the GPS-IR and manual observations and their best linear fit. The correlation coefficient is 0.73. The GPS-IR measurements have an RMSE of 4.11 cm and a bias of 2.49 cm. The agreement level of the GPS-IR-estimated snow depth to the manual observation ranges from 4 to 6 cm in the validation experiments of Larson (2019). Our measurements have comparable accuracy.
The GPS-IR measurements overestimate the snow depth, indicated by the positive bias. The main reason is possibly due to the difference of surface reflectivity between snow and wet soil. According to the in situ measurements, the volumetrical moisture content at 1 cm depth during DOY 167–173 in 2017 was around 38 %. Given the significant contrast of moisture content in snow and wet soil, their different surface reflectivity might affect the GPS-IR measurements. We use the multipath simulator of Nievinski and Larson (2014) to conduct simulations to quantify the influence. The details can be found in Sect. S2 in the Supplement. Our simulations show that a bias of 4 cm is introduced and can lead to an overestimation of the GPS-IR measurements, which help to explain the positive bias to some extent. Moreover, the possible penetration into soil when manually measuring snow depth may also affect the GPS-IR measurements (McCreight et al., 2014). The penetration could compensate for a part of the overestimation of GPS-IR observations.
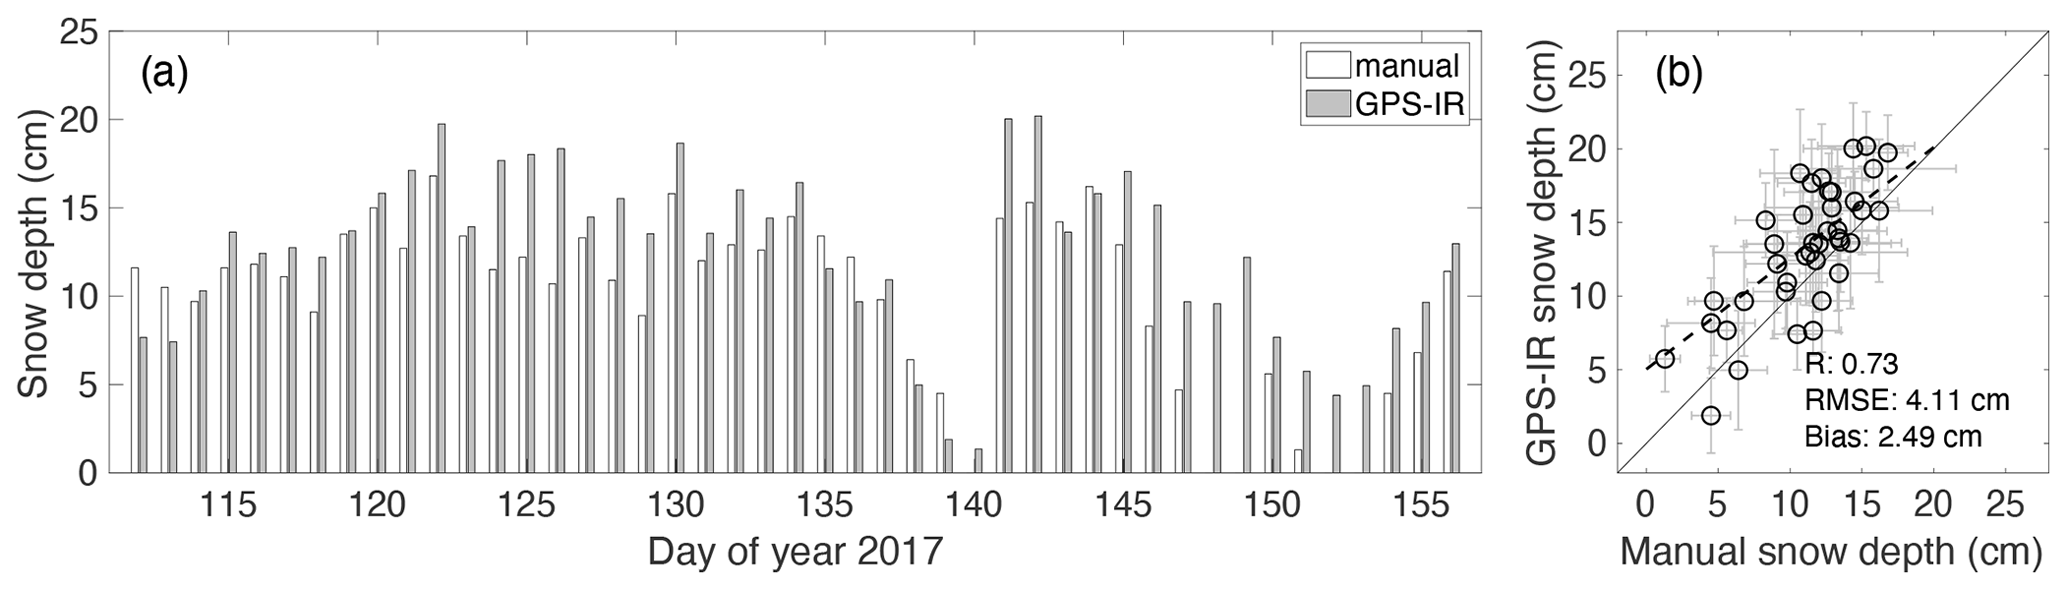
Figure 9(a) Bar plot of manual and GPS-IR-estimated snow depth. Error bars are not shown for clarity. (b) Scatter plot of the manual snow depth and the GPS-IR ones and their best linear fit as a dashed line. The correlation coefficient (R), RMSE, and bias are shown as well.
5.1 Merits and error sources of the modified algorithm
The advantage of the modified algorithm for estimating soil moisture content is that it can correct the bias introduced by the seasonal surface elevation changes in permafrost areas. Moreover, the required input of this method is easy to access. The surface elevation changes can be obtained directly by GPS-IR. The ground/air temperatures can be provided by in situ measurements or reanalysis datasets (e.g., European Centre for Medium-Range Weather Forecasts, https://www.ecmwf.int, last access: 24 June 2021). In addition, this modified method can also provide daily and continuous measurements with intermediate spatial coverages.
The error sources of the modified method are related to antenna gain pattern, surface conditions (i.e., vegetation and soil moisture), and the GPS-IR geometry. The receiver antenna is designed to favor the reception of direct signals and suppress those with low satellite elevation angles and reflected signals. It has an asymmetric gain pattern along the elevation angle. For any given SNR series, the antenna gain's impact varies at each data point. But for any SNR series with the same elevation angles, they suffer from the same impact. Therefore, the influence of antenna gain pattern on the SNR metrics (i.e., frequency, amplitude, phase) can be regarded as a systematic bias. As we focus on the temporal variations, the impact of antenna gain pattern is negligible. The surface reflectivity also varies with the elevation angle. Given antenna gain pattern and surface reflectivity, the phases of each point of a given SNR interferogram are slightly different (i.e., the phase term ϕ(e) in Eq. 1 is a variable). Assuming the phase to be a constant in data processing might introduce errors. Zavorotny et al. (2010) simulated SNR in bare soil conditions with a smooth reflecting surface. The phase variations with respect to the elevation angles are nearly the same, given a change in soil moisture content. It indicates that assuming the phase to be a constant has little impact on the GPS-IR estimates of soil moisture, as we focus on the temporal changes in the phase. The ground surface at our site is relatively smooth and horizontal (Fig. 1). The vegetation is sufficiently short (i.e., less than the wavelength of the L-band GPS signals) to be transparent for the GPS signals. The impact of the surface conditions is expected to be limited as well.
Regarding the error sources related to the GPS-IR geometry, they affect the soil moisture estimates through the GPS-IR-measured surface elevation changes, which are used to calculate the time-varying . The error sources are mainly monument stability, tropospheric delays of the GPS signals, and monument thermal contraction/expansion. Though the foundation base is slightly shallower than the active layer thickness, the monument does not have any significant displacement pattern (see the details in Sect. S1 in the Supplement). The monument can be regarded as stable with respect to the permafrost and barely has any impact on the GPS-IR-measured surface elevation changes. Regarding the tropospheric delays, we use the in situ air temperature and pressure measurements to quantify them, using the refraction correction model of Bennett (1982). The tropospheric biases are ∼ 1.3 cm and relatively steady (Fig. 10). As we focus on the temporal changes in the surface elevation changes, the impact of the tropospheric biases is negligible. For the thermal expansion/contraction of the monument, the coefficient of linear thermal expansion of galvanized steel is 11∼ 13 × 10−6 m (m ∘C)−1. Given a temperature variation range of 20 ∘C in a thaw season, for a 2 m high monument, the magnitude of the thermal expansion is less than 1 mm, which is at least 1 order of magnitude smaller than that of surface elevation changes.
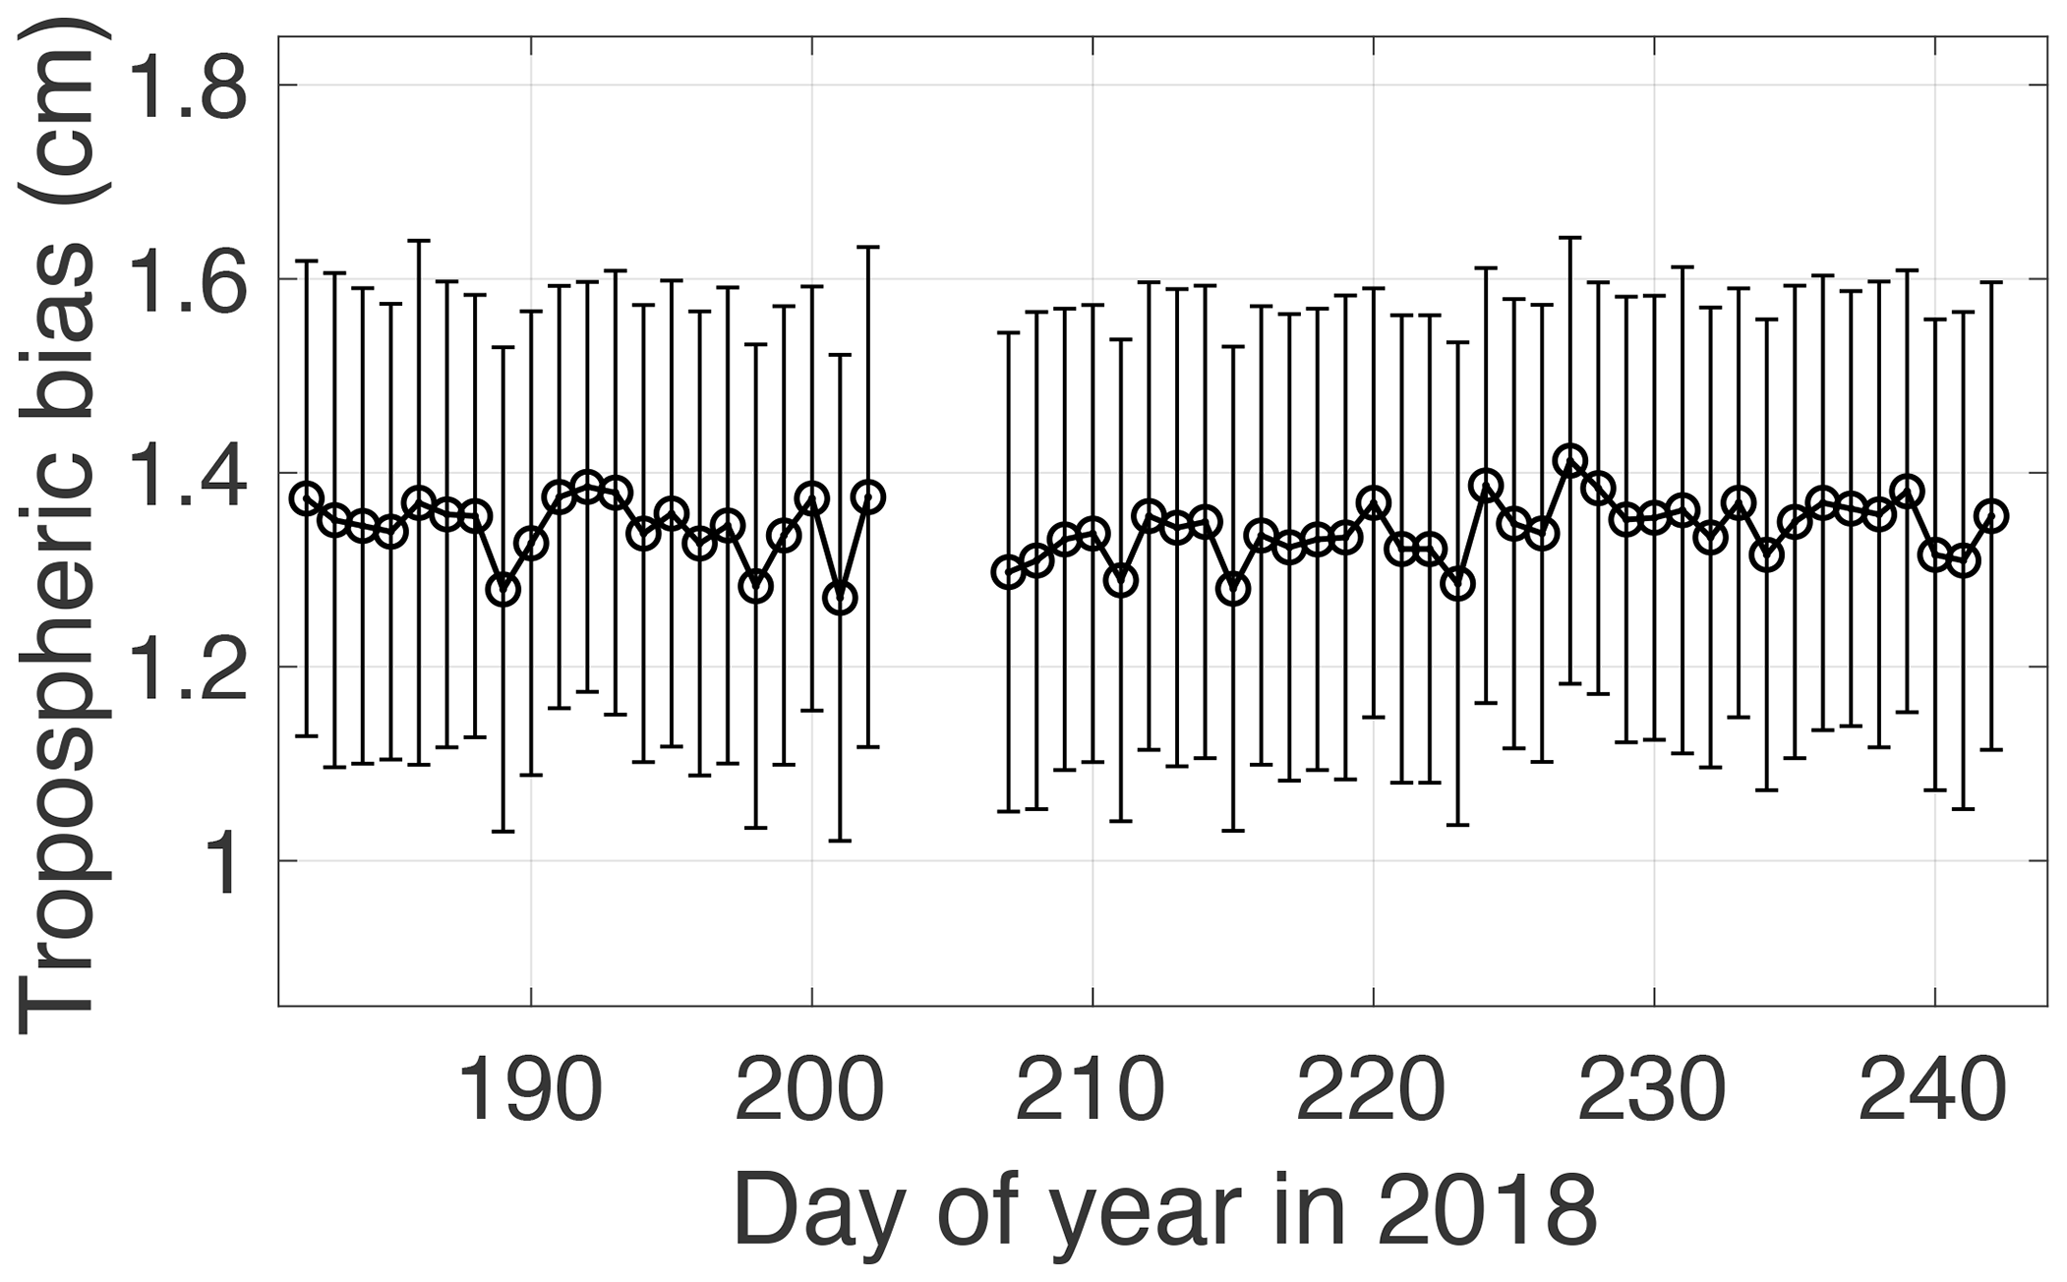
Figure 10Tropospheric biases of ground surface elevation changes during DOY 182–243 in 2018. They are the mean values of the biases of all satellite tracks, whose standard deviations are represented by error bars.
The temporal variation of soil moisture may also introduce bias to the GPS-IR-measured surface elevation changes and then to the measurements of soil moisture content. Assuming the phase to be a constant introduces a bias to the frequency retrieval and then the reflector height. Such a bias is called compositional reflector height, as it manifests itself as a part of the reflector height (Nievinski, 2013). Liu and Larson (2018) conducted simulations and found that the bias was less than 2 cm and varied in the range of less than 1 cm, given soil moisture between 15 % and 40 %. In this study, such a bias is expected to be limited, as the precipitation is scarce and light in the cold and dry plateau climate and we focus on the temporal changes in the surface elevations.
5.2 Benefits of the three-in-one framework to permafrost studies
The three-in-one framework can fully utilize the GPS-IR in permafrost studies. We can obtain the GPS-IR measurements of three key variables by one GPS station, which is crucially important due to the lack of observations in permafrost areas. Our study in QLBG serves as an example of this framework.
The obtained GPS-IR measurements can be directly used to study the changes in permafrost areas at local scales. We can use the snow depth to study the variation of snow cover and its insulating effect and hydrological impact on the frozen ground. The ground surface elevation changes can indicate the amount of melting ground ice and the changes in active layer thickness with ancillary information such as soil moisture profiles. The magnitude of surface elevation changes in permafrost areas mainly depends on the moisture content within the thawed/frozen soil. We can estimate the active layer thickness if we have the seasonal surface elevation changes and soil moisture profile (Liu et al., 2012). The soil moisture content measurements aid in studying the water cycles and surface energy balance and analyzing the interaction between the atmosphere and frozen ground.
The GPS-IR measurements can be used to calibrate/validate the remote sensing observations at regional scales. At present, surface elevation changes, soil moisture, and snow depth can be provided by airborne/satellite-borne measurements, such as InSAR measurements for surface elevation changes (Liu et al., 2010), Soil Moisture Active Passive (SMAP) data for soil moisture content (Entekhabi et al., 2010), and snow depth estimated from passive microwave radiometry data (Walker and Silis, 2002; Che et al., 2008). These remote sensing observations have relatively broad spatial coverages, typically on the order of several tens of kilometers. As the GPS-IR measurements have intermediate spatial coverages, they can be used to calibrate/validate the remote sensing observations.
The three-in-one framework can be extended to other GPS sites, such as those in the Arctic. The GPS station SG27 in Utqiagvik (formerly Barrow), Alaska, has been proved to be usable for GPS-IR studies (Liu and Larson, 2018). Zhang et al. (2020) also identified 12 usable GPS stations in the Northern Canada permafrost areas. We can apply the framework to these stations to obtain GPS-IR measurements, which will contribute to the research on permafrost.
This study highlights the improvement to the default GPS-IR algorithm for estimating soil moisture content. It can correct the bias introduced by the seasonal surface elevation changes in permafrost areas. We use the GPS data and the in situ measurements of soil moisture at QLBG to validate this modified method. The correlation coefficient and RMSE between the GPS-IR estimates and the in situ ones improve from 1.85 % to 1.51 % and 0.71 to 0.82, respectively.
We implement a framework to integrate the GPS-IR measurements of ground surface elevation changes, soil moisture, and snow depth at one single site. Following the framework, we obtain the GPS-IR measurements at QLBG. The framework helps to comprehensively use GPS-IR in frozen ground. It also can be extended to other sites, for instance, those in the Arctic, where multiple stations have been identified to be usable for GPS-IR studies.
This study is also the first to use GPS-IR in the QTP. QLBG fills a spatial gap in the existing sparse permafrost-monitoring sites. Its GPS-IR measurements are complementary to the existing observations, such as ground temperatures. They can also be used to calibrate/validate remote sensing observations.
We have published the GPS-IR measurements on Zenodo with the DOI of https://doi.org/10.5281/zenodo.4895864 (Zhang et al., 2021).
The supplement related to this article is available online at: https://doi.org/10.5194/tc-15-3021-2021-supplement.
JZ, LL, and TC conceived this work. JZ conducted the data processing and result analysis and wrote the manuscript. LL helped to interpret the results and revised the manuscript. TC and LS provided the GPS data and in situ measurements and revised the manuscript.
The authors declare that they have no conflict of interest.
Publisher’s note: Copernicus Publications remains neutral with regard to jurisdictional claims in published maps and institutional affiliations.
We thank Yufeng Hu for the constructive discussion. We also thank the reviewers and editor for their substantially helpful comments.
This research has been supported by the Second Tibetan Plateau Scientific Expedition and Research Program (STEP) (grant no. 2019QZKK0201), the Strategic Priority Research Program of the Chinese Academy of Sciences (grant no. XDA19070204), and the Hong Kong Research Grants Council (grant no. CUHK14305618).
This paper was edited by Claude Duguay and reviewed by three anonymous referees.
Bennett, G. G.: The Calculation of Astronomical Refraction in Marine Navigation, J. Navig., 35, 255–259, https://doi.org/10.1017/S0373463300022037, 1982.
Che, T., Li, X., Jin, R., Armstrong, R., and Zhang, T.: Snow depth derived from passive microwave remote-sensing data in China, Ann. Glaciol., 49, 145–154, https://doi.org/10.3189/172756408787814690, 2008.
Che, T., Li, X., Liu, S., Li, H., Xu, Z., Tan, J., Zhang, Y., Ren, Z., Xiao, L., Deng, J., Jin, R., Ma, M., Wang, J., and Yang, X.: Integrated hydrometeorological, snow and frozen-ground observations in the alpine region of the Heihe River Basin, China, Earth Syst. Sci. Data, 11, 1483–1499, https://doi.org/10.5194/essd-11-1483-2019, 2019.
Chen, J., Liu, L., Zhang, T., Cao, B., and Lin, H.: Using Persistent Scatterer Interferometry to Map and Quantify Permafrost Thaw Subsidence: A Case Study of Eboling Mountain on the Qinghai-Tibet Plateau, J. Geophys. Res.-Earth, 123, 2663–2676, https://doi.org/10.1029/2018JF004618, 2018.
Cheng, G. and Wu, T.: Responses of permafrost to climate change and their environmental significance, Qinghai-Tibet Plateau, J. Geophys. Res., 112, F02S03, https://doi.org/10.1029/2006JF000631, 2007.
Chew, C., Small, E. E., and Larson, K. M.: An algorithm for soil moisture estimation using GPS-interferometric reflectometry for bare and vegetated soil, GPS Solut., 20, 525–537, https://doi.org/10.1007/s10291-015-0462-4, 2016.
Chew, C. C., Small, E. E., Larson, K. M., and Zavorotny, V. U.: Effects of Near-Surface Soil Moisture on GPS SNR Data: Development of a Retrieval Algorithm for Soil Moisture, IEEE T. Geosci. Remote, 52, 537–543, https://doi.org/10.1109/TGRS.2013.2242332, 2014.
Daout, S., Dini, B., Haeberli, W., Doin, M.-P., and Parsons, B.: Ice loss in the Northeastern Tibetan Plateau permafrost as seen by 16 yr of ESA SAR missions, Earth Planet. Sc. Lett., 545, 116404, https://doi.org/10.1016/j.epsl.2020.116404, 2020.
Deng, H., Pepin, N. C., and Chen, Y.: Changes of snowfall under warming in the Tibetan Plateau, J. Geophys. Res.-Atmos., 122, 7323–7341, https://doi.org/10.1002/2017JD026524, 2017.
Dobinski, W.: Permafrost, Earth-Sci. Rev., 108, 158–169, https://doi.org/10.1016/j.earscirev.2011.06.007, 2011.
Entekhabi, D., Njoku, E. G., O'Neill, P. E., Kellogg, K. H., Crow, W. T., Edelstein, W. N., Entin, J. K., Goodman, S. D., Jackson, T. J., Johnson, J., Kimball, J., Piepmeier, J. R., Koster, R. D., Martin, N., McDonald, K. C., Moghaddam, M., Moran, S., Reichle, R., Shi, J. C., Spencer, M. W., Thurman, S. W., Tsang, L., and Van Zyl, J.: The Soil Moisture Active Passive (SMAP) Mission, Proc. IEEE, 98, 704–716, https://doi.org/10.1109/JPROC.2010.2043918, 2010.
Flanner, M. G. and Zender, C. S.: Snowpack radiative heating: Influence on Tibetan Plateau climate, Geophys. Res. Lett., 32, L06501, https://doi.org/10.1029/2004GL022076, 2005.
Gao, J., Williams, M. W., Fu, X., Wang, G., and Gong, T.: Spatiotemporal distribution of snow in eastern Tibet and the response to climate change, Remote Sens. Environ., 121, 1–9, https://doi.org/10.1016/j.rse.2012.01.006, 2012.
Gao, B., Yang, D., Qin, Y., Wang, Y., Li, H., Zhang, Y., and Zhang, T.: Change in frozen soils and its effect on regional hydrology, upper Heihe basin, northeastern Qinghai–Tibetan Plateau, The Cryosphere, 12, 657–673, https://doi.org/10.5194/tc-12-657-2018, 2018.
Göckede, M., Kwon, M. J., Kittler, F., Heimann, M., Zimov, N., and Zimov, S.: Negative feedback processes following drainage slow down permafrost degradation, Glob. Change Biol., 25, 3254–3266, https://doi.org/10.1111/gcb.14744, 2019.
Larson, K. M.: GPS interferometric reflectometry: applications to surface soil moisture, snow depth, and vegetation water content in the western United States, Wires Rev. Water, 3, 775–787, https://doi.org/10.1002/wat2.1167, 2016.
Larson, K. M.: Unanticipated Uses of the Global Positioning System, Annu. Rev. Earth Pl. Sc., 47, 19–40, https://doi.org/10.1146/annurev-earth-053018-060203, 2019.
Larson, K. M. and Small, E. E.: Estimation of Snow Depth Using L1 GPS Signal-to-Noise Ratio Data, IEEE J. Sel. Top. Appl., 9, 4802–4808, https://doi.org/10.1109/JSTARS.2015.2508673, 2016.
Larson, K. M., Small, E. E., Gutmann, E. D., Bilich, A. L., Braun, J. J., and Zavorotny, V. U.: Use of GPS receivers as a soil moisture network for water cycle studies, Geophys. Res. Lett., 35, L24405, https://doi.org/10.1029/2008GL036013, 2008.
Larson, K. M., Gutmann, E. D., Zavorotny, V. U., Braun, J. J., Williams, M. W., and Nievinski, F. G.: Can we measure snow depth with GPS receivers?, Geophys. Res. Lett., 36, L17502, https://doi.org/10.1029/2009GL039430, 2009.
Larson, K. M., Braun, J. J., Small, E. E., Zavorotny, V. U., Gutmann, E. D., and Bilich, A. L.: GPS Multipath and Its Relation to Near-Surface Soil Moisture Content, IEEE J. Sel. Top. Appl., 3, 91–99, https://doi.org/10.1109/JSTARS.2009.2033612, 2010.
Liu, L. and Larson, K. M.: Decadal changes of surface elevation over permafrost area estimated using reflected GPS signals, The Cryosphere, 12, 477–489, https://doi.org/10.5194/tc-12-477-2018, 2018.
Liu, L., Zhang, T., and Wahr, J.: InSAR measurements of surface deformation over permafrost on the North Slope of Alaska, J. Geophys. Res., 115, F03023, https://doi.org/ :10.1029/2009JF001547, 2010.
Liu, L., Schaefer, K., Zhang, T., and Wahr, J.: Estimating 1992–2000 average active layer thickness on the Alaskan North Slope from remotely sensed surface subsidence, J. Geophys. Res.-Earth, 117, F01005, https://doi.org/10.1029/2011JF002041, 2012.
McCreight, J. L., Small, E. E., and Larson, K. M.: Snow depth, density, and SWE estimates derived from GPS reflection data: Validation in the western U. S., Water Resour. Res., 50, 6892–6909, https://doi.org/10.1002/2014WR015561, 2014.
Nievinski, F. G.: Forward and inverse modeling of GPS multipath for snow monitoring, PhD thesis, University of Colorado, Boulder, CO, USA, 2013.
Nievinski, F. G. and Larson, K. M.: Forward modeling of GPS multipath for near-surface reflectometry and positioning applications, GPS Solut., 18, 309–322, https://doi.org/10.1007/s10291-013-0331-y, 2014.
Qi, J., Wang, L., Zhou, J., Song, L., Li, X., and Zeng, T.: Coupled Snow and Frozen Ground Physics Improves Cold Region Hydrological Simulations: An Evaluation at the upper Yangtze River Basin (Tibetan Plateau), J. Geophys. Res.-Atmos., 124, 12985–13004, https://doi.org/10.1029/2019JD031622, 2019.
Ran, Y., Li, X., and Cheng, G.: Climate warming over the past half century has led to thermal degradation of permafrost on the Qinghai–Tibet Plateau, The Cryosphere, 12, 595–608, https://doi.org/10.5194/tc-12-595-2018, 2018.
Reinosch, E., Buckel, J., Dong, J., Gerke, M., Baade, J., and Riedel, B.: InSAR time series analysis of seasonal surface displacement dynamics on the Tibetan Plateau, The Cryosphere, 14, 1633–1650, https://doi.org/10.5194/tc-14-1633-2020, 2020.
Schwarz, G. E. and Alexander, R. B.: State Soil Geographic (STATSGO) Data Base for the Conterminous United States, Edition 1.1., https://doi.org/10.3133/ofr95449, 1995.
Seneviratne, S. I., Corti, T., Davin, E. L., Hirschi, M., Jaeger, E. B., Lehner, I., Orlowsky, B., and Teuling, A. J.: Investigating soil moisture-climate interactions in a changing climate: A review, Earth-Sci. Rev., 99, 125–161, https://doi.org/10.1016/j.earscirev.2010.02.004, 2010.
Shiklomanov, N. I., Streletskiy, D. A., Nelson, F. E., Hollister, R. D., Romanovsky, V. E., Tweedie, C. E., Bockheim, J. G., and Brown, J.: Decadal variations of active-layer thickness in moisture-controlled landscapes, Barrow, Alaska, J. Geophys. Res., 115, G00I04, https://doi.org/10.1029/2009JG001248, 2010.
Small, E. E., Larson, K. M., Chew, C. C., Dong, J., and Ochsner, T. E.: Validation of GPS-IR Soil Moisture Retrievals: Comparison of Different Algorithms to Remove Vegetation Effects, IEEE J. Sel. Top. Appl., 9, 4759–4770, https://doi.org/10.1109/JSTARS.2015.2504527, 2016.
Walker, A. E. and Silis, A.: Snow-cover variations over the Mackenzie River basin, Canada, derived from SSM/I passive-microwave satellite data, Ann. Glaciol., 34, 8–14, https://doi.org/10.3189/172756402781817680, 2002.
Wang, C., Zhang, Z., Zhang, H., Zhang, B., Tang, Y., and Wu, Q.: Active Layer Thickness Retrieval of Qinghai–Tibet Permafrost Using the TerraSAR-X InSAR Technique, IEEE J. Sel. Top. Appl., 11, 4403–4413, https://doi.org/10.1109/JSTARS.2018.2873219, 2018.
Wu, Q., Liu, Y., Zhang, J., and Tong, C.: A review of recent frozen soil engineering in permafrost regions along Qinghai-Tibet Highway, China, Permafrost Periglac., 13, 199–205, https://doi.org/10.1002/ppp.420, 2002.
Xu, W., Ma, L., Ma, M., Zhang, H., and Yuan, W.: Spatial–Temporal Variability of Snow Cover and Depth in the Qinghai–Tibetan Plateau, J. Climate, 30, 1521–1533, https://doi.org/10.1175/JCLI-D-15-0732.1, 2017.
Yang, M., Nelson, F. E., Shiklomanov, N. I., Guo, D., and Wan, G.: Permafrost degradation and its environmental effects on the Tibetan Plateau: A review of recent research, Earth-Sci. Rev., 103, 31–44, https://doi.org/10.1016/j.earscirev.2010.07.002, 2010.
Zavorotny, V. U., Larson, K. M., Braun, J. J., Small, E. E., Gutmann, E. D., and Bilich, A. L.: A Physical Model for GPS Multipath Caused by Land Reflections: Toward Bare Soil Moisture Retrievals, IEEE J. Sel. Top. Appl., 3, 100–110, https://doi.org/10.1109/JSTARS.2009.2033608, 2010.
Zhang, J., Liu, L., and Hu, Y.: Global Positioning System interferometric reflectometry (GPS-IR) measurements of ground surface elevation changes in permafrost areas in northern Canada, The Cryosphere, 14, 1875–1888, https://doi.org/10.5194/tc-14-1875-2020, 2020.
Zhang, J., Liu, L., Su, L., and Che, T.: GPS-IR measurements of ground surface elevation changes, surface soil moisture, and snow depth at a permafrost site in northeastern Qinghai-Tibet Plateau, Zenodo [data set], https://doi.org/10.5281/zenodo.4895864, 2021.
Zhang, L., Zhao, L., Li, R., Gao, L., Xiao, Y., Qiao, Y., and Shi, J.: Investigating the influence of soil moisture on albedo and soil thermodynamic parameters during the warm season in Tanggula Range, J. Glaciol. Geocryol., 38, 351–358, https://doi.org/10.7522/j.issn.1000-0240.2016.0038, 2016.
Zhang, T.: Influence of the seasonal snow cover on the ground thermal regime: An overview, Rev. Geophys., 43, RG4002, https://doi.org/10.1029/2004RG000157, 2005.
Zhao, L., Wu, Q., Marchenko, S. S., and Sharkhuu, N.: Thermal state of permafrost and active layer in Central Asia during the international polar year, Permafrost Periglac., 21, 198–207, https://doi.org/10.1002/ppp.688, 2010.
Zhao, L., Zou, D., Hu, G., Du, E., Pang, Q., Xiao, Y., Li, R., Sheng, Y., Wu, X., Sun, Z., Wang, L., Wang, C., Ma, L., Zhou, H., and Liu, S.: Changing climate and the permafrost environment on the Qinghai–Tibet (Xizang) plateau, Permafrost Periglac., 31, 396–405, https://doi.org/10.1002/ppp.2056, 2020.
Zou, D., Zhao, L., Sheng, Y., Chen, J., Hu, G., Wu, T., Wu, J., Xie, C., Wu, X., Pang, Q., Wang, W., Du, E., Li, W., Liu, G., Li, J., Qin, Y., Qiao, Y., Wang, Z., Shi, J., and Cheng, G.: A new map of permafrost distribution on the Tibetan Plateau, The Cryosphere, 11, 2527–2542, https://doi.org/10.5194/tc-11-2527-2017, 2017.