the Creative Commons Attribution 4.0 License.
the Creative Commons Attribution 4.0 License.
 | 02 May 2021
Soil infiltration characteristics and pore distribution under freezing–thawing conditions
Ruiqi Jiang
Tianxiao Li
Dong Liu
Qiang Fu
Renjie Hou
Qinglin Li
Song Cui
Mo Li
Frozen soil infiltration widely occurs in hydrological processes such as seasonal soil freezing and thawing, snowmelt infiltration, and runoff. Accurate measurement and simulation of parameters related to frozen soil infiltration processes are highly important for agricultural water management, environmental issues, and engineering problems in cold regions. Temperature changes cause soil pore size distribution variations and consequently dynamic infiltration capacity changes during different freeze–thaw periods. To better understand these complex processes and to reveal the freeze–thaw action effects on soil pore distribution and infiltration capacity, black soils, meadow soils, and chernozem were selected as test subjects. These soil types account for the largest arable land area in Heilongjiang Province, China. Laboratory tests of soils at different temperatures were conducted using a tension infiltrometer and ethylene glycol aqueous solution. The stable infiltration rate and hydraulic conductivity were measured, and the soil pore distribution was calculated. The results indicated that for the different soil types, macropores, which constituted approximately 0.1 % to 0.2 % of the soil volume under unfrozen conditions, contributed approximately 50 % of the saturated flow, and after soil freezing, the soil macropore proportion decreased to 0.05 % to 0.1 %, while the saturated flow proportion decreased to approximately 30 %. Soil moisture froze into ice crystals inside relatively large pores, resulting in numerous smaller-sized pores, which reduced the number of macropores but increased the number of smaller-sized mesopores, so that the frozen soil infiltration capacity was no longer solely dependent on the macropores. After the ice crystals had melted, more pores were formed within the soil, enhancing the soil permeability.
- Article
(2733 KB) - Full-text XML
- BibTeX
- EndNote


Over the last few decades, the temperature changes caused by global warming have altered the freezing state of near-surface soils, and in China, changes in characteristic values such as the extent of the mean annual area of the seasonal soil freeze–thaw state and maximum freezing depth indicate the degradation of frozen soil, especially at high latitudes (Wang et al., 2019; Peng et al., 2016). Under the effect of temperature, most frozen regions experience seasonal freezing and thawing of soil, accompanied by coupled soil water and heat movement as well as frost heave processes, thus making the soil structure and function more variable (Oztas and Fayetorbay, 2003; Fu et al., 2019; Gao et al., 2018). Parameters such as the soil infiltration rate and hydraulic conductivity are key factors in the study of soil water movement, groundwater recharge, and solute and contaminant transport simulation (Angulo-Jaramillo et al., 2000). In regard to unfrozen soils, temperature has been shown to change the soil structure and kinematic viscosity of soil water, thereby affecting the unsaturated hydraulic conductivity of soils (Gao and Shao, 2015). In terms of frozen soils, the water infiltration characteristics and pore size distribution are highly variable and difficult to observe (Watanabe et al., 2013); moreover, the water movement in freezing–thawing soils is complicated by the migration of water and heat and the associated water phase change (Jarvis et al., 2016; Hayashi, 2013). The accurate measurement of water movement parameters and soil pore distribution under freeze–thaw conditions is a necessary prerequisite for the quantitative description of the water movement in frozen soil, and the mechanism and degree of influence of the temperature on the infiltration rate, hydraulic conductivity, porosity, and other parameters in the different stages of freeze–thaw periods require further research.
Currently, quantitative studies of the infiltration process in freezing–thawing soils can be mainly divided into experimental and model studies. Field experiments have been performed less often because under natural conditions, infiltration water exhibits a preferential flow into the deep soil, and the alternating freeze–thaw effect forms ice crystals to block the flow path through large pores, subsequently limiting water infiltration (Stadler et al., 1997), while the melting effect of the infiltration water on ice makes it difficult to reach a steady infiltration state. Therefore, the current relevant achievements are mainly focused on the infiltration process of snowmelt water (Hayashi et al., 2003) and the influence of preferential flow (Mohammed et al., 2019). Controlled laboratory experiments provide new opportunities for the simulation of frozen soil infiltration processes and the measurement of infiltration parameters. Williams and Burt (1974) conducted early direct measurements in the laboratory, resolved the water freezing problem by adding lactose, and applied dialysis membranes on both sides of soil columns, and they determined the water conductivity of saturated specimens in the horizontal direction (Burt and Williams, 1976). Andersland et al. (1996) measured the hydraulic conductivity of frozen granular soils at different saturations using a conventional drop permeameter with decane as the permeant and concluded that the hydraulic conductivity was the same as that of unfrozen soils with water as the infiltration solution. McCauley et al. (2002) determined and compared the differences in hydraulic conductivity, permeability, and infiltration rate between frozen and unfrozen soils using diesel mixtures as permeants, and their results indicated that the ice content determines whether soil is sufficiently impermeable. Zhao et al. (2013) quantified the unsaturated hydraulic conductivity of frozen soil using antifreeze instead of water and adopted a multistage outflow method under controlled pressures in combination with the concept of the pore impedance coefficient (Jame and Norum, 1980). However, most of these studies did not consider the differences in kinematic viscosity and surface tension between soil water and other solutions, which often results in an overestimation of hydraulic conductivity, and homemade devices in the laboratory are often inconvenient for generalization in the field. Due to the dynamic changes in the temperature and moisture phase, direct measurement is difficult, and hydraulic conductivity empirical equations and models of frozen soil have been developed. First, the frozen soil hydraulic conductivity was simply considered to follow a power exponential relationship with the temperature (Nixon, 1991; Smith, 1985), while others considered the hydraulic conductivity of frozen soil to be equal to that of unfrozen soil at the same water content and assumed that the hydraulic conductivity of frozen soil was a function of the moisture content of unfrozen soil (Lundin, 1990; Flerchinger and Saxton, 1989; Harlan, 1973). On the basis of Campbell's model (Campbell, 1985), Tarnawski and Wagner (1996) proposed a frozen soil hydraulic conductivity model based on the soil particle size distribution and porosity. Watanabe and Wake (2008) viewed soil pores as cylindrical capillaries and suggested that ice formation occurs at the center of these capillaries and established a model to describe the movement of thin film water and capillary water in frozen soil based on the theory of capillaries and surface absorption (Watanabe and Flury, 2008). The similarity between freezing and soil moisture profiles has been demonstrated (Spaans and Baker, 1996; Spaans, 1994), and subsequently, soil freezing characteristic curves have been applied to estimate the unsaturated hydraulic conductivity of frozen soils (Azmatch et al., 2012), which has been combined with field tests and inversion models to achieve a high accuracy (Cheng et al., 2019).
Table 1Basic physical and chemical properties of three kinds of soils.
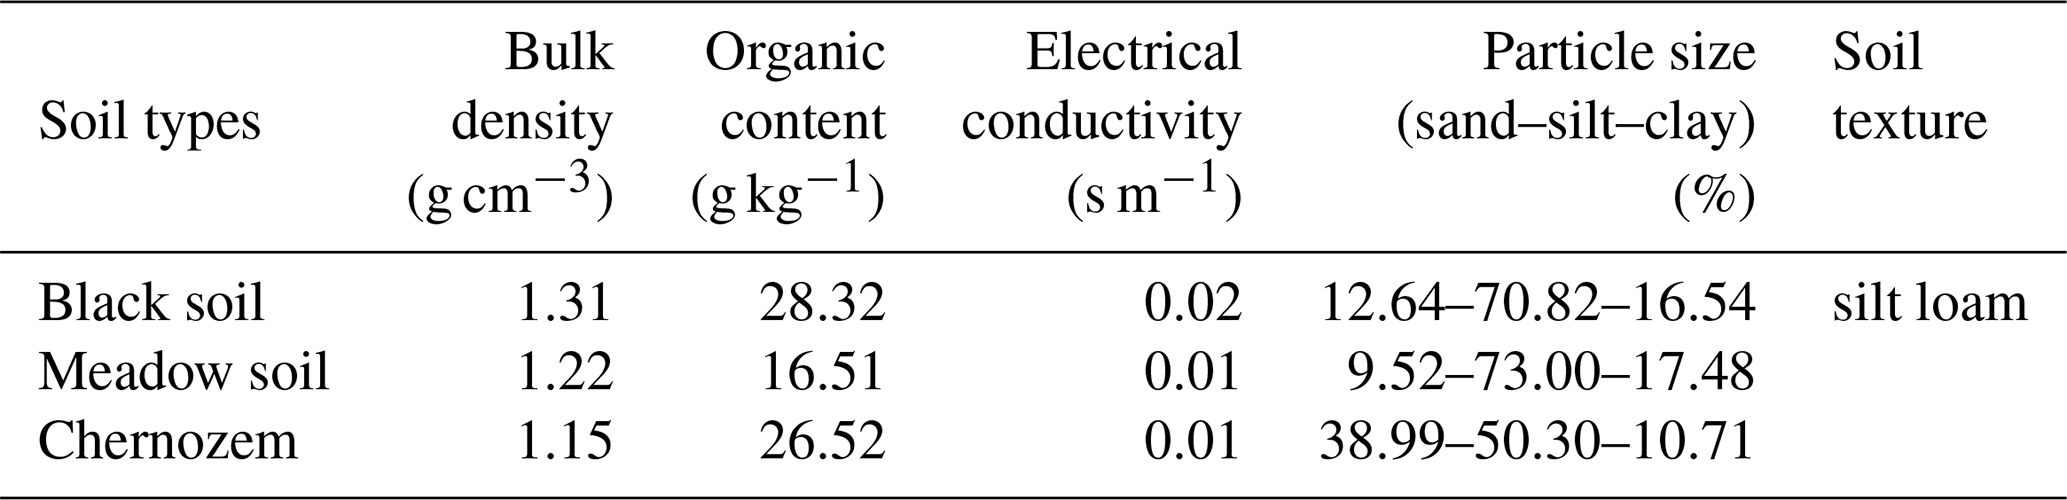
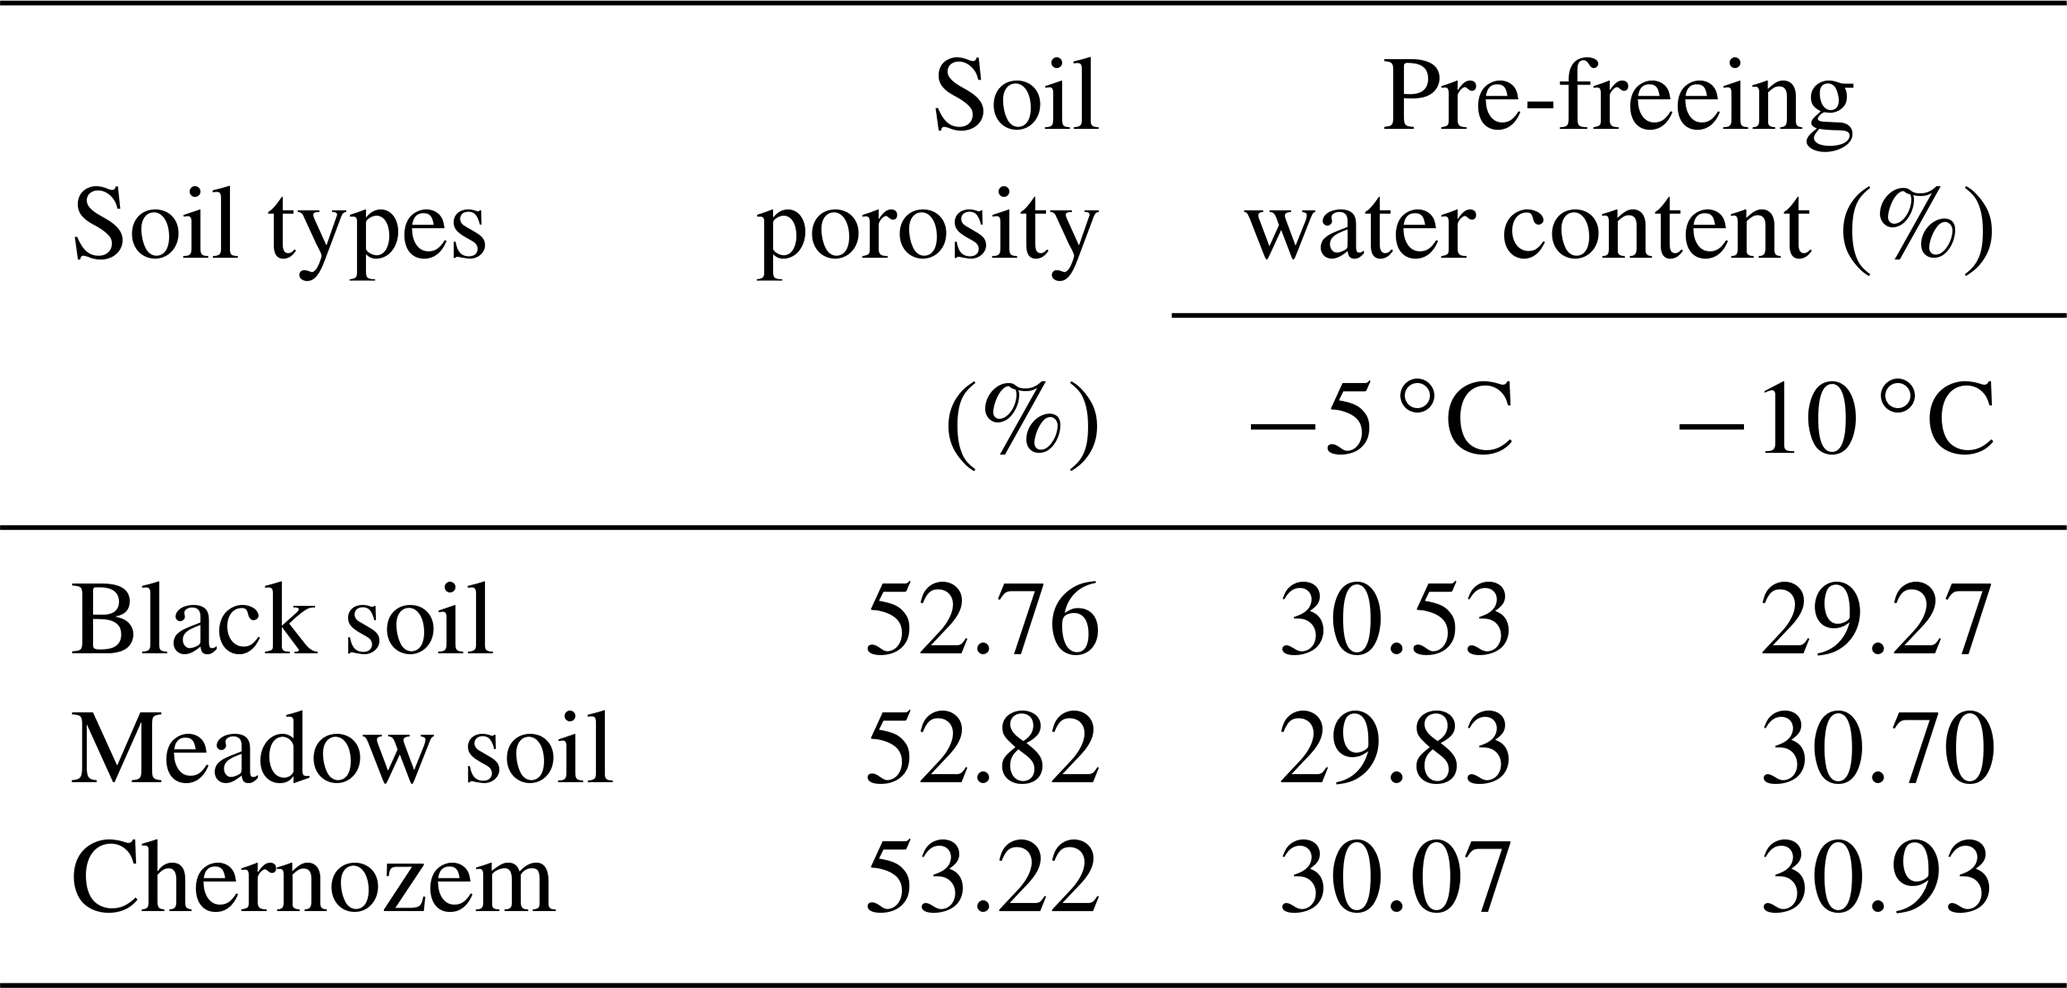
Table 2Soil porosity and pre-freezing soil water content of repacked samples.
Understanding the distribution characteristics of the soil pore system is essential for the evaluation of the water and heat movement processes in soil. Soil macroporosity has been shown to impose a major impact on water cycle processes such as infiltration, nutrient movement, and surface runoff (Demand et al., 2019; Jarvis, 2007). Macroporosity is widespread in a variety of soils and produces preferential flow in both frozen and unfrozen soils (Mohammed et al., 2018; Beven and Germann, 2013), and the pre-freeze moisture conditions affect the amount and state of ice in the macropores of frozen soils, resulting in notable variability in the infiltration capacity of thawed soils (Hayashi et al., 2003; Granger et al., 1984). Field experiments on frozen soil have also demonstrated that macropores accelerate the infiltration rate (Stähli et al., 2004; van der Kamp et al., 2003), the number and size of macropores affect the freezing and infiltration capacity of soil layers to different extents, and low temperatures cause infiltration water to refreeze inside macropores (Watanabe and Kugisaki, 2017; Stadler et al., 2000). Research on frozen soil macroporosity has largely focused on the qualitative analysis of its impact on the soil structure and infiltration capacity. With the development of experimental techniques, certain new methods and techniques, such as computed tomography (CT) and X-ray scanning, have been applied to measure the number and distribution of macropores (Taina et al., 2013; Bodhinayake et al., 2004; Grevers et al., 1989), but the lack of sampling techniques targeting frozen soil still restricts related research.
Many limitations and deficiencies remain in the direct measurement of frozen soil infiltration characteristics and pore distribution, and the relevant models also require a large amount of measured data to meet the accuracy and applicability requirements. In this paper, the stable infiltration rate and hydraulic conductivity of three types of soils at different temperatures were measured by precise control of the soil and ambient temperatures, and the macropore and mesopore size distribution was calculated by using a tension infiltrometer and a glycol aqueous solution as the infiltration medium. The conclusions provide a basis and reference for the numerical simulation of the coupled water–heat migration process of freezing–thawing soil and related parameterization studies.
2.1 Test plan
Referring to arable land area data of various regions of Heilongjiang Province, the three types of soils that dominate the cultivated land area in this province are black soils, meadow soils, and chernozem (Land Administrative Bureau of Heilongjiang Province, 1992). Harbin, Zhaoyuan, and Zhaozhou were selected as typical soil areas for sampling. A 5 cm surface layer of floating soil and leaves was removed, and topsoil samples were collected at depths ranging from 0 to 20 cm. After natural air drying and artificial crushing, the soil was sieved, and particles larger than 2 mm in diameter were removed. The remainder was used to prepare soil columns. The basic physical and chemical parameters of the test soils, such as the bulk density, organic content, and mechanical parameters, are listed in Table 1.
An artificial climate chamber was applied to control the temperature of the soil column and infiltration solution, and four temperature treatments were established with three replications for each treatment: 15 ∘C, unfrozen soil, representing the soil before freezing, which was recorded as 15 ∘C (BF); −5 ∘C, stable freezing; −10 ∘C, stable freezing; and freezing at −10 ∘C followed by thawing at 15 ∘C, representing the soil after melting, which was recorded as 15 ∘C (AM). Each soil column was tested for only one treatment. The freezing and thawing times were both 48 h. When the soil temperature was consistent with the set temperature in the climate chamber, the samples were considered to be completely frozen, and the effect of the number of freezing and thawing cycles was not considered in this test. According to the basic information of the original soil, the volumetric moisture content of the sieved soil was set to 30 % ± 2 % using deionized water, with a dry bulk density of 1.2 g cm−3. To reduce the inhomogeneous distribution of soil moisture, a spray bottle was used to add water to the sieved and air-dried soil in small but repeated amounts, while the change in soil moisture was detected using sensors, so that the moisture content of the soil columns was controlled within the set range and the texture was uniform, as well as making the pre-freeze moisture content relatively consistent between different soil columns. The soil porosity and pre-freezing soil water content of the repacked samples are shown in Table 2.
To ensure a homogeneous column, the soil was loaded into a polyvinyl chloride (PVC) cylinder at 5 cm depth intervals, and petroleum jelly was applied to the sides to reduce the sidewall flow (Lewis and Sjöstrom, 2010). The PVC cylinder was 26 cm in diameter and 30 cm in height, with a perforated plate at the bottom. To prevent lateral seepage, the barrel occurred 5 cm above the soil surface, and the thickness of the soil layer was 20 cm. A HYDRA-PROBE II sensor (STEVENS Water Monitoring Systems, Inc., Portland, Oregon, USA) was inserted in the middle of the barrel to observe the potential soil temperature and liquid water content change to determine whether ice melting occurred, and the ice content of frozen soil was measured by the drying method. A 5 cm thick layer of sand and gravel was placed below the soil column, and a 5 cm thick layer of black polypropylene insulation cotton was wrapped around the outer layer and the bottom of the soil column. The stable infiltration rate under tension levels of −3, −5, −7, −9, −11, and −13 cm was measured with a tension infiltrometer, and the infiltration time and cumulative infiltration were recorded. The detailed layout of the test apparatus is shown in Fig. 1.
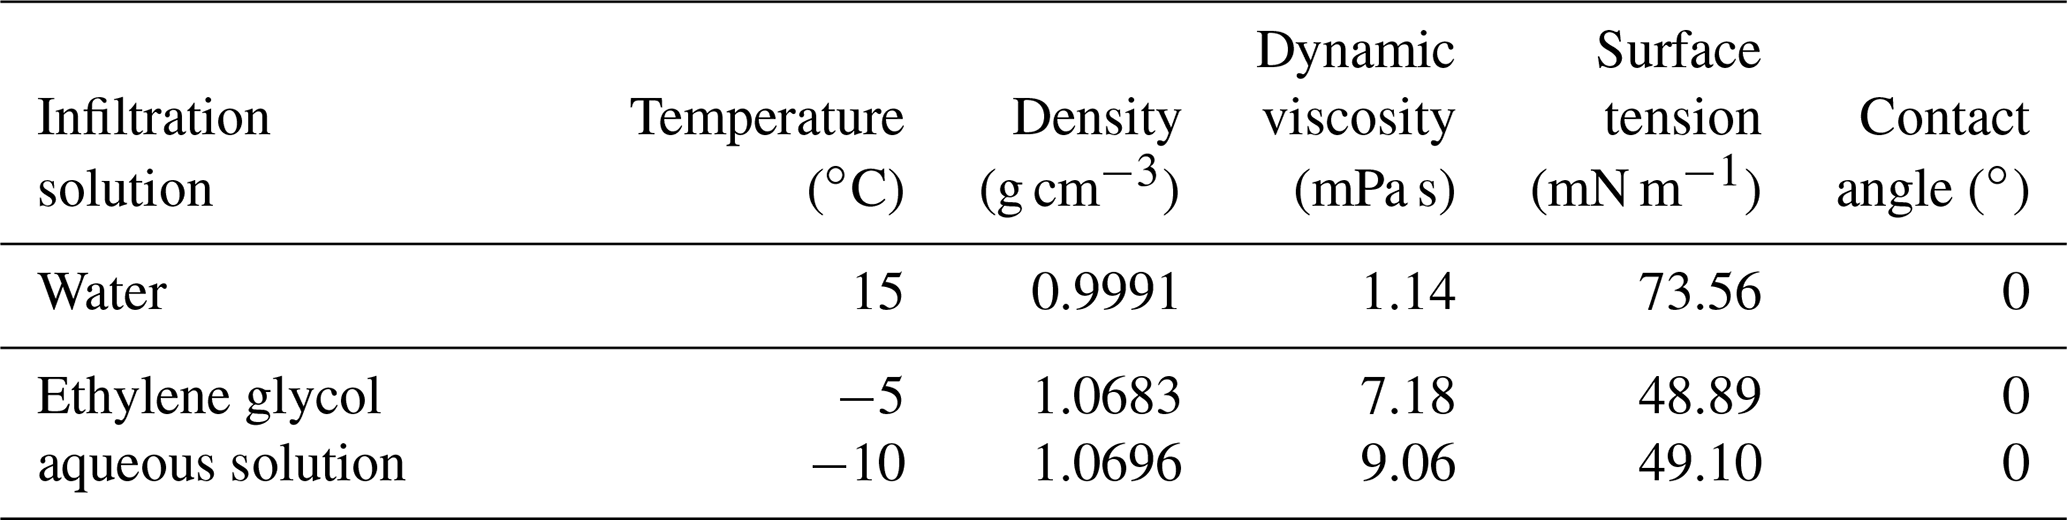
The addition of a certain amount of lactose, antifreeze, or other substances to water greatly reduces the freezing point of water (Zhao et al., 2013; Williams and Burt, 1974) so that the soil macropores are not quickly filled with ice with decreasing temperature, thereby maintaining better conditions for water flow. To further verify the feasibility of the use of deionized water to prepare an aqueous solution of ethylene glycol at a mass concentration of 40 % as the infiltration medium for the frozen soil measurements, the surface tension of the aqueous glycol solution at −5 and −10 ∘C and its relationship with the temperature were measured with a contact angle measuring instrument (OCA20, DataPhysics Instruments, Germany) and a surface tension measuring instrument (DCAT-21, DataPhysics Instruments, Germany), respectively. As an example, the contact angle measurement process of the black soil at −10 ∘C with the aqueous ethylene glycol solution is shown in Fig. 2. It is observed that the contact angle decreases to 0 ∘C within a few seconds after the liquid droplet is placed on the soil, and the liquid droplet completely dissolves in the frozen soil, which implies that the addition of glycol to water does not alter the wetting ability of the soil particles (Lu and Likos, 2004). For the unfrozen soils of the 15 ∘C (BF) and 15 ∘C (AM) treatments, deionized water was used as the infiltration solution. For the frozen soils of the −5 and −10 ∘C treatments, aqueous ethylene glycol solution was used as the infiltration solution. The relevant physicochemical properties of the aqueous ethylene glycol solution and water are compared in Table 3.
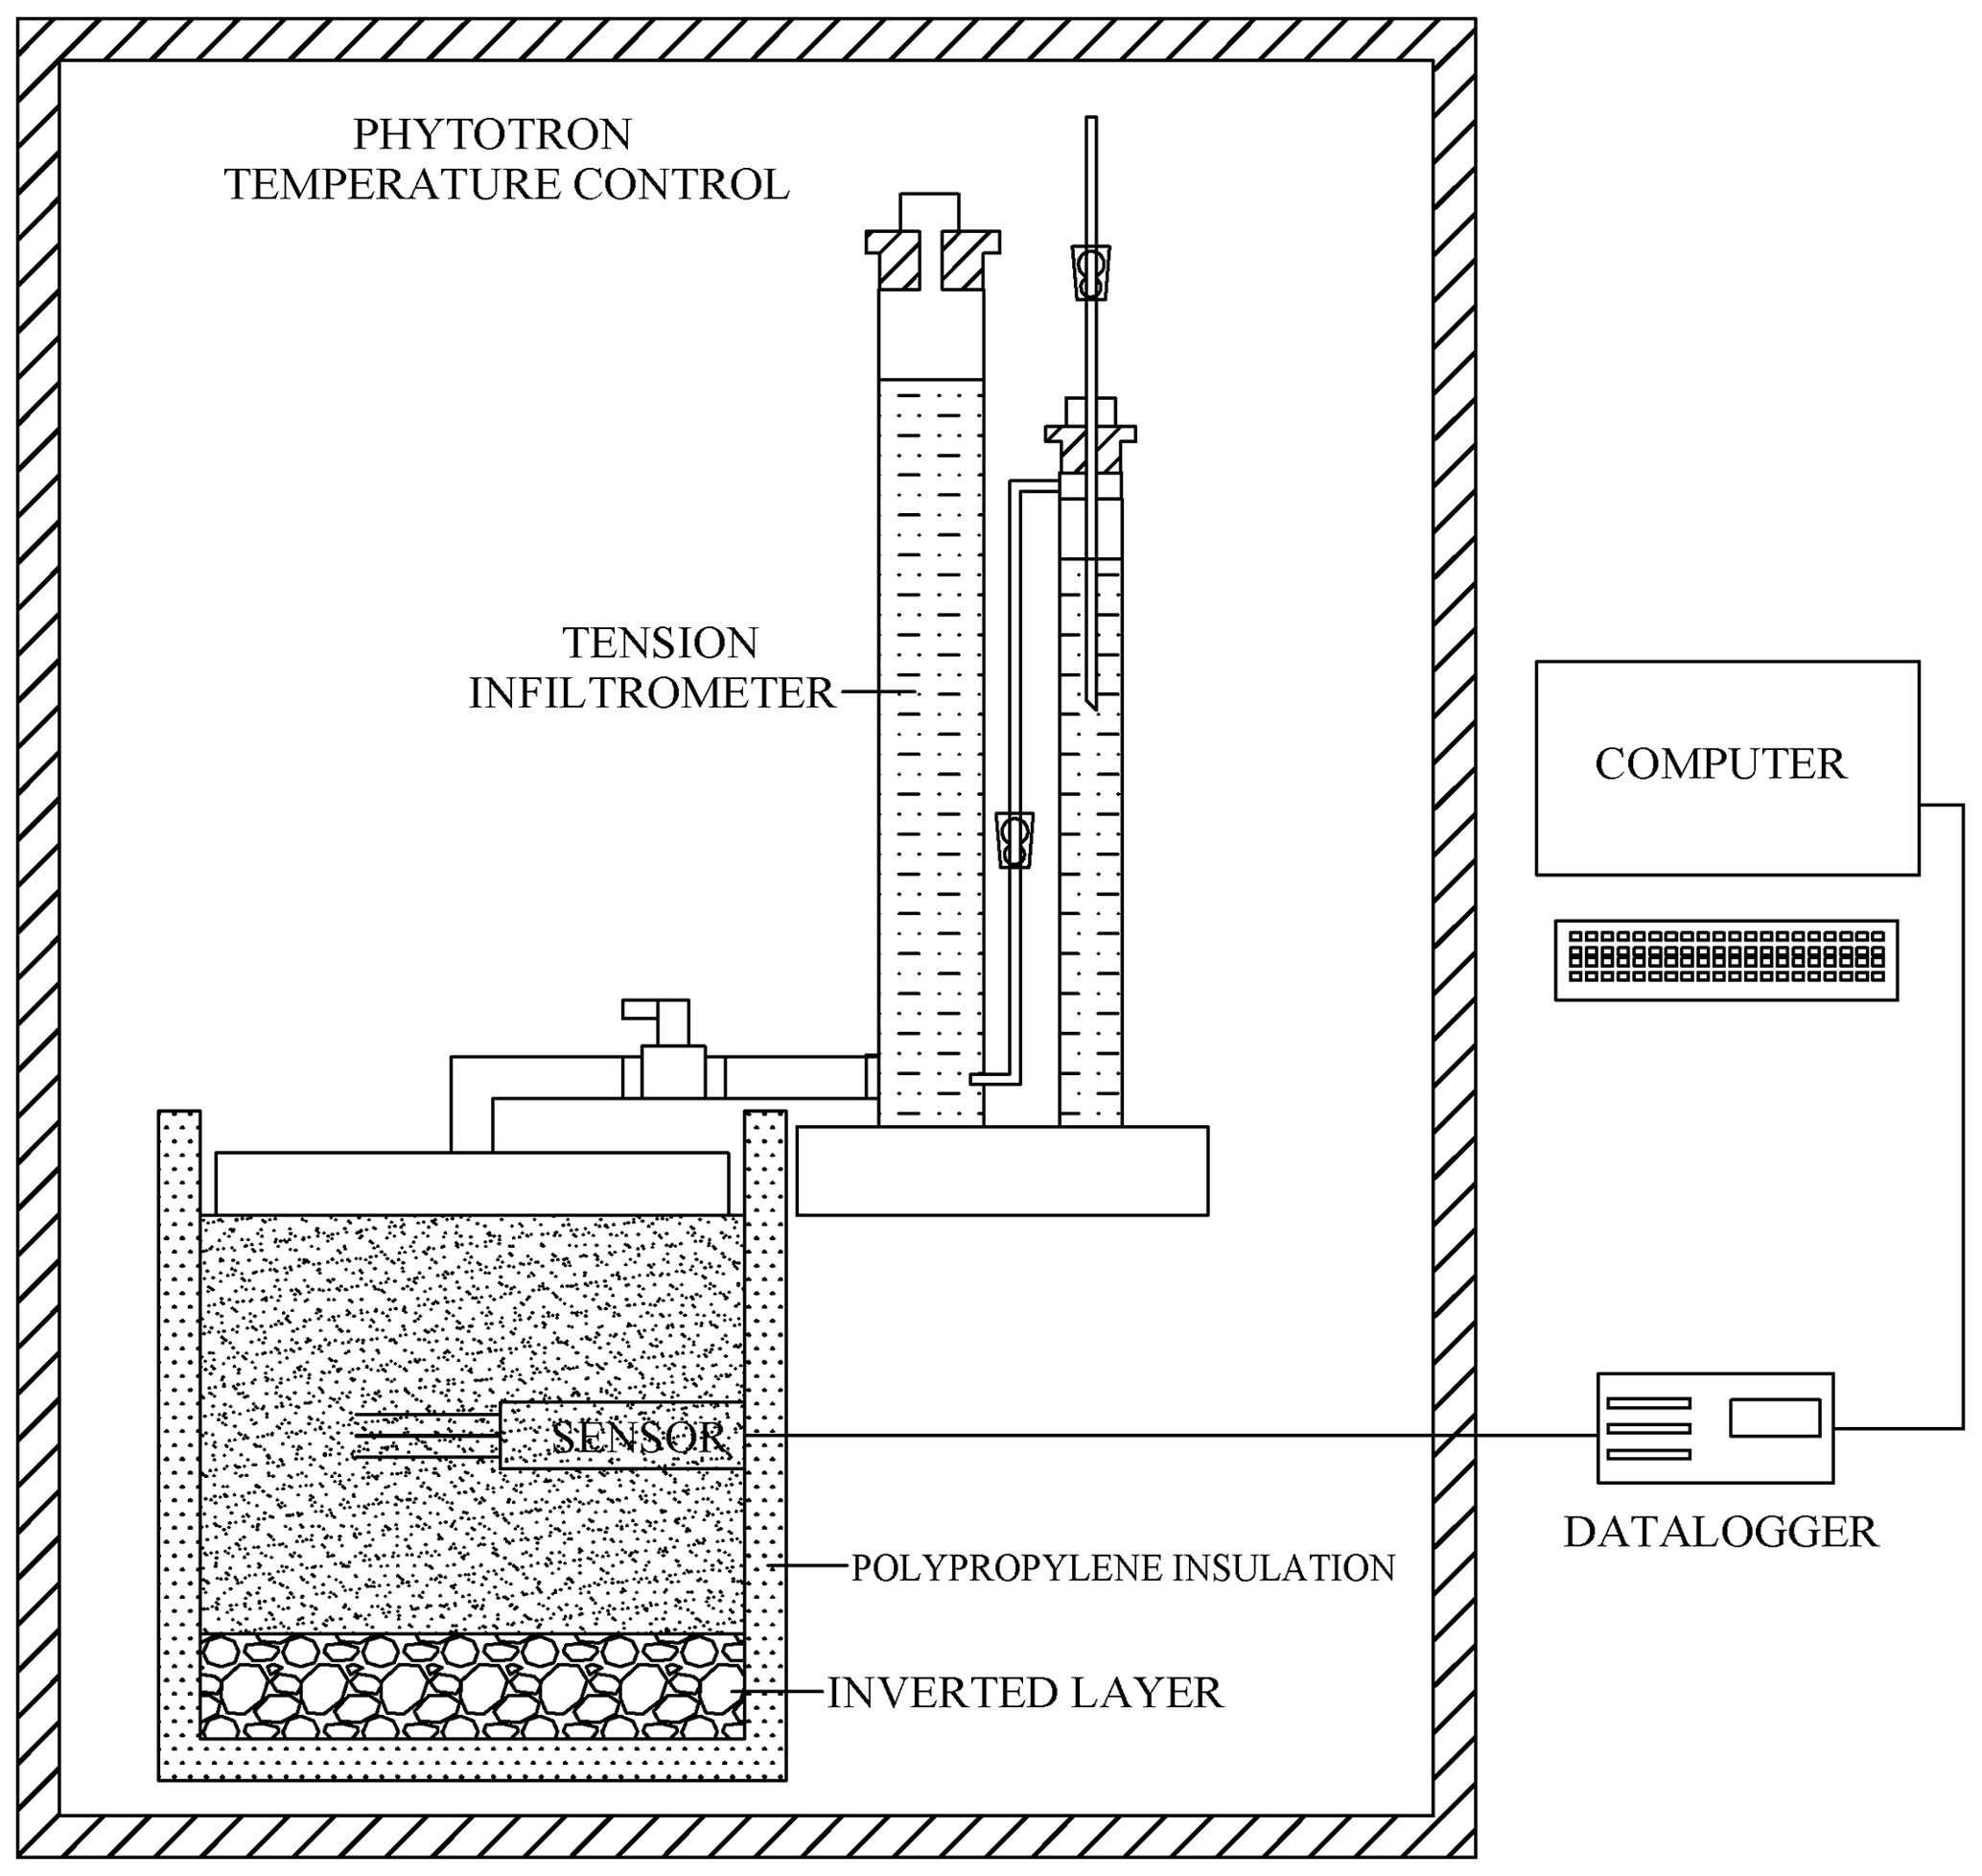
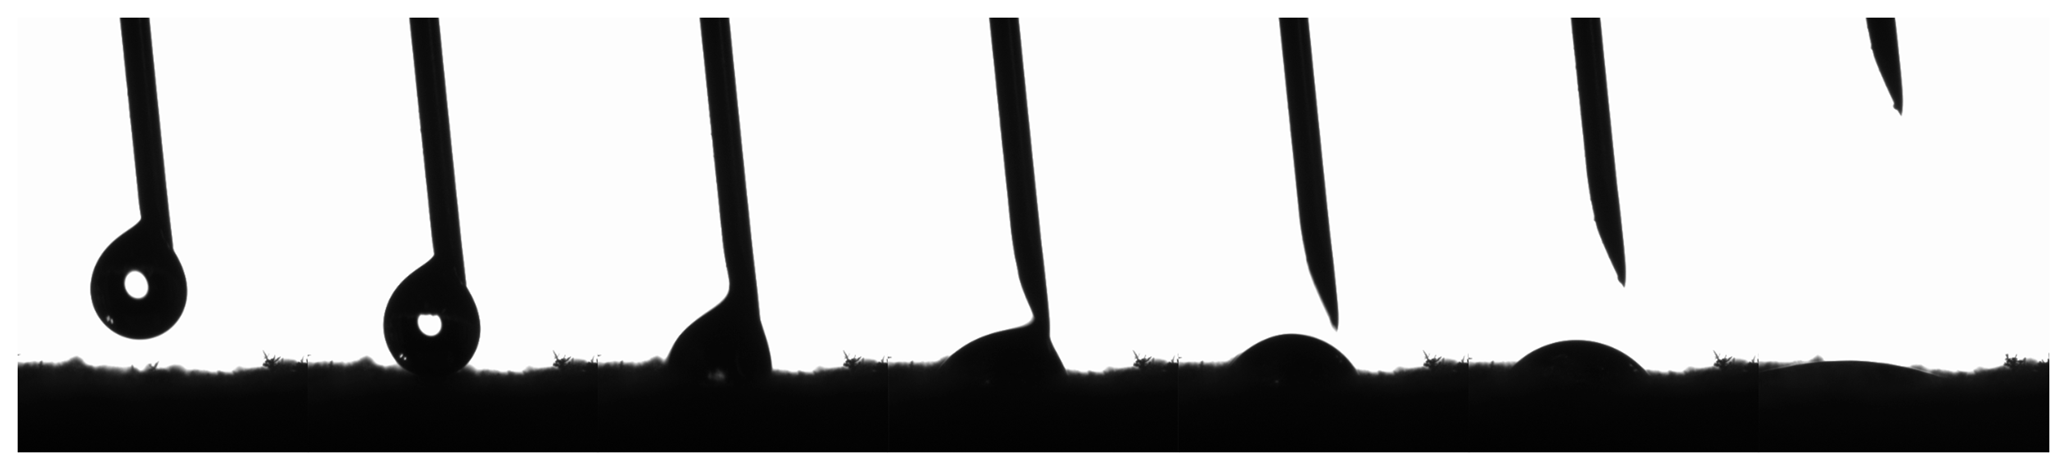
Figure 2Process of the contact angle measurement between the aqueous ethylene glycol solution and black soil at −10 ∘C.
Table 3Comparison of the physicochemical properties of the 40 % ethylene glycol aqueous solution and water.
2.2 Measurement of the frozen soil hydraulic conductivity
Gardner (1958) proposed that the unsaturated hydraulic conductivity of soil varies with the matric potential as follows:
where Ksat is the saturated hydraulic conductivity, cm h−1, and h is the matric potential or tension, cm H2O. Wooding (1968) considered that the steady-state unconfined infiltration rate into soil from a circular water source of radius R can be calculated with the following equation:
where Q is the amount of water entering the soil per unit time, cm3 h−1; K is the hydraulic conductivity, cm h−1; and α is a constant. Ankeny et al. (1991) proposed that implementing two successively applied pressure heads h1 and h2 could yield the unsaturated hydraulic conductivity, and upon replacing K in Eq. (2) with Eq. (1), the following is obtained:
Dividing Eq. (4) by Eq. (3) and solving for α yields
where Q(h1) and Q(h2) can be measured, h1 and h2 are the preset tension values, and α can be calculated with Eq. (5). The result can be substituted into Eq. (3) or (4) to calculate Ksat. When the number of tension levels is higher than 2, parameter fitting methods can be applied to improve the accuracy of α and Ksat (Hussen and Warrick, 1993).
The tension is controlled by the bubble collecting tube of the tension infiltrometer, and different pressure heads h correspond to different pore sizes r. By applying different pressure heads h to the soil surface, water will overcome the surface tension in the corresponding pores and will be discharged, and the infiltration volume is recorded after reaching the stable infiltration state.
Under the assumption that the frozen soil pore ice pressure is equal to the atmospheric pressure and that solutes are negligible, the Clausius–Clapeyron equation can be adopted to achieve the interconversion between the soil temperature and suction (Konrad and Morgenstern, 1980; Watanabe et al., 2013), which can be simplified as follows:
where ψ is the soil suction, kPa; L is the latent heat of fusion of water, 3.34×10⁵ J kg−1; ρw is the density of water, 1 g cm−3; and T is the subfreezing temperature, ∘C. After the unit conversion of the soil suction into h (cm H2O), the unsaturated hydraulic conductivity of frozen soil at different negative temperatures can be obtained via substitution into Eq. (2).
2.3 Measurement of the pore size distribution in frozen soil
As a nonuniform medium, soil consists of pores with various pore sizes, and the equation for the soil pore radius r can be obtained from the capillary model (Watson and Luxmoore, 1986):
where σ is the surface tension of the solution, g s−2; β is the contact angle between the solution and pore wall; ρ is the density of the solution, g cm−3; g is the acceleration of gravity, m s−2; and h is the corresponding tension of the tension infiltrometer, cm H2O.
The effective macroporosity θm can be calculated for various soil particle sizes based on the Poiseuille equation (Wilson and Luxmoore, 1988):
where μ is the dynamic viscosity of the fluid, g (cm s)−1; Km is the macropore hydraulic conductivity and is defined as the difference between K(h) at various tension gradients, cm h−1; and r is the corresponding equivalent pore size. The effective porosity is equal to the number of pores per unit area multiplied by the area of the corresponding pore size. For different pore sizes, the maximum number of effective macropores per unit area N can be calculated with the following equation:
where N is the number of effective macropores per unit area, and Eq. (7) calculates the minimum value of the pore radius, while the result obtained with Eq. (9) is actually the maximum number of effective macropores per unit area and the maximum porosity.
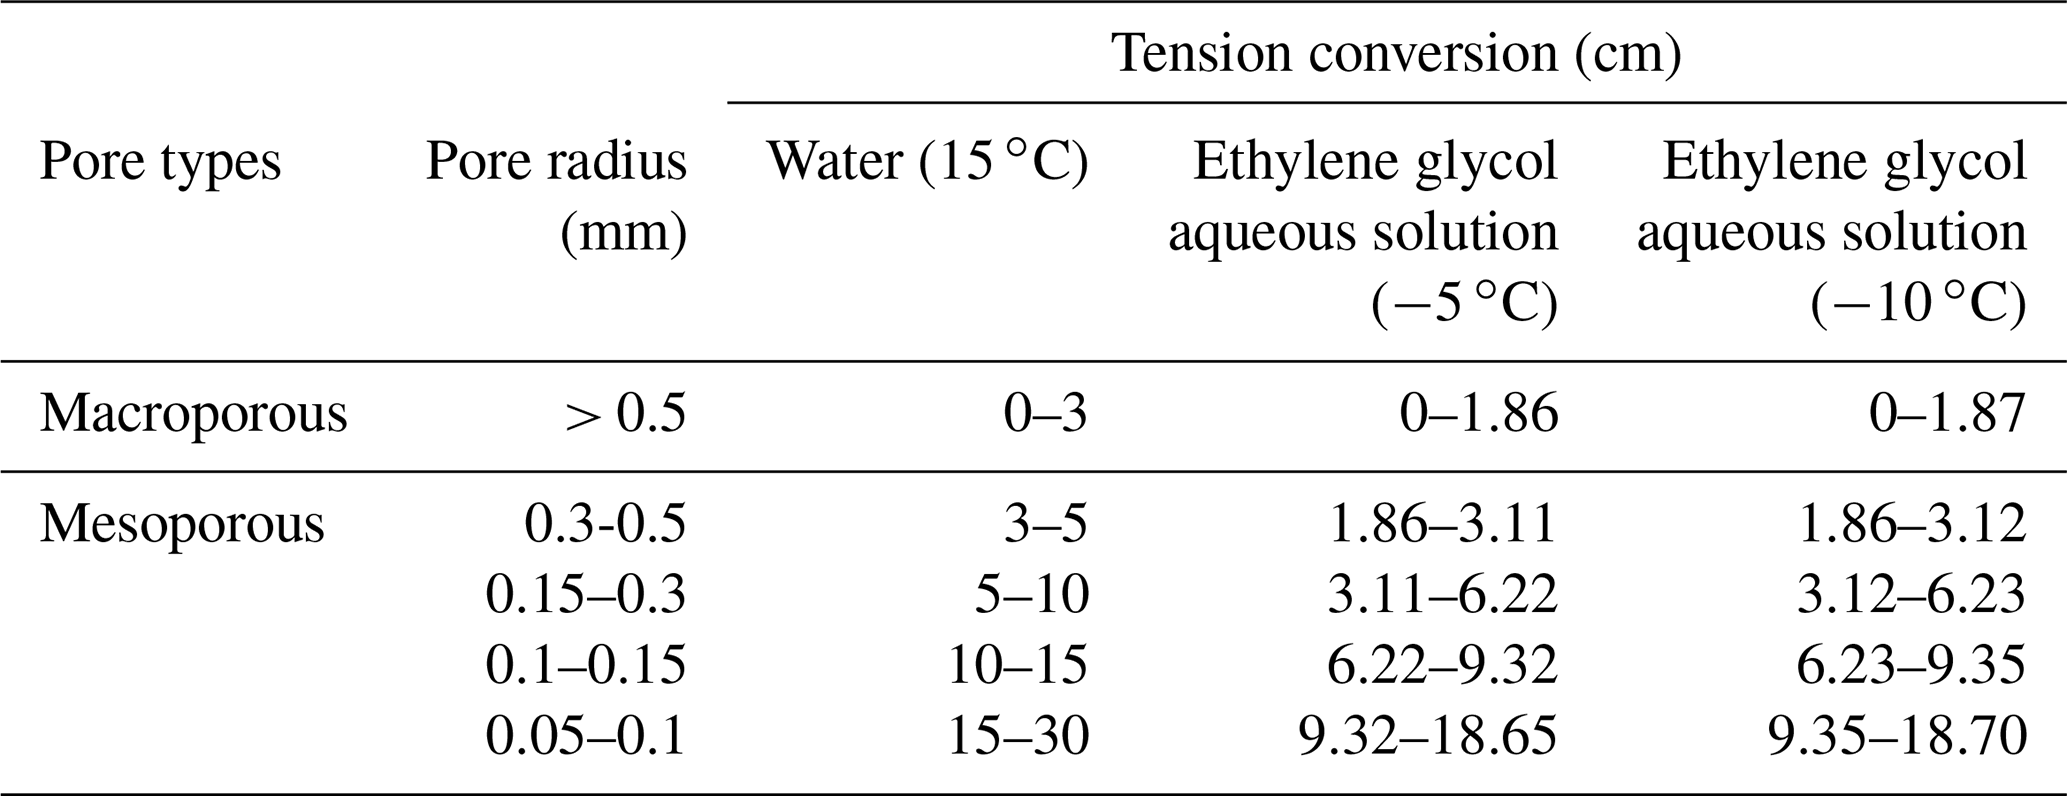
Considering the differences in surface tension and density between the aqueous ethylene glycol solution and water, when calculating the frozen soil pore size distribution, it is necessary to convert the tension into the equivalent pore radius according to Eq. (7), which is classified and subdivided into large and medium pores according to the common classification method (Luxmoore, 1981), the details of which are listed in Table 4, while the corresponding tension values in Table 4 are substituted into the fitting curve equation to calculate the corresponding stable infiltration rate q and unsaturated hydraulic conductivity K.
3.1 Infiltration characteristics of freezing–thawing soils
Curves of the recorded cumulative infiltration and infiltration rate were plotted over time, as shown in Figs. 3 and 4, respectively. The unfrozen water contents and ice contents of the frozen samples are shown in Table 5. The constant α and saturated hydraulic conductivity Ksat were calculated under different tensions h and corresponding steady-state infiltration rates q, and the unsaturated hydraulic conductivity under different tensions was calculated with Eq. (1). The stable infiltration rate and unsaturated hydraulic conductivity at different temperatures are shown in Fig. 5, and the details of α and Ksat are listed in Table 6.
Table 5Unfrozen water contents and ice contents of the frozen samples.
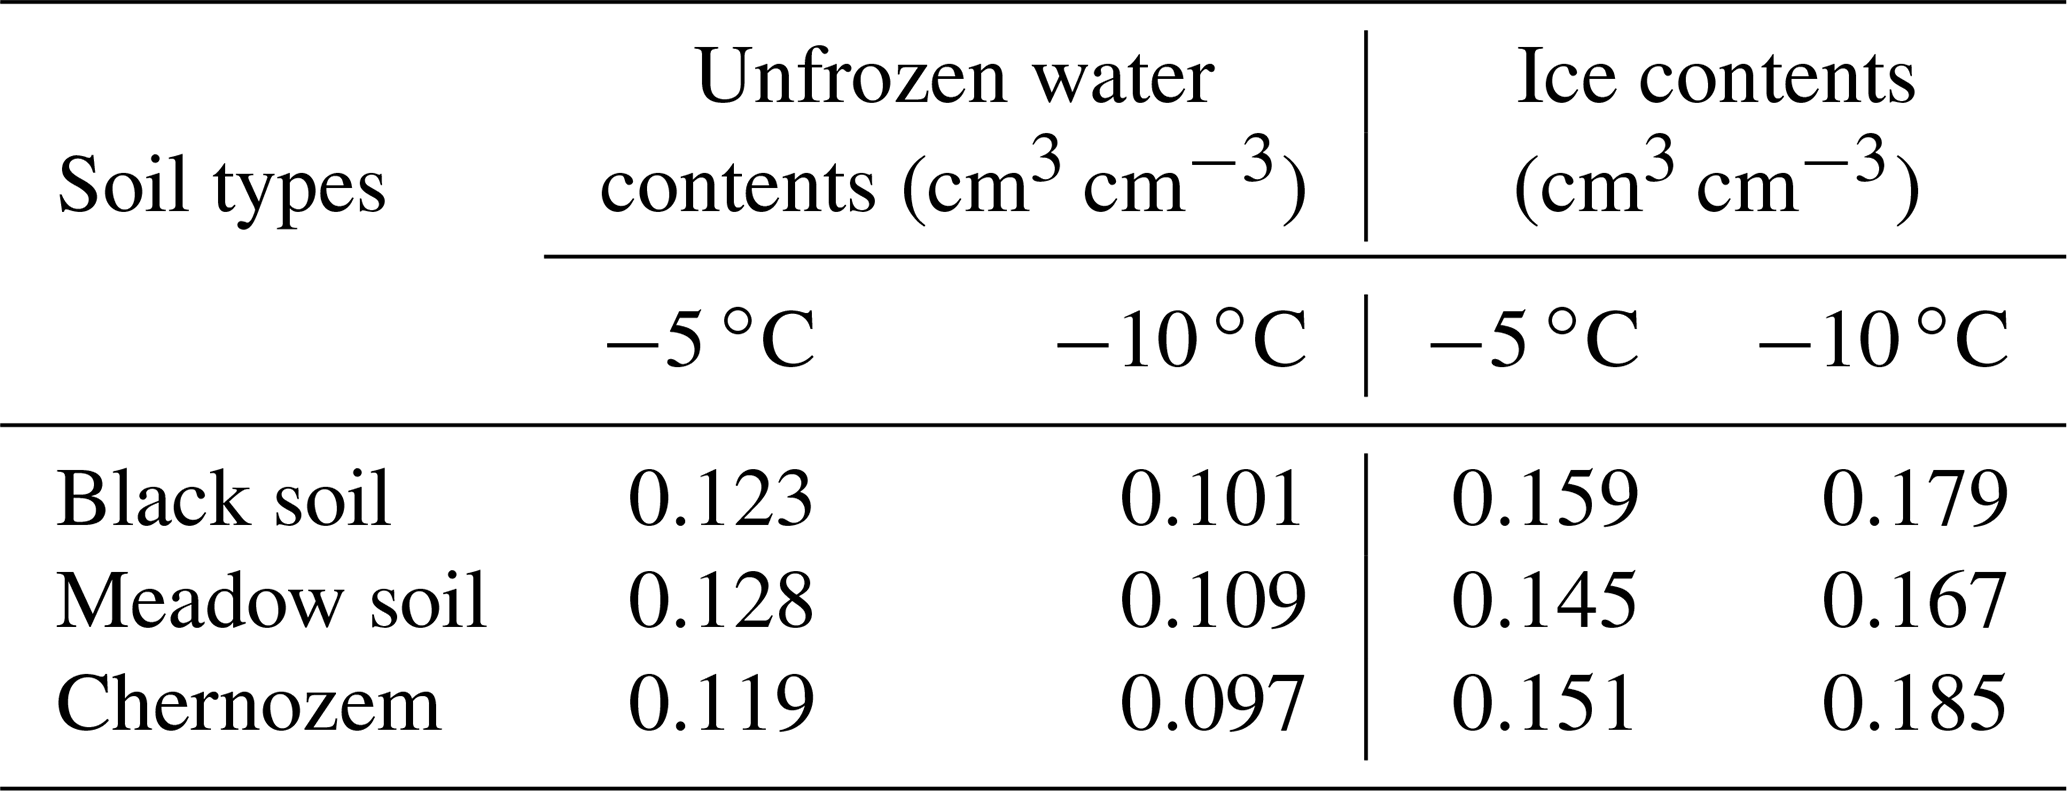
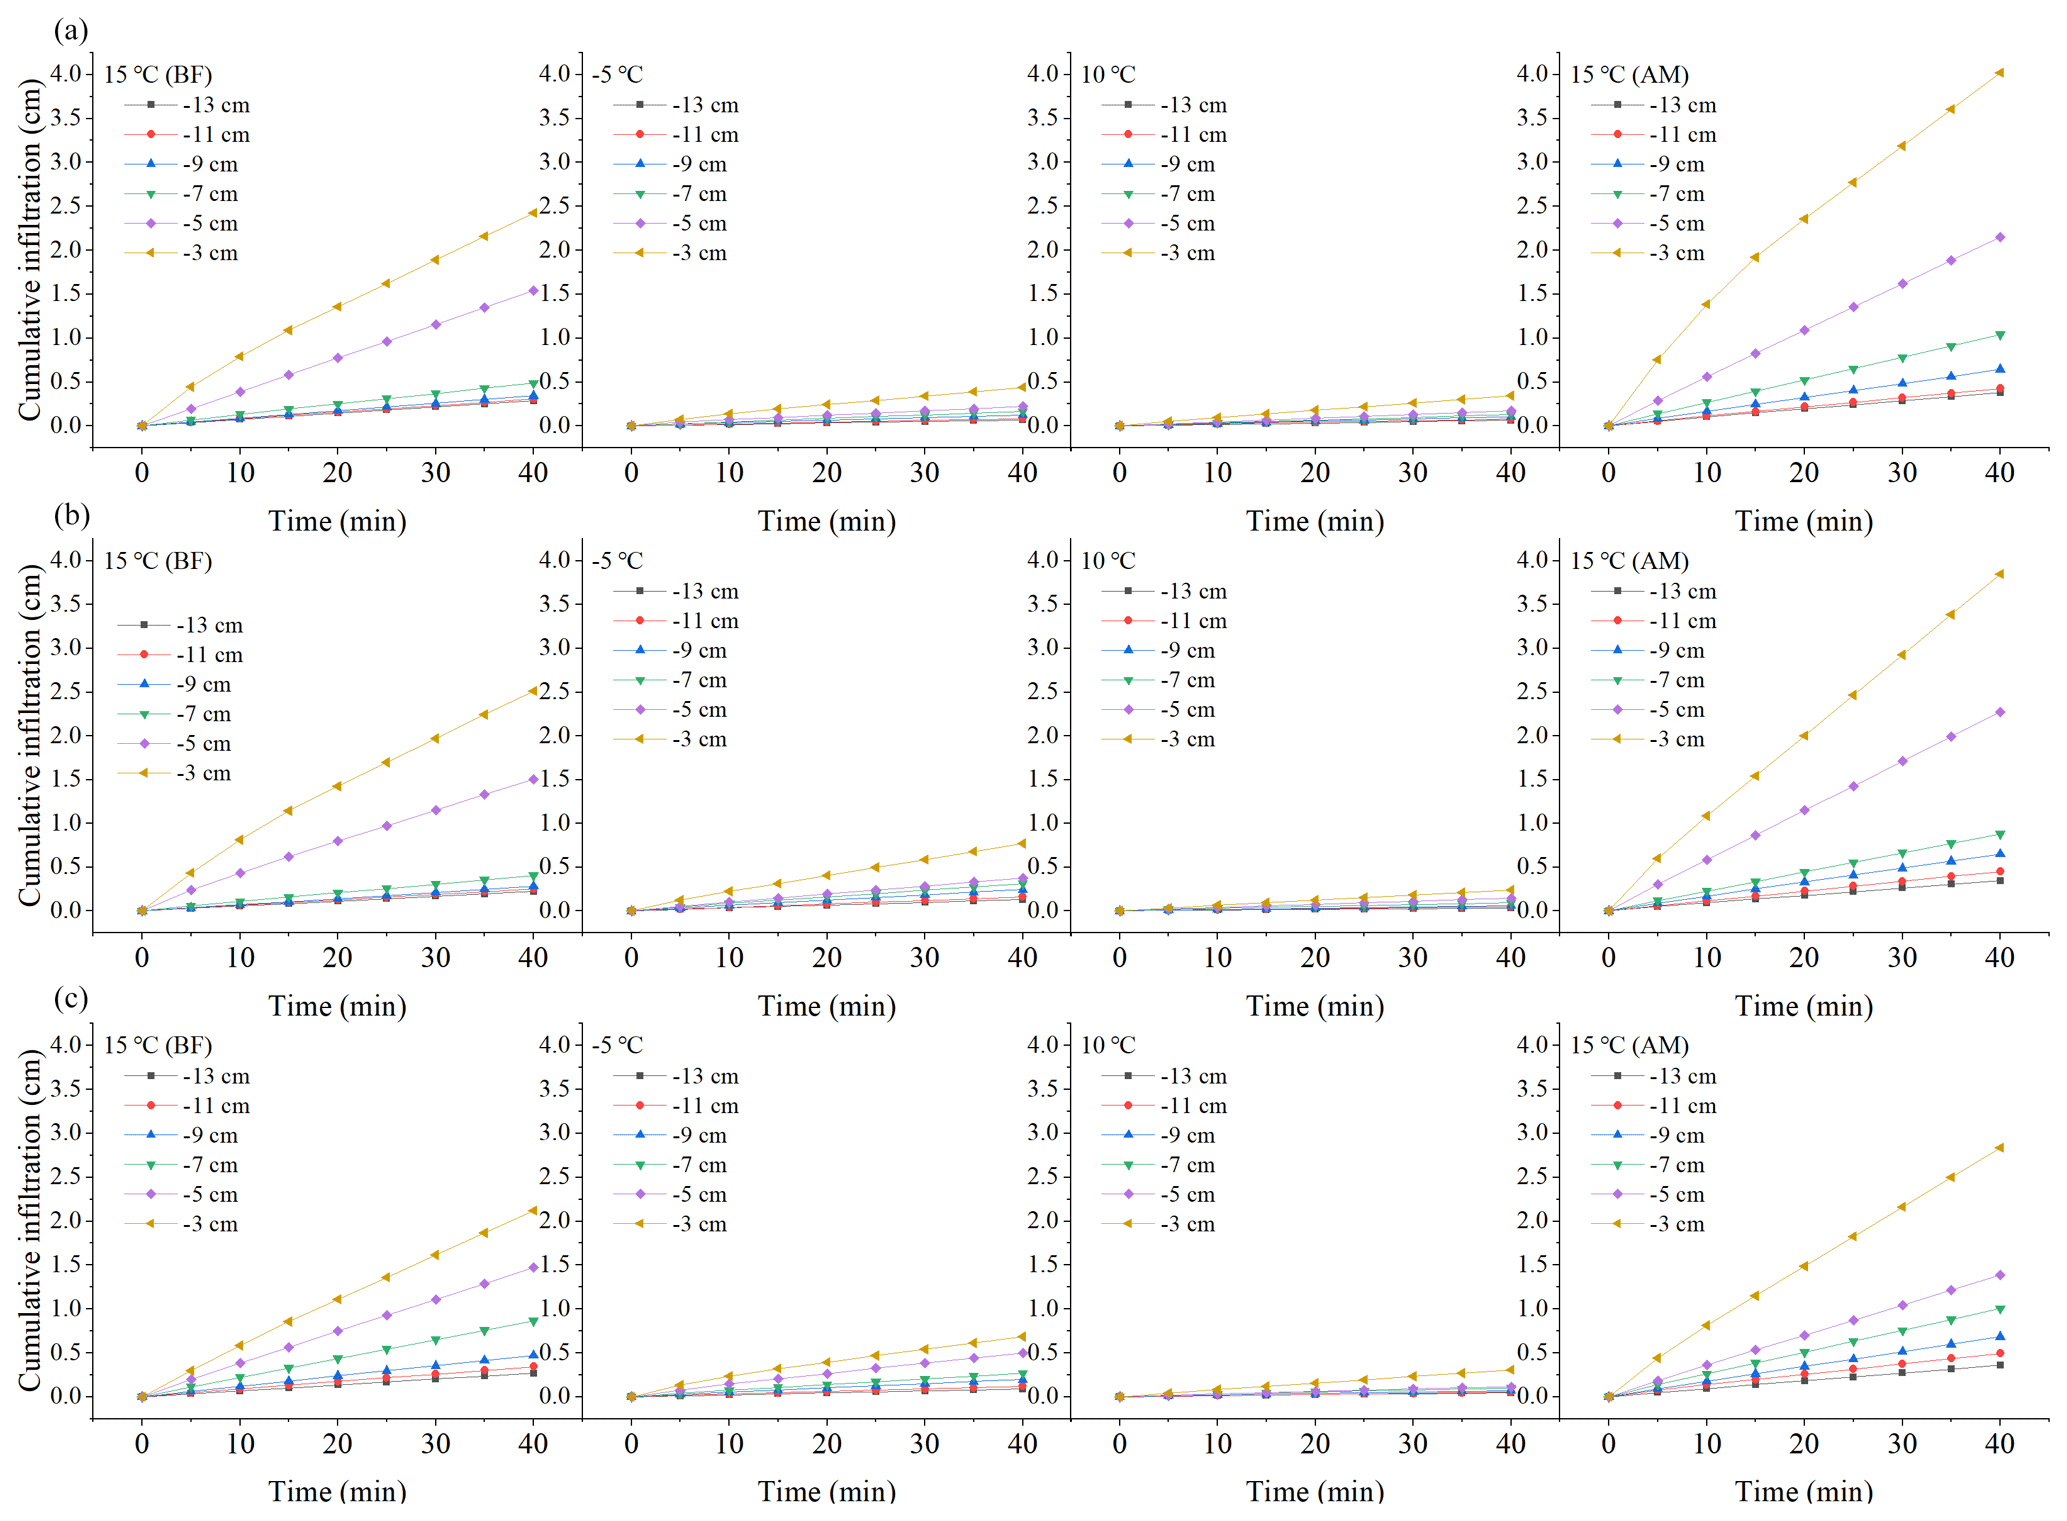
Figure 3Cumulative infiltration over time under the different treatments. (a) Black soil; (b) meadow soil; (c) chernozem.
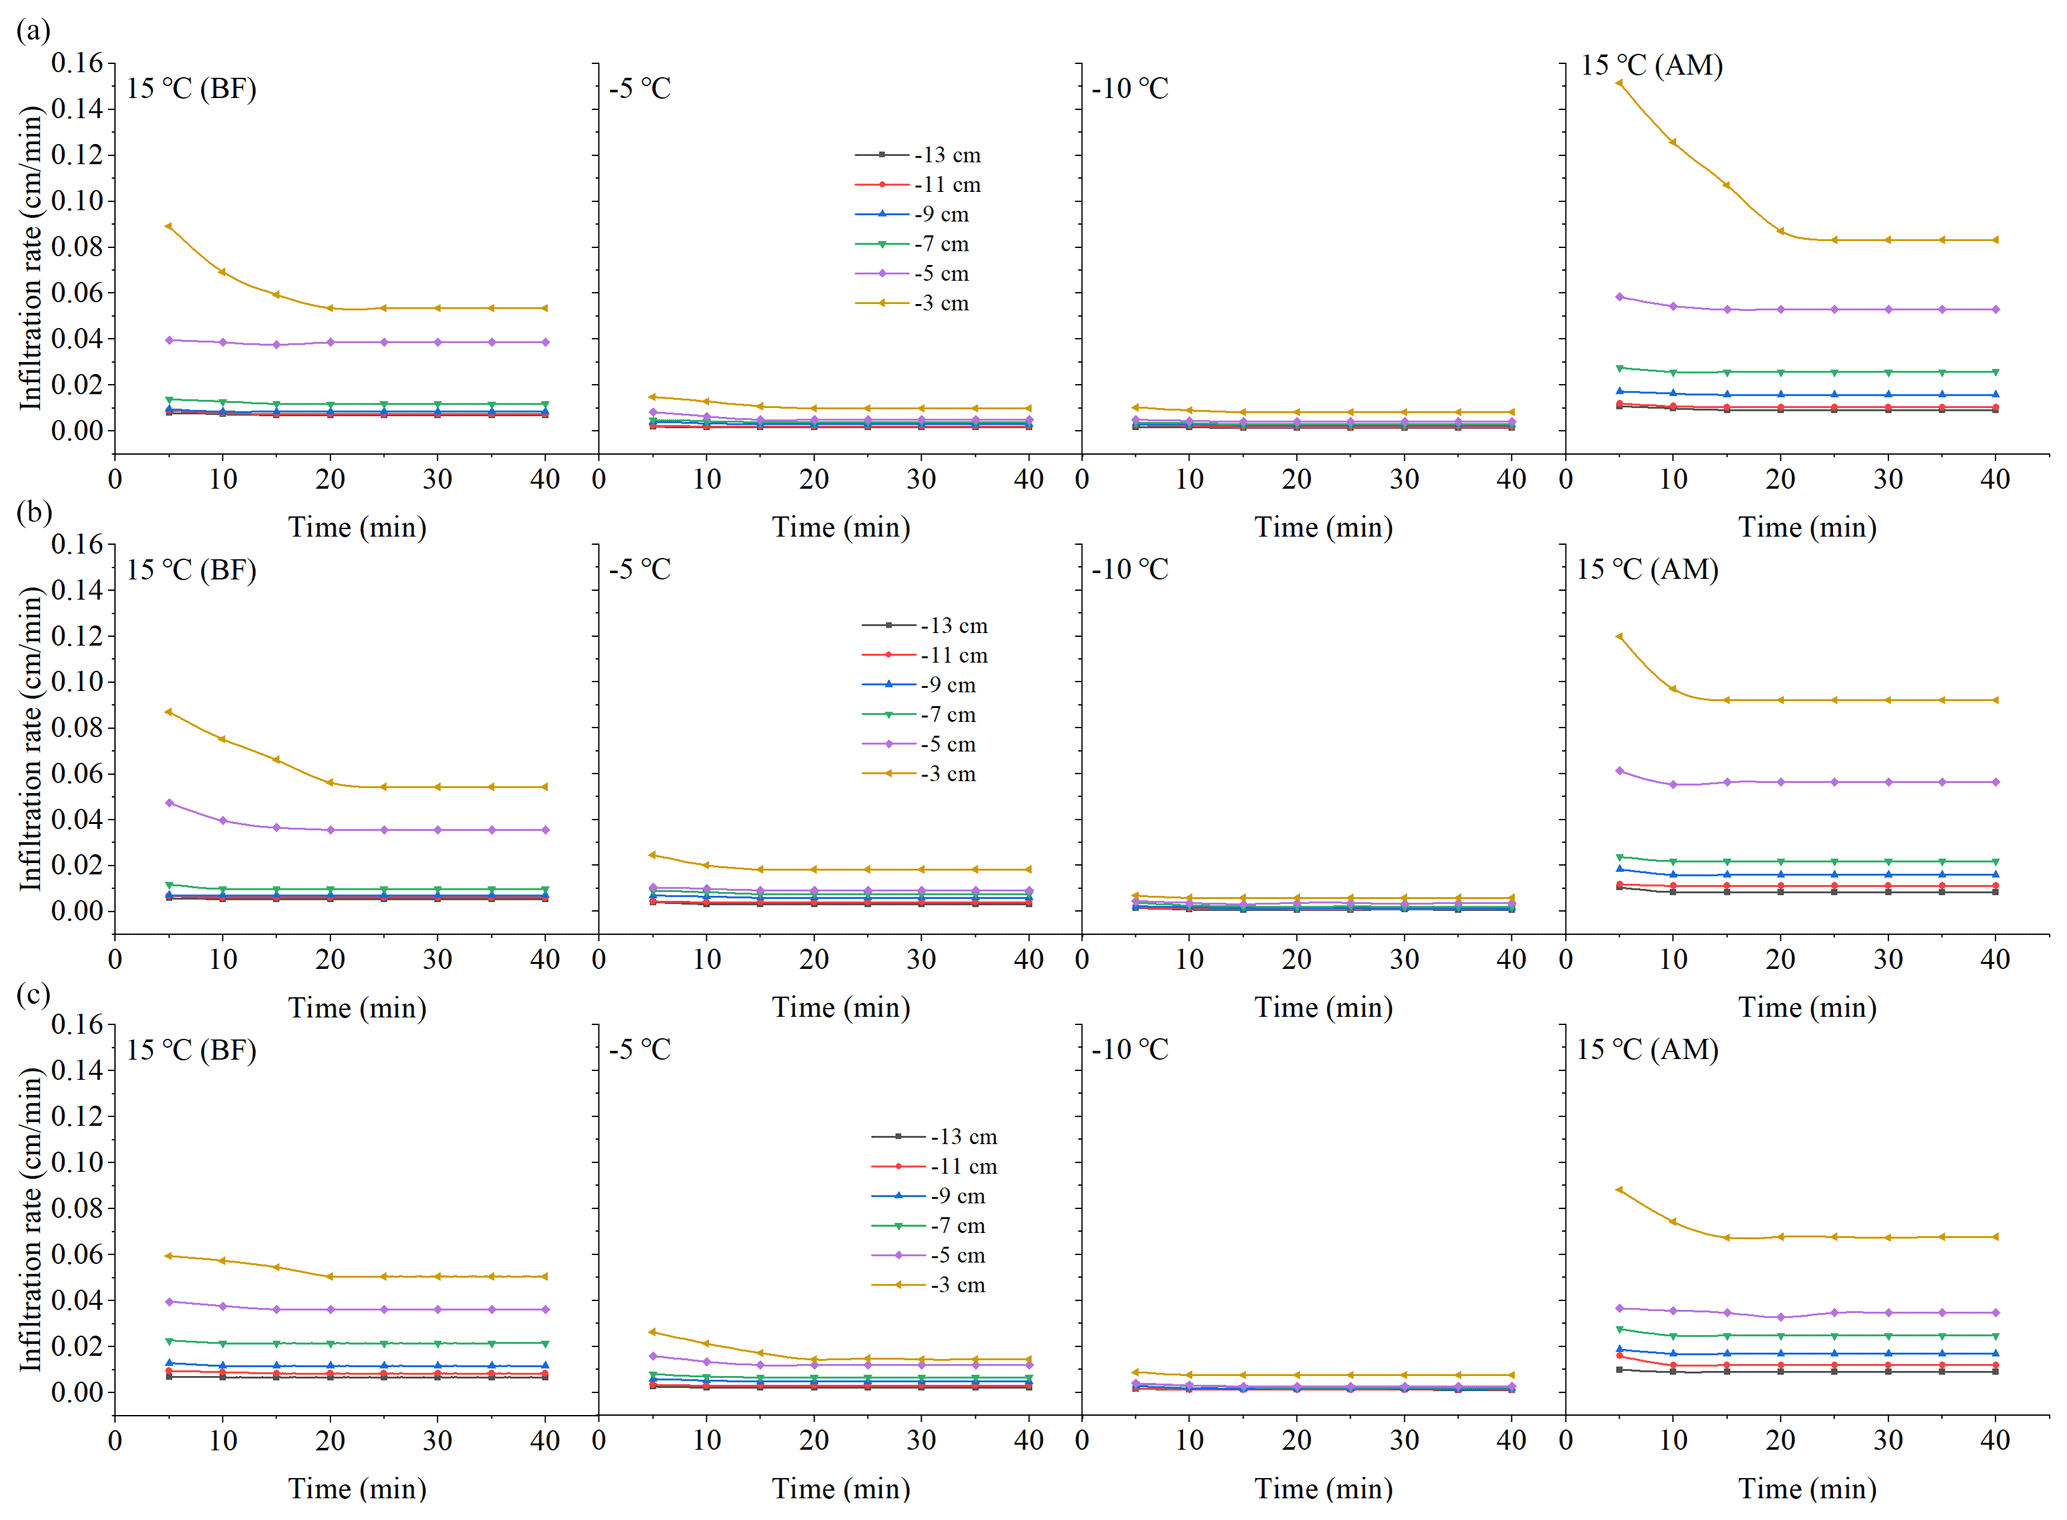
Figure 4Infiltration rate over time under the different treatments. (a) Black soil; (b) meadow soil; (c) chernozem.
As shown in Figs. 4 and 5, under the different tension conditions, the infiltration capacity of the unfrozen soil is basically consistent with the findings of field experiments and is highly influenced by the tension value (Wang et al., 1998). Compared to the room-temperature soil, the cumulative infiltration of frozen soil slowly increases, and the infiltration rate always remains low, while under the same negative temperature treatment, the influence of the tension value is also greatly reduced. When the temperature was reduced to −10 ∘C, few major tension differences were observed except for the maximum tension of −3 cm. Based on the change in the slope of the two curves, the time for the unfrozen soil to reach the stable infiltration rate usually ranges from 15–20 min, while the time for the frozen soil to reach the stable infiltration rate is usually 10 min under higher tensions of −3 and −5 cm and 5 min under lower tensions. A comparison of the infiltration process before and after the freezing and thawing of the soil indicates that overall, the cumulative infiltration and infiltration rate exhibited varying degrees of increase with increasing tension value, and the increase amplitude expanded. Moreover, the difference in the cumulative infiltration and infiltration rate between the low tension levels ranging from −9 to −13 cm after soil thawing was larger than that before soil freezing, which also indirectly demonstrated that freezing and thawing could further stabilize the soil pore distribution by affecting the homogeneity, which will be detailed in subsequent sections.
Table 6Infiltration parameters of the different temperature treatments of the three soil types.
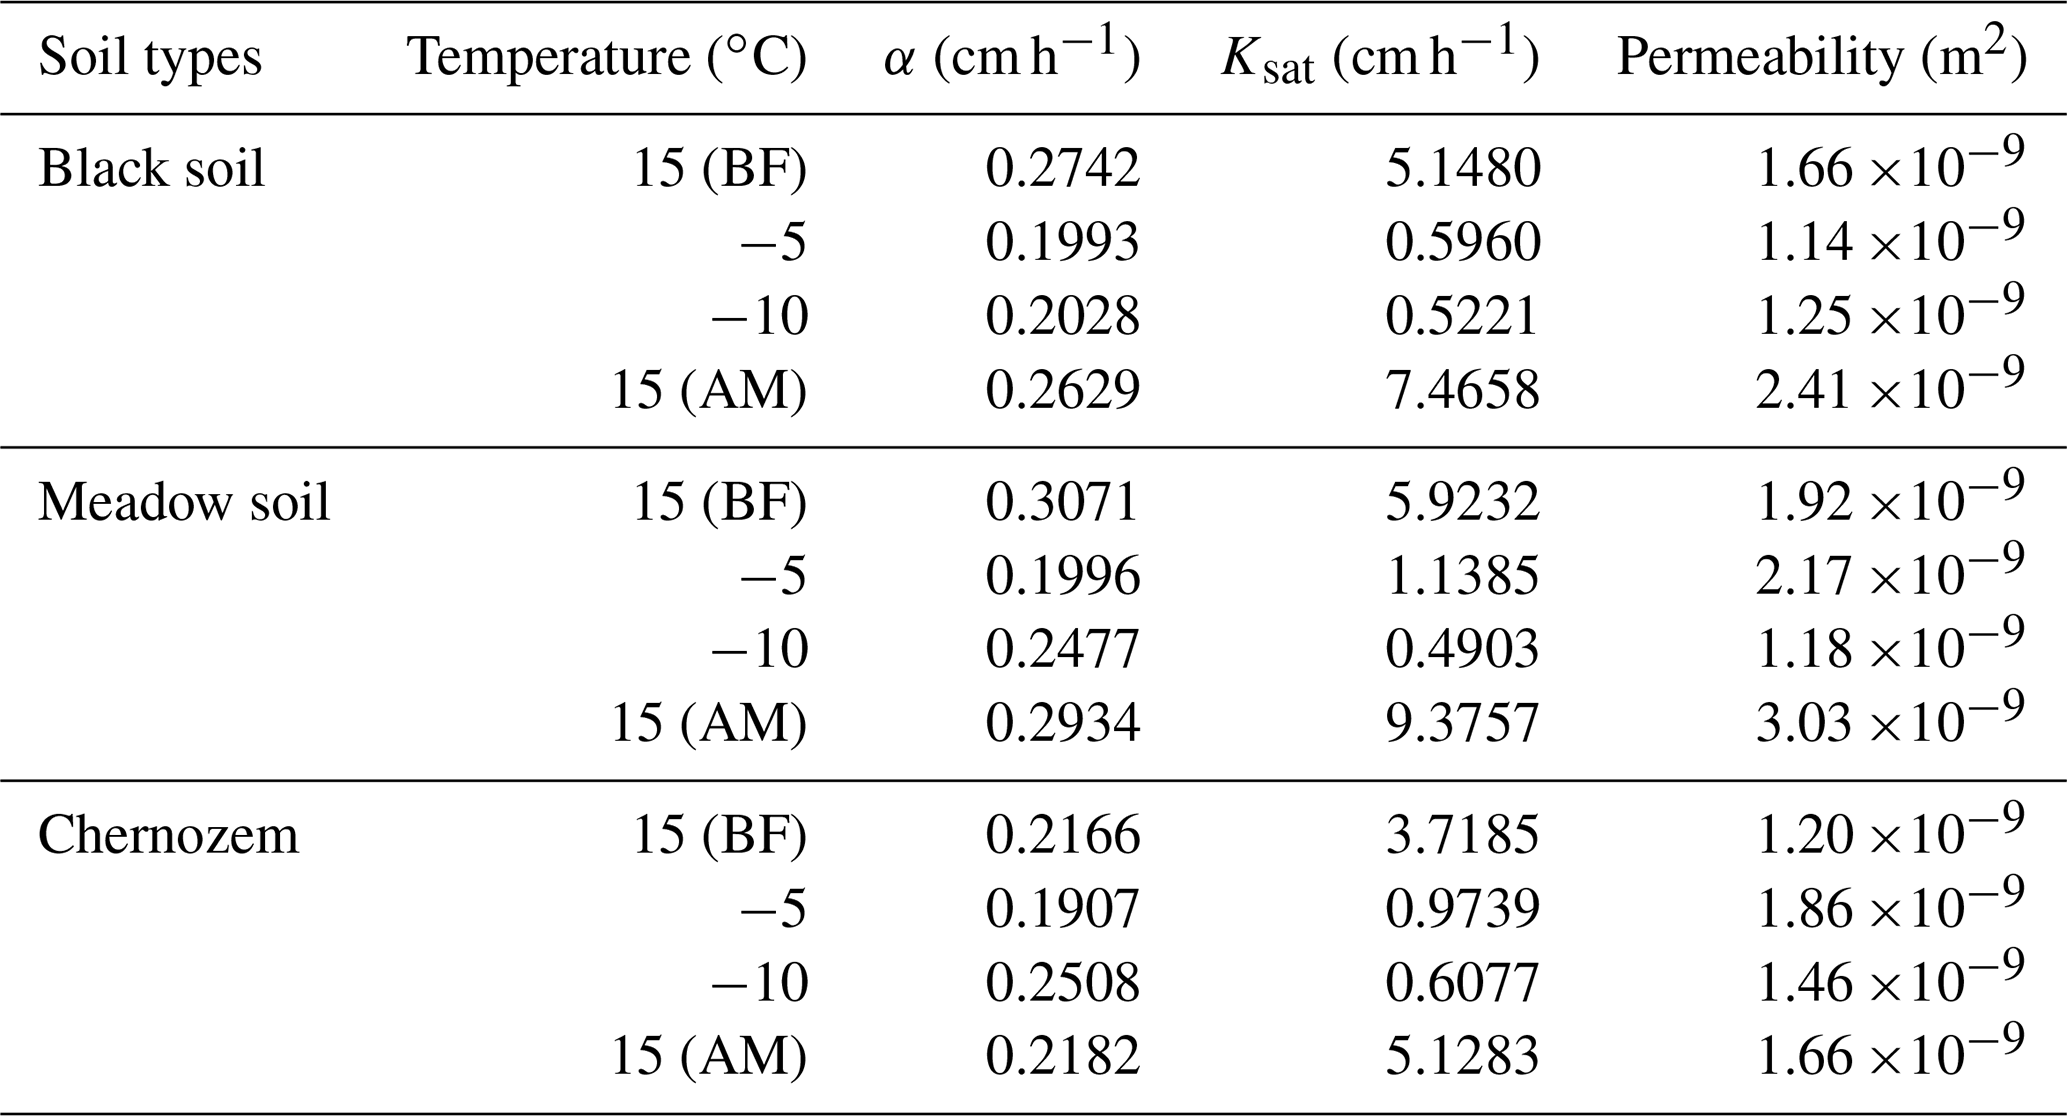

Figure 5Variation curves of the unsaturated hydraulic conductivity and stable infiltration rate with the tension for the different treatments of the three soils. (a) Black soil; (b) meadow soil; (c) chernozem. The solid lines represent the stable infiltration rate, and the dashed lines represent the unsaturated hydraulic conductivity.
By combining Fig. 5 and Table 6, we observe that the three types of soils exhibit a high infiltration capacity under normal temperature conditions. With increasing set tension value, the suction force of the soil matrix gradually weakened, the constraint and maintenance capacity of the matric potential with respect to the soil water decreased, the number of pores involved in the soil water infiltration process increased, and the unsaturated hydraulic conductivity and stable infiltration rate of the three types of soils exhibited different degrees of increase. When the temperature was lowered from 15 to −5 ∘C and remained constant for a certain time, the soil reached the stable frozen state, which usually indicated that there were no more drastic changes in temperature and moisture content, the saturated water conductivity of the black soil, meadow soil, and chernozem soil decreased by 88.42 %, 80.78 %, and 73.8 %, respectively. When the soil temperature was decreased to −10 ∘C, due to the presence of liquid water in the pores, the saturated water conductivity still exhibited a certain decrease over the pre-freeze conditions and continued to decrease by 1.43 %, 10.94 %, and 9.85 %, respectively. At negative temperatures, the unsaturated hydraulic conductivity decreased considerably and fluctuated within a small range, mainly because the unfrozen water content and saturated hydraulic conductivity were low after soil freezing. Based on a comparison of the −5 and −10 ∘C treatments, the unsaturated hydraulic conductivity (ANOVA, P= 0.72, F= 0.14) and stable infiltration rate (ANOVA, P= 0.71, F= 0.15) of the black soil exhibited almost no significant change, indicating that most of its pores were filled with ice crystals at −5 ∘C and were no longer involved in water infiltration. The unsaturated water conductivity of the meadow and chernozem soils still exhibited a more significant reduction when the freezing temperature was further reduced to −10 ∘C. When the temperature was raised again to 15 ∘C and the soil was completely thawed, the steady infiltration rate and saturated hydraulic conductivity increased with increasing temperature, and the values were higher than those of the soil at the same temperature before freezing. The saturated hydraulic conductivity of the black soil, meadow soil, and chernozem increased by 45.02 %, 58.63 %, and 37.91 %, respectively, relative to the 15 ∘C (BF) treatment values.
3.2 Pore distribution characteristics of the freezing–thawing soil
Considering the differences in the physical and chemical properties between the infiltration solutions, infiltration parameters such as the hydraulic conductivity and stable infiltration rate alone do not fully reflect the infiltration characteristics and internal pore size of frozen soils. According to Eqs. (7)–(9), the maximum number per unit area N, effective porosity θm, and percentage of pore flow to saturated flow P corresponding to the different soil pore sizes of the three soils under the different temperature treatments were calculated, as shown in Figs. 6 and 7.
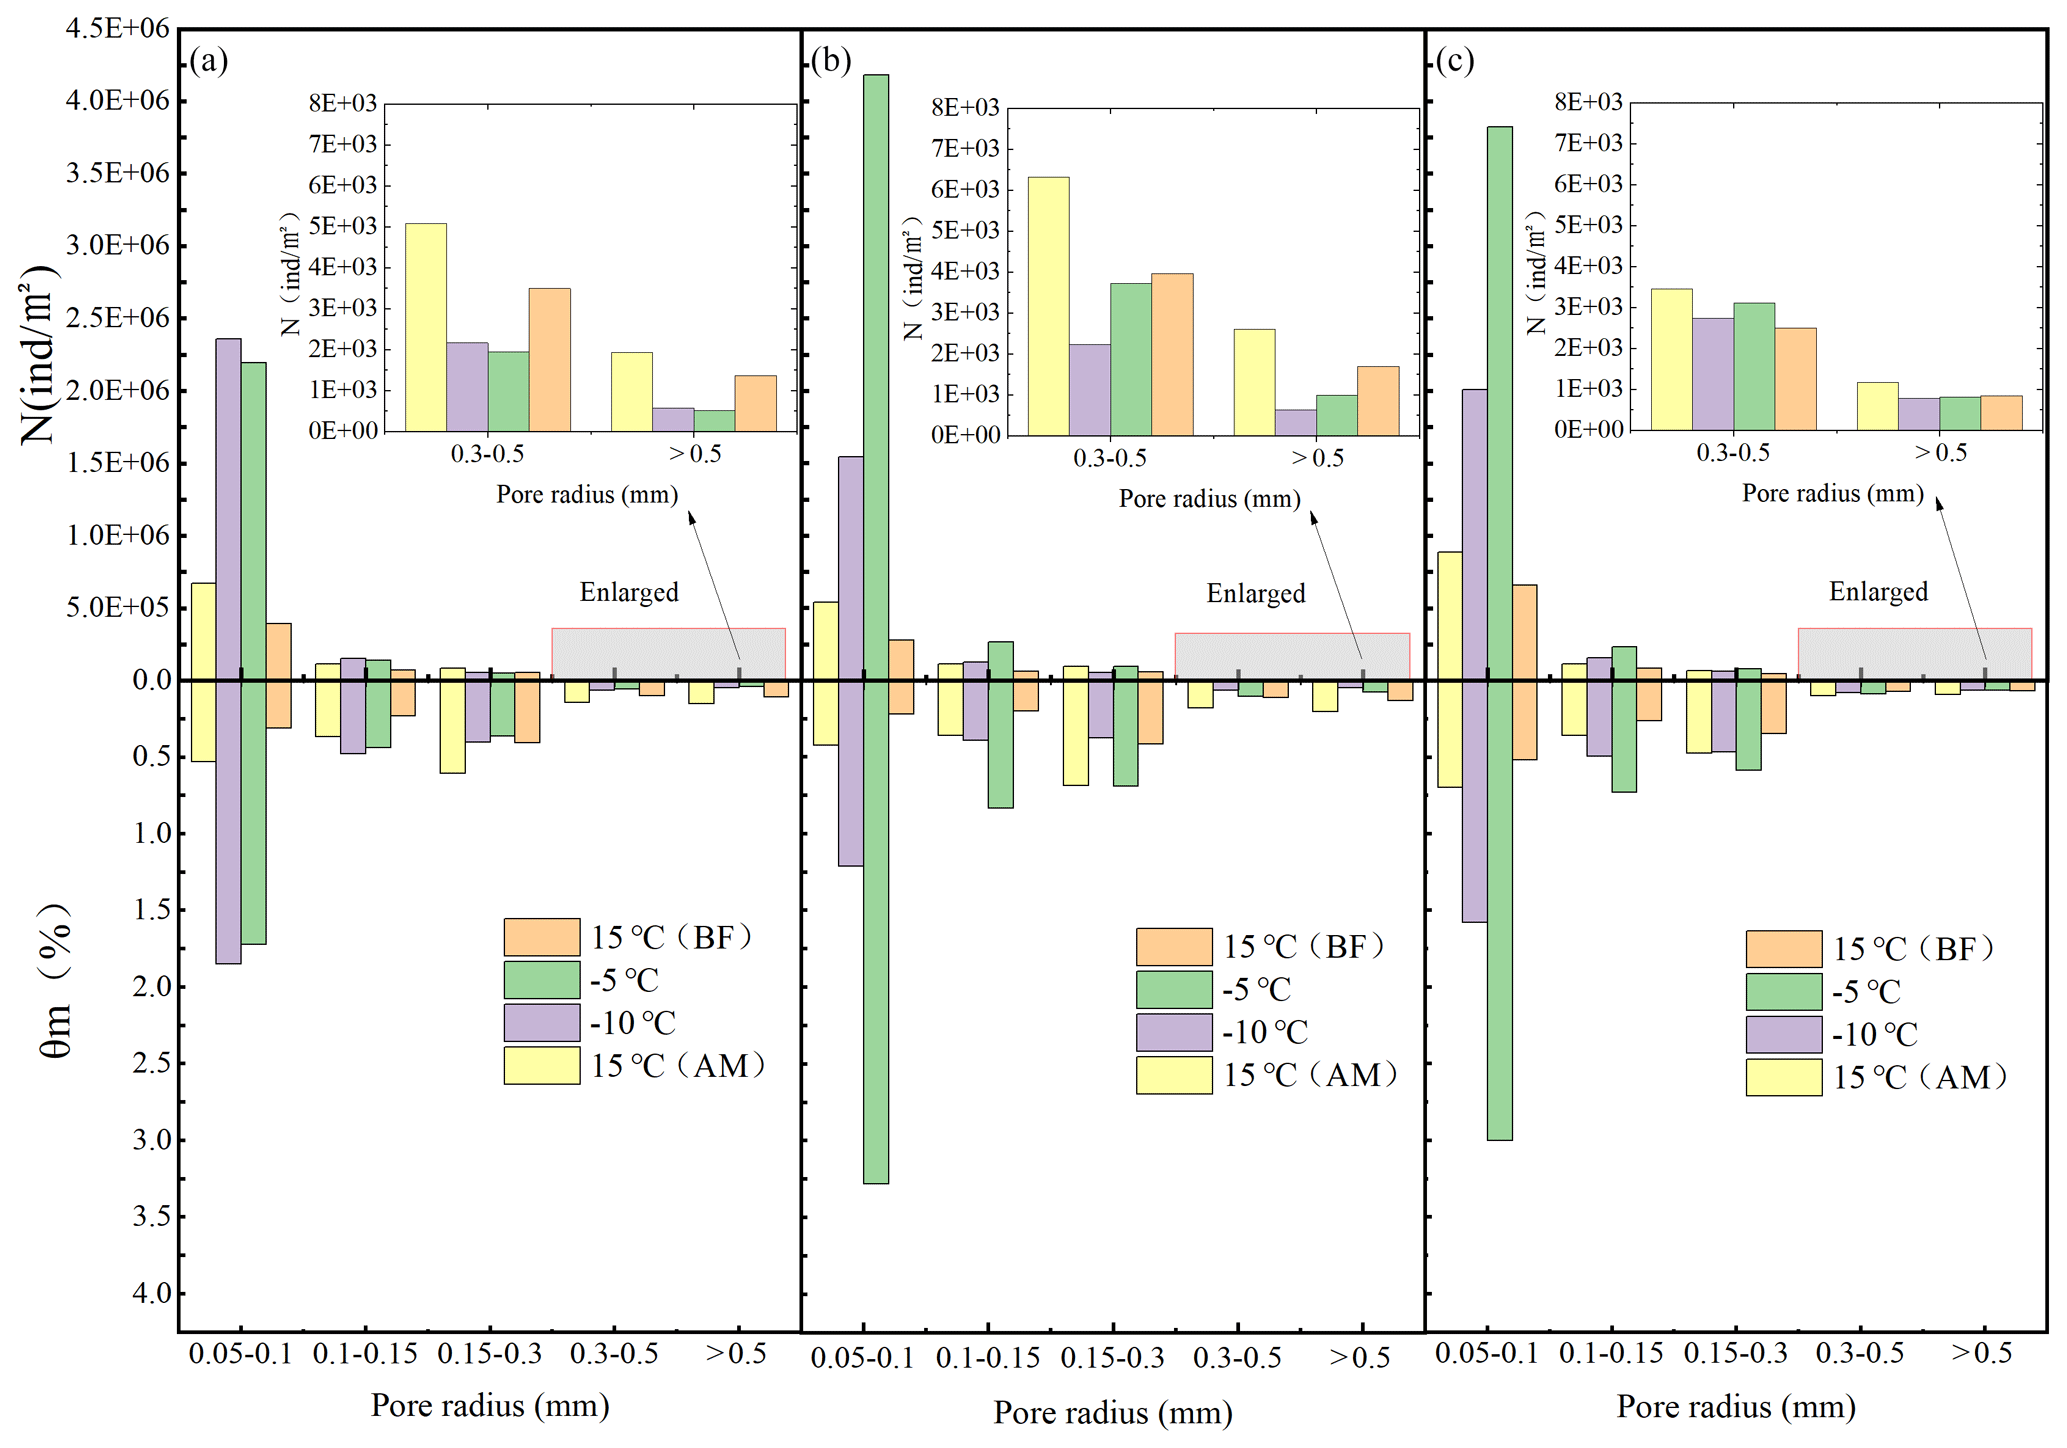
Figure 6Number of pores and effective porosity of the different equivalent pores. (a) Black soil; (b) meadow soil; (c) chernozem.
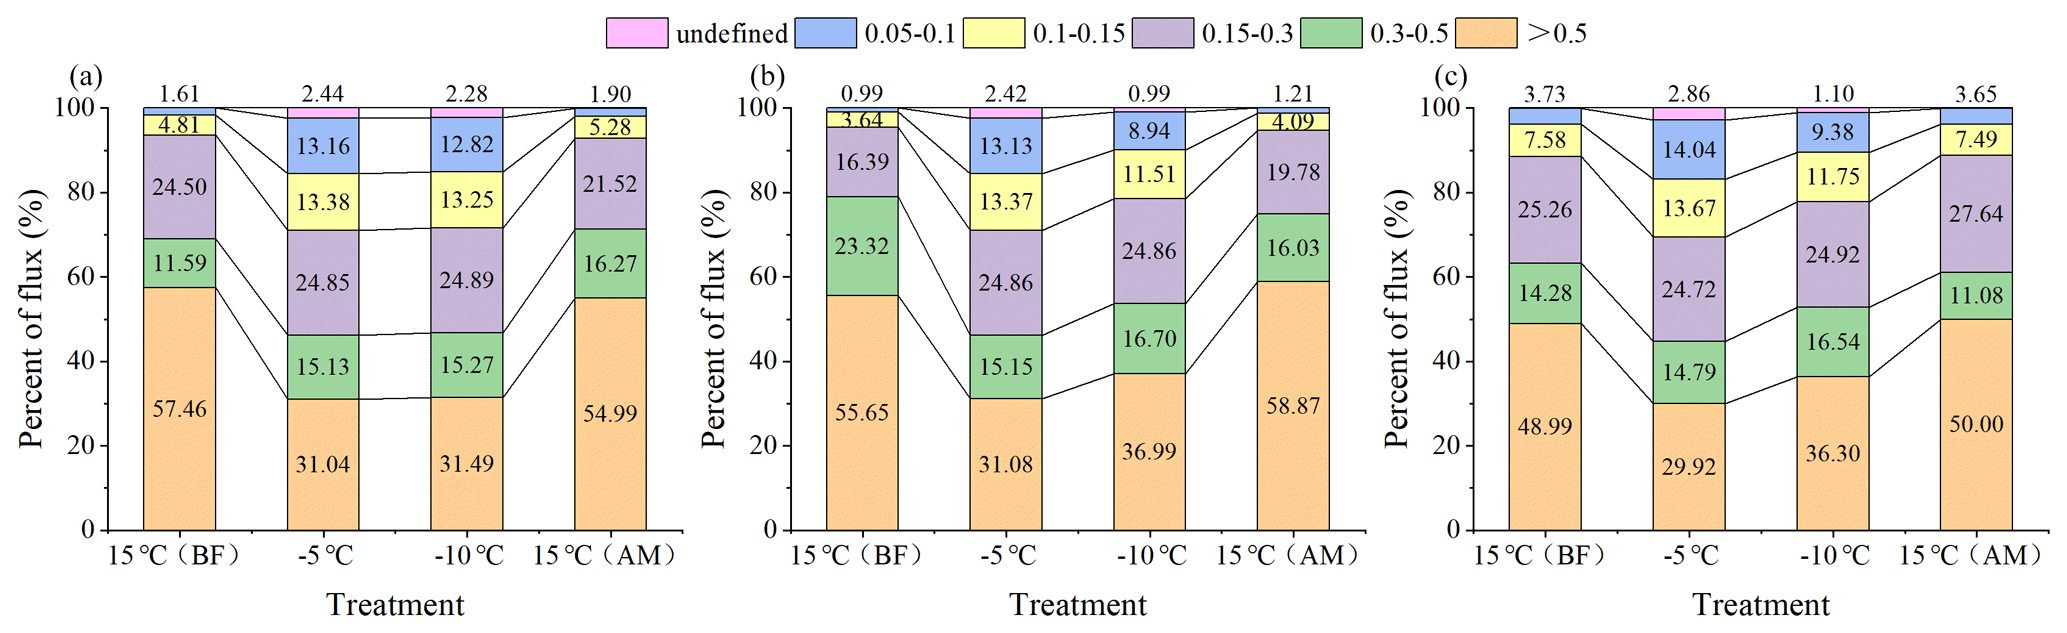
Figure 7Percentage of the pore flow in the saturated flow for the different equivalent pore sizes. (a) Black soil; (b) meadow soil; (c) chernozem.
Figure 6 shows that pores of different equivalent radii widely occur in all three soils, and under all four temperature treatments, the largest N value is that for the medium pores with an equivalent radius of 0.05–0.1 mm, and N gradually decreases with increasing equivalent radius size. Under the two room-temperature treatments at 15 ∘C (BF) and 15 ∘C (AM), the largest number of 0.05 to 0.1 mm medium pores and the smallest number of > 0.5 mm macropores differed by 2 orders of magnitude. The number of pores of each size exhibited different degrees of increase or decrease in the two treatments at −5 and −10 ∘C where freezing occurred, with the number of medium pores with an equivalent pore size of 0.05–0.1 mm significantly changing. Increases of more than an order of magnitude were achieved in all three soils, while the macropores with an equivalent pore size of > 0.5 mm were generally reduced by an order of magnitude, with the difference in the number of pores of these two sizes reaching 4 orders of magnitude. This indicates that freezing caused by temperature change significantly alters the soil internal structure, with ice crystals forming in the relatively large pores containing the internal soil moisture, resulting in a large number of smaller pores. Based on an assessment of the two treatments at −5 and −10 ∘C separately, when the temperature was lowered from −5 to −10 ∘C, the number of pores in each pore size interval of the meadow and chernozem soils exhibited a significant decrease, while the black soil revealed a small increase, which might be related to the high organic matter content of the black soil. A comparison of the two treatments at 15 ∘C (BF) and 15 ∘C (AM) indicated that the number of pores in all three soils increased to different degrees after thawing, and more pores were formed with the melting of ice crystals after the freeze–thaw destruction of the soil particles, which enhanced the soil water conductivity.
Comprehensive analysis of Figs. 6 and 7 reveals that before freezing, the θm values of the various pore sizes of the black soils, meadow soils, and chernozem with an equivalent radius of > 0.5 mm were 0.11 %, 0.13 %, and 0.07 %, respectively, while the P value reached 57.46 %, 55.65 %, and 48.99 %, respectively, with the values of the thawed soil being similar to these values. This indicates that for all five soil pore sizes under unfrozen conditions, although the number of macropores with a pore size > 0.5 mm was the smallest and the effective porosity was the lowest, their contribution to the saturated flow was usually more than half, and the macropores needed to represent only a small fraction of the pore volume to significantly contribute to the soil water flow. For the frozen soil, the P value of the > 0.5 mm macropores was significantly reduced and remained at approximately 30 % after the reduction, while the P value of the smaller pore sizes such as 0.15–0.3, 0.1–0.15, and 0.05–0.1 mm revealed different degrees of increase. Moreover, the smaller the pore size, the greater the P value increased, and the contribution of these pores eventually accounted for more than 10 % of the saturated flow. The saturated flow became more evenly distributed across the pores of each size, and the total proportion of medium pores exceeded that of the macropores. This indicates that the freezing action caused obvious changes to the soil structure, pore size, and quantity, and although the macropores still played an important role, the infiltration capacity of the frozen soil no longer relied solely on these macropores, and the contribution of certain smaller-sized mesopores to the infiltration capacity of the frozen soil could no longer be neglected. Selecting black soil as an example, the total effective porosity of the pores of each size under the four treatments was 1.15 %, 2.62 %, 2.84 %, and 1.80 %, and the P values were 99.97 %, 97.56 %, 97.72 %, and 99.96 %, respectively, which implies that the soil water infiltrated almost entirely via the large and medium pores. The small micropores, even in large numbers, contributed little to the infiltration process.
4.1 Permeability and hydraulic conductivity of the frozen soil
It is worth noting that the theory underpinning the tension infiltration analysis in this article is based on the assumption that larger pores only flow fully saturated, which means no air–water interface inside the pore and excludes the formation of an air–water interface with flowing water in larger pores (Perroux and White, 1988). However, recent work has shown that this flow mode does indeed occur (Beven and Germann, 2013; Nimmo, 2012, 2010). In addition, in unfrozen tension infiltrometer experiments, the soil moisture is assumed to be that imposed by the applied tension, whereas in the experiments with frozen samples, the applied tension is assumed to affect only the pores that are active during infiltration.
In the field environment, although it is difficult to accurately measure the infiltration rate of frozen soils using traditional instruments and methods such as single-loop infiltrators, the obtained test results still demonstrate that the infiltration capacity decreases by 1 or more orders of magnitude when the soil is frozen (Stähli et al., 2004). Although the cumulative infiltration and infiltration rate of frozen soil are low, the presence of unfrozen water allows a certain amount of infiltration flow to be maintained in the soil. When water is applied as the infiltration solution, the low temperature of the frozen soil easily causes the infiltration water to freeze, thus forming a thin layer of ice on the soil particle surface and delaying the subsequent infiltration of water. This phenomenon results in a low infiltration rate after the freezing of soils with a high initial water content and a relatively high infiltration rate after the freezing of dry soils (Watanabe et al., 2013), because the higher the ice content is, the more latent heat needs to be overcome to melt any ice crystals, resulting in a weakened propagation of the melting front, thus limiting the infiltration rate so that it is controlled by the downward movement of the melting leading edge of the ice crystals (Pittman et al., 2020). During the measurements using the tension infiltrator in this study, the sensor temperature always remained consistent with the soil temperature, indicating that the use of an aqueous glycol solution could be a useful way to avoid the problem of freezing of the infiltration solution. In addition, the hydraulic conductivity of frozen soils with different capacities and at various water flow rates was demonstrated not to greatly differ (Watanabe and Osada, 2017).
Whether water or other low-freezing point solutions are applied as infiltration media, the hydraulic conductivity of frozen soil significantly changes only within a limited temperature range above −0.5 ∘C depending on the unfrozen water and ice contents, and at a soil temperature below −0.5 ∘C, the hydraulic conductivity usually decreases to less than 10−10 m s−1 (Watanabe and Osada, 2017; Williams and Burt, 1974). The unsaturated hydraulic conductivity in our experiments was measured at a set tension level, and according to Eq. (6), the soil substrate potential increases by 125 m for every 1 ∘C decrease in temperature (Williams and Smith, 1989), while the frozen soil hydraulic conductivity calculated at −5 and −10 ∘C, which corresponds to the actual matric potential, is much lower than 10−10 m s−1, close to the zero point of the unsaturated hydraulic conductivity variation curves in Fig. 5, and can be ignored. This suggests that even under ideal conditions where no heat exchange occurs between the infiltration solution and the soil and no freezing of the infiltration water takes place to prevent subsequent infiltration, the unsaturated hydraulic conductivity of frozen soil is so low that the frozen soil at lower temperatures in its natural state could be considered impermeable, with respect to both water and other solutions. It should also be noted that we used different liquids at different temperatures and that the difference in infiltration parameters such as Ksat with temperature is related to the different viscosities of the liquid. It is predictable that if water is also used in frozen soils, such differences will be relatively insignificant as the ice melts.
4.2 Effect of freeze–thaw cycles on soil pore distribution
In our study, the N value after freezing for the different types of soil was approximately 1000–2000 m−2 based on the tension infiltrator, which agreed well with other studies such as conventional soil ring methods using X-ray and CT (Ding et al., 2019; Holten et al., 2018) and remained at the same magnitude, indicating that the method is generally reliable. Compared with saturated frozen soils (Ding et al., 2019), the effect of freeze–thaw cycles on the pore distribution of unsaturated frozen soil is also significant. Moreover, it should be noted that instruments such as CT are usually expensive and difficult to carry, tension infiltrators are affordable and widely used, and combined with temperature control equipment, they will be helpful for field measurements of macroporosity in frozen soils. The freeze–thaw effect significantly improves the water conductivity of the different types of soils because it increases the porosity, decreases the soil compactness and dry weight, and thus increases the soil water conductivity (Fouli et al., 2013). On this basis, we also found that the freeze–thaw process significantly altered the size and number of soil pores, especially after freezing, and the number of macropores decreased, while the contribution of macropores to the saturated flow decreased. The proportion of the saturated flow in the mesopores with a pore size of < 0.3 mm approached or even exceeded the proportion in the macropores, indicating that the soil water inside relatively large pores is more likely to freeze, which in turn creates a large number of small pores, whereas the water transfer process in unfrozen soils primarily relies on the macropores, with obvious differences (Wilson and Luxmoore, 1988; Watson and Luxmoore, 1986). The unsaturated water conductivity of the frozen soils measured in this study was quite low, but under human control (Watanabe and Kugisaki, 2017) or natural conditions in the field (Espeby, 1990), water has been shown to infiltrate frozen soils through macropores as long as the pore size is large enough. Considering that the soil in this experiment was disturbed soil that had been air dried and sieved, although the macropores created by tillage practices (Lipiec et al., 2006) and invertebrate activities (Lavelle et al., 2006) were excluded, due to the inherent heterogeneity of the soil particles, macropores remain in the uniformly filled soil column (Cortis and Berkowitz, 2004; Oswald et al., 1997), and these macropores still played a role in determining the infiltration water flow. In addition, according to the equations of N and θm, it can be found that the main source of their uncertainty is the value of the pore radius r, and Eq. (7) calculates the minimum value of pore radius, while the result obtained with Eq. (9) is in fact the upper limit of effective macropores per unit area and effective porosity, which may also lead to a certain overestimation. Furthermore, freezing of water may also have a potential effect on the microstructure of soil pores (Wan and Yang, 2020).
There are still only a few studies related to frozen soil macropore flow and pore distribution; consequently, more data should be acquired, and more models should be developed to better understand water movement in frozen soil regions. The experiments in this paper are based on repacked soils that were subjected to the first freeze–thaw cycle in the laboratory, and the conclusions may not be comprehensive. In subsequent studies, we will consider applying the methods used in this paper to field experiments to examine the dynamics of the infiltration capacity and pore distribution in nonhomogeneous soils during whole freeze–thaw periods under real outdoor climatic conditions, such as lower temperatures and more severe freeze–thaw cycles, but the infiltration solution must be carefully selected; as ethylene glycol has low toxicity, to prevent contamination of agricultural soils and crops, a certain concentration of lactose could be considered (Burt and Williams, 1976; Williams and Burt, 1974). At room temperature, an ethylene glycol aqueous solution and water have similar densities and relatively similar viscosities. We have compared these two infiltration solutions in unfrozen soil field experiments, and the infiltration and pore conditions were basically similar, so we still used an aqueous glycol solution in the frozen soil laboratory experiment. Measurements should focus on frozen soil layers at different depths, especially in the vicinity of freezing peaks, and the spatial variability in the distribution of frozen soil pores should be investigated. This work helps to improve the accuracy of simulations such as those of frozen soil water and heat movement or snowmelt water infiltration processes.
In this paper, the infiltration capacity of soil columns under four temperature treatments representing various freeze–thaw stages was measured, and the distribution of the pores of various sizes within the soil was calculated based on the measurements by applying an aqueous ethylene glycol solution with a tension infiltrator in the laboratory. The results revealed that for the three types of soils, i.e., black soil, meadow soil, and chernozem, the macropores, which accounted for only approximately 0.1 % to 0.2 % of the soil volume at room temperature, contributed approximately 50 % to the saturated flow, and after freezing, the proportion of macropores decreased to 0.05 % to 0.1 %, while their share of the saturated flow decreased to approximately 30 %. Coupled with the even smaller mesopores, the large and medium pores, accounting for approximately 1 % to 2 % of the soil volume, conducted almost all of the soil moisture under saturated conditions. Freezing decreased the number of macropores and increased the number of smaller-sized mesopores, thereby significantly increasing their contribution to the frozen soil infiltration capacity so that the latter was no longer solely dependent on the macropores. The infiltration parameters and pore distribution of the black soil were the least affected by the different negative freezing temperatures under the same moisture content and weight capacity conditions, while those of the meadow soil were the most impacted.
Data used in this study are available at Figshare (https://doi.org/10.6084/m9.figshare.12965123, Jiang, 2020).
RJ designed the research program. TL and RJ built and deployed the soil column and instruments with assistance from QL and RH. DL and QF provided funding for test equipment. SC collected soil samples in the field. RJ and TL analyzed the laboratory data. RJ prepared the manuscript with comments from TL and DL.
The authors declare that they have no conflict of interest.
We are grateful for the guidance of the experiment scheme from Xianghao Wang. We thank Hang Zhao for his assistance in operating the apparatus. We thank Xiaoying Lv for her help in drawing the diagram. An earlier manuscript greatly benefitted from the helpful comments by the reviewer Aaron Mohammed. We also appreciate the numerous insightful suggestions given by handling editor Ylva Sjöberg.
This research was supported by the National Science Fund for Distinguished Young Scholars (51825901), the Joint Fund of the National Natural Science Foundation of China (U20A20318), the Heilongjiang Provincial Science Fund for Distinguished Young Scholars (YQ2020E002), the “Young Talents” Project of Northeast Agricultural University(18QC28), the China Postdoctoral Science Foundation (2019M651247), and the Postdoctoral Science Foundation of Heilongjiang Province(LBH-Z19003).
This paper was edited by Ylva Sjöberg and reviewed by Aaron Mohammed and one anonymous referee.
Andersland, O. B., Wiggert, D. C., and Davies, S. H.: Hydraulic conductivity of frozen granular soils, J. Environ. Eng., 122, 212–216, https://doi.org/10.1061/(ASCE)0733-9372(1996)122:3(212), 1996.
Angulo-Jaramillo, R., Vandervaere, J.-P., Roulier, S., Thony, J.-L., Gaudet, J.-P., and Vauclin, M.: Field measurement of soil surface hydraulic properties by disc and ring infiltrometers: A review and recent developments, Soil Till. Res., 55, 1–29, https://doi.org/10.1016/S0167-1987(00)00098-2, 2000.
Ankeny, M. D., Ahmed, M., Kaspar, T. C., and Horton, R.: Simple field method for determining unsaturated hydraulic conductivity, Soil Sci. Soc. Am. J., 55, 467–470, https://doi.org/10.2136/sssaj1991.03615995005500020028x, 1991.
Azmatch, T. F., Sego, D. C., Arenson, L. U., and Biggar, K. W.: Using soil freezing characteristic curve to estimate the hydraulic conductivity function of partially frozen soils, Cold Reg. Sci. Technol., 83, 103–109, https://doi.org/10.1016/j.coldregions.2012.07.002, 2012.
Beven, K. and Germann, P.: Macropores and water flow in soils revisited, Water Resour. Res., 49, 3071–3092, https://doi.org/10.1002/wrcr.20156, 2013.
Bodhinayake, W., Si, B. C., and Xiao, C.: New method for determining water-conducting macro-and mesoporosity from tension infiltrometer, Soil Sci. Soc. Am. J., 68, 760–769, https://doi.org/10.2136/sssaj2004.0760, 2004.
Burt, T. and Williams, P. J.: Hydraulic conductivity in frozen soils, Earth Surf. Proc., 1, 349–360, https://doi.org/10.1002/esp.3290010404, 1976.
Campbell, G. S.: Soil physics with BASIC: transport models for soil-plant systems, Elsevier, Amsterdam, 1985.
Cheng, Q., Xu, Q., Cheng, X., Yu, S., Wang, Z., Sun, Y., Yan, X., and Jones, S. B.: In-situ estimation of unsaturated hydraulic conductivity in freezing soil using improved field data and inverse numerical modeling, Agr. Forest. Meteorol., 279, 107746, https://doi.org/10.1016/j.agrformet.2019.107746, 2019.
Cortis, A. and Berkowitz, B.: Anomalous transport in “classical” soil and sand columns, Soil Sci. Soc. Am. J., 68, 1539–1548, https://doi.org/10.2136/sssaj2004.1539, 2004.
Demand, D., Selker, J. S., and Weiler, M.: Influences of macropores on infiltration into seasonally frozen soil, Vadose Zone J., 18, 1–14, https://doi.org/10.2136/vzj2018.08.0147, 2019.
Ding, B., Rezanezhad, F., Gharedaghloo, B., Cappellen, P. V., and Passeport, E.: Bioretention cells under cold climate conditions: Effects of freezing and thawing on water infiltration, soil structure, and nutrient removal, Sci. Total Environ., 649, 749–759, 2019.
Espeby, B.: Tracing the origin of natural waters in a glacial till slope during snowmelt, J. Hydrol., 118, 107–127, https://doi.org/10.1016/0022-1694(90)90253-T, 1990.
Flerchinger, G. N. and Saxton, K. E.: Simultaneous Heat and Water Model of a Freezing Snow-Residue-Soil System I. Theory and Development, Am. Soc. Agr. Eng., 32, 573–576, https://doi.org/10.13031/2013.31041, 1989.
Fouli, Y., Cade-Menun, B. J., and Cutforth, H. W.: Freeze–thaw cycles and soil water content effects on infiltration rate of three Saskatchewan soils, Can. J. Soil Sci., 93, 485–496, https://doi.org/10.4141/CJSS2012-060, 2013.
Fu, Q., Zhao, H., Li, T., Hou, R., Liu, D., Ji, Y., Zhou, Z., and Yang, L.: Effects of biochar addition on soil hydraulic properties before and after freezing-thawing, Catena, 176, 112–124, https://doi.org/10.1016/j.catena.2019.01.008, 2019.
Gao, B., Yang, D., Qin, Y., Wang, Y., Li, H., Zhang, Y., and Zhang, T.: Change in frozen soils and its effect on regional hydrology, upper Heihe basin, northeastern Qinghai–Tibetan Plateau, The Cryosphere, 12, 657–673, https://doi.org/10.5194/tc-12-657-2018, 2018.
Gao, H. and Shao, M.: Effects of temperature changes on soil hydraulic properties, Soil Till. Res., 153, 145-154, https://doi.org/10.1016/j.still.2015.05.003, 2015.
Gardner, W.: Some steady-state solutions of the unsaturated moisture flow equation with application to evaporation from a water table, Soil Sci., 85, 228–232, https://doi.org/10.1097/00010694-195804000-00006, 1958.
Granger, R. J., Gray, D. M., and Dyck, G. E.: Snowmelt infiltration to frozen Prairie soils, Can. J. Earth Sci., 21, 669–677, https://doi.org/10.1139/e84-073, 1984.
Grevers, M., Jong, E. D., and St. Arnaud, R.: The characterization of soil macroporosity with CT scanning, Can J Soil Sci., 69, 629–637, https://doi.org/10.4141/cjss89-062, 1989.
Harlan, R.: Analysis of coupled heat-fluid transport in partially frozen soil, Water Resour. Res., 9, 1314–1323, https://doi.org/10.1029/WR009i005p01314, 1973.
Hayashi, M.: The Cold Vadose Zone: Hydrological and Ecological Significance of Frozen-Soil Processes, Vadose Zone J., 12, 1–8, https://doi.org/10.2136/vzj2013.03.0064, 2013.
Hayashi, M., van der Kamp, G., and Schmidt, R.: Focused infiltration of snowmelt water in partially frozen soil under small depressions, J. Hydrol., 270, 214–229, https://doi.org/10.1016/S0022-1694(02)00287-1, 2003.
Holten, R., Be, F. N., Almvik, M., Katuwal, S., and Eklo, O. M.: The effect of freezing and thawing on water flow and MCPA leaching in partially frozen soil, J. Contam. Hydrol., 219, 72–85, 2018.
Hussen, A. and Warrick, A.: Alternative analyses of hydraulic data from disc tension infiltrometers, Water Resour. Res., 29, 4103–4108, https://doi.org/10.1029/93WR02404, 1993.
Jame, Y. W. and Norum, D. I.: Heat and mass transfer in a freezing unsaturated porous medium, Water Resour. Res., 16, 811–819, 1980.
Jarvis, N.: A review of non-equilibrium water flow and solute transport in soil macropores: Principles, controlling factors and consequences for water quality, Eur. J. Soil Sci., 58, 523–546, https://doi.org/10.1111/j.1365-2389.2007.00915.x, 2007.
Jarvis, N., Koestel, J., and Larsbo, M.: Understanding Preferential Flow in the Vadose Zone: Recent Advances and Future Prospects, Vadose Zone J., 15, 1–11, https://doi.org/10.2136/vzj2016.09.0075, 2016.
Jiang, R.: Data for “Soil infiltration characteristics and pore distribution under freezing-thawing condition” .xlsx. figshare, Dataset, https://doi.org/10.6084/m9.figshare.12965123.v4, 2020.
Konrad, J.-M. and Morgenstern, N. R.: A mechanistic theory of ice lens formation in fine-grained soils, Can. Geotech. J., 17, 473–486, https://doi.org/10.1139/t80-056, 1980.
Land Administrative Bureau of Heilongjiang Province: Heilongjiang soil, Agriculture Press, Beijing, 1992.
Lavelle, P., Decaëns, T., Aubert, M., Barot, S. B., Blouin, M., Bureau, F., Margerie, P., Mora, P., and Rossi, J.-P.: Soil invertebrates and ecosystem services, Eur. J. Soil Biol., 42, S3–S15, https://doi.org/10.1016/j.ejsobi.2006.10.002, 2006.
Lewis, J. and Sjöstrom, J.: Optimizing the experimental design of soil columns in saturated and unsaturated transport experiments, J. Contam. Hydrol., 115, 1–13, 2010.
Lipiec, J., Kuś, J., Słowińska-Jurkiewicz, A., and Nosalewicz, A.: Soil porosity and water infiltration as influenced by tillage methods, Soil Till. Res., 89, 210–220, https://doi.org/10.1016/j.still.2005.07.012, 2006.
Lu, N. and Likos, W. J.: Unsaturated soil mechanics, Wiley, Hoboken, 2004.
Lundin, L.-C.: Hydraulic properties in an operational model of frozen soil, J. Hydrol., 118, 289–310, https://doi.org/10.1016/0022-1694(90)90264-X, 1990.
Luxmoore, R.: Micro-, meso-, and macroporosity of soil, Soil Sci. Soc. Am. J., 45, 671–672, https://doi.org/10.2136/sssaj1981.03615995004500030051x, 1981.
McCauley, C. A., White, D. M., Lilly, M. R., and Nyman, D. M.: A comparison of hydraulic conductivities, permeabilities and infiltration rates in frozen and unfrozen soils, Cold Reg. Sci. Technol., 34, 117–125, https://doi.org/10.1016/S0165-232X(01)00064-7, 2002.
Mohammed, A. A., Kurylyk, B. L., Cey, E. E., and Hayashi, M.: Snowmelt infiltration and macropore flow in frozen soils: Overview, knowledge gaps, and a conceptual framework, Vadose Zone J., 17, 1–15, https://doi.org/10.2136/vzj2018.04.0084, 2018.
Mohammed, A. A., Pavlovskii, I., Cey, E. E., and Hayashi, M.: Effects of preferential flow on snowmelt partitioning and groundwater recharge in frozen soils, Hydrol. Earth Syst. Sci., 23, 5017–5031, https://doi.org/10.5194/hess-23-5017-2019, 2019.
Nimmo, J. R.: Theory for Source-Responsive and Free-Surface Film Modeling of Unsaturated Flow, Vadose Zone J., 9, 295–306, https://doi.org/10.2136/vzj2009.0085, 2010.
Nimmo, J. R.: Preferential flow occurs in unsaturated conditions, Hydrol. Process., 26, 786–789, https://doi.org/10.1002/hyp.8380, 2012.
Nixon, J.: Discrete ice lens theory for frost heave in soils, Can. Geotech. J., 28, 843–859, https://doi.org/10.1139/t91-102, 1991.
Oswald, S., Kinzelbach, W., Greiner, A., and Brix, G.: Observation of flow and transport processes in artificial porous media via magnetic resonance imaging in three dimensions, Geoderma, 80, 417–429, https://doi.org/10.1016/S0016-7061(97)00064-5, 1997.
Oztas, T. and Fayetorbay, F.: Effect of freezing and thawing processes on soil aggregate stability, Catena, 52, 1–8, https://doi.org/10.1016/S0341-8162(02)00177-7, 2003.
Peng, X., Frauenfeld, O. W., Cao, B., Wang, K., Wang, H., Su, H., Huang, Z., Yue, D., and Zhang, T.: Response of changes in seasonal soil freeze/thaw state to climate change from 1950 to 2010 across china, J. Geophys. Res.-Earth Surf., 121, 1984–2000, https://doi.org/10.1002/2016JF003876, 2016.
Perroux, K. M. and White, I.: Designs for Disc Permeameters, Soil Sci. Soc. Am. J., 52, 1205–1215, https://doi.org/10.2136/sssaj1988.03615995005200050001x, 1988.
Pittman, F., Mohammed, A., and Cey, E.: Effects of antecedent moisture and macroporosity on infiltration and water flow in frozen soil, Hydrol. Process., 34, 795–809, https://doi.org/10.1002/hyp.13629, 2020.
Smith, M.: Observations of soil freezing and frost heave at Inuvik, Northwest Territories, Canada, Can. J. Earth Sci., 22, 283–290, https://doi.org/10.1016/0148-9062(85)90073-7, 1985.
Spaans, E. J.: The soil freezing characteristic: Its measurement and similarity to the soil moisture characteristic, PhD thesis, Department of Soil Science, University of Minnesota, St. Paul, 126 pp., 1994.
Spaans, E. J. and Baker, J. M.: The soil freezing characteristic: Its measurement and similarity to the soil moisture characteristic, Soil Sci. Soc. Am. J., 60, 13–19, https://doi.org/10.2136/sssaj1996.03615995006000010005x, 1996.
Stadler, D., Stähli, M., Aeby, P., and Flühler, H.: Dye tracing and image analysis for quantifying water infiltration into frozen soils, Soil Sci. Soc. Am. J., 64, 505–516, https://doi.org/10.2136/sssaj2000.642505x, 2000.
Stadler, D., Flühler, H., and and Jansson, P.-E.: Modelling vertical and lateral water flow in frozen and sloped forest soil plots, Cold Reg. Sci. Technol., 26, 181–194, https://doi.org/10.1016/S0165-232X(97)00017-7, 1997.
Stähli, M., Bayard, D., Wydler, H., and Flühler, H.: Snowmelt Infiltration into Alpine Soils Visualized by Dye Tracer Technique, Arct. Antarct. Alp. Res., 36, 128–135, https://doi.org/10.1657/1523-0430(2004)036[0128:SIIASV]2.0.CO;2, 2004.
Taina, I. A., Heck, R. J., Deen, W., and Ma, E. Y.: Quantification of freeze–thaw related structure in cultivated topsoils using X-ray computer tomography, Can. J. Soil Sci., 93, 533–553, https://doi.org/10.4141/CJSS2012-044, 2013.
Tarnawski, V. R. and Wagner, B.: On the prediction of hydraulic conductivity of frozen soils, Can. Geotech. J., 33, 176–180, https://doi.org/10.1139/t96-033, 1996.
van der Kamp, G., Hayashi, M., and Gallén, D.: Comparing the hydrology of grassed and cultivated catchments in the semi-arid Canadian prairies, Hydrol. Process., 17, 559–575, https://doi.org/10.1002/hyp.1157, 2003.
Wan, X., and Yang, Z. J.: Pore water freezing characteristic in saline soils based on pore size distribution, Cold Reg. Sci. Technol., 173, 103030.103031-103030.103012, 2020.
Wang, D., Yates, S., and Ernst, F.: Determining soil hydraulic properties using tension infiltrometers, time domain reflectometry, and tensiometers, Soil Sci. Soc. Am. J., 62, 318–325, https://doi.org/10.2136/sssaj1998.03615995006200020004x, 1998.
Wang, X., Chen, R., Liu, G., Yang, Y., Song, Y., Liu, J., Liu, Z., Han, C., Liu, X., Guo, S., Wang, L., and Zheng, Q.: Spatial distributions and temporal variations of the near-surface soil freeze state across China under climate change, Glob. Planet. Change, 172, 150–158, https://doi.org/10.1016/j.gloplacha.2018.09.016, 2019.
Watanabe, K. and Flury, M.: Capillary bundle model of hydraulic conductivity for frozen soil, Water Resour. Res., 44, W12402, https://doi.org/10.1029/2008WR007012, 2008.
Watanabe, K. and Kugisaki, Y.: Effect of macropores on soil freezing and thawing with infiltration, Hydrol. Process., 31, 270–278, https://doi.org/10.1002/hyp.10939, 2017.
Watanabe, K. and Osada, Y.: Simultaneous measurement of unfrozen water content and hydraulic conductivity of partially frozen soil near 0 C, Cold Reg. Sci. Technol., 142, 79–84, https://doi.org/10.1016/j.coldregions.2017.08.002, 2017.
Watanabe, K. and Wake, T.: Hydraulic conductivity in frozen unsaturated soil, Proceedings of the 9th International Conference on Permafrost, Fairbanks, Alaska, USA, 29 June–3 July 2008, 1927–1932, 2008.
Watanabe, K., Kito, T., Dun, S., Wu, J. Q., Greer, R. C., and Flury, M.: Water infiltration into a frozen soil with simultaneous melting of the frozen layer, Vadose Zone J., 12, vzj2011.0188, https://doi.org/10.2136/vzj2011.0188, 2013.
Watson, K. and Luxmoore, R.: Estimating macroporosity in a forest watershed by use of a tension infiltrometer, Soil Sci. Soc. Am. J., 50, 578–582, https://doi.org/10.2136/sssaj1986.03615995005000030007x, 1986.
Williams, P. and Burt, T.: Measurement of hydraulic conductivity of frozen soils, Can. Geotech. J., 11, 647–650, https://doi.org/10.1139/t74-066, 1974.
Williams, P. J. and Smith, M. W.: The frozen earth: fundamentals of geocryology, Cambridge University Press, 1989.
Wilson, G. and Luxmoore, R.: Infiltration, macroporosity, and mesoporosity distributions on two forested watersheds, Soil Sci. Soc. Am. J., 52, 329–335, https://doi.org/10.2136/sssaj1988.03615995005200020005x, 1988.
Wooding, R.: Steady infiltration from a shallow circular pond, Water Resour. Res., 4, 1259–1273, https://doi.org/10.1029/WR004i006p01259, 1968.
Zhao, Y., Nishimura, T., Hill, R., and Miyazaki, T.: Determining hydraulic conductivity for air-filled porosity in an unsaturated frozen soil by the multistep outflow method, Vadose Zone J., 12, 1–10, https://doi.org/10.2136/vzj2012.0061, 2013.