the Creative Commons Attribution 4.0 License.
the Creative Commons Attribution 4.0 License.
 | 13 Feb 2020
Supra-glacial debris cover changes in the Greater Caucasus from 1986 to 2014
Tobias Bolch
Roger D. Wheate
Stanislav S. Kutuzov
Ivan I. Lavrentiev
Michael Zemp
Knowledge of supra-glacial debris cover and its changes remain incomplete in the Greater Caucasus, in spite of recent glacier studies. Here we present data of supra-glacial debris cover for 659 glaciers across the Greater Caucasus based on Landsat and SPOT images from the years 1986, 2000 and 2014. We combined semi-automated methods for mapping the clean ice with manual digitization of debris-covered glacier parts and calculated supra-glacial debris-covered area as the residual between these two maps. The accuracy of the results was assessed by using high-resolution Google Earth imagery and GPS data for selected glaciers. From 1986 to 2014, the total glacier area decreased from 691.5±29.0 to 590.0±25.8 km2 (15.8±4.1 %, or ∼0.52 % yr−1), while the clean-ice area reduced from 643.2±25.9 to 511.0±20.9 km2 (20.1±4.0 %, or ∼0.73 % yr−1). In contrast supra-glacial debris cover increased from 7.0±6.4 %, or 48.3±3.1 km2, in 1986 to 13.4±6.2 % (∼0.22 % yr−1), or 79.0±4.9 km2, in 2014. Debris-free glaciers exhibited higher area and length reductions than debris-covered glaciers. The distribution of the supra-glacial debris cover differs between the northern and southern and between the western, central and eastern Greater Caucasus. The observed increase in supra-glacial debris cover is significantly stronger on the northern slopes. Overall, we have observed up-glacier average migration of supra-glacial debris cover from about 3015 to 3130 m a.s.l. (metres above sea level) during the investigated period.
- Article
(7414 KB) - Full-text XML
- Companion paper 1
- Companion paper 2
-
Supplement
(16731 KB) - BibTeX
- EndNote


Supra-glacial debris cover affects surface melt with increasing ablation in cases of thin debris cover (less than a few cm) or decreasing ablation under continuous thick debris cover (Östrem, 1959; Nicholson et al., 2018). Obtaining information about debris cover is relevant not only with respect to its impact on glacier ablation but also because it is an important part of the sediment transport system (supra-glacial, englacial and subglacial) in cold and high mountains (Kellerer-Pirklbauer, 2008), which ultimately affect the overall dynamics and mass balance of the glaciers. Several studies show an increase in debris-covered area with overall glacier shrinkage and mass loss (Deline, 2005; Stokes et al., 2007; Kirkbride and Deline; 2013; Glasser et al., 2016).
For regions where the local population is dependent on glacial meltwater supply, detailed knowledge of glacial hydrology is important to ensure the sustainable use of water resources (Baraer et al., 2012). One difficulty of such investigations is associated with limited knowledge of the large-scale extent, thickness and properties of the supra-glacial debris cover. Field measurements of debris layers have practical difficulties on a large scale, and methods for estimating supra-glacial debris thickness using remote sensing and modelling remain in development (Zhang et al., 2016; Rounce et al., 2018). Several studies have also reported the role of debris cover in promoting the formation of supra-glacial lakes (Thompson et al., 2016; Jiang et al., 2018), which are directly related to glacial hazards (Benn et al., 2012). Therefore, it is necessary to take supra-glacial debris cover into account when assessing temporal change of mountain glaciers.
Ice and snow melt in the Greater Caucasus are major sources of runoff for populated places in many parts of the Caucasus region (Tielidze, 2017). Previous studies have also shown that in this region, supra-glacial debris cover is an important control for ice ablation (Lambrecht et al., 2011) and a component in glacier mass balance (Popovnin and Rozova, 2002). Thus, correct delineation of supra-glacial debris cover in the Greater Caucasus is vital in correctly modelling future glacier development. A recent global study (Scherler et al., 2018) concluded that supra-glacial debris cover is abundant in the Caucasus and Middle East (more than 25 % of glacier area) and that the Caucasus shows the highest percentage of supra-glacial debris cover worldwide. However, earlier studies indicated lower relative supra-glacial debris cover than our study in the Greater Caucasus but are restricted to smaller regions (Stokes et al., 2007) or individual glaciers (Lambrecht et al., 2011; Popovnin et al., 2015). Scherler et al. (2018) used the glacier outlines from the Randolph Glacier Inventory (RGI) v6 database (RGI Consortium, 2017), with some geolocation errors and nominal glaciers representing glacier area by an ellipse and included in the RGI to achieve global coverage in case no other information was available (Pfeffer et al., 2014). Hence, there is a clear need to provide an improved estimate of supra-glacial debris cover and its changes for this region.
Based on a recently published glacier inventory (Tielidze and Wheate, 2018), we present the first regional assessment of the spatial distribution of supra-glacial debris cover and related glacier changes between 1986, 2000 and 2014 for the Greater Caucasus.
The Greater Caucasus is one of the world's highest mountain systems and the major mountain unit of the Caucasus region, containing about 96 % of the contemporary glacier area of the Caucasus and Middle East glacier region, according to the RGI (Pfeffer et al., 2014). The range stretches for about 1300 km from west–northwest to east–southeast, between the Taman Peninsula of the Black Sea and the Absheron Peninsula of the Caspian Sea. Using morphological and morphometric characteristics, the Greater Caucasus can be divided into three parts – western, central and eastern. Moreover, the Greater Caucasus can also be subdivided into the northern and southern part according to the location relative to the main crest of the range (Fig. 1). The central Greater Caucasus is the highest part of the main range, represented by the following summits exceeding 5000 m a.s.l.: Dykh-Tau – 5205 m, Shkhara – 5203 m, Jangha (Dzhangi-Tau) – 5058 m – and Pushkin Peak – 5034 m. The western and eastern sections are relatively low, with highest the summits of Mt. Dombai-Ulgen (4046 m) and Mt. Bazardüzü (4466 m) respectively. Contemporary glaciers are concentrated mostly along the main mountain range as well as in the subranges of the Greater Caucasus and separate massifs such as Elbrus and Kazbegi–Jimara (Fig. 1). Elbrus is a separate dormant volcanic mountain on the border between the western and central Greater Caucasus, about 10 km north from the main watershed divide. It is the highest summit of the region, with two peaks – western (5642 m) and eastern (5621 m).
According to the recent inventory (Tielidze and Wheate, 2018), this mountain range contains over 2000 glaciers, with a total area of about 1200 km2. The northern slopes of the Greater Caucasus contain more glaciers than the southern slopes. The altitude of the glacier equilibrium line (ELA) increases from 2500–2700 m in the west to 3700–3950 m in the eastern sector of the northern slope of the Greater Caucasus (Mikhalenko et al., 2015). The ELA was determined to range from ∼3030 m in the west to ∼3480 m in the eastern section of the southern slope of the Greater Caucasus (Tielidze, 2016). The ELA is ∼1000 m higher on the northern slopes of the Elbrus than the southern slopes of the central Greater Caucasus (Mikhalenko et al., 2015).
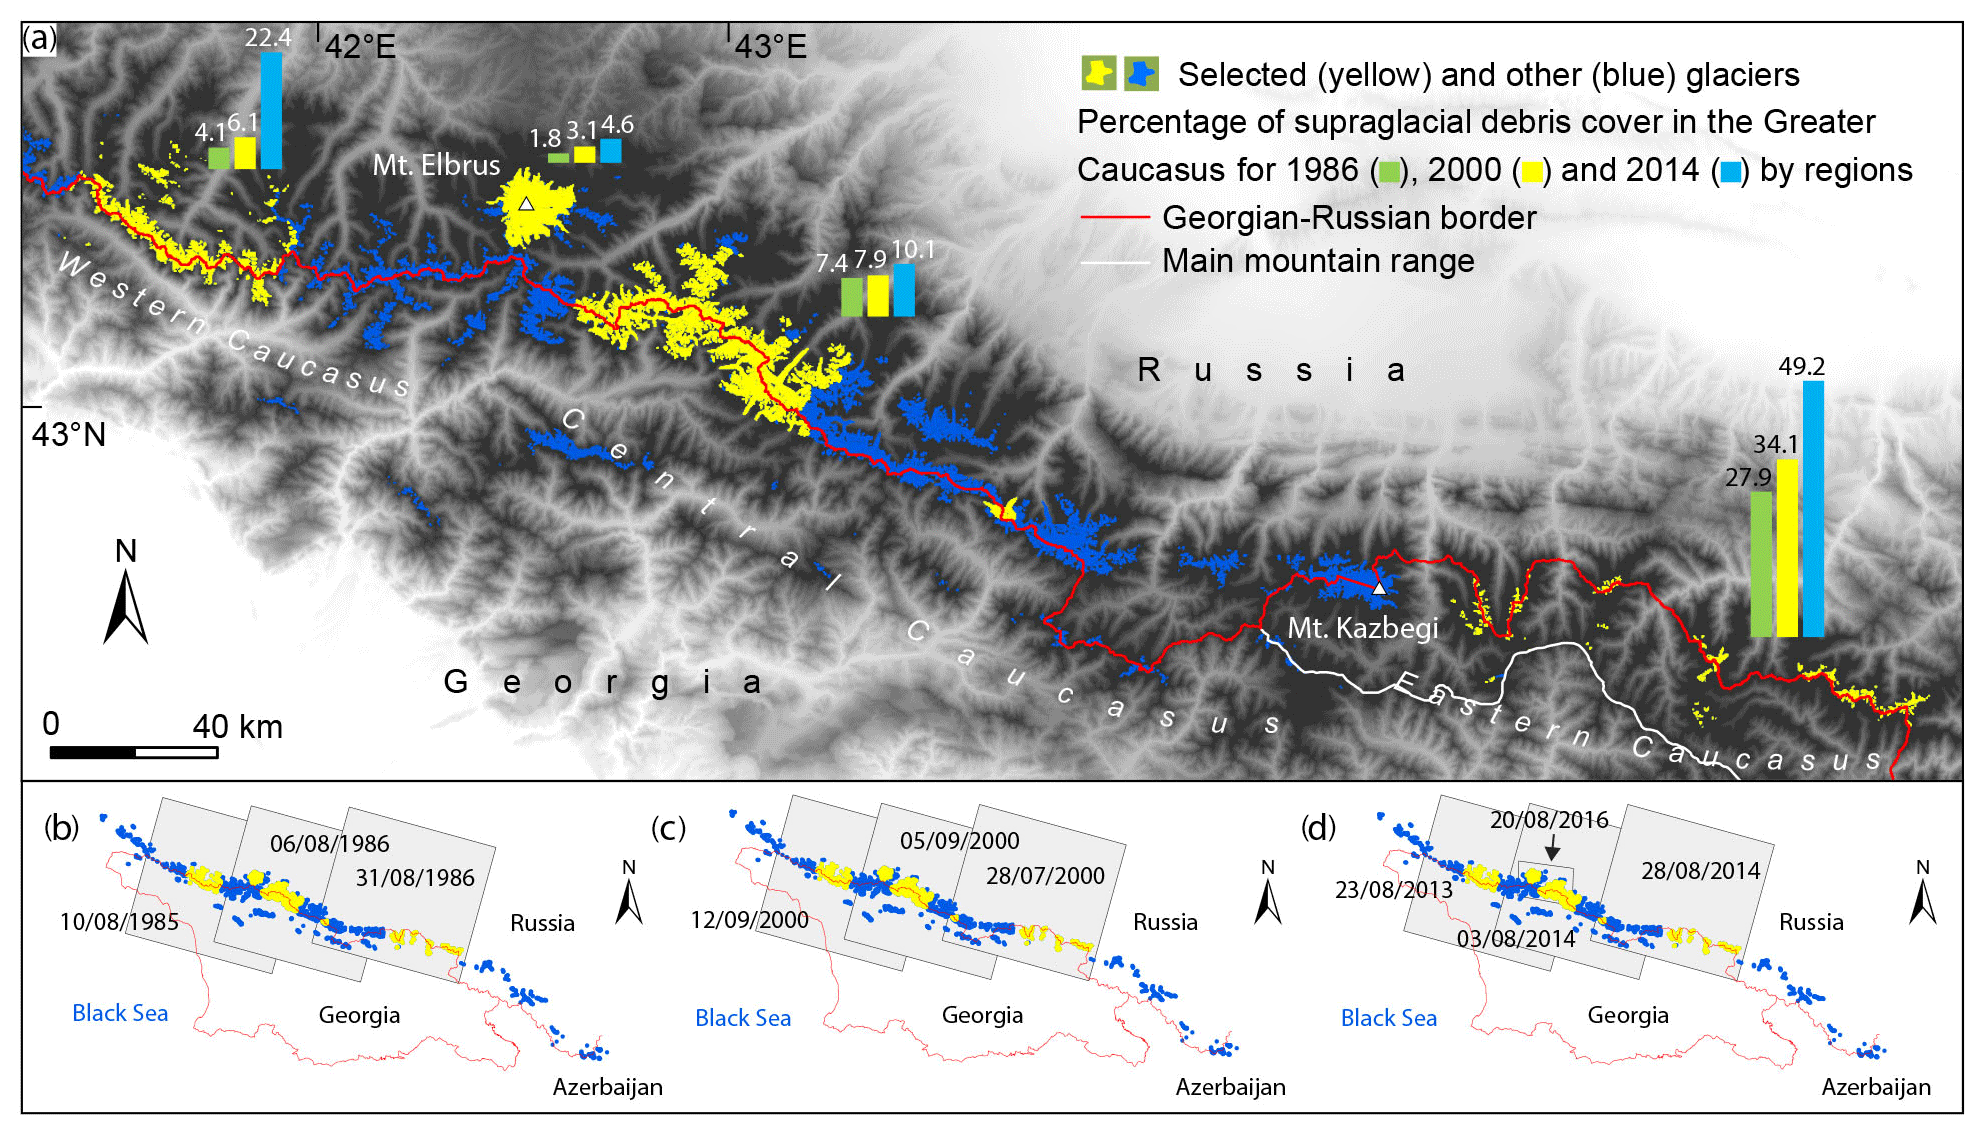
Figure 1(a) Investigated area and selected glaciers by regions. (b) Three Landsat 5 Thematic Mapper (TM) satellite scenes from 1985 to 1986. (c) Three Landsat 7 Enhanced Thematic Mapper Plus (ETM+) satellite scenes from 2000. (d) Three Landsat 8 Operational Land Imager (OLI) satellite scenes from 2013 to 2014 and one (smaller) SPOT satellite scene from 2016.
As the Greater Caucasus range forms the boundary between temperate and subtropical climatic zones, the orientation and height of the range determine the contrasts between the northern and southern slopes. The mean annual temperatures at the northern slopes are usually 1–2 ∘C cooler than those in the south (Tielidze and Wheate, 2018). The average regional lapse rate is minimum in winter (−2.3 ∘C per 1000 m) and maximum (−5.2 ∘C per 1000 m) in summer (Kozachek et al., 2017).
Annual precipitation varies between 2000 and 2500 mm in the west and declines to 800 and 1150 mm in the east on the northern slope. The central section of the southern slope receives over 2000 mm of precipitation, while in the east, the annual total is 1000 mm. The southwestern section of the region is humid, with annual precipitation of about 3200 mm (Volodicheva, 2002; Mikhalenko et al., 2015). The southwestern slopes of the Greater Caucasus experience heavy snowfall and snow avalanches (from November to April). Snow cover may reach 5–7 m in several regions of the western part of the Greater Caucasus, such as the Upper Svaneti and northern Abkhazeti regions in Georgia (Sylvén et al., 2008).
3.1 Data sets
We selected 659 glaciers, with a total area of 590.0±25.8 km2 (based on the Greater Caucasus Glacier Inventory and representing the year 2014; Tielidze and Wheate, 2018): 223 glaciers in the western Greater Caucasus (145 – northern slope, 78 – southern slope), 285 in the central Greater Caucasus (173 – northern slope, 112 – southern slope), and 130 in the eastern Greater Caucasus (130 – northern slope, 0 – southern slope). In addition, all 21 glaciers on Elbrus (5 – northern slope, 8 – southern slope, 5 – western slope, 3 – eastern slope) – the largest glacierized massif in the whole region – were selected (Fig. 1a). Overall, this equals 49.5 % and 32.6 % of the Greater Caucasus total glacier area and number respectively. The size of the selected glaciers varied between 37.5 and 0.01 km2.
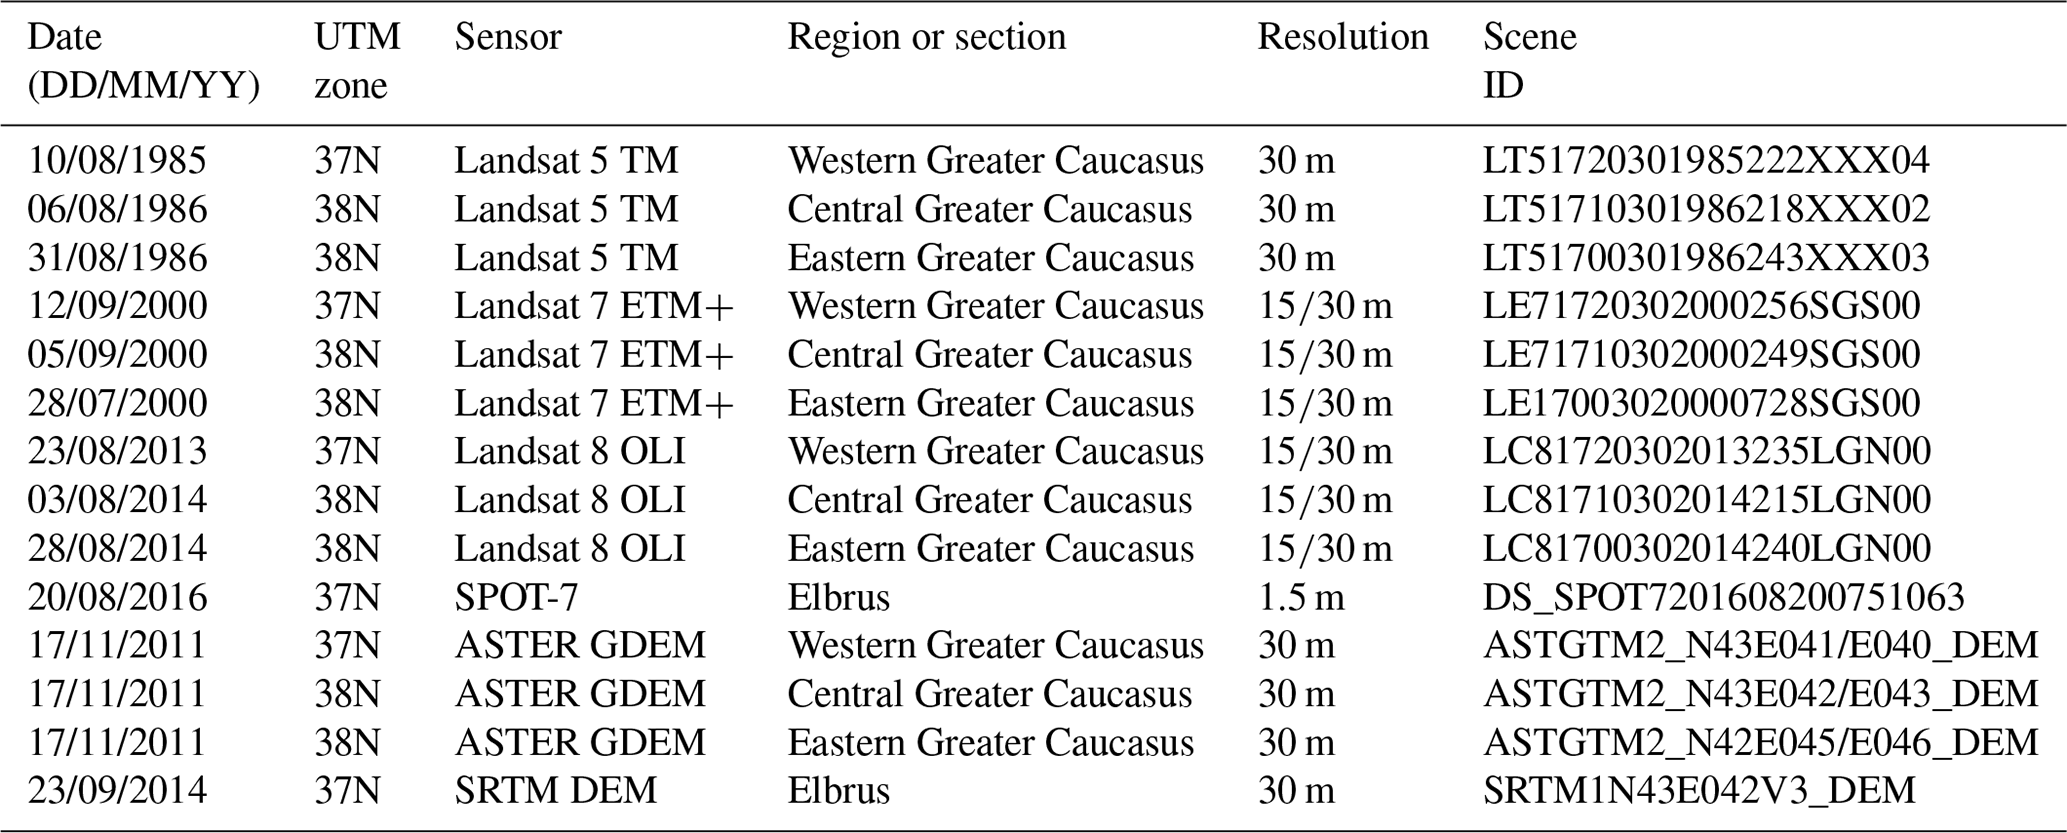
A total of nine Landsat images were used in this study (Fig. 1b–d; Table 1), downloaded from the EarthExplorer website (http://earthexplorer.usgs.gov/, last access: 5 August 2017). We also used an orthorectified high-resolution (spatial resolution 1.5 m) SPOT-7 satellite image from 2016 and the Shuttle Radar Topography Mission Digital Elevation Model (SRTM DEM 30 m; Table 1). The Landsat scenes served as a basis for supra-glacial debris cover assessment, while the SPOT image was used for corrections of supra-glacial debris-covered areas of Elbrus. All imagery was captured between 28 July and 12 September, when glacier tongues were mostly free of seasonal snow under cloud-free conditions.
The Advanced Spaceborne Thermal Emission and Reflection Radiometer (ASTER) Global Digital Elevation Model (GDEM; 30 m), version 2 (https://asterweb.jpl.nasa.gov/gdem.asp, last access: 13 July 2017), was used to measure the mean upper limit of the supra-glacial debris cover and to calculate supra-glacial debris cover by 500 m elevation bands. We used these elevation bands to intersect our digitized debris-covered areas for 1985–1986 to 2013–2014, with the total area per elevation band. Further data sets used in this study include high-resolution images from Google Earth and GPS measurements.
Table 1Satellite images and digital elevation models used in this study.
3.2 Methods
The widely used band ratio segmentation method (red : shortwave infrared, with a threshold of ≥2.0) was used as the first step in delineating clean-ice outlines for 2014 (Bolch et al., 2010; Paul et al., 2013) followed by intensive manual improvements (removing misclassified areas, e.g. due to snow and shadows). In the next step supra-glacial debris cover was classified as the residual between these semi-automatically derived clean-ice outlines and the existing manually mapped outlines which include the debris-covered parts (cf. Tielidze and Wheate, 2018; Fig. 2a). To assess temporal change, we calculated the area of supra-glacial debris cover for individual glaciers in a similar way to the earlier years, 1986 and 2000.
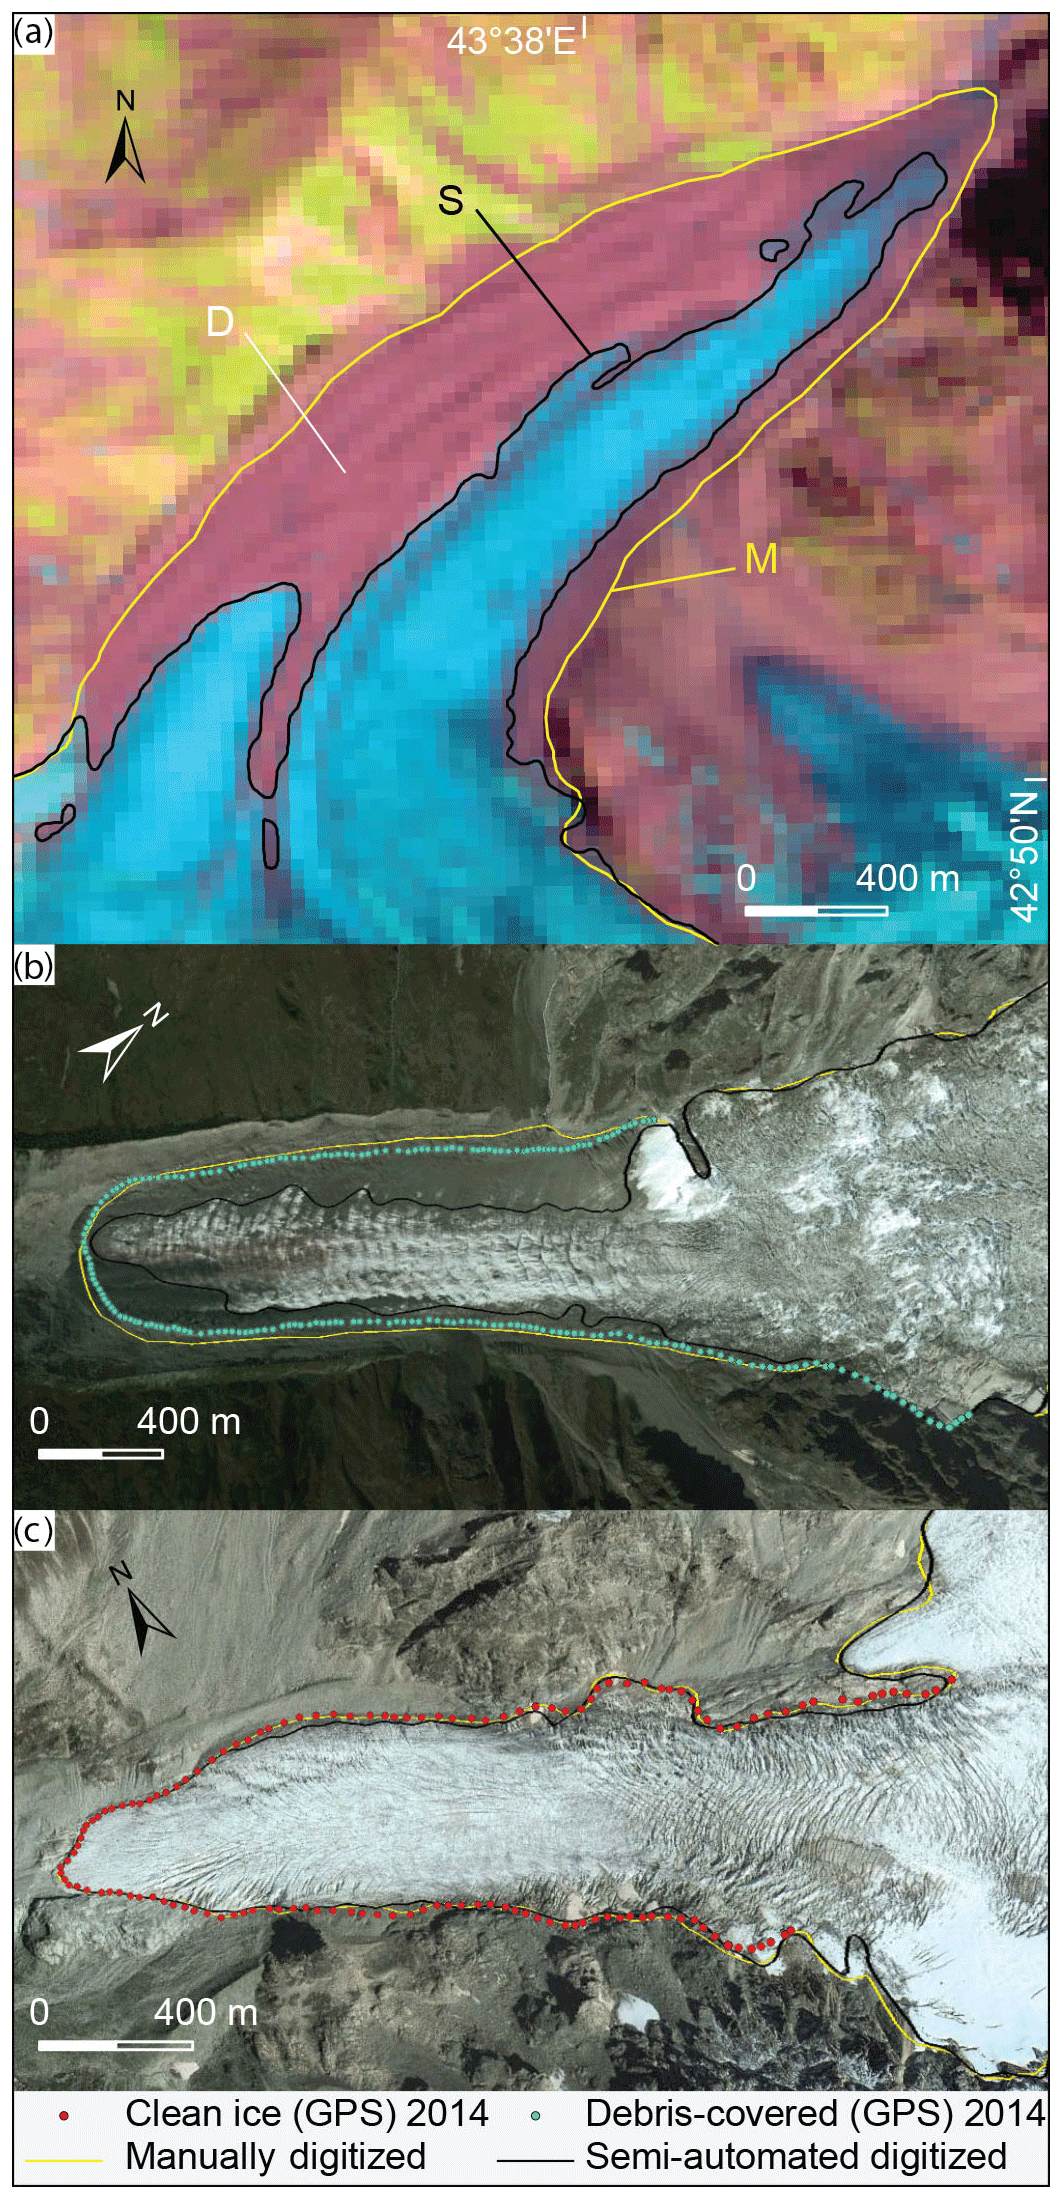
Figure 2Mapping examples: (a) supra-glacial debris cover (D) assessment with comparison of different methods – fully manual mapping (M) and semi-automated mapping (S; ratio TM 3 / 5 threshold ≥2.0 followed by manual improvement). The Landsat image from 6 August 1986 is shown in the background. Examples of glacier outline accuracy assessment by GPS measurements: (b) Adishi Glacier and (c) Kirtisho Glacier. A Google Earth image from 19 September 2011 is shown in the background.
We used the Glacier Classification Guidance from the Global Land Ice Measurements from Space (GLIMS) initiative for remote-sensing observations (Rau et al., 2005) to define debris-free and debris-covered glaciers. According to this guideline we consider all glaciers with a debris coverage of more than 10 % to be debris-covered and otherwise to be debris-free glaciers.
The buffer method (Granshaw and Fountain, 2006; Bolch et al., 2010) was used for uncertainty estimation for both clean-ice and debris-covered glacier parts. For clean ice we used a 15 m (1∕2 pixel) buffer (Bolch et al., 2010), and for debris-covered parts, we used a 60 m (two pixels; Frey et al., 2012) buffer. We used the standard deviation of the uncertainty distribution for the estimate following Mölg et al. (2018), as a normal distribution can be assumed for this type of mapping error. This method is applied to glacier complexes excluding overlapping areas as well as to the boundary between clean-ice and debris-covered ice of the same glacier. The calculated uncertainty for the clean-ice and debris-covered parts was on average 4.0 % and 6.4 % for 1986, 4.1 % and 6.3 % for 2000, and 4.1 % and 6.2 % respectively for 2014. The uncertainty estimates for all Caucasus glaciers are described in previous studies (Tielidze, 2016; Tielidze and Wheate, 2018).
As an independent assessment of these uncertainty estimates, three randomly selected glacier outlines from the Landsat 8 (3 August 2014; including clean-ice and debris-covered parts) were imported into Google Earth and manually adjusted using the available high-resolution QuickBird images (19 September 2011) superimposed upon the SRTM3 topography (Raup et al., 2014). These glacier outlines were then compared with original outlines from Landsat 8 image (3 August 2014). The area differences between the two resulting sets of outlines were ±5.2 % for supra-glacial debris cover and ±3.4 % for clean ice, which confirms our uncertainty estimate based on the buffer method. For Elbrus the high-resolution SPOT-7 image was used to estimate an extra uncertainty of the clean-ice and debris-covered area. The area difference between SPOT-7 and Landsat 8 outlines was ±7.4 % for supra-glacial debris cover and ±4.1 % for clean ice.
An additional uncertainty assessment was performed using GPS (Garmin 62stc) measurements of glacier margins (>1200 points) obtained during field investigations in 2014. In total seven glaciers (Ushba, Chalaati, Lekhziri, Adishi, Shkhara, Zopkhito, Kirtisho) were surveyed. The horizontal accuracy of these measurements varied from ±4 to ±10 m; Fig. 2b–c show the results of comparison between GPS measurements and Landsat-based supra-glacial debris-covered and clean-ice outlines. The average accuracy based on all seven glacier measurements was ±30 m for supra-glacial debris cover and ±15 m for clean ice, hence again confirming the suitability of the selected buffer method.
We found an absolute increase in supra-glacial debris cover for all investigated glaciers, from 48.3±3.1 km2 in 1986 to 54.6±3.4 km2 in 2000 and 79.0±4.9 km2 in 2014, in contrast to a reduction of the total glacier area. This equates to a total increase in the proportion of supra-glacial debris-covered surface area from 7.0±6.4 % in 1986 to 9.1±6.3 % in 2000 and to 13.4±6.2 % in 2014 (Table 2; Fig. 3). Supra-glacial debris cover was highest in the glacier area classes 1.0–5.0 and 5.0–10.0 km2 for both northern and southern slopes (Fig. S1 in the Supplement). The number of debris-covered glaciers (i.e. with an areal percentage of debris larger than 10 % – see Methods) also increased from 122 in 1986 to 143 in 2000 and to 172 in 2014.
For all regions investigated in the Greater Caucasus the rate of increase in supra-glacial debris cover varied between northern and southern slopes and between the western, central and eastern sections of the mountain range (Table 2; Figs. 3, 4). The western Greater Caucasus experienced a supra-glacial debris-covered area increase from 4.1±6.8 % in 1986 to 22.4±6.4 % in 2014, while the increase was significantly lower in the central Greater Caucasus over the last 30 years – from 7.4±6.3 % to 10.1±6.2 % (Table 2). The eastern Greater Caucasus with fewer glaciers almost doubled in supra-glacial debris cover over the last 30 years, from 27.9±6.2 % to 49.2±5.7 %.
The supra-glacial debris-covered area increased from 13.5±6.3 % to 29.3±6.0 % for all three sections (western, central and eastern) on the northern slope (not including Elbrus) and from 4.0±6.8 % to 9.2±6.9 % on the southern slope of the Greater Caucasus between 1986 and 2014.
The Elbrus Massif contained the smallest percentage of supra-glacial debris cover in all our study regions, but it more than doubled between 1986 and 2014 (from 1.8±6.9 % to 4.6±6.6 %). Supra-glacial debris cover percentage increase and total glacier area decrease were both highest on the eastern slope of the Elbrus between 1986 and 2014 and lowest on the western slope (Fig. 5a–c).
Hypsometric profiles show that supra-glacial debris cover is most commonly found in the 2500–3000 m zone for Elbrus and the 1900–2500 m zone for the other regions (Fig. 6). The supra-glacial debris cover doubled from 6.4 % to 12.2 % (0.21 % yr−1) in the 3000–3500 m zone for all selected glaciers in 1986–2014 (Fig. 6d) and increased in the 3500–4000 m zone for all regions and selected glaciers during the investigated period.
Table 2Supra-glacial debris cover and clean ice in the Greater Caucasus for 1985–1986, 2000 and 2013–2014 by regions and slopes. The error values are derived by a buffer approach.
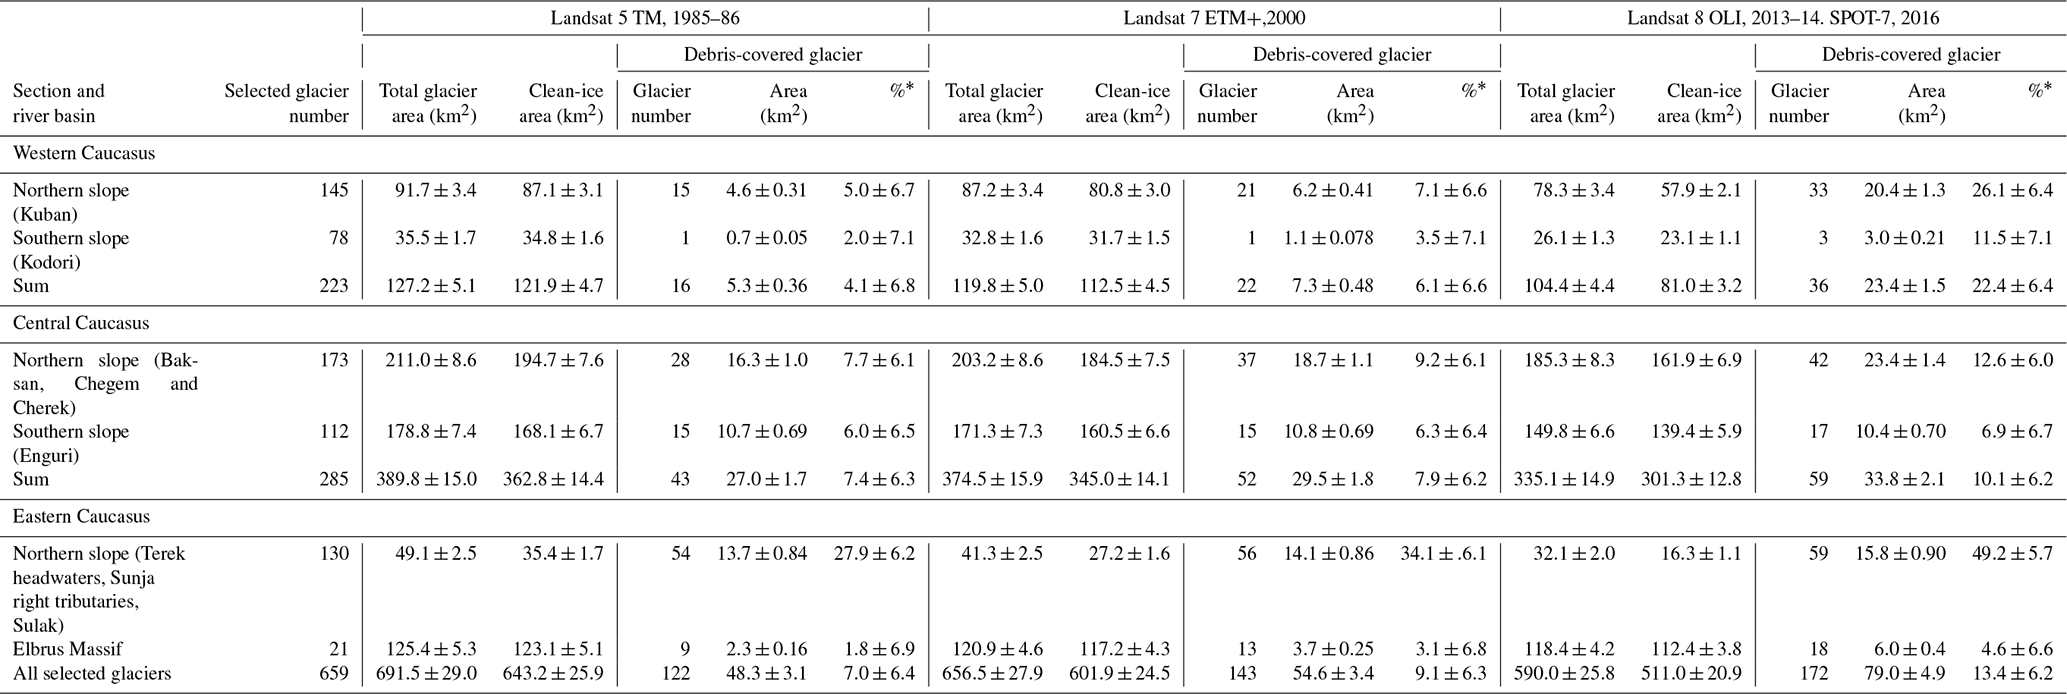
* % of the total glacier area.
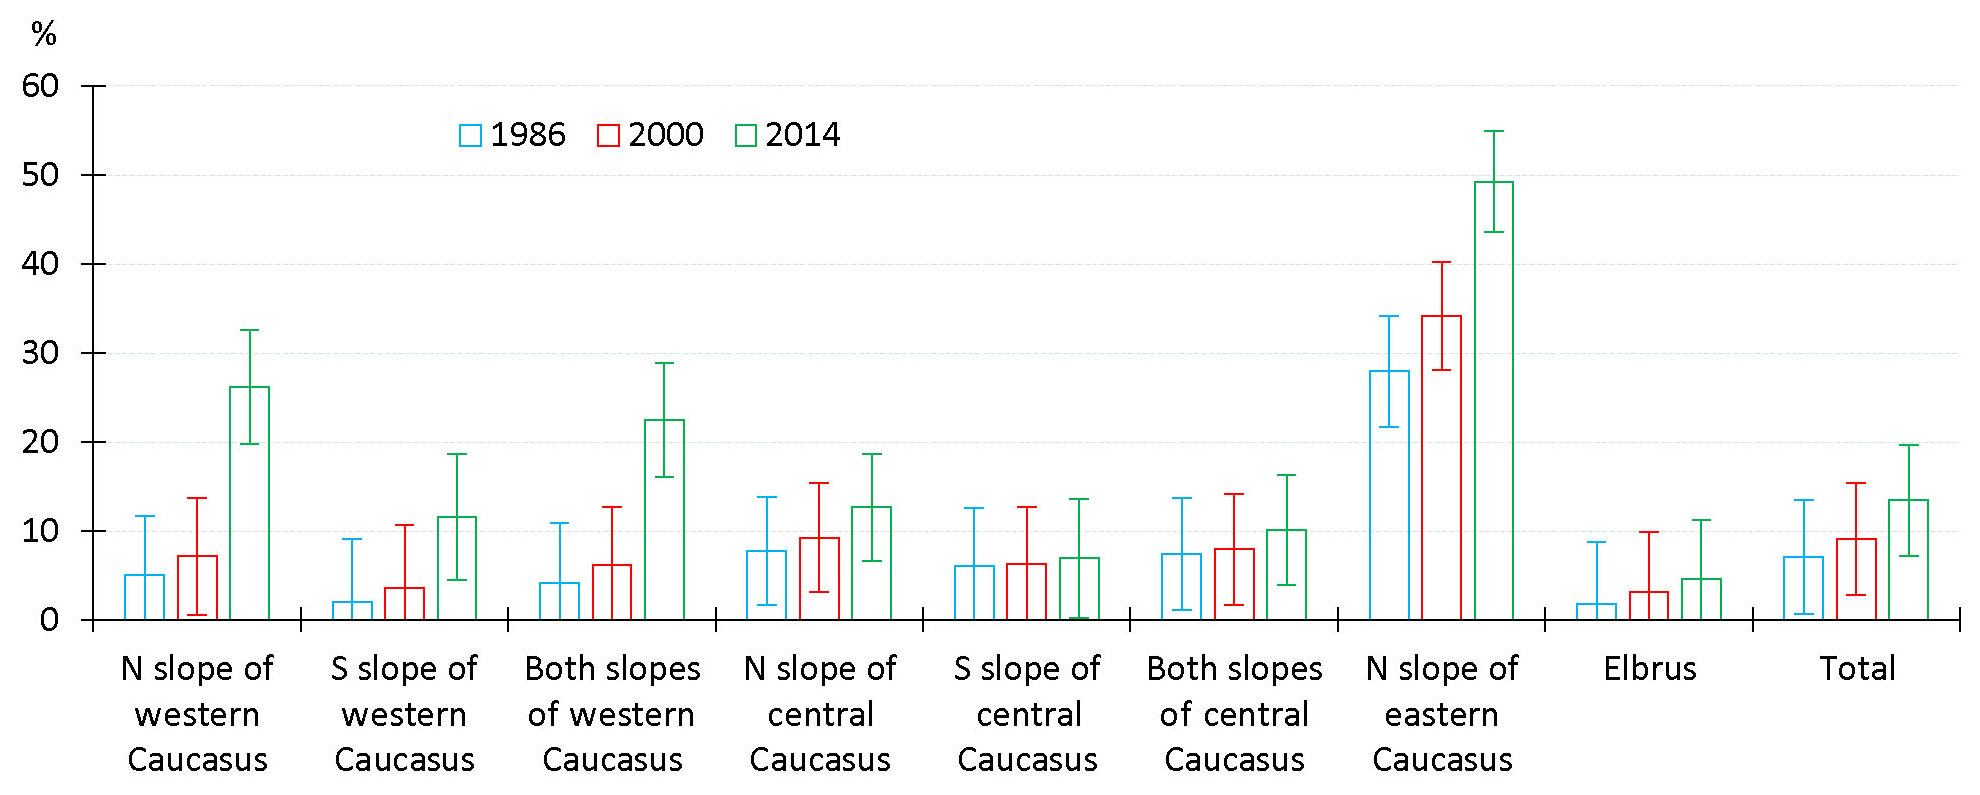
Figure 3Percentage of supra-glacial debris cover in the Greater Caucasus for 1986, 2000 and 2014 by regions (glaciers are non-existent on southern slopes of the eastern Greater Caucasus).
The supra-glacial debris-covered area for (the largest) Bezingi Glacier in the Greater Caucasus increased from 4.4±0.3 km2, or 11.0±5.9 %, to 7.5±0.4 km2, or 20.0±6.0 % (∼0.32 % yr−1), between 1986 and 2014, in contrast with a reduction of the total glacier area from 40.0±0.9 to 37.5±0.9 km2 (6.3±2.2 %, or ∼0.22 % yr−1) during the same period, with a terminus retreat of ∼374 m. Comparison with the debris-free Karaugom Glacier (third-largest glacier of the Greater Caucasus), located in the same region (northern slope of central Greater Caucasus), shows that the percentage of area reduction was almost 3 times greater than for the debris-covered Bezingi Glacier: from 29.2±0.6 to 24.0±0.4 km2 (17.8±2.1 %, or ∼0.63 % yr−1), with a terminus retreat of ∼1366 m (Fig. S2).
The mean upper limit of the supra-glacial debris cover migrated from ∼3015 to ∼3130 m between 1986 and 2014 for all selected glaciers of the Greater Caucasus. The highest mean upper limit lies on the northern slopes of the eastern Greater Caucasus (∼3626 m), while the lowest limit is on the southern slopes of the western Greater Caucasus (∼2850 m). On the Elbrus Massif the mean upper limit of the supra-glacial debris cover migrated from ∼3345 to ∼3520 m between 1986 and 2014 (Fig. 7; Table S1 in the Supplement).
5.1 Comparison with previous investigations
Our results are in agreement with studies assessing changes in supra-glacial debris cover for smaller areas in the Greater Caucasus. For example, Stokes et al. (2007) calculated that supra-glacial debris cover increased by 3 %–6 % (∼0.20 % yr−1) between 1985 and 2000 on several glaciers in the central Greater Caucasus. On individual glaciers, supra-glacial debris cover increased by 25 %–30 % (e.g. Shkhelda) in the same period. We found an increase in supra-glacial debris cover, from 21.3±6.0 % to 30±5.8 % (∼0.65 % yr−1), for Shkhelda Glacier between 1986 and 2000. Popovnin et al. (2015), reported a supra-glacial debris cover increase from 2 % to 13 % (∼0.23 % yr−1) between 1968 and 2010, based on direct field monitoring for Djankuat Glacier (northern slope of the central Greater Caucasus). This compares with our result of an area increase in supra-glacial debris cover for Djankuat Glacier from 2.6±6.9 % to 9.8±6.1 % (∼0.25 % yr−1) between 1986 and 2014. This difference can be explained in that the detailed field measurement would have picked out smaller spots of debris cover which were beyond the resolution of the satellite imagery. Lambrecht et al. (2011) estimated that the supra-glacial debris cover distribution remained nearly constant at ∼16 % between 1971 and 1991 in the Adyl-Su River basin (northern slope of the central Greater Caucasus). Between 1991 and 2006, the supra-glacial debris cover started to increase noticeably, reaching 23 % (∼0.46 % yr−1) within 15 years. For the Zopkhito and Laboda glaciers (southern slope of the central Greater Caucasus), supra-glacial debris cover increase was lower in the same period (from 6.2 % to 8.1 %, or ∼0.12 % yr−1). We measured the supra-glacial debris cover increase in the same glaciers from 4.9±6.5 % to 6.1±6.4 %, or ∼0.08 % yr−1, between 1986 and 2000.
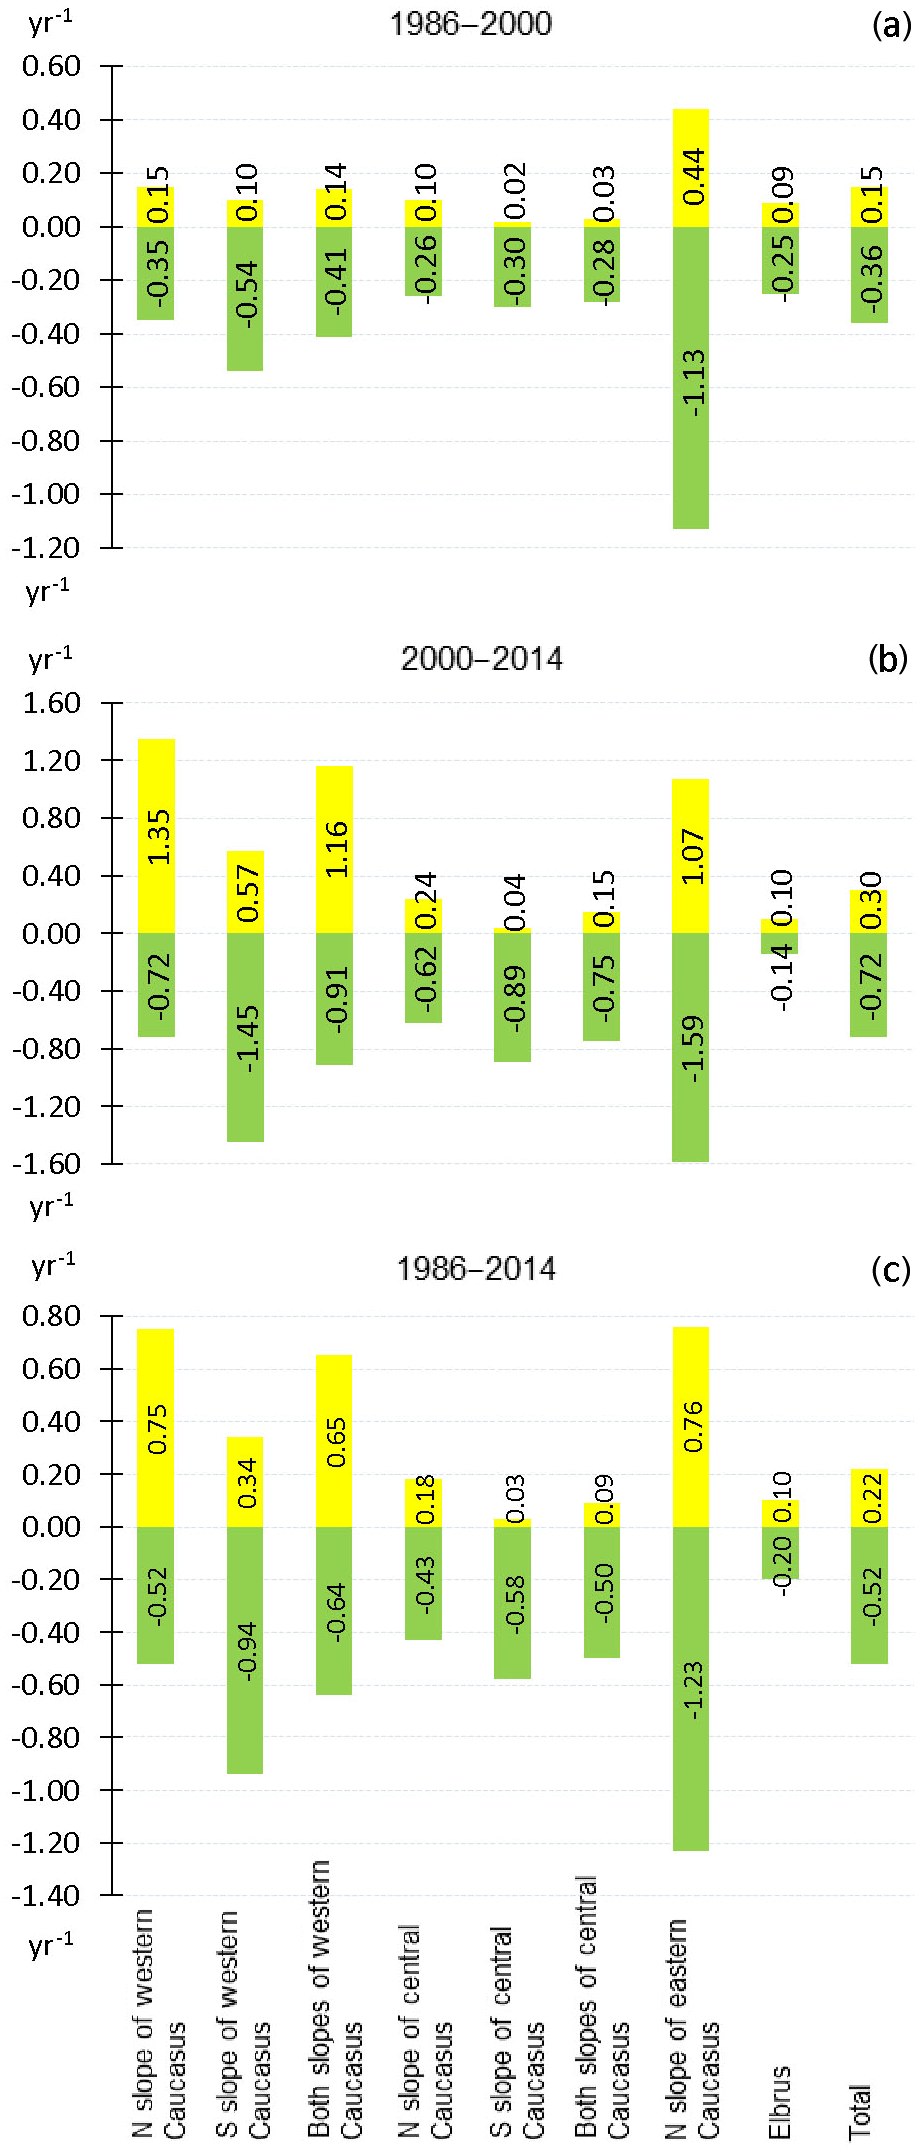
Figure 4Supra-glacial debris cover increase (yellow) and glacier area decrease (green) rates (%) in the Greater Caucasus by slopes, sections and mountain massifs in 1986–2000 (a), 2000–2014 (b) and 1986–2014 (c).
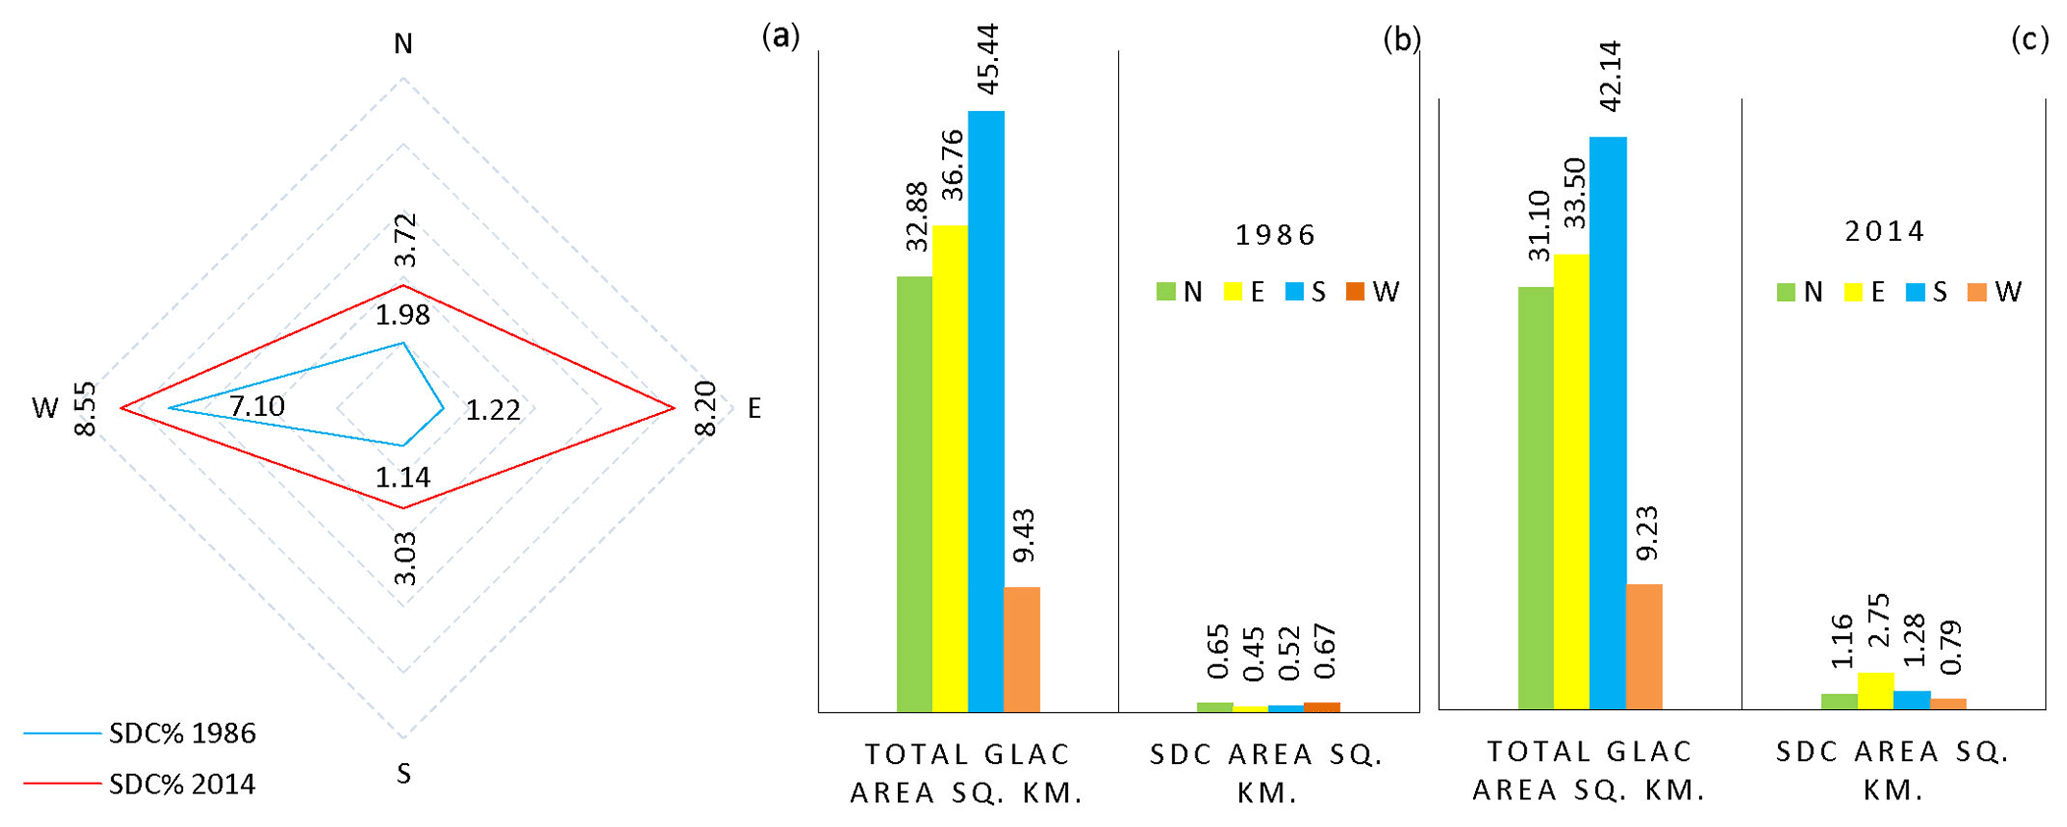
Figure 5Percentage of supra-glacial debris cover (SDC) for the Elbrus slopes in 1986 and 2014 (a). Total glacier area (km2) and supra-glacial debris-covered area changes (km2) in 1986 (b) and 2014 (c) for the Elbrus slopes.
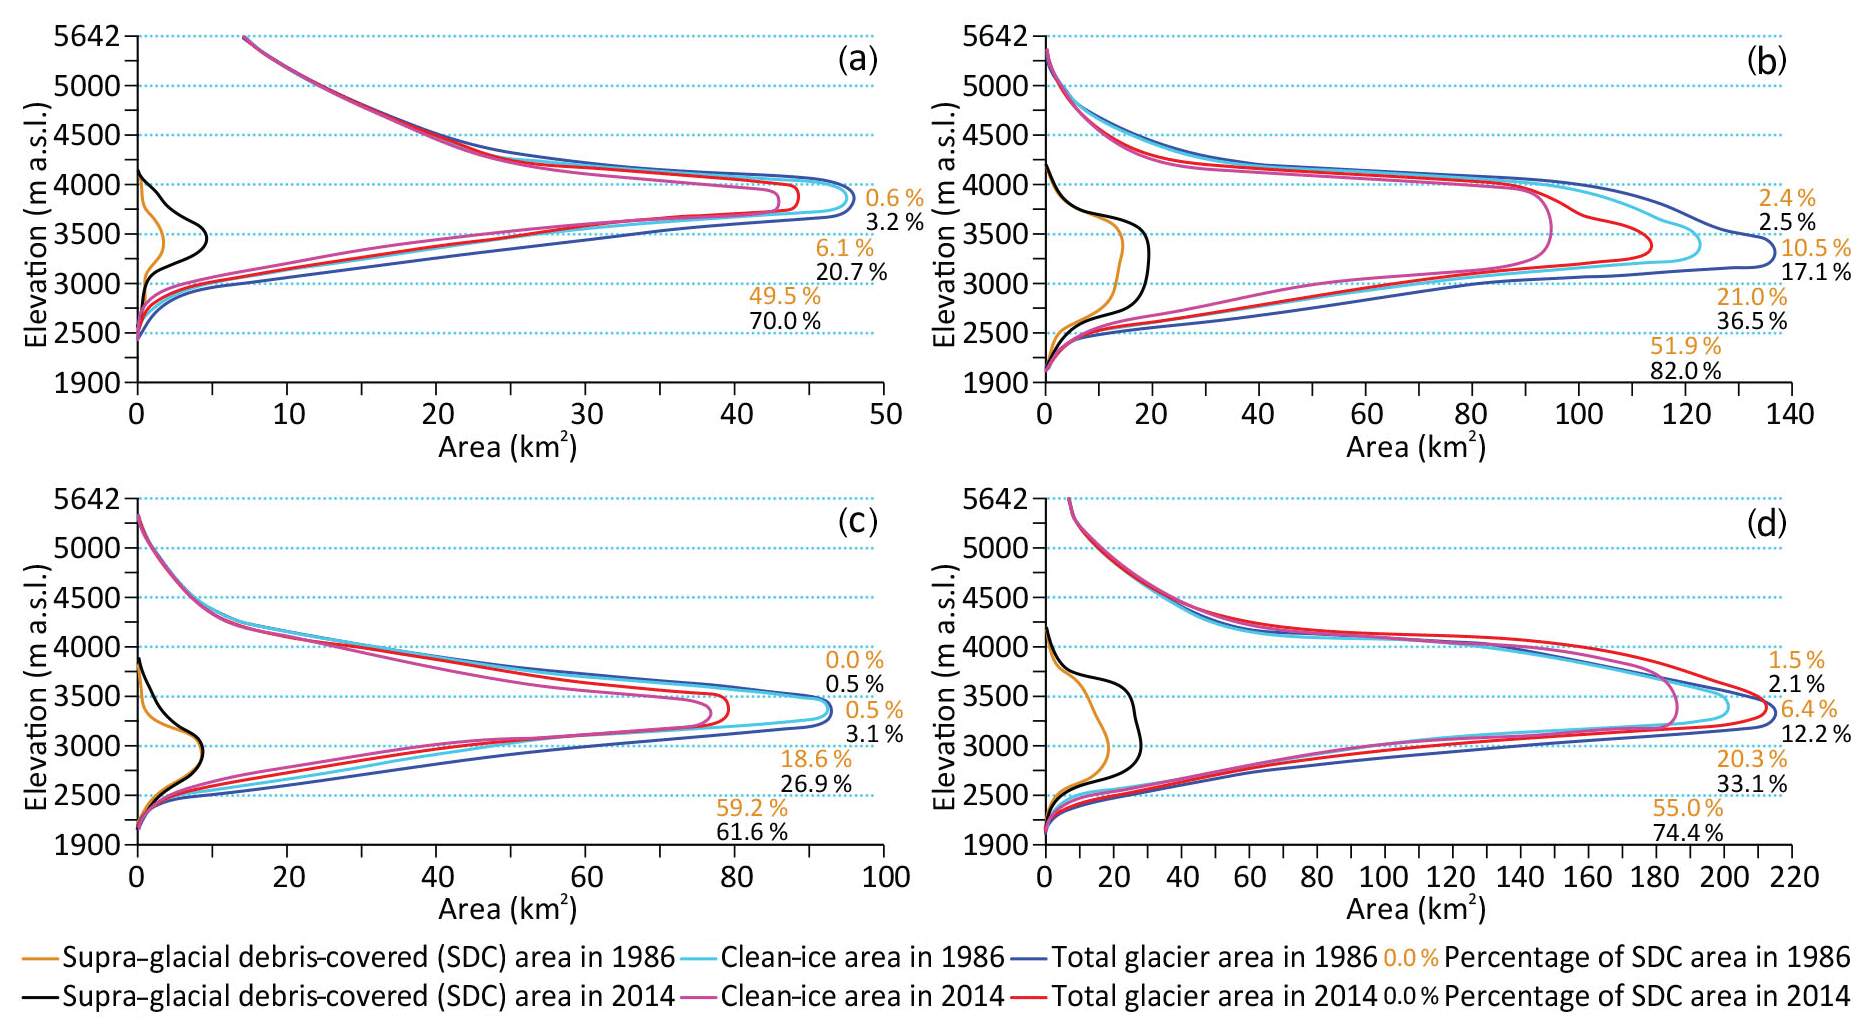
Figure 6Hypsometry of supra-glacial debris cover, clean ice and total glacier area of the four study regions in 1986 and 2014. (a) Elbrus, (b) northern slope of the Greater Caucasus, (c) southern slope of the Greater Caucasus and (d) all selected glaciers. Supra-glacial debris cover percentage is given according to the different elevation zones in 1986 (brown digits) and 2014 (black digits).
We extracted both supra-glacial debris cover and clean-ice outlines from Scherler et al. (2018) for our glacier sample from 2014 to compare these results of our regional study with those from the global study. We found that a large portion of these glaciers in the Greater Caucasus are covered by supra-glacial debris cover. While for two regions the results match within the uncertainty (western Greater Caucasus: 22.4±6.4 % vs. 23.7 %; Elbrus: 4.6±6.6 % vs. 7.7 %), our values are lower than the results of Scherler et al. (2018) for the other two regions (10.1±6.2 % vs. 30.8 % for central, 49.2±5.7 % vs. 84.9 % for eastern; Fig. S3). These differences can mostly be explained by (i) the RGI v6, used by Scherler et al. (2018), which is characterized by some inconsistent co-registration for the Greater Caucasus region that stems from the use of inadequately orthorectified satellite imagery to generate the inventory in contrast to the improved orthorectification of the Landsat L1T data (Fig. S4a), and (ii) the RGI v6, containing nominal glaciers (i.e. ellipses around glacier label points) for the Greater Caucasus region, which originates from the use of the World Glacier Inventory (WGI; Haeberli et al., 1989) to fill gaps with no data for earlier versions of the RGI (Pfeffer et al., 2014). According to Scherler et al. (2018), all nominal glaciers were classified as debris-covered (Fig. S4b). We note that the scope of the study by Scherler et al. (2018) was an automatized global assessment of supra-glacial debris cover from optical satellite data, without correcting any outlines in the RGI.
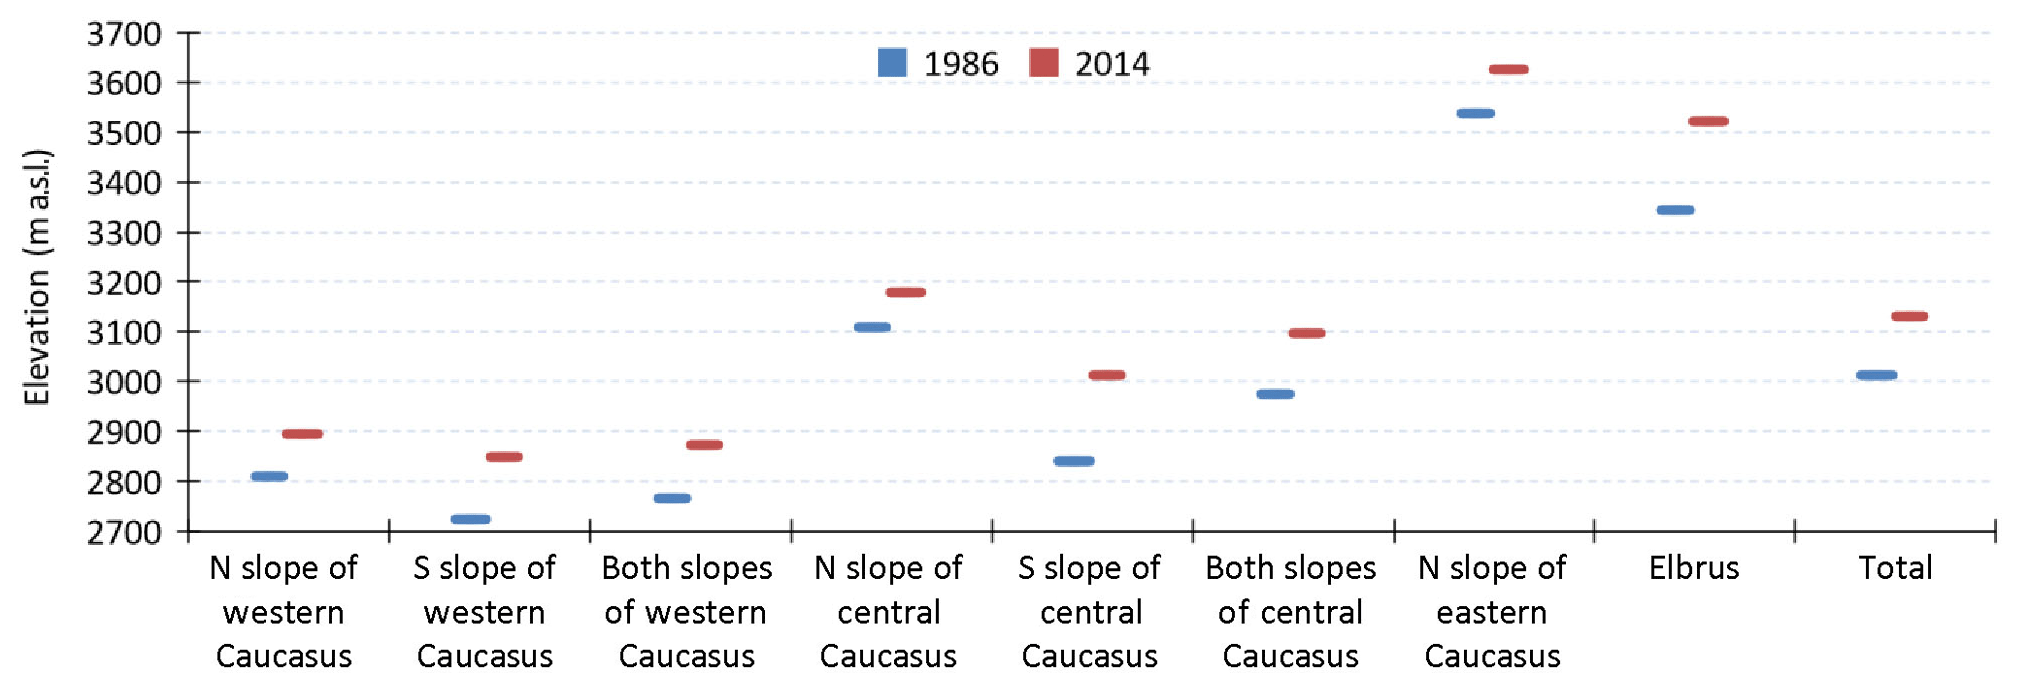
Figure 7Mean upper limit (m a.s.l.) of the supra-glacial debris cover for 1986 and 2014 by different regions (glaciers are non-existent on southern slopes of the eastern Greater Caucasus).
5.2 Possible reasons for supra-glacial debris cover changes
We observed a clear increase in supra-glacial debris cover in all investigated regions, which became more pronounced after 2000. Based on our investigation, the upper limit of supra-glacial debris cover migrated up-glacier (Figs. 7, 8; Table S2) as a response to glacier retreat and reduced mass flux, as described by Stokes et al. (2007) and defined as “backwasting” by Benn and Evans (1998). A similar pattern of up-glacier migration has also been described on Tasman Glacier, New Zealand (Kirkbride and Warren, 1999), and on Zmutt Glacier, Swiss Alps (Mölg et al., 2019).
The results presented in this study indicate that the clean-ice area for all selected glaciers decreased from about 93 % to 87 % between 1986 and 2014 (Table 2). This reduction was caused by both glacier retreat and an increase in total supra-glacial debris cover (Table 2; Figs. 3–6, S5). This finding is also consistent with field measurements on Djankuat Glacier (Popovnin et al., 2015).
Glacier thinning and a warming atmosphere can lead to permafrost thawing and slope instability at higher altitudes (Deline et al., 2015). Rock avalanches after 2000 on some glaciers in the Greater Caucasus (particularly in the eastern section) might be one of the reasons why the increase rate was higher during the second time period (2000–2014). For example, a rock–ice avalanche onto Devdoraki Glacier on 17 May 2014 (Tielidze et al., 2019a) caused an area increase in supra-glacial debris cover from 5.9±6.0 % to 19.1±5.6 %, or about 0.95 % yr−1, and a landslide after 2000 onto Suatisi Glacier produced a supra-glacial debris-covered area increase from 2.1±6.1 % to 17.6±5.7 %, or about 1.10 % yr−1 (Fig. S6).
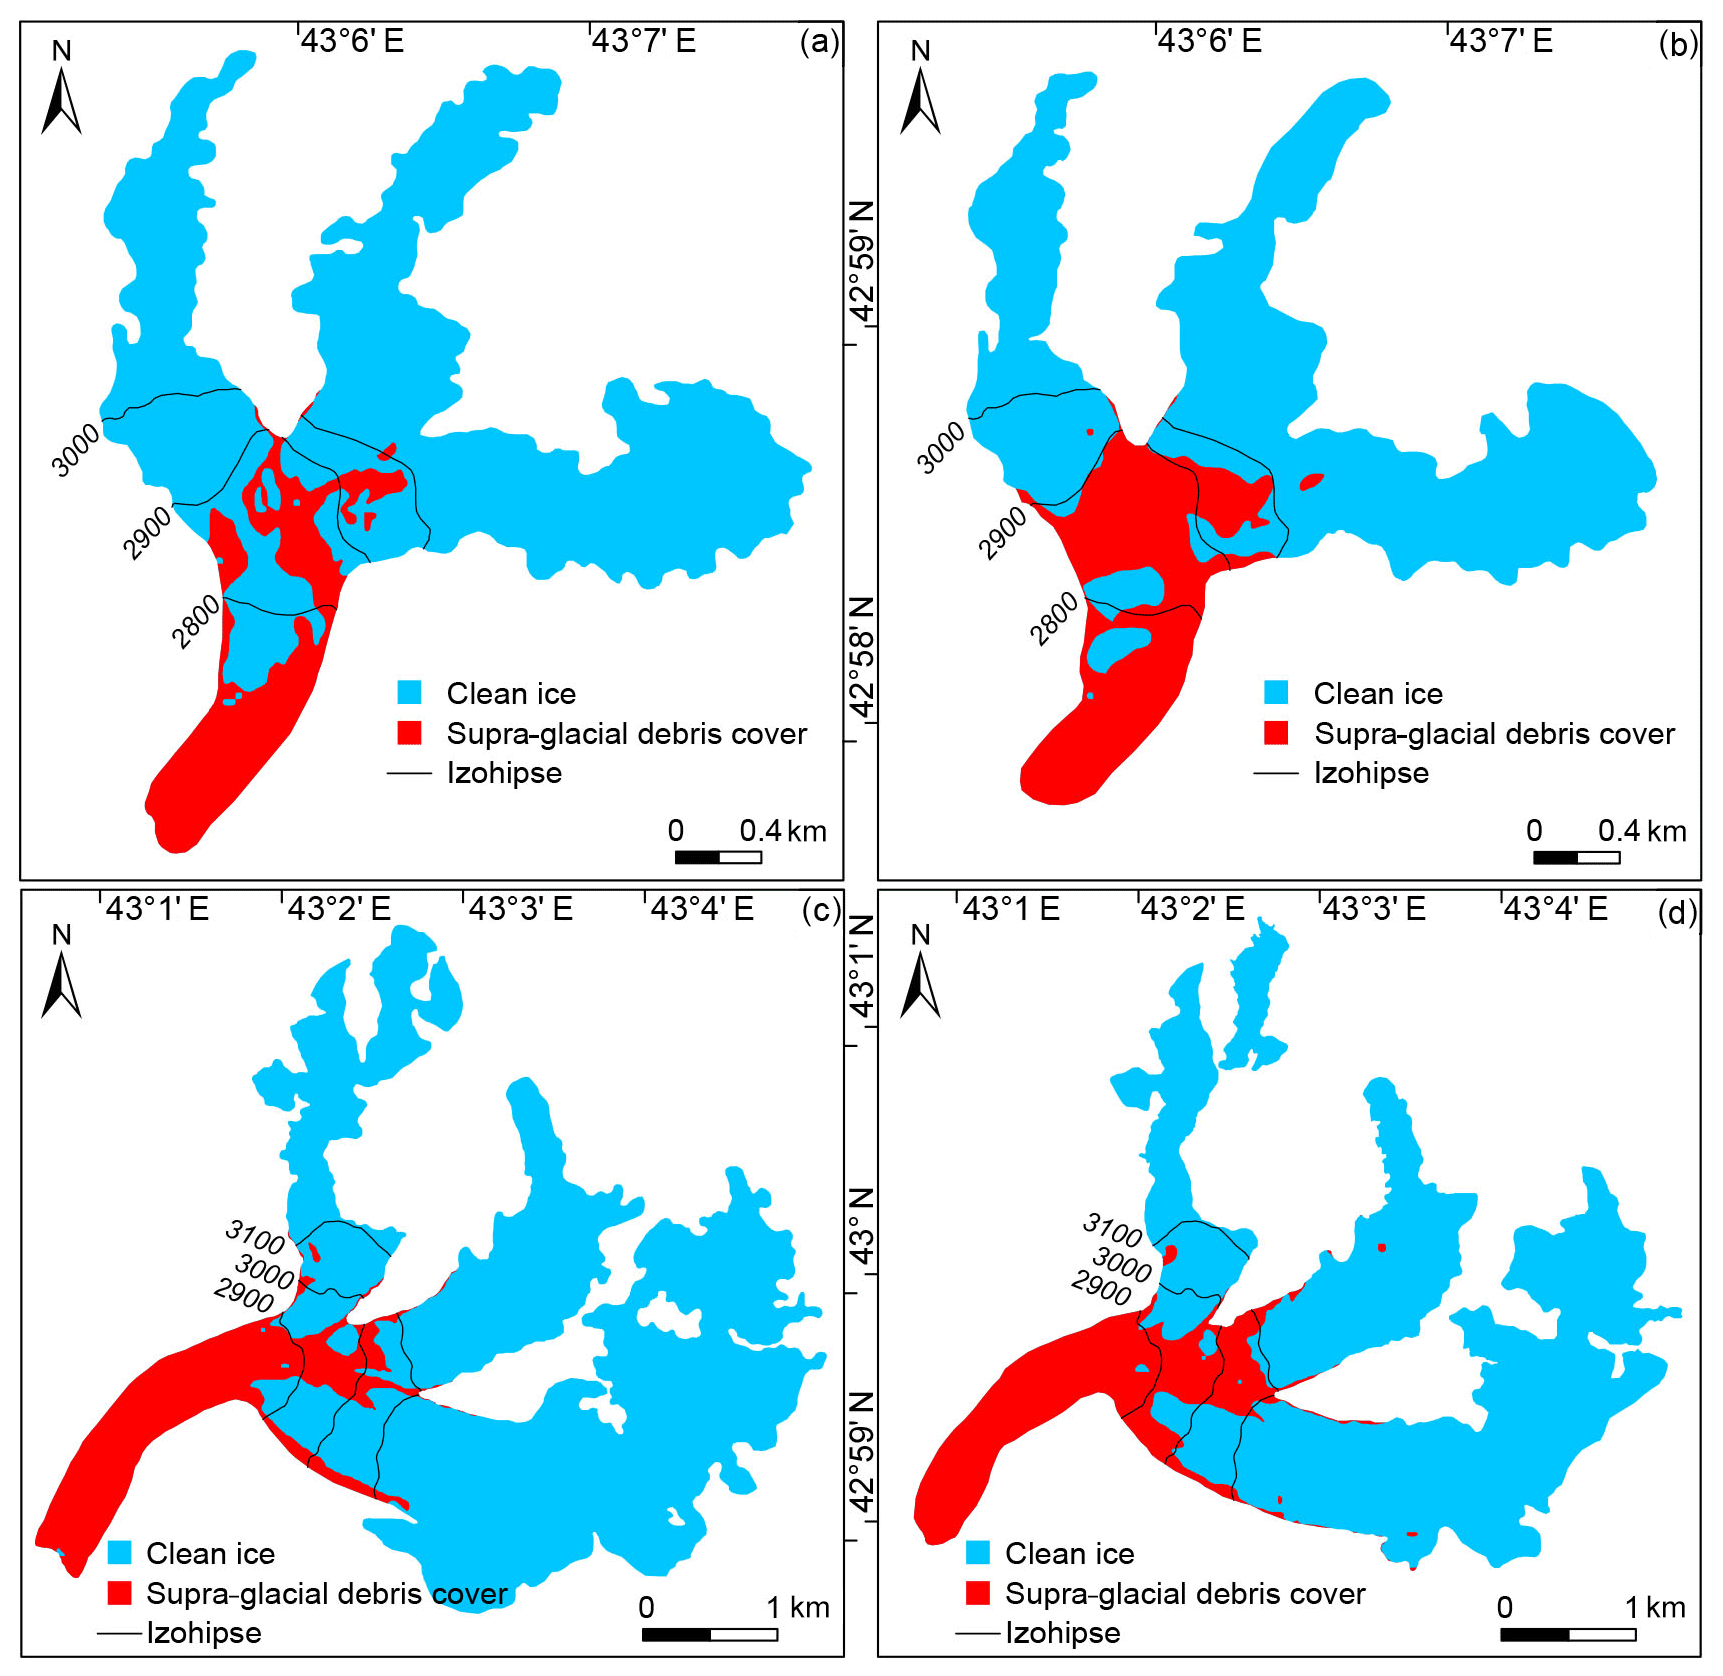
Figure 8An example of the supra-glacial debris cover up-glacier migration onto Shkhara Glacier in (a) 1986 and (b) 2014 and onto Khalde Glacier in (c) 1986 and (d) 2014.
Our investigation shows also that the supra-glacial debris cover increases more quickly on the northern slopes of the Greater Caucasus than on the southern slopes, where higher solar radiation input commonly results in smaller glaciers than on the northern slopes. Furthermore, smaller glaciers on the southern slope exist in high cirques with a much steeper surface. Glaciers on the northern slopes are on average less steep than on the southern slopes mainly because most valley glacier tongues in the north are longer and reach lower altitudes than the south-facing glaciers. This conclusion is supported by Lambrecht et al. (2011), who observed a more rapid increase in supra-glacial debris cover on the northern slopes than the southern slopes.
The highest mean upper limit of the supra-glacial debris cover in the eastern Greater Caucasus can mostly be found at small cirque and simple-valley type glaciers preserved at high altitudes and surrounded by rock walls.
The variation in supra-glacial debris-covered area in the eastern, central and western Greater Caucasus could be mostly caused by climate, lithology and morphological peculiarities of the relief. Some river basins in the eastern Greater Caucasus are built on Jurassic sedimentary rocks, which are characterized by relatively high denudation rates (Gobejishvili et al., 2011; Bochud, 2011) supporting supra-glacial debris cover formation. The relief of the central Greater Caucasus is mainly constructed from Proterozoic and lower Paleozoic plagiogranites, plagiogneisses, quartz diorites, and crystalline slates, which are more resistant and are less prone to the formation of rock avalanches. In addition, the central Greater Caucasus is the highest section of the main range, and glacier tongues are relatively steep and hence less favourable for debris cover accumulation. The western Greater Caucasus is hypsometrically lower, with less steep glaciers. This section is characterized by the highest glacier retreat after the eastern Greater Caucasus. It is therefore possible that glaciers are also rapidly thinning, favouring debris-covered area over the ablation area (Benn et al., 2012; Pratap et al., 2015). The dome of the anticlinorium of the western Greater Caucasus (crest of the main water divide) is built on Proterozoic and Paleozoic plagiogneisses, granites, amphibolites, and crystalline slates. This provides the framework for overall denudation of the high-mountainous relief (over 3000 m; Gobejishvili et al., 2019). Furthermore, this area is characterized by active tectonic and ongoing mountain building (uplifting) processes (Tsereteli et al., 2016), which might be a further reason for increasing supra-glacial debris cover. We note that all these reasons need confirmation by detailed field measurements and could be part of a separate investigation, since there is no accurate geographical pattern which otherwise explains the clear differences of the increase in supra-glacial debris cover.
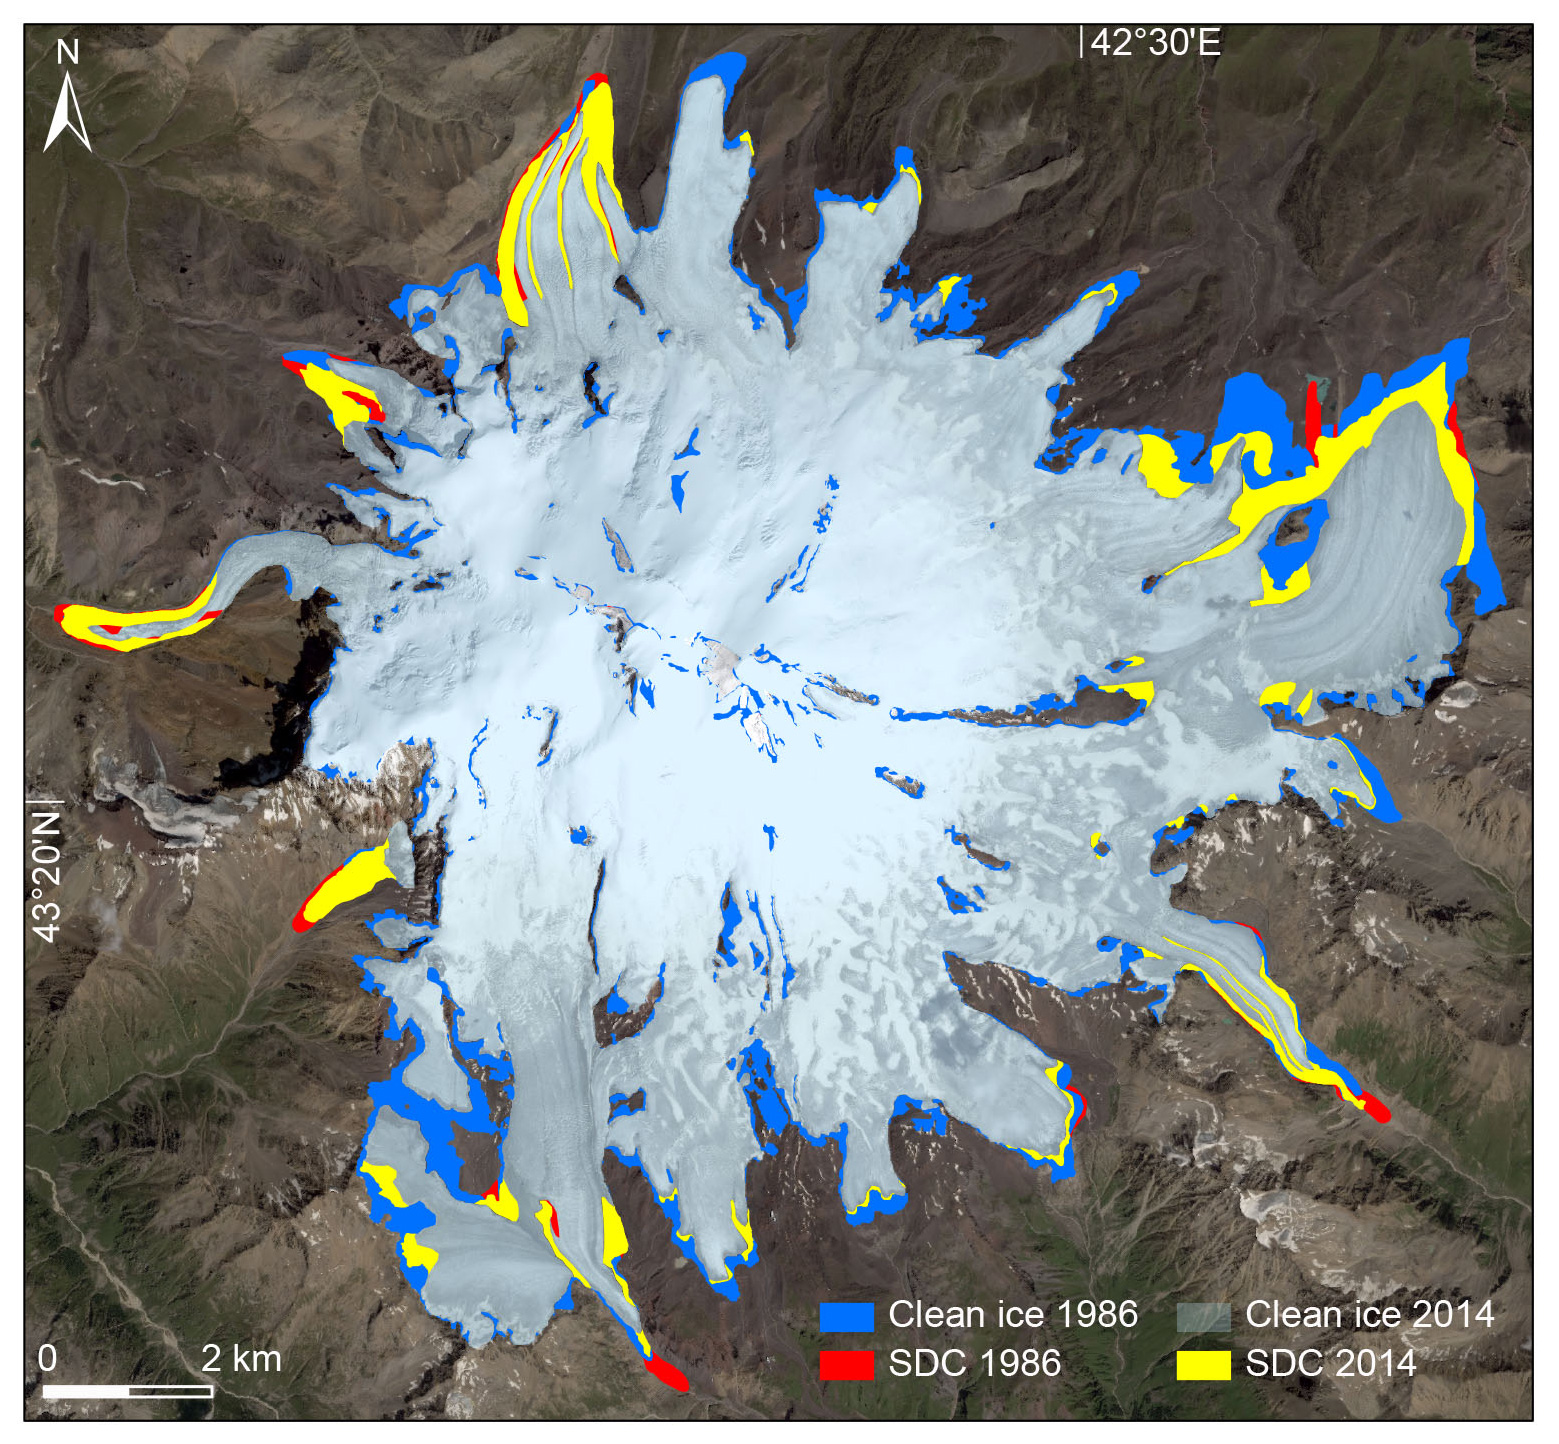
Figure 9Supra-glacial debris cover (SDC) increase on the Elbrus Massif from 1986 to 2014. SPOT-7 image from 20 August 2016 is used as the background. Blue shows retreat of clean-ice parts. Clean ice in 1986 consists of the clean ice in 2014 (light blue, transparent) plus clean-ice area that retreated between 1986 and 2014 (dark blue).
Our results indicate more than doubling of supra-glacial debris-covered area for Elbrus glaciers from 1986 to 2014, with the highest increase rate between 2000 and 2014 (Figs. 4, 9), although the total estimated uncertainty is comparable to the obtained relative changes. Glaciers on the western slope of Elbrus are affected by avalanches and thus are partially debris-covered (Kutuzov et al., 2019). Glaciers on the eastern slope are characterized by high rates of retreat and great expansion in proglacial lake number and area (Petrakov et al., 2007). The most significant increase in supra-glacial debris cover occurred on the eastern-oriented glaciers of Elbrus, where glaciers are characterized by the highest thinning rates in recent years (Kutuzov et al., 2019). Detailed ground-penetrating radar (GPR) survey helps with more accurately identifying supra-glacial debris cover extent in this area (e.g. GPR measurements by Kutuzov et al., 2019, showed that ∼30 m of ice may be present under the previously considered ice-free area on the eastern slope of Elbrus).
The glaciers in the Greater Caucasus have been retreating continuously since 1960 (Tielidze and Wheate, 2018), suggesting that the shielding effect of increased supra-glacial debris cover at the glacier surface may only partly offset the retreat trend. This is in line with detailed observations of the evolution of Zmutt Glacier, in the Swiss Alps (Mölg et al., 2019), and the fact that mass changes of debris-covered and debris-free glaciers in the Himalaya are similar (e.g. Brun et al., 2019; King et al., 2019). Direct field measurements show that thermal resistance of the <20 cm supra-glacial debris cover for some glaciers (e.g. Djankuat and Zopkhito) in the Greater Caucasus is higher (0.07–0.15 ∘C and 0.05–0.08 ∘C m2 W−1) than in other glacierized regions of the world (e.g. Baltoro, Karakoram: 0.02–0.07 ∘C; Maliy Aktru, Altai: 0.02–0.09 ∘C m2 W−1; Lambrecht et al., 2011), preventing a more rapid retreat. This process is consistent with our observations of the largest debris-covered (Bezingi) and debris-free (Karaugom) glaciers of the Greater Caucasus, where the latter is characterized with higher area shrinkage and terminus retreat. Numerous authors have found similar model results in the Himalaya (e.g. Scherler et al., 2011; Rowan et al., 2015; Jiang et al., 2018).
We have presented supra-glacial debris cover change over the last 30 years in the Greater Caucasus region. Manual and semi-automated digitization from satellite imagery (Landsat, SPOT and Google Earth) were used to distinguish the supra-glacial debris-covered area in 1986, 2000 and 2014. We expect that this study will significantly improve existing knowledge for this region.
The main conclusions of this research are summarized as follows:
-
An overall glacier shrinkage by 15.8±4.1 % in the Greater Caucasus was accompanied by an increase in supra-glacial debris cover from 7.0±6.4 % to 13.4±6.2 % between 1986 and 2014. Clean-ice area reduced by 20.1±4.0 % during the same time.
-
The supra-glacial debris cover increase rate was relatively low between 1986 and 2000 (∼0.15 % yr−1), while it doubled in the second investigated period (∼0.30 % yr−1), partly explained by rock avalanches after 2000 on some glaciers (particularly in the eastern section).
-
The number of debris-covered glaciers (percentage of debris cover larger than 10 %) increased from 122 in 1986 to 143 in 2000 and to 172 in 2014.
-
Increase of supra-glacial debris cover was observed more rapidly on the northern slopes than on the southern ones during the investigated periods.
-
The eastern Greater Caucasus represented the largest percentage of supra-glacial debris cover (49.2±5.7 %) for 2014, while the Elbrus Massif contained the lowest percentage of supra-glacial debris cover (4.6±6.6 %) in all our study regions.
Given the increasing degree of supra-glacial debris cover in the Greater Caucasus region, monitoring should be continued, as it constitutes an important control on glacier response to climate change. The recent significant increase in the supra-glacial debris-covered area in this region may alter the glacier mass balance in different ways, depending on debris thickness and properties. Such feedbacks can affect future glacier evolution and should be considered in glacier modelling.
Future work should focus on using high-resolution aerial and satellite imagery and more detailed field measurements, e.g. glaciological mass balance measurements; characteristics of debris and debris thickness measurement by ground-penetrating radar; or incoming and reflected solar radiation, long-wave terrestrial radiation and returned radiation. This will reduce uncertainties connected with supra-glacial debris cover assessment and glacier mapping accuracy in this region.
The new supra-glacial debris cover database created during the investigated period has been submitted to Global Land Ice Measurements from Space (GLIMS – https://www.glims.org/, last access: 7 February 2020; GLIMS, 2020) and can be used as a basis data set for future studies.
The Supplement includes glacier size classes with debris-covered and debris-free glacier distributions for northern and southern slopes (Fig. S1); comparison of debris-covered (Bezingi) and debris-free (Karaugom) glacier retreat between 1986 and 2014 (Fig. S2); mean up-glacier migration of the upper limit of the supra-glacial debris cover for 1986 and 2014 by regions (Table S1); relative supra-glacial debris cover for the western, central and eastern Greater Caucasus as well as for Mt. Elbrus based on the current study and in comparison to Scherler et al. (2018; Figs. S3–S4); increased supra-glacial debris-covered area for Devdoraki and Suatisi glaciers before and after rock–ice avalanches (Fig. S5); a comparison of supra-glacial debris-covered and clean-ice area distribution in 1986 and 2014 for south- and north-facing glaciers (Fig. S6); and total glacier area and supra-glacial debris cover change on the Elbrus Massif from 1986 to 2014 (animation map). The supplement related to this article is available online at: https://doi.org/10.5194/tc-14-585-2020-supplement.
LGT designed the conceptual framework for the study and wrote the paper based on input and feedback from all co-authors. TB, RDW and MZ contributed to the discussion, data analysis, and improved manuscript scientifically. SSK and IIL provided glacier mapping from the Elbrus area.
The authors declare that they have no conflict of interest.
We gratefully acknowledge the support of the editor, Etienne Berthier, and two reviewers, Dirk Scherler and Sam Herreid, for useful suggestions and detailed comments which clearly enhanced the quality of the paper. We thank Shaun Eaves for cooperation during the preparation of the paper.
This work was supported by Shota Rustaveli National Science Foundation of Georgia (SRNSFG; grant no. YS17_12).
This paper was edited by Etienne Berthier and reviewed by Sam Herreid and Dirk Scherler.
Baraer, M., Mark, B. G., McKenzie, J. M., Condom, T., Bury, J., Huh, K. I., Portocarrero, C., Gomez, J., and Rathay, S.: Glacier recession and water resources in Peru's Cordillera Blanca, J. Glaciol., 58, 134–150, 2012.
Benn, D., Bolch, T., Hands, K., Gulley, J., Luckman, A., Nicholson, L., Quincey, D., Thompson, S., Toumi, R., and Wiseman, S.: Response of debris-covered glaciers in the Mount Everest region to recent warming, and implications for outburst flood hazards, Earth-Sci. Rev., 114, 156–174, 2012.
Benn, D. I. and Evans, D. J. A.: Glaciers and Glaciation, Arnold, London, 1998.
Bochud, M.: Tectonics of the Eastern Greater Caucasus in Azerbaijan, PhD Thesis, Faculty of Sciences of the University of Fribourg (Switzerland), 2011.
Bolch, T., Menounos, B., and Wheate, R.: Landsat-based inventory of glaciers in western Canada, 1985–2005, Remote Sens. Environ., 114, 127–137, https://doi.org/10.1016/j.rse.2009.08.015, 2010.
Brun, F., Wagnon, P., Berthier, E., Jomelli, V., Maharjan, S. B., Shrestha, F., and Kraaijenbrink, P. D. A.: Heterogeneous Influence of Glacier Morphology on the Mass Balance Variability in High Mountain Asia, J. Geophys. Res.-Earth, 124, 1331–1345, https://doi.org/10.1029/2018JF004838, 2019.
Deline, P.: Change in surface debris cover on Mont Blanc massif glaciers after the “Little Ice Age” termination, Holocene, 15, 302–309, https://doi.org/10.1191/0959683605hl809rr, 2005.
Deline, P., Gruber, S., Delaloye, R., Fischer, L., Geertsema, M., Giardino, M., Hasler, A., Kirkbride, M., Krautblatter, M., Magnin, F., McColl, S., Ravanel, L., and Schoeneich, P.: Chapter 15 – Ice Loss and Slope Stability in High-Mountain Regions, in: Snow and Ice-Related Hazards, Risks and Disasters, edited by: Haeberli, W., Whiteman, C., and Shroder, J. F., Boston, Academic Press, 521–561, https://doi.org/10.1016/B978-0-12-394849-6.00015-9, 2015.
Frey, H., Paul, F., and Strozzi, T.: Compilation of a glacier inventory for the western Himalayas from satellite data: methods, challenges, and results, Remote Sens. Environ., 124, 832–843, 2012.
Gobejishvili, R., Lomidze, N., and Tielidze, L.: Late Pleistocene (Wurmian) glaciations of the Caucasus, in: Quaternary Glaciations: Extent and Chronology, edited by: Ehlers, J., Gibbard, P. L., and Hughes, P. D., Elsevier, Amsterdam, 141–147, https://doi.org/10.1016/B978-0-444-53447-7.00012-X, 2011.
Gobejishvili, R., Tielidze, L., and Astakhov, N.: Western Greater Caucasus, in: Geomorphology of Georgia, Geography of the Physical Environment, edited by: Tielidze, L., Springer, https://doi.org/10.1007/978-3-319-77764-1_8, 2019.
Glasser, N., Holt, T. O., Evans, Z. D., Davies, B. J., Pelto, M., and Harrison, S.: Recent spatial and temporal variations in debris cover on Patagonian glaciers, Geomorphology, 273, 202–216, https://doi.org/10.1016/j.geomorph.2016.07.036, 2016.
GLIMS: Global Land Ice Measurements from Space glacier database, Compiled and made available by the international GLIMS community and the National Snow and Ice Data Center, Boulder CO, USA, https://doi.org/10.7265/N5V98602, 2020.
Granshaw, F. D. and Fountain, A. G.: Glacier change (1958–1998) in the North Cascades National Park Complex, Washington, USA, J. Glaciol., 52, 251–256, https://doi.org/10.3189/172756506781828782, 2006.
Haeberli, W., Bösch, H., Scherler, K., Østrem, G., and Wallén, C. C. (Eds.): World glacier inventory – status 1988, IAHS(ICSI)/UNEP/UNESCO, Nairobi, 1989
Jiang, S., Nie, Y., Liu, Q., Wang, J., Liu, L., Hassan, J., Liu, X., and Xu, X.: Glacier Change, Supraglacial Debris Expansion and Glacial Lake Evolution in the Gyirong River Basin, Central Himalayas, between 1988 and 2015, Remote Sens., 10, 986, https://doi.org/10.3390/rs10070986, 2018.
Kellerer-Pirklbauer, A.: The Supraglacial Debris System at the Pasterze Glacier, Austria: Spatial Distribution, Characteristics and Transport of Debris, Z. Geomorphol., 52, 3–25, https://doi.org/10.1127/0372-8854/2008/0052S1-0003, 2008.
King, O., Bhattacharya, A., Bhambri, R., and Bolch, T.: Glacial lakes exacerbate Himalayan glacier mass loss, Sci. Rep., 9, 18145, https://doi.org/10.1038/s41598-019-53733-x, 2019.
Kirkbride, M. P. and Deline, P.: The formation of supraglacial debris covers by primary dispersal from transverse englacial debris bands, Earth Surf. Process. Land., 38, 1779–1792, https://doi.org/10.1002/esp.3416, 2013.
Kirkbride, M. P. and Warren, C. R.: Tasman Glacier, New Zealand: 20th-century thinning and predicted calving retreat, Global Planet. Chang., 22, 11–28, 1999.
Kozachek, A., Mikhalenko, V., Masson-Delmotte, V., Ekaykin, A., Ginot, P., Kutuzov, S., Legrand, M., Lipenkov, V., and Preunkert, S.: Large-scale drivers of Caucasus climate variability in meteorological records and Mt El'brus ice cores, Clim. Past, 13, 473–489, https://doi.org/10.5194/cp-13-473-2017, 2017.
Kutuzov, S., Lavrentiev, I., Smirnov, A., Nosenko, G., and Petrakov, D.: Volume Changes of Elbrus Glaciers From 1997 to 2017, Front. Earth Sci., 7, 153, https://doi.org/10.3389/feart.2019.00153, 2019.
Lambrecht, A., Mayer, C., Hagg, W., Popovnin, V., Rezepkin, A., Lomidze, N., and Svanadze, D.: A comparison of glacier melt on debris-covered glaciers in the northern and southern Caucasus, The Cryosphere, 5, 525–538, https://doi.org/10.5194/tc-5-525-2011, 2011.
Mikhalenko, V., Sokratov, S., Kutuzov, S., Ginot, P., Legrand, M., Preunkert, S., Lavrentiev, I., Kozachek, A., Ekaykin, A., Faïn, X., Lim, S., Schotterer, U., Lipenkov, V., and Toropov, P.: Investigation of a deep ice core from the Elbrus western plateau, the Caucasus, Russia, The Cryosphere, 9, 2253–2270, https://doi.org/10.5194/tc-9-2253-2015, 2015.
Mölg, N., Bolch, T., Rastner, P., Strozzi, T., and Paul, F.: A consistent glacier inventory for Karakoram and Pamir derived from Landsat data: distribution of debris cover and mapping challenges, Earth Syst. Sci. Data, 10, 1807–1827, https://doi.org/10.5194/essd-10-1807-2018, 2018.
Mölg, N., Bolch, T., Walter, A., and Vieli, A.: Unravelling the evolution of Zmuttgletscher and its debris cover since the end of the Little Ice Age, The Cryosphere, 13, 1889–1909, https://doi.org/10.5194/tc-13-1889-2019, 2019.
Nicholson, L. I., McCarthy, M., Pritchard, H. D., and Willis, I.: Supraglacial debris thickness variability: impact on ablation and relation to terrain properties, The Cryosphere, 12, 3719–3734, https://doi.org/10.5194/tc-12-3719-2018, 2018.
Östrem, G.: Ice Melting under a Thin Layer of Moraine, and the Existence of Ice Cores in Moraine Ridges, Geogr. Ann., 41, 228–230, 1959.
Paul, F., Barrand, N., Baumann, S., Berthier, E., Bolch, T., Casey, K., Frey, H., Joshi, S., Konovalov, V., Le Bris, R., Mölg, N., Nosenko, G., Nuth, C., Pope, A., Racoviteanu, A., Rastner, P., Raup, B., Scharrer, K., Steffen, S., and Winsvold, S.: On the accuracy of glacier outlines derived from remote-sensing data, Ann. Glaciol., 54, 171–182, https://doi.org/10.3189/2013AoG63A296, 2013.
Petrakov, D. A., Krylenko, I. V., Chernomorets, S. S., Tutubalina, O. V., Krylenko, I. N., and Shakhmina, M. S.: Debris flow hazard of glacial lakes in the Central Caucasus. Debris-Flow Hazards Mitigation: Mechanics, Prediction, and Assessment, Chen & Major, Millpress, Netherlands, 2007.
Pfeffer, W. T., Arendt, A. A., Bliss, A., Bolch, T., Cogley, J. G., Gardner, A. S., Hagen, J., Hock, R., Kaser, G., Kienholz, C., Miles, E. S., Moholdt, G., Mölg, N., Paul, F., Radic V., Rastner, P., Raup, B. H., Rich, J., Sharp, M. J., and The Randolph Consortium: The Randolph Glacier Inventory: a globally complete inventory of glaciers, J. Glaciol., 60, 537–552, https://doi.org/10.3189/2014JoG13J176, 2014.
Popovnin, V. V. and Rozova, A.: Influence of sub-debris thawing on ablation and runoff of the Djankuat Glacier in the Caucasus, Nord. Hydrol., 33, 75–94, 2002.
Popovnin, V. V., Rezepkin, A. A., and Tielidze, L. G.: Superficial moraine expansion on the Djankuat Glacier snout over the direct glaciological monitoring period, Earth Cryosphere, 1, 79–87, 2015.
Pratap, B., Dobhal, D., Mehta, M., and Bhambri, R.: Influence of debris cover and altitude on glacier surface melting: A case study on Dokriani Glacier, central Himalaya, India, Ann. Glaciol., 56, 9–16, https://doi.org/10.3189/2015AoG70A971, 2015.
Rau, F., Mauz, F., Vogt, S., Singh Khalsa, S. J., and Raup, B.: Illustrated GLIMS Glacier Classification Manual, Glacier Classification Guidance for the GLIMS Glacier Inventory, 2005.
Raup, B. H., Khalsa, S. J. S., Armstrong, R. L., Sneed, W. A., Hamilton, G. S., Paul, F., Cawkwell, F., Beedle, M. J., Menounos, B. P., Wheate, R. D., Rott, H., Shiyin, L., Xin, Li., Donghui, S., Guodong, C., Kargel, J. S., Larsen, C. F., Molnia, B. F., Kincaid, J. L., Klein, A., and Konovalov, V.: Quality in the GLIMS glacier database, in: Global Land Ice Measurements from Space, Springer Berlin Heidelberg, 163–182, https://doi.org/10.1007/978-3-540-79818-7_7 2014.
RGI Consortium: Randolph Glacier Inventory (RGI) – A dataset of global glacier outlines: version 6.0, Technical Report, Global Land Ice Measurements from Space, Boulder, Colorado, USA, 2017.
Rounce, D. R., King, O., McCarthy, M., Shean, D. E., and Salerno, F.: Quantifying Debris Thickness of Debris-Covered Glaciers in the Everest Region of Nepal Through Inversion of a Subdebris Melt Model, J. Geophys. Res., 123, 1094–1115, https://doi.org/10.1029/2017JF004395, 2018.
Rowan, A. V., Quincey, D. J., Egholm, D. L., and Glasser, N. F.: Modelling the feedbacks between mass balance, ice flow and debris transport to predict the response to climate change of debris-covered glaciers in the Himalaya, Earth Planet. Sc. Lett., 430, 427–438, https://doi.org/10.1016/j.epsl.2015.09.004 2015.
Scherler, D., Bookhagen, B., and Strecker, M. R.: Spatially variable response of Himalayan glaciers to climate change affected by debris cover, Nat. Geosci., 4, 156–159, https://doi.org/10.1038/NGEO1068, 2011.
Scherler, D., Wulf, H., and Gorelick, N.: Global assessment of supraglacial debris-cover extents, Geophys. Res. Lett., 45 11798–11805, https://doi.org/10.1029/2018GL080158, 2018.
Stokes, C. R., Popovnin, V. V., Aleynikov, A., and Shahgedanova, M.: Recent glacier retreat in the Caucasus Mountains, Russia, and associated changes in supraglacial debris cover and supra/proglacial lake development, Ann. Glaciol., 46, 196–203, 2007.
Sylvén, M., Reinvang, R., and Andersone-Lilley, Ž.: Climate Change in Southern Caucasus: Impacts on nature, people and society (WWF overview report), WWF Norway WWF Caucasus Programme, 2008.
Thompson, S., Benn, D., Mertes, J., and Luckman, A.: Stagnation and mass loss on a Himalayan debris-covered glacier: processes, patterns and rates, J. Glaciol., 62, 467–485, https://doi.org/10.1017/jog.2016.37, 2016.
Tielidze, L.: Introduction, in: Glaciers of Georgia, Geography of the Physical Environment, Springer, https://doi.org/10.1007/978-3-319-50571-8_1, 2017.
Tielidze, L. G.: Glacier change over the last century, Caucasus Mountains, Georgia, observed from old topographical maps, Landsat and ASTER satellite imagery, The Cryosphere, 10, 713–725, https://doi.org/10.5194/tc-10-713-2016, 2016.
Tielidze, L. G. and Wheate, R. D.: The Greater Caucasus Glacier Inventory (Russia, Georgia and Azerbaijan), The Cryosphere, 12, 81–94, https://doi.org/10.5194/tc-12-81-2018, 2018.
Tielidze, L. G., Kumladze, R. M., Wheate, R. D., and Gamkrelidze, M.: The Devdoraki Glacier Catastrophes, Georgian Caucasus, Hungarian Geographical Bulletin, 68, 21–35, https://doi.org/10.15201/hungeobull.68.1.2, 2019a.
Tielidze, L., Gobejishvili, R., and Javakhishvili, A.: Eastern Greater Caucasus, in: Geomorphology of Georgia, edited by: Tielidze, L., Geography of the Physical Environment, Springer, https://doi.org/10.1007/978-3-319-77764-1_10, 2019b.
Tsereteli, N., Tibaldi, A., Alania, V., Gventsadse, A., Enukidze, O., Varazanashvili, O., and Müller, B. I. R.: Active tectonics of central-western Caucasus, Georgia, Tectonophysics, 691, 328–344, https://doi.org/10.1016/j.tecto.2016.10.025, 2016.
Volodicheva, N.: The Caucasus, in: The Physical Geography of Northern Eurasia, edited by: Shahgedanova, M., Oxford University Press, Oxford, 350–376, 2002.
Zhang Y., Hirabayashi, Y., Fujita, K., Liu, S., and Liu, Q.: Heterogeneity in supraglacial debris thickness and its role in glacier mass changes of the Mount Gongga, Sci. China Earth Sci., 59, 170–184, https://doi.org/10.1007/s11430-015-5118-2, 2016.
- Article
(7414 KB) - Full-text XML
- Companion paper 1
- Companion paper 2
-
Supplement
(16731 KB) - BibTeX
- EndNote