the Creative Commons Attribution 4.0 License.
the Creative Commons Attribution 4.0 License.
 | 21 Dec 2020
Spring melt pond fraction in the Canadian Arctic Archipelago predicted from RADARSAT-2
Stephen E. L. Howell
Randall K. Scharien
Jack Landy
Mike Brady
Melt ponds form on the surface of Arctic sea ice during spring, influencing how much solar radiation is absorbed into the sea ice–ocean system, which in turn impacts the ablation of sea ice during the melt season. Accordingly, melt pond fraction (fp) has been shown to be a useful predictor of sea ice area during the summer months. Sea ice dynamic and thermodynamic processes operating within the narrow channels and inlets of the Canadian Arctic Archipelago (CAA) during the summer months are difficult for model simulations to accurately resolve. Additional information on fp variability in advance of the melt season within the CAA could help constrain model simulations and/or provide useful information in advance of the shipping season. Here, we use RADARSAT-2 imagery to predict and analyze peak melt pond fraction (fpk) and evaluate its utility to provide predictive information with respect to sea ice area during the melt season within the CAA from 2009–2018. The temporal variability of RADARSAT-2 fpk over the 10-year record was found to be strongly linked to the variability of mean April multi-year ice area with a statistically significant detrended correlation (R) of 0.89. The spatial distribution of RADARSAT-2 fpk was found to be in excellent agreement with the sea ice stage of development prior to the melt season. RADARSAT-2 fpk values were in good agreement with fpk observed from in situ observations but were found to be ∼ 0.05 larger compared to MODIS fpk observations. Dynamically stable sea ice regions within the CAA exhibited higher detrended correlations between RADARSAT-2 fpk and summer sea ice area. Our results show that RADARSAT-2 fpk can be used to provide predictive information about summer sea ice area for a key shipping region of the Northwest Passage.
- Article
(7642 KB) - Full-text XML
- BibTeX
- EndNote


Arctic sea ice extent during the summer months has declined considerably over the satellite record (Serreze et al., 2007; Stroeve et al., 2012; Peng and Meier, 2017). Surface melt ponds, which form on sea ice during the spring, play an important role in the decay of sea ice and seasonal reduction in ice extent because they influence how much solar radiation is absorbed into the sea ice–ocean system (Eicken et al., 2004). Specifically, the accumulation of meltwater on the surface of the sea ice lowers the albedo from ∼ 0.8 to between 0.2–0.4 and enhances melt (Perovich et al., 2002). The topographical constraints over multi-year ice (MYI) imposed by hummocks typically result in MYI exhibiting a lower melt pond fraction (fp) compared to seasonal first-year ice (FYI) (Grenfell and Perovich, 2004; Polashenski et al., 2012; Landy et al., 2015). With Arctic sea ice transitioning from a MYI- to FYI-dominated icescape (Maslanik et el., 2011), the lower fp of MYI will gradually be replaced with the higher fp of FYI, facilitating even more sea ice energy absorption and further enhancing sea ice melt (Perovich and Polashenski, 2012).
Predicting the state of Arctic sea ice several months in advance is challenging, and recently the sea ice prediction community has focused efforts on the development and utilization of dynamical forecast models (e.g. Chevallier et al., 2013; Sigmond et al., 2013; Guemas et al., 2016). Despite these recent efforts, rapidly changing Arctic sea ice conditions will continue to necessitate improved sea ice forecasting capabilities (Eicken, 2013). Accordingly, prognostic fp schemes have been integrated in climate models and have shown to exert a strong influence on summer sea ice area and extent (Flocco et al., 2010, 2012). Schröder et al. (2014) found a strong correlation between model-simulated May fp and the observed September sea ice extent. Observed fp has also demonstrated significant predictive skill for September ice extent from late July onwards (Liu et al., 2015). However, while fp estimates for the entire Arctic can be provided by model simulations, more representative and higher spatial resolution observational estimates at regional and pan-Arctic scales are much more difficult to obtain.
Optical remote sensing is the most widely utilized approach to estimate large-scale fp from space (e.g. Markus et al., 2003; Tschudi et al., 2008; Rösel et al., 2012; Istomina et al., 2015; Webster et al., 2015; Lee et al., 2020) but cloud cover remains a significant problem. Techniques for retrieving fp using advanced quad-polarization and compact-polarization mode synthetic aperture radar (SAR) imagery, at C- and X-band frequencies, have also been developed (Scharien et al., 2014; Fors et al., 2017; Li et al., 2017), but they are limited in systematic spatial application because the required polarization modes are not always available from wide-swath imagery. However, using the winter backscatter from widely available Sentinel-1 SAR imagery, Scharien et al. (2017) recently demonstrated a technique for predicting spring peak melt pond fraction (fpk) over the entire Canadian Arctic Archipelago (CAA) 3–4 months in advance of melt pond formation. These fpk predictions have potential utility in seasonal summer sea ice area and extent forecasts as early as April.
The CAA is a collection of islands located in northern Canada (Fig. 1) whose waterways are sea ice covered between fall and spring. It is an active region for marine shipping and has recently experienced an increase in summer shipping activity (Pizzolato et al., 2014). Model simulations have been utilized to understand the current and predicted future variability of sea ice conditions in the CAA (e.g. Dumas et al., 2006; Sou and Flato, 2009, Howell et al., 2016; Laliberté et al., 2016; Hu et al., 2018; Laliberté et al., 2018). However, modelling the CAA still remains challenging because complex sea ice dynamic and thermodynamic processes are often not accurately resolved in its narrow channels and inlets. In addition, the response of the CAA to climatic change is perhaps counter-intuitive as longer melt seasons are resulting in increased MYI import from the Arctic Ocean during the summer months (Howell and Brady, 2019). Since fpk is linked to summer sea ice melt processes (e.g. Eicken et al., 2004; Skyllingstad and Polashenski, 2018) additional information on fpk variability within the CAA could improve our understanding of regional summer melt processes, help constrain model simulations, and facilitate safer shipping activity in upcoming years.

Figure 1Map of the Canadian Arctic Archipelago region (red shading). The green star indicates the location of the lidar and aerial photograph observations.
In this study, we extend the work of Scharien et al. (2017) and investigate predicted fpk variability within the CAA over the longer-term record available from RADARSAT-2. Specifically, (i) we estimate fpk in the CAA using RADARSAT-2; (ii) evaluate the spatiotemporal variability of fpk in the CAA from 2009–2018; (iii) compare RADARSAT-2 fpk values to Sentinel-1 fpk values from Scharien et al. (2017), in situ fp observations from Landy et al. (2014) and Moderate Resolution Image Spectroradiometer (MODIS) fp values from Rösel et al. (2012); and (iv) investigate the utility of RADARSAT-2 fpk to provide predictive information about sea ice area in the CAA during the summer melt season.
2.1 Data
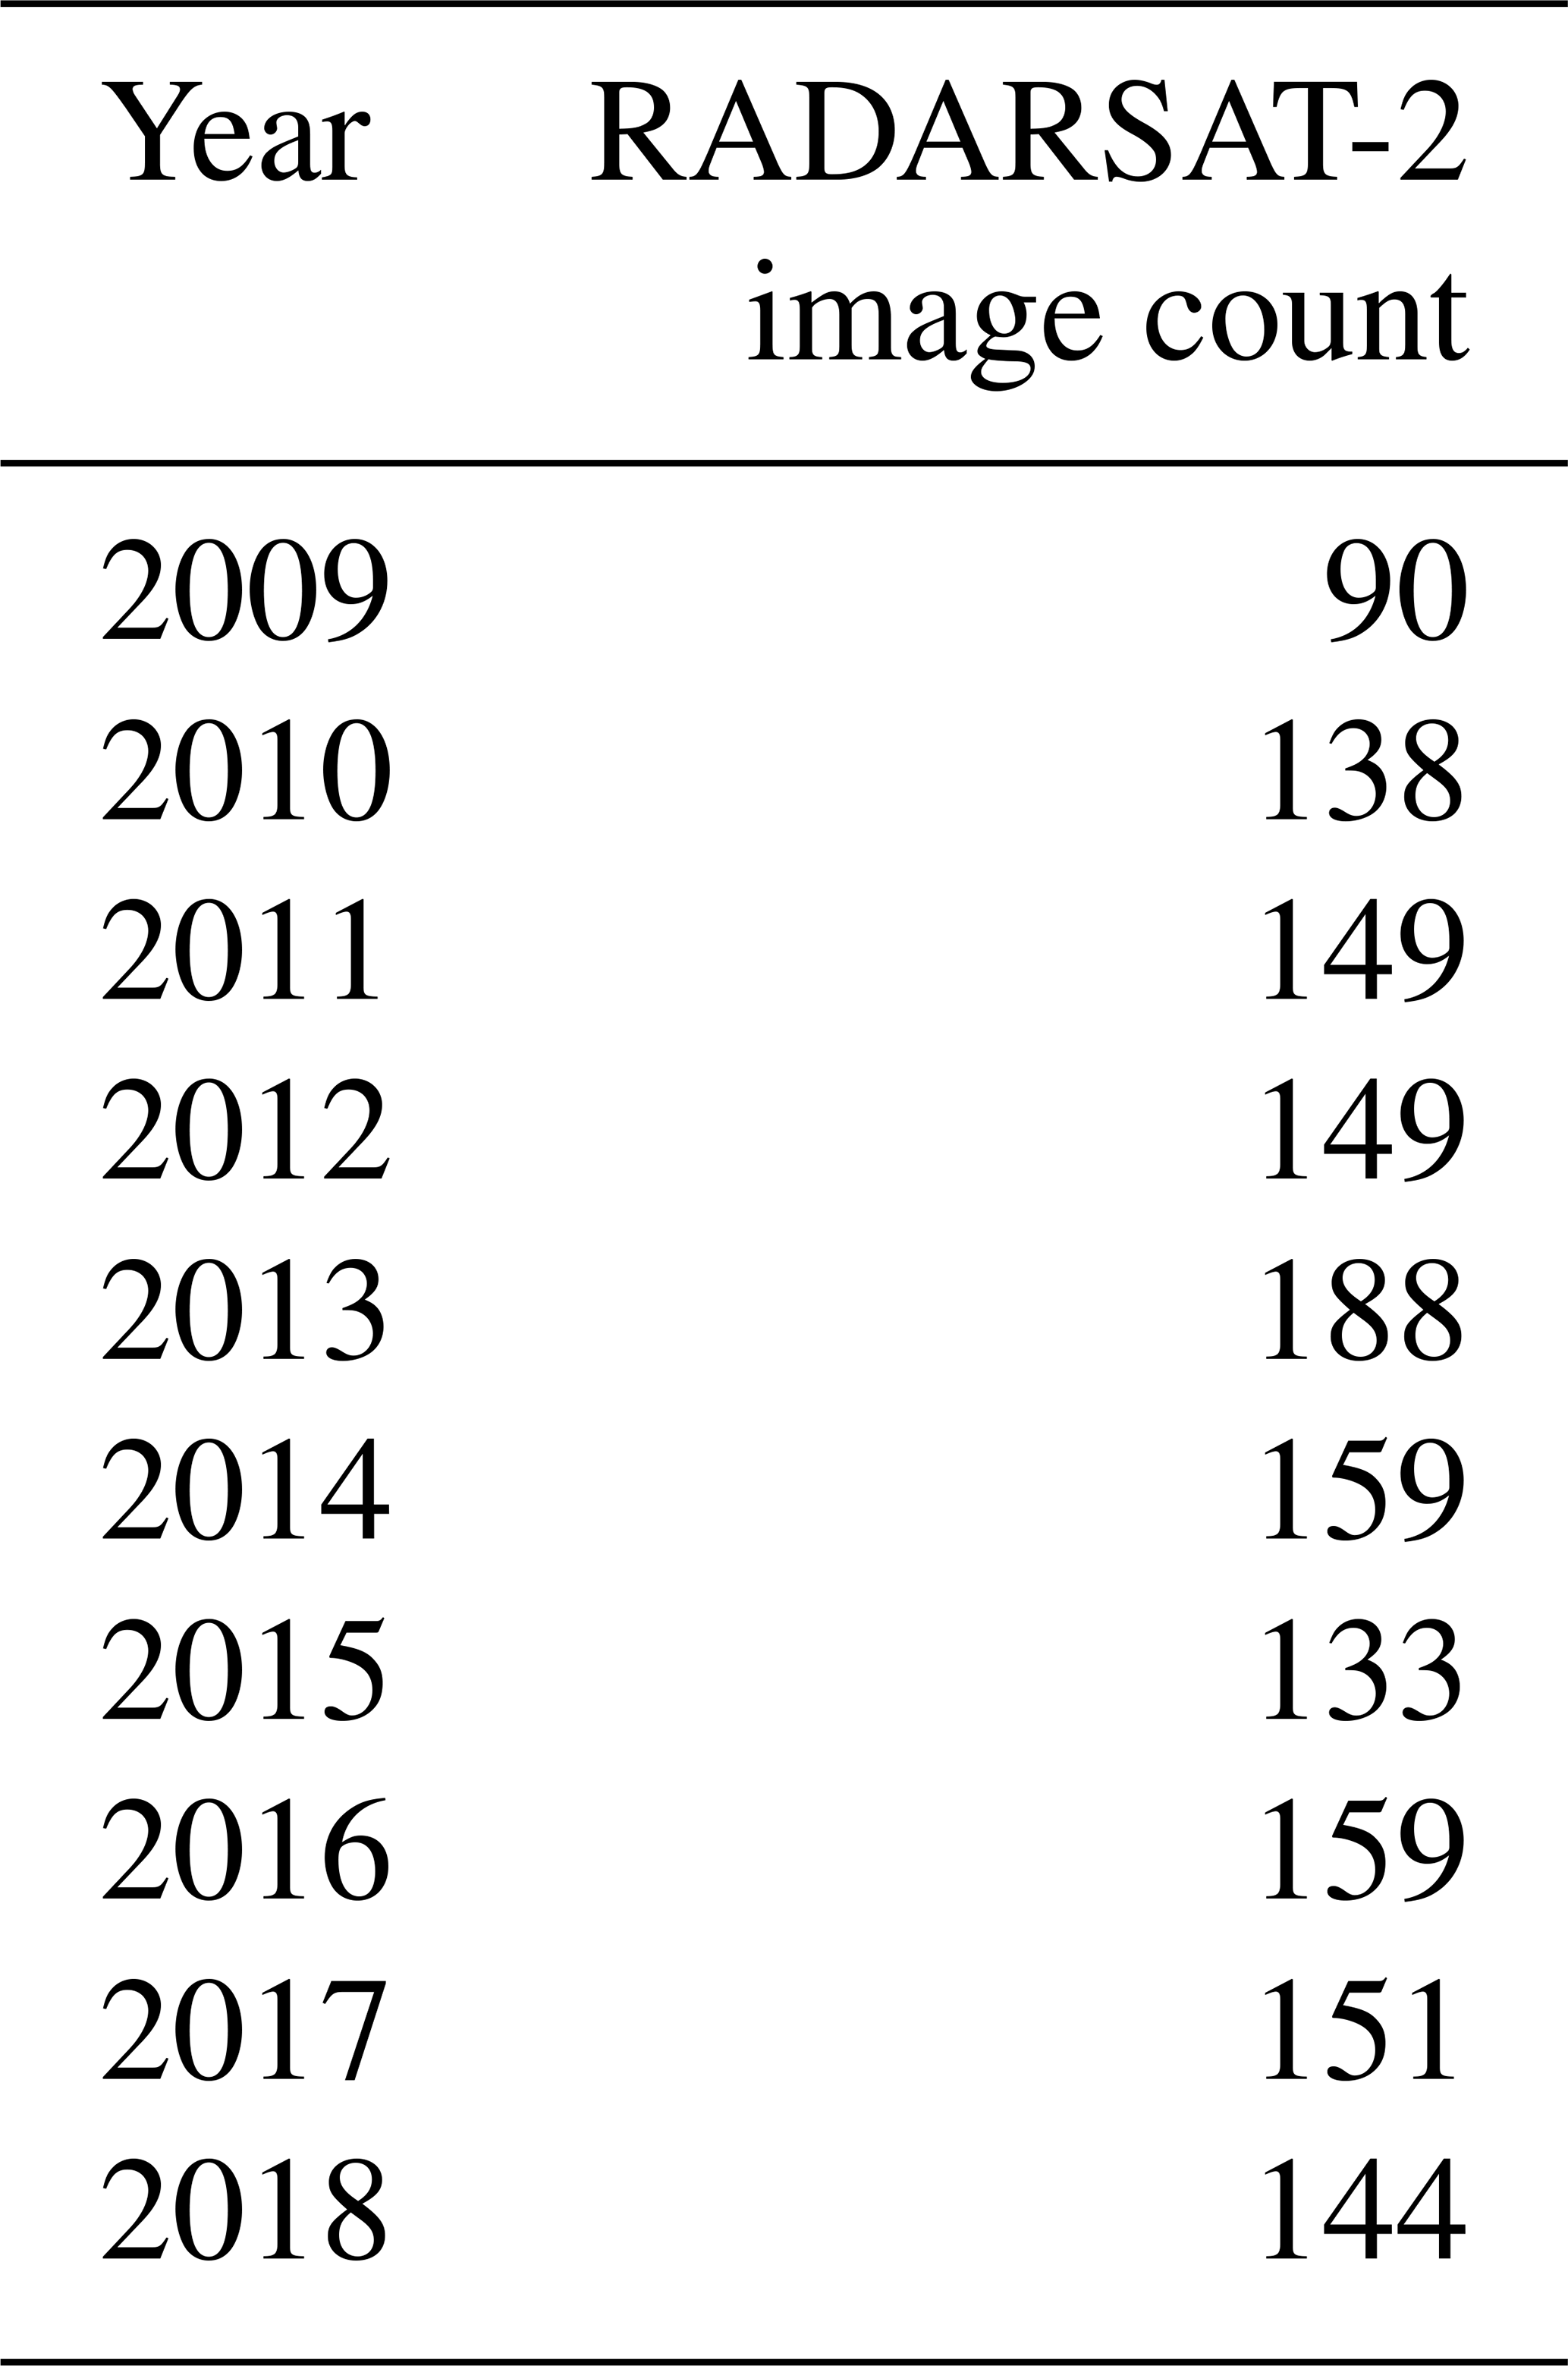
The primary dataset used in this analysis was 5.405 GHz (wavelength, λ=5.5 cm; C-band) SAR imagery in ScanSAR wide mode at HH polarization from RADARSAT-2 acquired over the CAA (Fig. 1) in April from 2009–2018 (Table 1). RADARSAT-2 ScanSAR wide mode imagery has a spatial resolution of 100 m with an incidence angle range of 20.0 to 49.3∘. We limited our analysis to only RADARSAT-2 images at HH polarization because Scharien et al. (2017) found HV produced noisy results in addition to there not being sufficient imagery at HV polarization in the early period of the RADARSAT-2 record to cover CAA in April.
Table 1Number of RADARSAT-2 images acquired over the Canadian Arctic Archipelago in April for 2009–2018.
In situ observations of fp on landfast FYI were obtained in 2 consecutive years from sites in the CAA using a terrestrial light detection and ranging (lidar) system (Landy et al., 2014) (Fig. 1, green star). In 2011, the site was located in Allen Bay on FYI with relatively rough surface topography, whereas in 2012, the site was located in Resolute Passage on FYI with relatively smooth topography. At each site, time series of fp observations were collected within the same 100×100 m area of the ice over a 2- to 3-week period following melt onset, covering three of the four stages of melt pond evolution detailed in Eicken et al. (2002). The lidar system produces dense measurements over snow or sea ice, with specular reflection over melt ponds allowing melt pond fractions to be retrieved with an accuracy better than 5 % (Landy et al., 2014). These observations allow us to evaluate how well RADARSAT-2 resolves fpk of seasonally evolving sea ice coverage.
Aerial photographs of estimated fp directly over the lidar site and the adjacent sea ice area away from land and open water were also obtained on 22 June 2012. The aerial photographs have a 0.22 m pixel resolution, covering 750 m by 750 m. In total, 123 aerial photographs of fp were used, and a complete description of the dataset is provided in Scharien et al. (2014).
Finally, we made use of 8 d composite satellite observations of fp obtained from the MODIS Arctic melt pond cover fraction dataset that has a spatial resolution of 12.5 km for the period of 2009–2011 (Rösel et al., 2012) and weekly sea ice area and stage of development observations obtained from the Canadian Ice Service Digital Archive (CISDA) regional ice charts for the period of 2009–2018 (Tivy et al., 2011).
2.2 Estimating fpk from RADARSAT-2
RADARSAT-2 fpk was determined using a modified approach to that described by Scharien et al. (2017). Their approach determines the second stage of the seasonal melt pond evolution cycle when fp is at its peak (Eicken et al., 2002; Polashenski et al., 2012) using Sentinel-1 Extra Wide (EW) swath imagery obtained during April within the CAA. April corresponds to late winter sea ice conditions in the CAA, when sea ice growth has reached its maximum and spring warming has yet to begin. Their approach was developed by relating the winter period HH gamma nought (γ∘) backscatter in decibels (dB) from Sentinel-1 to fpk observations in 1.7 m spatial resolution GeoEye-1 imagery, from spatially coincident image segments that represented homogeneous FYI and MYI regions. The result was that γ∘ can be converted to fpk using the following equation:
In Eq. (1), γ∘ was found to explain 73 % of the variability in fpk (Scharien et al., 2017).
In this study, all the available HH polarization RADARSAT-2 imagery over the CAA in April from 2009–2018 (Table 1) was first calibrated to γ∘ which minimizes the influence of incidence angle more so than with sigma nought (σ∘) (Small, 2011). RADARSAT-2 images were then speckle filtered using a 5×5 Lee filter and spatially registered to a common map projection. Finally, γ∘ was converted to fpk by applying Eq. (1) to each RADARSAT-2 image. For each year, the corresponding RADARSAT-2 fpk images in April were mosaicked together to cover the entire spatial domain of the CAA. Constructing a mosaic over a large region such as the CAA presents certain challenges with SAR imagery, particularly incidence angle variability. Even with the use of γ∘, Scharien et al. (2017) found that because of varying incidence angles associated with different ScanSAR images that fpk striping can still occur within the CAA in the mosaicked image. Our approach here was to average out incidence angle variability by taking advantage of a large amount of overlapping RADARSAT-2 imagery within the CAA (i.e. 90 to 159 images; Table 1) together with the fact that the majority of the sea ice in the CAA is landfast (immobile) during April, which results in a temporally stable fpk for all April images. To produce a RADARSAT-2 fpk mosaic within the CAA for each year, we calculated the mean fpk for each overlapping pixel using all of each year's RADARSAT-2 April images that effectively helped to reduce fpk striping across the CAA.
The root-mean-square error (RMSE) of fpk based on Eq. (1) is 0.085 (Scharien et al., 2017). While calculating the mean fpk of the overlapping image pixels helps reduce striping across the CAA, it also adds additional uncertainty and its effectiveness depends on the number of overlaps. In order to quantify the additional uncertainty (RMSER2), we used the mean and maximum standard deviation of RADARSAT-2 fpk of all pixels within the CAA calculated from 2009–2018 (fstd) together with a range of pixel overlaps (n) in the following equation:
Since RADARSAT-2 imagery is acquired operationally, overlapping images vary interannually but pixel overlaps across the CAA were typically between 6–12. Figure 2 illustrates the RMSER2 values for a range of pixel overlaps using the 2009–2018 mean fstd value of 0.08 and the 2009–2018 maximum fstd value of 0.2. For the maximum fstd with pixel overlaps between 6–12 the RMSER2 ranges from 0.10–0.12.

Figure 2The root-mean-square error of RADARSAT-2 peak melt pond fraction values (RMSER2) with increasing number of RADARSAT-2 pixel overlaps. The vertical dashed lines indicate the range of typical overlap from 2009–2018.
3.1 RADARSAT-2 fpk spatial and temporal variability from 2009–2018
The spatial distribution of mosaicked RADARSAT-2 fpk and pre-melt season (i.e. April) and sea ice stage of developed conditions in the CAA for the 2009–2018 time period are shown in Figs. 3 and 4, respectively. Lower fpk values are located primarily in the northern regions of the CAA (Queen Elizabeth Islands), Viscount Melville Sound, and the M'Clintock Channel where the majority of the CAA's MYI is typically found. The shallow bays and narrow channels located throughout the CAA exhibit high fpk values and these regions are typically associated with smooth FYI whereas rougher ice regions (i.e. Gulf of Boothia) are associated with lower fpk values. We should expect a lower fpk over MYI regions compared to FYI regions (Grenfell and Perovich, 2004; Perovich and Polashenski, 2012), and indeed the overall spatial distribution of RADARSAT-2 fpk is in excellent agreement with the spatial distribution of sea ice stage of development prior to the melt season for all years.
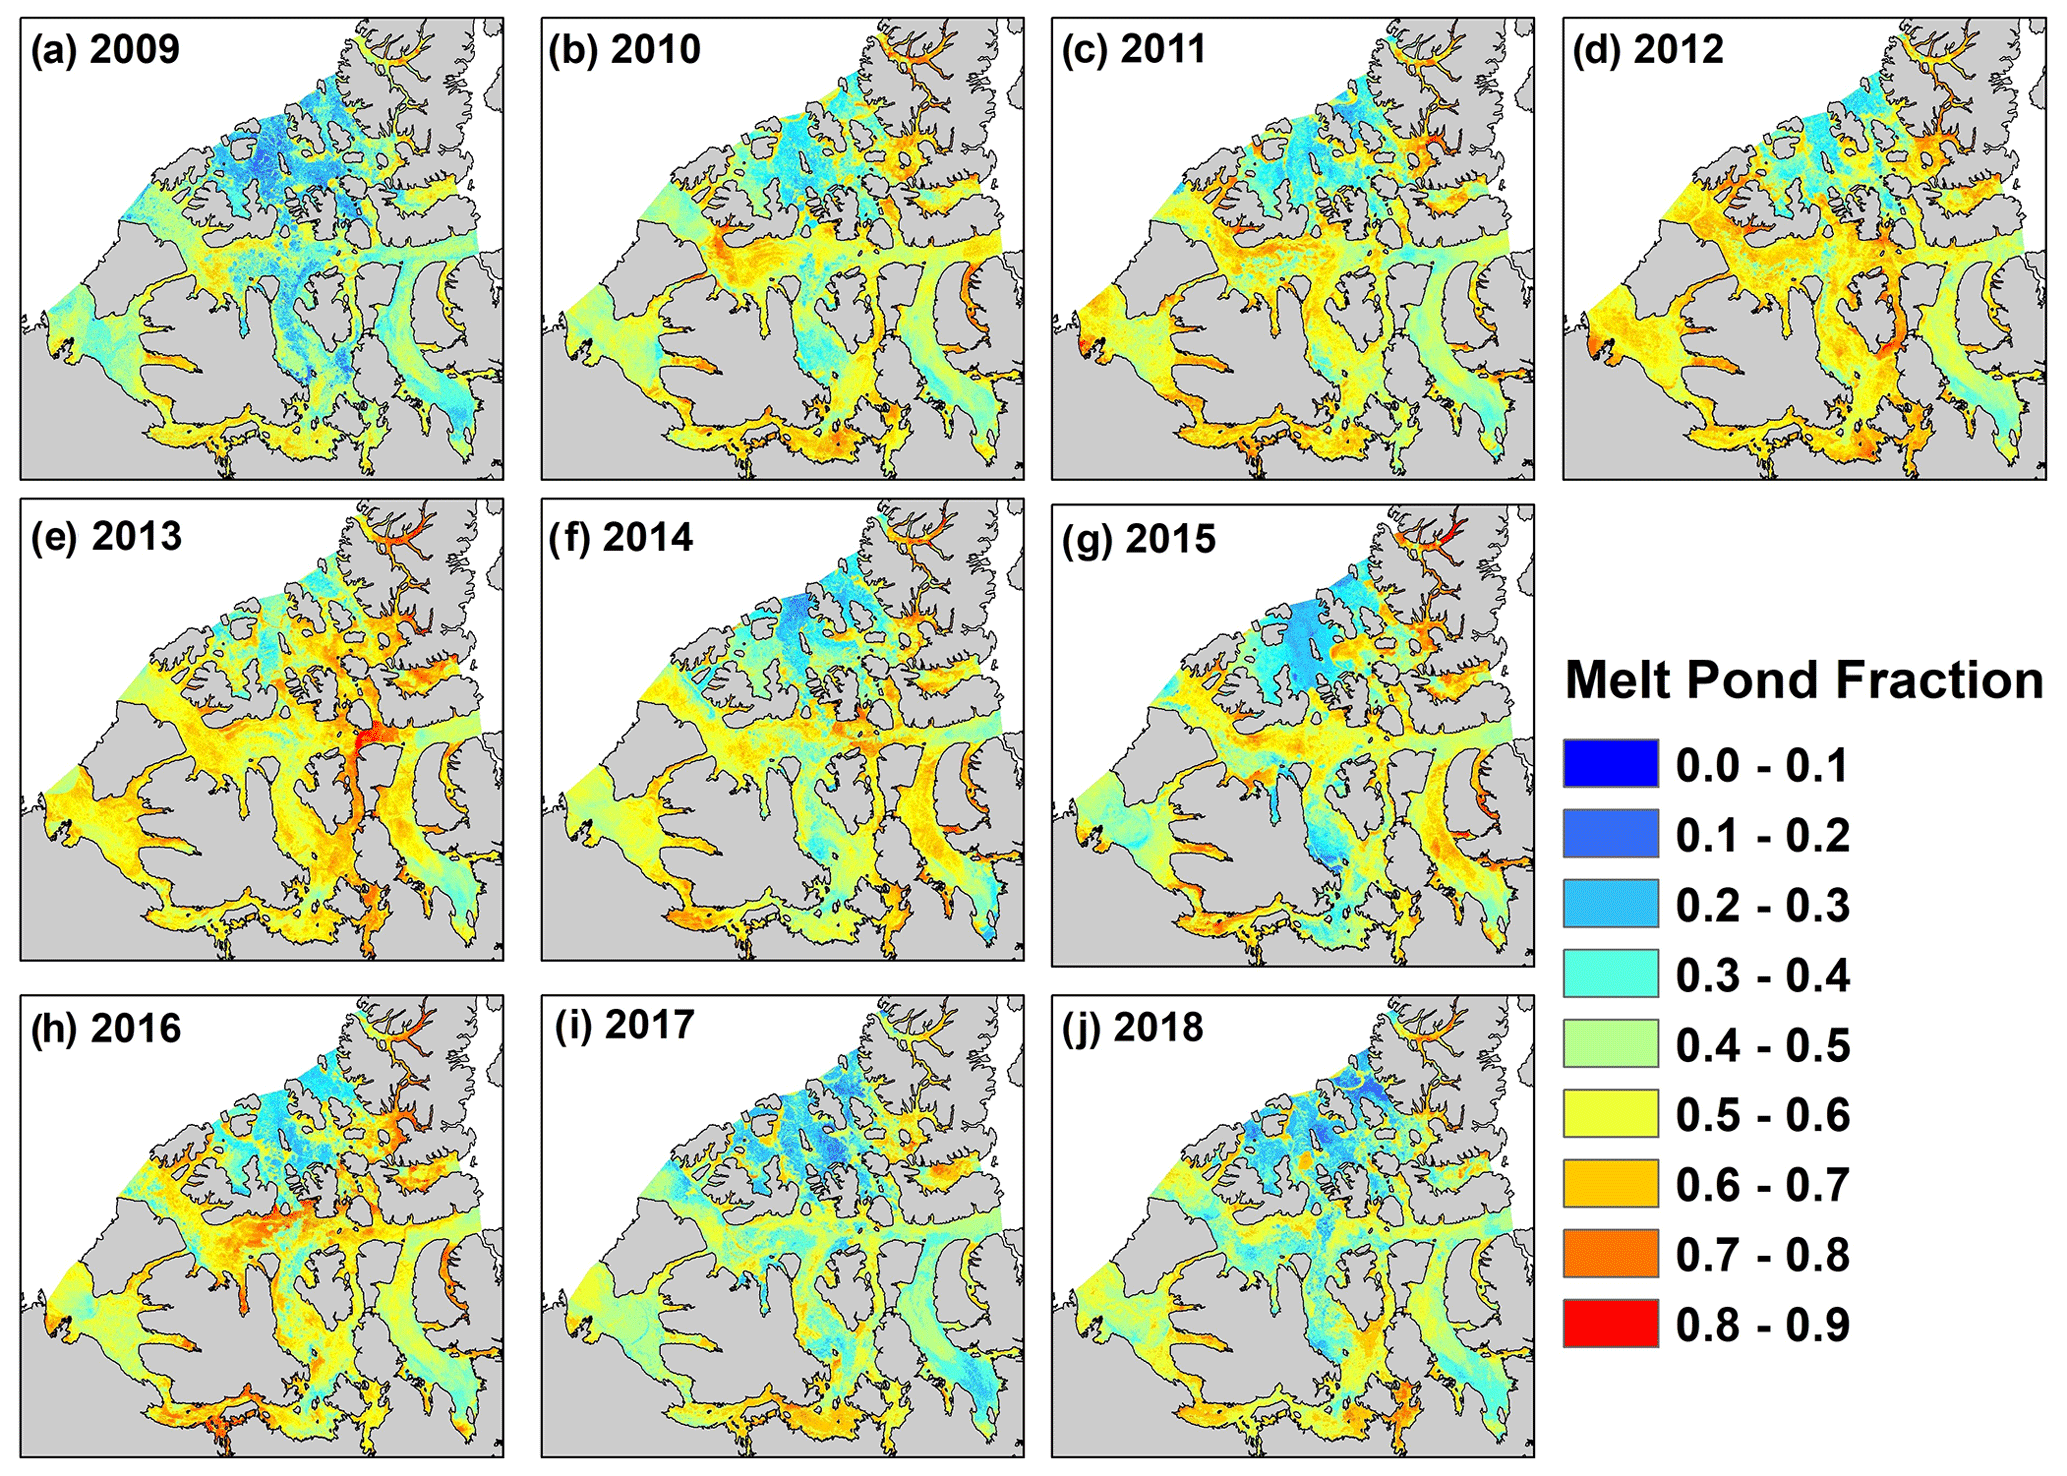
Figure 3Spatial distribution of RADARSAT-2 peak melt pond fraction (fpk) in the Canadian Arctic Archipelago from 2009–2018 (a–j).
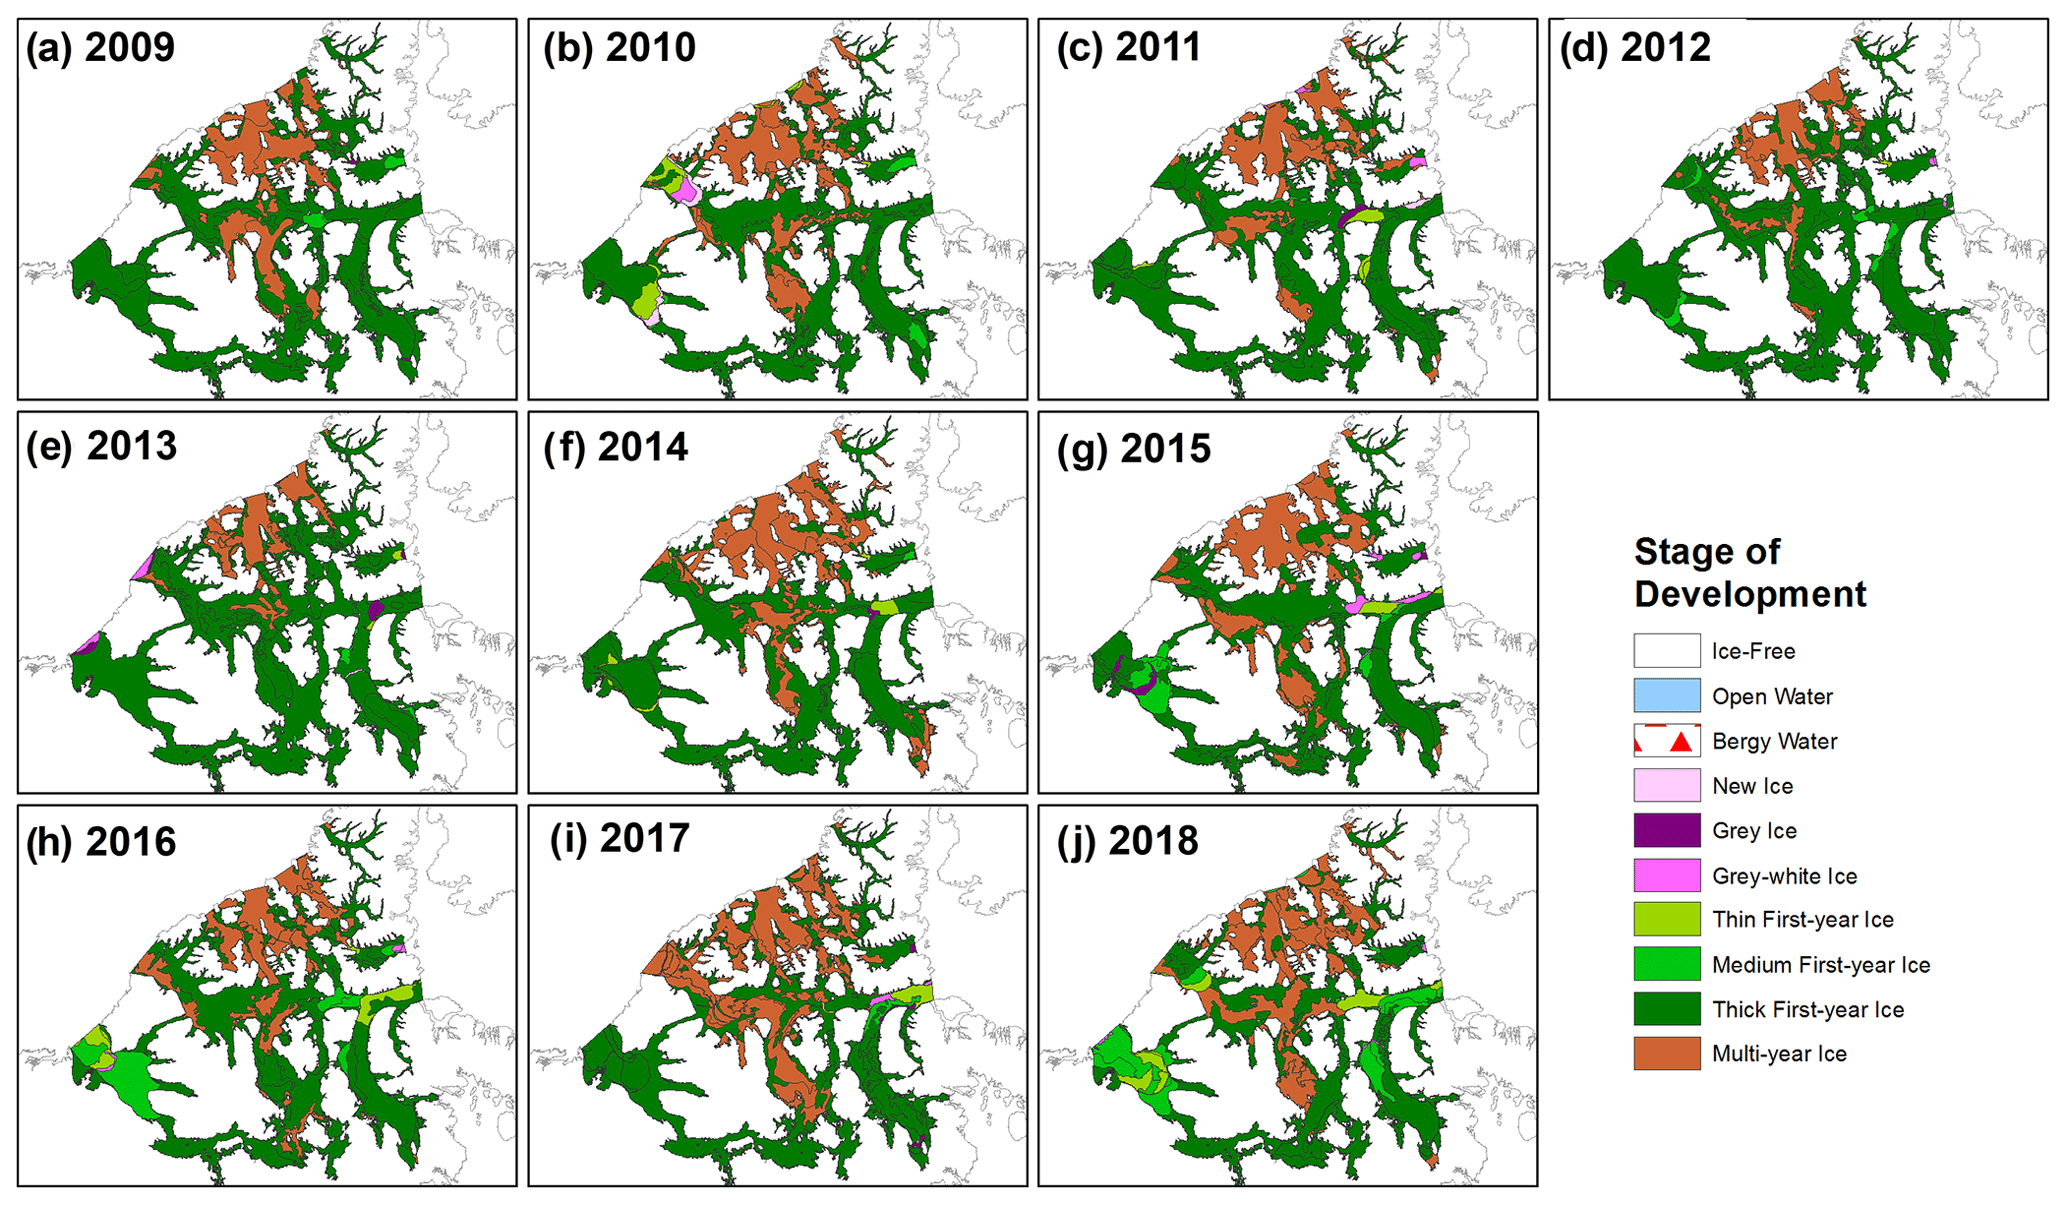
Figure 4Spatial distribution of sea ice stage of development (type) in the first week of April in the Canadian Arctic Archipelago for 2009–2018 (a–j).
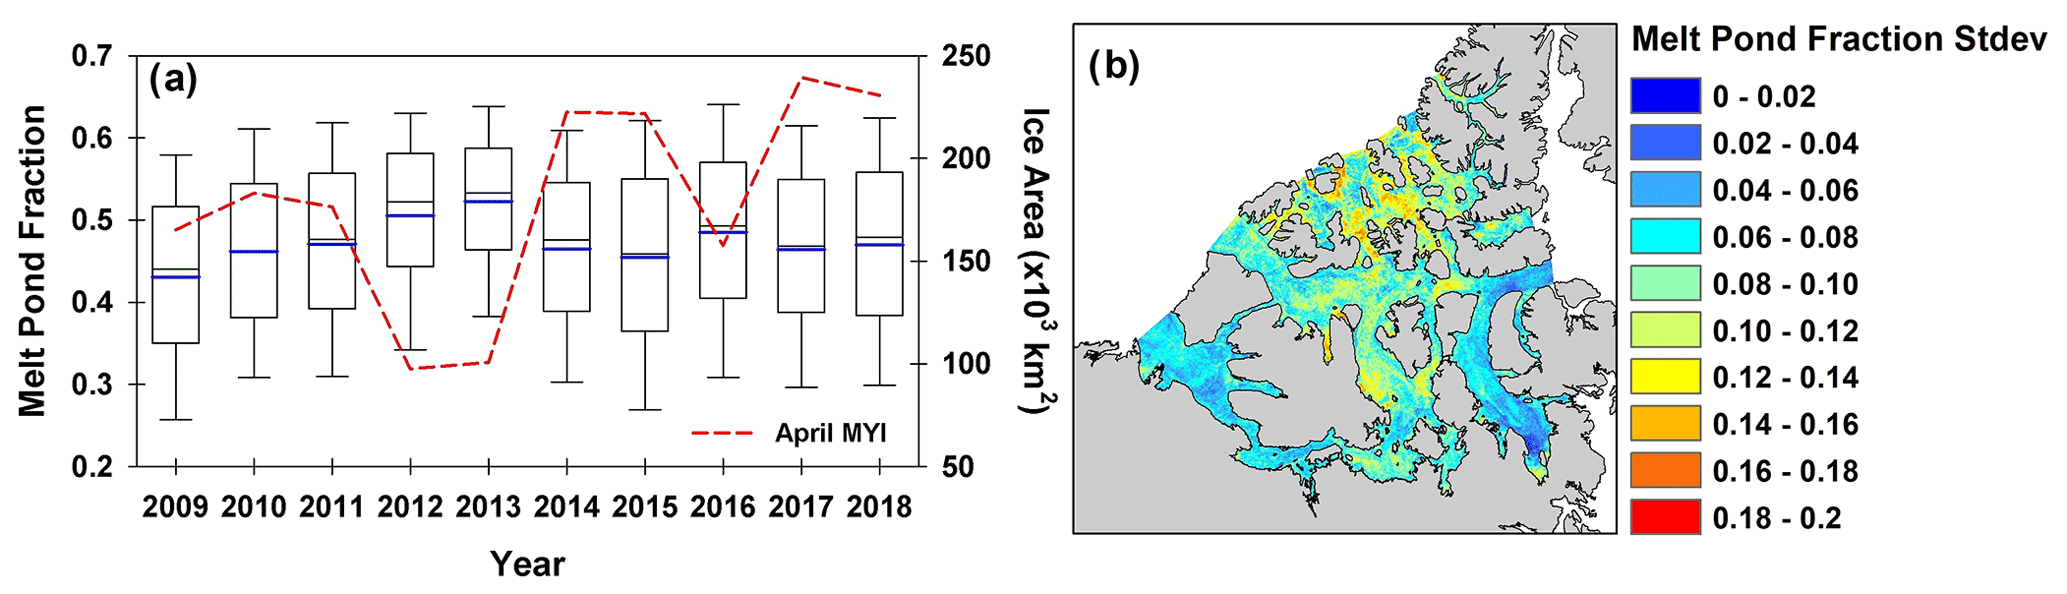
Figure 5Boxplot time series of RADARSAT-2 peak melt pond fraction (fpk) and mean April multi-year ice (MYI) area in the Canadian Arctic Archipelago for 2009–2018. The solid blue line represents the mean (a). Spatial distribution of the RADARSAT-2 fpk standard deviation from 2009–2018 (b).
Figure 5a shows the time series of RADARSAT-2 fpk variability together with mean April MYI area in the CAA from 2009–2018. Over the 10-year record, the mean RADARSAT-2 fpk was 0.47 and ranged from a low of 0.43 in 2009 to a high of 0.52 in 2013. The temporal variability in RADARSAT-2 fpk is reflected in the variability of April MYI area within the CAA over the 10-year record with a statistically significant detrended correlation (R) of .89. The RADARSAT-2 fpk linkage with April MYI area is particularly evident from 2011 and 2012 which were very light sea ice years within the CAA whereby a considerable amount of the CAA's MYI area was lost during the summer melt season (Howell et al., 2013), and this resulted in 2012 and 2013 (i.e. the years following extreme melt) being the two highest RADARSAT-2 fpk years from 2009–2018 (Fig. 3d–e). MYI area within in the CAA then increased following these light ice years and RADARSAT fpk began to respond accordingly. In fact, there has always been a period of MYI recovery following light ice years with either MYI grown in situ and/or advected from Arctic Ocean into the CAA and gradually migrating to the CAA's southern regions (Howell et al., 2013). Figure 5b illustrates the standard deviation of RADARSAT-2 fpk from 2009–2018 and spatially reflects the process of MYI flowing southward through the CAA as RADARSAT-2 fpk was more variable in the MYI regions of the CAA compared to regions where FYI dominates the regional icescape.
What is interesting in Fig. 5a is that the mean RADARSAT-2 fpk in 2009 was lower than all years from 2014–2018 (with the exception of 2016) despite the CAA containing less MYI area. In addition, 2017 and 2018 exhibited a larger spatial coverage of MYI compared to 2009 (Fig. 4a, i–j). We suggest that higher RADARSAT-2 fpk in recent years is a result of Arctic Ocean MYI entering the CAA being younger and thinner than in 2009 (Howell and Brady, 2019) with smoother surface topography, thereby having a higher summer melt pond coverage (Landy et al., 2015). This seems to be particularly evident in the Viscount Melville Sound and M'Clintock Channels regions when comparing 2009 (Fig. 3a) with 2017 (Fig. 3i) and 2018 (Fig. 3j). Indeed, several studies have reported considerable decreases in the age and thickness of Arctic Ocean MYI north of the CAA in recent years (e.g. Kwok, 2018; Petty et al., 2020; Tschudi et al., 2020)
3.2 Comparison of RADARSAT-2 fpk with Sentinel-1, in situ, and MODIS
Frequency distributions of RADARSAT-2 fpk and Sentinel-1 fpk from Scharien et al. (2017) in the CAA for 2016 and 2017 are shown in Fig. 6. Sentinel-1 appears to estimate more regions of lower fpk compared to RADARSAT-2 which are typically associated with MYI. Whereas RADARSAT-2 estimates more regions of higher fpk which are typically associated with smooth FYI. We consider these subtle differences to be primarily the result of taking the mean of all available April RADARSAT-2 imagery (Table 1) over all incidence angles in the CAA compared to only using images from Sentinel-1 within the CAA constrained to a certain incident angle range. As shown in Fig. 2, the uncertainty in RADARSAT-2 fpk varies depending on the number of pixel overlaps (images). Overall, the fpk distributions are in good agreement between both sensors.
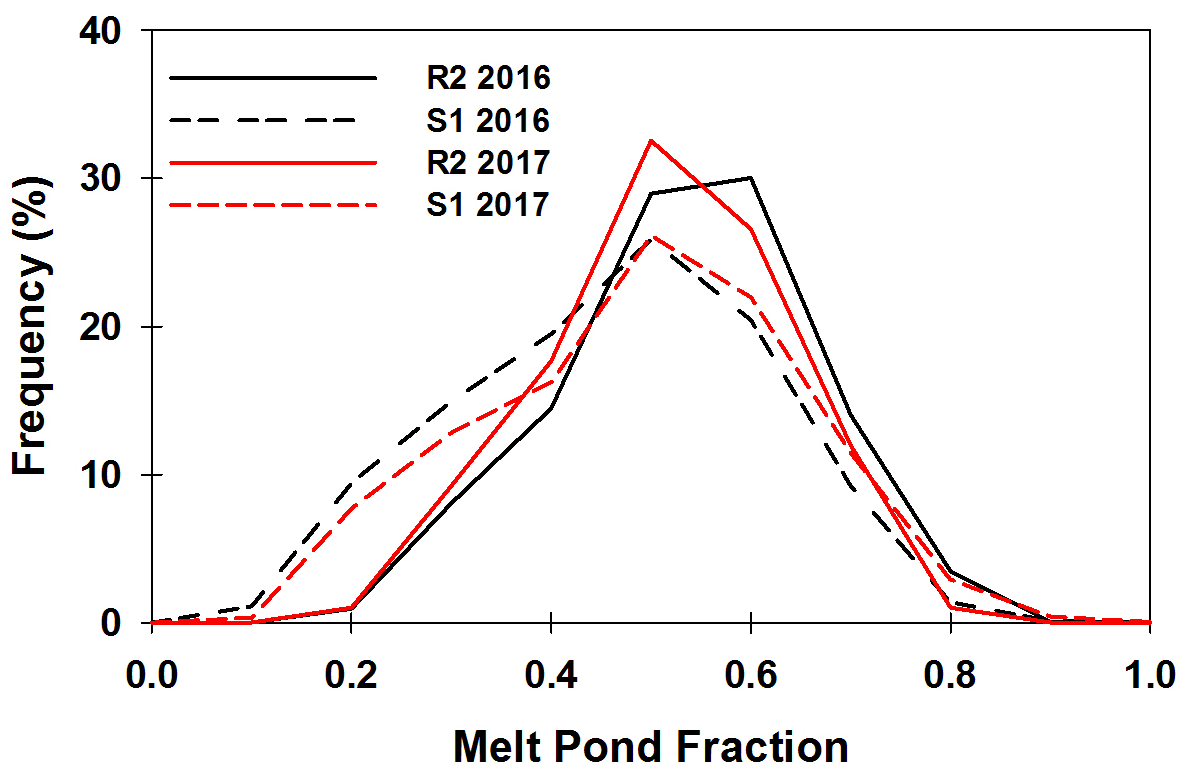
Figure 6Frequency distribution (%) of RADARSAT-2 peak melt pond fraction (fpk) and Sentinel-1 fpk from Scharien et al. (2017) in the Canadian Arctic Archipelago for 2016 and 2017.
The in situ evolution of fp over FYI within the CAA acquired by Landy et al. (2014) allows us to place the RADARSAT-2 fpk estimates within the melt pond stages of development classification system. Unfortunately, no MODIS fp observations are located in close proximity to the in situ observations. The evolution of melt ponds on the surface of the sea ice has been classified into four distinct and consecutive stages. A brief description is provided here, and the reader is referred to Eicken et al. (2002) and Polashenski et al. (2012) for a more comprehensive description. In stage I, meltwater from snowmelt fills topographic depressions on the surface of the sea ice until the ponds reach their maximum areal extent. In stage II, melt pond coverage decreases due to horizontal water transport into macroscopic flaws and drainage through the ice. In stage III, the melt ponds typically drain through to the ocean and further changes in melt pond coverage depend on changes in surface topography and freeboard. Finally, in stage IV, melt ponds that survived the melt season refreeze and snow begins to accumulate on their surface.
Figure 7a compares the time series of the entire 100 m lidar melt pond fraction coincident with the fpk determined from RADARSAT-2 at the coinciding pixels. For 2011, RADARSAT-2 fpk corresponds to the end of stage I and beginning of stage II, thus providing a very good representation of the seasonal peak of the fp, when the melt pond control on heat uptake and ice decay, through the ice–albedo feedback, is greatest. For 2012, RADARSAT-2 fpk also corresponds to the end of stage I and beginning of stage II but is ∼ 0.2 lower than in situ fp values. This is likely due to the short duration but very high maximum fp of 0.78 in 2012 as Scharien et al. (2017) found that Eq. (1) sometimes underestimates very high fp due to the low γ∘ signal associated with very smooth FYI.
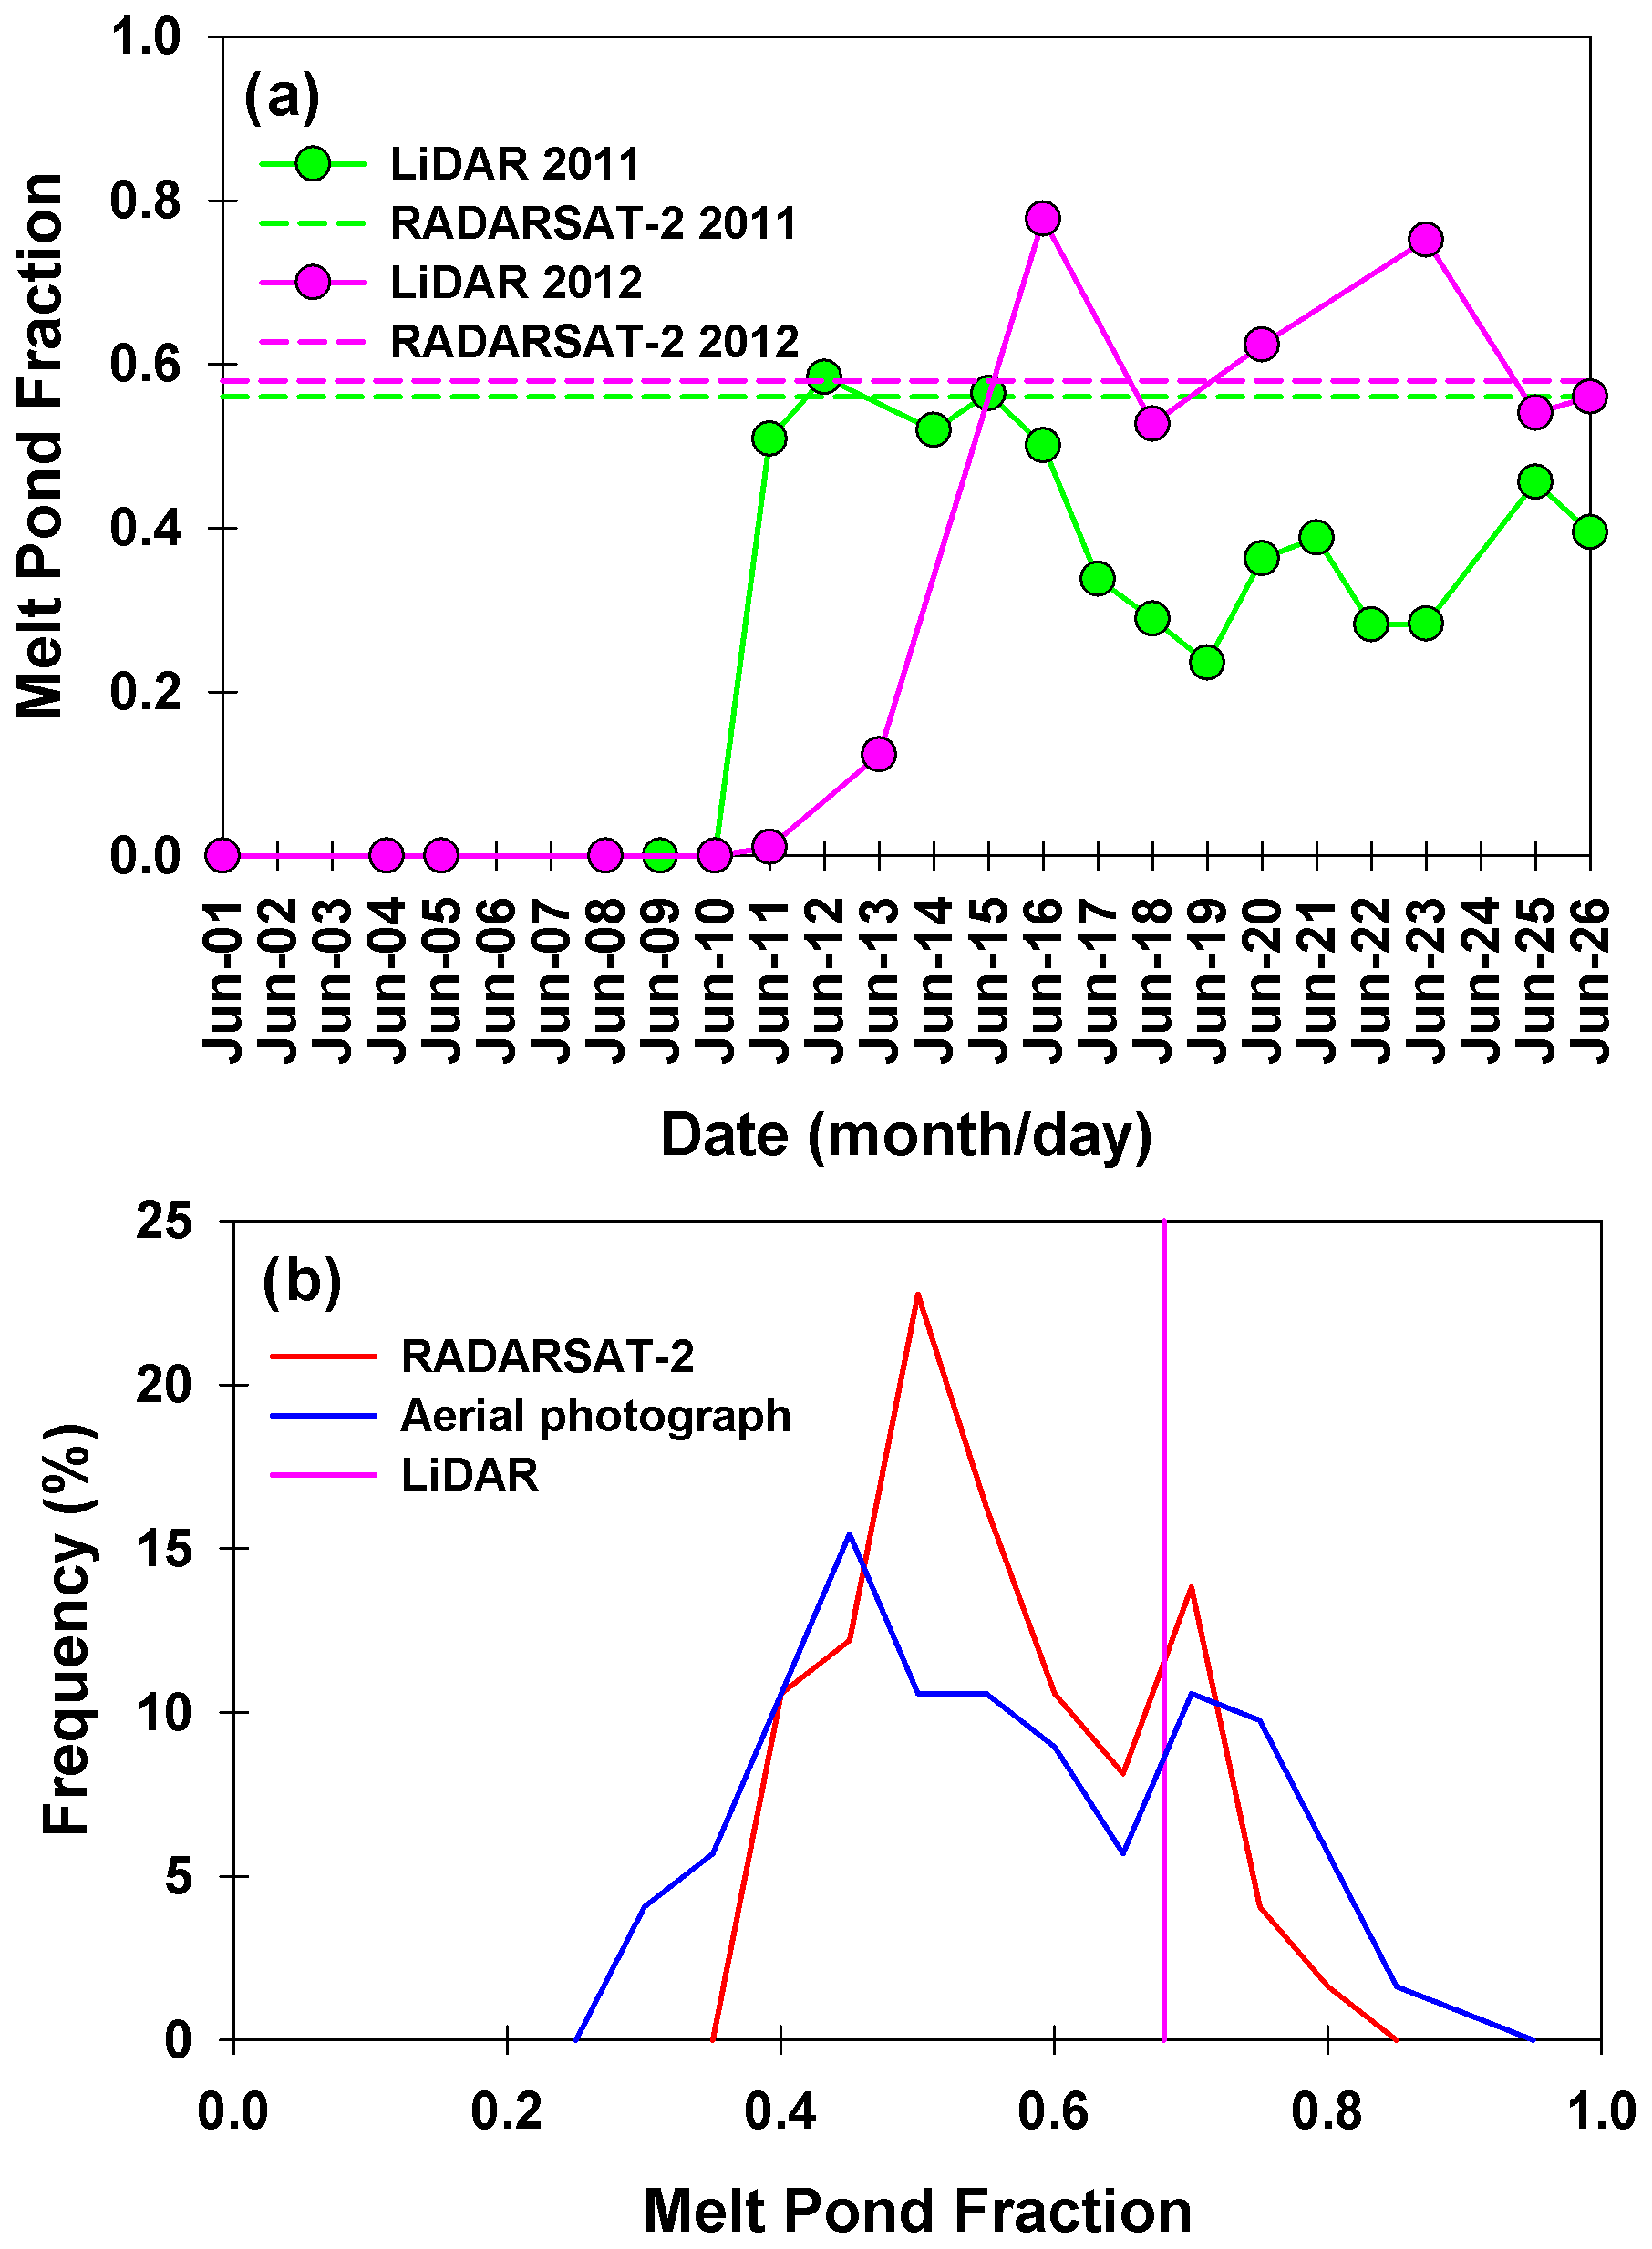
Figure 7(a) Temporal evolution of observed melt pond fraction (fp) and RADARSAT-2 peak melt pond fraction (fpk) at in situ observation sites for 2011 (74.7229∘ N, 95.1763∘ W) and 2012 (74.7264∘ N, 95.5772∘ W). (b) Frequency distribution of RADARSAT-2 fpk and aerial photograph fp observations in Resolute Passage on 22 June 2012; the pink vertical link represents the mean lidar fp on 22 June 2012.
To give spatial context beyond the single-point comparison at the lidar site, Fig. 7b shows the distribution of RADARSAT-2 fpk and the fp determined from aerial photo observations on 22 June 2012 near Resolute. The aerial photographs were acquired within 1 week of fpk coverage being observed at the lidar site. The comparison was done by averaging all RADARSAT-2 pixels within each aerial photo (123 photos) which represents ∼ 861 samples. The mean aerial photograph fp was 0.54 and RADARSAT-2 fpk was 0.53 with an the RMSE of 0.10 and bias of 0. The distributions are in reasonably good agreement but RADARSAT-2 values are slightly narrower than the distribution of fp from the aerial photographs. It is likely the RADARSAT-2 distribution is narrow on the left tail because our method captures peak pond coverage, and some of the regions photographed were before or after their seasonal peak. We attribute the narrow right tail to the documented underestimation of Eq. (1) from Scharien et al. (2017). However, it is notable that both RADARSAT-2 and the aerial photograph datasets capture the same bimodal fp distribution, with the first mode around 0.4–0.5 characterizing rougher sea ice areas and the second mode around 0.7 capturing smooth flooded sea ice.
The seasonal time series of the 8 d composite MODIS fp, the maximum seasonal MODIS fp and the predicted RADARSAT-2 fpk for 2009–2011 is shown in Fig. 8. MODIS fp observations within the CAA indicate initial pond formation occurred in May for all years with fpk reached in mid-July for 2009 and in early June for 2010 and 2011. Compared to the RADARSAT-2 fpk values, the peak MODIS fp is ∼ 0.20 smaller. RADARSAT-2 fpk is higher on average than MODIS because the MODIS 8 d product does not represent fpk. The MODIS fp observations are determined weekly using 8 d composite image products that would include some melt pond formation and drainage processes prior to, and after, the seasonal peak. Moreover, MODIS fp values are essentially aggregated from 500 m clear-sky pixels within a 12.5 km × 12.5 km grid cell (Rösel et al., 2012) and the 500 m spatial resolution may limit detection of smaller pond fractions. Furthermore, not all of the 500 m pixels within the 12.5 km × 12.5 km grid cell are likely to be at the same melt pond stage evolution. Finally, MODIS fp observations give the time series of fp; therefore even the highest seasonal estimated MODIS fp is reduced because while some regions of the CAA are at their seasonal peak others are behind or ahead. To that end, we also calculated the maximum fp from MODIS regardless of timing during the melt season, for each pixel, also shown in Fig. 8. These values more closely compare with the RADARSAT-2 fpk but are still ∼ 0.05 smaller on average. Even the maximum fp from MODIS is from an 8 d running mean of daily pond fraction estimates, so will underestimate the fpk if the duration of peak ponding is < 8 d. However, the top whisker of the box plot of the maximum fp from MODIS indicates that MODIS does capture some regions at peak during the 8 d time series. Although we are using MODIS fp product to compare against our RADARSAT-2 fpk estimates, Rösel et al. (2012) found that the MODIS fp product also has errors up to ∼ 0.1. Overall, MODIS fp estimates are more representative of the seasonal mean fp rather than fpk within the CAA.

Figure 8Boxplots of the seasonal time series of MODIS melt pond fraction (fp), the maximum seasonal MODIS fp and RADARSAT-2 peak melt pond fraction (fpk) for (a) 2009, (b) 2010 and (c) 2011. The solid blue line represents the mean.
3.3 Influence of RADARSAT-2 fpk on summer sea ice area
In order to investigate whether RADARSAT-2 fpk values can be used to provide predictive information for summer sea ice area within the CAA, we separated the CAA into numerous predefined subregions and then determined the detrended correlations between RADARSAT-2 fpk and weekly sea ice area from the CISDA regional ice charts in each region over the period of 2009–2018. We tested each week from the start of June to the end of September. The strongest correlation, together with the corresponding week of occurrence are shown in Fig. 9a and b, respectively. All the strongest correlations are negative, indicating – as expected – that years with higher predicted fpk values are associated with lower sea ice area at a later point in the summer. The higher fpk the lower the area-averaged albedo of the ice surface leading to accelerated melt and lower sea ice concentrations (e.g. Perovich and Polashenski, 2012). There is considerable spatial variability in the strongest correlation across the CAA with relatively low correlations in the majority of the northern CAA and very low correlations in the eastern regions of the CAA. The regions of Kellet-Crozier (0.92), Viscount Melville Sound (0.73), M'Clintock Channel (0.77), and Norwegian Bay (0.78) all exhibit statistically significant correlations above the 95 % confidence level. In terms of timing for the statistically significant regions, RADARSAT-2 fpk correlated the strongest to weekly sea ice area in August for all regions except Norwegian Bay (Fig. 9b). Compared to previous studies, the primary difference between using fp values to predict summer sea ice conditions seems to be the timing of when the correlation is the strongest. Using simulated fp values, Schröder et al. (2014) found the strongest correlation to September sea ice occurred for the May fp. Liu et al. (2015) used observed MODIS fp values and reported the strongest correlation to September sea ice in late July. Our findings suggest that methods such as these may be able to predict August sea ice area from fpk simulations or observations with higher confidence than September ice area, at least in the CAA.
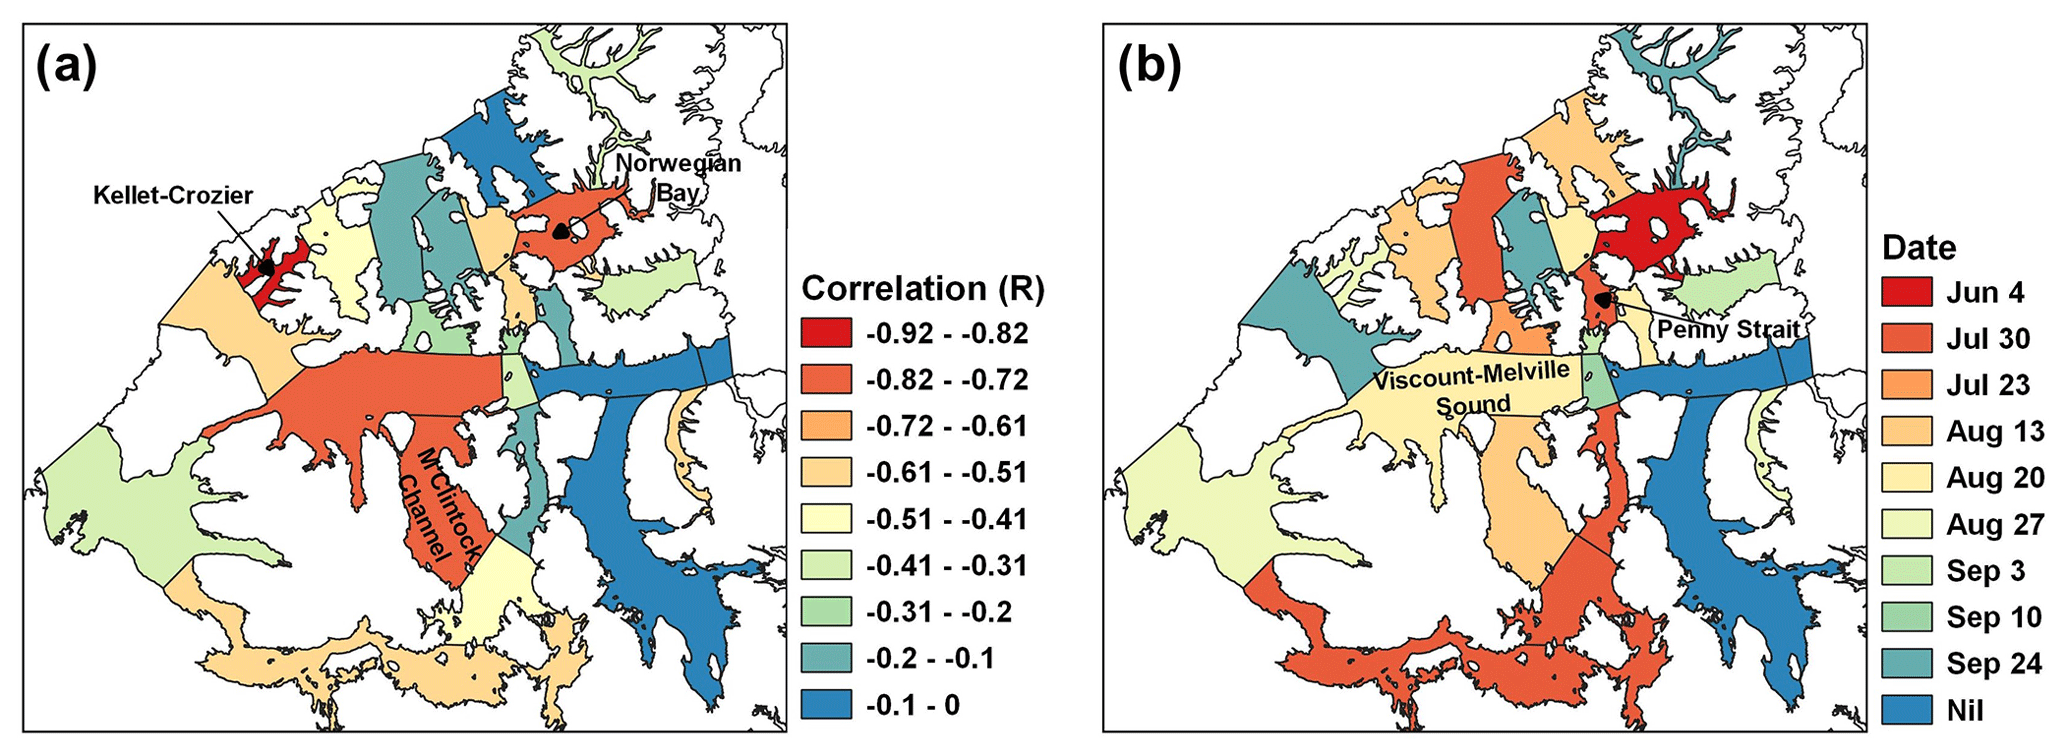
Figure 9Spatial distribution of the (a) strongest detrended correlation (R) between RADARSAT-2 peak melt pond fraction (fpk) and weekly sea ice area and (b) week of occurrence.
Why is the relationship stronger in some regions of the CAA and weaker in others? RADARSAT-2 fpk values are determined from imagery acquired in April when ice conditions in the CAA are landfast (immobile) and do not evolve in concert with sea ice dynamics operating within the CAA. As a result, RADARSAT-2 fpk values will not be spatially representative of the region's ice conditions when region-specific dynamic breakup processes dominate over thermodynamics (i.e. in situ melt). In other words, the origin of the ice in these regions during the summer melt season will not always be the same as in April (i.e. pre-melt) when the initial RADARSAT-2 fpk value was determined. The time series of weekly detrended RADARSAT-2 fpk and weekly sea ice area for selected regions within the CAA is shown in Fig. 10 and provides evidence for this regional dichotomy. In the Viscount Melville Sound and M'Clintock regions the correlations gradually get stronger, reaching a peak in August. These regions are known to be immobile and stagnant (e.g. Melling, 2002) with the majority of breakup taking place in September, which is when the relationship begins to degrade. The Kellet-Crozier is another stagnant region, which supports that in the absence of considerable ice dynamics the relationship between RADARSAT-2 fpk and sea ice area is strong throughout the melt season. The time series in Penny Strait illustrates how the correlation gradually increases but when the region's dynamic breakup begins in July, ice is advected southward which degrades the correlation. This was also the case for many other regions in the northern CAA (not shown) as the flushing of sea ice southward from the northern CAA is a regular occurrence during the melt season (Melling, 2002; Howell et al., 2006). The low correlations in the southeastern regions of the CAA are also likely a function of ice dynamics as these regions of the CAA are known to be considerably influenced by currents and wind (Prinsenberg and Hamilton, 2005), and sea ice speed in Lancaster Sound and Barrow Strait can reach 10 km d−1 (Agnew et al., 2008).
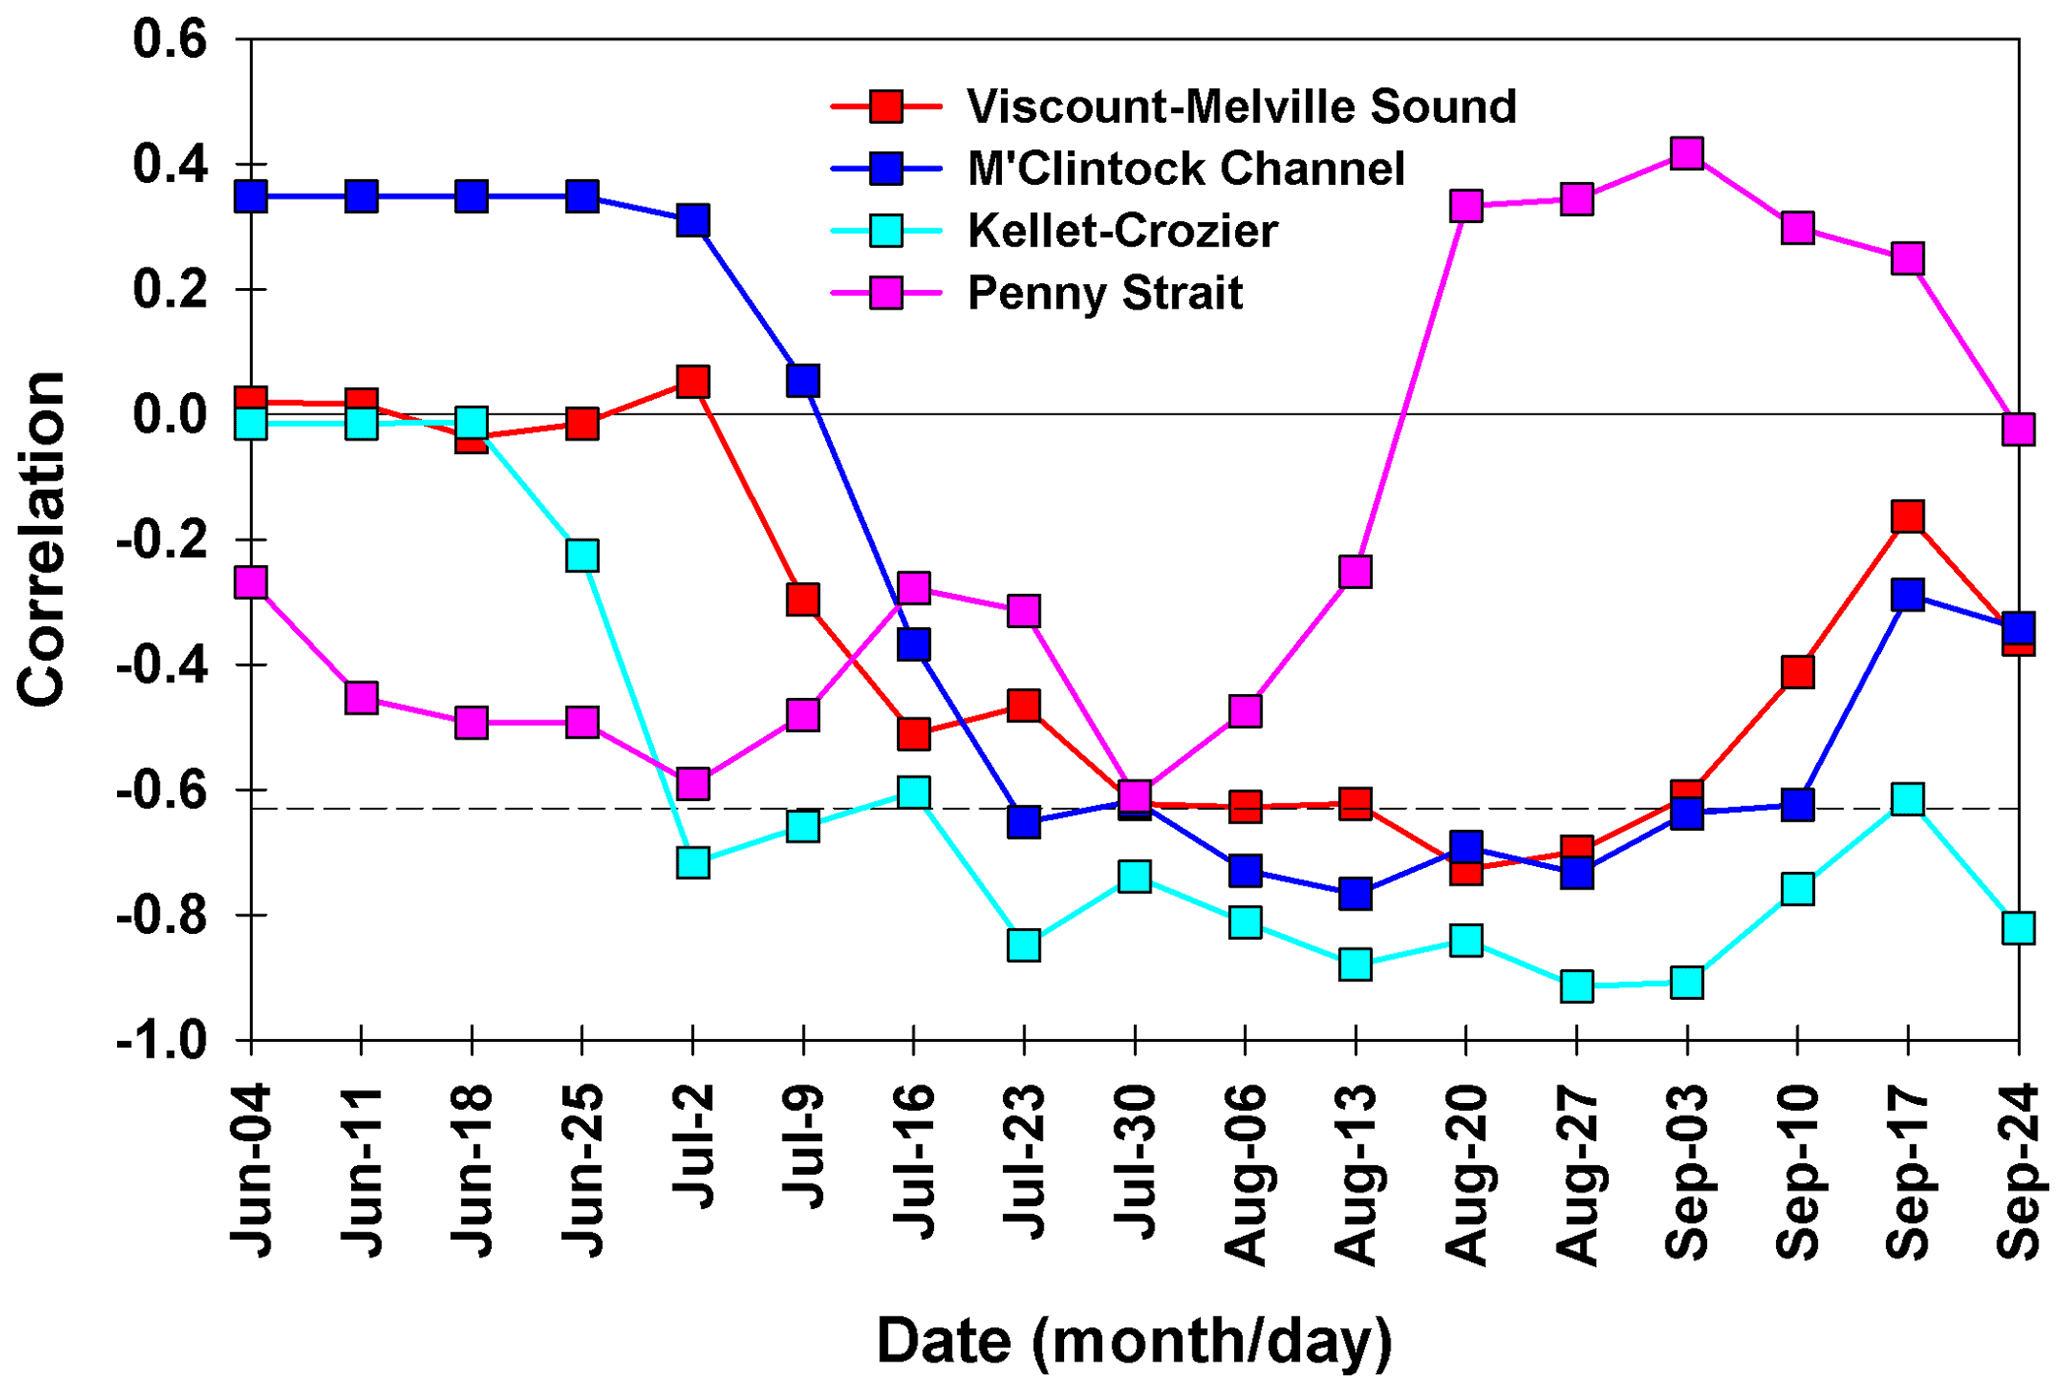
Figure 10Time series of detrended correlations between RADARSAT-2 peak melt pond fraction (fpk) and weekly sea ice area for selected regions in the Canadian Arctic Archipelago from June to September. The dashed black line is statistical significance at the 95 % confidence level.
The strong and statistically significant correlation in the Viscount Melville Sound region is encouraging as it is a key shipping region in the northern route of the Northwest Passage. To that end, we used linear regression to predict mean August sea ice area within Viscount Melville Sound with the detrended RADARSAT-2 fpk values as a predictor. Figure 11 illustrates the results compared to observations (detrended) from the CISDA ice charts for 2009–2018. There is reasonable agreement between the predicted and observed sea ice area in the region with an RMSE of 18×103 km2 and an R2=0.44. The largest discrepancies occurred for 2013 and 2014 with the RADARSAT-2 fpk model prediction resulting in too little sea ice area. Overall, within the Viscount Melville Sound region of CAA there is a period for which a significant statistical relationship exists between RADARSAT-2 fpk and the summer ice area before sea ice dynamics degrades the relationship.
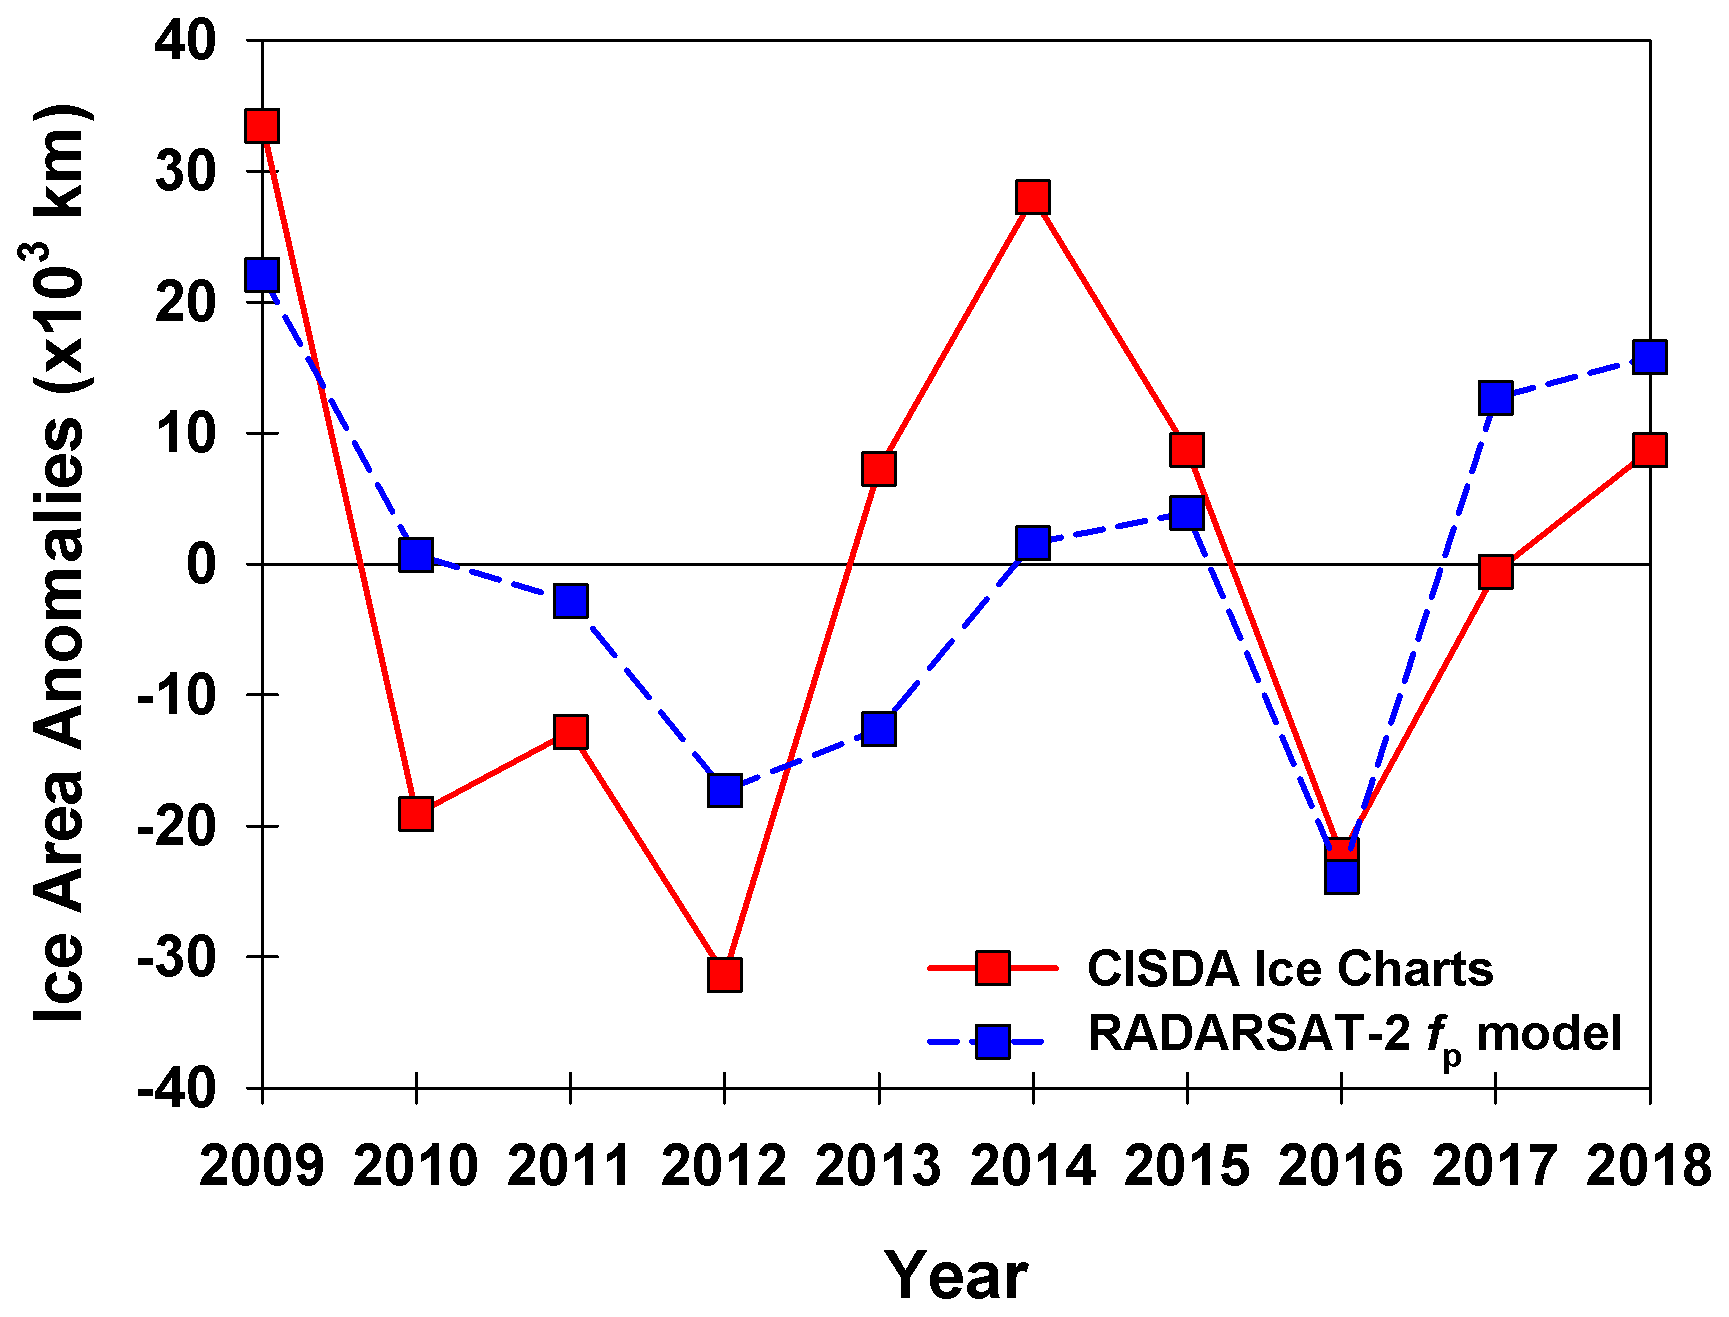
Figure 11Predicated sea ice area anomalies (detrended) using RADARSAT-2 peak melt pond fraction (fpk) and observed sea ice area anomalies (detrended) from the Canadian Ice Service Digital Archive (CISDA) ice charts in the Viscount Melville Sound region of the Canadian Arctic Archipelago, 2009–2018.
In this study we predicted and analyzed spring fpk using RADARSAT-2 within the CAA from 2009–2018. The spatial variability in RADARSAT-2 fpk was found to be excellent agreement with the spatial distribution of sea ice stage of development prior to the melt season as high (low) fpk values were associated with FYI (MYI) types. The temporal variability of RADARSAT-2 fpk over the 10-year record was significantly correlated to April MYI area, highlighting the importance of MYI within the CAA. RADARSAT-2 fpk was found to be in good agreement with the fpk maximum extent observed in situ for 2011 but was slightly lower than 2012 when peak fp was very large (> 0.7). Compared to peak MODIS fp values, RADARSAT-2 fpk values were larger by ∼ 0.05. Based on our comparative analysis, RADARSAT-2 fpk is more representative of peak fp within the CAA compared to the MODIS 8 d product, which on average was found to underestimate fpk by ∼ 0.2 and is more representative of the seasonal mean fp. We also found excellent agreement between RADARSAT-2 and Sentinel-1, which suggests that combining both Sentinel-1 and the recently launched RADARSAT Constellation Mission (RCM) could facilitate pan-Arctic fpk estimates. The RCM will also facilitate continued investigation of additional metrics that when combined with γ∘ could further improve predicted fpk.
The results presented in this study indicate that dynamically stable sea ice regions within the CAA exhibit a higher detrended correlation between RADARSAT-2 fpk and summer sea ice area. Specifically, the strong and statistically significant de-trended correlation in the Viscount Melville Sound region demonstrates that RADARSAT-2 fpk estimates are useful for providing predictive information about summer sea ice area in the northern route of the Northwest Passage. This information could find utility in constraining regional model simulations (e.g. Lemieux et al., 2016). Alternatively, it could be advantageous to exploit the high spatial resolution of SAR and investigate whether local-scale fpk estimates could enhanced knowledge of summer ice conditions in northern communities (e.g. Cooley et al., 2020). Ultimately, imagery from RCM will ensure our time series of RADARSAT-2 fpk estimates in the CAA will continue, gradually building statistics and facilitating the development of more robust statistical relationships in upcoming years.
RADARSAT-2 imagery is available online for a fee from the Earth Observation Data Management System (https://www.eodms-sgdot.nrcan-rncan.gc.ca, last access: 16 December 2020; Government of Canada, 2020a). RADARSAT-2-derived melt pond fraction is available through the lead author Stephen E. L. Howell (stephen.howell@canada.ca). The MODIS Arctic melt pond cover fraction dataset is available from the Integrated Climate Data Center (ICDC, https://icdc.cen.uni-hamburg.de/, last access: 16 December 2020; Universität Hamburg, 2020). The CISDA is available online from the Canadian Ice Service (CIS; https://www.canada.ca/en/environment-climate-change/services/ice-forecasts-observations/latest-conditions/archive-overview.html, last access: 16 December 2020; Government of Canada, 2020b). In situ melt pond data are available through contributing author Jack Landy (jack.landy@bristol.ac.uk), and the melt pond aerial photograph data are available through contributing author Randall K. Scharien (randy@uvic.ca).
SELH wrote the manuscript with input from all authors. SELH, RKS, and MB preformed the analysis.
The authors declare that they have no conflict of interest.
Funding for RKS provided by Polar Knowledge Canada Science and Technology program (grant no. NST-1718-0024) and Marine Environmental Observation Prediction and Response Network (MEOPAR) (project no. 1-02-02-012.5). Jack Landy is supported by the European Space Agency Living Planet Fellowship “Arctic-SummIT” (grant no. ESA/4000125582/18/I-NS) and the Natural Environment Research Council (grant nos. “PRE-MELT” NE/T000546/1 and “Diatom-ARCTIC” NE/R012849/1).
This paper was edited by Ludovic Brucker and reviewed by three anonymous referees.
Agnew, T., Lambe, A., and Long, D.: Estimating sea ice area flux across the Canadian Arctic Archipelago using enhanced AMSR-E, J. Geophys. Res., 113, C10011, https://doi.org/10.1029/2007JC004582, 2008.
Chevallier, M., Salas, D., Mélia, Y., Voldoire, A., Déqué, M., and Garric, G.: Seasonal forecasts of the pan-Arctic sea ice extent using a GCM-based seasonal prediction system, J. Climate, 26, 6092–6104, https://doi.org/10.1175/JCLI-D-12-00612.1, 2013
Cooley, S. W., Ryan, J. C., Smith, L. C., Horvat, C., Pearson, B., Dale, B., and Lynch, A. H.: Coldest Canadian Arctic communities face greatest reductions in shorefast sea ice, Nat. Clim. Change, 10, 533–538, https://doi.org/10.1038/s41558-020-0757-5, 2020.
Dumas, J. A., Flato, G. M., and Brown, R. D.: Future projections of landfast ice thickness and duration in the Canadian Arctic, J. Climate, 19, 5175–5189, 2006.
Eicken, H.: Ocean science: Arctic sea ice needs better forecasts, Nature, 497, 431–433, https://doi.org/10.1038/497431a, 2013.
Eicken, H., Krouse, H. R., Kadko, D., and Perovich, D. K.: Tracer studies of pathways and rates of meltwater transport through Arctic summer sea ice, J. Geophys. Res., 107, 8046, https://doi.org/10.1029/2000JC000583, 2002.
Eicken, H., Grenfell, T. C., Perovich, D. K., Richter-Menge, J. A., and Frey, K.: Hydraulic controls of summer Arctic pack ice albedo, J. Geophys. Res., 109, C08007, https://doi.org/10.1029/2003JC001989, 2004.
Flocco, D., Feltham, D. L., and Turner, A. K.: Incorporation of a physically based melt pond scheme into the sea ice component of a climate model, J. Geophys. Res., 115, C08012, https://doi.org/10.1029/2009JC005568, 2010.
Flocco, D., Schröder, D., Feltham, D. L., and Hunke, E. C.: Impact of melt ponds on Arctic sea ice simulations from 1990 to 2007, J. Geophys. Res., 117, C09032, https://doi.org/10.1029/2012JC008195, 2012.
Fors, A. S., Divine, D. V., Doulgeris, A. P., Renner, A. H. H., and Gerland, S.: Signature of Arctic first-year ice melt pond fraction in X-band SAR imagery, The Cryosphere, 11, 755–771, https://doi.org/10.5194/tc-11-755-2017, 2017.
Grenfell, T. C. and Perovich, D. K.: Seasonal and spatial evolution of albedo in a snow-ice-land-ocean environment, J. Geophys. Res., 109, C01001, https://doi.org/10.1029/2003JC001866, 2004.
Government of Canada: Canadian Ice Service archive: overview, available at: https://www.eodms-sgdot.nrcan-rncan.gc.ca, last access: 16 December 2020a.
Government of Canada: Earth Observation Data Management System, available at: https://www.canada.ca/en/environment-climate-change/services/ice-forecasts-observations/latest-conditions/archive-overview.html, last access: 16 December 2020b.
Guemas, V., Chevallier, M., Déqué, M., Bellprat, O., and Doblas-Reyes, F.: Impact of sea ice initialization on sea ice and atmosphere prediction skill on seasonal timescales, Geophys. Res. Lett., 43, 3889–3896, https://doi.org/10.1002/2015GL066626, 2016.
Howell, S. E. L. and Brady, M.: The dynamic response of sea ice to warming in the Canadian Arctic Archipelago, Geophys. Res. Lett., 46, 13119–13125, https://doi.org/10.1029/2019GL085116, 2019.
Howell, S. E. L., Tivy, A., Yackel, J. J., and Scharien, R. K.: Application of a SeaWinds/QuikSCAT sea ice melt algorithm for assessing melt dynamics in the Canadian Arctic Archipelago, J. Geophys. Res.-Oceans, 111, C07025, https://doi.org/10.1029/2005JC003193, 2006.
Howell, S. E. L., Wohlleben, T., Komarov, A., Pizzolato, L., and Derksen, C.: Recent extreme light sea ice years in the Canadian Arctic Archipelago: 2011 and 2012 eclipse 1998 and 2007, The Cryosphere, 7, 1753–1768, https://doi.org/10.5194/tc-7-1753-2013, 2013.
Howell, S. E. L., Laliberté, F., Kwok, R., Derksen, C., and King, J.: Landfast ice thickness in the Canadian Arctic Archipelago from observations and models, The Cryosphere, 10, 1463–1475, https://doi.org/10.5194/tc-10-1463-2016, 2016.
Hu, X., Sun, J., Chan, T. O., and Myers, P. G.: Thermodynamic and dynamic ice thickness contributions in the Canadian Arctic Archipelago in NEMO-LIM2 numerical simulations, The Cryosphere, 12, 1233–1247, https://doi.org/10.5194/tc-12-1233-2018, 2018.
Istomina, L., Heygster, G., Huntemann, M., Schwarz, P., Birnbaum, G., Scharien, R., Polashenski, C., Perovich, D., Zege, E., Malinka, A., Prikhach, A., and Katsev, I.: Melt pond fraction and spectral sea ice albedo retrieval from MERIS data – Part 1: Validation against in situ, aerial, and ship cruise data, The Cryosphere, 9, 1551–1566, https://doi.org/10.5194/tc-9-1551-2015, 2015.
Kwok, R.: Arctic sea ice thickness, volume, and multiyear ice coverage: losses and coupled variability (1958–2018), Environ. Res. Lett., 13, 105005, https://doi.org/10.1088/1748-9326/aae3ec, 2018.
Laliberté, F., Howell, S. E. L., and Kushner, P. J.: Regional variability of a projected sea ice-free Arctic during the summer months, Geophys. Res. Lett., 43, 256–263, https://doi.org/10.1002/2015GL066855, 2016.
Laliberté, F., Howell, S. E. L., Lemieux, J.-F., Dupont, F., and Lei, J.: What historical landfast ice observations tell us about projected ice conditions in Arctic archipelagoes and marginal seas under anthropogenic forcing, The Cryosphere, 12, 3577–3588, https://doi.org/10.5194/tc-12-3577-2018, 2018.
Landy, J. C., Ehn, J. K., Shields, M., and Barber, D. G.: Surface and melt pond evolution on landfast first-year sea ice in the Canadian Arctic Archipelago, J. Geophys. Res., 119, 3054–3075, 2014.
Landy, J. C., Ehn, J. K., and Barber, D. G.: Albedo feedback enhanced by smoother Arctic sea ice, Geophys. Res. Lett., 42, 710–714, https://doi.org/10.1002/2015GL066712, 2015.
Lee, S., Stroeve, J. C., Tsamados, M., and Khand, A.L.: Machine learning approaches to retrieve pan-Arctic melt ponds from visible satellite imagery, Remote Sens. Environ., 247, 111919, https://doi.org/10.1016/j.rse.2020.111919, 2020.
Lemieux, J.-F., Beaudoin, C., Dupont, F., Roy, F., Smith, G.C., Shlyaeva, A., Buehner, M., Caya, A., Chen, J., Carrieres, T., Pogson, L., DeRepentigny, P., Plante, A., Pestieau, P., Pellerin, P., Ritchie, H., Garric, G., and Ferry, N.: The Regional Ice Prediction System (RIPS): verification of forecast sea ice concentration, Q. J. Roy. Meteor. Soc, 142, 632–643, https://doi.org/10.1002/qj.2526, 2016.
Li, H., Perrie, W., Li, Q., and Hou, Y.: Estimation of melt pond fractions on first year sea ice using compact polarization SAR, J. Geophys. Res., 122, 8145–8166, https://doi.org/10.1002/2017JC013248, 2017.
Liu, J., Song, M. H., Horton R. M., and Hu, Y.: Revisiting the potential of melt pond fraction as a predictor for the seasonal Arctic sea ice extent minimum, Environ. Res. Lett., 10, 5, https://doi.org/10.1088/1748-9326/10/5/054017, 2015.
Markus, T., Cavalieri, D. J., Tschudi, M. A., and Ivanoff, A.: Comparison of aerial video and Landsat 7 data over ponded sea ice, Remote Sens. Environ., 86, 458–469, 2003.
Maslanik, J., Stroeve, J., Fowler, C., and Emery, W.: Distribution and trends in Arctic sea ice age through spring 2011, Geophys. Res. Lett., 38, L13502, https://doi.org/10.1029/2011GL047735, 2011.
Melling, H.: Sea ice of the northern Canadian Arctic Archipelago, J. Geophys. Res., 107, 3181, https://doi.org/10.1029/2001JC001102, 2002.
Peng, G. and Meier, W. M.: Temporal and regional variability of Arctic sea-ice coverage from satellite data, Ann. Glaciol., 59, 191–200, https://doi.org/10.1017/aog.2017.32, 2017.
Perovich, D. K. and Polashenski., C.: Albedo evolution of seasonal Arctic sea ice, Geophys. Res. Lett., 39, L08501, https://doi.org/10.1029/2012GL051432, 2012.
Perovich, D. K., Grenfell, T. C., Light, B., and Hobbs, P. V.: Seasonal evolution of the albedo of multiyear Arctic sea ice, J. Geophys. Res., 107, 8044, https://doi.org/10.1029/2000JC000438, 2002.
Petty, A. A., Kurtz, N. T., Kwok, R., Markus, T., and Neumann, T. A.: Winter Arctic sea ice thickness from ICESat-2 freeboards, J. Geophys. Res.-Oceans, 125, e2019JC015764, https://doi.org/10.1029/2019JC015764, 2020.
Pizzolato, L., Howell, S. E. L., Derksen, C., Dawson, J., and Copland, L.: Changing sea ice conditions and marine transportation activity in Canadian Arctic waters between 1990 and 2012, Climatic Change, 123, 161–173, https://doi.org/10.1007/s10584-013-1038-3, 2014.
Polashenski, C., Perovich, D. K., and Courville, Z.: The mechanisms of sea ice melt pond formation and evolution, J. Geophys. Res., 117, C01001, https://doi.org/10.1029/2011JC007231, 2012.
Prinsenberg, S. J. and Hamilton, J.: Monitoring the volume, freshwater and heat fluxes passing through Lancaster sound in the Canadian Arctic Archipelago, Atmos.-Ocean, 43, 1–22, https://doi.org/10.3137/ao.430101, 2005.
Rösel, A., Kaleschke, L., and Birnbaum, G.: Melt ponds on Arctic sea ice determined from MODIS satellite data using an artificial neural network, The Cryosphere, 6, 431–446, https://doi.org/10.5194/tc-6-431-2012, 2012.
Scharien, R. K., Hochheim, K., Landy, J., and Barber, D. G.: First-year sea ice melt pond fraction estimation from dual-polarisation C-band SAR – Part 2: Scaling in situ to Radarsat-2, The Cryosphere, 8, 2163–2176, https://doi.org/10.5194/tc-8-2163-2014, 2014.
Scharien, R. K., Segal, R., Nasonova, S., Nandan, V., Howell, S. E. L., and Haas, C.: Winter Sentinel-1 backscatter as a predictor of spring Arctic sea ice melt pond fraction, Geophys. Res. Lett., 44, 12262–12270, https://doi.org/10.1002/2017GL075547, 2017.
Serreze, M. C., Holland, M. M., and Stroeve, J.: Perspectives on the Arctic's shrinking sea-ice cover, Science, 315, 1533–1536, 2007.
Schröder, D., Feltham, D. L., Flocco, D., and Tsamados, M.: September Arctic sea-ice minimum predicted by spring melt-pond fraction, Nat. Clim. Change, 4, 353–357, https://doi.org/10.1038/nclimate2203, 2014.
Sigmond, M., Fyfe, J. C., Flato, G. M., Kharin, V. V., and Merryfield, W. J.: Seasonal forecast skill of Arctic sea ice area in a dynamical forecast system, Geophys. Res. Lett., 40, 529–534, https://doi.org/10.1002/grl.50129, 2013.
Skyllingstad, E. D. and Polashenski, C.: Estimated heat budget during summer melt of Arctic first-year sea ice Geophys. Res. Lett., 45, 11789–11797, https://doi.org/10.1029/2018GL080349, 2018.
Small, D.: Flattening gamma: Radiometric terrain correction for SAR imagery, IEEE T. Geosci. Remote S., 49, 3081–3093, https://doi.org/10.1109/TGRS.2011.2120616, 2011.
Sou, T. and Flato, G.: Sea ice in the Canadian Arctic Archipelago: Modeling the past (1950–2004) and the future (2041–60), J. Climate, 22, 2181–2198, 2009.
Stroeve, J. C., Serreze, M. C., Holland, M. M., Kay, J. E., Maslanik, J., and Barrett, A. P.: The Arctic's rapidly shrinking sea ice cover: A research synthesis, Climatic Change, 110, 1005–1027, https://doi.org/10.1007/s10584-011-0101-1, 2012.
Tivy, A., Howell, S. E. L., Alt, B., McCourt, S., Chagnon, R., Crocker, G., Carrieres, T., and Yackel, J. J.: Trends and variability in summer sea ice cover in the Canadian Arctic based on the Canadian Ice Service Digital Archive, 1960–2008 and 1968–2008, J. Geophys. Res., 116, C03007, https://doi.org/10.1029/2009JC005855, 2011.
Tschudi, M. A., Maslanik, J. A., and Perovich, D. K.: Derivation of melt pond coverage on arctic sea ice using MODIS observation, Remote Sens. Environ., 112, 2605–2614, 2008.
Tschudi, M. A., Meier, W. N., and Stewart, J. S.: An enhancement to sea ice motion and age products at the National Snow and Ice Data Center (NSIDC), The Cryosphere, 14, 1519–1536, https://doi.org/10.5194/tc-14-1519-2020, 2020.
Universität Hamburg: Integrated Climate Data Center – ICDC, available at: https://icdc.cen.uni-hamburg.de/, last access: 16 December 2020.
Webster, M. A., Rigor, I. G., Perovich, D. K., Richter-Menge, J. A., Polashenski, C. M., and Light, B.: Seasonal evolution of melt ponds on Arctic sea ice, J. Geophys. Res., 120, 5968–5982, https://doi.org/10.1002/2015JC011030, 2015.