the Creative Commons Attribution 4.0 License.
the Creative Commons Attribution 4.0 License.
 | 16 Dec 2020
Measurements and modeling of snow albedo at Alerce Glacier, Argentina: effects of volcanic ash, snow grain size, and cloudiness
Julián Gelman Constantin
Lucas Ruiz
Gustavo Villarosa
Valeria Outes
Facundo N. Bajano
Cenlin He
Hector Bajano
Laura Dawidowski
The impact of volcanic ash on seasonal snow and glacier mass balance has been much less studied than that of carbonaceous particles and mineral dust. We present here the first field measurements on the Argentinian Andes, combined with snow albedo and glacier mass balance modeling. Measured impurity content (1.1 mg kg−1 to 30 000 mg kg−1) varied abruptly in snow pits and snow and firn cores, due to high surface enrichment during the ablation season and possibly local or regional wind-driven resuspension and redeposition of dust and volcanic ash. In addition, we observed high spatial heterogeneity, due to glacier topography and the prevailing wind direction. Microscopic characterization showed that the major component was ash from recent Calbuco (2015) and Cordón Caulle (2011) volcanic eruptions, with a minor presence of mineral dust and black carbon. We also found a wide range of measured snow albedo (0.26 to 0.81), which reflected mainly the impurity content and the snow and firn grain size (due to aging). We updated the SNow, ICe, and Aerosol Radiation (SNICAR) albedo model to account for the effect of cloudiness on incident radiation spectra, improving the match of modeled and measured values. We also ran sensitivity studies considering the uncertainty in the main measured parameters (impurity content and composition, snow grain size, layer thickness, etc.) to identify the field measurements that should be improved to facilitate the validation of the snow albedo model. Finally, we studied the impact of these albedo reductions on Alerce Glacier using a spatially distributed surface mass balance model. We found a large impact of albedo changes on glacier mass balance, and we estimated that the effect of observed ash concentrations can be as high as a 1.25 m water equivalent decrease in the annual surface mass balance (due to a 34 % increase in the melt during the ablation season).
- Article
(12827 KB) - Full-text XML
-
Supplement
(6803 KB) - BibTeX
- EndNote


Since glaciers are highly sensitive to climate fluctuations, their unprecedented rates of retreat observed during the last few decades represent one of the most unambiguous signals of climate change (Zemp et al., 2015; IPCC, 2019). Along the Wet Andes (below 35∘ S latitude), both precipitation decrease and air surface temperature increase have been pointed out as the drivers of the shrinkage of glaciers in the last few decades (Dussaillant et al., 2019). Although some processes, like sublimation at the high and cold Dry Andes (37 to 20∘ S) or the calving at the outlet glaciers of the Patagonian ice fields (south of 45∘ S), could contribute to or be even more critical than melt for the shrinkage of glaciers in some particular cases, ablation is mainly ruled by melt. Along the Southern Andes, melt is driven by shortwave radiation and sensible turbulent flux (Schaefer et al., 2020). Shortwave radiation absorption increases significantly during summer, due to the exposure of low-albedo areas in their ablation zones, which causes strong, positive feedback that enhances surface melt significantly and shapes the spatial ablation pattern (Brock et al., 2000). Furthermore, deposition of light-absorbing particles (LAPs – mineral dust, volcanic ash, and black carbon) have a fundamental impact on the melting of glaciers and snow-covered areas (Warren and Wiscombe, 1980; Bond et al., 2013; Molina et al., 2015). LAPs decrease snow albedo, increasing solar radiation absorption and thus producing a direct effect on snow melting. But, in addition, the snowpack temperature increase due to the direct effect accelerates the growth of snow grains, which produces a further albedo decrease (and thus an additional, indirect impact on snow melting) (Bond et al., 2013; Flanner et al., 2007). While LAPs control the snow albedo mainly in the visible wavelengths (since ice is relatively transparent in the visible band), the snow grain size affects the albedo in the near-infrared (e.g., Hadley and Kirchstetter, 2012; Pirazzini et al., 2015; He and Flanner, 2020). Recently it has been highlighted that the growth of glacier algae could also decrease the albedo (Williamson et al., 2019).
Atmospheric particulate matter (PM) is diverse in size, chemical composition, and optical properties; while most PM reflects a large fraction of the incoming radiation and thus has a cooling effect on the atmosphere, other particles absorb a significant fraction of the visible radiation (depending on the ratio of their absorption and scattering coefficients) and have a heating effect (Bond et al., 2013). In snow, the term LAP is used to refer to black carbon (BC), mineral dust, volcanic ash, and all other particles that totally or partially absorb incident light and hence increase the snow energy absorption. Different snow albedo models have been developed to include the direct effect of BC and other LAPs as well as several positive feedbacks (Flanner et al., 2007; Koch et al., 2009; Krinner et al., 2006), such as the increase in surface concentration of impurities due to enhanced snow melting or the albedo reduction due to the growth of snow grains by accelerated snow aging (Bond et al., 2013). More recently, models have included the effects of non-spherical snow grains (Libois et al., 2013; He et al., 2017) and external or internal mixing of impurities with snow grains (He et al., 2018). Although some snow albedo models have been successfully validated for laboratory conditions (Brandt et al., 2011; Hadley and Kirchstetter, 2012), the prediction of snow spectral albedo in environmental conditions is still challenging. When the snow has been undergoing heavy metamorphosis processes, a single snow grain size distribution is not enough to reproduce the snow spectral albedo due to the fact that the largest particles and the thinnest protrusions of the irregular crystals have contributions to the snow reflectance that depend on the wavelength (Carmagnola et al., 2013; Pirazzini et al., 2015). Notably, it has been shown that taking into account the quantity of LAPs in the snow reduces the difference between simulated and measured albedo, especially in the visible range (Zhang et al., 2018).
Different studies have considered the effect of LAPs on snow and ice albedo and their impact on glaciers mass balance or seasonal snow cover and estimated their radiative forcing (Qian et al., 2015; Skiles et al., 2018). Some studies have used point measurements of LAP content (ice cores) together with a snow albedo model to estimate potential melting, using a radiative transfer model to calculate the additional absorbed energy by BC and mineral dust (Ginot et al., 2014; Zhang et al., 2018) or perturbing a glacier mass balance model to include BC forcing (Painter et al., 2013). “Online” coupling of snow albedo models in global or regional atmospheric chemistry models (where both models are run simultaneously allowing two-way feedback) has been applied to study snow and glaciers interaction with the climate around the globe (Hansen et al., 2005; Flanner, 2013; Ménégoz et al., 2014). Although these global or regional atmospheric studies are useful to identify LAP sources and dispersion patterns and to compare snow–atmosphere feedback in different regions, the spatial resolution can be inadequate to obtain accurate results in mountain regions (Ménégoz et al., 2014; Qian et al., 2015).
Even though most studies focus on the effect of BC, some include the effect of mineral dust (e.g., Ginot et al., 2014; Skiles and Painter, 2017; Zhang et al., 2018) or even concentrate on mineral dust due to local or regional relevance (e.g., Krinner et al., 2006; Painter et al., 2012; Wittmann et al., 2017). Studies on the effect of volcanic ash concentration on snow albedo are scarcer (e.g., Conway et al., 1996; Brock et al., 2007; Young et al., 2014).
In recent years there has been an increase in the measurement and modeling of albedo along the Southern Andes (Rowe et al., 2019). A 3-year study (Schmitt et al., 2015) showed that glaciers closer to population centers in the Cordillera Blanca, Peru, have higher surface content of equivalent black carbon (EBC – BC plus other LAPs, especially dust in this case): up to 70 ng g−1 EBC, as compared with remote glaciers (with surface content as low as 2.0 ng g−1 EBC). A 1-week study successfully connected the decreases in snow broadband albedo with heavy-traffic days in the nearby road that connects Argentina and Chile (Cereceda-Balic et al., 2018). A more recent study along the Southern Andes of Chile found a mean albedo reduction due to light-absorbing particles in the snow, with its corresponding mean radiative forcing increase (Rowe et al., 2019). They conclude that in the north (dusty, vegetation-sparse Atacama Desert), BC plays a smaller role than non-BC, whereas near Santiago and in the south (vegetation-rich), the BC contribution is higher. For example, the albedo reduction due to BC alone in the north was estimated to be only about 43 % of that for all light-absorbing particles (assuming spherical 100 µm radii snow grains). By comparison, these albedo reductions are 53 % and 82 % near Santiago and in southern Chile, where a greater share of light absorption is due to BC. In the Southern Andes of Argentina, the only available information on snow albedo is due to remote sensing (Malmros et al., 2018), and up to now, the impact of volcanic ash and other LAPs on the mass balance of Argentinian glaciers has not been evaluated either.
Here we present the results from two field campaigns developed on Alerce Glacier during April 2016 and April 2017 to assess the bounds the of the PM deposition impact on the Alerce Glacier mass balance. We show in situ albedo measurements and PM concentration values measured on surface and sub-surface snow and firn samples in accumulation and ablation zones of the glacier. Albedo in situ measurements are compared with results from the SNow, ICe, and Aerosol Radiation (SNICAR) albedo model (Flanner et al., 2007; He et al., 2018), using measured snow properties and LAP content as input data. We present here an improvement of SNICAR’s incident radiation spectra (presented as SNICARv2.1), to take into account changes in direct and diffuse solar radiation for partly cloudy skies. We study the effect of volcanic events that have occurred in recent years (Cordón Caulle in 2011 and Calbuco in 2015). Finally, the influence of LAPs on snow and ice albedo on the annual surface mass balance of Alerce Glacier is assessed using an enhanced temperature index melt model (Oerlemans, 2001). This study is not only the first field study of the impact of LAPs on Argentinian glaciers but also one of the few studies of the long-term impact of volcanic ash on snow albedo.
Alerce is a small (2.2 km2), debris-free mountain glacier located at Mount Tronador (41.15∘ S, 71.88∘ W), in the northern Patagonian Andes. The climate in this region is primarily modulated by the weather disturbance embedded in the mid-latitude westerlies (Garreaud et al., 2009). Weather disturbances and prevailing winds coming from the Pacific Ocean are more frequent and stronger in winter. However, associated frontal precipitation system move over the Patagonian Andes all year round. In this region, the hydrological year begins on 1 April with the accumulation season. The accumulation season lasts until 31 October, which marks the beginning of the ablation season.
Alerce Glacier has an elevation range of between 1650 and 2400 (above sea level), has a gentle slope (mean of 10∘), and is exposed to the southeast. Since 2013 it has been the focus of a glacier mass balance monitoring program by the IANIGLA (Instituto Argentino de Nivología, Glaciología y Ciencias Ambientales; Ruiz et al., 2015, 2017). Seasonal mass balance has been studied every year using the traditional glaciological method of stakes and snow pits. An enhanced temperature index mass balance model has been developed (Huss et al., 2008; Huss, 2010) to study the surface mass balance of the glacier. This model is used here to analyze the influence of LAPs, through glacier albedo changes, over the mass balance of Alerce Glacier.
In recent years Mount Tronador glaciers have been reached by volcanic ash derived from two volcanic events: (i) the Cordón Caulle fissure system, which had a long eruption between June 2011 and January 2012, and (ii) Volcán Calbuco, which commenced on 23 April 2015.
2.1 Fieldwork
In April 2016 and April 2017, besides mass balance measuring, we took snow and firn samples and we measured surface albedo at Alerce Glacier. Figure 1 shows the sampling sites at Alerce Glacier. We sampled accumulation and ablation zones and looked for similar sampling sites in both campaigns. The Otto Meiling mountain hut served both as a base camp for field trips and as a field laboratory for initial processing of the snow samples. April 2016 served as an exploratory campaign. Albedo measurements were improved for the 2017 campaign. We lowered instrumental uncertainty and used an improved mounting stand for the pyranometer, which allowed us to evaluate the variability and uncertainty in albedo measurements by repeatedly measuring in the same site. We also improved the measurement of snow grain size distribution. More details are given below. However, the second campaign duration was shortened and number of sampling sites decreased due to poor weather conditions. Nevertheless, relevant results of PM concentration and albedo measurements are presented for the first time for Mount Tronador glaciers.
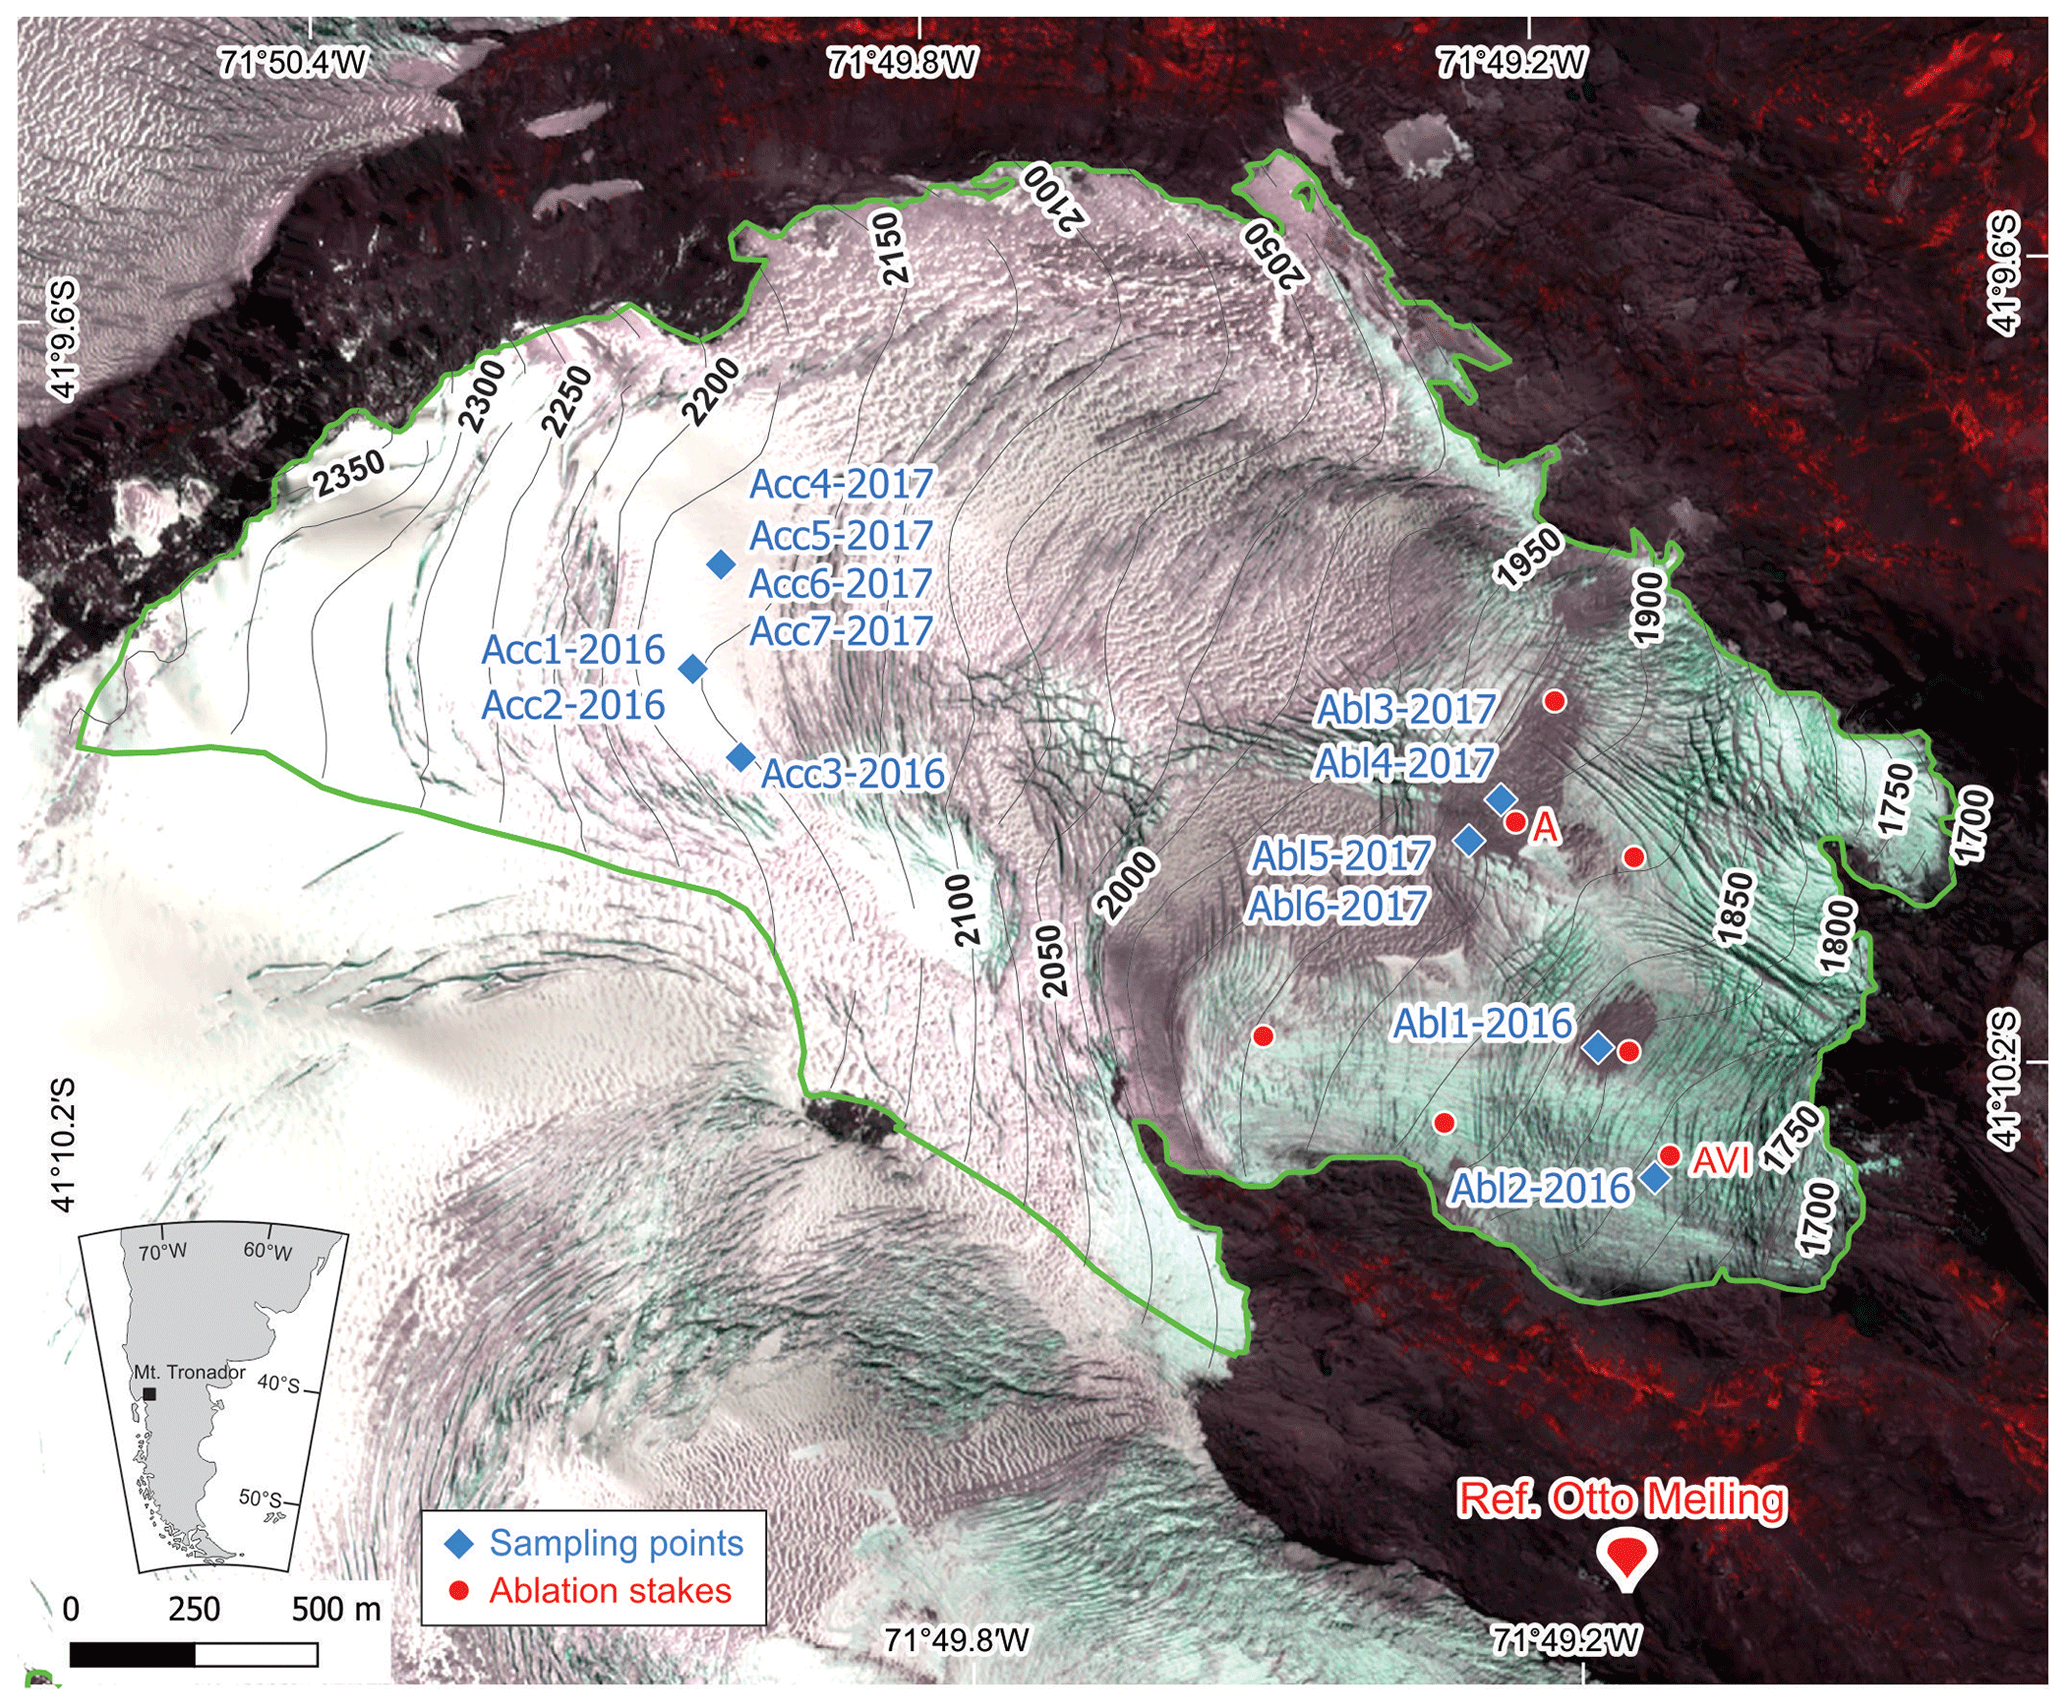
Figure 1Outline of Alerce Glacier, showing the location of sampling sites and ablation stakes used for mass balance model calibration (model output for labeled ablation stakes is shown in Fig. S6). Labels of contour lines of terrain elevation are expressed in meters above sea level. Otto Meiling mountain hut and inset of the location of Mount Tronador in the context of southern South America are represented for reference. Background image: false-color pansharpened Pléiades satellite image, 7 March 2012, PGO, CNES Airbus DS (Ruiz et al., 2015).
2.1.1 Snow samples, filter treatment
Before collecting snow, firn, and ice samples, we performed an in situ stratigraphy at each site to identify and date layers. Many of the sampling sites corresponded to the accumulation zone of Alerce Glacier or accumulation pockets in the ablation zone. In those sites, we dated seasonal layers of snow and firn. The main elements to attribute layers were PM content and hardness of the layers. Figure 2 shows the results of the stratigraphy and PM gravimetry, which are described in detail in Sect. 3.1. In sampling sites located in the ablation zone, we distinguish glacier ice from recent snow covering the glacier ice.
Most of the samples were taken from snow and firn pits. In the 2016 campaign we also used a snow and firn hand auger to sample a 2.5 m snow and firn core (site Acc2-2016, Fig. 2). Samples were melted and filtered in the base camp, and filters were taken to the laboratory for gravimetric determination of PM content and further analysis. Further details are given in Sect. S1.1 in the Supplement.
PM in the filters was described and photographed using a Leica S8 APO stereo microscope equipped with a DFC295 camera. Some samples were also studied by scanning electron microscopy (FEI Quanta 200, equipped with an Edax accessory for energy dispersive X-ray analysis).
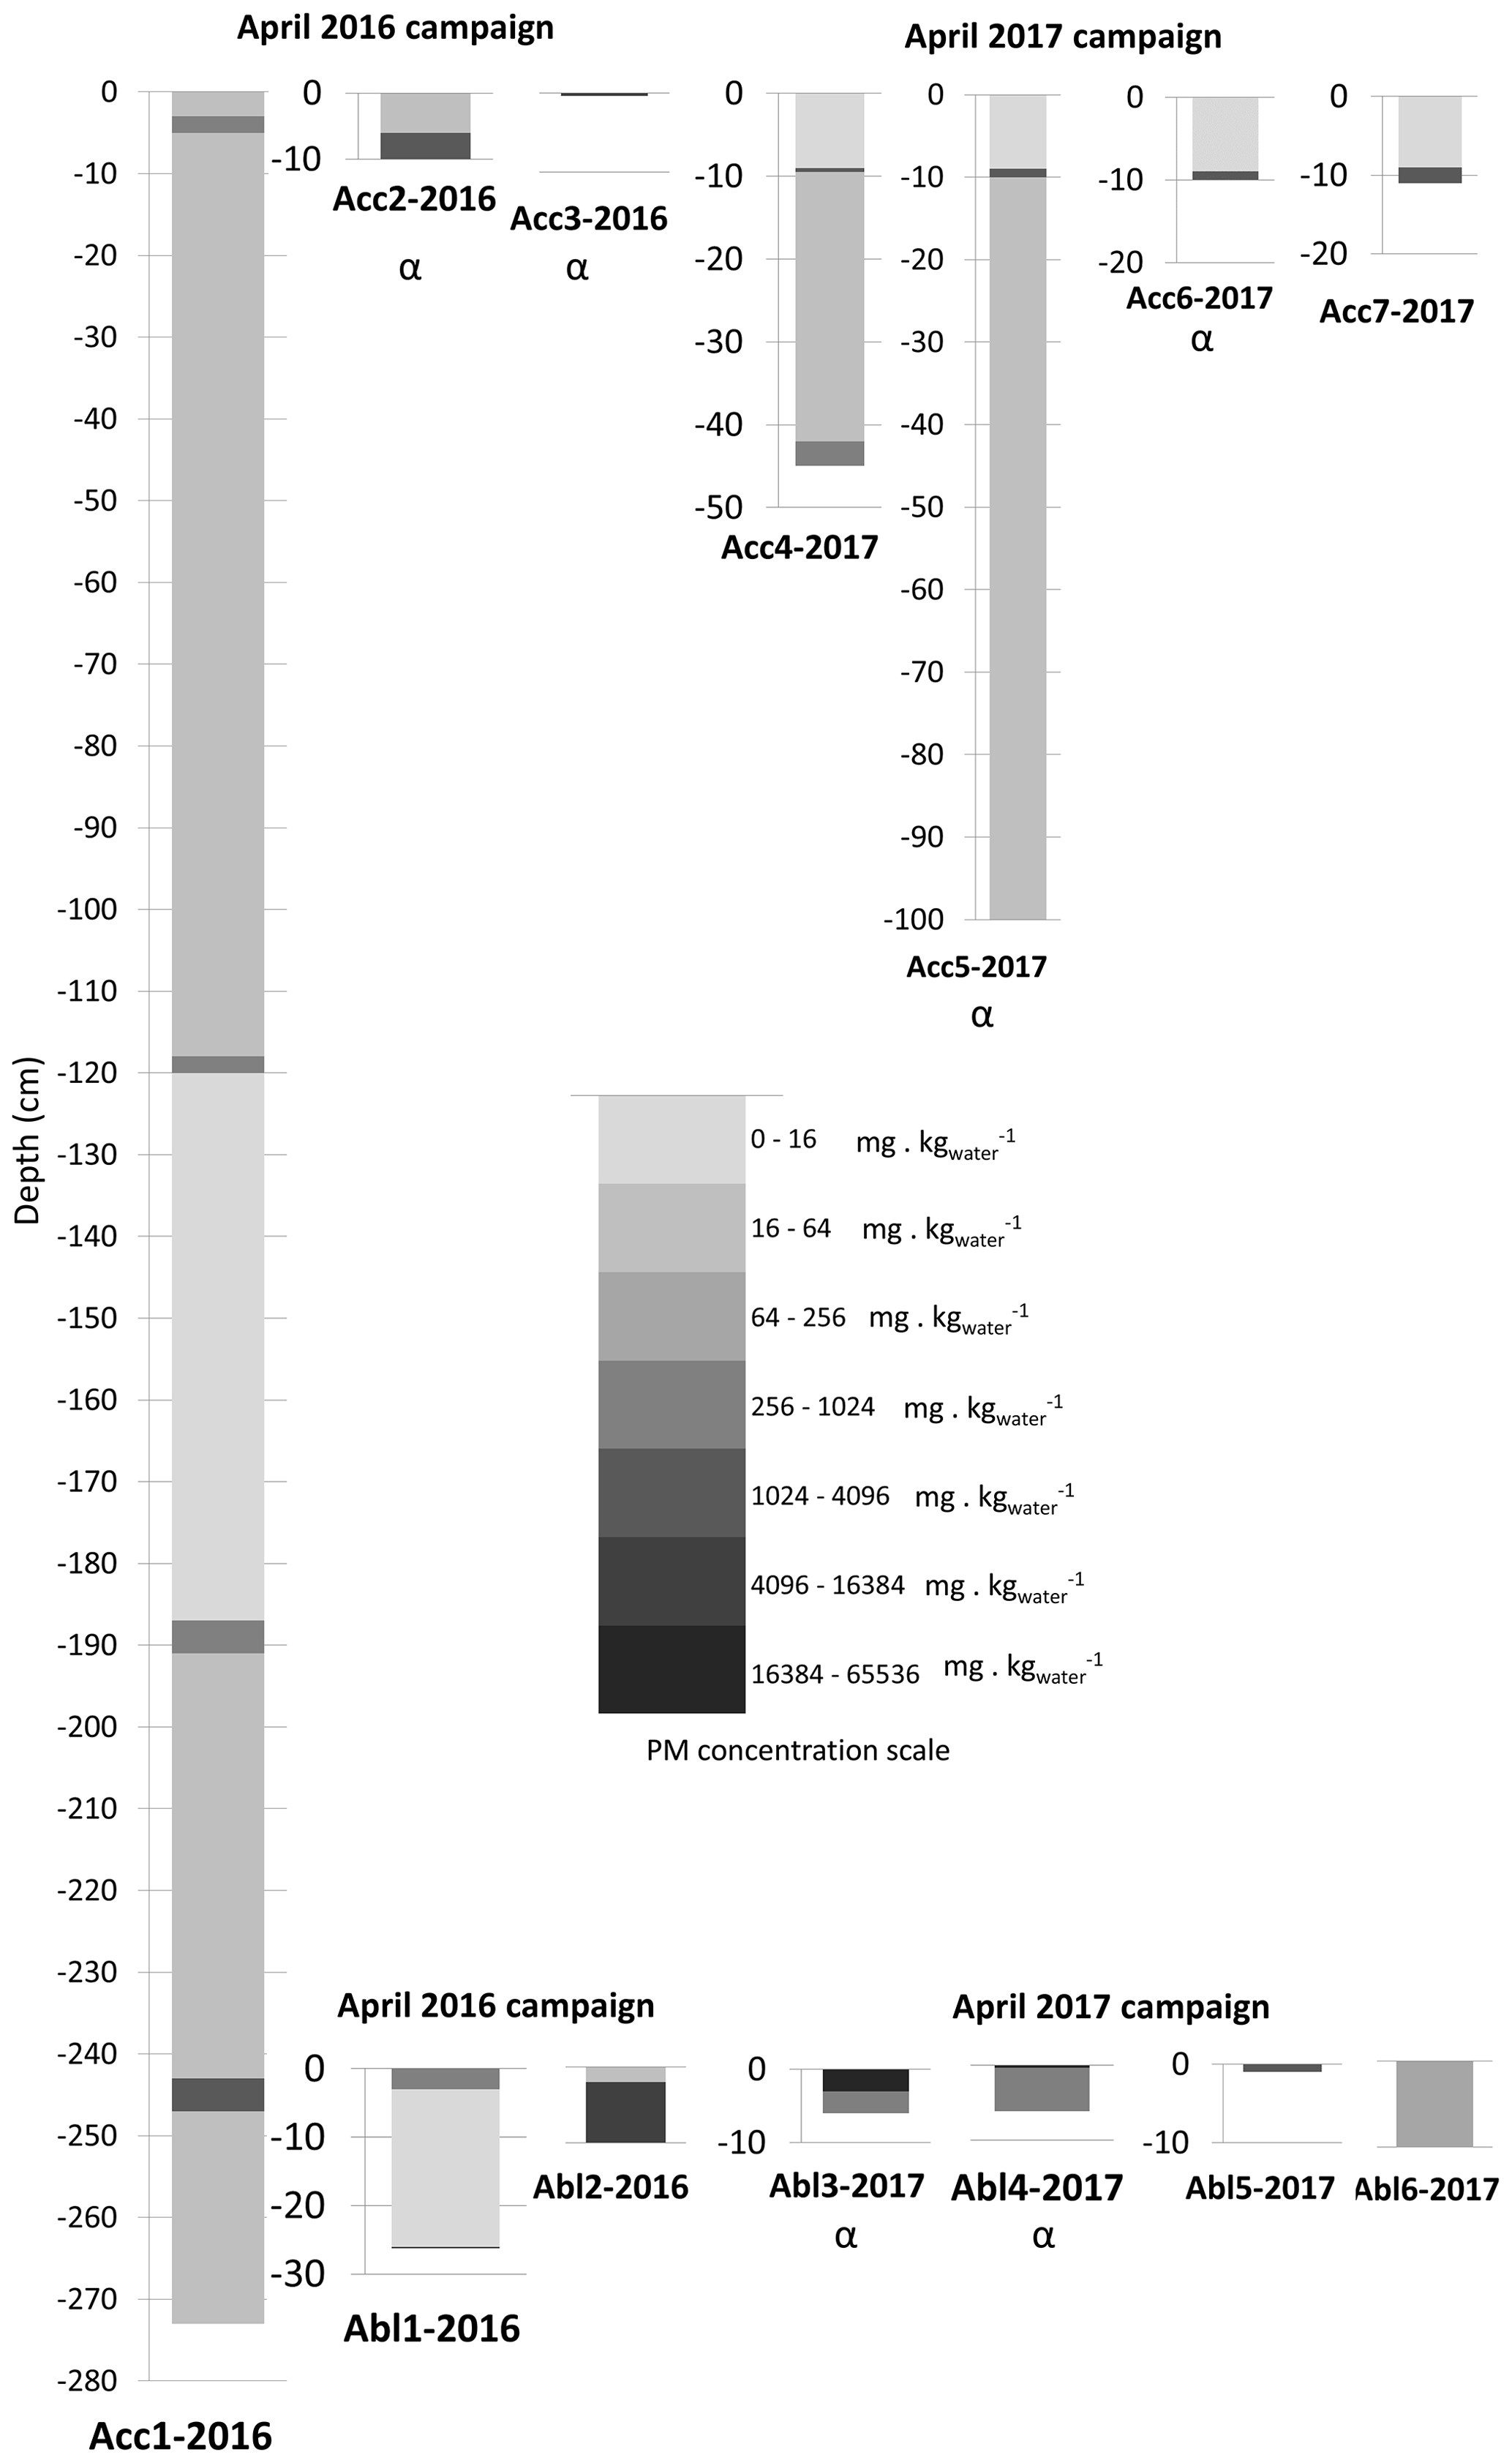
Figure 2PM concentration (grayscale) as a function of pit depth for different sampling sites. Notice that the grayscale is logarithmic. Top panel: accumulation zone. Bottom panel: ablation zone. The α symbol is used to highlight sites with concurrent albedo measurements. In sample Abl2-2016, the top rectangle corresponds to the average PM content of the first two layers (fresh snow and end-of-summer dark layer).
2.2 Albedo – measurements and corrections
We performed in situ albedo measurements in some of the snow sampling sites in both field campaigns. Upwelling (reflected) and downwelling (direct + diffuse) radiation were measured with one CM5 Kipp & Zonen pyranometer (wavelength range 0.3 to 2.8 µm), using two different in-house-developed mounting stands in the 2016 and 2017 campaigns, logged with a handheld voltmeter. The voltmeter used in the 2016 campaign had a reduced precision (resolution of 0.1 mV) that limited the overall accuracy of the albedo measurement (first two rows of Table 1). In the 2017 campaign, a new, more accurate voltmeter was used (resolution of 0.001 mV, accuracy of 0.010 mV), reducing significantly instrumental uncertainty. Further details are given in Sect. 3.3.
Raw albedo values were corrected to account for the diffuse or reflected light blocked by the operator or the mounting stand and, for upwelling radiation, the effect of shadows of the sensor and the stand on the snow surface (Wright et al., 2014; Carmagnola et al., 2013). Further details are given in Sect. S1.2 in the Supplement.
2.2.1 Pyranometer mounting stands and cloudiness effect
In the 2016 campaign, we used a fixed mounting stand with three stainless-steel legs (Fig. 3a). It was designed to provide a stable irradiation measurement, with a precise tilt angle (parallel to the snow surface), and to minimize the blocking of incident light. When measuring clear-sky downwelling radiation, this stand does not block light at all (operators stand 4 m away from the sensor, blocking less than 0.1 % of incoming diffuse radiation). For clear-sky upwelling radiation, the percentage of blocked light is below 0.8 %, and shadows from the equipment represent another 0.4 %. Hence, the total correction for upwelling radiation sums to around 1.2 %, affecting around 1 % of measured albedo. For cloudy or overcast conditions, due to the sharp changes in cloud cover, incoming radiation varies more quickly than the time needed for assembling and disassembling the pyranometer stand. To proceed faster under these conditions, the measurements were made differently: the sensor was held by two operators, each 0.45 m away from the sensor, without using the stand legs. Under these conditions 12 % of diffuse downwelling and 9 % of upwelling radiation is blocked by the operators, resulting in an albedo correction of 3.5 %, significantly higher than those obtained for clear-sky conditions.
To overcome the difficulties due to cloudiness, for the 2017 campaign a new mounting stand was designed. The new lighter design has only one arm and one leg and is carried by one operator, located 1.25 m away from the sensor, and leveled manually with the help of a bubble level (Fig. 3b). This design allows fast and easy alternate downwelling and upwelling radiation measurements, making it possible to assess the variability in albedo under the same sky conditions. For downwelling radiation the operator blocks around 1.1 % of diffuse light. For upwelling radiation, the operator blocks around 1.9 % of light, which, together with shadows of the equipment, brings corrections to a maximum of 2.4 %. Overall albedo corrections vary between 0.8 % and 2.0 %. Additional details on the mounting stands are given in Fig. S1 in the Supplement.
2.2.2 Diffuse and direct radiation fraction
For albedo calculation, the upwelling radiation measurement is used directly from measurements. But for downwelling radiation, the direct and diffuse fractions must be distinguished (see Eq. S1 in the Supplement).
The calculation of the diffuse fraction of downwelling radiation requires adding another measurement with the pyranometer (total downwelling, diffuse downwelling, and total upwelling radiation) and the operation of the accessory to block direct radiation. Fast changes in cloudiness during measurements made it very difficult to assure that all three measurements were performed under the same sky conditions. Therefore, we decided to prioritize that measurements required for albedo calculation (total downwelling and total upwelling radiation) were performed under the same conditions, and thus we dropped the diffuse downwelling radiation measurement. Hence, the diffuse-radiation-to-global-radiation ratio (needed for albedo measurement corrections and comparison with modeled albedo) had to be estimated differently. We used in situ observations of cloudiness (or pictures of the sky taken before and after albedo measurements) together with the relations found by Kasten and Czeplak (1980) (Eq. 4) to estimate the diffuse radiation ratios, which are presented in Table 1.
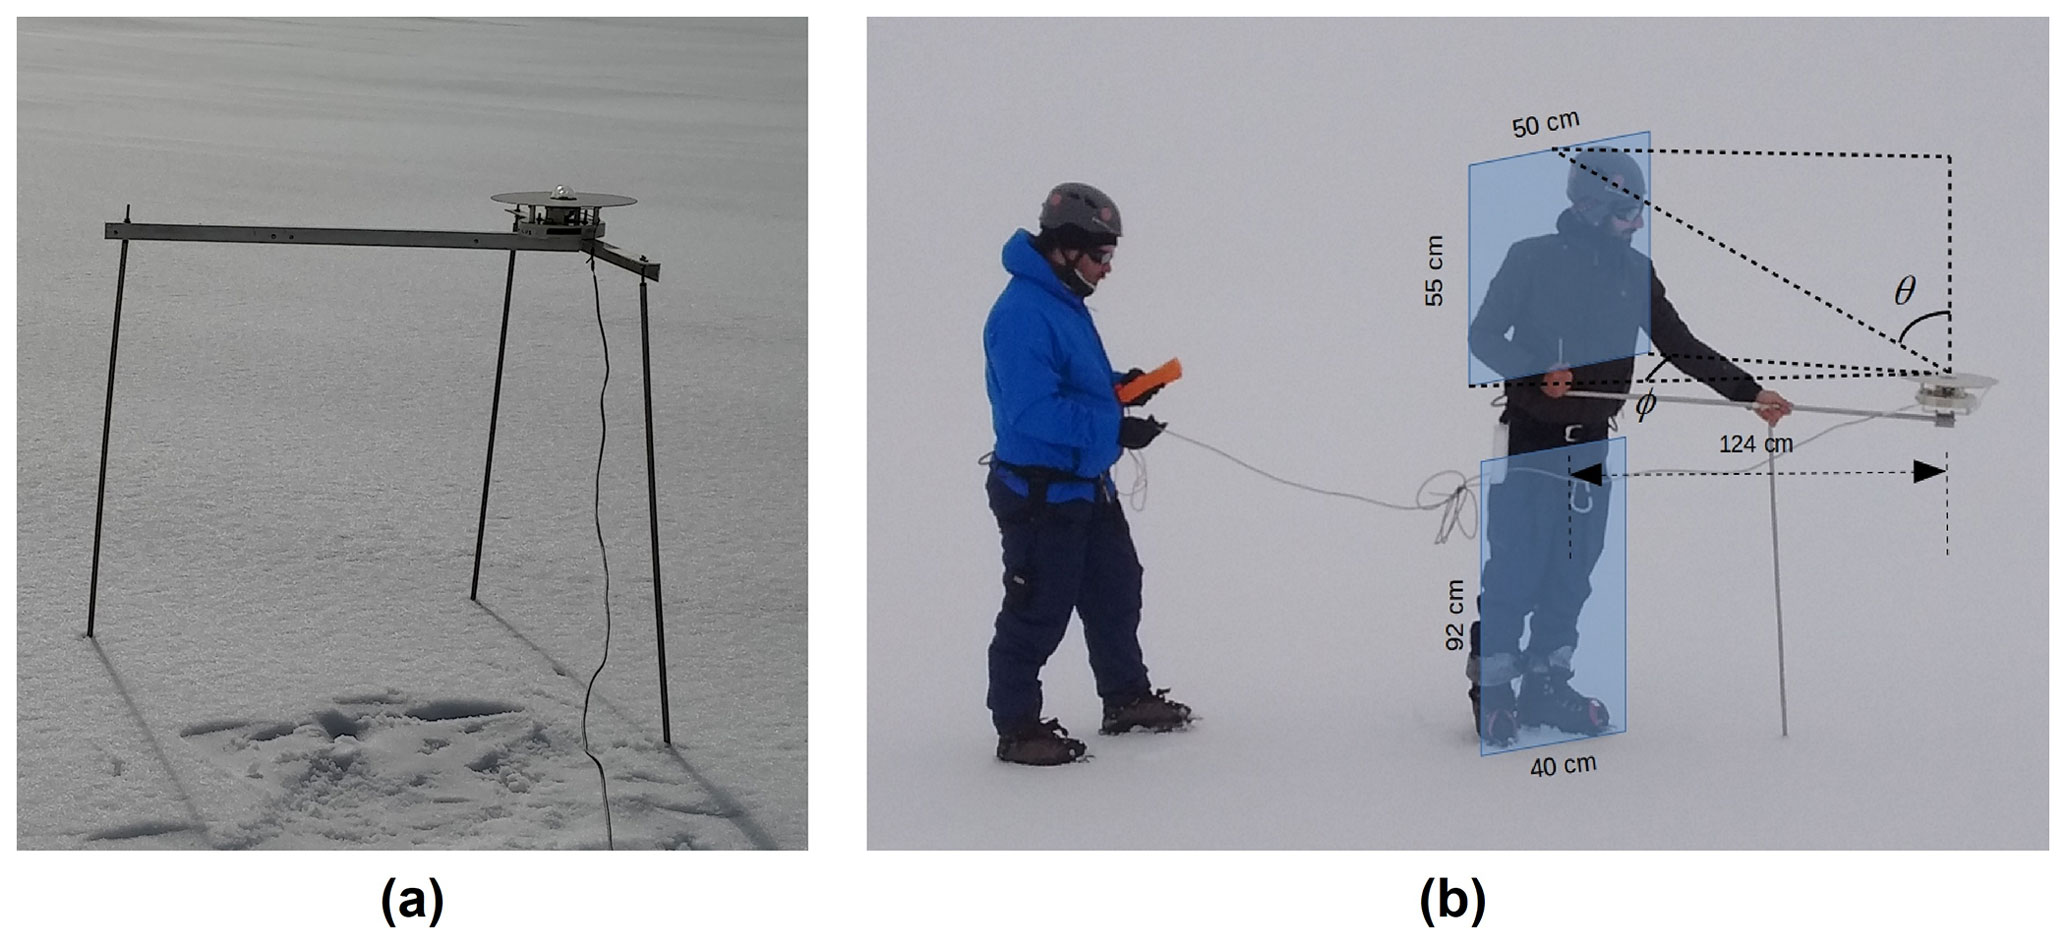
Figure 3Albedo measurement equipment. (a) Mounting stand used in the 2016 campaign. (b) Mounting stand used in the 2017 campaign. The presence of the stand and the observer is taken into account to correct the albedo measurement through the angles θ and ϕ and Eqs. (S1) and (S2) in the Supplement.
2.2.3 Snow and firn grain size
In the 2016 campaign, snow was placed in a crystal grid (with three different scales – 2, 1.2, and 0.6 mm) and average size was determined with a magnifying lens. In the 2017 campaign, a similar in-house-developed grid was used (with two scales – 1 and 0.5 mm) in combination with a macro lens and a mobile phone digital camera. High-resolution pictures (Fig. S3 in the Supplement) were analyzed later with ImageJ software (Schneider et al., 2012). Snow grains were manually fitted with ellipses; the metric choice was the average of the minor and major axes of the ellipse. The new equipment and methodology introduced in the 2017 campaign allows a more detailed description of the snow samples and a more precise average radius value.
2.3 Albedo – modeling
To analyze the different factors affecting measured albedo at each sampling site, we modeled albedo for the same conditions using SNICAR (Flanner et al., 2007; He et al., 2017, 2018). Snow density and layer thicknesses were taken as parameters from in situ stratigraphies. The average snow grain size and shape were obtained from in situ measurements. LAP content was obtained from filter gravimetry. Based on in situ observations and the analysis of microscopy images (Sect. 3.2), we assigned all recollected PM mass to volcanic ash (in a similar way to that previously done in sites where mineral dust represents most LAPs; Krinner et al., 2006; Painter et al., 2012; Wittmann et al., 2017). Albedo of the underlying layers was calculated explicitly within the same model, using the properties of those layers.
SNICARv2 (He et al., 2017, 2018) supported only four incident solar spectra: two clear-sky direct solar spectra (one for Summit Camp, Greenland, and one for mid-latitudes), and two overcast diffuse spectra (for the same locations). These spectra are used to calculate direct-radiation albedo and diffuse radiation albedo, respectively. These are good approximations for clear-sky albedo (where most of the incident radiation is direct, clear-sky solar radiation) or for overcast-sky albedo (where most of the radiation is diffuse). In this updated version of SNICAR (referred to as SNICARv2.1 throughout the article) we provided an alternative for these spectra for cases where latitude, longitude, or altitude differ significantly from those of the provided spectra or where the sky is partly cloudy.
First, we calculated the clear-sky spectra for the site location and time using SMARTS (Gueymard, 2001). Then, we calculated the direct and diffuse spectra for overcast or partly cloudy sky following Gueymard (1986, 1987) and Ernst et al. (2016):
Idir, Idiff, and Iglob are clear-sky direct, diffuse, and global solar irradiance (where ), as calculated from SMARTS. Fdir,S(λ) and Fdiff,S(λ) are the spectral distributions of clear-sky direct and diffuse solar irradiance, also from SMARTS. Fdir,norm(λ) and Fdiff,norm(λ) are the normalized spectral distributions of direct and diffuse solar irradiance thus calculated for our sites. The cloud opacity factor Npt is calculated following Ernst et al. (2016):
where ρ and ρS are the diffuse-irradiance-to-global-irradiance ratios for the site and from SMARTS, respectively.
The clear-sky direct radiation spectrum available in SNICARv2 matches reasonably well the SMARTS clear-sky direct radiation spectrum. On the other hand, the SMARTS clear-sky diffuse radiation spectrum is very different from the diffuse radiation spectrum available in SNICARv2 (Fig. 4). The spectral distribution obtained for the 95 % cloud fraction for SNICARv2.1 closely matches the diffuse radiation spectrum available in SNICARv2, which confirms that the latter was produced to represent an overcast-sky condition. On the other hand, the spectral distribution obtained for a 50 % cloud fraction differs significantly from both spectra available in SNICARv2, showing a larger contribution from clear-sky diffuse radiation (Fig. 4).
Hence, we expect to find a larger impact of our improved incident sun spectra for intermediate cloud cover fractions. For clear-sky conditions, direct radiation spectra were already well represented. Even though diffuse radiation spectra were not accounted for, this fact has little impact on the calculated albedo, due to the low diffuse radiation fraction for clear-sky conditions. Conversely, for overcast conditions, diffuse radiation spectra were already well represented, and neglecting the direct radiation fraction has a low impact on albedo calculations.
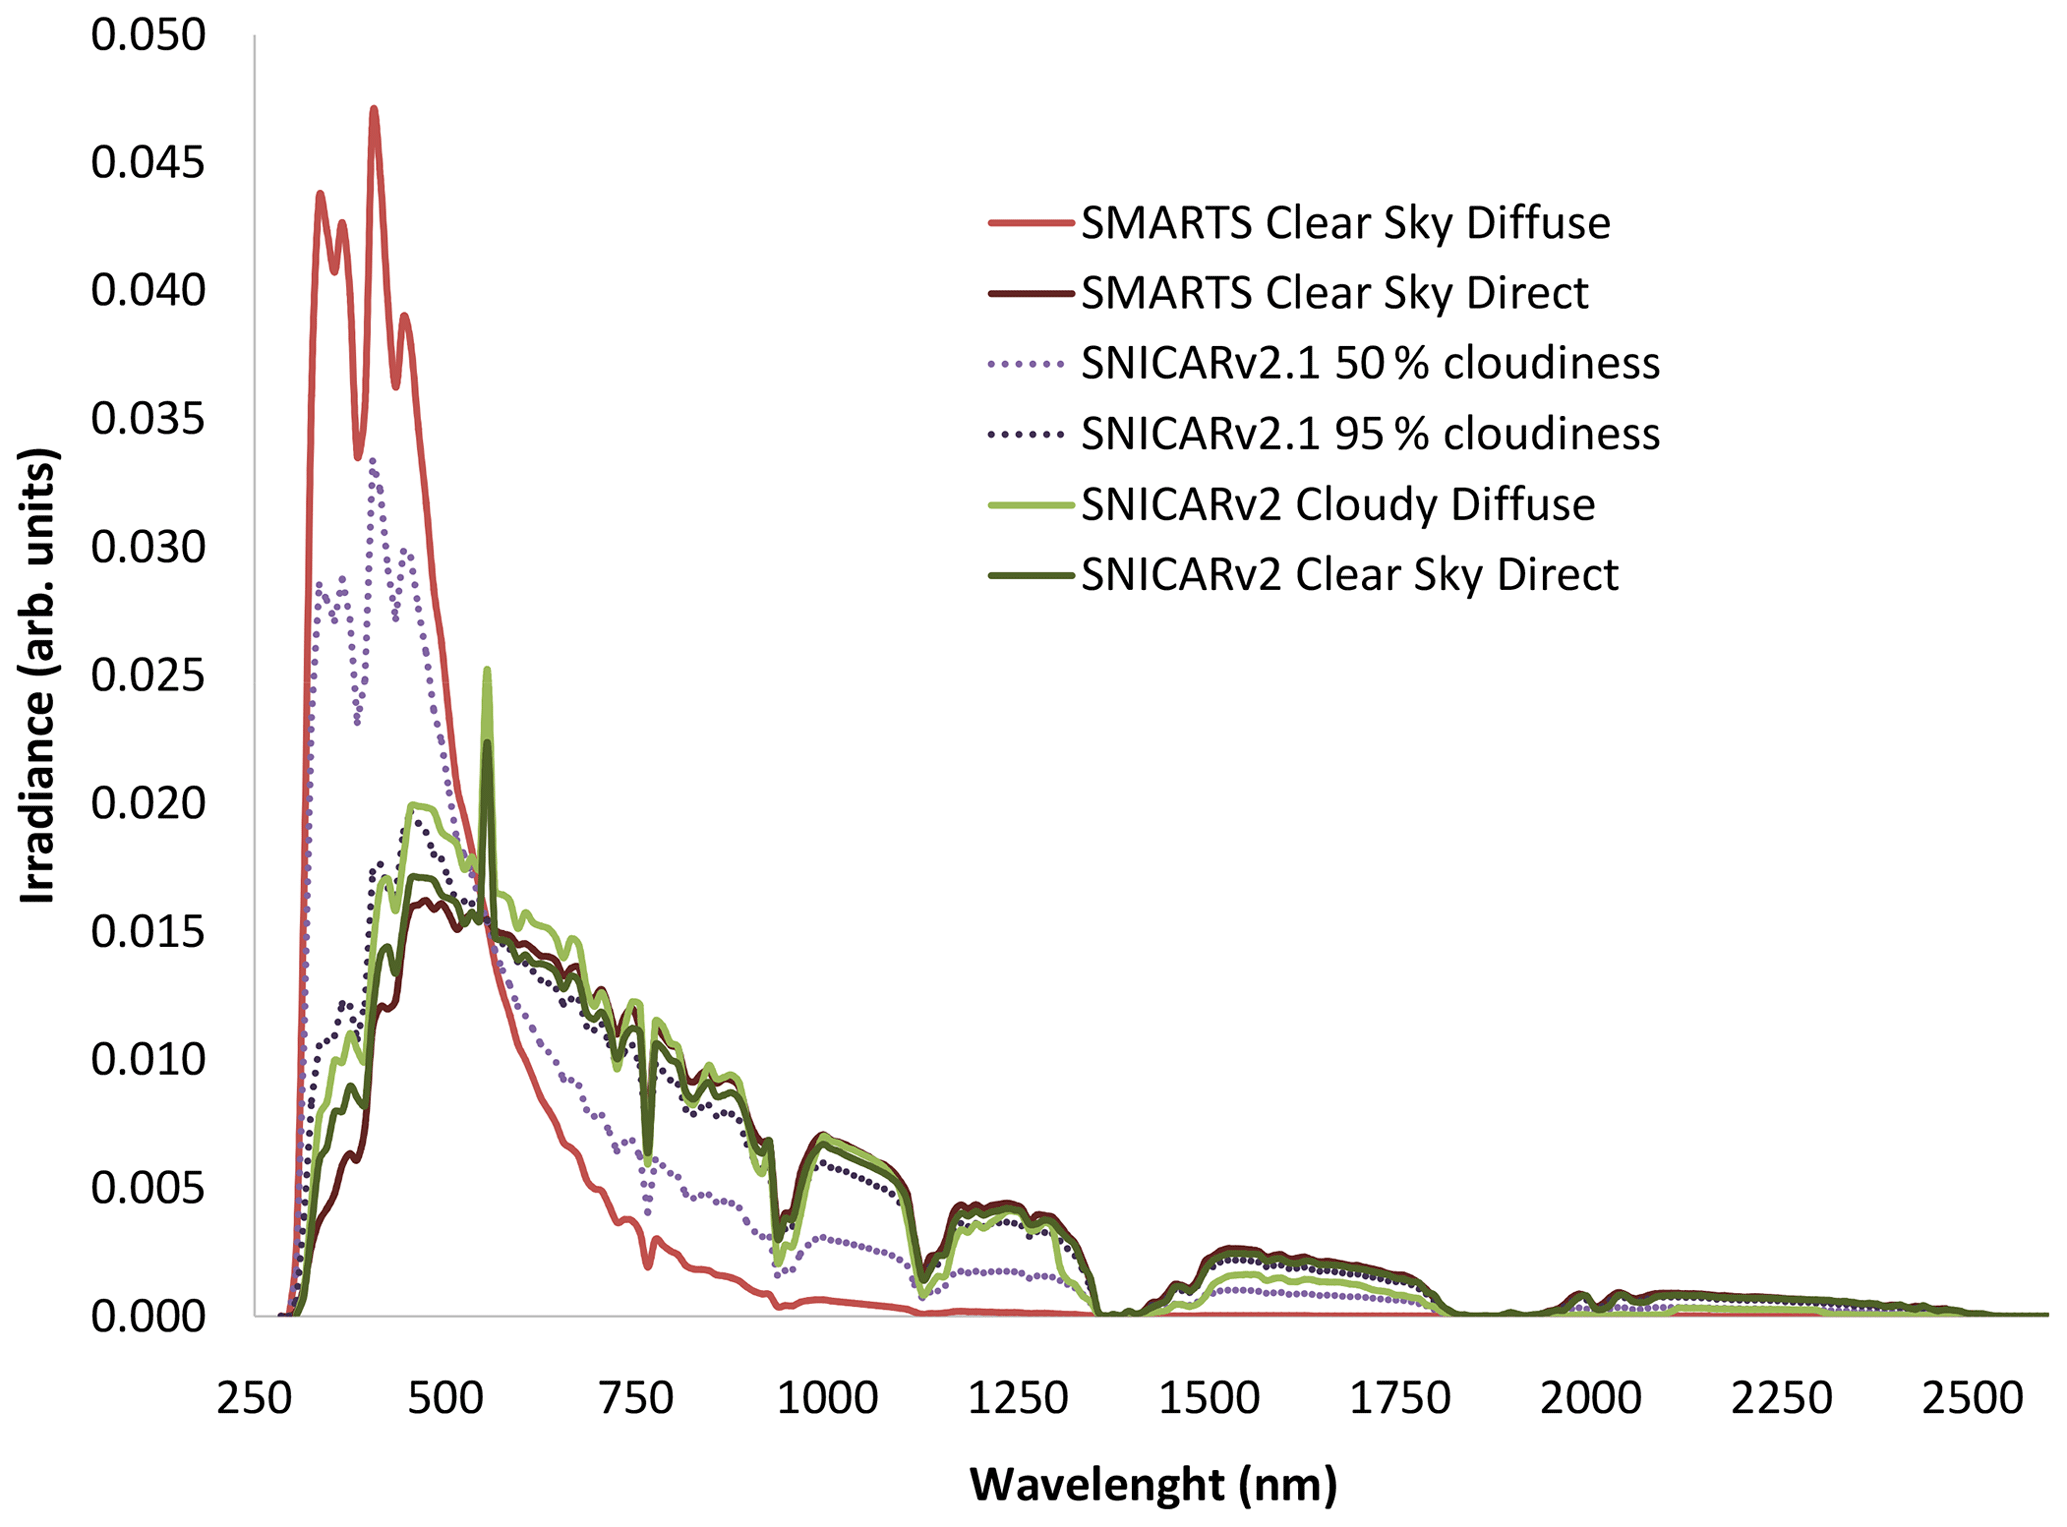
Figure 4Different normalized spectral distributions of sun radiation for SNICAR snow albedo model. SNICARv2 included two spectra for mid-latitude locations: one for overcast conditions and one for clear-sky conditions. SNICARv2.1 allows calculation of diffuse spectra for partly cloudy conditions (50 % and 95 % cloud fraction are shown as examples). SMARTS diffuse and direct clear-sky spectra for one of our sampling sites are represented for comparison.
Using different incident radiation spectral distributions, we obtained the pure direct and diffuse albedo with SNICARv2 and SNICARv2.1 (αdir and αdiff). For SNICARv2.1 we also calculated the weighted average albedo, which should be compared to the net measured albedo:
2.4 Alerce Glacier surface mass balance model
To analyze the role of albedo decrease in the surface mass balance of Alerce Glacier, we used a spatially distributed surface mass balance model (spatial resolution 20 m) driven by daily temperature, precipitation, and potential direct solar radiation (Huss et al., 2008). The model was calibrated by surface mass balance measurements performed on a seasonal to annual basis through the year 2016 over Alerce Glacier.
Here we summarize the most relevant model components. Snow accumulation for all grid cells (x,y) and all time steps (t) was calculated based on precipitation P(t) occurring below a threshold air temperature of 1.5 ∘C (Hock, 1999). Accumulation distribution Ds(x,y) was inferred based on a spatial distribution pattern derived from winter snow measurements and topographic parameters (slope, curvature) to account for small-scale snow redistribution (Huss et al., 2008; Sold et al., 2016).
P(t) was the daily precipitation at Tepual weather station (90 m altitude, ID 857990; https://www.ncei.noaa.gov/access/search/data-search/global-summary-of-the-day, last access: 15 September 2020). The factor Cpre allows for adjusting precipitation measured at the weather station to the conditions on the glacier.
Snow and ice melt were calculated based on a simplified energy-balance formulation proposed by Oerlemans (2001), where the energy available for melt was defined as follows:
where is the potential direct solar radiation in W m−2, τ is the atmospheric transmission to solar irradiance, is the air temperature, and c0 and c1 represent parameters. T(t) was taken from the air surface temperature at San Carlos de Bariloche Airport weather station (846 m altitude, ID 877650; https://www.ncei.noaa.gov/access/search/data-search/global-summary-of-the-day, last access: 15 September 2020). Potential direct solar radiation for all grid cells and days was calculated following Hock (1999). The local surface albedo was taken to be constant for bare-ice surfaces (αice=0.34), using the most commonly applied value in the literature (Oerlemans and Knap, 1998; Cuffey and Paterson, 2010); for snow surfaces, αsnow was calculated based on the snow aging function proposed by Oerlemans and Knap (1998) with a maximum snow albedo (αmax) of 0.8 and a minimum snow albedo (αmin) adjusted during the calibration procedure.
The model was calibrated in two steps using surface mass balance measurements of the year 2016 on Alerce Glacier (Fig. S4 in the Supplement). First, the model was run over the winter period with an initial set of constants (c0 and c1) and a guess for the precipitation correction factor Cpre. As melt is of minor importance in winter, this run was used to calibrate Cpre, which scales Ds for every snowfall event. After a good agreement of measured and calculated winter accumulation was obtained, the model was run over the entire year and the remaining constants were calibrated so that the root-mean-square error between modeled and observed point annual balances was minimized and the average misfit was close to zero (Figs. S5 and S6 in the Supplement). A random set of snow accumulation and ablation stake measurements performed through the year and not used to calibrate the model were left to validate the results of the surface mass balance model.
We studied surface mass balance changes for different values of αmin (Table 2), which are indicative of the sensitivity of glacier mass balance to a change in albedo that might occur in response to the darkening of the glacier surface.
3.1 PM concentration on Alerce Glacier
PM concentrations in samples obtained in both field campaigns in the accumulation and the ablation zones are depicted in Fig. 2 as a function of pit or core depth. Alternating thin, high-PM-concentration layers and thick, low-PM-concentration layers are indicative of the seasonal glacier mass balance of more than 1 hydrological year, combined with the impact of long-range transported aerosols and the resuspension and redeposition of local particles.
Thick and low-PM-concentration layers (4.9 to 51 mg kg−1, excluding two samples from ablation zone of higher concentration, (128±2) mg kg−1 and (667±17) mg kg−1) correspond to snow accumulated during the accumulation season. Meanwhile, thin and high-PM-concentration layers (with a wide range of concentrations, between (339±26) and (9040±950) mg kg−1) are related to the surface enrichment of PM content due to the melt of snow during spring and summer (ablation season) or fair-weather melt events during the accumulation season. In the longest snow and firn core (Acc1-2016), four high-PM-concentration layers were recognized. The first one at 3–5 cm deep represents the end of the ablation season of the hydrological year 2015–2016, with a concentration of (339±26) mg kg−1. The next two thin layers with relatively high PM concentrations at 118 to 120 and 187 to 191 cm deep ((365±26) and (410±20) mg kg−1, respectively) were, on the basis of microscopic characterization (Sect. 3.2), attributed to the resuspension and redeposition of dust and volcanic ash and also to possible melt events, related to fair-weather events during the accumulation season of the hydrological year 2015–2016. The deepest (242 to 247 cm deep) thin, high-PM-concentration layer ((1970±200) mg kg−1) was interpreted as the surface at the end of the ablation season of the hydrological year 2014–2015, based on the abrupt change in the density, hardness, and grain size of the snow above this layer and the firn found below. In addition to PM enrichment due to melting, this last layer suffered a direct ashfall event from Calbuco volcano, which erupted on 22–23 April 2015 (Reckziegel et al., 2016).
The same alternating pattern of low- and high-PM-concentration layers was observed at other snow pits in the accumulation zone (Acc2-2016, Acc4-2017 to Acc7-2017). At the snow pit Acc4-2017, in roughly the same location as Acc1-2016, the low-PM-concentration layer between the high-concentration layers is less than 30 cm thick, which illustrates the strong decrease in direct snowfall during the accumulation season of the hydrological year 2016–2017. At site Acc3-2016, due to the slope of the site, there was no fresh snow accumulation, so the site is interpreted as representative of the surface of the accumulation area at the end-of-ablation season.
In the ablation zones we collected samples in two different environments: accumulation pockets (Abl1-2016, Abl3-2017, Abl4-2017) and glacier ice with or without fresh snow on top of it (Abl2-2016, Abl5-2017, Abl6-2017).
The net accumulation layer of Abl1-2016 goes only from 3 to 26 cm deep. This accumulation pocket completely disappeared in the summer 2016–2017. In the 2017 campaign we took two samples in a different accumulation pocket. Sites Abl3-2017 and Abl4-2017 had a negative net balance during the hydrological year 2016–2017; consequently the surface layer presented the highest PM content observed in both campaigns ((30 000±5000) mg kg−1 and (12 000±2000) mg kg−1, respectively), due to the accumulation of PM depositions from several hydrological years (together with the impact of volcanic eruptions). In situ stratigraphy revealed that in the Abl4-2017 site, the high-concentration layer was on top of a relatively low-concentration, firn layer from the 2015 winter, which means that, during the 2016–2017 ablation season, all the snow accumulated during the 2016 winter melted. Site Abl3-2017 presented an even lower net balance, revealing older firn (winter 2014) below the surface high-concentration layer. See Sect. S2 in the Supplement for additional details on the attribution of layers in sites Abl3-2017 and Abl4-2017.
The fresh snow at the top of Abl2-2016 shows slightly higher content of PM than fresh snow sampled in the accumulation zone ((21.9±0.6) mg kg−1). In the case of fresh snow at site Abl5-2017 (with a higher PM content of (1410±30) mg kg−1) we could not discard, due to its thinness, some contamination with PM from the glacier ice. Glacier ice was highly heterogeneous (relatively pure ice mixed with debris and cryoconite holes); in consequence a substantial variability in PM content over the ice surface was retrieved ((200±20) to (4300±900) mg kg−1).
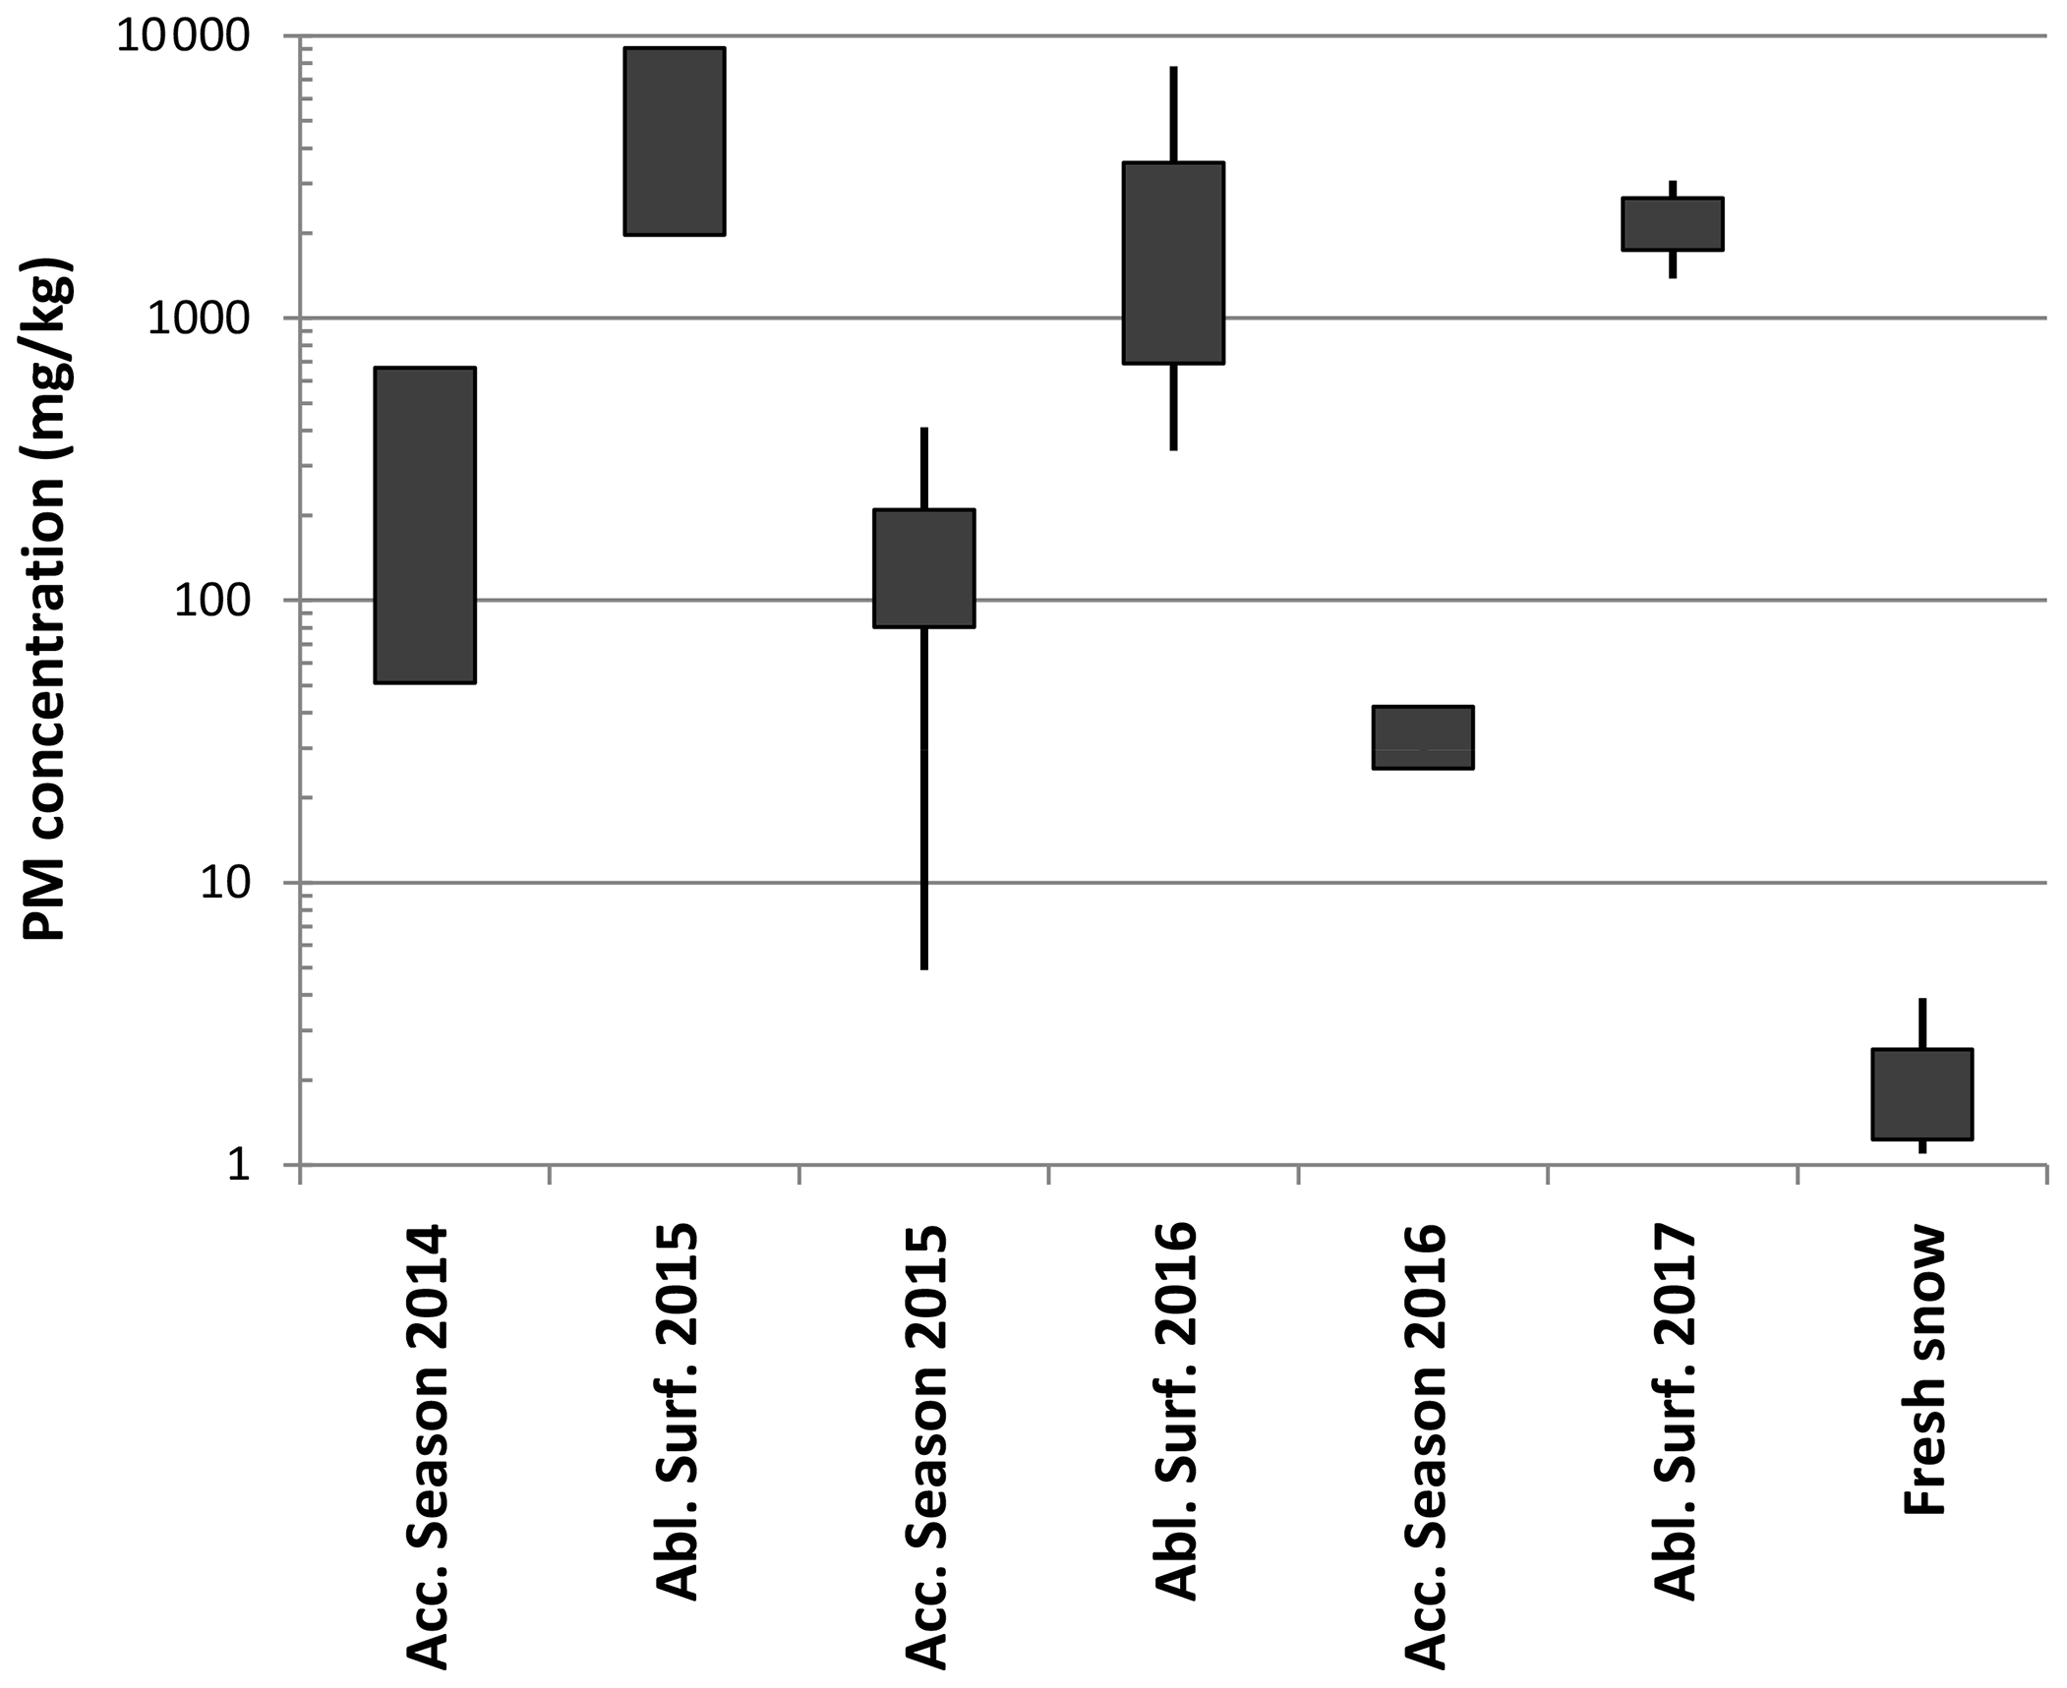
Figure 5Seasonal range of PM concentration found on snow and firn samples. For accumulation season, the values represent the mean PM concentration in thick, low-PM layers of snow and firn. For ablation season the values represents the surface PM concentration at the end of the season. The box encompasses 1 standard deviation of data, and whiskers represent minimum and maximum values (when N>2). Notice that for seasonal layers with only two measurements, the box represents those two values (coincident with the definition of standard deviation for N=2). The plot includes data from both field campaigns and excludes ablation ice samples, which cannot be assigned to a specific year or season. Fresh snow represents snow that fell a few days before the field campaigns of 2016 or 2017.
Figure 5 combines data from both field campaigns and groups PM concentrations according to the attributed date of the layers but excludes glacier ice samples, which cannot be assigned to a specific year or season. It must be noted that PM content varies over several orders of magnitude (1.3 to 21.9 mg kg−1 on fresh snow, to up to (30 000±5000) mg kg−1 in end-of-summer layers of the ablation zones). As discussed in Sect. 3.3, this is one of the main causes of the albedo values' variation.
The alternation of thin and high PM concentration with thick and low PM concentration is partially due to seasonality, as explained above. But in addition to seasonality, there is large spatial heterogeneity, especially during spring and summer (in winter, abundant fresh snow covers the glacier and gives a more homogeneous PM content and albedo distribution, as observed in other glaciers; Brock et al., 2000). The spatial variation is not only between the ablation and accumulation zones of the glacier. The interaction between glacier topography and prevailing winds produces accumulation pockets and windswept ridges, which have contrasting snow accumulation values. These areas of higher and lower accumulation lead to a wide range of spectral albedos. The detailed variations in PM concentrations, and therefore in the albedo, need to be accounted for in a detailed mass balance of the glacier (see Sect. 3.4).
Field observations on Mount Tronador in 2013 and 2014 confirmed the presence of volcanic ash in the atmosphere, derived from resuspension of volcanic ash. The magnitude of resuspension events in Andean Patagonia, a region with strong, persistent westerlies and a dry season with low relative humidity, is well known. These eolian remobilization events may produce huge ash clouds that may be even confused with true volcanic plumes; they can remobilize ash tens of kilometers away (Toyos et al., 2017). In particular, deposits of volcanic ash that are covered by snow during the winter in the high mountains usually become exposed to remobilization during the summer, traveling through the atmosphere and redepositing over different surfaces due to decreasing wind competence or to the adherence of particles on humid surfaces, even at considerably high altitudes.
The 2011 Cordón Caulle eruption produced several ashfall events during the second half of 2011; by January 2012 explosive activity had declined. As a consequence, thick deposits of tephra with different grain sizes covered an extended area in Argentina (see Fig. 2, Alloway et al., 2015). The Calbuco eruption (April 2015) was active during a shorter period but due to its location and predominant wind direction also affected Mount Tronador (Romero et al., 2016; Reckziegel et al., 2016).
Direct ash deposition and resuspension events can affect the glacier surface in different ways. Continuous, thick layers of ash (a few millimeters to a few centimeters) have been shown to behave as isolating layers when deposited over snow, similar to the effect of debris on covered glaciers (Brock et al., 2007), which reduces ablation. But on the other hand, a thinner or disperse deposit may have the opposite effect, lowering the surface albedo of the glacier and increasing its melting. The effect of ash (or other PM, for instance from biomass burning events) deposition during autumn or winter can extend for a few days until the next snow event, which covers the dark surface with the highly reflecting surface of fresh snow (see Fig. 7, Córdoba et al., 2015). But during spring and summer, warmer temperatures and fewer snow events result in an increase in ablation processes over accumulation. Snow melting can flush some of the smaller, hydrophilic PM, but larger particles (or less water-soluble small particles) are concentrated on the glacier surface (Conway et al., 1996; Xu et al., 2012; Doherty et al., 2013; Li et al., 2017; Skiles and Painter, 2017), producing up to 2 orders of magnitude of surface enrichment of PM content (Doherty et al., 2016). Resuspension and surface enrichment explain the observed alternating thin, high-PM-concentration layers and thick, low-PM-concentration layers. They also impact the spatial variability in albedo on the glacier surface during summer (Fig. 1) (Brock et al., 2000).
3.2 PM characterization
Three main types of particles were identified in samples collected in the field: mineral dust, volcanic ash and crystals derived from ashfall events, and carbonaceous particles.
Based on glass morphology, scanning electron microscopy (SEM) images, and energy dispersive spectroscopy (EDS) microanalysis performed on selected fragments, we were able to identify the presence of volcanic glass derived from the Cordón Caulle 2011 (CC) and Calbuco 2015 (Cal) eruptions. Isopach maps for both eruptions (Alloway et al., 2015; Villarosa et al., 2016; Reckziegel et al., 2016) show that Mount Tronador was reached by different plumes from ashfall events marginally, further confirming that most of the volcanic ash identified in the filters derive from these two recent eruptions. Though both eruptions deposited pumiceous ash east of the Andes in Patagonia, they can be distinguished by petrographic and morphological characteristics of the glass fragments (Fig. 6). CC glass is very fine grained colorless glass (rhyolitic in composition) while Cal pumice is light- to pale-brown, clear glass (dacitic to andesitic in composition). SEM images show the presence of irregular glass fragments, with evidence of bubble coalescence; flat or slightly curved platy glass shards that are most probably pieces of broken thin vesicle walls; and triangular (in cross section) to Y-shaped particles, which are vesicle walls from the junction of three adjacent vesicles (Fig. 7). EDS analyses of individual fragments of glass from these samples were performed and were compared with the composition of volcanic glass from samples collected in nearby locations during direct ashfall events. Results confirm the presence of glass shards from the 2015 Cal and 2011 CC eruptions (Fig. 8). In a sub-surface sample from site Abl3-2017, which was interpreted as winter snow from 2014, previous to the 2015 Cal eruption, we found that approximately 75 % of the observed particles correspond to fine-grained colorless pumiceous ash. EDS of individual fragments confirmed that ash on that sample corresponds to the CC eruption, as expected.
Other evidence of the presence of volcanic material within the PM collected in the study area is crystals of pyroclastic origin. They are clearly identified as they are partially surrounded by or associated with patches of glass and are irregular in shape. Crystals that are not directly derived from CC 2011 or Cal 2015 are more or less rounded due to erosion and transport, exhibit a dull luster, and are identified as mineral dust.
Another identified PM component is charcoal, present as black, elongated, brittle fragments. In addition, some of the samples showed evidence of the presence of BC particles, identified by their characteristic shape (carbon spherules of 100 to 200 nm in aggregates of different morphology). Carbon content by EDS could not be used to confirm the identity of BC particles due to the usage of carbon tape to fix the particles for SEM imaging.
The predominance of volcanic glass in the collected PM indicates the need to take into account the effect of volcanic ash in the albedo of seasonal snow and glaciers of the region, which can be frequently affected by volcanic eruptions. It must be emphasized that ash from the CC and Cal eruptions was observed in most of the samples, in layers dated not only immediately after the eruptions but also many years after direct deposition. Field stratigraphy together with these microscopy results suggests that we can study the effect of LAPs on snow albedo considering that all PM content can be attributed to LAPs (and, more specifically, to volcanic ash). Further chemical studies will be performed on the PM samples to refine the representation of LAPs in the snow albedo model, since optical properties can be very different for BC, mineral dust, volcanic ash, etc. (the ratio of light absorption to light scattering at different wavelengths depends on particle size, shape, and chemical composition).
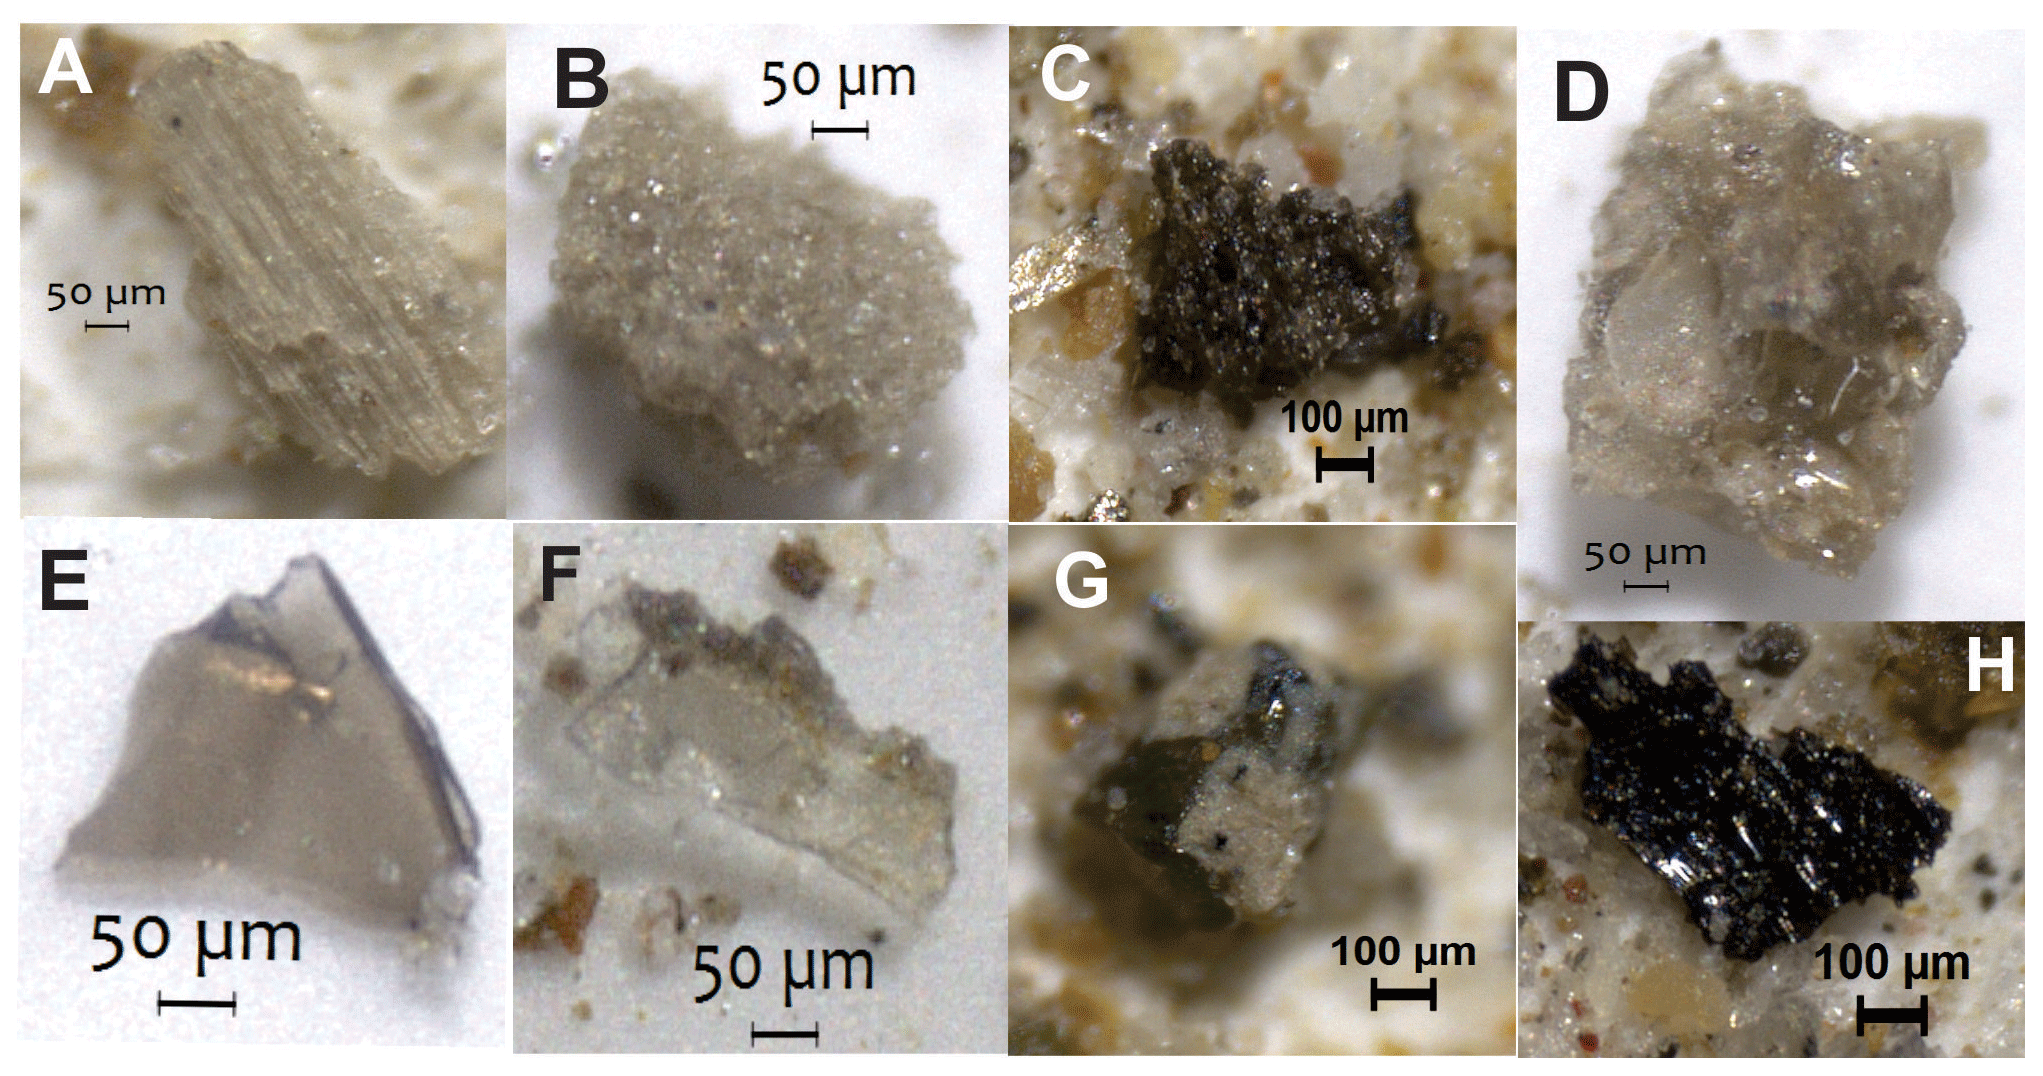
Figure 6Stereo microscope images of juvenile glass fragments from ashfall events identified in the filters. Different morphologies are shown: (a) colorless glass fragment with elongate, thin, pipe-shaped vesicles (2017 end-of-summer dark layer, site Acc7-2017). (b) Colorless pumice (surface ablation ice, site Abl6-2017). (c) Dark brown fragment of vesicular glass (2017 end-of-summer dark layer, site Acc7-2017). (d) Glass fragments with smooth, round surfaces formed by surface tension within still-molten, vesiculating droplets suggesting highly vesicular interior (2017 end-of-summer dark layer, site Acc7-2017). (e, f) Two flat, tan glass shards derived from broken vesicle walls. Left: Y-shaped fragment formed where three bubbles were in close proximity (surface ablation ice, site Abl6-2017). Right: flat glass plate formed by the fragmentation of walls that enclosed large elongated, flattened vesicles as those shown above (fresh snow on top of ablation ice, site Abl5-2017). (g) Pyroxene crystal with two patches of colorless glass with tiny dots of magnetite (2016 end-of-summer dark layer, site Acc4-2017). (h) Planar piece of charcoal with subtle striated surface texture and brilliant luster.

Figure 7Scanning electron microscopy images of samples collected on Alerce Glacier. (a) Irregular glass fragment with low vesicularity; evidence of bubble coalescence, and small, flat, platy, very thin glass shards indicated by red arrows, loosely adhering to the grain surface. These tiny fragments are remnants of burst vesicle walls. (b) Glass fragment with smooth surface. (c) Glass fragment, with remnant of parallel pipe vesicles; notice the thin vesicle walls. (d) Y-shaped glass fragment, remnant of a partially broken pumiceous pyroclast with elongated parallel bubbles. (e) Glass fragment with smooth surface. (f) Closeup of the glass fragment in (e), showing in detail the smooth surface. (g) Portion of a vitric pyroclast with loose material on its surface (adhering dust), mostly tiny glass fragments, and a vesicle indicated by a red circle which contains small particles. (h) Closeup of the vesicle filling in (g), showing an aggregate of carbon spherules of 100 to 200 nm corresponding to black carbon (BC) particles.
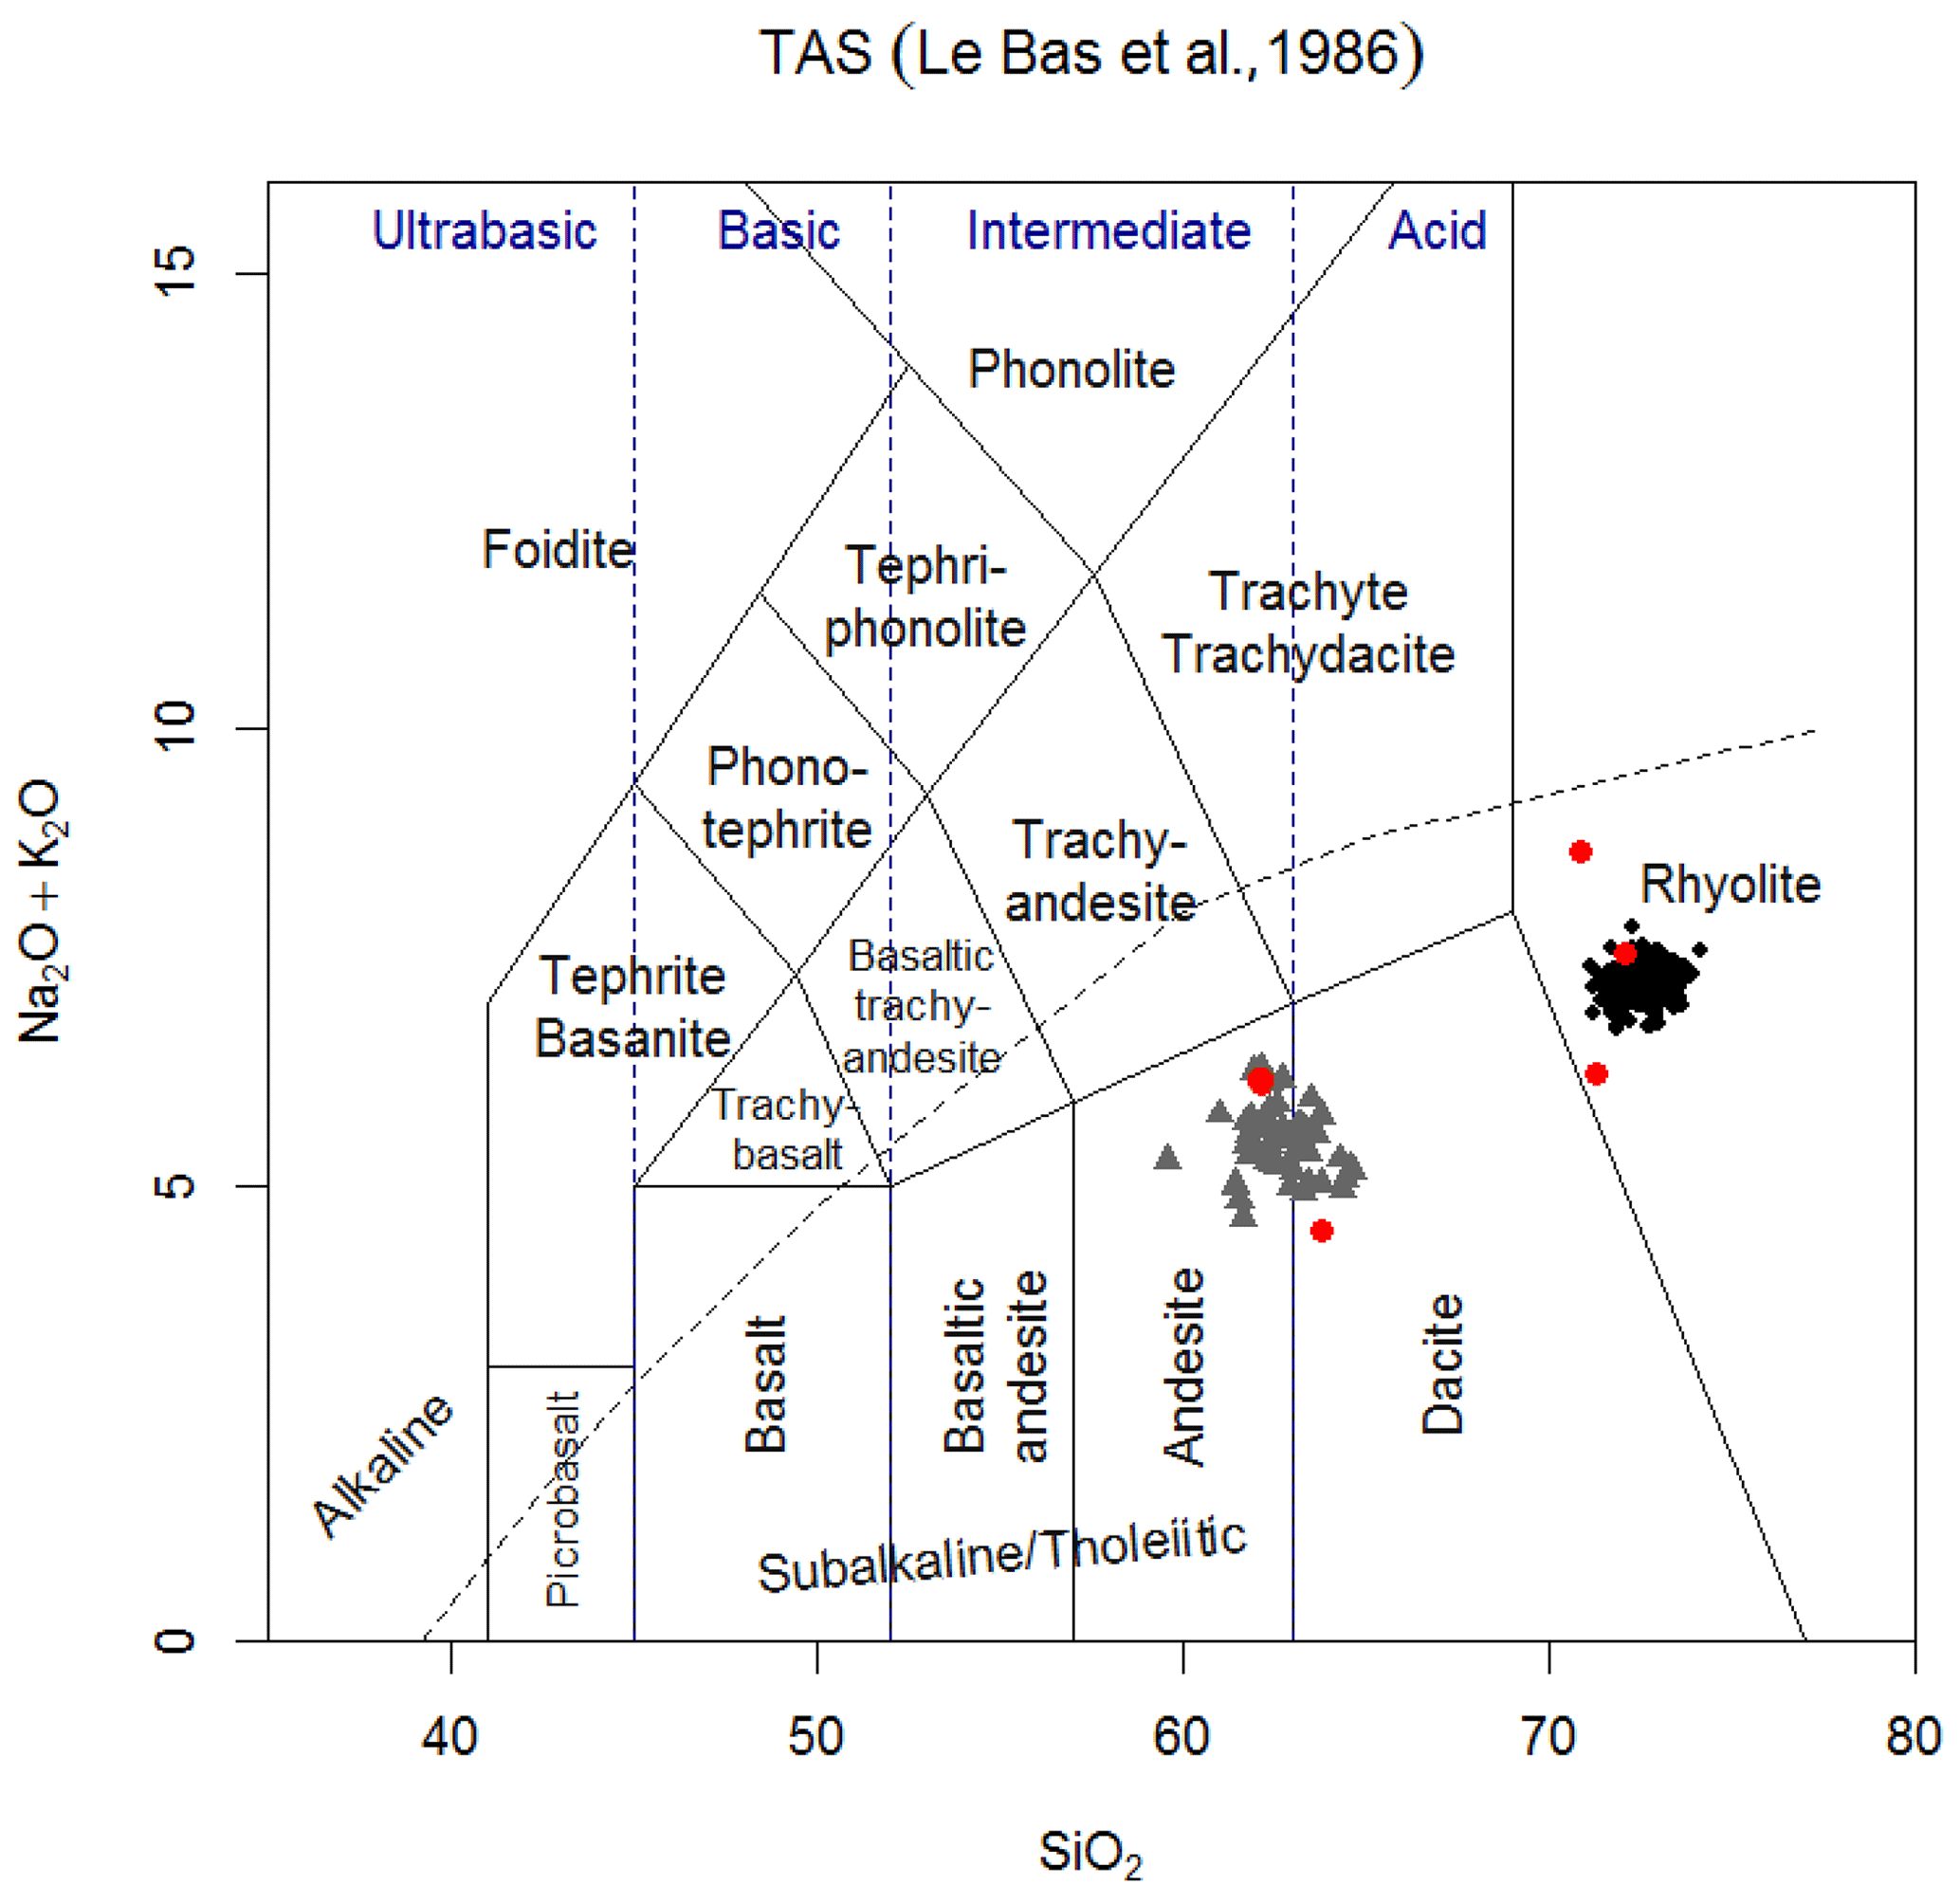
Figure 8Classification diagram TAS (Le Bas et al., 1986). Major element compositions of glass shards from the 2015 CE Calbuco eruption acquired by electron microprobe analyses (microprobe housed at the LAMARX laboratory, FAMAF, Universidad Nacional de Córdoba, Argentina) from samples collected during direct ashfall events in Junín de los Andes and on Cardenal Antonio Samoré Pass, Argentina (Villarosa et al., 2016), and from the 2011 CE Cordón Caulle eruption acquired by electron microprobe (EMP) analysis, with samples collected in San Carlos de Bariloche, Villa La Angostura and on Cardenal Antonio Samoré Pass, Argentina (Alloway et al., 2015). Red circles: EDS analyses from PM samples from the studied area. Glass shards derived from Cordón Caulle (black circles) are rhyolitic in composition, while glass from the Calbuco eruption (grey triangles) is andesitic to dacitic in composition.
3.3 Albedo – measurements and models
Table 1 shows measured and modeled albedo values for six sites (two from the first field campaign, 2016, and four from the latter, 2017), together with different measured properties of the snow topmost layer and site.
Table 1Measured and modeled snow albedo for six sites (two in 2016 campaign and four in 2017 campaign). For 2016 campaign the measured albedo is a single measurement and is given together with its instrumental uncertainty. For 2017 campaign, we report the average and the standard error in the average for several repetitions. For modeled albedo, sensitivity to different input parameters is reported, as an estimation of albedo uncertainty. See Sect. 3.3 for an explanation of the values in bold.
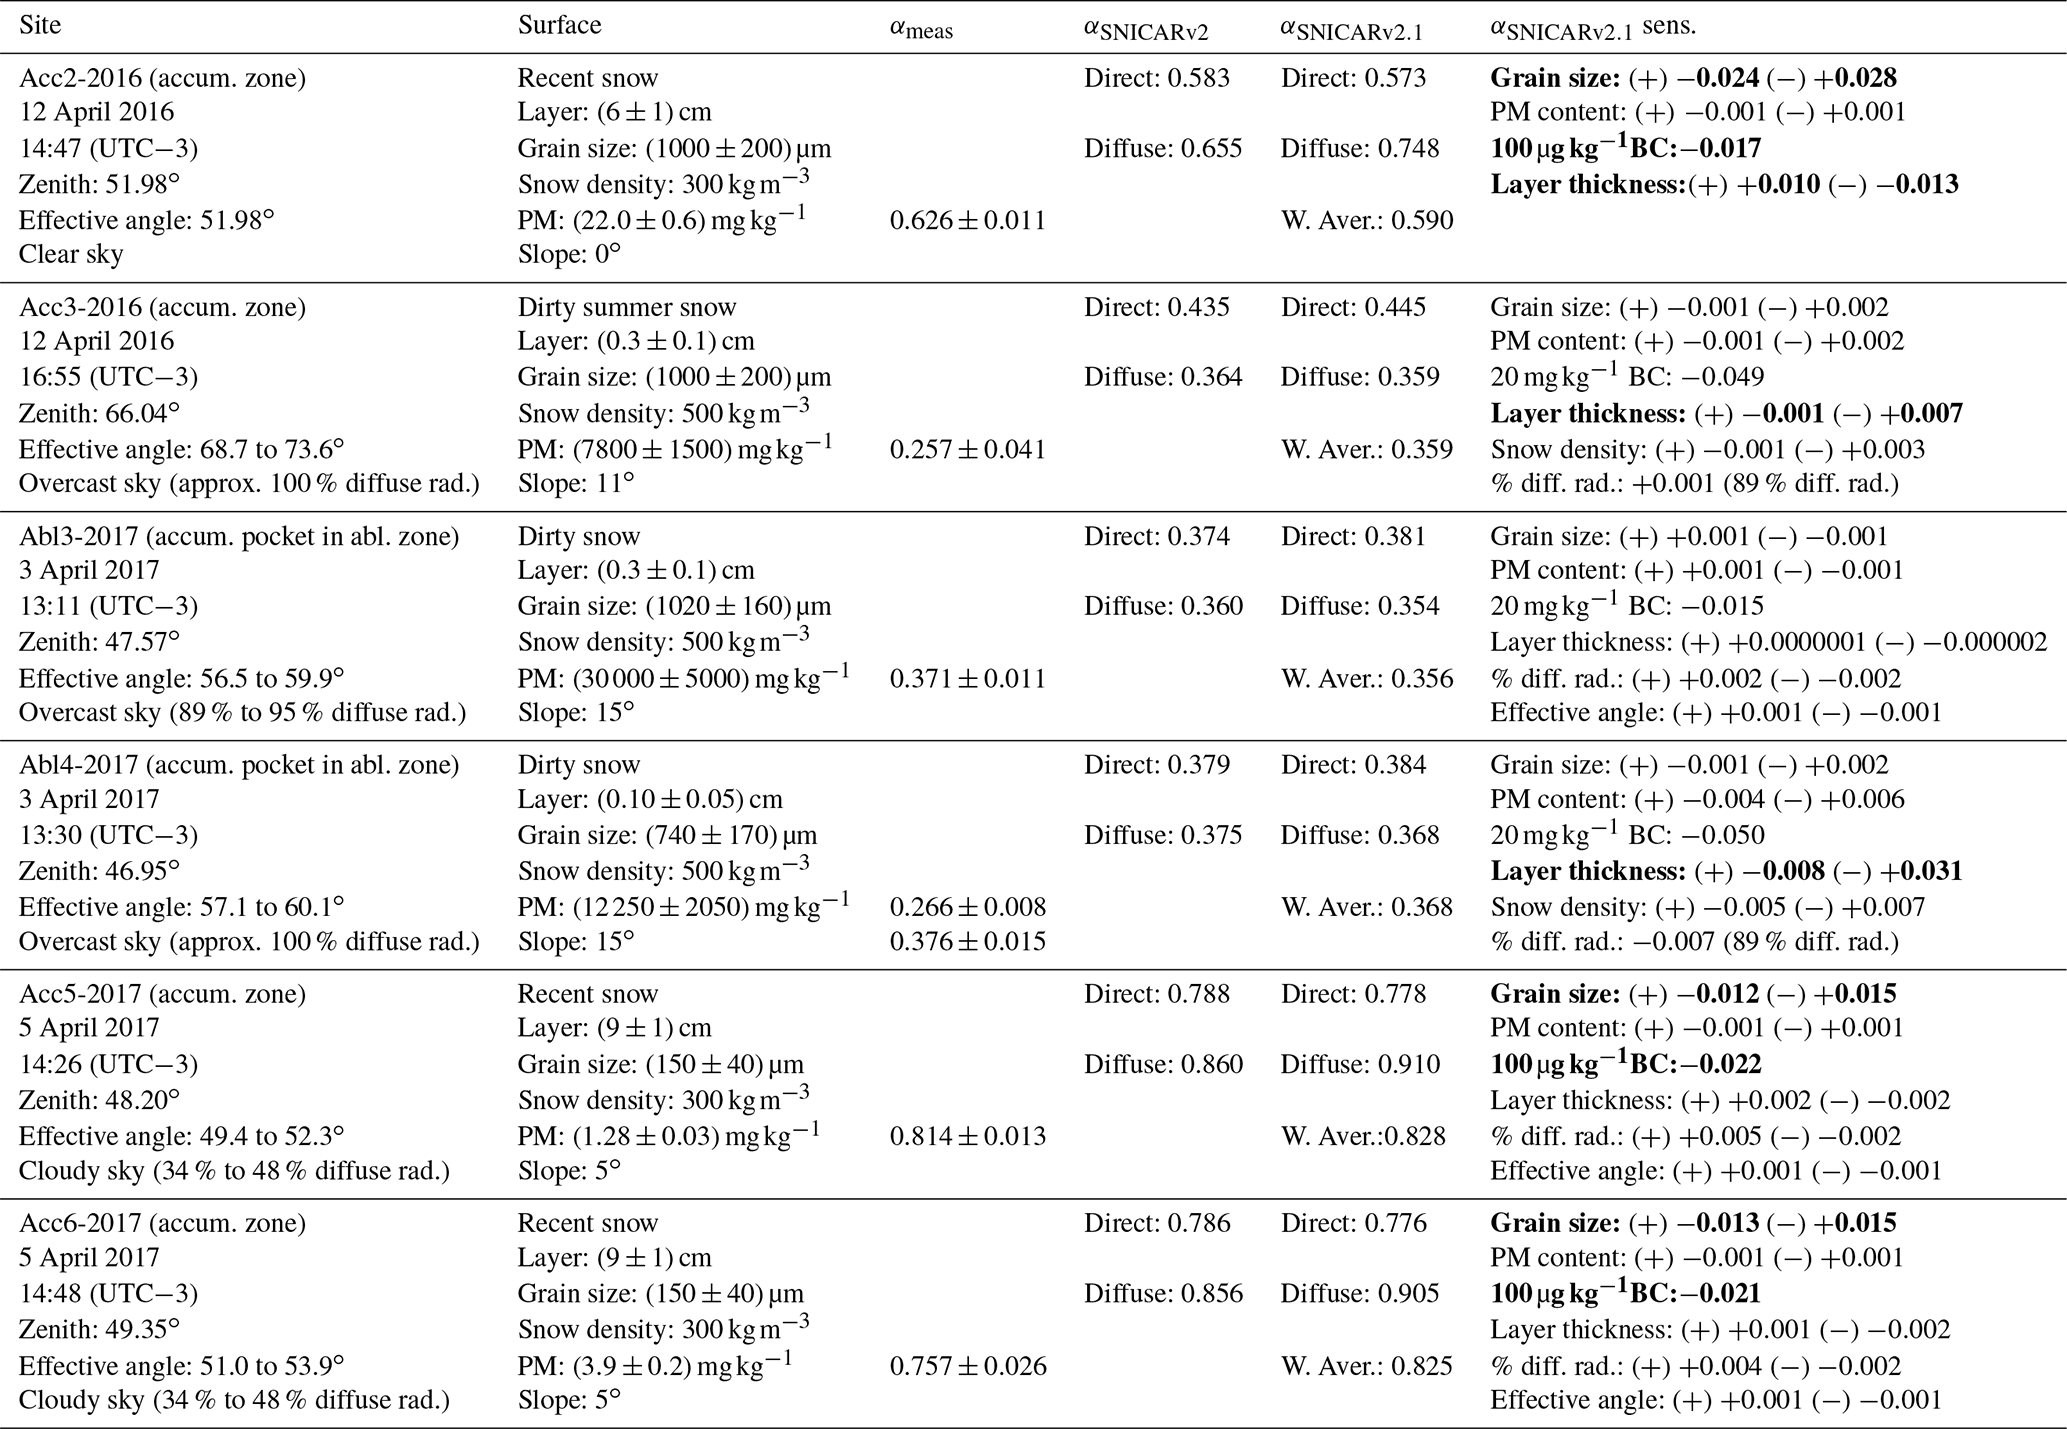
Reported values of measured albedo include shadow corrections, although these corrections were quite small in all cases (below 3.5 % for the worst conditions in the 2016 campaign and below 2 % for the 2017 campaign). In some cases (site Acc3-2016) the corrections in the measured incoming and reflected radiation are higher (10 % to 14 %), but they largely balance out. For the 2016 campaign, the reported measured albedo is a single measurement (registered after voltage reached a stable value) and is given together with its instrumental uncertainty. It must be noted that for this campaign the reported uncertainty reached values as high as 15 % for the worst conditions (low incident radiation and low albedo, as in Acc3-2016) or of around 2 % for the best conditions (clear sky, high albedo). For the 2017 campaign the instrumental uncertainty was lowered by improving the accuracy of the digital multimeter used with the pyranometer, achieving uncertainties lower than 3.5 % (worst conditions) or lower than 1.2 % (best conditions).
Results from the 2017 campaign, obtained using the improved mounting stand, shed light on the reproducibility of albedo measurements. For this campaign, we found that repeated albedo measurements in the same site have a standard deviation corresponding to around 5 % to 10 % of the average values. This range could be partly due to the leveling of the stand or to inherent variability in the measurement at these sites (especially differences in the solar irradiance for situations with rapid changes in cloudiness).
Regarding snow grain size, it is relevant to notice the range of the observed average radius. In fresh snow samples from the accumulation zone (sites Acc5-2017 and Acc6-2017) we found an average snow grain radius of (151±41) µm, whereas in samples of older firn in the ablation zone (or sub-surface snow and firn in the accumulation zone) we measured values usually of around (1000±200) µm. Pirazzini et al. (2015) also used 2D photos but with a different metric. They suggest that the SSK (shortest skeleton branch) is a proxy for “half the width of the shortest particle dimension”, which they claim is a better approximation of the optically equivalent snow grain radius. Our metric (see Sect. 2.2.3) would probably give higher results than the SSK, and hence we might have overestimated the optically equivalent snow grain radius. Nevertheless, as we show below in this section, our grain size measurements seem to be good enough to reproduce the measured albedo for fine and coarse snow in the SNICARv2.1 snow albedo model. It must be emphasized here that the developed method for characterizing snow grains for the 2017 campaign allows us to measure the size distribution and to assess the relevance of different grain shapes (when necessary). It has been shown that the shape of the snow grains can significantly affect snow albedo (Libois et al., 2013; He et al., 2017). Except for fresh snow (snow less than 1 d old), where it is possible to still distinguish crystal fragments, in both campaigns the observed snow and firn grains were rounded. This is related to the temperate climate at Mount Tronador, where snow temperature is above −5 ∘C and the temperature gradient is low. Also, the presence of meltwater within the snow layers enhances the rate at which grains become rounded, because the grains melt first at their extremities. Finally, the average grain size increases because the smaller grains tend to melt before the larger ones (Flanner and Zender, 2006). Hence, we assumed spherical grains for all modeled albedo calculations.
Table 1 also reports modeled albedo results for each site. Results of the updated model (SNICARv2.1) were calculated with the direct and diffuse spectra estimated for the specific sky conditions, as detailed in Sect. 2.3. The weighted average of pure direct and pure diffuse radiation albedos represents the net albedo of snow for total incident radiation. For comparison, results from SNICARv2 with the available standard spectra (mid-latitude clear-sky direct radiation spectrum or overcast-sky diffuse radiation spectrum) are presented. As expected, for clear-sky conditions (site Acc2-2016) the pure direct albedo from SNICARv2 is similar to the weighted average from SNICARv2.1. The pure diffuse albedos from both models differ significantly, but the fraction of diffuse radiation is very low, and hence its contribution to net albedo is also low. For overcast conditions (Acc3-2016, Abl3-2017, and Abl4-2017), the pure diffuse albedo from both models is also similar, and the weighted average albedo from SNICARv2.1 is coincident with the pure diffuse albedo. For both models, the diffuse radiation spectrum for overcast conditions is coincident with the global solar radiation spectrum (see Fig. 4), which explains the similar results. It must be noticed that for site Abl4-2017, we observed rapid cloud movements, and we decided to register two sets of albedo measurements. The average albedo of the second set is similar to the modeled weighted average albedo and to the measurement for site Abl3-2017. We suggest that this coincidence means that the pictures of the sky above the site (taken after the two sets of measurements) and the estimate of cloud cover based on those pictures represent more accurately the sky conditions during the second set of measurements. Finally, partly cloudy skies (sites Acc5-2017 and Acc6-2017) are the main reason for the development of SNICARv2.1. For these cases, pure direct and pure diffuse albedo differ much more than the associated uncertainties, and pure diffuse albedo from SNICARv2.1 also differs from that from SNICARv2. These differences are also evident from the comparison between the diffuse radiation spectra for partly cloudy skies developed for SNICARv2.1 and the diffuse spectra for overcast skies used in SNICARv2 (Fig. 4). For these sites, SNICARv2 cannot give a good approximation. For Acc5-2017 the SNICARv2.1 weighted average albedo seems a good approximation of the measured albedo. For Acc6-2017, the measured albedo is lower than the pure direct and pure diffuse albedo, so both models give higher estimates for this site. As discussed below in this section, the effect of the diffuse radiation fraction does not seem to be the main source of this disagreement.
The updated model reproduces quite well the main features of the measured albedo (with a larger discrepancy for sampling site Acc3-2016). One of the most important parameters affecting albedo is PM content: the measurements with lower albedo values (αmeas<0.4) correspond to sites with the highest PM content (Acc3-2016, Abl3-2017, and Abl4-2017), whereas the remaining sites have much lower PM content (fresh snow) and αmeas>0.6. It must be noted that for high PM content, a further increase in particle content does not significantly affect the albedo: our simulations for site Acc3-2016, with (7800±1500) mg kg−1 of PM, match closely those for sites Abl3-2017 and Abl4-2017, with (30 000±5000) mg kg−1 and (12 250±2050) mg kg−1 of PM, respectively. The same effect is noticed when simulating the impact of the possible presence of BC on snow. For sites with low PM content, an increment of 100 µg kg−1 of aged BC has a relevant impact on modeled albedo (of between −0.017 and −0.022 for the studied sites). However, for sites with higher PM content, much higher BC concentrations were needed in order to observe a relevant effect in modeled albedo (for a 20 mg kg−1 increment of BC, we calculated an effect of −0.015 to −0.050 in calculated albedo). Ginot et al. (2014) have already reported simulation results for Mera Glacier, Nepal, that showed that the effects of dust and BC content on albedo and the potential melting of snow are non-additive. Our results show that for site Acc3-2016 20 mg kg−1 of BC represents a lowering of −0.049 of albedo for snow containing 7800 mg kg−1 of volcanic ash, but the impact increases to −0.057 if the snow contains only 6300 mg kg−1 of volcanic ash (which is possible due to the uncertainty in gravimetric PM content).
On the other hand, comparison between sites with low PM content shows that snow grain size has a remarkable effect, as previously reported (Wiscombe and Warren, 1980; Hadley and Kirchstetter, 2012). Fresh snow with a small grain size presents αmeas≈0.8 (sites Acc5-2017 and Acc6-2017), but snow with similar PM content that has aged a few days presents αmeas≈0.6 (site Acc2-2016). Spectral albedo measurements (not available in our field campaigns) would allow us to study separately the effect of grain size and LAP content (see for instance measurements of snow specific surface area, SSA, in Carmagnola et al., 2013), to confirm that our grain size measurements are a good estimate of the optically equivalent grain radius.
The last column in Table 1 reports the results of sensitivity studies to evaluate the impact on the calculated albedo of the uncertainty in key input parameters. We define the sensitivities as the modeled albedo changes increasing or decreasing one parameter at the same magnitude as their respective reported uncertainties (identified in Table 1 with a “+” or a “−” sign, respectively), while keeping all other parameters unchanged. For each site, we studied PM content and grain size impact, together with other parameters that could be relevant at each site. We highlighted (with bold characters) the higher sensitivities for each site.
Concerning grain size uncertainty (the standard deviation of snow grain radii in each sample), it is clear that the impact on albedo is much larger when PM content is low (sites Acc2-2016, Acc5-2017, and Acc6-2017). For low-PM-content sites, the effect is comparable to experimental uncertainty and is relevant for sites with both finer-grain-size and coarser-grain-size snow. For sites with high content of PM the uncertainty in grain size does not have an appreciable effect. Pirazzini et al. (2015) determined an 11 % uncertainty in the grain size measurements from 2D photos (due to the subjectivity of the software operators). Although we did not determine such uncertainty in our measurements, we suggest that the reported standard deviation (between 16 % and 26 % of the average value) is probably larger than the uncertainty in the method. The sensitivity studies showed that the effect on the modeled albedo is lower than 4.5 % for clean snow and lower than 0.8 % for dirty snow. We believe that this explains the fact that we can reproduce the measured albedo using the estimated grain size together with other snow properties (especially LAP content), even though our grain size estimates might not be as accurate as those obtained by other methods.
The uncertainty in volcanic ash content does not have a relevant impact for any of the sites, although it is larger for site Abl4-2017. However, as previously mentioned, the presence of BC (not yet quantified in these samples) could have a more relevant impact on albedo. For instance, it could explain the difference between measured and modeled albedo for site Acc6-2017 and the difference with site Acc5-2017.
Regarding the impact of the uncertainty in layer thickness, the results show that several factors determine the relevance of this parameter. The impact is maximal for very thin layers, especially when the underlying layer has a significantly different albedo (site Abl4-2017, 0.1 cm thick), and it is minimal for the thicker layers (sites Acc5-2017 or Acc6-2017, 9 cm thick) or for intermediate thicknesses with high PM content (i.e., low penetration of incident light, site Abl3-2017, 0.3 cm thick). The impact of uncertainty on snow density was not studied in detail, but the impact is inverse to that of the thickness of the layer. Hence, we report only the moderate impact of snow density uncertainty for site Abl4-2017.
The impact of the uncertainty on the diffuse-irradiance-to-global-irradiance ratio is moderate but appreciable, which emphasizes the relevance of measuring the ratio in the field. Finally, the impact of the uncertainty on the incidence angle is low and not appreciable for this range of experimental albedo uncertainty.
Another possible reason for disagreement between modeled and measured albedo, especially for aged snow, is surface roughness. Millimeter-scale surface roughness due to snow aging has been shown to reduce albedo, especially in the infrared region, due to multiple reflections in the cavities (Pirazzini et al., 2015). Computer simulations have studied the parameters that determine the magnitude of the effect of sastrugi (centimeter-scale roughness) on albedo (Zhuravleva and Kokhanovsky, 2011). Quantification of the impact of surface roughness of snow on measured albedo is out of the scope of this work, but it must be remarked that in sites with higher PM content, where there have been longer snow metamorphosis processes (Acc3-2016, Abl3-2017, and Abl4-2017), we observed higher surface roughness.
Literature values of snow albedo mainly depend on the PM content. Two other studies that have found snow albedo ranges similar to our measurements are connected with local or regional transport of dust (Painter et al., 2012; Wittmann et al., 2017). Young et al. (2014) modeled the direct deposition of volcanic ash from the Redoubt volcano 2009 eruption on Arctic snow, finding similarly high albedo reductions. Sicart et al. (2001) also found a similar albedo range at Zongo Glacier, but their lower values of albedo are attributed not to PM surface enrichment but to very thin snow layers over dirty ice.
Recent studies in the Chilean Andes have measured or modeled small reductions in snow albedo, due to traffic-related BC (Cereceda-Balic et al., 2018) or to a combination of urban BC and dust from desert regions (Rowe et al., 2019). Similarly, studies on Mera Glacier, Nepal (Ginot et al., 2014), and at several sites on the Tibetan Plateau (Zhang et al., 2018) have found small albedo reductions due to BC and dust, and almost negligible effects of impurities have been found in Greenland (Carmagnola et al., 2013; Wright et al., 2014).
3.4 Albedo and modeled impact on glacier mass balance
Table 2 shows the modeled annual and winter surface mass balance, equilibrium line altitude (ELA), and accumulation area ratio (AAR) for different values of old snow albedo (αmin). Figure 9 shows the change in cumulative surface mass balance and ablation and the annual mass balance elevation gradient for the different values of αmin. The mass balance sensitivity to albedo change, defined as the change in surface mass balance per 0.1 of αmin decrease is around −0.6 and −0.07 , for annual and winter mass balance, respectively (Table 2). Aged snow albedo has a considerable effect on the surface mass balance of Alerce Glacier (Fig. 9a), increasing the amount of melt during the ablation period from almost 2.4 m w.e. to more than 4.6 m w.e. when αmin is decreased from 0.7 to 0.3 (Fig. 9b). Although the accumulation of the glacier does not change (the amount of precipitation for the different run test is the same), there is a decrease in the winter (accumulation) mass balance due to the albedo effect over ablation episodes at the beginning of the accumulation season (Fig. 9, Table 2). The decrease in the aged snow albedo αmin has an impact all over the glacier, decreasing the surface mass balance at all elevation ranges. Other glaciological parameters related to the surface mass balance of the glacier, like the ELA or AAR, also seem to be profoundly impacted with the decrease in albedo, with a total increase in ELA of 250 m and a decrease in the AAR of more than 50 % when the old snow albedo changes from 0.7 to 0.3. Nevertheless, since both ELA and the AAR depend on the hypsometry of the glacier, the changes do not increase constantly.
Table 2Albedo values for ice (αice), old snow (firn, (αmin)), and fresh snow (αmax) used for the sensitivity study of Alerce glacier-wide mass balance to change in the albedo. The winter and annual glacier-wide surface mass balance (MB), ELA, and AAR for each simulation is presented.

To give physical meaning to the albedo values presented in Fig. 9 and Table 2, we can use as a reference the daily averaged albedo values modeled with SNICARv2.1 for some of the sampling sites in Table 1.
The used in the mass balance model is equivalent to the daily average of 0.805 for clear-sky conditions, 0.803 for overcast sky, and 0.835 for 33 % cloudiness, modeled for fresh snow with very low PM content at site Acc5-2017. The scenario in Table 2 is similar to the daily average of 0.612 for clear-sky conditions, 0.605 for overcast sky, and 0.637 for 33 % cloudiness, modeled for aged snow with low PM content (Acc2-2016). Although it represents intermediately aged snow, it can serve as an example of a snow or firn surface with low PM content, a situation where no ashfall occurred at Mount Tronador. The scenario in Table 2 is similar to the modeled daily average of 0.407 for clear-sky conditions, 0.368 for overcast sky, and 0.382 for 33 % cloudiness of the firn with very high PM content (Abl4-2017). These values are representative of the snow and firn albedo during summer for the years 2016 and 2017. The other scenarios are used to depict intermediate or more extreme situations and to analyze the role of albedo change in the surface mass balance of the glacier.
Our αmin analysis allows us to estimate the impact of volcanic ash on the surface mass balance of Alerce Glacier. In the absence of volcanic eruptions, if we assume that other local or regional PM sources (mineral dust, biomass burning, etc.) do not affect significantly fresh snow albedo, it is expected that the summer αmin over the glacier surface is similar to the scenario. Although we could not sample summer firn layers previous to the 2015 Cal eruption to test this hypothesis, this first-order assumption would mean that volcanic ash is responsible for a 1.25 decrease in the annual surface mass balance (or a 36 % increase in summer ablation) if we compare the and scenarios.
Although more sampling of the firn and snow layer and further chemical analysis on the samples are needed to confirm that the decrease in albedo is only due to the effect of volcanic ash, we have shown that PM content (and hence αmin) varies largely over the glacier surface. Taking into account these spatiotemporal changes in albedo for glacier mass balance models is a challenging task. Defining a low number of representative regions over the glacier surface is not an easy task, due to the already-mentioned high heterogeneity. In addition, it would be difficult to regularly measure PM content (and/or albedo) in those regions, due to the distances and path conditions on the glacier. Regional atmospheric models could be of help in predicting the deposition of volcanic ash, mineral dust, BC, and other PM. But the spatial scale of those models (>1 km) is too coarse to capture the spatial variation in the albedo over the glacier.
These challenges have been acknowledged in the literature, and several approaches have been followed to estimate snow and ice melting. The simplest approaches have used measured or modeled albedo changes together with measured or modeled solar radiation to estimate melting, without taking into account spatial heterogeneity (in surface temperature, PM concentration, etc.) (Ginot et al., 2014; Zhang et al., 2018). For Mera Glacier, Ginot et al. (2014) calculate that BC and dust are responsible for approximately 26 % of total melting. Zhang et al. (2018) do not report the effect on melt rates but only the impact on seasonal snow cover duration, and hence their results are not easy to compare with ours. Painter et al. (2013) used a glacier mass balance model similar to ours but introduced temperature anomalies (due to BC radiative forcing) to estimate mass balance changes. They used several approximations to postulate BC concentrations over the glaciers based on limited ice cores. Their results are difficult to compare to ours due to the different approach: they analyze general mass balance trends over 2 centuries. Flanner et al. (2007) and Ménégoz et al. (2014) used emission inventories and general circulation models to study deposition of BC (and mineral dust, in the latter work) and its radiative forcing. The spatial resolution of their simulations make difficult the comparison with field PM concentration measurements and hinder the accuracy of quantitative mass balance calculations (Ménégoz et al., 2014; Qian et al., 2015). Young et al. (2014) used modeled ash deposition, SNICAR, and a restricted degree-day radiation balance. They found melt rates to be between 140 % and 320 % higher than for pure snow, although the low spatial resolution of the simulations (≈18 km) may affect the precision of the results. Vionnet et al. (2012) used the detailed snow model Crocus implemented on the soil model SURFEX to study the snowpack on the Grandes Rousses mountain range in the French Alps. They used a high-resolution DEM (150 m) together with meteorological forcing from interpolation of SAFRAN atmospheric reanalysis. Their main weakness is that at that moment Crocus did not explicitly treat PM in snow (it was only implicitly included in their parametrization of snow albedo changes with snow aging).
There are also some examples in the literature that have addressed the coupling of meteorological models with glacier or snowpack models. Different authors have studied climate feedback effects on Karakoram glaciers (Collier et al., 2013), the Svalbard glaciers (Aas et al., 2016), and the snowpack in Antarctica (Vionnet et al., 2012). The authors suggest that the next steps would be to couple a regional atmospheric model with the ability of prognosis of PM deposition (such as Ménégoz et al., 2014) with a high-resolution glacier mass balance model (such as ours or Crocus implementation in SURFEX; Vionnet et al., 2012), and include explicit treatment of the PM effect on snow albedo (such as SNICAR or recent Crocus implementations in Tuzet et al., 2017).
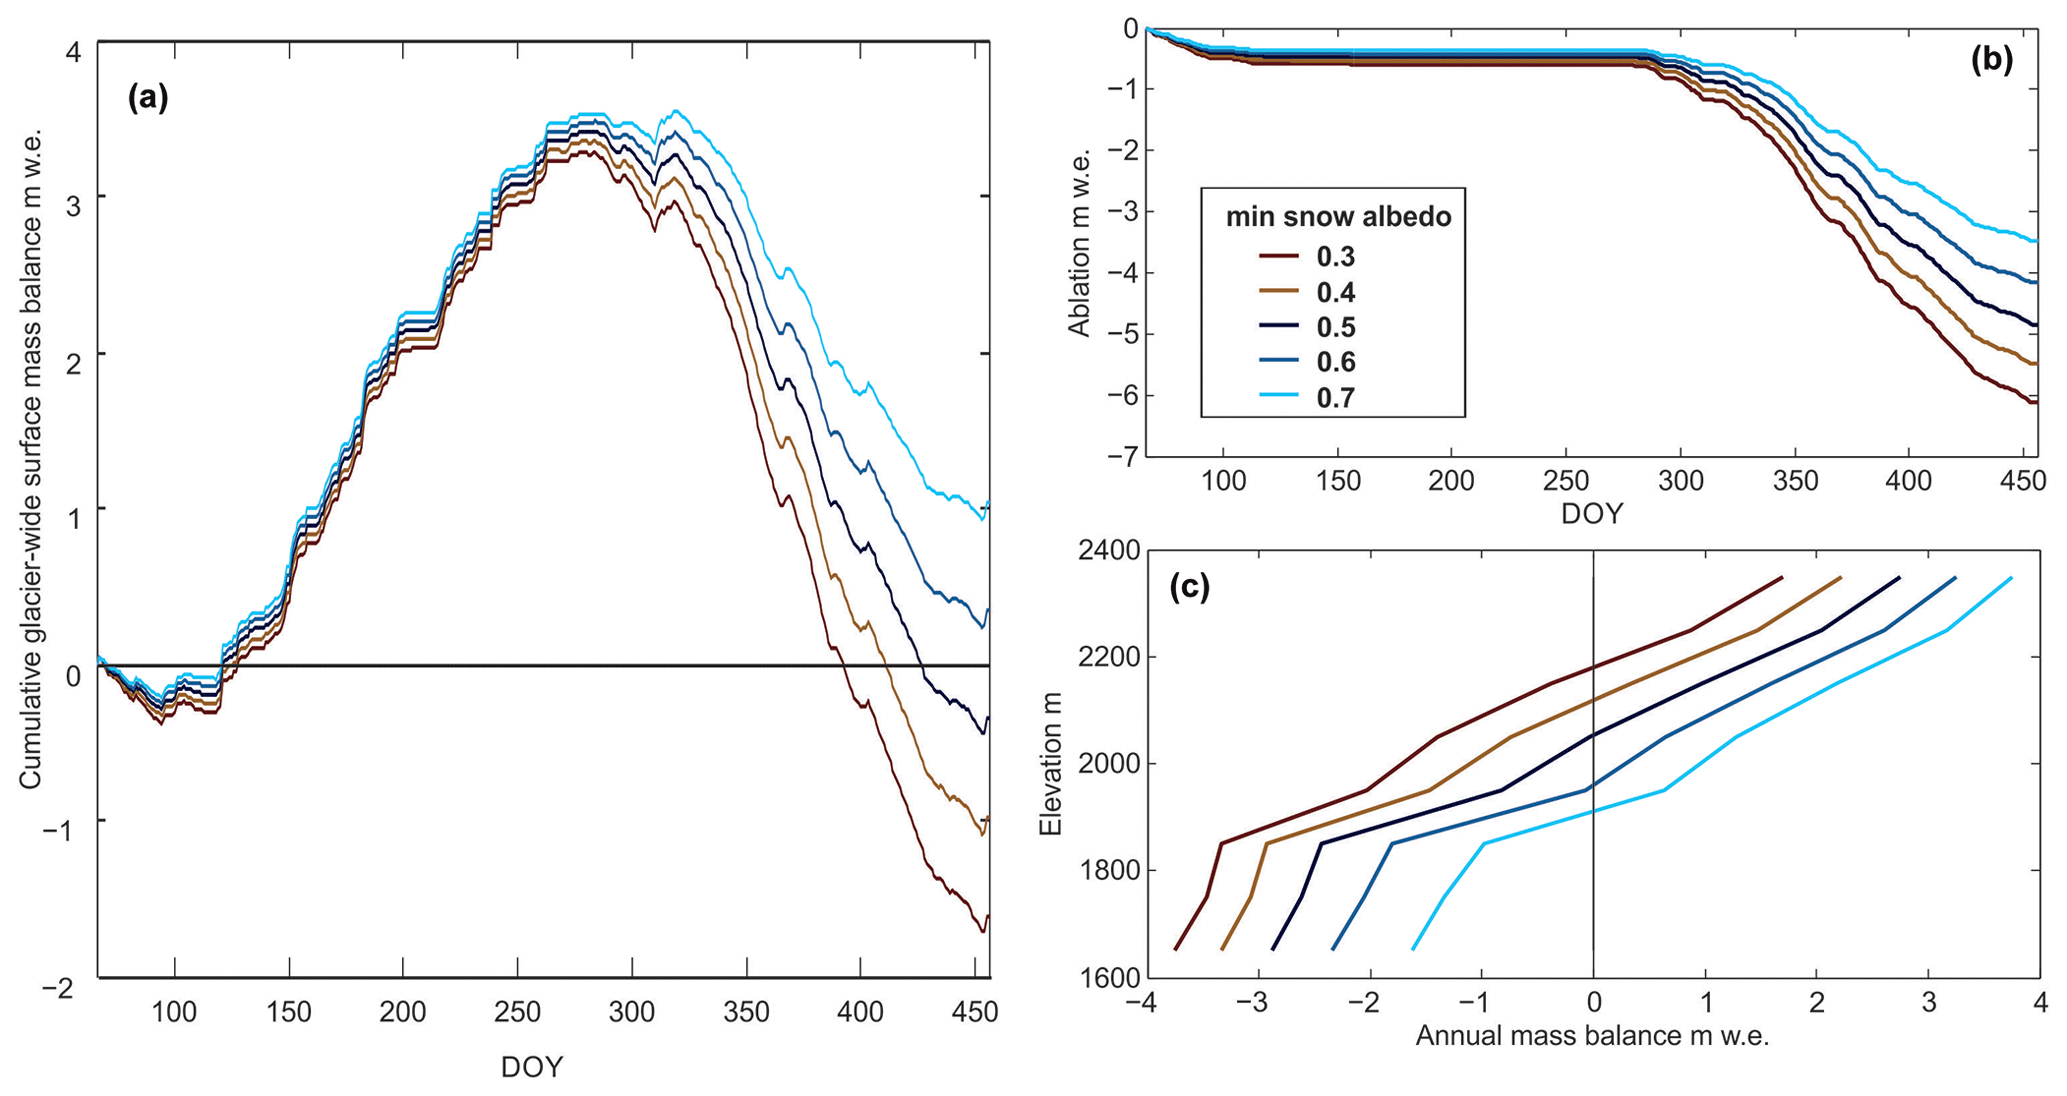
Figure 9Sensitivity of Alerce surface mass balance to change in albedo of aged snow. (a) Cumulative surface mass balance, (b) cumulative melt, and (c) mass balance gradient of Alerce Glacier for the different αmin values.
Our study combines field measurements and modeling to analyze the role of PM in the albedo of Alerce Glacier in Mount Tronador. PM content of the samples varied in a wide range, from lowest to highest in fresh snow, 1.1 to 21.9 mg kg−1; in old winter snow and firn, 4.9 to 51 mg kg−1 (except for some samples from ablation zone); in thin, darker layers with a contribution of local and regional resuspension of dust and ash, 365 to 410 mg kg−1; or with high PM enrichment due to spring and summer ablation, 339 to 9040 mg kg−1 (reaching even 12 250 to 30 000 mg kg−1 in the ablation zone). Microscopic characterization of PM showed that the major component on snow and firn layers after 2014 and also on the glacier ice surface is volcanic ash, not only from the recent Calbuco eruption (2015) but also from the Cordón Caulle eruption (2011). Minor contributions of mineral dust and black carbon were also detected.
The fact that volcanic ash represents the largest fraction of the collected PM in all studied samples indicates that the effect of volcanic eruptions is expected not only immediately after direct deposition but also many years later, due to surface enrichment and wind resuspension and redeposition. The spatial and temporal distribution of PM is highly heterogeneous, due both to seasonality and to the combination of glacier topography and the prevailing wind direction. These facts need to be accounted for when studying the effect of snow albedo on glacier mass balance. While the albedo parametrization used in the mass balance model partially accounts for the spatial heterogeneity of PM surface concentration (implicitly), we suggest that in the future it would be useful to couple our mass balance model with an atmospheric model which provides prognosis of PM content and a snow albedo model that includes LAP effects explicitly.
The measured snow albedo also varied in a wide range (0.26 to 0.81), similar to that of other glaciers with dust or volcanic ash concentration on the same order of magnitude. We found that for our setup (where the pyranometer must be inverted sequentially to measure upwelling and downwelling radiation) rapid changes in cloudiness hinder the repeatability of albedo measurements and may degrade the comparison with modeled albedo. Nevertheless, comparison of measured and modeled snow albedo showed a good match and illustrates the effect of PM content and composition (i.e., BC versus dust or volcanic ash), snow grain size, layer thickness, and cloudiness on snow albedo. To evaluate the latter, we updated the SNICAR snow albedo model to accurately represent the effect of cloudiness on direct and diffuse solar spectra (SNICARv2.1). This update improved considerably the match of measured and modeled albedo for partially cloudy sky conditions. The effect of uncertainties in field measurements was evaluated for different types of samples, suggesting strategies to reduce uncertainty in snow albedo modeling or in retrieval of snow properties from measured albedo. We found that snow grain size must be measured more carefully in samples with low volcanic ash content and that the accuracy of layer thickness can be relevant not only for very thin layers (0.1 cm) but also for thicker layers (6 cm) with low ash content. The accuracy of ash content was found to be good enough to reproduce our albedo measurements. However, it was remarked that the presence of small amounts of BC can affect the albedo significantly in samples with low ash content.
We showed that surface mass balance is highly sensitive to the parametrization of aged snow albedo. We find a glacier-wide albedo change sensitivity of around −0.6 , mostly due to higher ablation during spring and summer. Finally, we suggest that the effect of volcanic ash in Alerce Glacier can be as high as a 1.25 decrease in the glacier annual mass balance or a 34 % increase in the melt during the ablation season, considering a surface volcanic ash content compatible with that measured in sites Acc3-2016, Abl3-2017, and Abl4-2017. Nevertheless, a more accurate calculation of volcanic ash impact would take into account the quantity of other regional or local sources of PM present on the glacier in absence of such volcanic eruptions, which cannot be estimated with the results of the field campaigns reported in this article.
To the best of our knowledge, this work is the first study of PM content and snow albedo on Argentinian glaciers. Our results highlight the need for appropriately considering the effect of volcanic eruptions on snow albedo and glacier mass balance even years after the eruption events. We suggest possible future steps to improve prognosis ability and mass balance accuracy, using a combination of measurements and modeling.
The complete set of field measurements are available from the corresponding author on reasonable request. The code of SNICAR v2.1 is available online at https://doi.org/10.5281/zenodo.4319016 (He, 2020) (https://github.com/EarthSciCode/SNICARv2.git).
The supplement related to this article is available online at: https://doi.org/10.5194/tc-14-4581-2020-supplement.
JGC, LD, and LR designed the field campaigns. HB designed and built the mounting stands for albedo measurements. JGC and FNB collected and filtered the snow samples and performed the albedo measurements, with the assistance of LR and his team. JGC performed the gravimetry of filters and corrected albedo measurements. JGC updated SNICAR code in collaboration with CH. JGC performed modeling related to solar incident spectra and SNICAR snow albedo. VO and GV characterized PM on the filters by binocular microscopy, SEM, and EDS. LR performed the modeling of glacier mass balance. JGC, LD and LR prepared the manuscript, with contributions from VO, GV, and CH.
The authors declare that they have no conflict of interest.
Julián Gelman Constantin, Lucas Ruiz, Valeria Outes, and Gustavo Villarosa are members of Consejo Nacional de Investigaciones Científicas y Técnicas (CONICET). This material is based upon work supported by the National Center for Atmospheric Research, which is a major facility sponsored by the National Science Foundation under Cooperative Agreement No. 1852977. The authors thank Claudio Bolzi and their team (DES, CAC-CNEA) for sharing their equipment for albedo measurements. The authors are also grateful for the valuable field knowledge and collaboration provided by Hernan Gargantini, Mariano Castro, Ernesto Corvalán, Valentina Zorzut, and Inés Dussaillant. The authors acknowledge Dario R. Gómez for their valuable comments and contributions to the manuscript. The authors thank Adriana Dominguez and Lucia Marzocca (Laboratorio de Microscopía Electrónica, G. Materiales, CAC-CNEA) for SEM images and EDS analysis. Administración de Parques Nacionales kindly provided permission and logistical assistance to work at Cerro Tronador inside Parque Nacional Nahuel Huapi.
This research has been supported by the Agencia Nacional de Promoción Científica y Tecnológica, Fondo para la Investigación Científica y Tecnológica (grant no. PICT 2016-3590).
This paper was edited by Benjamin Smith and reviewed by Marius Schaefer and one anonymous referee.
Aas, K. S., Dunse, T., Collier, E., Schuler, T. V., Berntsen, T. K., Kohler, J., and Luks, B.: The climatic mass balance of Svalbard glaciers: a 10-year simulation with a coupled atmosphere–glacier mass balance model, The Cryosphere, 10, 1089–1104, https://doi.org/10.5194/tc-10-1089-2016, 2016. a
Alloway, B. V., Pearce, N. J. G., Villarosa, G., Outes, V., and Moreno, P. I.: Multiple melt bodies fed the AD 2011 eruption of Puyehue-Cordón Caulle, Chile, Scientific Reports, 5, 17589, https://doi.org/10.1038/srep17589, 2015. a, b, c
Bond, T. C., Doherty, S. J., Fahey, D. W., Forster, P. M., Berntsen, T., Deangelo, B. J., Flanner, M. G., Ghan, S., Kärcher, B., Koch, D. M., Kinne, S., Kondo, Y., Quinn, P. K., Sarofim, M. C., Schultz, M. G., Schulz, M., Venkataraman, C., Zhang, H., Zhang, S., Bellouin, N., Guttikunda, S. K., Hopke, P. K., Jacobson, M. Z., Kaiser, J. W., Klimont, Z., Lohmann, U., Schwarz, J. P., Shindell, D. T., Storelvmo, T., Warren, S. G., and Zender, C. S.: Bounding the role of black carbon in the climate system: A scientific assessment, J. Geophys. Res.-Atmos., 118, 5380–5552, https://doi.org/10.1002/jgrd.50171, 2013. a, b, c, d
Brandt, R. E., Warren, S. G., and Clarke, A. D.: A controlled snowmaking experiment testing the relation between black carbon content and reduction of snow albedo, J. Geophys. Res., 116, D08109, https://doi.org/10.1029/2010JD015330, 2011. a
Brock, B., Rivera, A., Casassa, G., Bown, F., and Acuña, C.: The surface energy balance of an active ice-covered volcano: Villarrica Volcano, southern Chile, Ann. Glaciol., 45, 104–114, https://doi.org/10.3189/172756407782282372, 2007. a, b
Brock, B. W., Willis, I. C., and Sharp, M. J.: Measurement and parameterisation of albedo variations at Haut Glacier d ’Arolla, Switzerland, J. Glaciol., 46, 675–688, https://doi.org/10.3189/172756506781828746, 2000. a, b, c
Carmagnola, C. M., Domine, F., Dumont, M., Wright, P., Strellis, B., Bergin, M., Dibb, J., Picard, G., Libois, Q., Arnaud, L., and Morin, S.: Snow spectral albedo at Summit, Greenland: measurements and numerical simulations based on physical and chemical properties of the snowpack, The Cryosphere, 7, 1139–1160, https://doi.org/10.5194/tc-7-1139-2013, 2013. a, b, c, d
Cereceda-Balic, F., Vidal, V., Moosmüller, H., and Lapuerta, M.: Reduction of snow albedo from vehicle emissions at Portillo, Chile, Cold Reg. Sci. Technol., 146, 43–52, https://doi.org/10.1016/j.coldregions.2017.11.008, 2018. a, b
Collier, E., Mölg, T., Maussion, F., Scherer, D., Mayer, C., and Bush, A. B. G.: High-resolution interactive modelling of the mountain glacier–atmosphere interface: an application over the Karakoram, The Cryosphere, 7, 779–795, https://doi.org/10.5194/tc-7-779-2013, 2013. a
Conway, H., Gades, A., and Raymond, C. F.: Albedo of dirty snow during conditions of melt, Water Resour. Res., 32, 1713–1718, https://doi.org/10.1029/96WR00712, 1996. a, b
Córdoba, G., Villarosa, G., Sheridan, M. F., Viramonte, J. G., Beigt, D., and Salmuni, G.: Secondary lahar hazard assessment for Villa la Angostura, Argentina, using Two-Phase-Titan modelling code during 2011 Cordón Caulle eruption, Nat. Hazards Earth Syst. Sci., 15, 757–766, https://doi.org/10.5194/nhess-15-757-2015, 2015. a
Cuffey, K. M. and Paterson, W. S. B.: The physics of glaciers, Academic Press, 4th editio edn., ISBN 9780123694614, 2010. a
Doherty, S. J., Grenfell, T. C., Forsström, S., Hegg, D. L., Brandt, R. E., and Warren, S. G.: Observed vertical redistribution of black carbon and other insoluble light-absorbing particles in melting snow, J. Geophys. Res.-Atmos., 118, 5553–5569, https://doi.org/10.1002/jgrd.50235, 2013. a
Doherty, S. J., Hegg, D. A., Johnson, J. E., Quinn, P. K., Schwarz, J. P., Dang, C., and Warren, S. G.: Causes of variability in light absorption by particles in snow at sites in Idaho and Utah, J. Geophys. Res., 121, 4751–4768, https://doi.org/10.1002/2015jd024375, 2016. a
Dussaillant, I., Berthier, E., Brun, F., Masiokas, M., Hugonnet, R., Favier, V., Rabatel, A., Pitte, P., and Ruiz, L.: Two decades of glacier mass loss along the Andes, Nature Geosci., 12, 802–808, https://doi.org/10.1038/s41561-019-0432-5, 2019. a
Ernst, M., Holst, H., Winter, M., and Altermatt, P. P.: SunCalculator: A program to calculate the angular and spectral distribution of direct and diffuse solar radiation, Solar Energy Materials and Solar Cells, 157, 913–922, https://doi.org/10.1016/J.SOLMAT.2016.08.008, 2016. a, b
Flanner, M. G.: Arctic climate sensitivity to local black carbon, J. Geophys. Res.-Atmos., 118, 1840–1851, https://doi.org/10.1002/jgrd.50176, 2013. a
Flanner, M. G. and Zender, C. S.: Linking snowpack microphysics and albedo evolution, J. Geophys. Res., 111, D12208, https://doi.org/10.1029/2005JD006834, 2006. a
Flanner, M. G., Zender, C. S., Randerson, J. T., and Rasch, P. J.: Present-day climate forcing and response from black carbon in snow, J. Geophys. Res.-Atmos., 112, D11202, https://doi.org/10.1029/2006JD008003, 2007. a, b, c, d, e
Garreaud, R. D., Vuille, M., Compagnucci, R., and Marengo, J.: Present-day South American climate, Palaeogeogr. Palaeoclimatol. Palaeoecol., 281, 180–195, https://doi.org/10.1016/j.palaeo.2007.10.032, 2009. a
Ginot, P., Dumont, M., Lim, S., Patris, N., Taupin, J.-D., Wagnon, P., Gilbert, A., Arnaud, Y., Marinoni, A., Bonasoni, P., and Laj, P.: A 10 year record of black carbon and dust from a Mera Peak ice core (Nepal): variability and potential impact on melting of Himalayan glaciers, The Cryosphere, 8, 1479–1496, https://doi.org/10.5194/tc-8-1479-2014, 2014. a, b, c, d, e, f
Gueymard, C.: Une paramétrisation de la luminance énergétique du ciel clair en fonction de la turbidité, Atmosphere-Ocean, 24, 1–15, https://doi.org/10.1080/07055900.1986.9649237, 1986. a
Gueymard, C.: An anisotropic solar irradiance model for tilted surfaces and its comparison with selected engineering algorithms, Sol. Energ., 38, 367–386, https://doi.org/10.1016/0038-092X(87)90009-0, 1987. a
Gueymard, C. A.: Parameterized transmittance model for direct beam and circumsolar spectral irradiance, Sol. Energ., 71, 325–346, https://doi.org/10.1016/S0038-092X(01)00054-8, 2001. a
Hadley, O. L. and Kirchstetter, T. W.: Black-carbon reduction of snow albedo, Nature Climate Change, 2, 437–440, https://doi.org/10.1038/nclimate1433, 2012. a, b, c
Hansen, J., Sato, M., Ruedy, R., Nazarenko, L., Lacis, A., Schmidt, G. A., Russell, G., Aleinov, I., Bauer, M., Bauer, S., Bell, N., Cairns, B., Canuto, V., Chandler, M., Cheng, Y., Genio, A. D., Faluvegi, G., Fleming, E., Friend, A., Hall, T., Jackman, C., Kelley, M., Kiang, N., Koch, D., Lean, J., Lerner, J., Lo, K., Menon, S., Miller, R., Minnis, P., Novakov, T., Oinas, V., Perlwitz, J., Perlwitz, J., Rind, D., Romanou, A., Shindell, D., Stone, P., Sun, S., Tausnev, N., Thresher, D., Wielicki, B., Wong, T., Yao, M., and Zhang, S.: Efficacy of climate forcings, J. Geophys. Res., 110, D18104, https://doi.org/10.1029/2005JD005776, 2005. a
He, C.: EarthSciCode/SNICARv2: Release of SNICARv2.1 (Version v2.1), Zenodo, https://doi.org/10.5281/zenodo.4319016, 2020. a
He, C. and Flanner, M.: Snow Albedo and Radiative Transfer: Theory, Modeling, and Parameterization, in: Springer Series in Light Scattering (Volume 5), edited by: Kokhanovsky, A. A., pp. 67–133, Springer, Cham, https://doi.org/10.1007/978-3-030-38696-2_3, 2020. a
He, C., Takano, Y., Liou, K.-N., Yang, P., Li, Q., and Chen, F.: Impact of Snow Grain Shape and Black Carbon–Snow Internal Mixing on Snow Optical Properties: Parameterizations for Climate Models, J. Climate, 30, 10019–10036, https://doi.org/10.1175/JCLI-D-17-0300.1, 2017. a, b, c, d
He, C., Flanner, M. G., Chen, F., Barlage, M., Liou, K.-N., Kang, S., Ming, J., and Qian, Y.: Black carbon-induced snow albedo reduction over the Tibetan Plateau: uncertainties from snow grain shape and aerosol–snow mixing state based on an updated SNICAR model, Atmos. Chem. Phys., 18, 11507–11527, https://doi.org/10.5194/acp-18-11507-2018, 2018. a, b, c, d
Hock, R.: A distributed temperature-index ice- and snowmelt model including potential direct solar radiation, J. Glaciol., 45, 101–111, https://doi.org/10.3189/s0022143000003087, 1999. a, b
Huss, M.: Mass balance of Pizolgletscher, Geogr. Helv., 65, 80–91, https://doi.org/10.5194/gh-65-80-2010, 2010. a
Huss, M., Bauder, A., Funk, M., and Hock, R.: Determination of the seasonal mass balance of four Alpine glaciers since 1865, J. Geophys. Res., 113, F01015, https://doi.org/10.1029/2007JF000803, 2008. a, b, c
IPCC: IPCC Special Report on the Ocean and Cryosphere in a Changing Climate, available at: https://www.ipcc.ch/report/srocc/ (last access: 15 September 2020), 2019. a
Kasten, F. and Czeplak, G.: Solar and terrestrial radiation dependent on the amount and type of cloud, Sol. Energ., 24, 177–189, https://doi.org/10.1016/0038-092X(80)90391-6, 1980. a
Koch, D. M., Menon, S., Del Genio, A., Ruedy, R., Alienov, I., and Schmidt, G. A.: Distinguishing Aerosol Impacts on Climate over the Past Century, J. Climate, 22, 2659–2677, https://doi.org/10.1175/2008JCLI2573.1, 2009. a
Krinner, G., Boucher, O., and Balkanski, Y.: Ice-free glacial northern Asia due to dust deposition on snow, Climate Dyn., 27, 613–625, https://doi.org/10.1007/s00382-006-0159-z, 2006. a, b, c
Le Bas, M. J., Le Maitre, R. W., Streckeisen, A., and Zanettin, B.: A chemical classification of volcanic rocks based on the total alkali-silica diagram, J. Petrol., 27, 745–750, https://doi.org/10.1093/petrology/27.3.745, 1986. a
Li, X., Kang, S., He, X., Qu, B., Tripathee, L., Jing, Z., Paudyal, R., Li, Y., Zhang, Y., Yan, F., Li, G., and Li, C.: Light-absorbing impurities accelerate glacier melt in the Central Tibetan Plateau, Sci. Total Environ., 587–588, 482–490, https://doi.org/10.1016/j.scitotenv.2017.02.169, 2017. a
Libois, Q., Picard, G., France, J. L., Arnaud, L., Dumont, M., Carmagnola, C. M., and King, M. D.: Influence of grain shape on light penetration in snow, The Cryosphere, 7, 1803–1818, https://doi.org/10.5194/tc-7-1803-2013, 2013. a, b
Malmros, J. K., Mernild, S. H., Wilson, R., Tagesson, T., and Fensholt, R.: Snow cover and snow albedo changes in the central Andes of Chile and Argentina from daily MODIS observations (2000–2016), Remote Sens. Environ., 209, 240–252, https://doi.org/10.1016/J.RSE.2018.02.072, 2018. a
Ménégoz, M., Krinner, G., Balkanski, Y., Boucher, O., Cozic, A., Lim, S., Ginot, P., Laj, P., Gallée, H., Wagnon, P., Marinoni, A., and Jacobi, H. W.: Snow cover sensitivity to black carbon deposition in the Himalayas: from atmospheric and ice core measurements to regional climate simulations, Atmos. Chem. Phys., 14, 4237–4249, https://doi.org/10.5194/acp-14-4237-2014, 2014. a, b, c, d, e
Molina, L. T., Gallardo, L., Andrade, M., Baumgardner, D., Borbor-Córdova, M., Bórquez, R., Casassa, G., Cereceda-Balic, F., Dawidowski, L., Garreaud, R., Huneeus, N., Lambert, F., McCarty, J., Mc Phee, J., Mena-Carrasco, M., Raga, G. B., Schmitt, C. G., and Schwarz, J. P.: Pollution and its impacts on the South American Cryosphere (PISAC), Earth's Future, 3, 345–369, https://doi.org/10.1002/2015EF000311, 2015. a
Oerlemans, J.: Glaciers & Climate Change, CRC Press, Exton (PA), 1 edition edn., 2001. a, b
Oerlemans, J. and Knap, W. H.: A 1 year record of global radiation and albedo in the ablation zone of Morteratschgletscher, Switzerland, J. Glaciol., 44, 231–238, https://doi.org/10.3189/s0022143000002574, 1998. a, b
Painter, T. H., Skiles, S. M., Deems, J. S., Bryant, A. C., and Landry, C. C.: Dust radiative forcing in snow of the Upper Colorado River Basin: 1. A 6 year record of energy balance, radiation, and dust concentrations, Water Resour. Res., 48, W07521, https://doi.org/10.1029/2012WR011985, 2012. a, b, c
Painter, T. H., Flanner, M. G., Kaser, G., Marzeion, B., VanCuren, R. A., and Abdalati, W.: End of the Little Ice Age in the Alps forced by industrial black carbon, P. Natl. Acad. Sci., 110, 15216–15221, https://doi.org/10.1073/pnas.1302570110, 2013. a, b
Pirazzini, R., Räisänen, P., Vihma, T., Johansson, M., and Tastula, E.-M.: Measurements and modelling of snow particle size and shortwave infrared albedo over a melting Antarctic ice sheet, The Cryosphere, 9, 2357–2381, https://doi.org/10.5194/tc-9-2357-2015, 2015. a, b, c, d, e
Qian, Y., Yasunari, T. J., Doherty, S. J., Flanner, M. G., Lau, W. K. M., Jing, M., Wang, H., Wang, M., Warren, S. G., and Zhang, R.: Light-absorbing Particles in Snow and Ice: Measurement and Modeling of Climatic and Hydrological impact, Adv. Atmos. Sci., 32, 64–91, https://doi.org/10.1007/s00376-014-0010-0, 2015. a, b, c
Reckziegel, F., Bustos, E., Mingari, L., Báez, W., Villarosa, G., Folch, A., Collini, E., Viramonte, J., Romero, J., and Osores, S.: Forecasting volcanic ash dispersal and coeval resuspension during the April–May 2015 Calbuco eruption, J. Volcanol. Geoth. Res., 321, 44–57, https://doi.org/10.1016/j.jvolgeores.2016.04.033, 2016. a, b, c
Romero, J. E., Morgavi, D., Arzilli, F., Daga, R., Caselli, A., Reckziegel, F., Viramonte, J., Díaz-Alvarado, J., Polacci, M., Burton, M., and Perugini, D.: Eruption dynamics of the 22–23 April 2015 Calbuco Volcano (Southern Chile): Analyses of tephra fall deposits, J. Volcanol. Geoth. Res., 317, 15–29, https://doi.org/10.1016/j.jvolgeores.2016.02.027, 2016. a
Rowe, P. M., Cordero, R. R., Warren, S. G., Stewart, E., Doherty, S. J., Pankow, A., Schrempf, M., Casassa, G., Carrasco, J., Pizarro, J., MacDonell, S., Damiani, A., Lambert, F., Rondanelli, R., Huneeus, N., Fernandoy, F., and Neshyba, S.: Black carbon and other light-absorbing impurities in snow in the Chilean Andes, Scientific Reports, 9, 4008, https://doi.org/10.1038/s41598-019-39312-0, 2019. a, b, c
Ruiz, L., Berthier, E., Masiokas, M., Pitte, P., and Villalba, R.: First surface velocity maps for glaciers of Monte Tronador, North Patagonian Andes, derived from sequential Pléiades satellite images, J. Glaciol., 61, 908–922, https://doi.org/10.3189/2015JoG14J134, 2015. a, b
Ruiz, L., Berthier, E., Viale, M., Pitte, P., and Masiokas, M. H.: Recent geodetic mass balance of Monte Tronador glaciers, northern Patagonian Andes, The Cryosphere, 11, 619–634, https://doi.org/10.5194/tc-11-619-2017, 2017. a
Schaefer, M., Fonseca-Gallardo, D., Farías-Barahona, D., and Casassa, G.: Surface energy fluxes on Chilean glaciers: measurements and models, The Cryosphere, 14, 2545–2565, https://doi.org/10.5194/tc-14-2545-2020, 2020. a
Schmitt, C. G., All, J. D., Schwarz, J. P., Arnott, W. P., Cole, R. J., Lapham, E., and Celestian, A.: Measurements of light-absorbing particles on the glaciers in the Cordillera Blanca, Peru, The Cryosphere, 9, 331–340, https://doi.org/10.5194/tc-9-331-2015, 2015. a
Schneider, C. A., Rasband, W. S., and Eliceiri, K. W.: NIH Image to ImageJ: 25 years of image analysis, Nature Methods, 9, 671–675 , https://doi.org/10.1038/nmeth.2089, 2012. a
Sicart, J. E., Ribstein, P., Wagnon, P., and Brunstein, D.: Clear-sky albedo measurements on a sloping glacier surface: A case study in the Bolivian Andes, J. Geophys. Res., 106, 31729–31737, https://doi.org/10.1029/2000JD000153, 2001. a
Skiles, S. M. and Painter, T. H.: Daily evolution in dust and black carbon content, snow grain size, and snow albedo during snowmelt, Rocky Mountains, Colorado, J. Glaciol., 63, 118–132, https://doi.org/10.1017/jog.2016.125, 2017. a, b
Skiles, S. M., Flanner, M., Cook, J. M., Dumont, M., and Painter, T. H.: Radiative forcing by light-absorbing particles in snow, Nat. Clim. Change, 8, 964–971, https://doi.org/10.1038/s41558-018-0296-5, 2018. a
Sold, L., Huss, M., Machguth, H., Joerg, P. C., Leysinger Vieli, G., Linsbauer, A., Salzmann, N., Zemp, M., and Hoelzle, M.: Mass Balance Re-analysis of Findelengletscher, Switzerland; Benefits of Extensive Snow Accumulation Measurements, Front. Earth Sci., 4, 18, https://doi.org/10.3389/feart.2016.00018, 2016. a
Toyos, G., Mingari, L., Pujol, G., and Villarosa, G.: Investigating the nature of an ash cloud event in Southern Chile using remote sensing: volcanic eruption or resuspension?, Remote Sens. Lett., 8, 146–155, https://doi.org/10.1080/2150704X.2016.1239281, 2017. a
Tuzet, F., Dumont, M., Lafaysse, M., Picard, G., Arnaud, L., Voisin, D., Lejeune, Y., Charrois, L., Nabat, P., and Morin, S.: A multilayer physically based snowpack model simulating direct and indirect radiative impacts of light-absorbing impurities in snow, The Cryosphere, 11, 2633–2653, https://doi.org/10.5194/tc-11-2633-2017, 2017. a
Villarosa, G., Outes, V., Delménico, A., Beigt, D., Cottet, J., Toyos, G., Horwell, C. J., Damby, D. E., Najorka, J., Arretche, M., Wilson, T., and Stewart, C.: Impacts after the 2015 Calbuco eruption in Argentina and their relation to tephra deposit characteristics and climatic variables, in: Cities on Volcanoes 9, Puerto Varas, Chile, 2016. a, b
Vionnet, V., Brun, E., Morin, S., Boone, A., Faroux, S., Le Moigne, P., Martin, E., and Willemet, J.-M.: The detailed snowpack scheme Crocus and its implementation in SURFEX v7.2, Geosci. Model Dev., 5, 773–791, https://doi.org/10.5194/gmd-5-773-2012, 2012. a, b, c
Warren, S. G. and Wiscombe, W. J.: A Model for the Spectral Albedo of Snow. II: Snow Containing Atmospheric Aerosols, J. Atmos. Sci., 37, 2734–2745, https://doi.org/10.1175/1520-0469(1980)037<2734:AMFTSA>2.0.CO;2, 1980. a
Williamson, C. J., Cameron, K. A., Cook, J. M., Zarsky, J. D., Stibal, M., and Edwards, A.: Glacier Algae: A Dark Past and a Darker Future, Front. Microbiol., 10, 524, https://doi.org/10.3389/fmicb.2019.00524, 2019. a
Wiscombe, W. J. and Warren, S. G.: A Model for the Spectral Albedo of Snow. I: Pure Snow, J. Atmos. Sci., 37, 2712–2733, https://doi.org/10.1175/1520-0469(1980)037<2712:AMFTSA>2.0.CO;2, 1980. a
Wittmann, M., Groot Zwaaftink, C. D., Steffensen Schmidt, L., Guðmundsson, S., Pálsson, F., Arnalds, O., Björnsson, H., Thorsteinsson, T., and Stohl, A.: Impact of dust deposition on the albedo of Vatnajökull ice cap, Iceland, The Cryosphere, 11, 741–754, https://doi.org/10.5194/tc-11-741-2017, 2017. a, b, c
Wright, P., Bergin, M., Dibb, J., Lefer, B., Domine, F., Carman, T., Carmagnola, C., Dumont, M., Courville, Z., Schaaf, C., and Wang, Z.: Comparing MODIS daily snow albedo to spectral albedo field measurements in Central Greenland, Remote Sens. Environ., 140, 118–129, https://doi.org/10.1016/j.rse.2013.08.044, 2014. a, b
Xu, B., Cao, J., Joswiak, D. R., Liu, X., Zhao, H., and He, J.: Post-depositional enrichment of black soot in snow-pack and accelerated melting of Tibetan glaciers, Environ. Res. Lett., 7, 014022, https://doi.org/10.1088/1748-9326/7/1/014022, 2012. a
Young, C. L., Sokolik, I. N., Flanner, M. G., and Dufek, J.: Surface radiative impacts of ash deposits from the 2009 eruption of Redoubt volcano, J. Geophys. Res.-Atmos., 119, 11387–11397, https://doi.org/10.1002/2014JD021949, 2014. a, b, c
Zemp, M., Frey, H., Gärtner-Roer, I., Nussbaumer, S. U., Hoelzle, M., Paul, F., Haeberli, W., Denzinger, F., Ahlstrøm, A. P., Anderson, B., Bajracharya, S., Baroni, C., Braun, L. N., Cáceres, B. E., Casassa, G., Cobos, G., Dávila, L. R., Delgado Granados, H., Demuth, M. N., Espizua, L. E., Fischer, A., Fujita, K., Gadek, B., Ghazanfar, A., Hagen, J. O., Holmlund, P., Karimi, N., Li, Z., Pelto, M., Pitte, P., Popovnin, V. V., Portocarrero, C. a., Prinz, R., Sangewar, C. V., Severskiy, I., Sigurðsson, O., Soruco, A., Usubaliev, R., and Vincent, C.: Historically unprecedented global glacier decline in the early 21st century, J. Glaciol., 61, 745–762, https://doi.org/10.3189/2015JoG15J017, 2015. a
Zhang, Y., Kang, S., Sprenger, M., Cong, Z., Gao, T., Li, C., Tao, S., Li, X., Zhong, X., Xu, M., Meng, W., Neupane, B., Qin, X., and Sillanpää, M.: Black carbon and mineral dust in snow cover on the Tibetan Plateau, The Cryosphere, 12, 413–431, https://doi.org/10.5194/tc-12-413-2018, 2018. a, b, c, d, e, f
Zhuravleva, T. B. and Kokhanovsky, A. A.: Influence of surface roughness on the reflective properties of snow, J. Quant. Spectrosc. Ra., 112, 1353–1368, https://doi.org/10.1016/J.JQSRT.2011.01.004, 2011. a