the Creative Commons Attribution 4.0 License.
the Creative Commons Attribution 4.0 License.
 | 19 Nov 2020
Proglacial icings as records of winter hydrological processes
Michel Baraër
Émilie Bouchard
The ongoing warming of cold regions is affecting hydrological processes, causing deep changes, such as a ubiquitous increase in river winter discharges. The drivers of this increase are not yet fully identified mainly due to the lack of observations and field measurements in cold and remote environments. In order to provide new insights into the sources generating winter runoff, the present study explores the possibility of extracting information from icings that form over the winter and are often still present early in the summer. Primary sources detection was performed using time-lapse camera images of icings found in both proglacial fields and upper alpine meadows in June 2016 in two subarctic glacierized catchments in the upper part of the Duke watershed in the St. Elias Mountains, Yukon. As images alone are not sufficient to entirely cover a large and hydrologically complex area, we explore the possibility of compensating for that limit by using four supplementary methods based on natural tracers: (a) stable water isotopes, (b) water ionic content, (c) dissolved organic carbon, and (d) cryogenic precipitates. The interpretation of the combined results shows a complex hydrological system where multiple sources contribute to icing growth over the studied winter. Glaciers of all sizes, directly or through the aquifer, represent the major parent water source for icing formation in the studied proglacial areas. Groundwater-fed hillslope tributaries, possibly connected to suprapermafrost layers, make up the other detectable sources in icing remnants. If similar results are confirmed in other cold regions, they would together support a multi-causal hypothesis for a general increase in winter discharge in glacierized catchments. More generally, this study shows the potential of using icing formations as a new, barely explored source of information on cold region winter hydrological processes that can contribute to overcoming the paucity of observations in these regions.
- Article
(10974 KB) - Full-text XML
-
Supplement
(345 KB) - BibTeX
- EndNote


Winter baseflow increases in response to climatic changes have been observed in a multitude of arctic and subarctic rivers (Brabets and Walvoord, 2009; Chesnokova et al., 2020; Danilovich et al., 2019; St. Jacques et al., 2009; Makarieva et al., 2019; Lammers et al., 2001; Rennermalm et al., 2010; Smith et al., 2007; Tananaev et al., 2016; Qin et al., 2020; Walvoord and Striegl, 2007; Wang, 2019; Woo and Thorne, 2014; Yang et al., 2002). The hypotheses proposed to explain this positive trend mainly fall into two categories: those based on a change in water storage capacity of aquifers and those based on a change in water inputs to aquifers from different hydrological sources (Liljedahl et al., 2016). Increases in aquifer storage capacity result from delays in soil freeze-up (e.g., Yang et al., 2002), increases in suprapermafrost layer thickness (e.g., Ge et al., 2011; Toohey et al., 2016), or both. These phenomena may lead to an increased amount of water accumulated in the aquifer during summer that can be released during the freezing season. The term “suprapermafrost layer” (e.g., Connon et al., 2018) refers to the layer on top of permafrost and includes both the active layer and suprapermafrost taliks (i.e., perennially unfrozen zones). Hydrological sources that might increase their contribution to winter discharge include precipitation (e.g., Makarieva et al., 2019; Neal et al., 2002), permafrost thaw (e.g., St. Jacques et al., 2009, and glacier melt (Liljedahl et al., 2016). By increasing the aquifer recharge, these sources would indirectly promote an increase in winter discharge.
Although the aforementioned hypotheses are widely accepted, the exact sources responsible for the observed increase in winter discharge remain difficult to identify. This is especially true in proglacial settings where numerous hydrological components exist. Several studies have shown that the extra water volumes originating from the permafrost thaw alone cannot explain the observed trend in winter baseflow (e.g., McClelland et al., 2004). In addition, positive trends in winter discharge are observed in both permafrost-underlined and non-permafrost-underlined areas (McClelland et al., 2004; Smith et al., 2007; Tananaev et al., 2016), and some watersheds experienced a decrease in winter flow even though permafrost thaw had been observed (Lyon et al., 2009). Similarly, the hypothesis that glacier downwasting alone would be responsible for the changes in baseflow is confronted by the observed baseflow increase in both glacierized and non-glacierized watersheds (Chesnokova et al., 2020). Finally, due to data scarcity in cold regions, testing the hypothesis about changes in precipitation input to aquifer recharge is problematic (Smith et al., 2007; Woo and Thorne, 2014). More generally, due to an overall lack of field observations over the winter, the direct evaluation of winter discharge composition in proglacial areas represents a major challenge.
In the present study, we propose to compensate for the scarcity of direct observations of winter hydrological processes in glacierized catchments in cold regions by attempting to extract information on potential parent hydrological sources, which we expect is recorded in proglacial icings. An icing (“Aufeis” in German and “naled” in Russian) is a sheet-like mass of ice formed during the winter when surface water or groundwater floods onto existing surfaces (ground, ice, snow) and freezes to form an additional ice layer (Alekseyev, 1987; Carey, 1973; Kane, 1981). This flooding is intermittent and may incorporate snowfalls (Hodgkins et al., 2004; Wadham et al., 2000). Icings redistribute runoff in the course of a year by releasing, during the ablation season, the water stored during the winter (Pavelsky and Zarnetske, 2017). Their contribution to summer runoff can be important for unglaciated watersheds in northern regions, accounting for up to 30 % of the annual baseflow (Kane and Slaughter, 1973; Reedyk et al., 1995; Yoshikawa et al., 2007). In glacierized watersheds, icings can form from the different water sources that are active during the winter. Both polythermal (Bukowska-Jania and Szafraniec, 2005; Hambrey, 1984; Sobota, 2016; Stachnik et al., 2016; Wadham et al., 2000; Yde et al., 2012) and cold-based glacier meltwater (Bælum and Benn, 2011; Hodgkins et al., 2004, 1998; Naegeli et al., 2014) can be responsible for icing formation. At some locations, features such as lakes (Moorman, 2003; Veillette and Thomas, 1979; Wainstein et al., 2014; Yde and Knudsen, 2005) and buried ice formations within proglacial fields (Gokhman, 1987) can contribute to icing growth. In regions underlain by permafrost, water that flows to the surface through taliks over the winter has been observed to be involved in icing formation. Where this happens, both supra- (Ensom et al., 2020; French and Heginbottom, 1983; Markov et al., 2016; Pollard, 2005) and sub-permafrost water (Ensom et al., 2020; Hu and Pollard, 1997; Kane and Slaughter, 1973; Kane, 1981; Pollard, 2005; Romanovsky, 1973; Yoshikawa et al., 2007) can contribute.
Since types of water sources that produce proglacial icings are also likely to contribute to winter runoff, learning from the hydrological records preserved in icings can provide new insights into winter hydrological processes and active sources in many cold regions (Crites and Lacelle, 2020). In light of the above, the main objective of this study is to explore the possibility of identifying water sources that remain active during the winter in the headwaters of subarctic glacierized watersheds by tracing back those that contribute to the formation of icings. This is achieved by addressing three research questions. (1) What are the main parent sources responsible for icing formations in the studied watershed? (2) What is the most promising set of methods for extracting information from icings about the winter hydrological process? (3) What are the findings on winter hydrological processes and baseflow trends that can be derived from studying icing formations in the study area?
The Duke River valley, Yukon, Canada, is used as the study site. Numerous icings are observed almost every year in the upper part of the Duke watershed. In addition, this subarctic glacierized watershed is a complex hydrological system in which numerous hydrological components, such as glaciers, buried ice formations, talus slope and hillslope tributaries, snow cover, and permafrost, act as potential water sources. The study targeted six different icings found in two glacierized sub-catchments in the upper part of the Duke watershed in June 2016 within both proglacial fields and upper alpine meadows.
Being the only direct method available for the study, the use of time-lapse camera (TLC) images is considered as the primary detection method for parent hydrological sources for icing formation. Because using TLCs at the scale of an entire sub-catchment is difficult and because TLC images may not detect some of the contributing sources, we tested four secondary methods in parallel: analyses of (a) stable water isotopes, (b) water ionic content, (c) dissolved organic carbon (DOC), and (d) cryogenic precipitates. As none of these four secondary techniques can be considered conclusive by themselves, the results they generate are ultimately expressed as “supporting” or “not supporting” a source as being the potential parent water for icing formation.
The two studied sub-catchments are located in the headwaters of the Duke River (Kluane First Nation name: Shar Ndu Chu) in the St. Elias Mountains, Yukon. The climate in this region is continental with a mean annual air temperature between −8 and −12 ∘C and a mean annual total precipitation of 500 to 600 mm, depending on the location in the region (Wahl et al., 1987). The glaciers in the region are not in equilibrium with the current climate and experience long-term negative mass balances (Arendt et al., 2002; Barrand and Sharp, 2010). Large glaciers are polythermal (Flowers et al., 2014), whereas smaller glaciers are probably cold-based (Wilson et al., 2013). Many glaciers in the area, including the Duke Glacier, are surging (Clarke et al., 1986). As a result of glacier retreat and surging events, their proglacial fields contain climate-sensitive hydrological features, such as buried ice and ice-cored moraines (Johnson, 1971, 1978, 1986, 1992).
The study region is located in a zone of discontinuous permafrost (Brown et al., 2002). However, local permafrost coverage can be continuous at elevations above 1600 m above sea level (a.s.l.) (Bonnaventure and Lewkowicz, 2008). Most of the permafrost-monitoring sites in North America display a thawing trend driven by air temperature increase. Indeed, permafrost warming and active layer deepening are reported in the Arctic (Hinzman et al., 2005) and the Subarctic (Smith et al., 2010; Smith et al., 2005; Tarnocai et al., 2004).
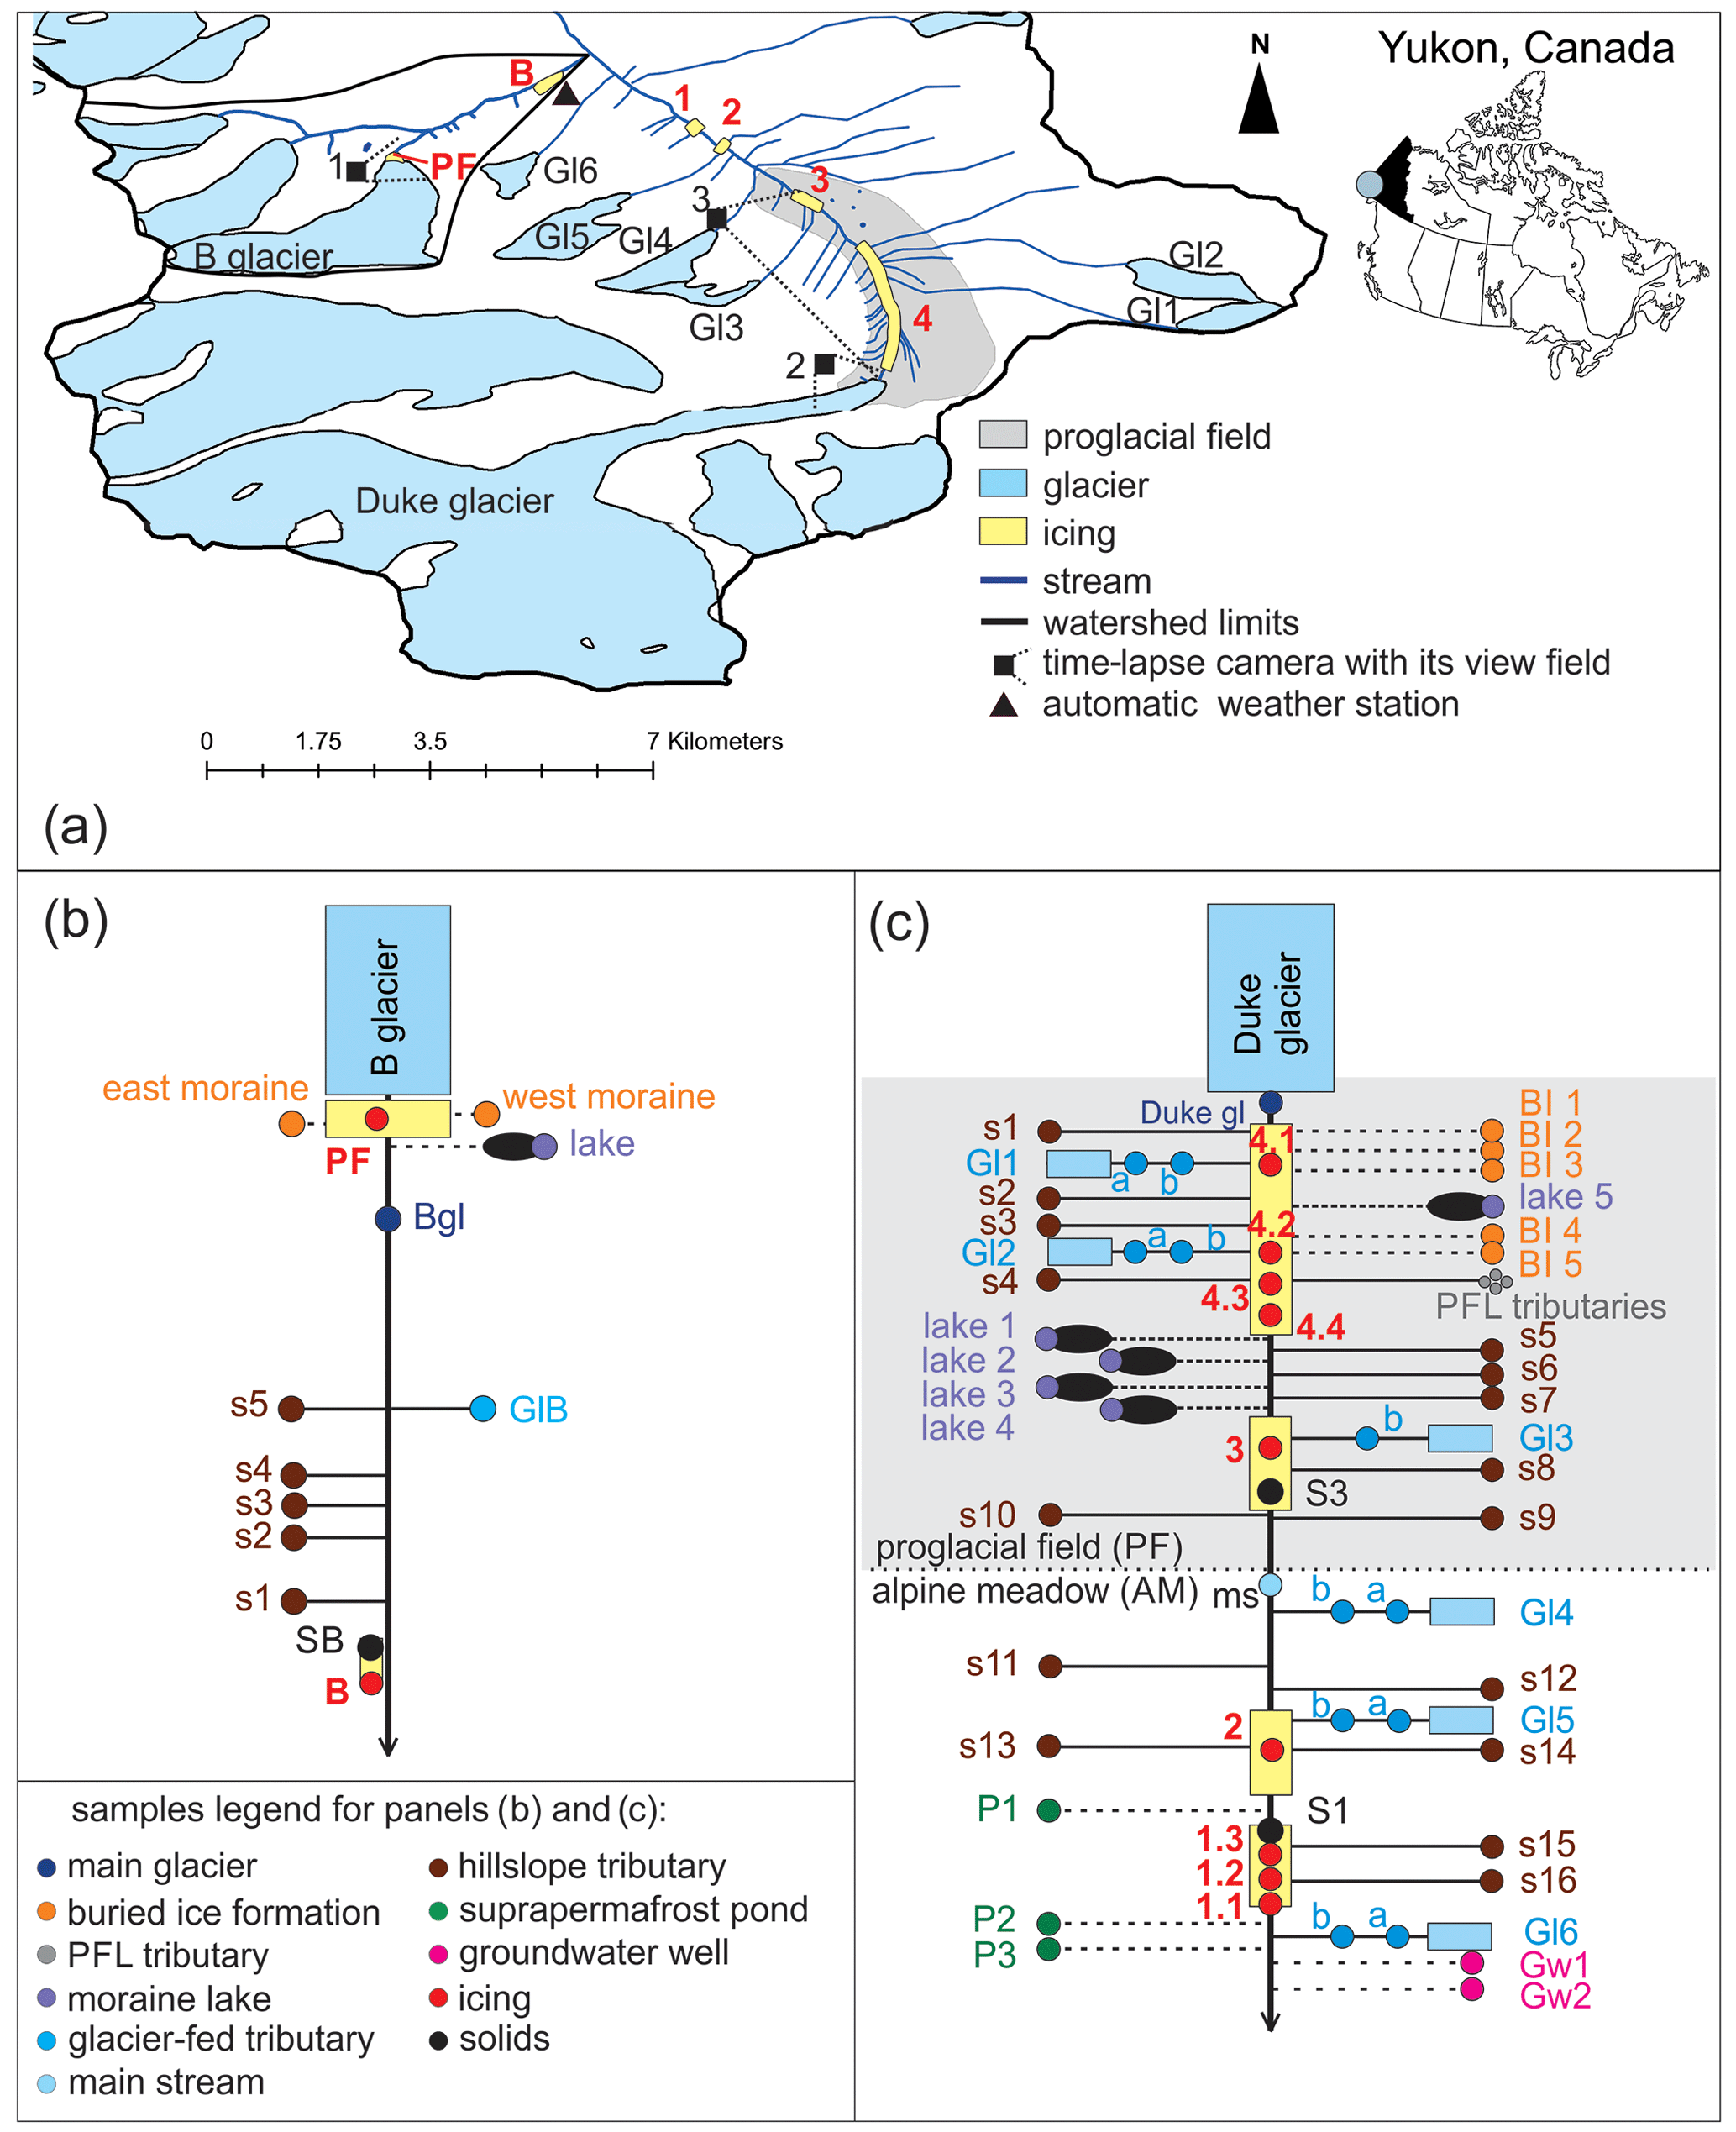
Figure 1Study watersheds and sampling plans. Panel (a) shows the Upper Duke watershed and Watershed B limits and the locations of time-lapse cameras and the automatic weather station. Panels (b) and (c) present schematic maps of Watershed B and Duke watershed, respectively, with relative locations of sampling points. Dashed lines show sources that are not directly connected above the surface with the main stream. In panel (c), for streams fed by small glaciers, the letter “a” identifies samples taken close to the glacier tongue, and the letter “b” identifies samples taken close to the confluence with the Duke River.
The two study catchments are contiguous. As we were unable to learn the name of that particular valley, we refer to the first study catchment as Watershed B (Fig. 1a). Its drainage area of 8.7 km2 is 36.6 % glacierized, and its elevation ranges from 1674 to 2906 m a.s.l. The Watershed B surface is, to a large extent, composed of bare rocks and debris. The main stream originates from a glacier, which we named B. The other two glaciers in the same Watershed B form a tributary that reaches the main stream in its upper section.
The second study catchment is named the Upper Duke watershed (Fig. 1a). Its drainage area of 69.1 km2 is 39.7 % glacierized, and its elevation ranges from 1598 to 3042 m a.s.l. The main glacier of the catchment is named Duke Glacier. It is categorized as a surging glacier (Clarke et al., 1986). The Duke Glacier is considered to be the Duke River headwater. The Duke River is fed by numerous tributaries of glacier and non-glacier origins. This part of the watershed can be divided into two areas of different natures (Fig. 1a). Starting around the Duke Glacier tongue and extending several kilometres downstream is the proglacial field. It is a barely vegetated debris-covered area that has been shaped by previous glaciations and/or surging events. Further down, the watershed is characterized by relatively gently sloping alpine meadow.
3.1 Methods overview
The analysis of TLC images, in conjunction with the winter air temperature records, is conducted for two winters: 2015–2016 and 2016–2017. This primary method permits the monitoring of icing formation, as well as the visual location of hydrological sources contributing to their growth throughout winter. The TLC image analysis presents an advantage over other methods since it is based on direct observations with limited possibilities of producing false-positive results (i.e., indicate sources that are not active). TLC coverage, however, is limited in its range of coverage, is vulnerable to certain weather/environmental conditions (e.g., snowfall, darkness), and is inconclusive for parent sources that are not observed in the images. We thus test four other methods that potentially are able to provide complementary information on parent sources responsible for icing formation. These indirect methods are all based on the principle that waters originating from different sources present unique hydrochemical and isotopic signatures as a result of the specific hydrological, geological, and biological processes they have been exposed to (Drever, 1997). We hypothesize that comparing the hydrochemical signatures of icing water and cryogenic precipitates to those of other hydrological sources can provide insights into the sources that contributed to icing formation.
Taken individually, each of the indirect methods presents a substantial level of uncertainty. They are all based on the hypothesis that relative chemical and isotopic concentrations of parent sources do not change significantly over the year in glacierized catchments, as was observed by Beylich and Laute (2012). This hypothesis can be considered robust in the case of DOC and cryogenic precipitates. In pristine environments, DOC originates mainly from plant and microorganism decomposition (Hagedorn et al., 2004). The presence of significant amounts of DOC in icings can therefore allow the rejection of the contribution from DOC-free parent sources. Similar reasoning is used for cryogenic precipitates. The formation of cryogenic precipitates requires high relative concentrations of the elements that precipitate in parent waters (Bukowska-Jania, 2007) that further increase due to freezing-driven exclusion (Kuo et al., 2011). The same phenomenon can affect the relation between the relative concentration of solutes in parent sources and in icing meltwater. In addition, because there is a link between stable water isotopes and elevation (Baraer et al., 2015), isotopic signatures of meltwater can potentially vary throughout the year. Moreover, icing remnants, which are observed in spring, might not be formed by a unique source or process but rather may represent aggregated features formed as a result of multiple sources and processes. Taking into account these aforementioned processes, the interpretation of the results for indirect methods for each potential parent source is limited and is simply expressed either as “+”, indicating that the source is supported as a contributor to the icing formation, or as “−”, indicating that the source is suggested as not being a contributor. Resulting outcomes are compiled into a decision matrix. Unlike the indirect methods, sources identified as contributing to the growth of a given icing are given a “”, as TLC images interpretation is considered the primary method. Due to the limitations mentioned above, the analyses of stable water isotopes, DOC, and cryogenic precipitates were used only to rule out potential parent sources (i.e., support as non-contributor). These are based on the principle that similitudes between icing and a given source for a unique tracer do not necessarily imply the source is a parent water, but dissimilitudes suggest the source is not a parent water. The opposite principle (i.e., similitude between icing and a given source does imply the source is a potential parent water) applies when results of many tracers agree with each other, as is the case for the ionic-signature-based principal component analysis (PCA).
The methodological approach is first applied to Watershed B, which is smaller and of lower hydrological complexity than the Upper Duke watershed. Watershed B serves as a proof of concept, and we use it to fix or validate thresholds for secondary methods, such as the analysis of stable water isotopes. Once tested on Watershed B, the methods are then applied to the hydrologically complex Upper Duke watershed.
3.2 Analysis of time-lapse images
TLCs were oriented to target icing formations with the objective of capturing flooding events and possible contributing sources. We installed three TLCs during the summer of 2015 (Fig. 1a). TLC1 was installed above Glacier B's tongue and pointed toward the Glacier B proglacial field, proglacial field icing (Icing PF), and the east-side moraines. TLC2 was installed in the Duke watershed, just above the Duke Glacier margin, and pointed toward the Duke Glacier's proglacial field and the Duke River, where Icing 4 formed. TLC3 was placed just above the proglacial field–alpine meadow border and pointed toward the Duke Glacier's tongue and the upper part of its proglacial field, thus featuring icings 3 and 4. All cameras took four visible colour images per day at 8, 11, 13, and 16 h at 72 dpi.
The visual analysis of TLC images consisted of identifying the timing and the extent of flooding events and snowfalls. In TLC images, flooding events are associated with a darkening or bluing of the white ice and/or snow pixels due to increased water content (e.g., Fig. 2b–d) or with a sudden appearance of bright pixels due to the formation of a reflecting layer on top of a previously low-reflecting one (e.g., Fig. 3b and f). Major snowfall events erase traces of flooding on images by whitening the scene, which facilitates the detection of subsequent floods. TLC time series are occasionally interrupted when snowfalls cover the lenses of the cameras. For each detected flooding event, we listed possible water sources based on the flooding location. The timeline of the detected flooding events was then superimposed on the air temperature time series of an automatic weather station installed on the southwestern shore of the Duke River upstream from the confluence with Stream B (Fig. 1a). This station measured mean hourly air temperatures from 11 July 2015 to 24 June 2017 at a height of 1.5 m above the ground.
3.3 Sample collection
During the field campaign of June 2016, we observed and sampled four icing remnants within the Duke riverbed (Fig. 1a and c) and two in Watershed B (Fig. 1a and b). Two of the icings in the Upper Duke watershed (icings 3 and 4) were situated within the proglacial field and the two others (icings 1 and 2) within the alpine meadow (Fig. 1a and c). Icing varied from 70 to 1980 m in length and from several metres to several hundred metres in width. Ice thickness was estimated to range from 0.5 to 1.5 m. In Watershed B, Icing B stretched along the river and was 60 m long and 10 m wide. The second icing (Icing PF) was situated within the proglacial field next to Glacier B's tongue and had a circular shape ca 40 m in diameter (Fig. 1a and b). All icings were characterized by an alternating sequence of layers of blue bubble-free and white bubble-rich ice, which result from slow and quick freezing of water, respectively (Moorman and Michel, 2000). Icings 1 and 2 had layers of candle ice closer to their tops, suggesting that melt events had already altered the ice (Stachnik et al., 2016). An ice mound, a feature that forms when the top surface layer bulges due to the freezing of water lenses trapped underneath (Alekseyev, 2015; Carey, 1973), was still intact on Icing 4. Overall, 13 icing samples were taken in June 2016 (Fig. 1b, c, Table 1) from supra-icing ponds and/or channels (samples 1.3, 2, 3, 4.2, 4.4, Icing B, and Icing PF), from water dripping from the icing surface (samples 1.2, 4.1, and 4.3), or in the form of ice crystals from one of the icing layers (sample 1.1). Thus, most of the icing samples represent the average signature of all the icing layers.
Table 1Summary of samples collected in (a) Watershed B and (b) Duke watershed. PF stands for proglacial field, and AM stands for alpine meadow.
Over the same period, we sampled all potential contributors to icing formation (Table 1). To make the distinction between the roles of proglacial fields and of alpine meadows in icing formation, samples of potential contributors were categorized as PF or AM, respectively.
In Watershed B, the main glacier was sampled at the edge of its immediate proglacial field. Both west and east lateral ice-cored moraines were sampled from purged boreholes made in the buried ice with a steam drill. Within the west moraine complex, we also sampled a moraine lake situated above the main stream but not visibly connected to it. In the downstream part of the watershed, hillslope tributaries originating from taluses were sampled close to their confluence with the main stream. Finally, we sampled a large tributary fed by the two other glaciers of the same watershed (Fig. 1a).
In the Duke watershed proglacial field, Duke Glacier was sampled from water discharging at the glacier snout. Samples from buried ice formations and kettle lakes were found only in the proglacial field. Another proglacial-field-specific group of sources includes small tributaries with headwaters within the borders of the proglacial field, called PFL tributaries.
Alpine-meadow-specific sources consisted of groundwater and suprapermafrost layer water. The northeastern side of the alpine meadow exhibited permafrost-specific features, such as thaw scars. Several small, disconnected ponds/springs were sampled as suprapermafrost layer water, even though they may include a limited amount of direct precipitation. In this area, digging shallow wells has been impossible due to the presence of ice on the ground. No visible signs of permafrost were observed at the southwestern side of the alpine meadow. Samples taken from the wells on that side, once purged, were therefore identified as groundwater. We acknowledge that these samples may also represent water from the suprapermafrost layer, but we decided to make a distinction between them due to their different sampling locations.
Hillslope tributaries from glacier-free areas (with the headwaters on the valley hillslopes) and streams fed by glaciers were found within both the proglacial field and the alpine meadow (Fig. 1a). The latter were sampled twice: upstream close to the glacier snout and downstream close to the confluence with the Duke River. Finally, we also collected rainwater samples during the field campaign.
All the water samples were taken in a very short period of time following a synoptic sampling strategy (Mark and Seltzer, 2003). Samples were collected into high-density polyethylene plastic bottles. We collected 30 mL for stable water isotope analysis and 50 mL for solute and DOC analyses. Samples for solutes and DOC were filtered using 0.45 µm filters and acidified with three drops of 0.5 M nitric acid in the field. All bottles were filled to the brim, sealed, and kept in the dark at 4 ∘C prior to analysis.
During the 2016 field campaign, we collected three solid-state samples at icings 1 and 3 in the Duke watershed and at Icing B in Watershed B (Fig. 1b and c; Table 1). Cryogenic precipitate is commonly encountered on the icing surface (Lacelle et al., 2009). It is formed when sufficient concentrations of precipitating elements exist in the freezing water (Žák et al., 2008). The production of mineral precipitates in such conditions occurs by solute expulsion during freezing (Bukowska-Jania, 2007; Lacelle et al., 2009; Lauriol et al., 1991; Vogt, 1991). The most common minerals found on the surface of the icings in the melt season are carbonates (CaCO3) and gypsum (CaSO4) (Lacelle et al., 2009). In glacierized catchments, these cryogenic minerals represent a unique archive of the hydrologic conditions that prevailed during their formation (Thomazo et al., 2017). Where we assumed to have located a cryogenic precipitate associated with an icing, we collected about 5 g of the solid and stored it in a sealed 50 mL plastic centrifuge tube.
3.4 Analysis of stable water isotopes
We analyzed water samples for relative concentrations of stable isotopes of oxygen, δ18O, and hydrogen, δD, using cavity ring-down spectrometry (Picarro L2130-i Analyzer; guaranteed instrumental precision is 0.03 ‰ for δ18O and 0.2 ‰ for δD). Both δ18O and δD were expressed in per mil relative to the Vienna Standard Mean Ocean Water standard (‰) (Coplen, 1996). The spectrometer was calibrated every 100 samples using six laboratory standards. In addition, we analyzed one standard after every third sample to verify the stability of measurements and eventually perform corrections. Results are presented in the form of δ18O–δD plots, which include local meteoric water line (LMWL) built based on rain samples. Potential sources that plot away from the icing samples are then considered as non-contributing sources. The thresholds applied for this decision are fixed using Watershed B results as a reference.
3.5 Analysis of selected ions
We measured the anion concentrations in the samples (F−, Cl−, and SO) using an ionic chromatographer (Dionex ED50, Thermo Fisher Scientific) that was calibrated every 30 samples using seven standards ranging from 0.005 to 3.2 ppm for F−, from 0.1 to 50 for Cl−, and from 0.2 to 75 for SO. We inserted a standard (0.2 ppm for F−, 0.9 for Cl−, and 1.8 for SO) followed by a blank every three samples to guarantee analytical stability and to correct results from an eventual drift in measurements.
Cationic concentrations (Li+, Na+, K+, Ca2+, Mg2+, Al3+, Ag+, Ba2+, Cr3+, Cu2+, Fe3+, Mn3+, Si4+, Sr2+, Ti3+, and Zn2+) were measured using an inductively coupled plasma optical emission spectrometer (5110 ICP-OES, Agilent). The spectrometer was calibrated every 23 samples using nine standards ranging from 1 to 40 ppm for Ca2+, Si4+, and Mg2+ for some samples (those with high concentrations) and from 0 to 10 ppm for the other ions. We inserted two standards (10 ppm for Ca2+ and 5 ppm for all other ions) followed by a blank sample every three samples to guarantee analytical stability and to correct results resulting from a drift in measurements.
We investigated connections between samples by conducting a principal component analysis (PCA) on selected tracers. Tracers were selected based on their ability to segregate different sample origins/types in bivariate plots (Baraer et al., 2015). As the hydrochemical signature of the icing samples depends not only on the hydrochemical composition of its parent sources but also on the cryochemical fractionation, we used the relative concentrations of solutes (solute ionic concentrations divided by the sum of all anions [SA−] or all cations [SC+]) instead of absolute concentrations in the PCA (Baraer et al., 2015). For each group of hydrological sources, we added error ellipses that illustrate a 95 % confidence interval assuming Gaussian distribution. After being tested on the Watershed B dataset, PCA diagrams were used in a way that the contribution of a given group of hydrological sources to icing formation is supported if the icing sample plots within the error ellipse of this group.
Alongside PCA, we created conceptual maps of the relative concentrations of dominant ions to identify areas with particularly high concentrations of a given solute. The upper quartile calculated for each selected ion based on its relative concentrations was chosen as a threshold value.
3.6 Analysis of dissolved organic carbon
Water sources originating from permafrost-underlined vegetated terrains are usually characterized by higher concentrations of DOC than the nearby permafrost-free areas due to extended exposure to the organic-reach suprapermafrost layer (Carey, 2003; Ma et al., 2019; MacLean et al., 1999). DOC can, therefore, be seen as a tracer for permafrost-related water sources (e.g., Petrone et al., 2006; Toohey et al., 2016; Yoshikawa et al., 2007). We measured DOC concentrations using an Apollo 9000 combustion analyzer. Three injections were made for each sample, and calibration was done every 20 samples using four standards ranging from 0 to 10 ppm. We analyzed a standard every five samples to assess the stability of the measurements. The detection limit for the analysis was 1 ppm. To avoid false-positive results, the threshold for considering a DOC presence in a sample was fixed at twice the limit of detection. Hydrological sources with less than 2 ppm of DOC are therefore considered to be non-contributors to those icings that exhibit DOC concentrations in their samples over this limit.
3.7 Analysis of solid samples
We applied two methods to determine the chemical composition of solid samples that we assumed were cryogenic precipitates: X-ray fluorescence (XRF) (Niton XL3t GOLDD, Thermo Scientific) and acid digestion followed by anion and cation analysis. All samples were first dried at 110 ∘C for 24 h. For XRF, a smooth and plain pellet was produced out of 2 g of sample using a pellet press. For acid digestion, 1 g of dried sample was mixed with 4 mL of nitric acid (50 %) and 10 mL of hydrochloric acid (20 %) and heated for 2 h at 90 ∘C. The resulting solutions were then analyzed by ICP-OES (see above for the characteristics) for cationic concentrations. We employed both methods to determine the relative abundance of ions. Parent source identification was made by comparing the chemical composition of the samples with the ionic concentrations of water samples from different sources by using the conceptual maps of selected ionic relative concentrations (Sect. 3.5). Hydrological sources that do not present precipitate constituents as dominant elements in their samples are considered to be non-contributors to the icing from which cryogenic precipitates originate.
4.1 Time-lapse image analysis
In Watershed B, we detected episodes of hydrological activity leading to the formation of Icing PF throughout both winter seasons. Icing B was not visible in TLC images. The images showed that the remnants of Icing PF persisted late into the melting season for both years (end of September 2016 and July 2017).
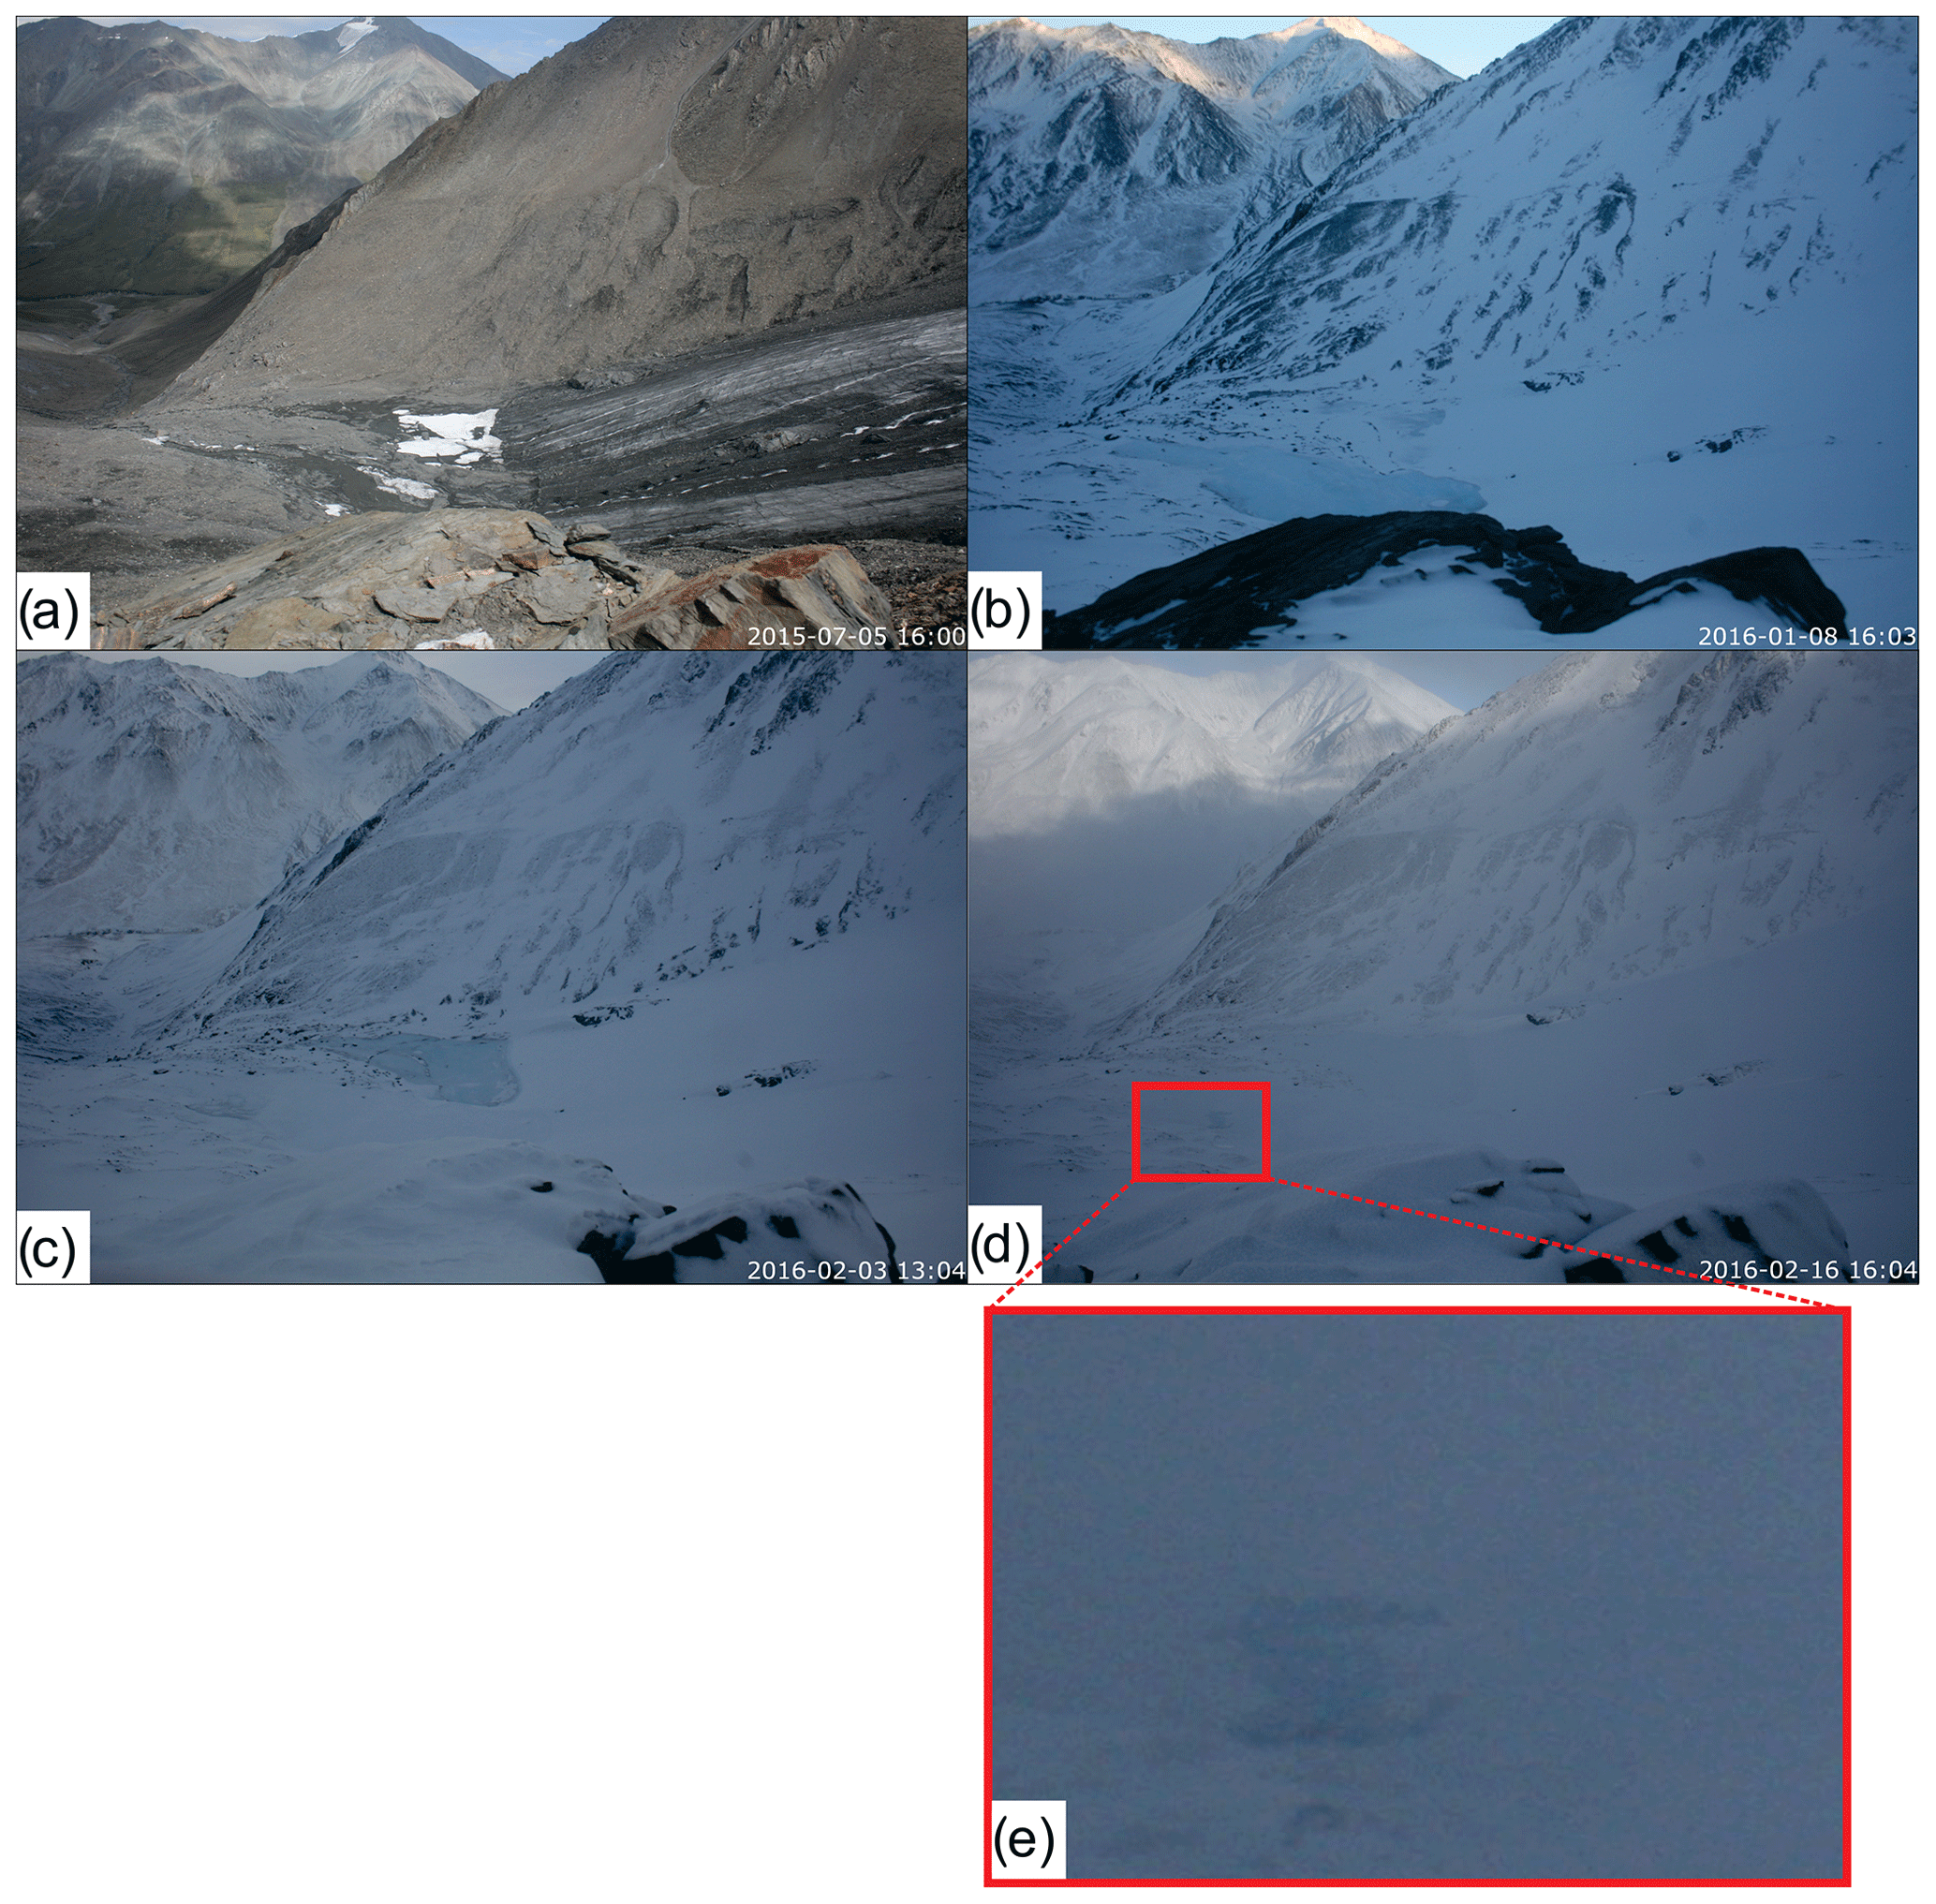
Figure 2Glacier B tongue and hydrological activities visible in the TLC1 images. Panel (a) shows Glacier B's tongue, proglacial field, proglacial icing, and the east side of the valley at the camera installation. Panels (b) and (c) illustrate flooding events on the west (b) and the east (c) side of the proglacial field; panels (d) and (e) show flooding occurring on the bottom east side of the proglacial field.
The first winter of the study (2015–2016) was characterized by consistently negative air temperatures between late September and late March, except during two warm events: 25–27 November and 30 December. The first identified flooding event occurred in mid-October (Fig. 4a), and, by the beginning of November, we observed icing formation on the west side of the proglacial field. In general, flooding events over the icing surface occurred mainly in two locations: on the west side until January (e.g., Fig. 2b), where the main glacier outlet stream is observed in the summer, and, from January onwards, most often on the east side of the proglacial field (e.g., Fig. 2c). On two occasions during that season, 16 February and 6 March, flooding occurred next to the west-side lateral moraine, where buried ice is exposed in the summer. On 16 February, we observed a stream forming on the slope of this ice-cored moraine (e.g., Fig. 2d and e). As a small moraine lake is situated at the top of this moraine, this stream could originate either from the lake or from buried ice.
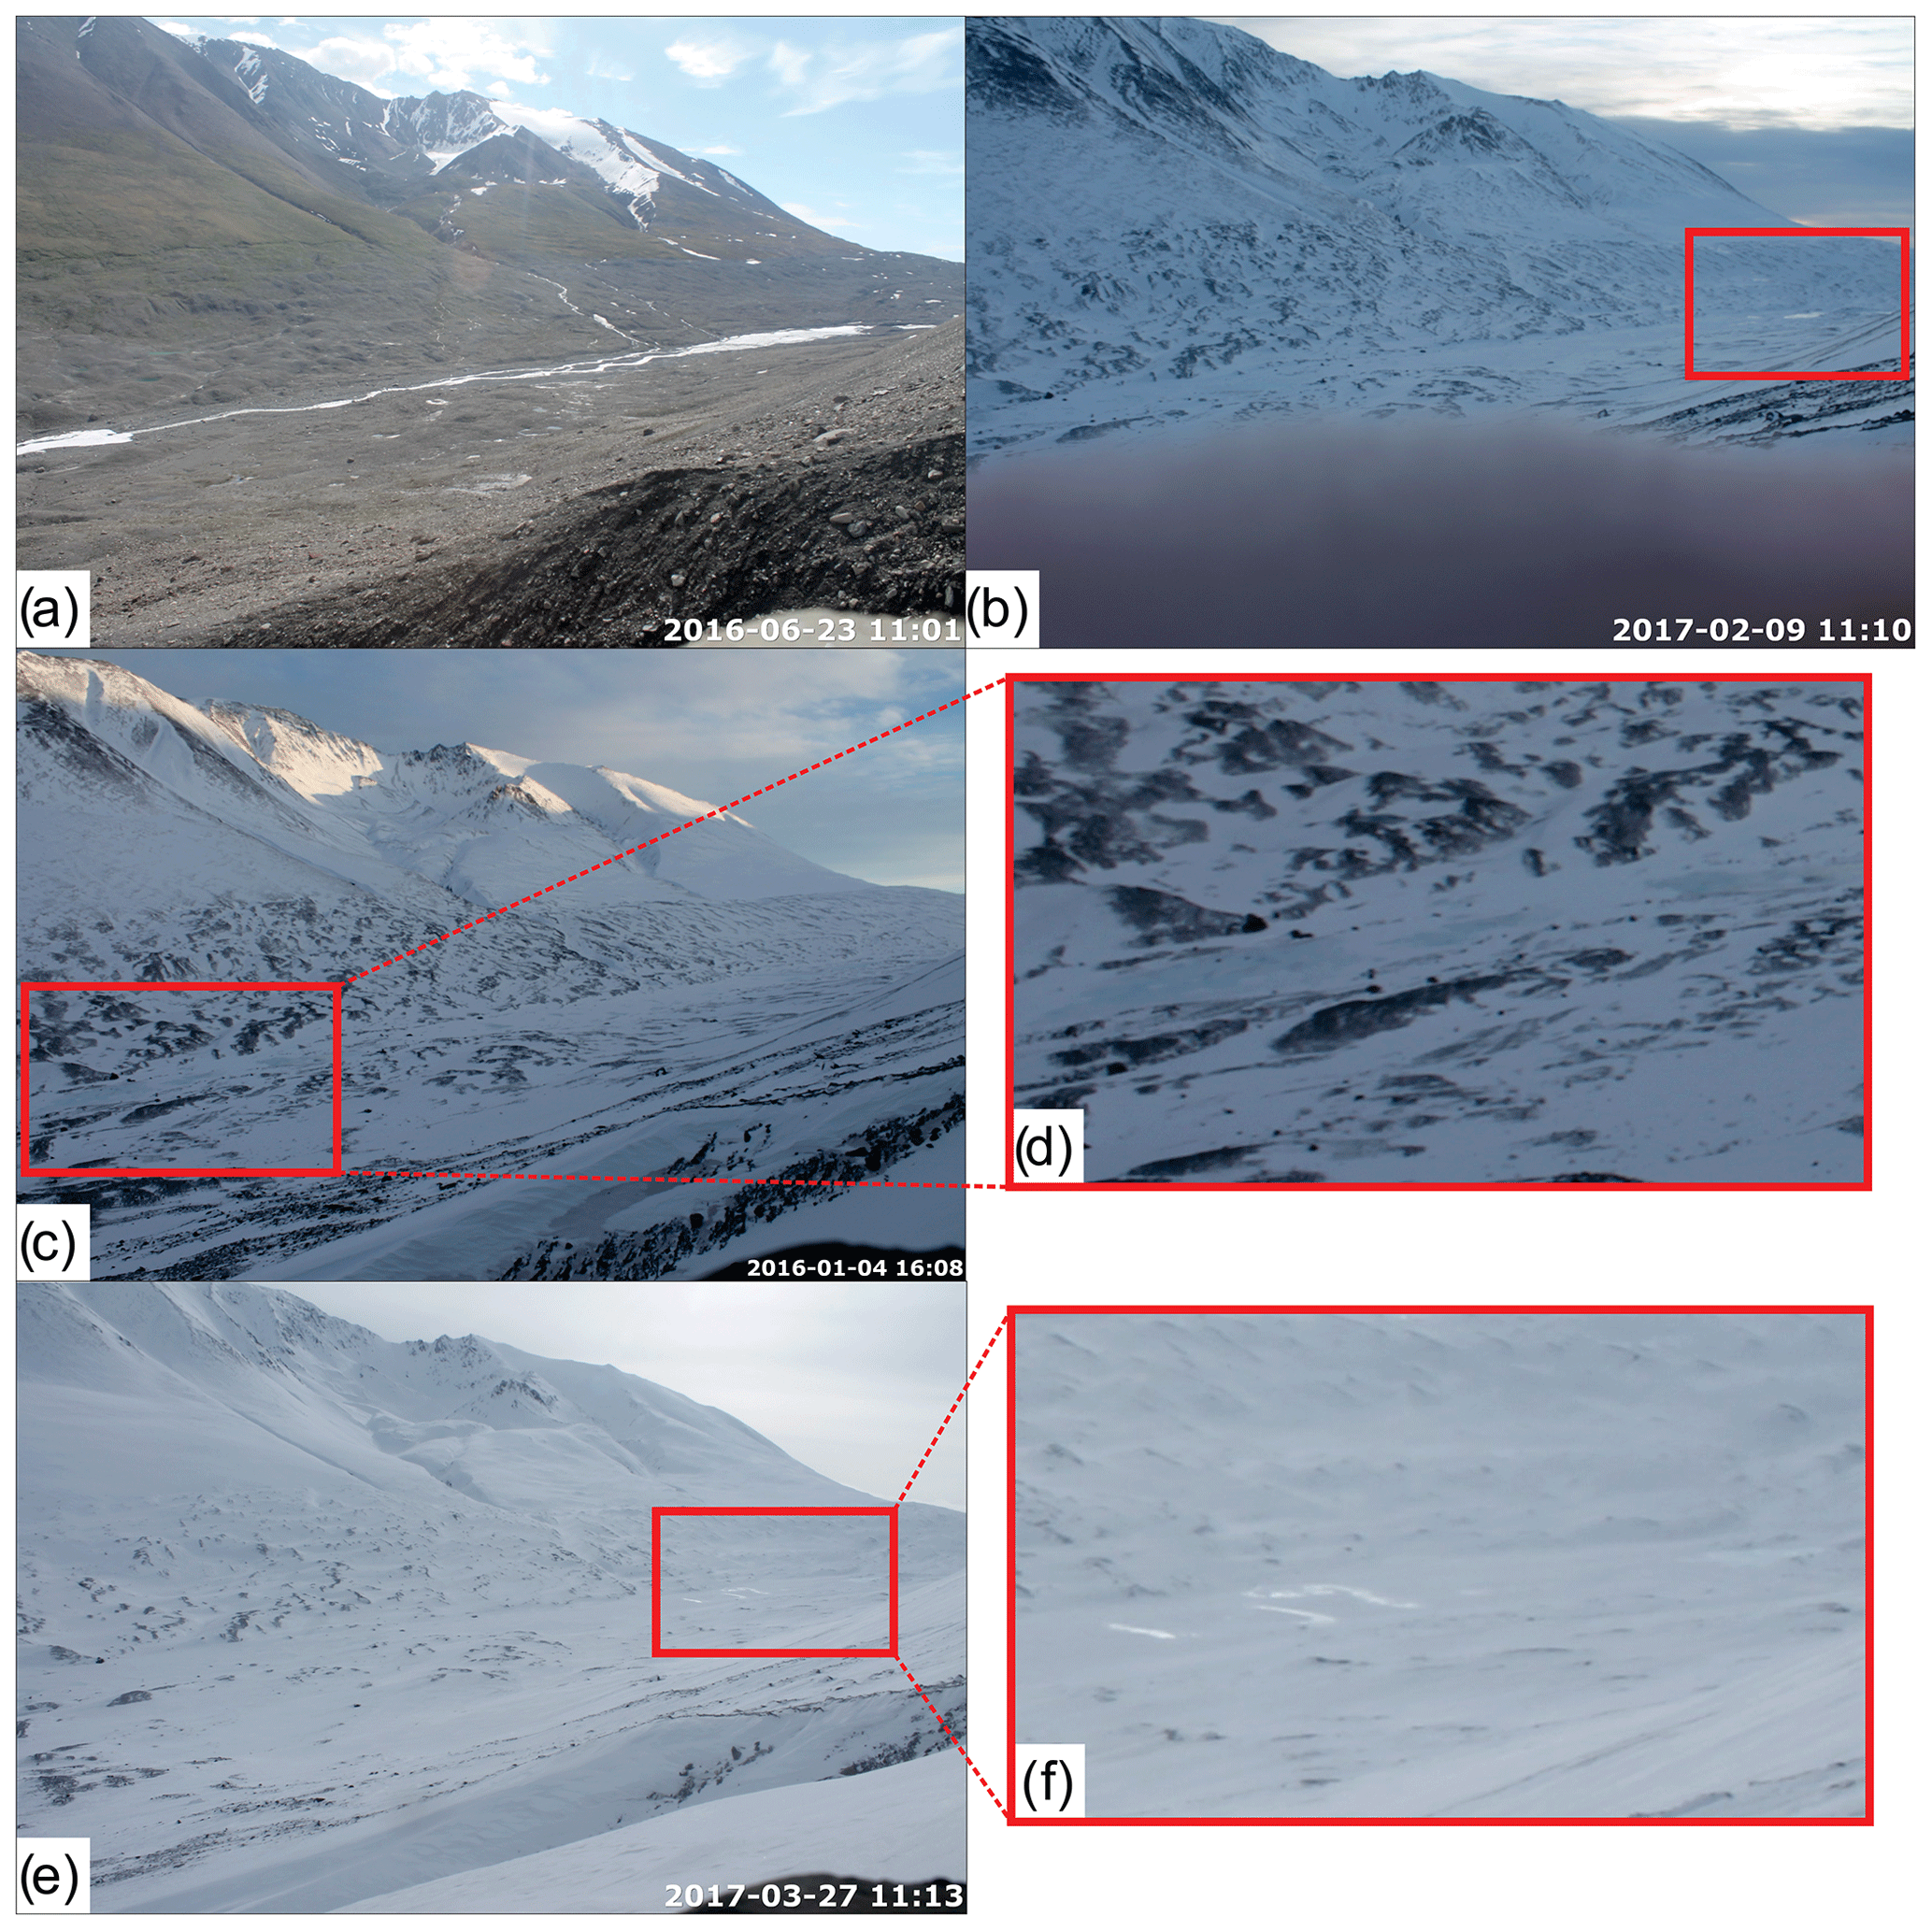
Figure 3The Duke proglacial field visible in the TLC3 images. Panel (a) shows icings 3 (right side of the image) and 4 (left side of the image) at the camera installation; panel (b) shows an example of flooding originating from the Duke Glacier; panels (c) and (d) show an example of the darkening and/or bluing of pixels as a result of flooding; and panels (e) and (f) show an example of flooding being detectable from reflective (brightening) pixels.
During winter 2016–2017, the air temperature stayed below zero between mid-October and mid-April, apart from warm episodes on 30 December and 2 January (Fig. 4). The icing's extent increased in late fall when the air temperature dropped below zero. By the end of October 2016, an icing had formed on the east side of the proglacial field (Fig. 4b). Unlike the 2015–2016 season, flooding events mostly happened on the east side of the proglacial field before January and on its west side afterward. During the 2016–2017 season, we observed signs of contribution of either the west ice-cored moraine or the moraine lake to icing formation on 26 November and 28 March.
For both winters, the sources identified as potential contributors to icing growth based on TLC images are the main glacier and either the west ice-cored moraine, the moraine lake, or both.
4.2 Stable water isotopes
In the TLC images, we observed that Glacier B contributes to the Icing PF formation (Fig. 4). Based on this finding, we use the distance between samples from Icing PF and Glacier B on the δ18O–δD diagram to form a range from other icing samples in both directions along the LMWL for decision-making on isotopic compatibility between icings and potential parent sources (red arrows on Fig. 5a), in which samples outside of the range are ruled out as potential parent sources. Due to cryogenic fractionation, icings samples and parent source samples can have different isotopic signatures and potentially plot further away from each other on the δ18O–δD diagram (Lacelle, 2011); however, this methodology helps us eliminate potential false-positive results. As a result, the sample from the moraine lake cannot be ruled out as a potential parent source for Icing PF since it plots within the range. The sample from the west ice-cored moraine plots further away from the Icing PF sample, and thus its contribution is not supported. Concerning Icing B, we observe that its sample plots with those of the hillslope tributaries and away from the other tested sources.

Figure 4Hydrological activities observed in Watershed B by the use of time-lapse cameras for the 2015–2016 season (a) and the 2016–2017 season (b). Solid black lines show air temperature measured at the automatic weather station, half-circles mark the timing of hydrological activity on either the left or right side of the proglacial field, and full circles represent the timing of hydrological activity related to either an ice-cored moraine or a moraine lake.
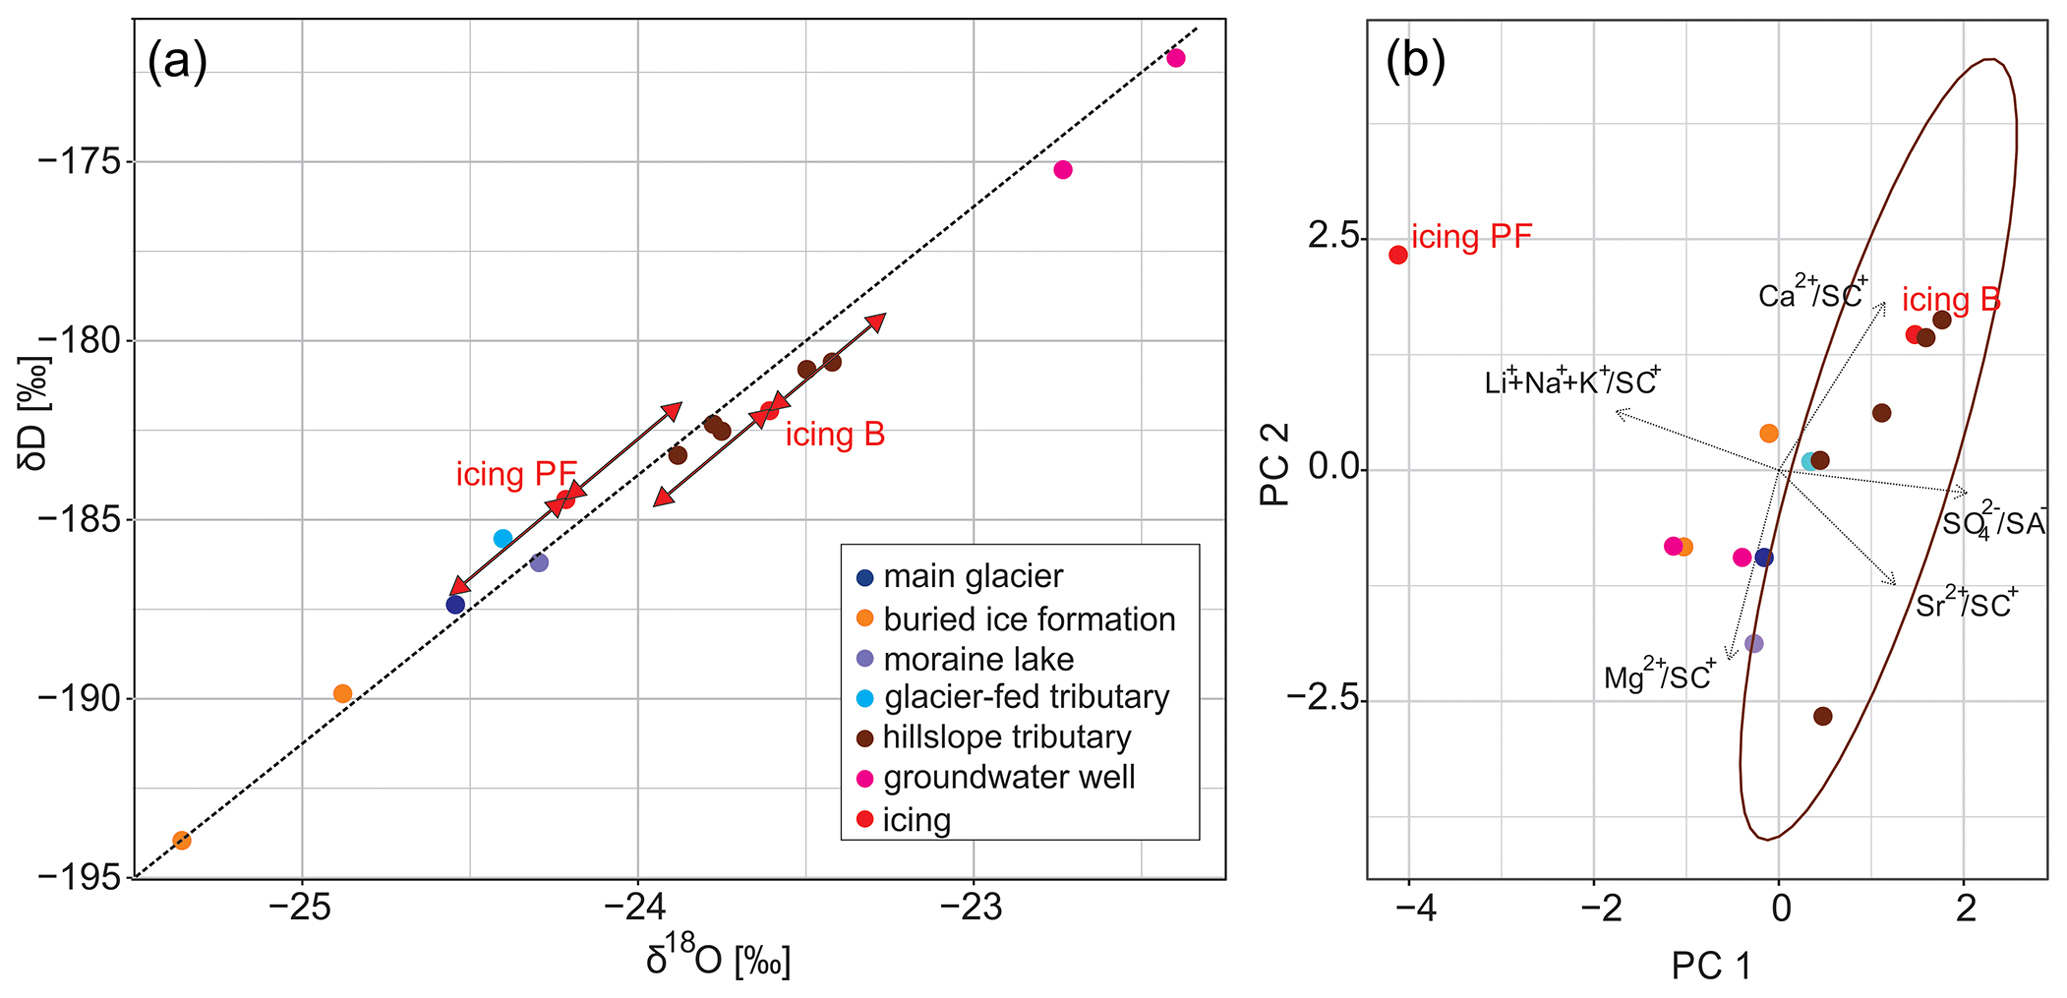
Figure 5Isotopic and hydrochemical method results for Watershed B. Panel (a) shows results from stable water isotope analysis. The straight dashed line represents the local meteoric water line. Red arrows define the range within which samples from parent sources are considered to plot close to the icing sample. Panel (b) shows results of the hydrochemical analysis, and the ellipse illustrates the 95 % confidence interval.
4.3 Ionic signatures
The results of ionic concentration analyses are presented in Fig. 5b, which shows the projection of water sample data on the reduced space determined by PCA using Ca2+ ∕ SC+, Mg2+ ∕ SC+, LiNaK+ ∕ SC+, SO ∕ SA−, and Sr2+ ∕ SC+. We chose these tracers based on their ability to cluster icings and different water sources in bivariate plots (Figs. S1 and S2, Supplement). For Watershed B, the first two principal components account for 0.86 of the total variance. Due to the small number of samples, it was not possible to include error ellipses for any group of hydrological sources apart from hillslope tributaries. In the PCA diagram (Fig. 5b), none of the sources plot close to the Icing PF. The sample from Icing B plots within the error ellipse of hillslope tributaries, and thus the analysis of ionic signatures supports the contribution from hillslope tributaries to the Icing B formation. Thus, the use of the 95 % confidence intervals was validated based on the fact that for Icing B, the method provides the same indications as the stable water isotope analysis.
4.4 Dissolved organic carbon
None of the samples taken in Watershed B presented a DOC concentration above the equipment detection limit, making this method non-conclusive for this watershed.
4.5 Solid samples
The solid sample taken on Icing B was brown-grey and, according to both methods, namely XRF and acid digestion, presented high concentrations of Al3+ and Fe3+ (Fig. 6). These elements do not correspond to reported compositions of cryogenic precipitates occurring naturally on the earth (Lacelle et al., 2009). Thus, sampled solids are most likely sediments carried out by parent waters. Unlike for cryogenic precipitates, the relation of these sediments to icing formation cannot be proven. Conversely, high relative concentrations of both Al3+ and Fe3+ are observed in the water sample from the moraine lake, and high relative concentrations of Fe3+ are observed in the hillslope tributary sample just upstream of Icing B (Fig. 6), making these sources possible contributors to the icing formation.
5.1 Time-lapse image analysis
In the Duke watershed, we detected hydrological activity only for icings 3 and 4. In comparison with Watershed B, we identified a larger number of water sources as potential contributors to the formation of these icings. In general, floodings detected by TLC occurred when the air temperature was below zero, and all detected sources were active during both seasons. On occasion, several sources showed activity at the same time (on 29 November or 10 December; Fig. 7a).
In the 2015–2016 season, icings 3 and 4 had formed by the end of November and melted away by the end of July. Due to TLC failure, observations for this season are only available until February. The hydrological activities of Duke Glacier and small glacier Gl2 were detected throughout the observation period (Fig. 7a). The only flooding event associated with the small glacier Gl1 was detected in November. In addition to glaciers, hillslope tributaries s3–s7 appear to be contributing to the growth of icings. Tributaries s5, s6, and s7 are represented by the same circle in Fig. 7 since distinguishing between them based on TLC images in winter conditions was not possible.
The 2016–2017 icings formed at the beginning of November. Icing 3 had melted away by the end of July, and Icing 4 persisted until the end of August (Fig. 7b). In November 2016, icings 3 and 4 appear to make one larger icing. The Duke Glacier and small glaciers Gl1 and Gl2 contribute to icing formation throughout this winter season (Fig. 7b). As for hillslope tributaries, s3 and s4 were active before January, and s5, s6, and s7 showed activity from January onwards (Fig. 7b).
For both winters, the sources identified as potential contributors to Icing 4 growth include the Duke Glacier, streams fed by two small glaciers on the right side of the valley, and two hillslope tributaries on the right side. For Icing 3, potential contributors include three hillslope tributaries on the left side of the valley.
5.2 Stable water isotopes
Figure 8a and c present the results from stable water isotopes for the Duke watershed, in which Fig. 8a shows results for icings and potential sources within the proglacial field, and Fig. 8c shows results for the alpine meadow. Samples from the most upstream icing, Icing 4, plot in the lower part of the δ18O–δD diagram (Fig. 8a). When we use the distance obtained for Watershed B as a reference, we see that hydrological sources, such as the main glacier, buried ice formations, PFL sources, and both glacier-fed tributaries and hillslope tributaries, plot within the range indicated by red arrows for Icing 4 (Fig. 8a) and thus are not ruled out as potential parent sources. For Icing 3, this range includes PFL sources, glacier-fed tributaries, and hillslope tributaries. For alpine meadow Icing 2, glacier-fed and hillslope tributaries plot close to the icing sample, and for Icing 1, in addition to these two groups of sources, samples from groundwater wells also plot within the range formed by the arrows (Fig. 8d).
5.3 Ionic signatures
Figure 8b and d present the results from ionic concentration analyses for the Duke watershed, in which the first two principal components account for 0.85 of the variance. For readability, we split the presentation of the results into two sub-figures: Fig. 8b shows results for icings and potential sources within the proglacial field, and Fig. 8d shows results for icings and potential sources within the alpine meadow. On the PCA diagram, samples from both proglacial field icings, icings 4 and 3, plot within the error ellipses formed by samples from buried ice formations (Fig. 8b), and thus ionic signature analysis supports these formations as parent water sources. For Icing 3, this method also supports moraine lakes as a parent source (Fig. 8b). Alpine meadow Icing 2 is potentially fed by hillslope tributaries, and Icing 1 samples do not appear to be related to any water sources (Fig. 8d). Note that the ionic signature of sample 1.1 was not analyzed since it was taken in the form of ice crystals.
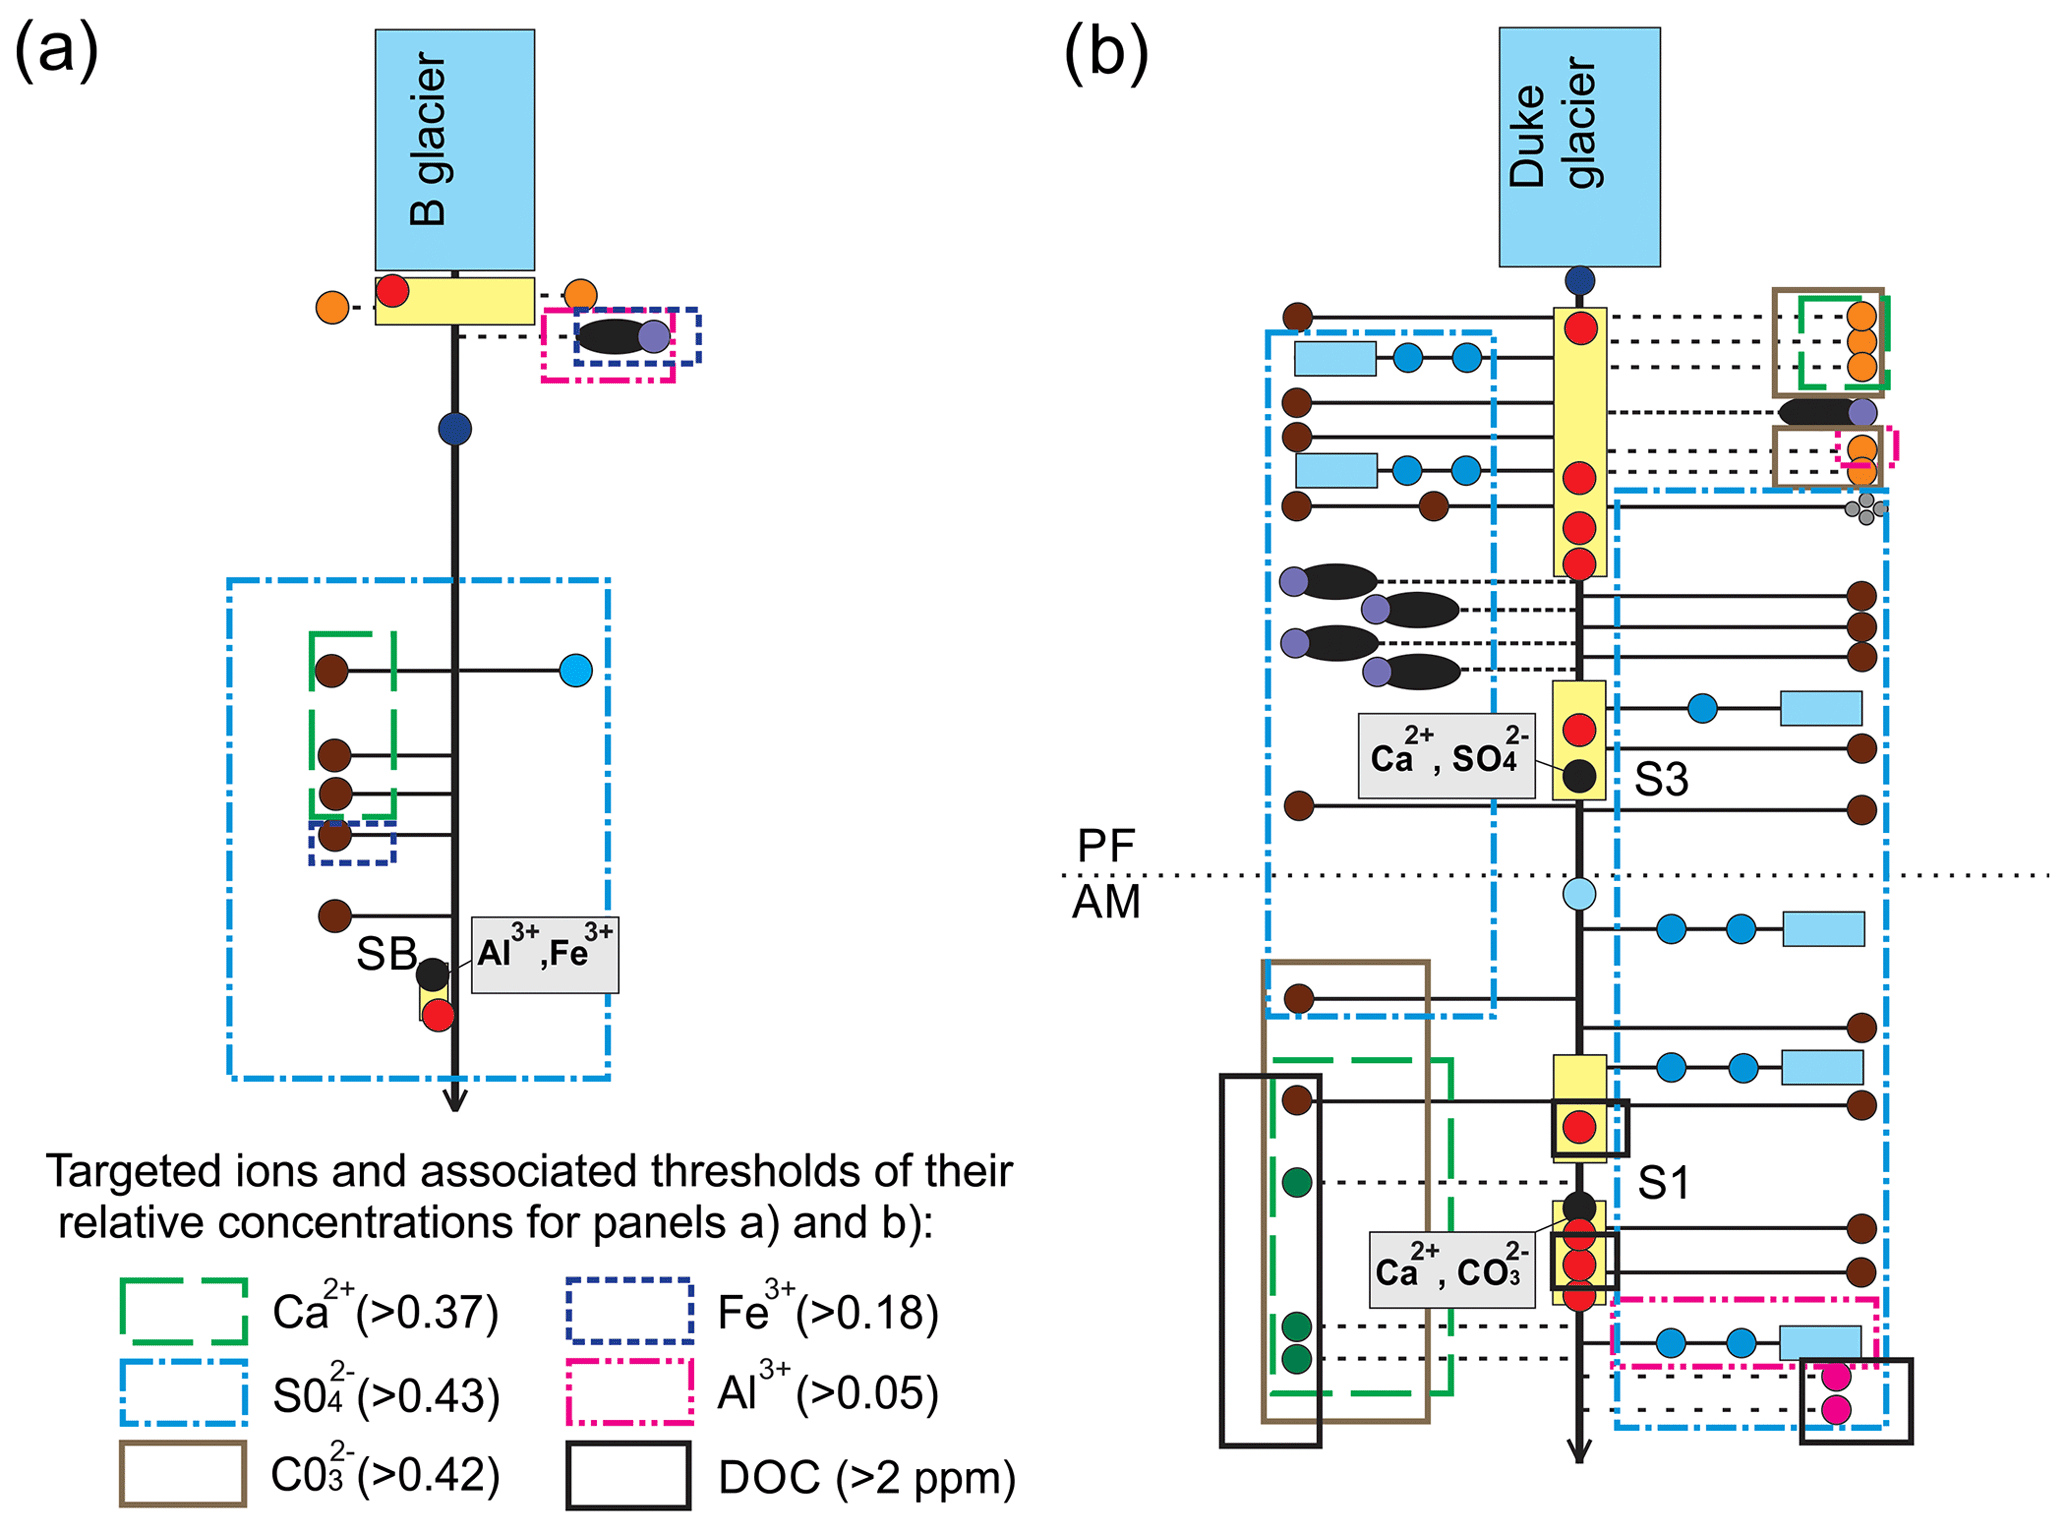
Figure 6Conceptual maps of ionic content of water samples. Coloured boxes delineate sampled areas with targeted ion relative concentrations above the threshold. The names of sampling points can be found in Fig. 1.
5.4 Dissolved organic carbon
Most of the samples taken from icings have DOC concentrations below the fixed threshold (2 ppm) with two exceptions: sample 1.2 (Icing 1) presents DOC concentrations at 5.9 ppm and sample 2 (Icing 2) at 2.3 ppm. Among potential parent waters, only the samples from the alpine meadow ponds and those taken from groundwater wells have high DOC concentrations: P1 (8.6 ppm), P2 (5.4 ppm), P3 (5.4 ppm), Gw1 (4.0 ppm), and Gw2 (4.3 ppm). The hillslope tributary sample S13, sampled just upstream of the suprapermafrost ponds, also exhibits DOC (2.6 ppm) higher than the 2 ppm threshold. DOC concentrations below the threshold in all other samples suggest that these should be considered non-contributing sources to icing samples 1.2 and 2. Since comparatively highly concentrated DOC has been associated with suprapermafrost layers (O'Donnell et al., 2012; Raudina et al., 2018) and since all of our samples presenting DOC in similarly high concentrations are located in an area where permafrost has been detected, our results support the hypothesis of a suprapermafrost water contribution to icing in this lower section of the upper Duke valley.
5.5 Cryogenic precipitate
Unlike Icing B in Watershed B, the solid sample S3 from Icing 3 was white and presented high amounts of Ca and S when analyzed with XRF and high amounts of Ca2+ and SO upon acid digestion (Fig. 6). Such a composition is characteristic of cryogenic gypsum, the second most common cryogenic mineral found on icings (Lacelle et al., 2009). Figure 6 shows high relative concentrations of Ca2+ in buried ice samples (BI 2 and 3) and in samples from the suprapermafrost ponds (P1–3) on the right side of the alpine meadow. High relative concentrations of SO are observed throughout the proglacial field, apart from samples of hydrological components that are related to the Duke Glacier (i.e., samples from buried ice formations, from Duke Glacier, and on the southwestern side of the alpine meadow). All the above-mentioned sources can potentially reach gypsum saturation during freezing and solute expulsion, except the ones that also show high concentrations of carbonates: buried ice formations and suprapermafrost ponds (Fig. 6). Because the solubility constant of calcite is more than 1000 times lower than that of gypsum (Zarga et al., 2013), cryogenic precipitates from these sources should be made mainly of calcium carbonate. The results, therefore, do not support sources that have relatively high concentrations of carbonates as being the parent water for Icing 3, including the Duke Glacier, since buried ice within the proglacial field is likely made of its remains.
The solid sample collected on Icing 1 was brownish-grey and presented high concentrations of Ca2+ and carbonates (Fig. 6). Figure 6 shows high relative concentrations of carbonates and calcium in the upper part of the proglacial field in water samples from buried ice formations (BI2-5) and on the northeastern side of the alpine meadow in samples of suprapermafrost layer water (P1–3) and hillslope tributaries s13 and s11. The distance from buried ice and these hillslope tributaries makes their contribution to Icing 1 formation highly improbable.
Table 2Summary of potential contributors to icing formation.
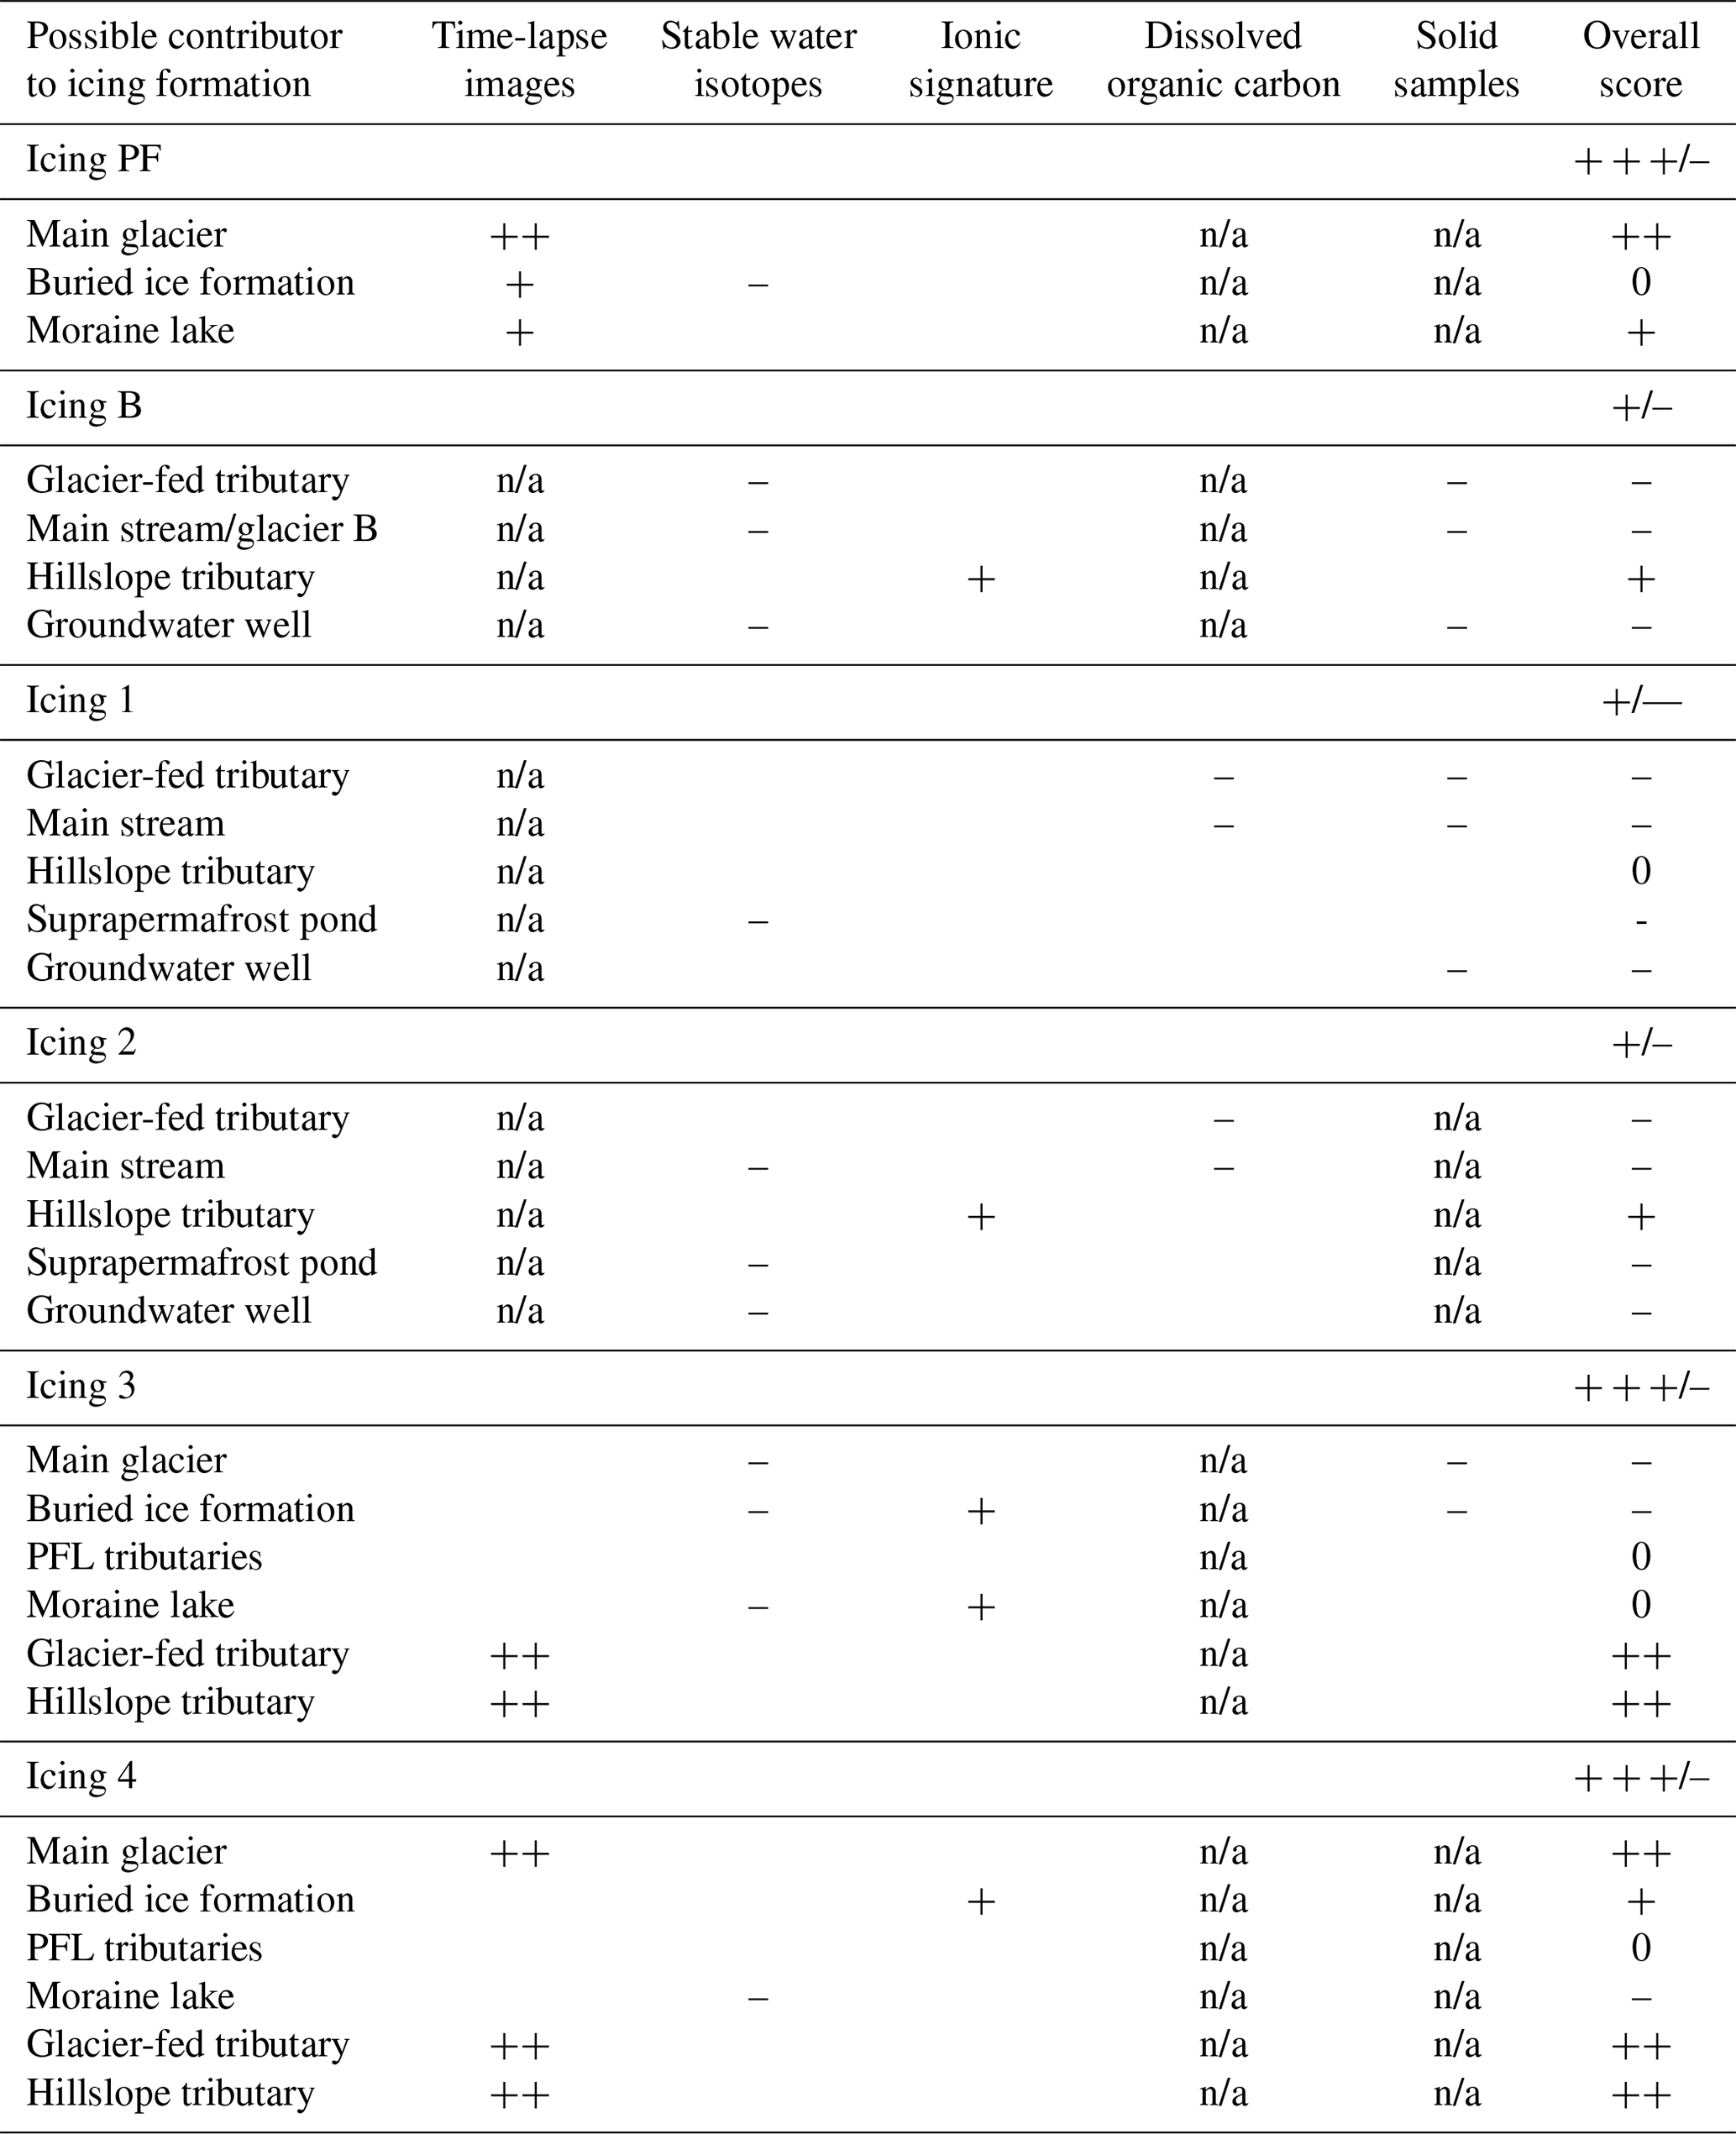
Note: “+” indicates the source is supported as being a contributor to the icing formation, while “–” indicates the source is suggested as being a non-contributor. “n/a” indicates cases where a particular method is not applicable. The last column shows the overall score for each possible source, where for each icing, the maximum positive and negative marks are provided to facilitate the interpretation of scores.
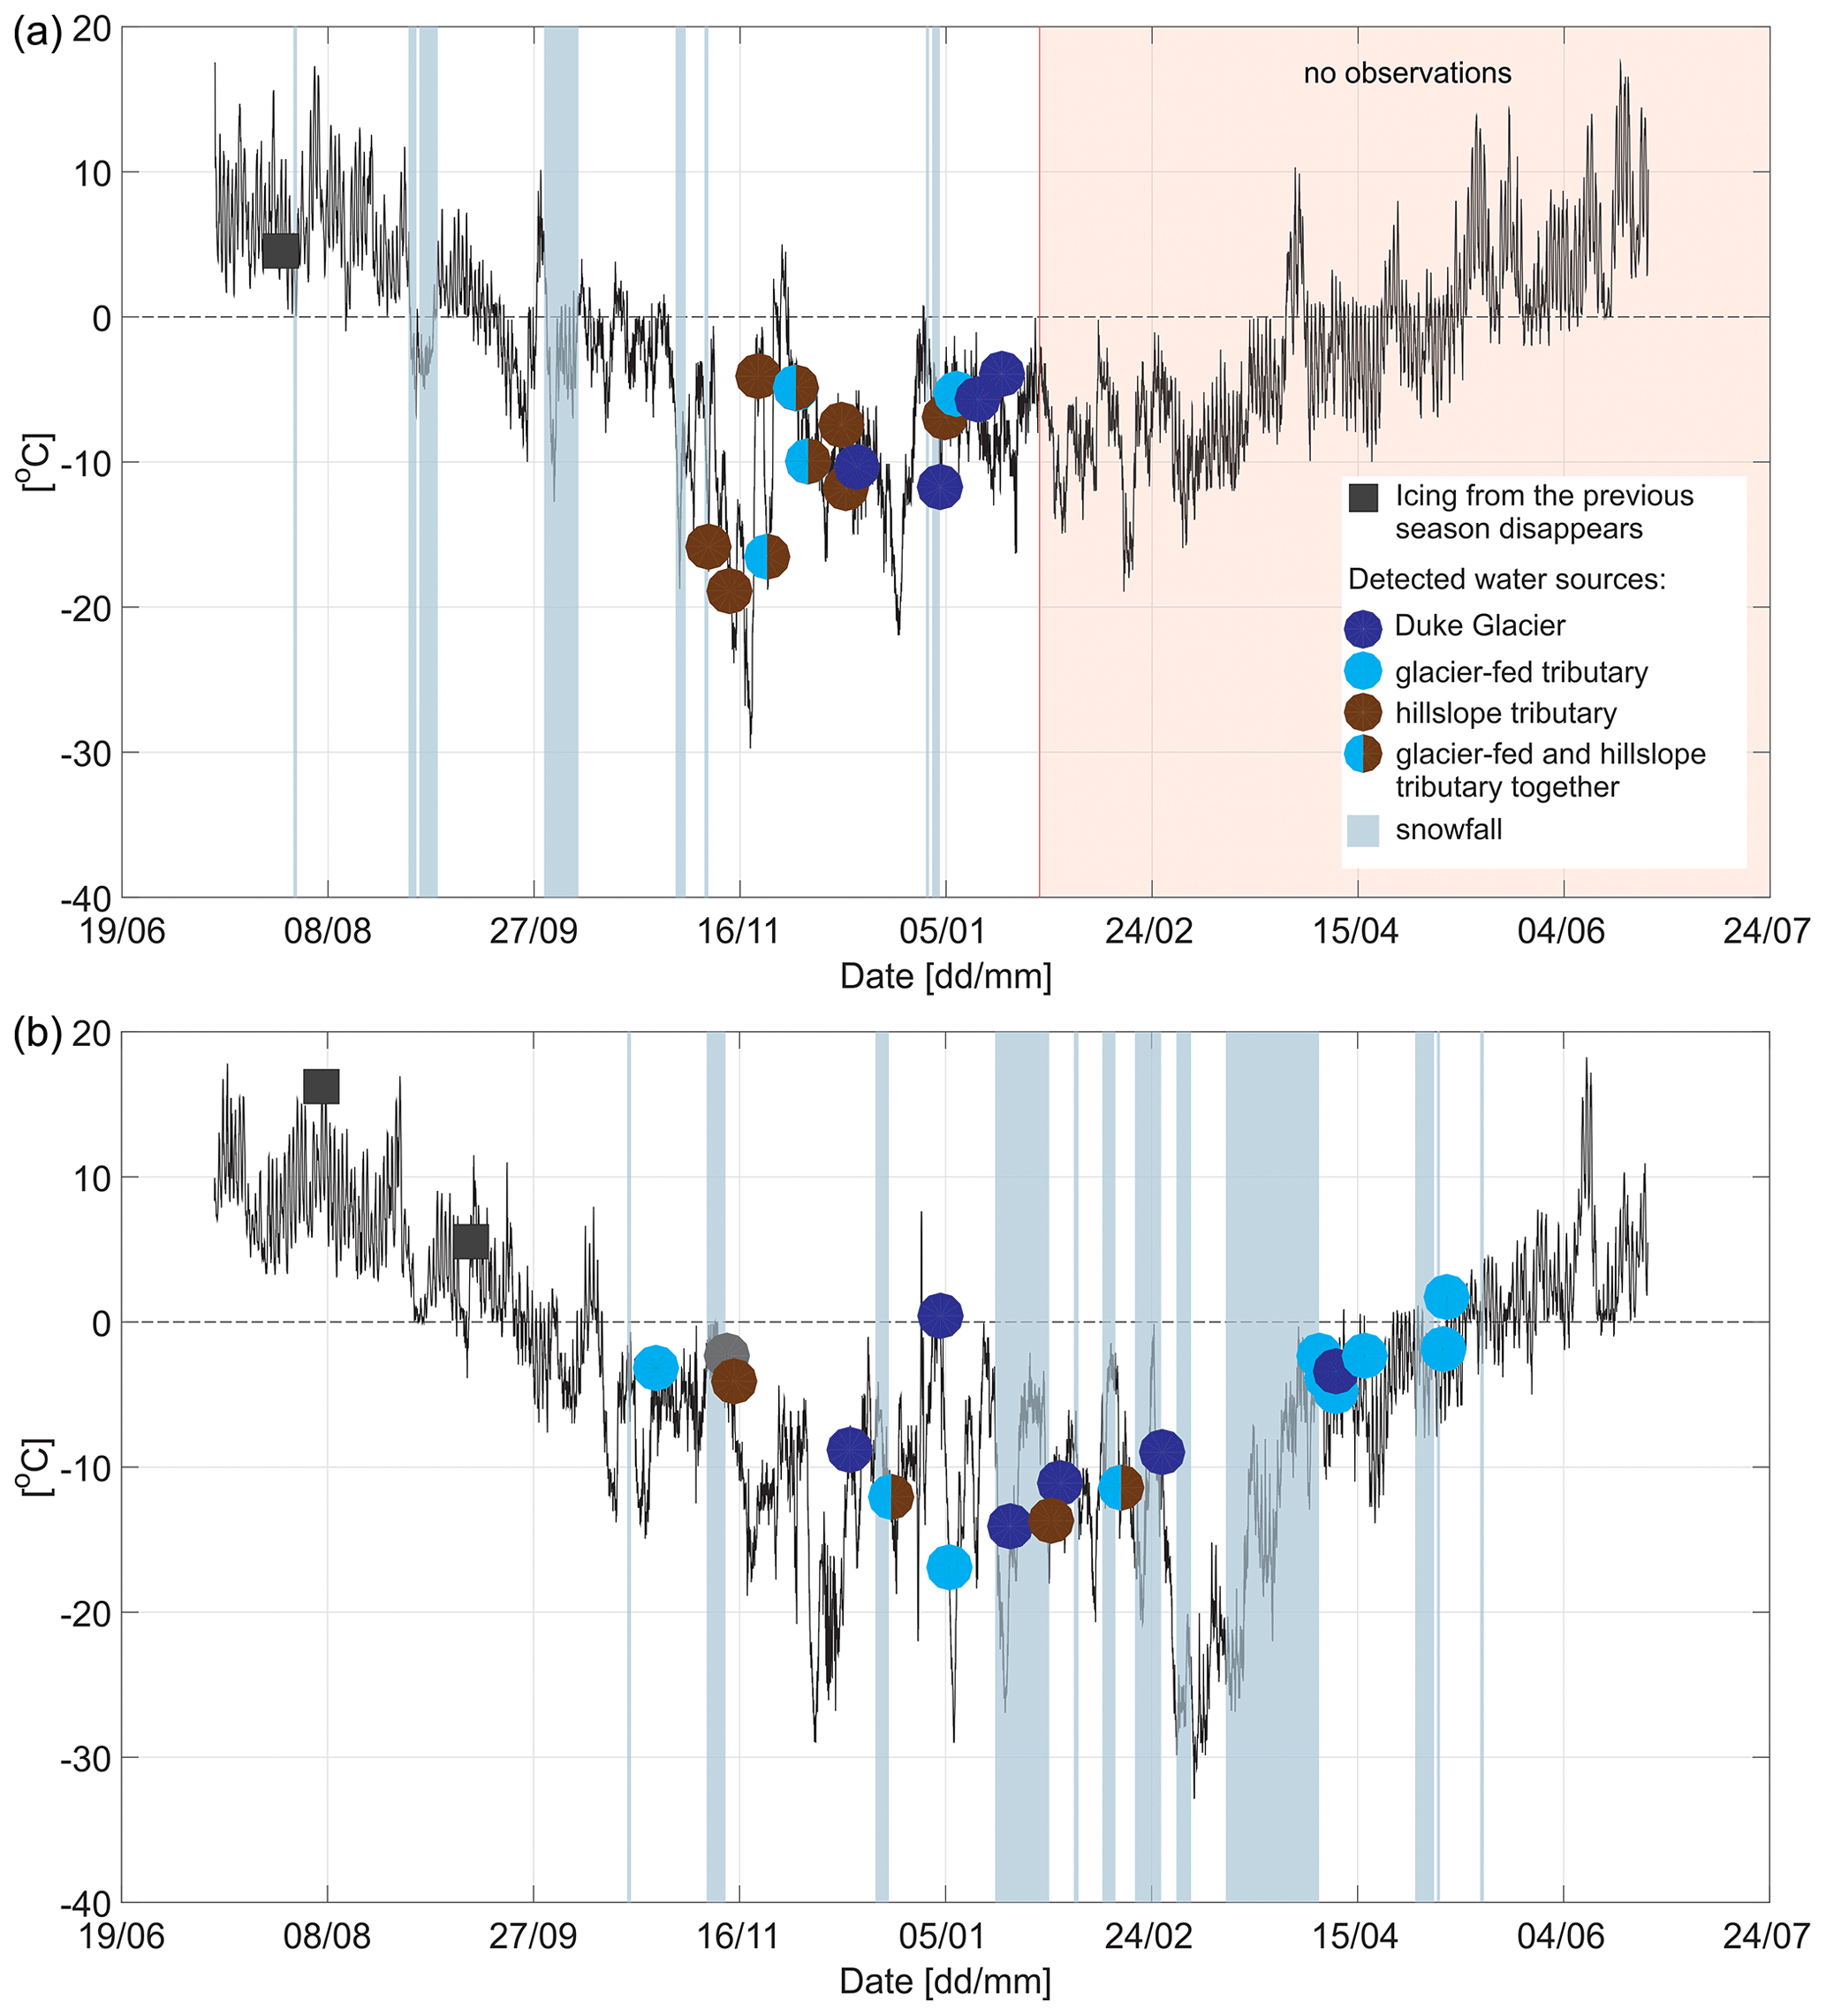
Figure 7Hydrological activities observed in the Upper Duke watershed by the use of time-lapse cameras for the 2015–2016 season (a) and the 2016–2017 season (b). Solid black lines show air temperature measured at the automatic weather station. Circles represent the timing of hydrological activity related to different water sources. The coloured circles identify a specific source type. In cases where different sources were observed as being active on the same day, the circle has multiple colours.
6.1 Identification of parent sources for icing formation
6.1.1 Identification of parent sources based on TLC images
For each studied icing, Table 2 provides a summary of the sources contributing to icing formation based on each method, in which only sources that can physically contribute (i.e., geographically close, not downstream of the icing) to each icing are listed. The results from our primary method, the TLC images, showed contributing water sources for each of the icings that were in a camera's field of vision. We marked these sources as “” in Table 2. The main glaciers in both studied watersheds feed their most proximate icings, icings PF and 4, and glacier-fed tributaries, as well as hillslope tributaries, contribute to the formation of icings 3 and 4. For Icing PF, another contributing source was identified, but images did not allow the differentiation between a buried ice formation and a moraine lake. Thus, we marked both sources with a single “+”. These primary results highlight that multiple sources can contribute to icings growth, even for those that form close to the glacier's tongue. This first finding contrasts with the traditional characterization of icing based on a single contributing source (e.g., Åkerman, 1982; Crites et al., 2020). These results show how important tributaries are in hydrologically complex systems, such as the Upper Duke watershed. There are two types of contributing tributaries: those connected to glaciers and those that are not. The contribution to icing formation of small glaciers, which are situated on the main valley slopes, can be hypothesized to be in the form of either surface discharge or discharge through the ground. The latter would mean that these small glaciers are an important source of aquifer recharge. The contribution from non-glacier-fed hillslope tributaries was observed over long periods of subzero air temperatures (Figs. 4, 7), and thus these tributaries can be considered to be groundwater-fed.
6.1.2 Identification of parent sources based on indirect methods for icings within TLC field of view
We tested four indirect methods to detect parent sources because TLC images do not cover all the observed icings and because hydrological sources may be missed by this method. Noticeably, these indirect methods did not contradict any of the findings from the primary method; none of the indirect methods suggested that the main glacier is not a parent source of the Icing PF or that glacier-fed tributaries and hillslope tributaries are not parent sources of icings 3 and 4. Apart from confirming sources identified by TLC, indirect methods also help detect potential parent sources that were not visible in TLC images. In Watershed B, stable water isotopes support moraine lakes as being contributors to Icing PF but not buried ice formation. Thus, indirect methods help to verify sources observed in TLC images for this icing. In the Duke watershed, for Icing 4, the contribution of buried ice formations is supported by ionic signature analysis and is not ruled out by the analysis of isotopes (Table 2). Regarding Icing 3, not much is brought by the indirect methods. For this icing, the results of the ionic signature analysis and isotopic analysis disagree for sources like buried ice formations and moraine lakes. In particular, buried ice formations are rejected as potential contributors by both the analysis of solid samples and isotope analyses, and thus we can consider their contribution to Icing 3 as being of low probability. None of the indirect methods supported main glacier contribution to Icing 3 formation. This is in agreement with TLC images and suggests that TLCs did not miss any flooding events from the Duke Glacier.
6.1.3 Identification of parent sources based on indirect methods for icings that are not visible in TLC images
In Watershed B, we observe a 100 % agreement between the three methods that were applied to Icing B (Table 2), in which all methods support hillslope tributaries (groundwater-fed) as its unique parent source. These results, however, should be met with caution, as for the analysis of isotopes, we used the distance between the B glacier sample and the Icing PF sample on the δ18O–δD diagram obtained for Watershed B to identify parent sources. In the Duke watershed, the contribution of groundwater-fed hillslope tributaries to the formation of Icing 2 is supported by the analysis of ionic signatures and is not rejected by any other method, and the main stream as a source is not supported by any method (Table 2). When we look at the results for other potential parent sources for Icing 2 and for any source for Icing 1, we see that there is no full agreement between the methods.
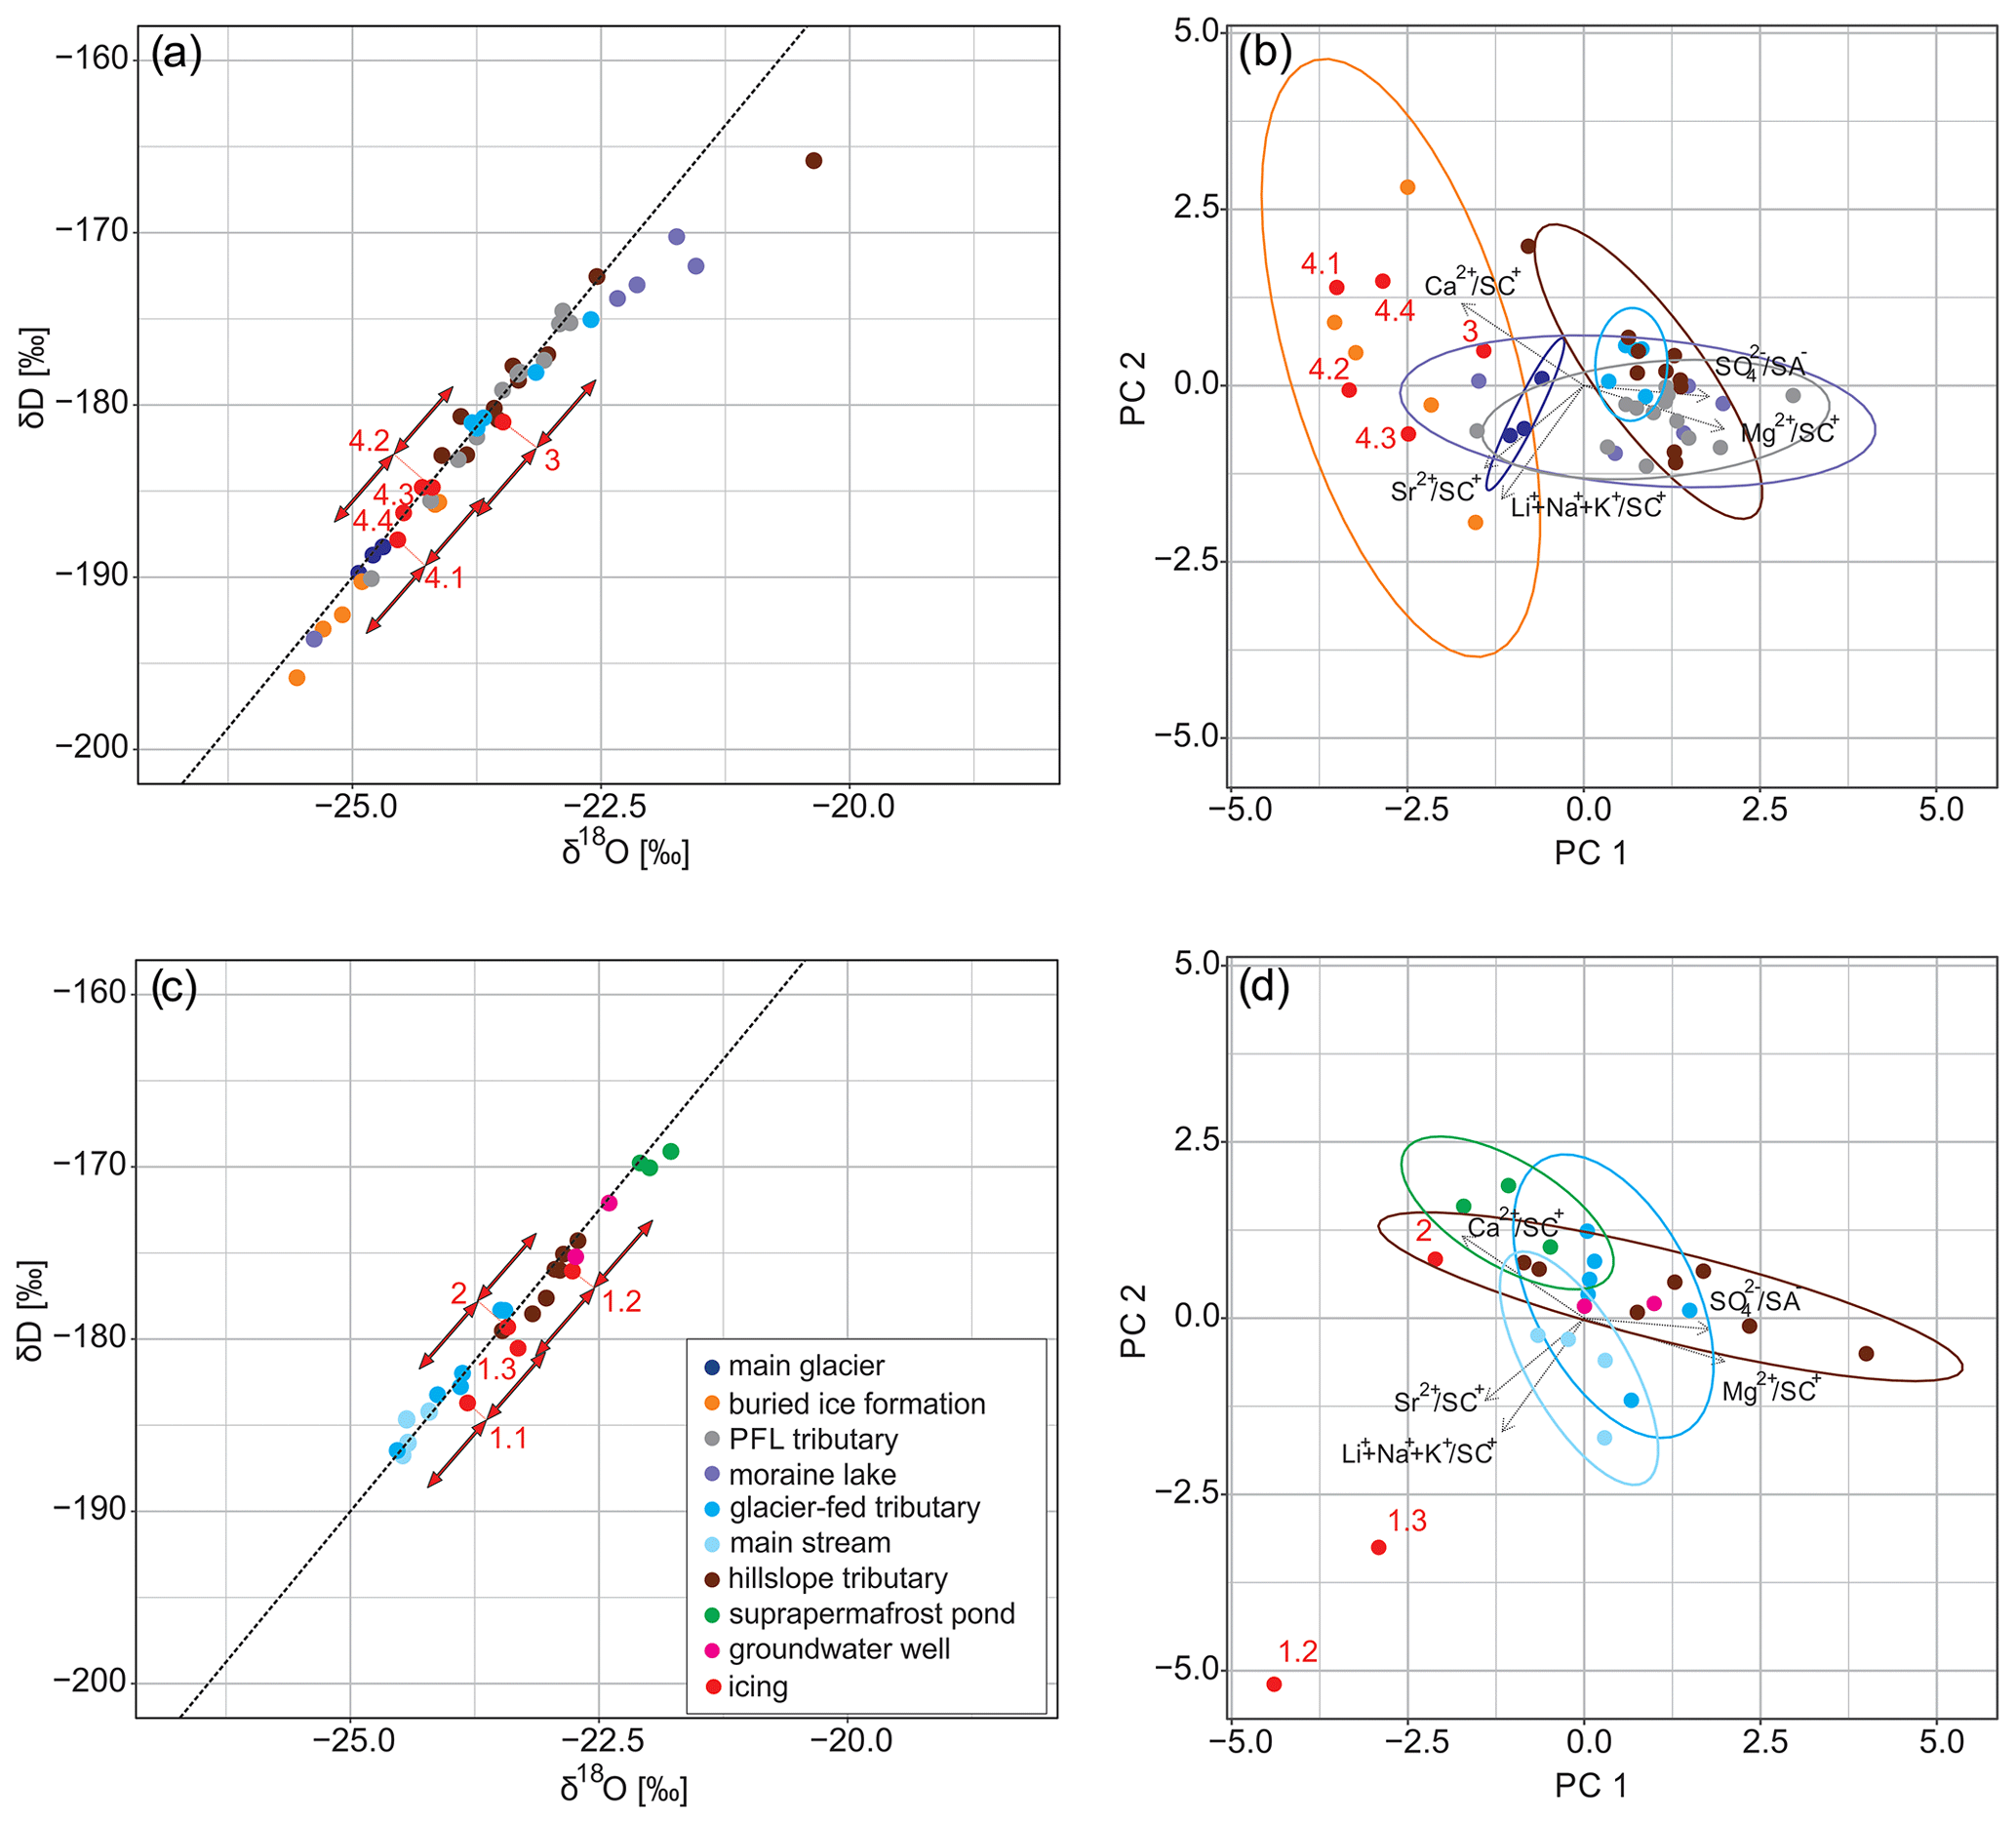
Figure 8Isotopic and hydrochemical results for the Duke watershed. Panels (a) and (b) show icings and sources within the proglacial field; panels (c) and (d) show icings and sources within the alpine meadow. Panels (a) and (c) show results from stable water isotope analysis. The straight dashed line represents the local meteoric water line. Red arrows define the range within which samples from parent sources are considered to plot close to the icing sample. For samples from Icing 4, only arrows for the most depleted and the less depleted samples are included for readability. Panels (b) and (d) show results of the hydrochemical analysis, and the ellipses illustrate the 95 % confidence interval.
6.2 Methodological limits
The use of TLC image analysis as the primary method allowed us to capture major flooding events and identify hydrological sources responsible for those events with a reasonable level of confidence. There are, however, three main drawbacks associated with the TLC images: (1) we found difficulties in differentiating between sources situated close to each other, (2) some flooding events were missed because of snowfall events and shorter daylight hours during the winter, and (3) the contribution of some minor sources was not detectable. In addition, the cameras' limited field of view and the difficulties in finding shooting locations that allow image acquisition throughout the whole year proved to be challenging in complex environments. Finally, harsh winter conditions can be responsible for equipment malfunctions. For instance, due to technical problems, one of the cameras in the Duke watershed stopped working at the end of the 2015–2016 season, thus eliminating the possibility of comparing the number of hydrological events for each identified parent source between seasons (Fig. 7a). The use of indirect methods which are based on natural tracers to support TLC image interpretation was informative in the studied watersheds, as none of these methods contradicted TLC findings. When applied to icings that were not covered by a TLC, these indirect methods showed contrasting results. In the smaller Watershed B, they exhibited good agreement for Icing B, providing a good confidence level in the overall findings. The situation is less straightforward for icings 1 and 2 in the Duke watershed. From a total of 11 potential sources evaluated for these two icings, the full agreement between applied indirect methods was reached only twice (Table 2). This lack of uniformity between the results of different methods partly arises from the underlying assumptions and sampling procedure. All methods that use natural tracers are based on assumptions about the tracer's content conservation across the seasons and about the representativeness of the icing sample, which can rarely be verified. While this assumption is conceptually strong for cryogenic precipitates and DOC, it is less certain for stable water isotopes and ionic signatures. We can only use the analysis of cryogenic precipitates and DOC when these properties were detected in icing samples. Thus, the results from these analyses have a lower weight in the decision matrix presented in Table 2 compared to results from the isotopes and the ionic signature analyses. In addition, the four indirect methods used are highly dependent on the sampling strategy. This is illustrated by two icings that have been sampled at multiple points, such as icings 4 and 1; both icings show variability in isotopic and ionic signatures among their samples.
Finally, while the use of indirect methods helped to account for the spatial variability of hydrological components responsible for icing formation, these methods did not provide information about the temporal variability of hydrological activity. Here, despite being unable to give a general picture of sources that remain active all winter long, the analysis of solids and DOC helped to provide indications about parent sources in specific cases, such as the contribution of the suprapermafrost layer water.
6.3 Findings on winter hydrological processes and implications for baseflow trends in the upper Duke River valley
All methods agree on the hydrological activity of glaciers throughout the winter in both the B and Duke watersheds. The Duke Glacier is a polythermal glacier (Flowers et al., 2014; Wilson et al., 2013), and the formation of icings has been commonly associated with this type of glacier in the Canadian Arctic (Moorman and Michel, 2000; Wainstein et al., 2008), Greenland (Yde and Knudsen, 2005), and Svalbard (Bukowska-Jania and Szafraniec, 2005; Hambrey, 1984; Sobota, 2016; Stachnik et al., 2016; Wadham et al., 2000; Yde et al., 2012). The contribution of the Duke Glacier to icing formation detected in the present study confirms that polythermal glaciers are hydrologically active during the winter. Glacier B is also active during winter, but its thermal regime had not yet been categorized. The contribution to icing formation from tributaries connected to small glaciers situated on valley slopes was not expected because these glaciers are visually thin and, therefore, probably freeze to their base (Wilson et al., 2013). Thus, the exact nature of the discharge in these tributaries should be further studied to better understand their winter activity.
Winter hydrological activity of non-glacier-fed hillslope tributaries has been identified at more than half of the icing locations. This highlights the role of groundwater discharge in the winter hydrological system even within the proglacial field, which could have been anticipated to be hydrologically inactive during the winter (Cooper et al., 2011).
Another type of hydrological activity in studied watersheds is related to the presence of permafrost. In Alaska and the Canadian Arctic, most of the studied icings have been shown to be fed by sub-permafrost water (Hu and Pollard, 1997; Kane and Slaughter, 1973; Kane, 1981; Pollard, 2005; Yoshikawa et al., 2007), and several studies that addressed water provenance for icing formation in regions with continuous and discontinuous permafrost explicitly concluded that suprapermafrost water does not participate in icing formation (Kane, 1981, in central Alaska, USA; Veillette and Thomas, 1979, in NWT, Canada; Yoshikawa et al., 2007, in Brooks Range, Alaska, USA). In this study, the results summary provided in Table 2 does not allow us to make a conclusion about the role of suprapermafrost layer water in icing growth. However, DOC results taken independently can shed some light. In particular, samples from alpine meadow icings 1 and 2 exhibit higher DOC concentrations. Among potential sources, suprapermafrost ponds, groundwater wells, and one hillslope tributary also exhibit DOC concentrations above the threshold. Interestingly, this hillslope tributary was sampled in the vicinity of the suprapermafrost ponds, suggesting that this tributary is at least partly fed by the suprapermafrost layer water. The potential contribution of suprapermafrost layer water to icing formation is also supported by the analysis of the cryogenic precipitate. As previously observed, icings fed by suprapermafrost water typically stop growing before the end of the winter when the water stored in the suprapermafrost layer is exhausted (e.g., Pollard, 2005). In the absence of TLC covering alpine meadows, it is impossible to say if discharge from the suprapermafrost layer happens throughout the winter or only at the beginning of the winter season.
While suggested by some methods, the activity of hydrological sources such as buried ice formations and moraine lakes for Icing PF and Icing 4 is impossible to confirm in the absence of DOC in samples from these groups, as well as of cryogenic precipitates on the icings.
The multi-source and distributed hydrological system described above will potentially respond to a further warming climate by sustaining the increase in winter baseflow in the Upper Duke watershed. The contribution of small glaciers to winter baseflow, supported by our results, should lead to a future increase in winter baseflow. Liljedahl et al. (2016) suggested for Tanana River, Alaska, that ubiquitous glacier mass loss leads to a continuous supply of meltwater, which is partly used for aquifer recharge. At the Upper Duke watershed, this recharge could enhance permafrost thaw by heat advection, thus simultaneously increasing aquifer storage capacity (Lamontagne-Hallé et al., 2018; McKenzie and Voss, 2013). As a result, actual glacier retreat should lead to an increase in groundwater discharge during the winter season.
An increase in suprapermafrost layer thickness in response to the changing climate should lead to the increased storage capacity of an aquifer, which in turn can also lead to increased winter discharge (Ge et al., 2011; Toohey et al., 2016). In addition, the formation of taliks activates the groundwater system which is otherwise shut down during the winter season (Lamontagne-Hallé et al., 2018; Pomortscev et al., 2010). Our results show that suprapermafrost layer water is a probable source of icing formation, and therefore it is reasonable to suggest that the observed permafrost thaw in the region (Smith et al., 2015) can contribute to the increased winter discharge in the region.
Similarly, under increasing temperatures, the water storage capacity of an aquifer can increase due to delayed freeze-up (Rennermalm et al., 2010; Yang et al., 2002), and thus groundwater-fed hillslope tributaries can be expected to contribute more to the winter baseflow.
Finally, the moraine lake contribution to winter discharge will most likely increase in a warming climate. Moorman (2003) and Wainstein et al. (2014) in Bylot Island, Canada, concluded that marginal glacier lakes did not freeze entirely over the winter and kept releasing water all year long through taliks. The increase in talik formations expected in response to the changing climate should thus enhance the contribution of moraine lakes to winter discharge.
Based on our results and the existing literature, we can anticipate that most of the sources that we detected as hydrologically active during the winter and contributing to baseflow should exhibit positive feedback to climate change in the upper Duke River valley.
Icings form from hydrological sources that remain active during the winter, and we therefore used them to chronicle winter hydrological processes in the upper Duke River valley, a remote subarctic watershed. The use of TLC images coupled with the natural-tracer-based analysis of water and icing samples taken at the end of the winter season revealed valuable information that can be used to understand complex hydrological systems. We explored isotopic, ionic, and DOC concentrations within samples of icing meltwater and of solids removed from deposits on icing remnants and compared them to those of potential hydrological parent sources.
The results show that it is possible to identify hydrological sources that remain active during the winter by studying icing formation and to depict a complex, distributed contribution of different sources to studied icings. As expected, icings forming next to a main glacier terminus are fed by glacier meltwater. However, even in the vicinity of the glaciers, traces of non-glacier-related water sources, such as groundwater-fed hillslope tributaries, buried ice formations, and moraine lakes, have been found. With increasing distance downstream from the main glaciers, the contribution from groundwater-fed and small-glacier-fed tributaries is more pronounced and becomes a major source for icing formation in the alpine meadow section of the watershed. Some hillslope tributaries within the alpine meadow seem to be fed by suprapermafrost layer water.
Even though Watershed B is a small, highly glacierized catchment, it seems that the sources contributing to icing formation, and thus the winter hydrological processes occurring there, are comparable to those present in the longer and wider Upper Duke watershed. However, the Duke watershed shows a larger variety of sources as potential components of winter runoff. The comparison between Watershed B and the Duke watershed shows that the size of the watershed does not affect the spatial patterns of winter runoff generation, but a larger watershed is more complex, and its sources are therefore more diverse.
Our multi-technique approach provided important information about the water sources active during the winter season in the headwaters of a glacierized catchment. Our findings, in the context of a ubiquitous increase in winter discharge in cold regions, show that the investigation of icing formations can help overcome the lack of direct groundwater observations in remote environments and generate new insights about winter runoff trends.
The data that support the findings of this study are available from the corresponding author upon reasonable request.
The supplement related to this article is available online at: https://doi.org/10.5194/tc-14-4145-2020-supplement.
AC and MB designed the research. AC, MB, and ÉB collected data in the field. AC performed chemical analysis of samples and data analysis and wrote the initial draft of the paper. All authors contributed to editing and revising the paper.
The authors declare that they have no conflict of interest.
We want to acknowledge that this research was conducted on the traditional territory of Kluane First Nation, and we are thankful for their support. We are also grateful for help from Parks Canada. Finally, we are thankful for the thorough and constructive comments of the two reviewers, Olga Makarieva and Tim Ensom, and the TC associate editor, Peter Morse, who helped to considerably improve the paper.
This research has been supported by the Natural Science and Engineering Research Council (NSERC) of Canada, the École de technologie supèrieure, a constituent of the Université du Québec network, the Geochemistry and Geodynamics Research Centre (GEOTOP) of Quebec, and the Polar Continental Shelf Program.
This paper was edited by Peter Morse and reviewed by Olga Makarieva and Tim Ensom.
Åkerman, J.: Studies on naledi (icings) in West Spitsbergen, Fourth Can. Permafr. Conf., 189–202, 1982.
Alekseyev, V. R.: Naledi, Nauka, Moscow, 1987.
Alekseyev, V. R.: Cryogenesis and geodynamics of icing valleys, Geodyn. Tectonophys., 6, 171–224, https://doi.org/10.5800/GT-2015-6-2-0177, 2015.
Arendt, A. A, Echelmeyer, K. a, Harrison, W. D., Lingle, C. S., and Valentine, V. B.: Rapid wastage of Alaska glaciers and their contribution to rising sea level, Science, 297, 382–6, https://doi.org/10.1126/science.1072497, 2002.
Bælum, K. and Benn, D. I.: Thermal structure and drainage system of a small valley glacier (Tellbreen, Svalbard), investigated by ground penetrating radar, The Cryosphere, 5, 139–149, https://doi.org/10.5194/tc-5-139-2011, 2011.
Baraer, M., Mckenzie, J., Mark, B. G., Gordon, R., Bury, J., Condom, T., Gomez, J., Knox, S., and Fortner, S. K.: Contribution of groundwater to the outflow from ungauged glacierized catchments: A multi-site study in the tropical Cordillera Blanca, Peru, Hydrol. Process., 29, 2561–2581, https://doi.org/10.1002/hyp.10386, 2015.
Barrand, N. E. and Sharp, M. J.: Sustained rapid shrinkage of Yukon glaciers since the 1957–1958 International Geophysical Year, Geophys. Res. Lett., 37, L07501, https://doi.org/10.1029/2009GL042030, 2010.
Beylich, A. A. and Laute, K.: Seasonal and annual variations of surface water chemistry, solute fl uxes and chemical denudation in a steep and glacier-fed mountain catchment in western Norway (Erdalen, Nordfjord), Catena, 96, 12–27, https://doi.org/10.1016/j.catena.2012.04.004, 2012.
Bonnaventure, P. P. and Lewkowicz, A. G.: Mountain permafrost probability mapping using the BTS method in two climatically dissimilar locations, northwest Canada, Can. J. Earth Sci., 45, 443–455, https://doi.org/10.1139/E08-013, 2008.
Brabets, T. P. and Walvoord, M. A.: Trends in streamflow in the Yukon River Basin from 1944 to 2005 and the influence of the Pacific Decadal Oscillation, J. Hydrol., 371, 108–119, https://doi.org/10.1016/j.jhydrol.2009.03.018, 2009.
Brown, J., Ferrians, O., Heginbottom, J., and Melnikov, E.: Circum-Arctic Map of Permafrost and Gound-Ice Conditions, version 2, Natl. Snow Ice Data Cent., Boulder, CO, 2002.
Bukowska-jania, E. and Szafraniec, J.: Distribution and morphometric characteristics of icing fields in Svalbard, Polar Res., 24, 41–53, 2005.
Bukowska-Jania, E.: The role of glacier system in migration of calcium carbonate on Svalbard, Polish Polar Res., 28, 137–155, 2007.
Carey, K. L.: Icings developed from surface water and ground water, 1973.
Carey, S. K.: Dissolved organic carbon fluxes in a discontinuous permafrost subarctic alpine catchment, Permafr. Periglac. Process., 14, 161–171, https://doi.org/10.1002/ppp.444, 2003.
Chesnokova, A., Baraër, M., Laperrière-Robillard, T., and Huh, K.: Linking Mountain Glacier Retreat and Hydrological Changes in Southwestern Yukon, Water Resour. Res., 56, 1–26, https://doi.org/10.1029/2019WR025706, 2020.
Clarke, G. K. C., Schmok, J. P., Simon, C., Ommanney, L., and Collins, S. G.: Characteristics of Surge-Type Glaciers, J. Geophys. Res., 91, 7165–7180, 1986.
Connon, R., Devoie, É., Hayashi, M., Veness, T., and Quinton, W. L.: The Influence of Shallow Taliks on Permafrost Thaw and Active Layer Dynamics in Subarctic Canada, J. Geophys. Res.-Earth Surf., 123, 281–297, https://doi.org/10.1002/2017JF004469, 2018.
Cooper, R., Hodgkins, R., Wadham, J., and Tranter, M.: The hydrology of the proglacial zone of a high-Arctic glacier(Finsterwalderbreen, Svalbard): Sub-surface water fluxes and complete water budget, J. Hydrol., 406, 88–96, https://doi.org/10.1016/j.jhydrol.2011.06.008, 2011.
Coplen, T. B.: New guidelines for reporting stable hydrogen, carbon, and oxygen isotope-ratio data, Geochim. Cosmochim. Acta, 60, 3359–3360, 1996.
Crites, H., Kokelj, S. V., and Lacelle, D.: Icings and groundwater conditions in permafrost catchments of northwestern Canada, Sci. Rep., 10, 1–11, https://doi.org/10.1038/s41598-020-60322-w, 2020.
Danilovich, I., Zhuravlev, S., Kurochkina, L., and Groisman, P.: The Past and Future Estimates of Climate and Streamflow Changes in the Western Dvina River Basin, Front. Earth Sci., 7, 1–16, https://doi.org/10.3389/feart.2019.00204, 2019.
Drever, J. I.: The Geochemistry of Natural Waters: Surface and Groundwater Environments, 3rd edn., Prentice Hall, New jersey, USA, 1997.
Ensom, T., Makarieva, O., Morse, P., Kane, D. Alekseev, V., and Marsh, P.: The distribution and dynamics of aufeis in permafrost regions, Permafr. Periglac. Process., 31, 383–395, https://doi.org/10.1002/ppp.2051, 2020.
Flowers, G. E., Copland, L., and Schoof, C. G.: Contemporary Glacier Processes and Global Change: Recent Observations from Kaskawulsh Glacier and the Donjek Range, St. Elias Mountains, ARCTIC, 1–13, available at: http://arctic.synergiesprairies.ca/arctic/index.php/arctic/article/view/4356 (last access: 30 October 2014), 2014.
French, H. M. and Heginbottom, J. A.: Guidebook to permafrost and related features of the Northern Yukon territory and Mackenzie Delta, Canada, Fourth Int. Conf. Permafr., 194 pp., 1983.
Ge, S., McKenzie, J., Voss, C., and Wu, Q.: Exchange of groundwater and surface-water mediated by permafrost response to seasonal and long term air temperature variation, Geophys. Res. Lett., 38, L14402, https://doi.org/10.1029/2011GL047911, 2011.
Gokhman, V. V.: Distribution and conditions of formation of glacial icings on spitsbergen, Polar Geogr. Geol., 11, 249–260, https://doi.org/10.1080/10889378709377334, 1987.
Hagedorn, F., Saurer, M., and Blaser, P.: A 13C tracer study to identify the origin of dissolved organic carbon in forested mineral soils, Eur. J. Soil Sci., 55, 91–100, https://doi.org/10.1046/j.1365-2389.2003.00578.x, 2004.
Hambrey, M. J.: Sedimentary processes and buried ice phenomena in the pro-glacial areas of Spitsbergen glaciers, J. Glaciol., 30, 116–119, https://doi.org/10.1017/S002214300000856X, 1984.
Hinzman, L. D., Bettez, N. D., Bolton, W. R., Chapin, F. S., Dyurgerov, M. B., Fastie, C. L., Griffith, B., Hollister, R. D., Hope, A., Huntington, H. P., Jensen, A. M., Gensuo, J. J., Jorgenson, T., Kane, D. L., Klein, D. R., Kofinas, G., Lynch, A. H., Lloyd, A. H., Mcguire, a D., Nelson, F. E., Oechel, W. C., Racine, C. H., Romanovsky, V. E., Stone, R. S., Stow, D. a, Sturm, M., Tweedie, C. E., Vourlitis, G. L., Walker, M. D., Walker, D. a, Webber, P. J., Welker, J. M., and Winker, K. S.: Evidence and Implications of Recent Climate Change in Northern Alaska and Other Arctic Regions, Clim. Change, 72, 251–298, https://doi.org/10.1007/s10584-005-5352-2, 2005.
Hodgkins, R., Tranter, M., and Dowdeswell, J. A.: The hydrochemistry of runoff from a “cold-based” glacier in the High Artic (Scott Turnerbreen, Svalbard), Hydrol. Process., 12, 87–103, https://doi.org/10.1002/(SICI)1099-1085(199801)12:1<87::AID-HYP565>3.0.CO;2-C, 1998.
Hodgkins, R., Tranter, M., and Dowdeswell, J.: The characteristics and formation of a high-arctic proglacial icing, Geogr. Ann., 86, 265–275, 2004.
Hu, X. and Pollard, W. H.: The hydrologic analysis and modelling of river icing growth, North Fork Pass, Yukon Territory, Canada, Permafr. Periglac. Process., 8, 279–294, https://doi.org/10.1002/(SICI)1099-1530(199709)8:3<279::AID-PPP260>3.3.CO;2-Z, 1997.
Johnson, P. G.: Ice Cored Moraine Formation and Degradation, Donjek Glacier, Yukon Territory, Canada, Geogr. Ann. Ser. A, Phys. Geogr., 53, 198, https://doi.org/10.2307/520789, 1971.
Johnson, P. G.: Rock glacier types and their drainage systems, Grizzly Creek, Yukon Territory, Can. J. Earth Sci., 15, 1496–1507, https://doi.org/10.1139/e78-155, 1978.
Johnson, P. G.: Holocene paleohydrology of the St. Elias Mountains, British Columbia and Yukon, Geogr. Phys. Quat., 40, 47–53, https://doi.org/10.7202/032622ar, 1986.
Johnson, P. G.: Stagnant glacier ice, St Elias Mountains, Yukon, Geogr. Ann. Ser. A Phys. Geogr., 74, 13–19, 1992.
Kane, D. L.: Physical mechanics of aufeis growth, Can. J. Civ. Eng., 8, 186–195, https://doi.org/10.1139/l81-026, 1981.
Kane, D. L. and Slaughter, C. W.: Seasonal regime and hydrological significance of stream icings in central Alaska, Role snow ice Hydrol. Proc. Banff Symp., 528–540, available at: http://hydrologie.org/redbooks/a107/107041.pdf (last access: 10 December 2019), 1973.
McKenzie, J. M. and Voss, C. I.: Permafrost thaw in a nested groundwater-flow system, Hydrogeol. J., 21, 299–316, https://doi.org/10.1007/s10040-012-0942-3, 2013.
Kuo, M. H., Moussa, S. G., and McNeill, V. F.: Modeling interfacial liquid layers on environmental ices, Atmos. Chem. Phys., 11, 9971–9982, https://doi.org/10.5194/acp-11-9971-2011, 2011.
Lacelle, D.: On the δ18O, δD and D-excess relations in meteoric precipitation and during equilibrium freezing: Theoretical approach and field examples, Permafr. Periglac. Process., 22, 13–25, https://doi.org/10.1002/ppp.712, 2011.
Lacelle, D., Lauriol, B., and Clark, I. D.: Formation of seasonal ice bodies and associated cryogenic carbonates in caverne de l'ours, Québec, Canada: Kinetic isotope effects and pseudo-biogenic crystal structures, J. Cave Karst Stud., 71, 48–62, 2009.
Lammers, R. B., Shiklomanov, A. I., Vörösmarty, C. J., Fekete, B. M., and Peterson, B. J.: Assessment of contemporary Arctic river runoff based on observational discharge records, J. Geophys. Res.-Atmos., 106, 3321–3334, https://doi.org/10.1029/2000JD900444, 2001.
Lamontagne-Hallé, P., McKenzie, J. M., Kurylyk, B. L., and Zipper, S. C.: Changing groundwater discharge dynamics in permafrost regions, Environ. Res. Lett., 13, 084017, https://doi.org/10.1088/1748-9326/aad404, 2018.
Lauriol, B. and Clark, J.: Localisation, Genèse et Fonte de Quelques Naleds du Nord du Yukon (Canada), Permafr. Periglac. Process., 2, 225–236, https://doi.org/10.1002/ppp.3430020306, 1991.
Liljedahl, A., Gaedeke, A., O'Neel, S., Gatesman, T. and Douglas, T.: Glacierized headwater streams as aquifer recharge corridors, subarctic Alaska, Geophys. Res. Lett., 44, 6876–6885, https://doi.org/10.1002/2017GL073834, 2016.
Lyon, S. W., Destouni, G., Giesler, R., Humborg, C., Mörth, M., Seibert, J., Karlsson, J., and Troch, P. A.: Estimation of permafrost thawing rates in a sub-arctic catchment using recession flow analysis, Hydrol. Earth Syst. Sci., 13, 595–604, https://doi.org/10.5194/hess-13-595-2009, 2009.
Ma, Q., Jin, H., Yu, C., and Bense, V. F.: Dissolved organic carbon in permafrost regions: A review, Sci. China Earth Sci., 62, 349–364, https://doi.org/10.1007/s11430-018-9309-6, 2019.
MacLean, R., Oswood, M. W., Irons, J. G., and McDowell, W. H.: The effect of permafrost on stream biogeochemistry: A case study of two streams in the Alaskan (USA) taiga, Biogeochemistry, 47, 239–267, 1999.
Makarieva, O., Nesterova, N., Post, D. A., Sherstyukov, A., and Lebedeva, L.: Warming temperatures are impacting the hydrometeorological regime of Russian rivers in the zone of continuous permafrost, The Cryosphere, 13, 1635–1659, https://doi.org/10.5194/tc-13-1635-2019, 2019.
Mark, B. G. and Seltzer, G. O.: Tropical glacier meltwater contribution to stream discharge: A case study in the Cordillera Blanca, Peru, J. Glaciol., 49, 271–281, https://doi.org/10.3189/172756503781830746, 2003.
Markov, M. L., Vasilenko, N. G., and Gurevich, E. V: Icing fields of the BAM zone: expeditionary investigations, in Nestor-History, Saint Petersburg, Russia, 2016.
McClelland, J. W., Holmes, R. M., Peterson, B. J., and Stieglitz, M.: Increasing river discharge in the Eurasian Arctic: Consideration of dams, permafrost thaw, and fires as potential agents of change, J. Geophys. Res.-Atmos., 109, D18102, https://doi.org/10.1029/2004JD004583, 2004.
Moorman, B. J.: Glacier-permafrost hydrology interactions, Bylot Island, Canada, Proc. 8th Int. Conf. Permafr., 783–788, 2003.
Moorman, B. J. and Michel, F.: Glacial hydrological system characterization using ground-penetrating radar, Hydrol. Process., 14, 2645–2667, https://doi.org/10.1002/1099-1085(20001030)14:15<2645::AID-HYP84>3.0.CO;2-2, 2000.
Naegeli, K., Lovell, H., Zemp, M., and Benn, D. I.: Dendritic subglacial drainage systems in cold glaciers formed by cut-and-closure processes, Geogr. Ann. Ser. A Phys. Geogr., 96, 591–608, https://doi.org/10.1111/geoa.12059, 2014.
Neal, E. G., Todd Walter, M., and Coffeen, C.: Linking the pacific decadal oscillation to seasonal stream discharge patterns in Southeast Alaska, J. Hydrol., 263, 188–197, https://doi.org/10.1016/S0022-1694(02)00058-6, 2002.
O'Donnell, J. A., Aiken, G. R., Walvoord, M. A., and Butler, K. D.: Dissolved organic matter composition of winter flow in the Yukon River basin: Implications of permafrost thaw and increased groundwater discharge, Global Biogeochem. Cy., 26, GB0E06, https://doi.org/10.1029/2012GB004341, 2012.
Pavelsky, T. M. and Zarnetske, J. P.: Rapid decline in river icings detected in Arctic Alaska: Implications for a changing hydrologic cycle and river ecosystems, Geophys. Res. Lett., 44, 3228–3235, https://doi.org/10.1002/2016GL072397, 2017.
Petrone, K. C., Jones, J. B., Hinzman, L. D., and Boone, R. D.: Seasonal export of carbon, nitrogen, and major solutes from Alaskan catchments with discontinuous permafrost, J. Geophys. Res., 111, G02020, https://doi.org/10.1029/2005JG000055, 2006.
Pollard, W. H.: Icing processes associated with high Arctic perennial springs, Axel Heiberg Island, Nunavut, Canada, Permafr. Periglac. Process., 16, 51–68, https://doi.org/10.1002/ppp.515, 2005.
Pomortscev, O. A., Kashkarov, E. P. and Popov, B. F.: Aufeis: global warming and processes of ice formation (rhythmic basis of long-term prognosis), Yakutsk State Univ. Bull., 7, 2010.
Qin, J., Ding, Y., and Han, T.: Quantitative assessment of winter baseflow variations and their causes in Eurasia over the past 100 years, Cold Reg. Sci. Technol., 513, 734427, https://doi.org/10.1016/j.aquaculture.2019.734427, 2020.
Raudina, T. V, Loiko, S. V, Lim, A., Manasypov, R. M., Shirokova, L. S., Istigechev, G. I., Kuzmina, D. M., Kulizhsky, S. P., Vorobyev, S. N., and Pokrovsky, O. S.: Permafrost thaw and climate warming may decrease the CO2, carbon , and metal concentration in peat soil waters of the Western Siberia Lowland, Sci. Total Environ., 634, 1004–1023, https://doi.org/10.1016/j.scitotenv.2018.04.059, 2018.
Reedyk, S., Woo, M.-K. K., and Prowse, T. D.: Contribution of icing ablation to streamflow in a discontinuous permafrost area, Can. J. Earth Sci., 32, 13–20, https://doi.org/10.1139/e95-002, 1995.
Rennermalm, A. K., Wood, E. F., and Troy, T. J.: Observed changes in pan-arctic cold-season minimum monthly river discharge, Clim. Dynam., 35, 923–939, https://doi.org/10.1007/s00382-009-0730-5, 2010.
Romanovsky, N. N.: About geological activity of aufeis, in Permafrost studies, Moscow University, Moscow, 1973.
Smith, L. C., Pavelsky, T. M., MacDonald, G. M., Shiklomanov, A. I., and Lammers, R. B.: Rising minimum daily flows in northern Eurasian rivers: A growing influence of groundwater in the high-latitude hydrologic cycle, J. Geophys. Res.-Biogeo., 112, G04S47, https://doi.org/10.1029/2006JG000327, 2007.
Smith, S. L., Burgess, M. M., Riseborough, D., and Nixon, F. M.: Recent trends from Canadian permafrost thermal monitoring network sites, Permafr. Periglac. Process., 16, 19–30, https://doi.org/10.1002/ppp.511, 2005.
Smith, S. L., Romanovsky, V. E., Lewkowicz, A. G., Burn, C. R., Allard, M., Clow, G. D., Yoshikawa, K., and Throop, J.: Thermal state of permafrost in North America: A contribution to the international polar year, Permafr. Periglac. Process., 21, 117–135, https://doi.org/10.1002/ppp.690, 2010.
Smith, S. L., Lewkowicz, A. G., Ednie, M., Maxime, A., and Bevington, A.: Characterization of Permafrost Thermal State in the Southern Yukon, 68e Conférence Can. Géotechnique 7e Conférence Can. sur le Pergélisol, Québec, 20–23 September 2015.
Sobota, I.: Icings and their role as an important element of the cryosphere in High Arctic glacier forefields, Bull. Geogr. Phys. Geogr. Ser., 10, 81–93, 2016.
Stachnik, Ł., Yde, J. C., Kondracka, M., Ignatiuk, D., and Grzesik, M.: Glacier naled evolution and relation to the subglacial drainage system based on water chemistry and GPR surveys (Werenskioldbreen, SW Svalbard), Ann. Glaciol., 57, 19–30, https://doi.org/10.1017/aog.2016.9, 2016.
St. Jacques, J.-M. and Sauchyn, D. J.: Increasing winter baseflow and mean annual streamflow from possible permafrost thawing in the Northwest Territories, Canada, Geophys. Res. Lett., 36, L01401, https://doi.org/10.1029/2008GL035822, 2009.
Tananaev, N. I., Makarieva, O. M., and Lebedeva, L. S.: Trends in annual and extreme flows in the Lena River basin, Northern Eurasia, Geophys. Res. Lett., 43, 10764–10772, https://doi.org/10.1002/2016GL070796, 2016.
Tarnocai, C., Nixon, M. F., and Kutny, L.: Circumpolar-Active-Layer-Monitoring (CALM) sites in the Mackenzie Valley, northwestern Canada, Permafr. Periglac. Process., 15, 141–153, https://doi.org/10.1002/ppp.490, 2004.
Thomazo, C., Buoncristiani, J. F., Vennin, E., Pellenard, P., Cocquerez, T., Mugnier, J. L., and Gérard, E.: Geochemical processes leading to the precipitation of subglacial carbonate crusts at bossons glacier, mont blanc massif (French alps), Front. Earth Sci., 5, 1–16, https://doi.org/10.3389/feart.2017.00070, 2017.
Toohey, R. C., Herman-Mercer, N. M., Schuster, P. F., Mutter, E. A., and Koch, J. C.: Multidecadal increases in the Yukon River Basin of chemical fluxes as indicators of changing flowpaths, groundwater, and permafrost, Geophys. Res. Lett., 43, 12120–12130, https://doi.org/10.1002/2016GL070817, 2016.
Veiette, J. J. and Thomas, R. D.: Icings and seepage in frozen glaciofluvial deposits, District of Keewatin, N.W.T., Can. Geotech., 16, 789–798, 1979.
Vogt, T.: Cryogenic Physico-chemical Precipitations?: Iron, Silica, Calcium Carbonate, Permafr. Periglac. Process., 1, 283–293, 1991.
Wadham, J. L., Tranter, M., and Dowdeswell, J. A.: Hydrochemistry of meltwaters draining a polythermal-based, high-Arctic glacier, south Svalbard: II. Winter and early Spring, Hydrol. Process., 14, 1767–1786, https://doi.org/10.1002/1099-1085(200007)14:10<1767::AID-HYP103>3.0.CO;2-Q, 2000.
Wahl, H. E., Fraser, D. B., Harvey, R. C., and Maxwell, J. B.: Climate of Yukon, Atmospheric Environment Service, Environment Canada, 1987.
Wainstein, P., Moorman, B. J., and Whitehead, K.: Importance of glacier-permafrost interactions in the preservation of a proglacial icing: Fountain Glacier, Bylot Island, Canada, Ninth Int. Conf. Permafr., 1881–1886 available at: https://scholar.google.com/scholar?hl=en&btnG=Search&q=intitle:Importance+of+Glacier-Permafrost+Interactions+in+the+Preservation+of+a+Proglacial+Icing+:+Fountain+Glacier+,+Bylot+Island+,+Canada#0 (last access: 13 January 2015), 2008.
Wainstein, P., Moorman, B. J., and Whitehead, K.: Glacial conditions that contribute to the regeneration of Fountain Glacier proglacial icing, Bylot Island, Canada, Hydrol. Process., 28, 2749–2760, https://doi.org/10.1002/hyp.9787, 2014.
Walvoord, M. A. and Striegl, R. G.: Increased groundwater to stream discharge from permafrost thawing in the Yukon River basin: Potential impacts on lateral export of carbon and nitrogen, Geophys. Res. Lett., 34, L12402, https://doi.org/10.1029/2007GL030216, 2007.
Wang, S.: Freezing Temperature Controls Winter Water Discharge for Cold Region Watershed, Water Resour. Res., 55, 10479–10493, https://doi.org/10.1029/2019WR026030, 2019.
Wilson, N. J., Flowers, G. E., and Mingo, L.: Comparison of thermal structure and evolution between neighboring subarctic glaciers, J. Geophys. Res.-Earth Surf., 118, 1443–1459, https://doi.org/10.1002/jgrf.20096, 2013.
Woo, M.-K. K. and Thorne, R.: Winter flows in the Mackenzie drainage system, Arctic, 67, 238–256, https://doi.org/10.14430/arctic4384, 2014.
Yang, D., Kane, D. L., Hinzman, L. D., Zhang, X., Zhang, T., and Ye, H.: Siberian Lena River hydrologic regime and recent change, J. Geophys. Res.-Atmos., 107, 4694, https://doi.org/10.1029/2002JD002542, 2002.
Yde, J. C. and Knudsen, N. T.: Observations of debris-rich naled associated with a major glacier surge event, Disko Island, West Greenland, Permafr. Periglac. Process., 16, 319–325, https://doi.org/10.1002/ppp.533, 2005.
Yde, J. C., Hodson, A. J., Solovjanova, I., Steffensen, J. P., Nørnberg, P., Heinemeier, J., and Olsen, J.: Chemical and isotopic characteristics of a glacier-derived naled in front of Austre Grønfjordbreen, Svalbard, Polar Res., 31, 17628, https://doi.org/10.3402/polar.v31i0.17628, 2012.
Yoshikawa, K., Hinzman, L. D., and Kane, D. L.: Spring and aufeis (icing) hydrology in Brooks Range, Alaska, J. Geophys. Res.-Biogeo., 112, G04S43, https://doi.org/10.1029/2006JG000294, 2007.
Žák, K., Onac, B. P., and Perşoiu, A.: Cryogenic carbonates in cave environments: A review, Quat. Int., 187, 84–96, https://doi.org/10.1016/j.quaint.2007.02.022, 2008.
Zarga, Y., Ben Boubaker, H., Ghaffour, N., and Elfil, H.: Study of calcium carbonate and sulfate co-precipitation, Chem. Eng. Sci., 96, 33–41, https://doi.org/10.1016/j.ces.2013.03.028, 2013.