the Creative Commons Attribution 4.0 License.
the Creative Commons Attribution 4.0 License.
 | 21 Sep 2020
How much snow falls in the world's mountains? A first look at mountain snowfall estimates in A-train observations and reanalyses
Anne Sophie Daloz
Marian Mateling
Tristan L'Ecuyer
Mark Kulie
Norm B. Wood
Mikael Durand
Melissa Wrzesien
Camilla W. Stjern
Ashok P. Dimri
CloudSat estimates that 1773 km3 of snow falls, on average, each year over the world's mountains. This amounts to 5 % of the global snowfall accumulations. This study synthetizes mountain snowfall estimates over the four continents containing mountains (Eurasia, North America, South America and Africa), comparing snowfall estimates from a new satellite cloud-radar-based dataset to those from four widely used reanalyses: Modern-Era Retrospective analysis for Research and Applications (MERRA), MERRA-2, Japanese 55-year Reanalysis (JRA-55), and European Center for Medium-Range Weather Forecasts Re-Analysis (ERA-Interim). Globally, the fraction of snow that falls in the world's mountains is very similar between all these independent datasets (4 %–5 %), providing confidence in this estimate. The fraction of snow that falls in the mountains compared to the continent as a whole is also very similar between the different datasets. However, the total of snow that falls globally and over each continent – the critical factor governing freshwater availability in these regions – varies widely between datasets. The consensus in fractions and the dissimilarities in magnitude could indicate that large-scale forcings may be similar in the five datasets, while local orographic enhancements at smaller scales may not be captured. This may have significant implications for our ability to diagnose regional trends in snowfall and its impacts on snowpack in rapidly evolving alpine environments.
- Article
(2223 KB) - Full-text XML
- BibTeX
- EndNote


Falling snow transfers moisture and latent energy between the atmosphere and the surface. Snow impacts the surface radiant energy transfer by modifying albedo and emissivity. Accumulated snow can also act as a thermal insulator that modifies sensible heat fluxes and how surface temperature responds to changes in atmospheric conditions. Furthermore, it acts as a surface water storage reservoir (Rodell et al., 2018), providing seasonal runoff that provides freshwater supplies for both human populations and water-dependent ecosystems. Billions of people around the world depend on these resources. These water supplies are recognized as being at risk from climate change and rising global temperatures (Barnett et al., 2005; Mankin et al., 2015).
The advent of satellite-borne instruments capable of detecting falling snow and of reanalysis products that diagnose snowfall have made possible a global examination of how snowfall is distributed and its contribution to atmospheric and surface processes. Precipitation gauge measurements of snowfall for meteorological and hydrological purposes provide valuable data but have historically suffered shortcomings related to spatial sampling and gauge performance (Kidd et al., 2017). Shortcomings in the accuracy of such measurements and methods to improve that accuracy have been the focus of a number of studies (Goodison et al., 1998; Kochendorfer et al., 2018). Beyond accuracy issues, these gauge networks are necessarily of limited spatial coverage, potentially biasing climatologies over large domains. Coverage of ocean regions is not possible. Over land, gauges tend to be located near inhabited areas, leading to sparse or nonexistent coverage in more remote locations (Groisman and Legates, 1994). These remote locations include areas such as the high latitudes and mountains, where snowfall can be the dominant form of precipitation. Even when these areas have relatively dense gauge networks, such as the CONUS (contiguous United States) mountains, gridded datasets have their limitations, most notably gauge under catchment issues and large snowfall accumulation gradients in complex terrain that are often insufficiently sampled by existing in situ networks (Henn et al., 2018).
Given these shortcomings in snowfall surface observations, studies on snowfall in remote locations commonly rely on reanalyses (e.g., Bromwich et al., 2011). Reanalyses utilize numerical weather prediction models to integrate observations of large-scale geophysical fields (e.g., temperature and water vapor). One strength of reanalysis datasets is their continuous spatial and temporal coverage. However, the veracity of reanalysis snowfall datasets depends strongly on the underlying model and the assimilated datasets, which often exhibits systematic and varied biases (Daloz et al., 2018). In addition, their low spatial resolutions can be a limitation especially in regions of complex topography, and reanalyses should therefore be used with caution. For example, Wrzesien et al. (2019) showed that reanalyses have large biases in terms of snow water equivalent (SWE) over North America. Wang et al. (2019) compared the European Centre for Medium-Range Weather Forecasts (ECMWF) Reanalysis 5th generation (ERA5) and ERA-Interim snowfall estimates over Arctic sea ice and showed higher snowfall in ERA5 compared to ERA-Interim, resulting in a thicker snowpack for ERA5. Orsolini et al. (2019) focused on the Tibetan Plateau and evaluated snow depth and snow cover estimates from reanalyses (ERA-5; ERA-Interim; Japanese 55-year Reanalysis, JRA-55; and Modern-Era Retrospective analysis for Research and Applications 2, MERRA-2), in situ observations and satellite remote sensing observations. They showed that reanalyses can represent the snowpack of the Tibetan Plateau but tend to overestimate snow depth or snow cover. Snow accumulation measurements from automatic weather stations are compared to reanalysis datasets (ERA-Interim and National Center for Environmental Prediction-2, NCEP-2) over the Ross Ice Shelf in Antarctica in Cohen and Dean (2013). While both reanalysis datasets miss a number of accumulation events, ERA-Interim is able to capture more events than NCEP-2. Liu and Magulis (2019) evaluated snowfall precipitation biases over high-mountain Asia in MERRA-2 and ERA-5. The results show that, at high altitudes, snowfall is underestimated in both reanalyses. In this current study, four reanalysis datasets will be examined: MERRA, MERRA-2, ERA_Interim and JRA-55.
As an alternative to reanalyses, snowfall rates can now be assessed using satellite observations (with sufficient spatiotemporal coverage) provided by CloudSat's Cloud Profiling Radar (CPR). CloudSat observations, nearly continuous since 2006 (Stephens et al., 2002, 2008), have been applied to produce near-global estimates of snowfall occurrence and intensity (Liu, 2008; Kulie and Bennartz, 2009; Wood and L'Ecuyer, 2018). The resulting datasets have been examined extensively from local to global scales (Liu, 2008; Kulie and Bennartz, 2009; Hiley et al., 2011; Palerme et al., 2014; Smalley et al., 2015; Chen et al., 2016; Behrangi et al., 2016; Norin et al., 2015; Milani et al., 2018; Lemonnier et al., 2019a, b). CloudSat has substantially extended the spatial extent of precipitation measurements compared to existing gauge or radar networks. In particular, these instruments have greatly enhanced the observations of light precipitation, including snowfall over oceans, over remote high-latitude regions and over inaccessible land areas (e.g., Behrangi et al., 2016; Milani et al., 2018; Smalley et al., 2015; Norin et al., 2017; Lemonnier et al., 2019a, b).
However, satellite-based retrievals also have inherent uncertainties related, for example, to their limited temporal coverage. For instance, they might miss some heavy events such as atmospheric rivers in western North America and South America (Ralph et al., 2005; Neiman et al., 2008; Viale and Nunez, 2011). Therefore, CloudSat snowfall retrievals have been extensively assessed against a wide range of independent ground-based measurements. Hiley et al. (2011) seasonally compared CloudSat snowfall estimates with Canadian surface gauge measurements, showing better results for higher versus lower latitudes – especially lower-latitude coastal sites. They speculated that the latitudinal differences might be due to CloudSat sampling (more observations at higher latitudes), snow microphysical differences associated with warmer snow events that could affect CloudSat estimates (e.g., wetter snow, rimed snow and/or mixed phase precipitation), or precipitation-phase identification issues associated with snow events in the 0–4 ∘C temperature range. CloudSat's 2C-SNOW-PROFILE (2CSP) product also displayed excellent light snowfall detection capabilities when compared against the National Multi-Sensor Mosaic QPE System (NMQ) dataset, a hydrometeorological platform that assimilates different observational networks. Still, CloudSat did not produce higher snowfall rates as frequently as NMQ (Cao et al., 2014). Further comparisons between CloudSat and the National Centers for Environmental Prediction (NCEP) merged NEXRAD and rain gauge Stage IV dataset illustrated consistent CloudSat–Stage IV performance when near-surface temperatures are below freezing (Smalley et al., 2014). The CloudSat 2CSP product was also compared to a ground-based radar network in Sweden, showing consistent agreement in the 0.1–1.0 mm h−1 snowfall rate range (Norin et al., 2015). However, 2CSP snowfall rate counts were lower above the 1 mm h−1 threshold. The 2CSP retrievals have also been rigorously compared to ground-based profiling radars in Antarctica, with CloudSat outperforming ERA-Interim grid-averaged results when MRR-derived retrievals are used as a reference dataset (Souverijns et al., 2018). Comparisons between CloudSat and existing reanalysis datasets are however scarce and mostly limited to the poles (Palerme et al., 2014, 2017; Milani et al., 2018; Behrangi et al., 2016). Together, these independent analyses provide confidence that CloudSat observations may deliver realistic accumulations on seasonal scales. The CloudSat snowfall dataset has also proven useful for isolating distinct modes of snowfall variability on global scales. For instance, over-ocean convective snow has been comprehensively studied using CloudSat products (Kulie et al., 2016; Kulie and Milani, 2018). CloudSat also exhibits enhanced snowfall observational capabilities in mountainous regions compared to ground-based radar networks, partially due to scanning radar beam blockage issues (Smalley et al., 2014).
In spite of the noted shortcomings in snowfall datasets from gauges, radar and reanalyses, mountain snowfall has not yet been thoroughly studied using multiple reanalyses and the CloudSat dataset. In this study, we derive mountain snowfall from five datasets (CloudSat 2CSP, MERRA, MERRA-2, ERA-Interim and JRA-55) to answer the following questions.
-
How much snow falls on the world's mountains?
-
What percentage of continental snow falls on mountainous regions?
Given the challenges in retrieving snowfall from single-frequency radar observations, especially in complex terrain, the CloudSat estimates are not treated as the “reference” dataset, though we note that they are the only estimates derived directly from observations. All five sources are treated as providing valid independent estimates of the fraction of snow that falls in mountainous compared to all continental regions to document the current state of knowledge in this field. The next section presents the different datasets employed in this study, as well as methodological information such as the mountain and continental masks. Section 3 compares mountain snowfall fraction and magnitudes between the different datasets, while the following section (Sect. 4) discusses the differences in absolute magnitude of snowfall estimates. Finally, Sect. 5 summarizes the results of this study and offers concluding remarks.
2.1 Satellite observations
For this work, the CloudSat data are spatially gridded onto a (lat × long) grid. The nadir-pointing CPR onboard NASA's CloudSat satellite is the first spaceborne W-band (94 GHz) radar. CloudSat's high inclination orbit (98∘) provides a unique coverage of observed global snowfall (Kulie et al., 2016). In addition to providing near-global sampling, the CPR has a minimum detectable radar reflectivity of approximately −29 dBZ and is consequently sensitive to lighter precipitation events (Tanelli et al., 2008). The CPR has a fixed field of view pointed at near-nadir and measures over a spatial resolution of approximately 1.7 km along-track and 1.4 km cross-track (Tanelli et al., 2008). The orbit is such that CloudSat revisits particular locations every 16 d. While this observing strategy limits sampling on short timescales, CloudSat has observed more than 120 million snowing profiles over its 10+-year mission, providing a rich dataset from which to derive snowfall frequency and cumulative snowfall over the large domains analyzed here. CloudSat data are available from 2007.
CloudSat's 2CSP snowfall product, version R04 (Wood et al., 2013), provides estimates of instantaneous surface snowfall rates (S) for each of these pixels derived from the observed vertical profiles of radar reflectivity (Z). A version R05 is now available; however, the snow retrieval status variable is evaluated in the same way in the two versions of the product. The global snowfall amount is very similar in R04 and R05; therefore, the results should only differ slightly with the new version of CloudSat. The data are spatially gridded onto a (lat × long) grid to ensure robust sampling by the narrow CloudSat ground track. This means that the satellite data are sampled onto the spatial grid desired and then averaged within each grid. The product derives instantaneous data twice per month from an optimal estimation retrieval (Rodgers, 2000). They are then applied to individual reflectivity profiles to obtain vertical profiles of snow microphysical properties. Ground clutter affects radar bins nearest the surface, so the retrieval is applied only to the clutter-free portion of the profile, i.e., that portion of the profile that is above the extent of likely ground clutter effects, typically about 1.2 km over land. Surface snowfall rate is estimated as the rate in the lowest clutter-free radar bin. The cumulative snowfall presented here are thus not true surface snowfall rates. Grazioli et al. (2017) compared the vertical profile of precipitation from the ECMWF Integrated Forecasting System (IFS) model with satellite-borne radar measurements. They showed some noticeable differences between the different datasets in the vertical structure. Clutter limits CloudSat's ability to detect shallow snow events or capture strong variations in snow profiles near the surface (Maahn et al., 2014; Souverijns et al., 2018; Palerme et al., 2017). While this introduces uncertainty in the snowfall estimates presented here, the analysis of ground-based vertically pointing radar in East Antarctica and in Svalbard (Norway) by Maahn et al. (2014) shows that the effects of this observing system limitations may be compensated by the competing effects of evaporation and undetected shallow snowfall. It should also be noted that on 1 November 2011 there was a change in CloudSat's operating mode, leading to daytime-only operations, which can lead to some uncertainty in the snowfall estimates.
Snow and rain are discriminated based on the CloudSat 2C-PRECIP-COLUMN product (Haynes et al., 2013), which applies a melting-layer model driven by the ECMWF analyses temperature profiles. Snow particles are assumed to melt following the model of melted mass fraction described by Haynes et al. (2009). All profiles with melted fractions less than about 15 % at the surface (< 1.2 km) are considered snowing. Those with melted fractions greater than 90 % are considered raining. Melted and frozen fractions between 15 % and 90 % are labeled as being in the “mixed” category, which is considered to be a catch-all uncertainty for profiles that cannot be unambiguously classified as rain or snow using W-band reflectivity alone. Only snowing profiles are considered in this study.
2.2 Reanalyses
This study also considers four modern reanalyses: MERRA, MERRA-2, ERA-Interim and JRA-55. MERRA (Rienecker et al., 2011; levels) uses the Goddard Earth Observing System version 5 (GEOS-5) and the data assimilation system (DAS). MERRA-2 (Gelaro et al., 2017; Bosilovich et al., 2015; levels) was recently introduced to replace MERRA. ERA-Interim (Dee et al., 2011; levels) is developed by the ECMWF. ERA-Interim replaced the previous reanalysis dataset from the ECMWF, ERA-40. The Japanese Meteorological Agency (JMA) has recently developed their second reanalysis dataset after JRA-25: JRA-55 (Kobayashi et al., 2015; levels). Both MERRA (Rienecker et al., 2011) and MERRA-2 (Gelaro et al., 2017) use 3D variational assimilation systems, where JRA-55 (Kobayashi et al., 2015) and ERA-Interim (Dee et al., 2011) use 4D. The spatial and temporal modeling of snowfall alone is different in these reanalyses, as are some of the physical mechanisms within. The MERRA-2 reanalysis is based on an updated version of the GEOS-5 atmospheric model. Reichle et al. (2017) showed that the snow amounts are generally better represented in MERRA-2 than MERRA. However, MERRA-2 precipitation has a known deficiency over high topography due to issues in categorizing precipitation mode as large-scale instead of convective (Gelaro et al., 2017). The results from these previous studies make the comparison between MERRA and MERRA-2 particularly interesting in this case. JRA-55 assimilates the same observations that were used for the predecessor to ERA-Interim, ERA-40, as well as archived observations from JMA. Both JRA-55 and ERA-Interim use their own forecast models.
CloudSat has not been assimilated in any of the four reanalyses, thus it can be considered independent. All datasets used in this study are bilinearly interpolated from their native resolution to match the (lat × long) grid of CloudSat. The data are examined over the time period 2007–2016 with a monthly temporal resolution. The production of MERRA data ended in February 2016, as MERRA-2 is now the preferred dataset, while CloudSat started in 2007.
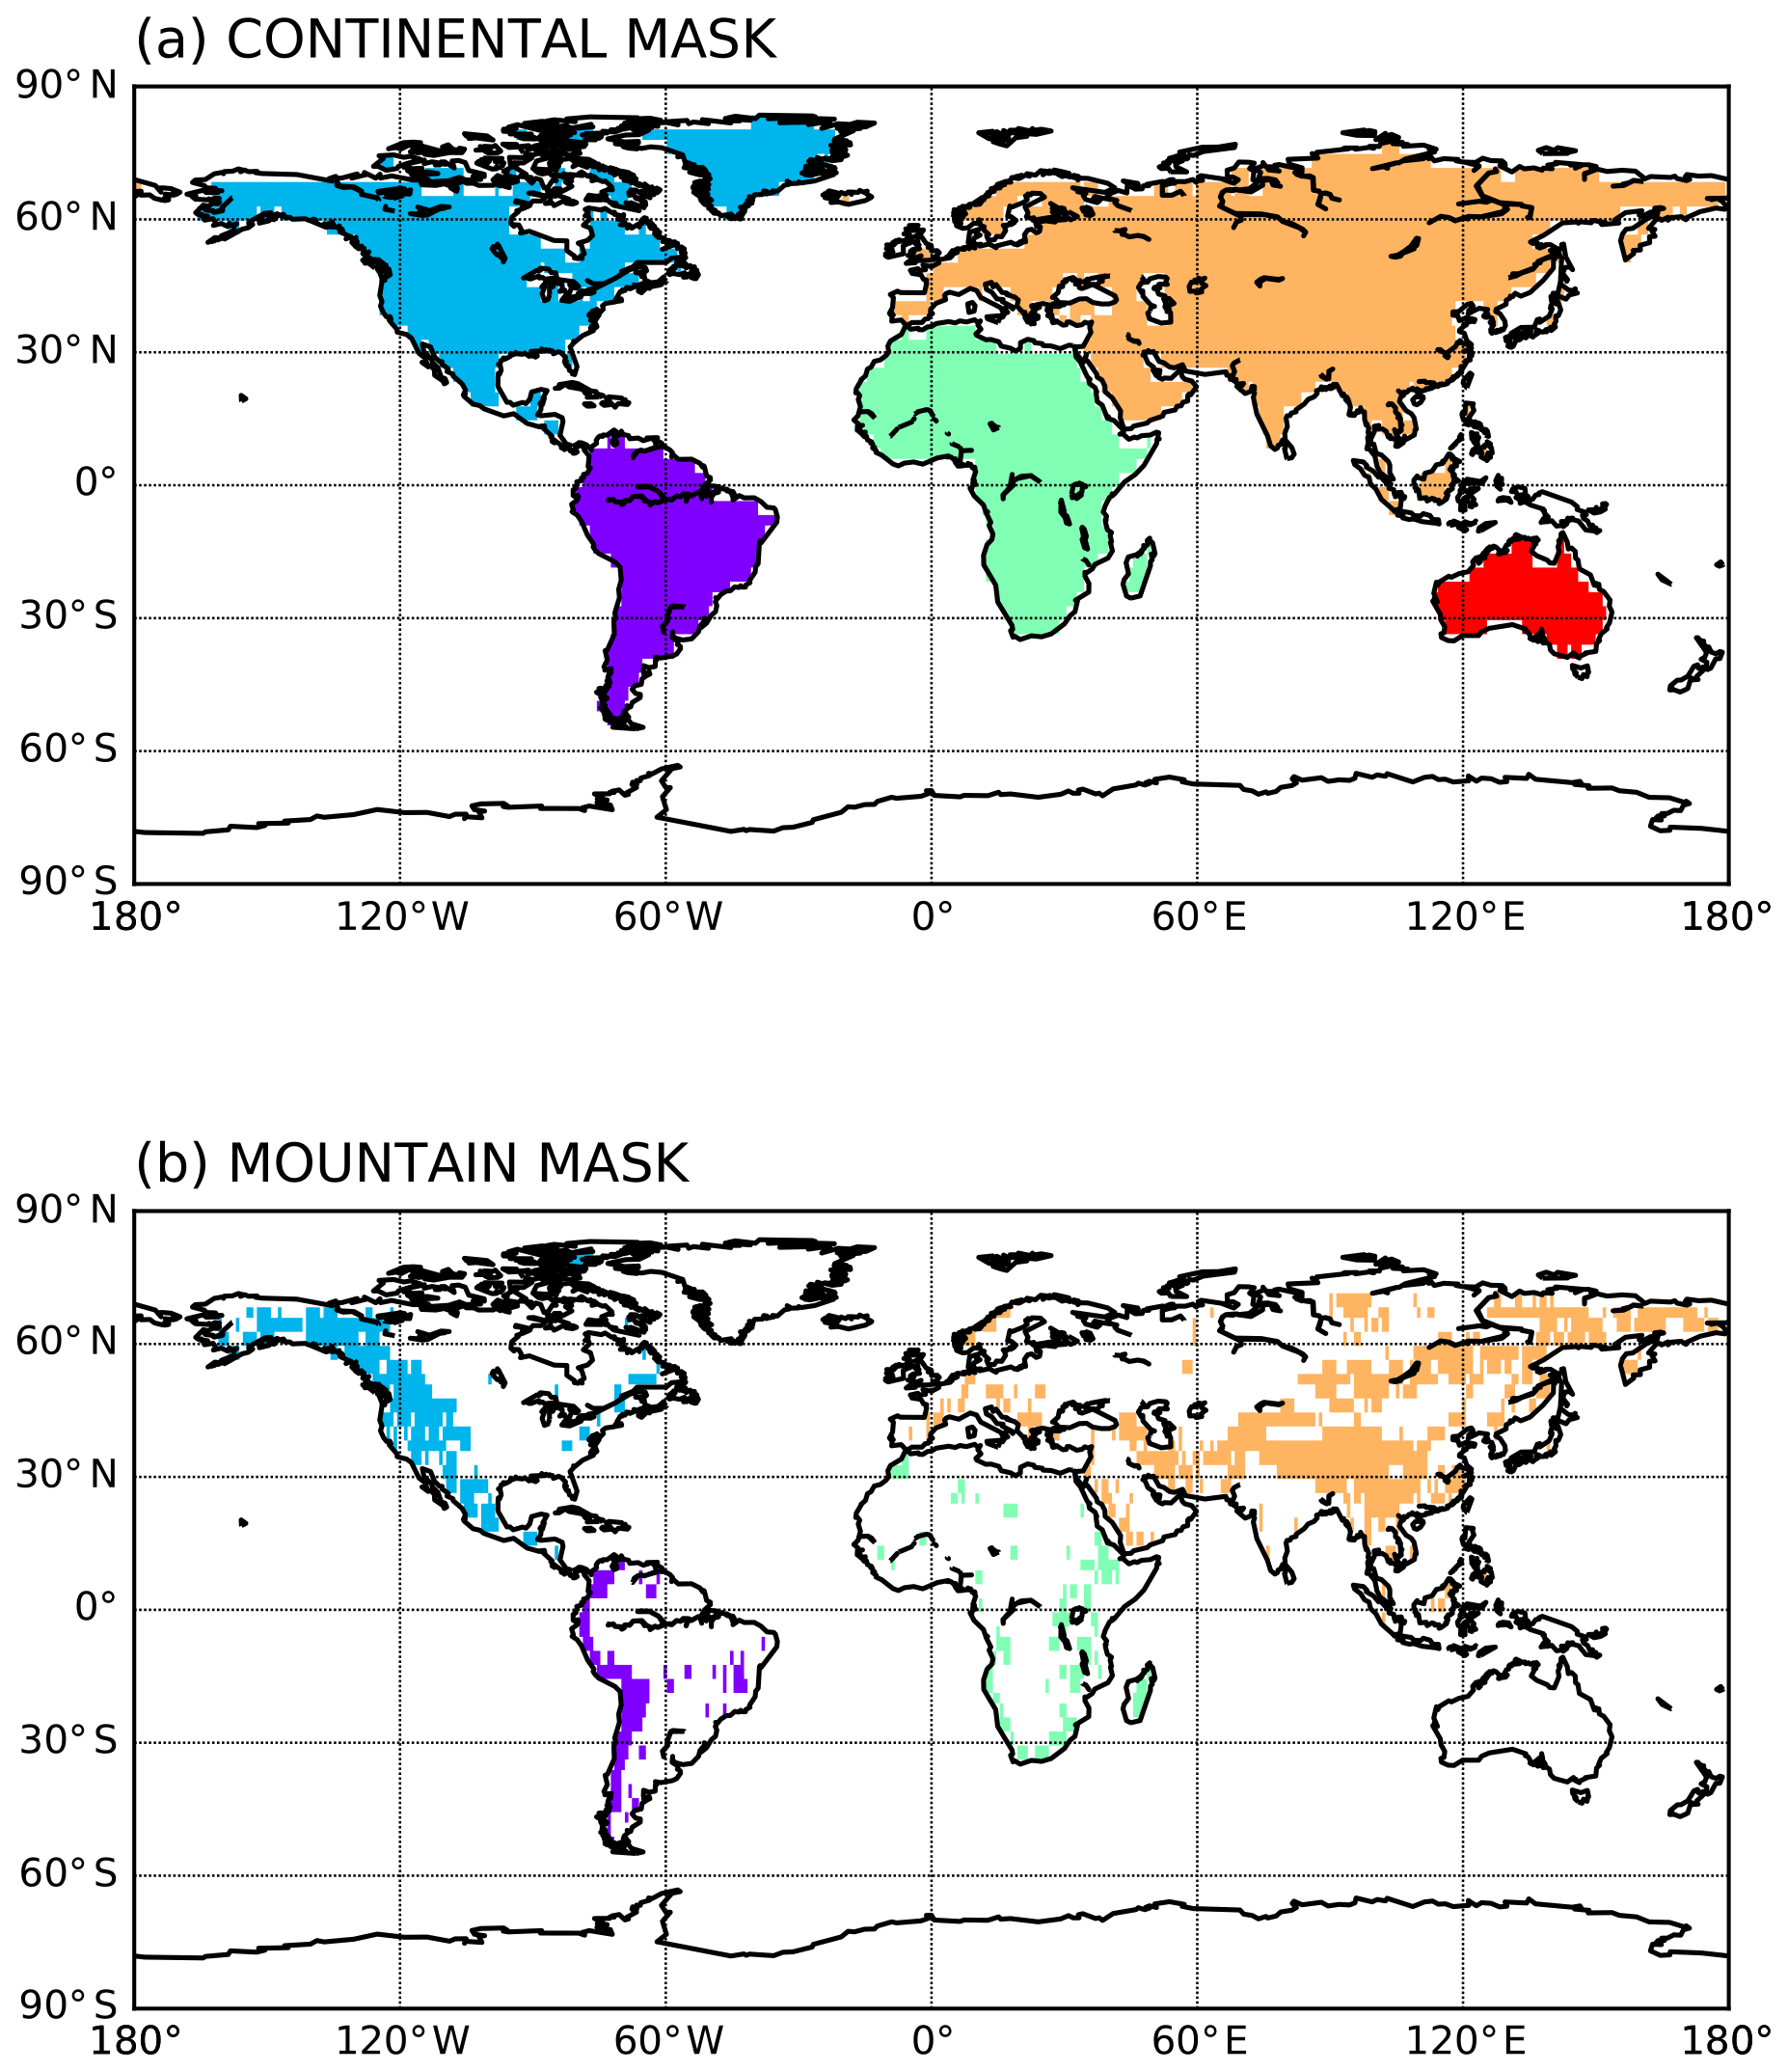
Figure 1Spatial maps of the continental mask (a) with specific colors for each continent: blue for North America, pink for South America, orange for Eurasia, green for Africa, red for Australia and white for Antarctica. The associated mountain mask (b) for each continent containing mountains.
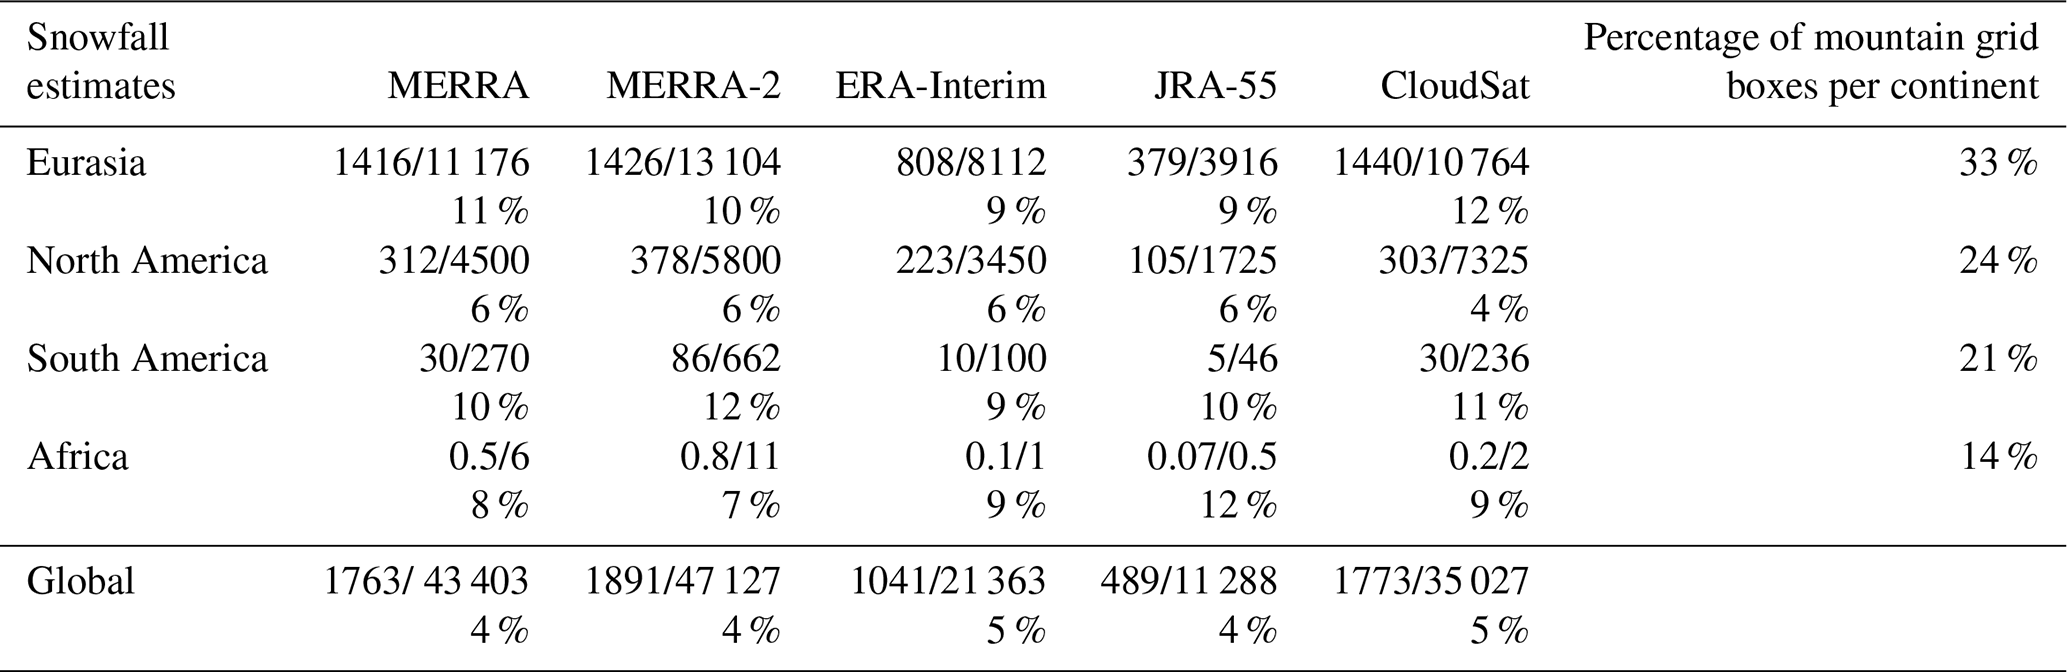
Table 1The table summarizes the snowfall estimates of mountain and non-mountain snowfall for MERRA, MERRA-2, ERA-Interim, JRA-55 and CloudSat, for the time period 2007–2016, for Eurasia, North America, South America, Africa and globally. Global snowfall is the cumulative snow falling over all land in the world, which includes the four continents already cited plus Greenland, Australia and Antarctica. For each area and dataset, a table cell shows: the amount of mountain (top left), non-mountain snow (top right, km3 yr−1) and the contribution of mountain snow to the total amount of snow falling over a continent (bottom, %). The last column shows the percentage of grid boxes considered to be mountain by the mountain mask over each continent.
2.3 Masks and definitions
Snowfall estimates from all sources are partitioned between the different continents using the “continental mask” shown in Fig. 1a. The continental mask was first used in L'Ecuyer et al. (2015). Following this, the mountain and non-mountain regions are separated using the “mountain mask” presented in Fig. 1b. Based on the Kapos et al. (2000) definition, grid cells are classified as mountainous based on elevation, slope and local elevation range. They used the global digital elevation model GTOPO30 and ARC-INFO to identify areas above particular altitudes and generate grids containing the slope and the local elevation range, and then they combined these variables, with adapted criteria, to define mountainous regions. The original mask was produced using with a spatial resolution of 30 arcsec (∼ 1 km). Our version of the mountain mask has been aggregated to (lat × long) grid to match the spatial resolution of the gridded CloudSat 2SCP. The combination of these two masks is used to subdivide the snowfall estimates over the four continents that contain mountains: North America, South America, Eurasia and Africa.
In this article, total mountain snowfall is equal to the cumulative snow falling over North America, South America, Africa and Eurasia. Greenland and Antarctica are considered ice sheets and therefore do not qualify as continents with mountains. Global snowfall is the cumulative snow falling over all lands in the world, which includes the four continents already cited plus Greenland, Australia and Antarctica.
3.1 Global spatial distribution of mountain snowfall
Table 1 shows the snowfall estimates for mountain and non-mountain snowfall for CloudSat and the reanalyses, over each continent and globally. According to CloudSat observations, 1773 km3 of snow falls over global mountains per year. This number is an average over the volume of snow falling during the time period from 2007 to 2016. From CloudSat estimates, 5 % of global snowfall is within mountainous areas. It is encouraging that the fraction of snow falling in the mountains occupies a narrow range from 4 % for MERRA's reanalyses and JRA-55 to 5 % for ERA-Interim and CloudSat. This good agreement between the different datasets (Table 1) allows us to state with some confidence that 5 % of all continental snow falls in the mountains globally. In the reanalyses, while the fraction of snow within the mountains is similar across all datasets, the amount of snow falling over the mountains varies depending on the dataset examined (see Table 1). MERRA and MERRA-2 global mountain snowfall estimates are close to CloudSat with 1763 and 1891 km3 yr−1, respectively, while ERA-Interim and JRA-55 show much lower amounts, with 1041 and 489 km3 yr−1, respectively.
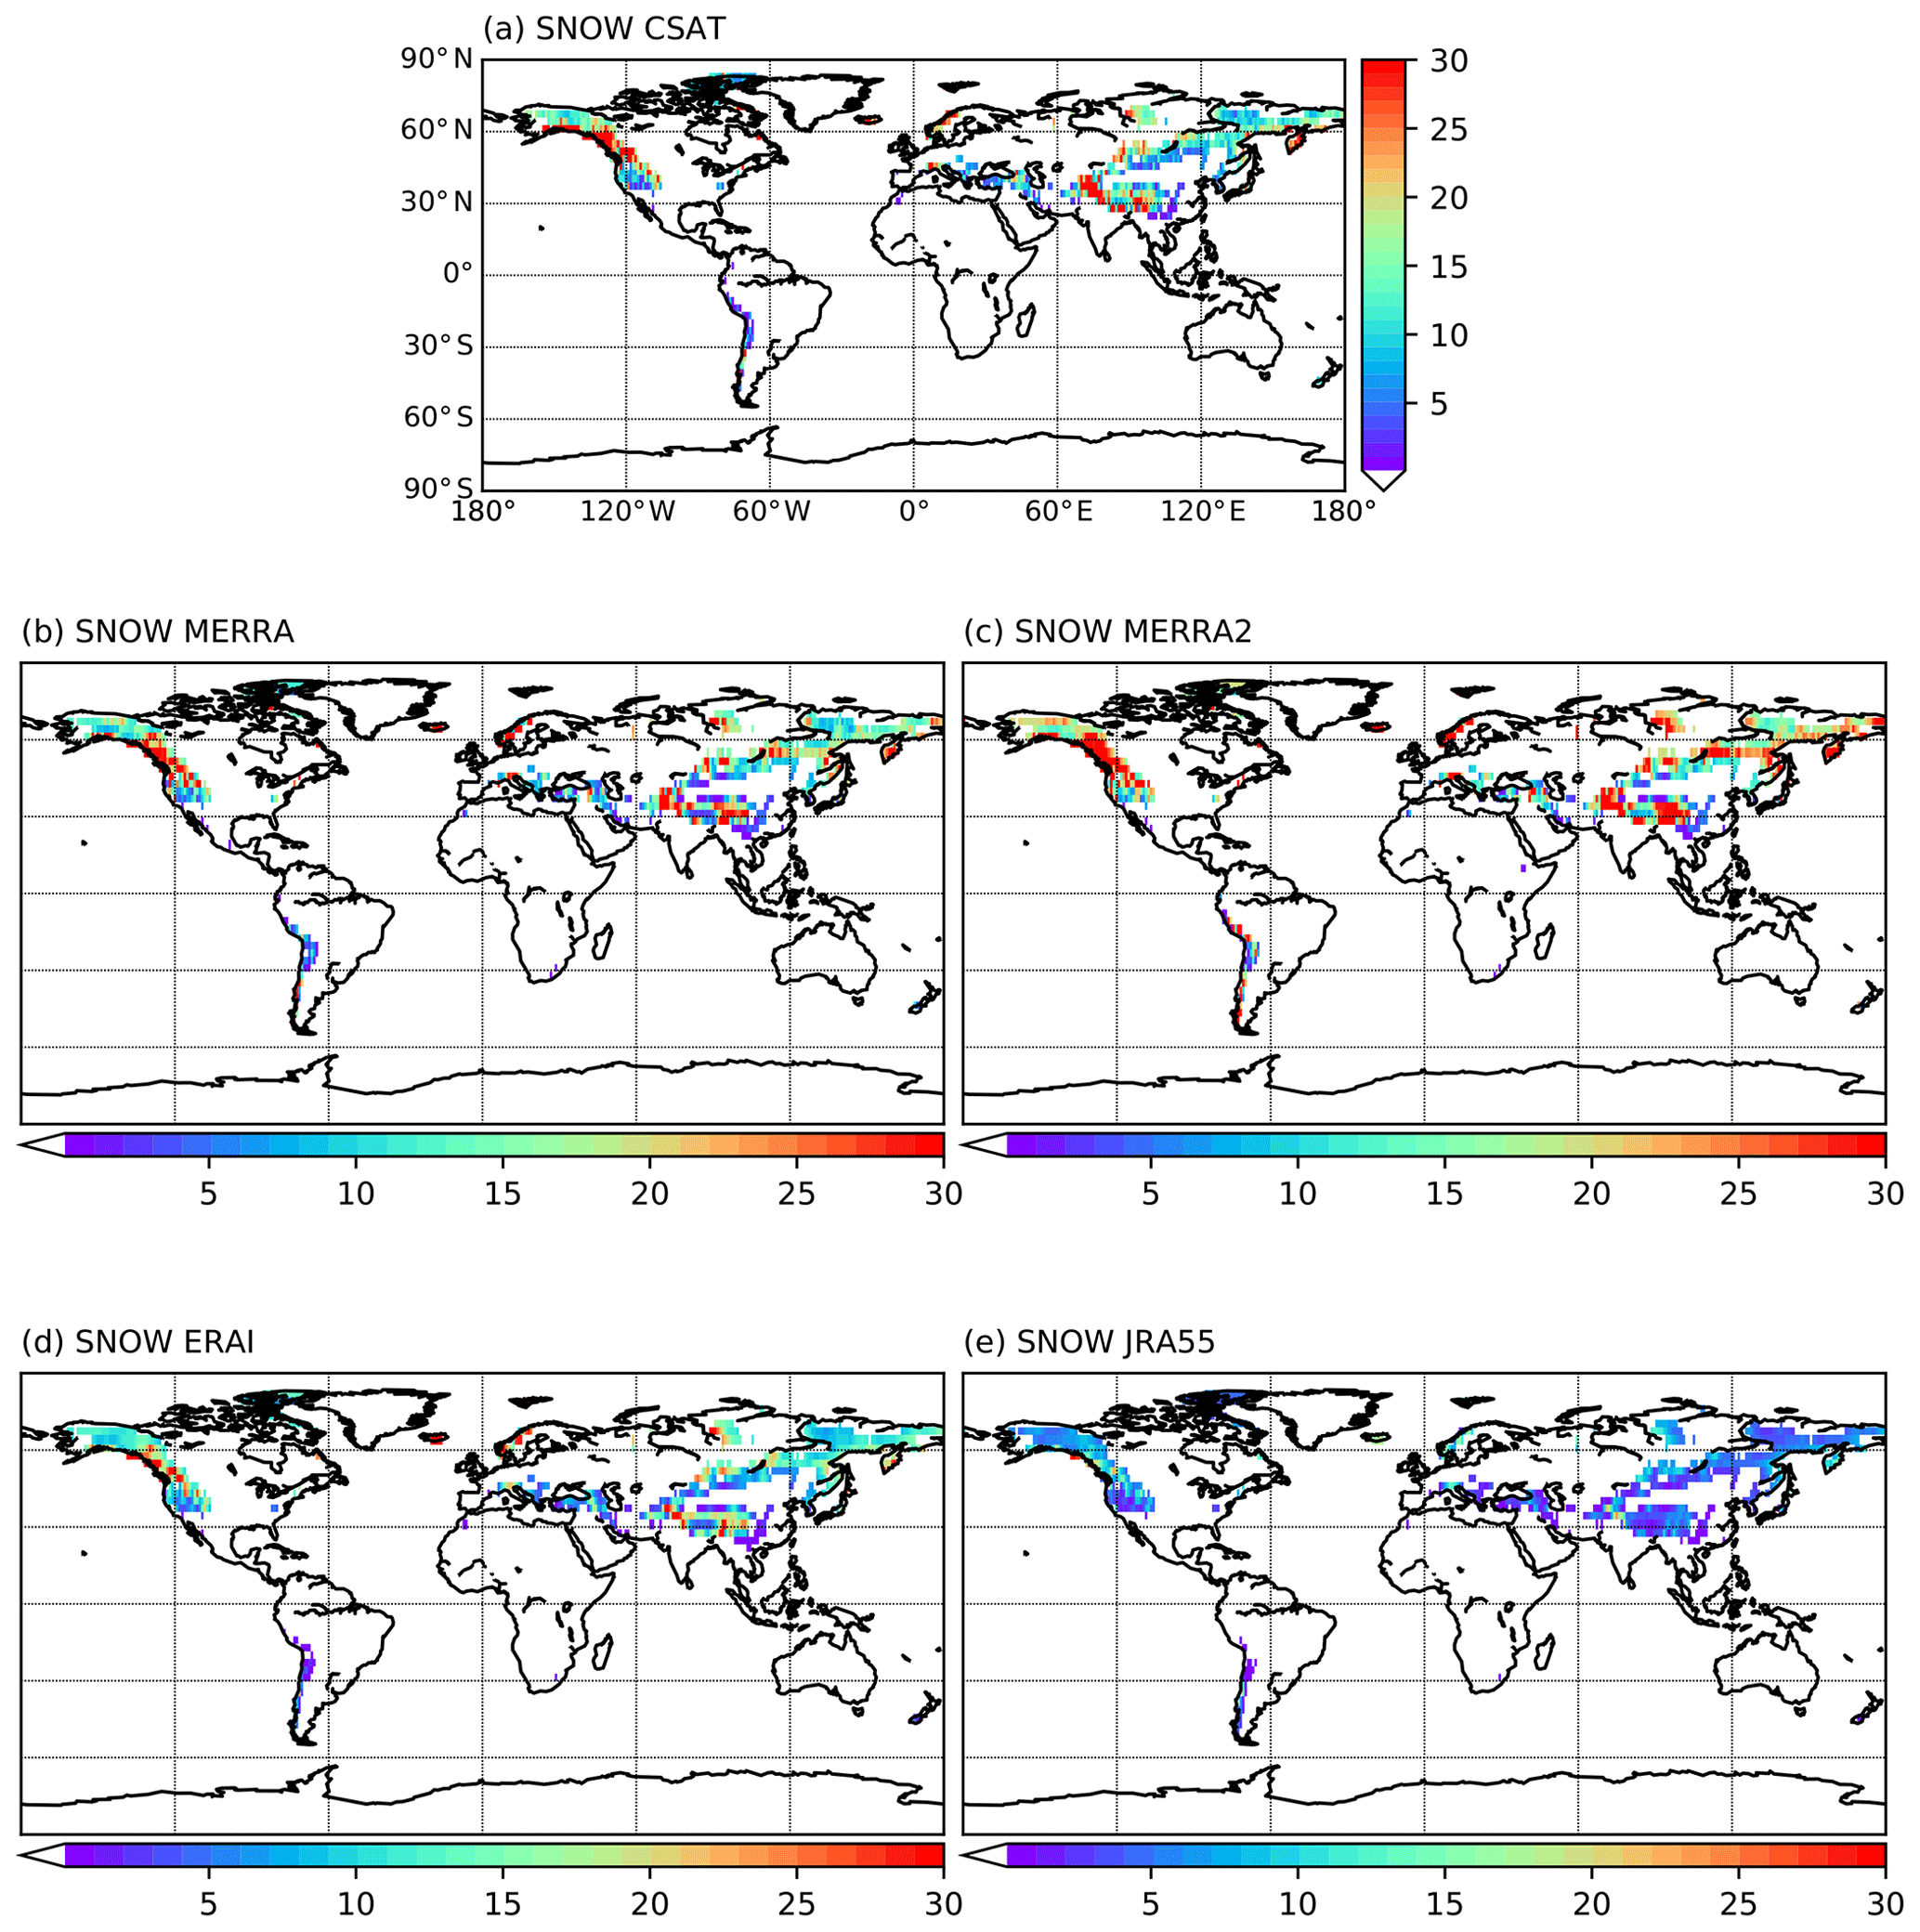
Figure 2Spatial maps of global cumulative mountain snowfall (millimeters per month per grid box) for (a) CloudSat, (b) MERRA, (c) MERRA-2, (d) ERA-Interim and (e) JRA-55, averaged over the time period 2007–2016.
To visualize where the snow is falling, Fig. 2 presents the geographical distribution of the mountain snowfall estimates in CloudSat and the reanalyses. As expected, in all datasets a majority of the mountain snow falls in the Northern Hemisphere (Himalayas and Rockies; 95 %–99 %), with little snowfall (< 5 %) in the Southern Hemisphere. The geographical patterns exhibited by MERRA, MERRA-2 and CloudSat seem to resemble each other, while ERA-Interim and JRA-55 tend to show different geographical distributions with generally lower snow rates. However, when focusing on specific regions, we can see that MERRA-2 also has major differences compared to MERRA and CloudSat: for example, over South America or eastern Russia, MERRA-2 produces much more snow than all the other datasets. Another interesting difference appears when comparing the datasets over North America versus Asia. ERA-Interim has higher snow rates in the Rockies compared to the Himalayas, while for the other datasets they are comparable. To go deeper into the comparison of the datasets, Fig. 3 presents the differences in geographical distribution of mountain snowfall between CloudSat and the reanalyses over high-mountain Asia. This figure clearly shows very large differences between CloudSat and the reanalyses, reaching ±10 mm per month per grid box at some locations. In general, both ERA-Interim and JRA-55 present much lower snow accumulations compared to CloudSat. On the other hand, MERRA and MERRA-2 present lower snow accumulations on the southern part of the domain and higher accumulations on the northern part. These differences in snowfall distribution have major implications in terms of mountain runoff, and millions of people in the surrounding regions depend on these resources. The systematically lower mountain snowfall estimates in ERA-Interim and in JRA-55, as well as the tendency for MERRA-2 to produce higher mountain snowfall rates over some continents, will be further discussed below.
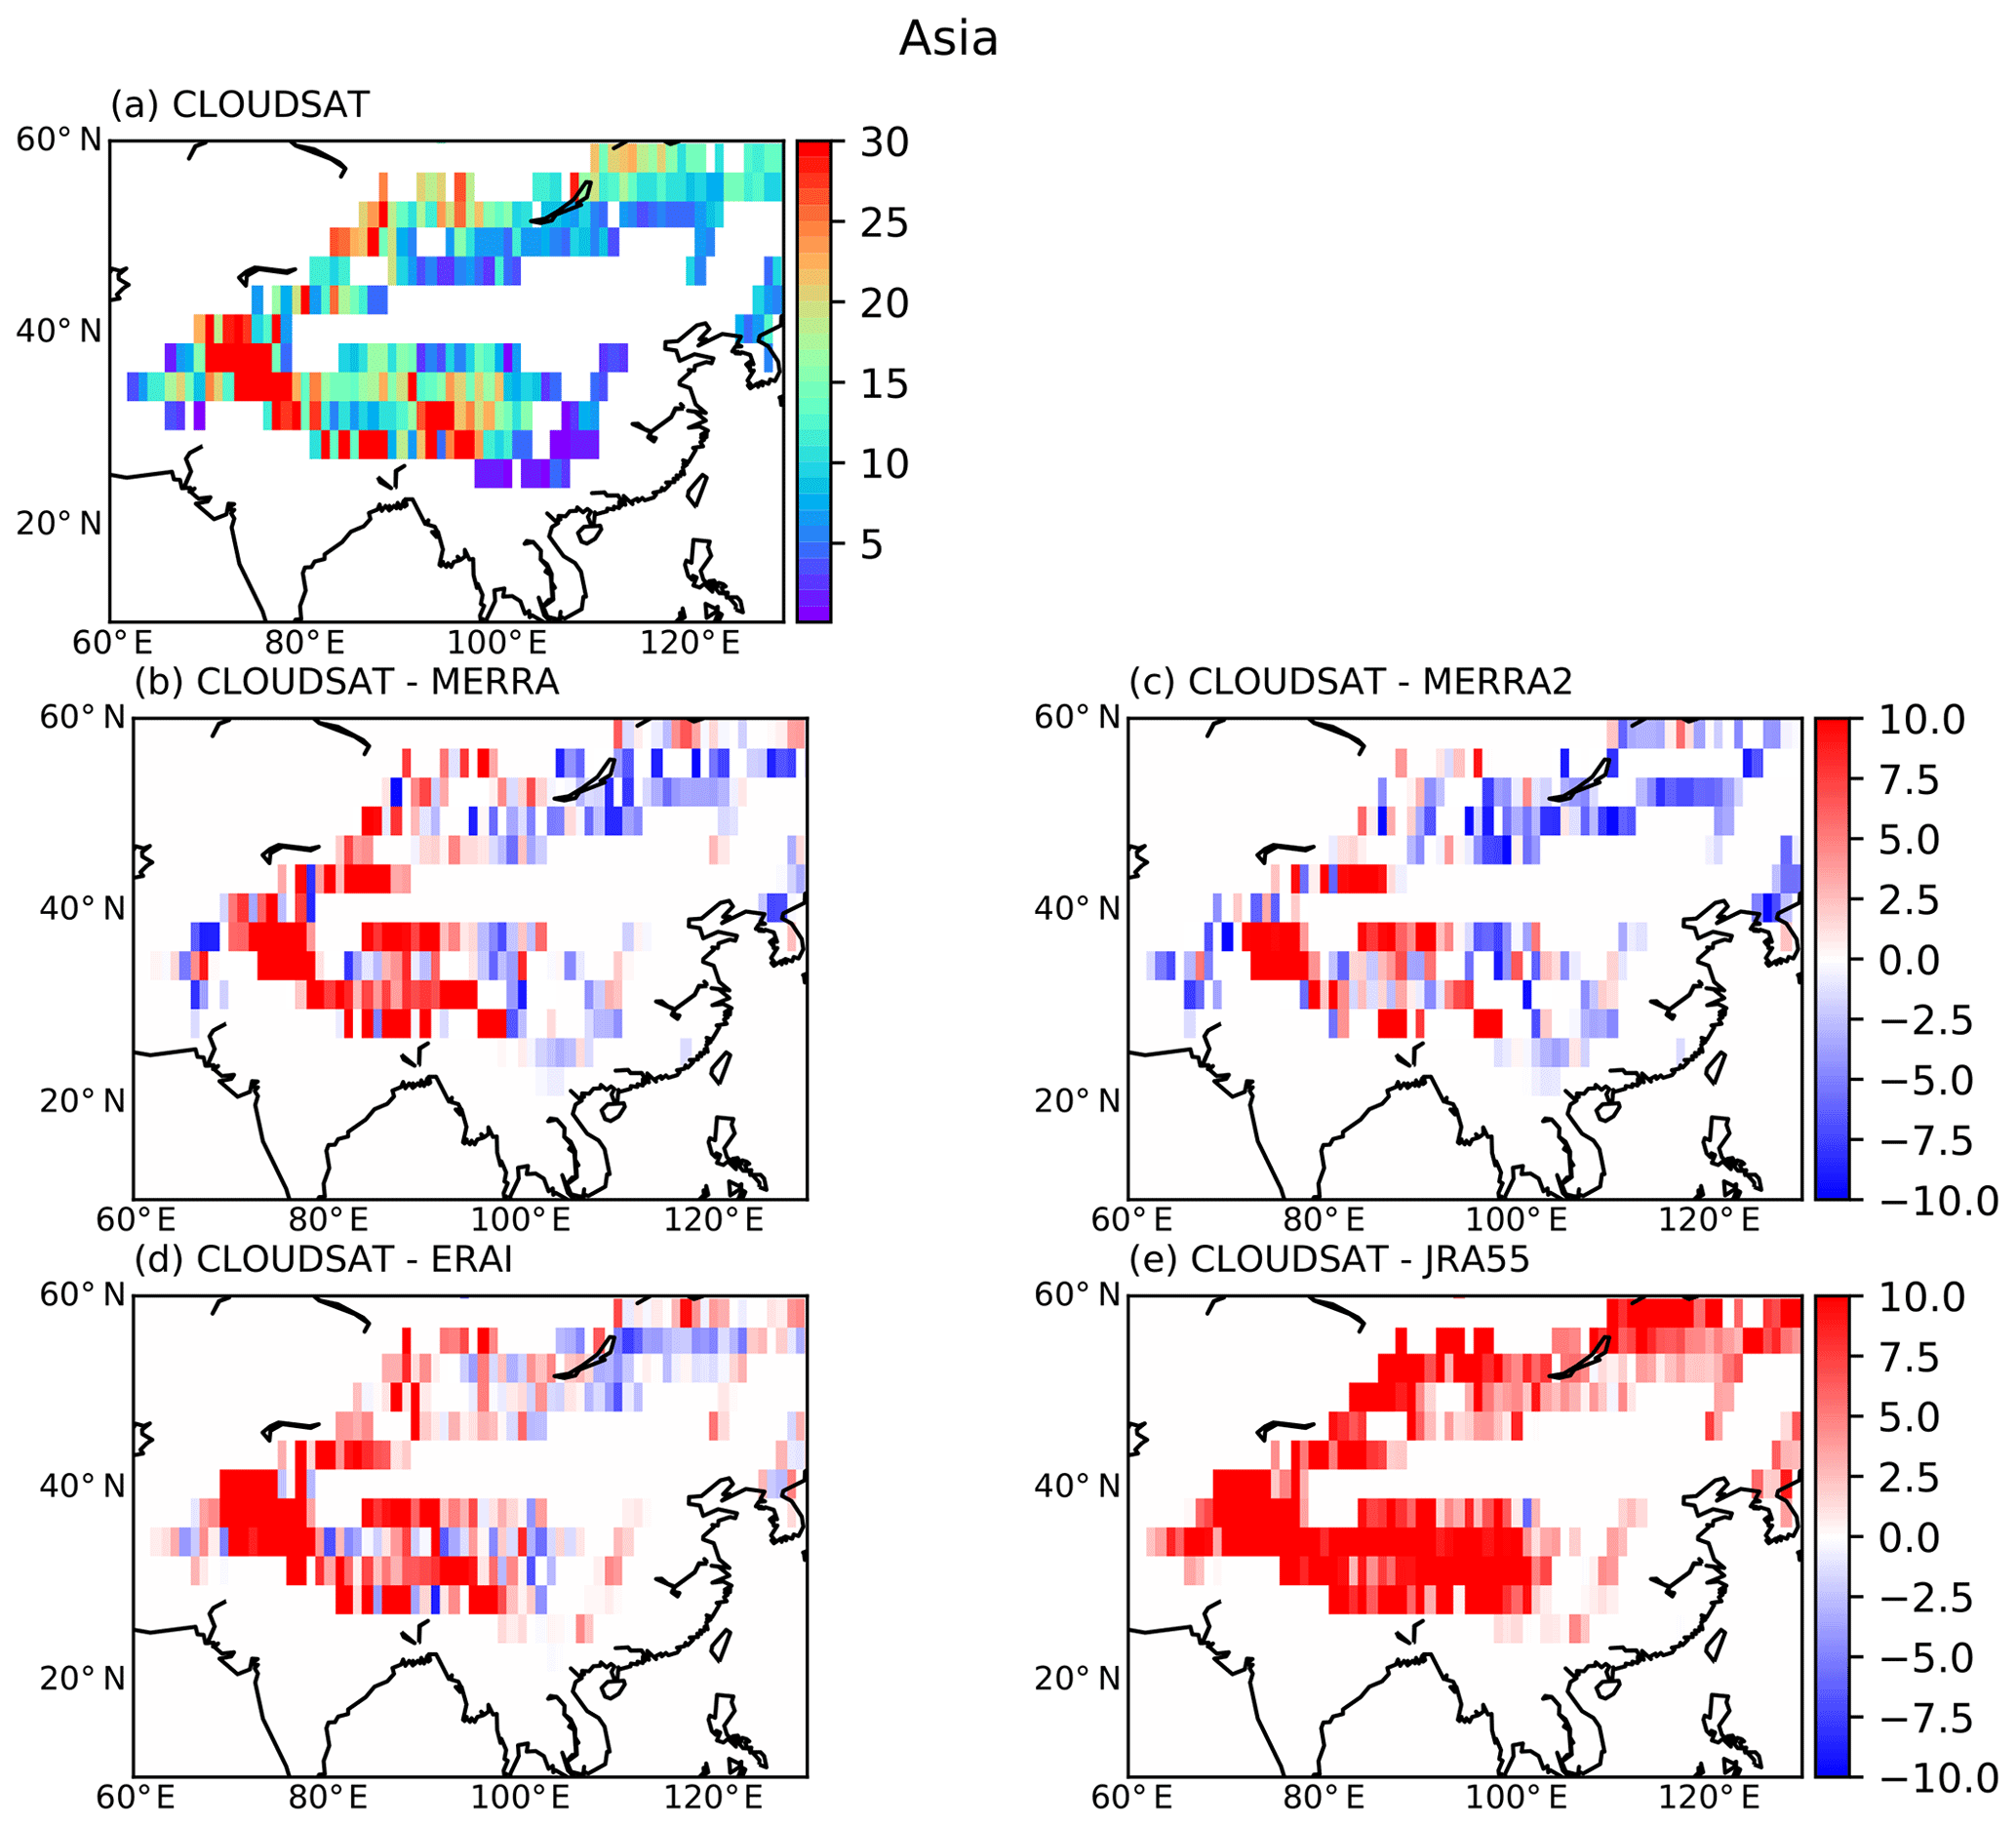
Figure 3Spatial maps of the global cumulative mountain snowfall (millimeters per month per grid box) over high-mountain Asia for (a) CloudSat, (b) CloudSat minus MERRA, (c) CloudSat minus MERRA-2, (d) CloudSat minus ERA-Interim and (e) CloudSat minus JRA-55 over the time period 2007–2016.
3.2 Contribution of mountain snowfall to continental snowfall
Table 1 also shows the contribution of mountain snowfall to total snowfall for CloudSat and each reanalysis over each continent. To get a better sense of the contribution of orography to snowfall, the percentage of mountainous grid points over each continent is provided in the last column of the table. Eurasia has the highest fraction of mountainous grid boxes with 33 % of its grid boxes considered mountains. North America and South America have a quarter of their grid boxes covered with mountains, and only 14 % of the African continent is considered mountainous. The contribution of mountain snowfall does not vary substantially between continents. For Eurasia, South America and Africa it is around 10 %, while for North America it represents around 5 % of the snow falling over the continent. Over all the continents, the agreement between the reanalyses and CloudSat observations is very good, with differences under 4 %.
Coherently with the previous section, the magnitude of mountain snowfall estimates over the four continents varies a lot depending on the datasets examined. MERRA's datasets and CloudSat present a similar magnitude in terms of mountain and continental snowfall, while ERA-Interim and JRA-55 present much lower estimates than the other datasets. For example, over Eurasia the values for mountain snowfall vary between 379 and 1440 km3 yr−1 for JRA-55 and CloudSat, respectively. Over North America, it varies from 105 km3 yr−1 for JRA-55 to 378 km3 yr−1 for MERRA-2, and for South America it varies from 5to 86 km3 yr−1 for JRA-55 and for MERRA-2, respectively. Unfortunately, the high range of differences observed for mountain snowfall also applies for the magnitude of total snowfall over each continent. In all cases, JRA-55 shows the lowest magnitude estimates and MERRA-2 the highest. It is also interesting to point out that CloudSat is always part of the higher range of snowfall estimates for each continent. Due to its limited temporal coverage, it might be missing some heavy snow events, such as atmospheric rivers in western North America (Rutz and Steenburgh, 2012; Lavers and Villarini, 2015; Molotch et al., 2010). These few events contribute to a large part of the water year precipitation, but as the analysis has been done over several years, this should have a limited impact on the total accumulated snow.
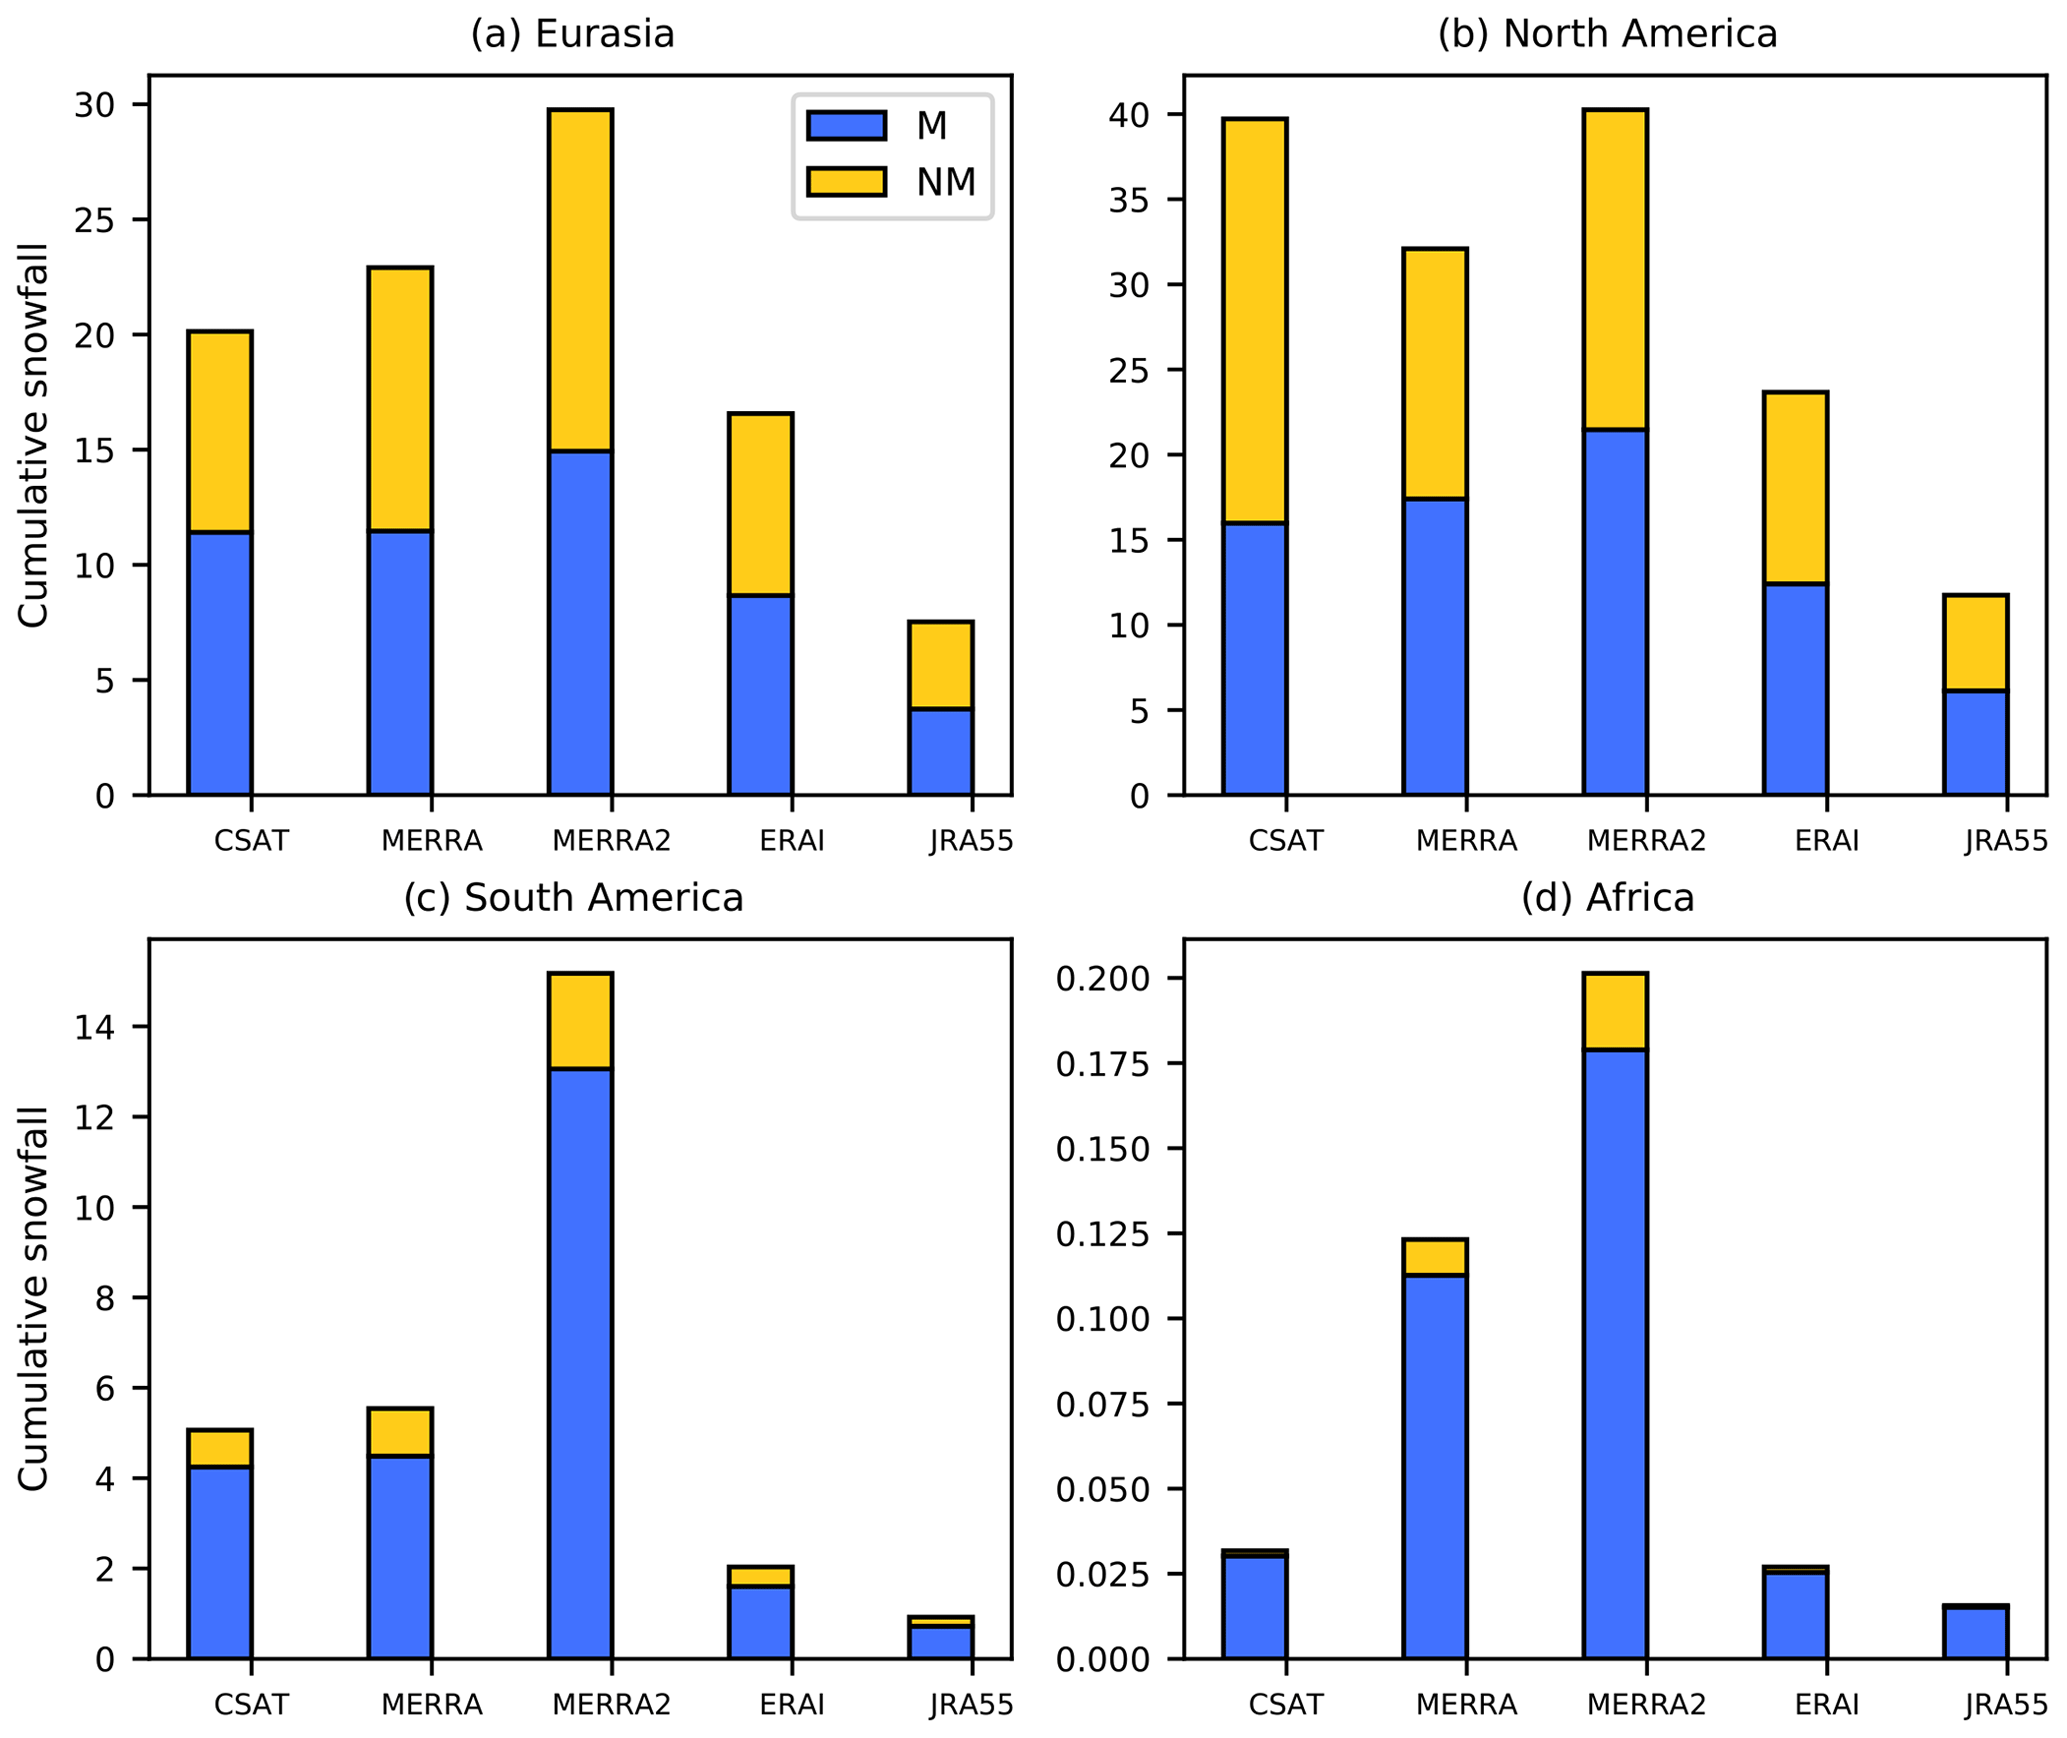
Figure 4Snowfall estimates (millimeters per month per grid box) over (a) Eurasia, (b) North America, (c) South America and (d) Africa for CloudSat, MERRA, MERRA-2, ERA-Interim and JRA-55 over the time period 2007–2016. Mountain snow is in blue, and non-mountain snow is in yellow.
The previous section showed a very good agreement between all the datasets in terms of mountain snowfall fractions. However, the spatial maps presented in Fig. 2 and the absolute snowfall amounts in Table 1 showed substantial differences in magnitude between the different datasets. This is further demonstrated in Fig. 4, which summarizes the snowfall estimates in a millimeters per month per grid box over Eurasia, North America, South America and Africa and its partitioning between mountainous (blue) and non-mountainous areas (yellow) for the five datasets. To ease the comparison between the different datasets, here the snowfall amounts are normalized by the number of mountain and non-mountain grid boxes. There is some consistency in the relative behavior of the various datasets between the regions. Consistent with the results in Sect. 3, JRA-55 always has the lowest estimates of snowfall per grid box (see Table 1). For example, over North America and Eurasia, JRA-55 produces 68 % less snowfall than the average of the four other datasets (Fig. 4). Even so, when looking at Fig. 5, which presents the frequency of snowfall occurrences for each continent for all datasets, the frequency of snowfall occurrences for JRA-55 is very close to the other products. This indicates that JRA-55 underestimates the intensity of many snowfall events. ERA-Interim also tends to be on the lower end of the spectrum concerning snowfall compared to the other datasets (Fig. 4). This can be at least partly attributed to its systematic lower frequency of snowfall occurrences (see Fig. 5). With the exception of North America, MERRA-2 generally has the highest total snowfall compared to the other datasets (Fig. 4). Again, this is consistent with the results shown in the previous section. This overestimate is related to the way this dataset represents the frequency of snowfall events. MERRA-2 produces much more snowfall events than the other datasets (see Fig. 5). This bias might be similar to the bias identified for precipitation in climate models, producing too frequent and too lightly precipitating events, referred to as “perpetual drizzle” (Stephens et al., 2010). This could be happening for snowfall events in MERRA-2.
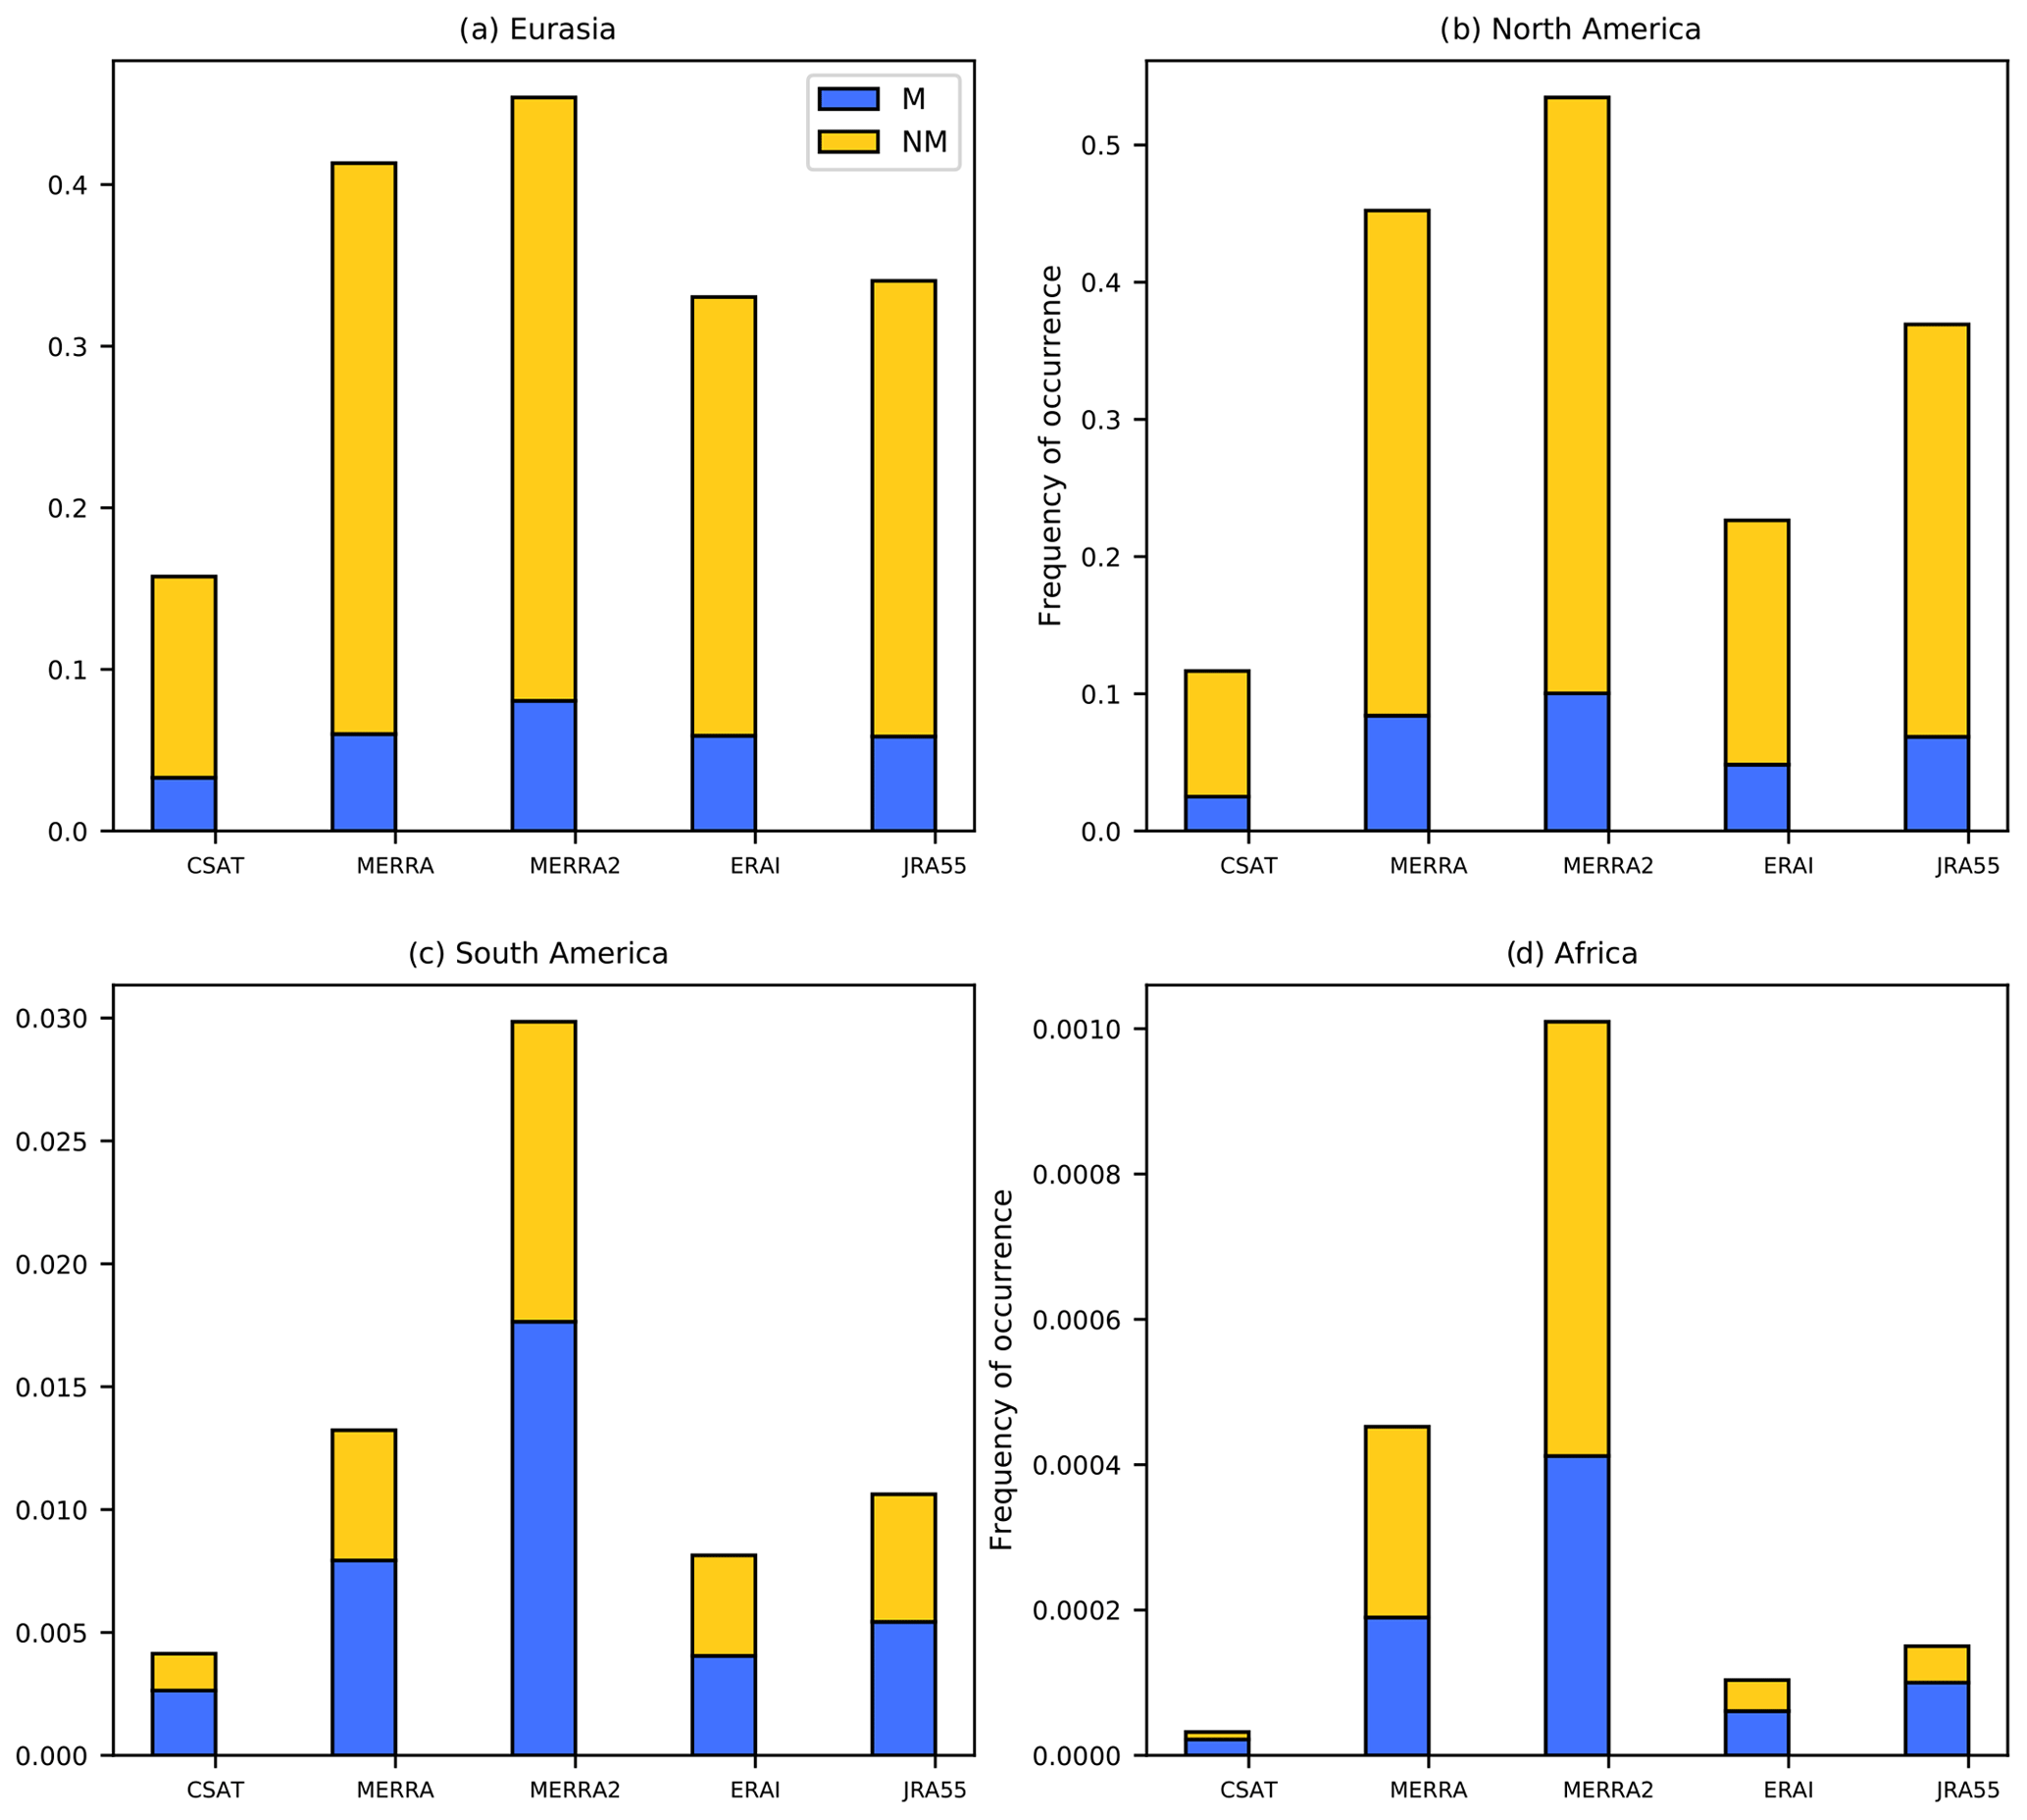
Figure 5Frequency of occurrence of snowfall estimates over (a) Eurasia, (b) North America, (c) South America and (d) Africa for CloudSat, MERRA, MERRA-2, ERA-Interim and JRA-55 over the time period 2007–2016. Mountain snow is in blue and non-mountain snow is in yellow.
The differences in snowfall among datasets is especially prominent over Africa and South America. Over Africa (Fig. 4d), both MERRA and MERRA-2 produce much more snow than the other datasets, with MERRA-2 producing nearly twice as much snowfall as MERRA. MERRA produces 75 % more snowfall than the average of the three remaining datasets (ERA-Interim, JRA-55 and CloudSat), while MERRA-2 produces 85 % more. For the same reasons, over South America MERRA-2 produces 73 % more snowfall than the average of the other datasets. Furthermore, it highly exceeds the mountain and non-mountain snowfall compared to the other datasets. However, as most of the snow over South America is mountainous, the excess in mountainous snowfall has a stronger impact on the differences in total accumulated snowfall. The seasonal cycle of mountain snowfall over South America (not shown) provides another interesting explanation for this specific bias. From January to December, MERRA-2 overestimates the other datasets but with a similar seasonal cycle in the first part of the year. However, during the second part (after June), the behavior of MERRA-2 is very different – instead of a decrease in mountain snowfall, snowfall accumulations remain very high and steady. This is clearly a major contributor to the high snowfall estimates of MERRA-2 over South America.
Overall, these results are coherent with previous studies comparing different reanalysis datasets (Daloz et al., 2018; Sebastian et al., 2016, Thorne and Vose, 2010). They all show that reanalyses are able to represent some general patterns but also show very important differences. For example, Sebastian et al. (2016) compared atmospheric budgets for the computation of water availability in different reanalyses. They showed considerable variations in the individual components of the different budgets and suggested that part of these variations could be attributed to differences in the representation of clouds and convective schemes for precipitation. Furthermore, Daloz et al. (2018) showed significant differences in the representation of clouds in the reanalyses examined in this article, confirming the hypothesis of Sebastian et al. (2016). More specifically, they showed that JRA-55 exhibits some strong deficiencies in the representation of clouds and that MERRA-2 introduces some biases that were not evident in MERRA. These results may partly explain the deficiencies observed for these two datasets.
Snowfall plays an important role in a number of atmospheric and surface processes that impact energy and hydrological cycles and can influence the Earth's climate. To understand these processes and how they will be influenced by future climate change, it is imperative to have reliable observations of present-day mountain snowfall. This study is a preliminary step towards an estimate of mountain snowfall from CloudSat satellite observations and four reanalyses (MERRA, MERRA-2, JRA-55 and ERA-Interim). In this work we answer the following questions.
-
How much snow falls on the world's mountains?
A total of 1773 km3 yr−1 of snow falls on the world's mountains in CloudSat observations, 1763 km3 yr−1 in MERRA, 1891 km3 yr−1 in MERRA-2, 1041 km3 yr−1 in ERA-Interim and 489 km3 yr−1 in JRA-55 (see Table 1).
- 2.
What percentage of continental snow falls on mountainous regions?
A total of 4 % to 5 % of snow falls over the mountains (see Table 1).
One aim of this research is to provide context for researchers who want to use snowfall estimates globally or on specific continents from reanalyses and/or satellite observations. The results of the discussion clearly emphasize the necessity of using several datasets, including different platforms such as reanalyses and satellite observations. Results presented here can help future analyses select validation datasets for specific continents, since we show that some datasets behave differently to the others for continental snowfall estimates. For instance, modelers have difficulties accurately representing snowfall over South American mountains (Gelaro et al., 2017), and it is suspected that MERRA-2 is not the optimal dataset to use for this continent. However, this study and Wrzesien et al. (2019) showed that over North America MERRA-2 is certainly a realistic dataset with substantial skills. Generally, there is no good or bad dataset; however, some datasets may outperform others over certain continents. These different abilities in the reanalyses and satellite products can lead to issues when validating climate models, for example. We therefore recommend using an ensemble of the products in the same sense that it is recommended to use several models or simulations.
This study also suggests that estimates of the fraction of snow that falls in the mountains compared to all continental snowfall may be more reliable than estimates of the absolute magnitude of mountain snow accumulations. A hypothesis behind this result could be that the datasets presented here have a similar representation of the large-scale forcings but differences at local and smaller scales, which could be due to differences in the physical parameterizations of the models, subgrid-scale parameterizations of orographical effects. Indeed, even if the reanalyses are based on different models, they should simulate similar and realistic large-scale forcings. For CloudSat, its ability to capture these forcings would come from its relatively good level of temporal and spatial coverage. This could explain the consensus between the different datasets in terms of snowfall fractions. On the other hand, at smaller scales, both types of datasets experience different limitations, which would explain the dissimilarities in snowfall magnitude. For example, for CloudSat, its spatial coverage could lead it to miss some heavy snow events like atmospheric rivers.
In the future, this work will expand in several directions. First, a deeper and more process-oriented analysis of the differences observed during the different datasets should be done over each continent. While this study is confined to mountain snowfall produced by CloudSat and reanalysis datasets, it also serves as a foundation for studying cloud microphysical and dynamical processes operating within snow-producing clouds forced by orography. Because different modes of snowfall have varying impacts on the environment and potentially unique remote sensing fingerprints, identifying specific types of snowfall could lead to better measurements of snowfall. In addition, this could also improve forecasting by representing different snowfall modes more realistically within numerical weather models. Also, to evaluate the ability of climate models to represent snowfall estimates, this same analysis could be realized for climate models such as the Coupled Model Intercomparison Project 6 (CMIP6) ensemble.
CloudSat data used herein were acquired from the CloudSat Data Processing Center (DPC) and at the time of writing can be accessed online at http://www.cloudsat.cira.colostate.edu/data-products/level-2c/2c-snow-profile?term=57 (last access: September 2017).
MERRA and MERRA-2 data were provided by NASA's Global Modeling and Assimilation Office (GMAO) and obtained through the Goddard Earth Sciences Data and Information Services Center (GES DISC, https://disc.gsfc.nasa.gov/information/alerts?keywords=M2T1NXADG_5.12.4&title=Deprecation%20of%20the%20MERRA%20and%20MERRA-2%20Unique%20Web%20Interface%20Subsetter, last access: July 2016).
JRA-55 data was provided by the Japanese Meteorological Agency and obtained through the National Center for Atmospheric Research's (NCAR) Research Data Archive (https://doi.org/10.5065/D6HH6H41, Japan Meteorological Agency, 2013).
ERA-Interim data was provided by the European Centre for Medium-Range Weather Forecasts (ECMWF) and obtained via the ECMWF WebAPI (https://apps.ecmwf.int/datasets/data/interim-full-daily/levtype=sfc/, last access: October 2016, ECMWF, 2016).
ASD and TL conceived of the presented idea. ASD developed the current work with support from MM, MK, NW, MD and MW. MM also performed the computations for preparing the datasets. MK and NW provided critical expertise on the analysis and preparation of the satellite observations. MD and MW provided the mask used for selecting mountainous regions. CS and AD provided critical feedbacks on the manuscript.
The authors declare that they have no conflict of interest.
The views, opinions and findings contained in this report are those of the author(s) and should not be construed as an official National Oceanic and Atmospheric Administration or U.S. Government position, policy or decision.
Parts of this work by Tristan L'Ecuyer were performed at the University of Wisconsin-Madison for the Jet Propulsion Laboratory, California Institute of Technology, sponsored by the National Aeronautics and Space Administration (NASA) CloudSat program. Parts of this research by Norm B. Wood were performed at the University of Wisconsin – Madison for the Jet Propulsion Laboratory, California Institute of Technology, sponsored by the National Aeronautics and Space Administration. We acknowledge the support of the DPC in providing their data.
This research has been supported by the NASA (grant no. NNX16AE21G) and the Center for Climatic Research (Seed grant).
This paper was edited by Guillaume Chambon and reviewed by Jean-Baptiste Madeleine and one anonymous referee.
Barnett, T. P., Adam, J. C., and Lettenmaier, D. P.: Potential impacts of a warming climate on water availability in snow-dominated regions, Nature, 438, 303–309, https://doi.org/10.1038/nature04141, 2005
Behrangi, A., Christensen, M., Richardson, M., Lebsock, M., Stephens, G., Huffman, G. J., Bolvin, D., Adler, R. F., Gardner, A., Lambrigtsen, B., and Fetzer, E.: Status of high-latitude precipitation estimates from observations and reanalyses, J. Geophys. Res.-Atmos., 121, 4468–4486, https://doi.org/10.1002/2015JD024546, 2016.
Bosilovich, M. G., Chern, J., Mocko, D., Robertson, F. R., and, da Silva, A. M.: Evaluating Observation Influence on Regional Water Budgets in Reanalyses, J. Climate, 28, 3631–3649, https://doi.org/10.1175/JCLI-D-14-00623.1, 2015.
Bromwich, D. H., Nicolas, J. P., and Monaghan, A. J.: An assessment of precipitation changes over Antarctica and the Southern Ocean since 1989 in contemporary global reanalyses, J. Clim., 24, 4189–4209, https://doi.org/10.1175/2011JCLI4074.1, 2011.
Cao, Q, Hong, Y., Chen, S., Gourley, J. J., Zhang, J., and Kirstetter, P. E.: Snowfall Detectability of NASA'S CloudSat: The first cross-investigation of its 2C-Snow-Profile Product and National Multi-sensor Mosaic QPE (NMQ) Snowfall Data, Prog. Electromag. Res., 148, 55–61, 2014.
Chen, T., Guo, J., Li, Z., Zhao, C., Liu, H., Cribb, M., Wang, F., and He, J.: A CloudSat Perspective on the Cloud Climatology and Its Association with Aerosol Perturbations in the Vertical over Eastern China. J. Atmos. Sci., 73, 3599–3616, https://doi.org/10.1175/JAS-D-15-0309.1, 2016.
Cohen, L. and Dean, S.: Snow on the Ross Ice Shelf: comparison of reanalyses and observations from automatic weather stations, The Cryosphere, 7, 1399–1410, https://doi.org/10.5194/tc-7-1399-2013, 2013.
Daloz, A. S., Nelson, E., L'Ecuyer, T. S., Rapp, A. D., and Sun, L.: Assessing the Coupled Influences of Clouds on the Atmospheric Energy and Water Cycles in Reanalyses with A-Train Observations, J. Climate, 31, 8241–8264, https://doi.org/10.1175/JCLI-D-17-0862.1, 2018.
Dee, D. P., Uppala, S. M., Simmons, A. J., Berrisford, P., Poli, P., Kobayashi, S., Andrae, U., Balmaseda, M. A., Balsamo, G., Bauer, P., Bechtold, P., Beljaars, A. C. M., van de Berg, I., Biblot, J., Bormann, N., Delsol, C., Dragani, R., Fuentes, M., Greer, A. J., Haimberger, L., Healy, S. B., Hersbach, H., Holm, E. V., Isaksen, L., Kallberg, P., Kohler, M., Matricardi, M., McNally, A. P., Mong-Sanz, B. M., Morcette, J.-J., Park, B.-K., Peubey, C., de Rosnay, P., Tavolato, C., Thepaut, J. N., and Vitart, F.: The ERA-Interim reanalysis: Configuration and performance of the data assimilation system, Q. J. Roy. Meteorol. Soc., 137, 553–597, https://doi.org/10.1002/qj.828, 2011.
European Centre for Medium-Range Weather Forecasts (ECMWF): ERA-Interim data, ECMWF WebAPI, available at: https://apps.ecmwf.int/datasets/data/interim-full-daily/levtype=sfc/, last access: October 2016.
Gelaro, R., McCarty, W., Suárez, M. J., Todling, R., Molod, A., Takacs, L., Randles, C. A., Darmenov, A., Bosilovich, M. G., Reichle, R., Wargan, K., Coy, L., Cullather, R., Draper, C., Akella, S., Buchard, V., Conaty, A., da Silva, A. M., Gu, W., Kim, G.-K., Koster, R., Lucchesi, R., Merkova, D., Nielsen, J. E., Partyka, G., Pawson, S., Putman, W., Rienecker, M., Schubert, S. D., Sienkiewicz, M., and Zhao, B.: The Modern-Era Retrospective Analysis for Research and Applications, Version 2 (MERRA-2), J. Climate, 30, 5419–5454, https://doi.org/10.1175/JCLI-D-16-0758.1, 2017.
Goodison, B., Louie, P. Y. T., and Yang, D.: WMO solid precipitation measurement intercomparison: Final report, WMO/TD No. 872, WMO, Geneva, 88 pp. 1998.
Grazioli, J., Madeleine, J.-B., Gallée, H., Forbes, R. M., Genthon, C., Krinner, G., and Berne, A.: Katabatic winds diminish Antarctic precipitation, P. Natl. Acad. Sci. USA, 114, 10858–10863, https://doi.org/10.1073/pnas.1707633114, 2017.
Groisman, P. Y. and Legates, D. R.: The accuracy of United States precipitation data, B. Am. Meteorol. Soc., 75, 215–227, 1994.
Haynes, J. M., L'Ecuyer, T. S., Stephens, G. L., Miller, S. D., Mitrescu, C., Wood, N. B., and Tanelli, S.: Rainfall retrieval over the ocean with spaceborne W-band radar, J. Geophys. Res., 114, D00A22, https://doi.org/10.1029/2008JD009973, 2009.
Haynes, J. M., L'Ecuyer, T. S., Vane, D., Stephens, G., and Rienke, D.: Level 2-C Precipitation Column algorithm product process description and interface control document, version P2_R04, CloudSat Project technical document, National Aeronautics and Space Administration, 17 pp., available at: http://www.cloudsat.cira.colostate.edu/sites/default/files/products/files/2C-PRECIP-COLUMN_PDICD.P2_R04.20130124.pdf (last access: 20 June 2019), 2013.
Henn, B., Newman, A. J., Ben Livneh, Daly, C., and Lundquist, J. D.: An assessment of differences in gridded precipitation datasets in complex terrain, J. Hydrol., 556, 1205–1219, https://doi.org/10.1016/j.jhydrol.2017.03.008, 2018.
Hiley, M. J., Kulie, M. S., and Bennartz, R.: Uncertainty Analysis for CloudSat Snowfall Retrievals, J. Appl. Meteor. Climatol., 50, 399–418, https://doi.org/10.1175/2010JAMC2505.1, 2011.
Japan Meteorological Agency: JRA-55: Japanese 55-year Reanalysis, Daily 3-Hourly and 6-Hourly Data. Research Data Archive at the National Center for Atmospheric Research, Computational and Information Systems Laboratory, https://doi.org/10.5065/D6HH6H41, 2013.
Kapos, V., Rhind, J., Edwards, M., Price, M. F., and Ravilious, C.: Developing a map of the world's mountain forests, in: Forests in Sustainable Mountain Development: A State-of-Knowledge Report for 2000, edited by: Price, M. F. and Butt, N., CAB International, Wallingford, 4–9, 2000.
Kidd, C., Becker, A., Huffman, G. F., Muller, C. L., Joe, P., Skofronick-Jackson, G., and Kirschbaum, D. B.: So, How Much of the Earth's Surface Is Covered by Rain Gauges?, B. Am. Meteorol. Soc., 98, 69–78, https://doi.org/10.1175/BAMS-D-14-00283.1, 2017.
Kobayashi, S., Ota, Y., Harada, Y., Ebita, A., Moriya, M., Onoda, H., Onogi, K., Kamahori, H., Kobayashi, C., Endo, H., Miyaoka, K., and Takahasi, K.: The JRA-55 Reanalysis: General Specifications and Basic Characteristics, J. Meteor. Soc. Jpn., 93, 5–48, https://doi.org/10.2151/jmsj.2015-001, 2015.
Kochendorfer, J., Nitu, R., Wolff, M., Mekis, E., Rasmussen, R., Baker, B., Earle, M. E., Reverdin, A., Wong, K., Smith, C. D., Yang, D., Roulet, Y.-A., Meyers, T., Buisan, S., Isaksen, K., Brækkan, R., Landolt, S., and Jachcik, A.: Testing and development of transfer functions for weighing precipitation gauges in WMO-SPICE, Hydrol. Earth Syst. Sci., 22, 1437–1452, https://doi.org/10.5194/hess-22-1437-2018, 2018.
Kulie, M. S. and Bennartz, R.: Utilizing spaceborne radars to retrieve dry snowfall, J. Appl. Meteorol. Clim., 48, 2564–2580, 2009.
Kulie, M. S., Milani, L., Wood, N. B., Tushaus, S. A., Bennartz, R., and L'Ecuyer, T. S.: A Shallow Cumuliform Snowfall Census Using Spaceborne Radar, J. Hydrometeor., 17, 1261–1279, https://doi.org/10.1175/JHM-D-15-0123.1, 2016.
Kulie, M. S. and, Milani, L.: Seasonal variability of shallow cumuliform snowfall: A CloudSat perspective, Q. J. R. Meteor. Soc., 144, 329–343, https://doi.org/10.1002/qj.3222, 2018.
Lavers, D. A. and Villarini, G.: The contribution of atmospheric rivers to precipitation in Europe and the United States, J. Hydrol., 522, 382–390, https://doi.org/10.1016/j.jhydrol.2014.12.010, 2015.
Lemonnier, F., Madeleine, J.-B., Claud, C., Palerme, C., Genthon, C., L'Ecuyer, T., Wood, N.: CloudSat-inferred vertical structure of snowfall over the Antarctic continent, J. Geopys. Res.-Atmos., 125, e2019JD031399, https://doi.org/10.1029/2019JD031399, 2019a.
Lemonnier, F., Madeleine, J.-B., Claud, C., Genthon, C., Durán-Alarcón, C., Palerme, C., Berne, A., Souverijns, N., van Lipzig, N., Gorodetskaya, I. V., L'Ecuyer, T., and Wood, N.: Evaluation of CloudSat snowfall rate profiles by a comparison with in situ micro-rain radar observations in East Antarctica, The Cryosphere, 13, 943–954, https://doi.org/10.5194/tc-13-943-2019, 2019b.
L'Ecuyer, T. S., Beaudoing, H. K., Rodell, M., Olson, W., Lin, B., Kato, S., Clayson, C. A., Wood, E., Sheffield, J., Adler, R., Huffman, G., Bosilovich, M., Gu, G., Robertson, F., Houser, P. R., Chambers, D., Famiglietti, J. S., Fetzer, E., Liu, W. T., Gao, X. , Schlosser, C. A., Clark, E., Lettenmaier, D. P., and Hilburn, K.: The Observed State of the Energy Budget in the Early Twenty-First Century, J. Climate, 28, 8319–8346, https://doi.org/10.1175/JCLI-D-14-00556.1, 2015.
Liu, G.: Deriving snow cloud characteristics from CloudSat observations. J. Geophys. Res., 113, D00A09, https://doi.org/10.1029/2007JD009766, 2008.
Liu Y. and Magulis, S. A.: Deriving bias and uncertainty in MERRA-2 snowfall precipitation over High Mountain Asia, Front. Earth. Sci., 7, 280, https://doi.org/10.3389/feart.2019.00280, 2019.
Maahn, M., Burgard, C., Crewell, S., Gorodetskaya, I. V., Kneifel, S., Lhermitte, S., Van Tricht, K., and van Lipzig, N. P. M.: How well does the spaceborne radar blind zone affect derived surface snowfall statistics in polar regions?, J. Geophys. Res.-Atmos., 119, 132604–132620, https://doi.org/10.1002/2014JD022079, 2014.
Mankin, J. S., Viviroli, D., Singh, D., Hoekstra, A. Y., and Diffenbaugh, N. S.: The potential for snow to supply human water demand in the present and future, Environ. Res. Lett., 10, 114016, https://doi.org/10.1088/1748-9326/10/11/114016, 2015.
Milani, L., Kulie, M. S., Casella, D., Dietrich, S., L'Ecuyer, T. S., Giulia, P., Porcu, F., Sano, P., and Wood, N. B.: CloudSat snowfall estimates over Antarctica and the Southern Ocean: An assessment of independent retrieval methodologies and multi-year snowfall analysis, Atmos. Res., 213, 121–135, https://doi.org/10.1016/j.atmosres.2018.05.015, 2018.
Neiman, P. J., Ralph, F. M., Wick, G. A., Lundquist, J. D., and Dettinger, M. D.: Meteorological characteristics and overland precipitation impacts of atmospheric rivers affecting the west coast of North America based on eight years of SSM/I satellite observations, J. Hydrometeor., 9, 22–47, 2008.
Norin, L., Devasthale, A., L'Ecuyer, T. S., Wood, N. B., and Smalley, M.: Intercomparison of snowfall estimates derived from the CloudSat Cloud Profiling Radar and the ground-based weather radar network over Sweden, Atmos. Meas. Tech., 8, 5009–5021, https://doi.org/10.5194/amt-8-5009-2015, 2015.
Orsolini, Y., Wegmann, M., Dutra, E., Liu, B., Balsamo, G., Yang, K., de Rosnay, P., Zhu, C., Wang, W., Senan, R., and Arduini, G.: Evaluation of snow depth and snow cover over the Tibetan Plateau in global reanalyses using in situ and satellite remote sensing observations, The Cryosphere, 13, 2221–2239, https://doi.org/10.5194/tc-13-2221-2019, 2019.
Palerme, C., Claud, C., Dufour, A., Genthon, C., Wood, N. B., and L'Ecuyer, T. S.: Evaluation of Antarctic snowfall in global meteorological reanalyses, Atmos. Res., 190, 104–112, https://doi.org/10.1016/j.atmosres.2017.02.015, 2017.
Palerme, C., Kay, J. E., Genthon, C., L'Ecuyer, T., Wood, N. B., and Claud, C.: How much snow falls on the Antarctic ice sheet?, The Cryosphere, 8, 1577–1587, https://doi.org/10.5194/tc-8-1577-2014, 2014.
Ralph, F. M., Neiman, P. J., Wick, G. A., Gutman, S. I., Dettinger, M. D., Cayan, D. R., and White, A. B.: Flooding on California's Russian River: Role of atmospheric river. Geophys. Res. Lett., 33, L13801, https://doi.org/10.1029/2006GL026689, 2006.
Reichle, R. H., Liu, Q., Koster, R. D., Draper, C. S., Mahanama, S. P., and Partyka, G. S.: Land Surface Precipitation in MERRA-2, J. Climate, 30, 1643–1664, https://doi.org/10.1175/JCLI-D-16-0570.1, 2017.
Rienecker, M. M., Suarez, M. J., Gelaro, R., Todling, R., Bacmeister, J., Liu, E., Bosilovich, M. G., Schubert, S. D., Takacs, L., Kim, G.-K., Bloom, S., Chen, J., Collins, D., Conaty, A., da Silva, A., Gu, W., Joiner, J., Koster, R. D., Lucchesi, R., Molod, A., Owens, T., Pawson, S., Pegion, P., Redder, C. R., Reichle, R., Robertson, F. R., Ruddick, A. G., Sienkiewicz, M., and Woollen, J.: MERRA: NASA's Modern-Era Retrospective Analysis for Research and Applications, J. Climate, 24, 3624–3648, https://doi.org/10.1175/JCLI-D-11-00015.1, 2011.
Rodell, M., Famiglietti, J. S., Wiese, D. N., Reager, J. T., Beaudoing, H. K., Landerer, F. W., and Lo, M.-H. : Emerging trends in global freshwater availability, Nature, 557, 651–659, 2018.
Rodgers, C. D.: Inverse Methods for Atmospheric Sounding: Theory and Practice. Series on Atmospheric and Oceanic and Planetary Physics, Vol. 2, World Scientific, 256 pp., 2000.
Rutz, J. J. and Steenburgh, W. J.: Quantifying the role of atmospheric rivers in the interior western United States, Atmosphys. Sci. Lett., 13, 257–261, https://doi.org/10.1002/asl.392, 2012.
Sebastian, D., Pathak, A., and Ghosh, S.: Use of Atmospheric Budget to Reduce Uncertainty in Estimated Water Availability over South Asia from Different Reanalyses, Sci. Rep., 6, 29664, https://doi.org/10.1038/srep29664, 2016.
Smalley, M., L'Ecuyer, T., Lebsock, M., and Haynes, J.: A comparison of precipitation occurrence from the NCEP Stage IV QPE product and the CloudSat cloud profiling radar, J. Hydrometeorol., 15, 444–458, https://doi.org/10.1175/JHM-D-13-048.1, 2014.
Smalley, M. and L'Ecuyer, T. S.: A global assessment of the spatial scale of precipitation occurrence, J. Appl. Meteorol. Climatol., 54, 2179–2197, 2015.
Souverijns, N., Gossart, A., Lhermitte, S., Gorodetskaya, I. V., Grazioli, J., Berne, A., Duran-Alarcon, C., Boudevillain, B., Genthon, C., Scarchilli, C., and van Lipzig, N. P. M.: Evaluation of the CloudSat surface snowfall product over Antarctica using ground-based precipitation radars, The Cryosphere, 12, 3775–3789, https://doi.org/10.5194/tc-12-3775-2018, 2018.
Stephens, G. L., Vane, D. G., Boain, R. J., Mace, G. G., Sassen, K., Wang, Z., Illingworth, A. J., O'connor, E. J., Rossow, W. B., Durden, S. L., Miller, S. D., Austin, R. T., Benedetti, A., Mitrescu, C., the CloudSat Science Team: The CloudSat mission and the A-Train, B. Am. Meteorol. Soc., 83, 1771–1790, https://doi.org/10.1175/BAMS-83-12-1771, 2002.
Stephens, G. L., Vane, D. G., Tanelli, S., Im, E., Durden, S., Rokey, M., Reinke, D., Partain, P., Mace, G. G., Austin, R., L'Ecuyer, T. S., Haynes, J., Lebsock, M., Suzuki, K., Waliser, D., Wu, D., Kay, J., Gettelman, A., Wang, Z., and Marchand, R.: CloudSat mission: Performance and early science after the first year of operation, J. Geophys. Res., 113, D00A18, https://doi.org/10.1029/2008JD009982, 2008.
Stephens, G. L., L'Ecuyer, T. S., Forbes, R., Gettlemen, A., Golaz, J.-C, Bodas-Salcedo, A., Suzuki, K., Gabriel, P., and Haynes, J.: Dreary state of precipitation in global models, J. Gephys. Res., 115, D24211, https://doi.org/10.1029/2010JD014532, 2010.
Tanelli, S., Durden, S. L., Im, E., Pak, K. S., Reinke, D. G., Partain, P., Haynes, J. M., and Marchand, R. T.: CloudSat's Cloud Profiling Radar after two years in orbit: Performance, calibration, and processing, IEEE T. Geosci. Remote Sens., 46, 3560–3573, https://doi.org/10.1109/TGRS.2008.2002030, 2008.
Thorne, P. W. and Vose, R. S.: Reanalyses Suitable for Characterizing Long-Term Trends, B. Am. Meteorol. Soc., 91, 353–362, https://doi.org/10.1175/2009BAMS2858.1, 2010.
Viale, M. and Nuñez, M. N.: Climatology of Winter Orographic Precipitation over the Subtropical Central Andes and Associated Synoptic and Regional Characteristics, J. Hydrometeor., 12, 481–507, https://doi.org/10.1175/2010JHM1284.1, 2011.
Wang, C., Graham, R. M., Wang, K., Gerland, S., and Granskog, M. A.: Comparison of ERA5 and ERA-Interim near-surface air temperature, snowfall and precipitation over Arctic sea ice: effects on sea ice thermodynamics and evolution, The Cryosphere, 13, 1661–1679, https://doi.org/10.5194/tc-13-1661-2019, 2019.
Wood, N., L'Ecuyer, T. S., Vane, D., Stephens, G., and Partain, P.: Level 2C Snow Profile Process Description and Interface Control Document, Algorithm Version P_R04, NASA JPL CloudSat project technical document revision 0, 21 pp., available at: http://www.cloudsat.cira.colostate.edu/sites/default/?les/products/?les/2C-SNOW-PROFILE_PDICD.P_R04.20130210.pdf (last access: 3 August 2015), 2013.
Wood, N. B. and L'Ecuyer, T. S.: Level 2C Snow Profile Process Description and Interface Control Document, Product Version P1_R05, NASA JPL CloudSat project document revision 0, 26 pp., available at: http://www.cloudsat.cira.colostate.edu/sites/default/files/products/files/2C-SNOW-PROFILE_PDICD.P1_R05.rev0_.pdf (last access 20 June 2019), 2018.
Wrzesien, M. L., Durand, M. T., and Pavelsky, T. M.: A reassessment of North American River basin cool-season precipitation: Developments from a new mountain climatology data set, Water Resour. Res., 55, 3502–3519, https://doi.org/10.1029/2018WR024106, 2019.
- Abstract
- Introduction
- Data and methodology
- Mountain snowfall estimates in CloudSat observations and reanalyses
- Examination of the differences in snowfall magnitude
- Summary and conclusion
- Data availability
- Author contributions
- Competing interests
- Disclaimer
- Acknowledgements
- Financial support
- Review statement
- References