the Creative Commons Attribution 4.0 License.
the Creative Commons Attribution 4.0 License.
 | 27 Aug 2020
Brief communication: Evaluating Antarctic precipitation in ERA5 and CMIP6 against CloudSat observations
Marie-Laure Roussel
Florentin Lemonnier
Christophe Genthon
Gerhard Krinner
CMIP5, CMIP6, and ERA5 Antarctic precipitation is evaluated against CloudSat data. At continental and regional scales, ERA5 and the median CMIP models are biased high, with insignificant improvement from CMIP5 to CMIP6. However, there are fewer positive outliers in CMIP6. AMIP configurations perform better than the coupled ones, and, surprisingly, relative errors in areas of complex topography are higher (up to 50 %) in the five higher-resolution models. The seasonal cycle is reproduced well by the median of the CMIP models, but not by ERA5. Progress from CMIP5 to CMIP6 being limited, there is still room for improvement.
- Article
(1655 KB) - Full-text XML
- BibTeX
- EndNote


Antarctica is the largest freshwater reservoir on Earth. Because of its sea-level equivalent of 57.9±0.9 m (Morlighem et al., 2019), even minor changes of the ice sheet mass balance can have important consequences for global sea level. Apart from a small contribution from ice deposition, precipitation is by far the dominant positive term in the ice sheet mass balance. At equilibrium it is compensated for by meltwater drainage and ice discharge (e.g., Favier et al., 2017). Precipitation is the main source of interannual mass balance variability of the ice sheet (e.g., Boening et al., 2012) and is projected to increase in a warmer future (e.g., Frieler et al., 2015). Therefore, an evaluation of the most recent CMIP6 (World Climate Research Programme (WCRP) Coupled Model Intercomparison Project Phase 6) coordinated climate model simulations (Eyring et al., 2016) is timely.
Over the last decades, numerous technical developments have led to an increased number of meteorological measurements. In this study, precipitation over almost the entire Antarctic continent is analyzed at a climatological timescale using a large-scale snowfall dataset that is independent from climate models, allowing objective evaluation. The reference for snowfall rate used here is the map produced by Palerme et al. (2014) based on the CloudSat satellite radar, which provided the first 4-year surface snowfall climatology for Antarctica. It has recently been followed by its complete three-dimensional version (Lemonnier et al., 2020). We use these satellite observations to assess the Antarctic precipitation rates simulated by the CMIP6 models in various setups, at continental and regional spatial scales, and at the annual and seasonal timescales. We further assess progress with respect to the preceding CMIP Phase 5 (Taylor et al., 2012). ERA5 reanalyses are also used and evaluated in this comparison, because outputs are often used as a reference, particularly in less monitored areas, and because of its foreseeable use as a driver for regional climate models, the continental and climatological precipitation rates of which are strongly determined by the driving global model (e.g., Di Luca et al., 2012). Using new reanalyses and output of the most recent CMIP exercise, this work provides a brief update of the analysis by Palerme et al. (2017), which focused on CMIP5 and ERA-Interim.
2.1 Data
2.1.1 Snowfall: CloudSat radar
The instrument on the CloudSat satellite platform is a RADAR operating at 94GHz and looking at nadir. The Cloud Profiling Radar (CPR) measures the back-scattered signal of hydrometeors. Based on microphysical parameters (Wood et al., 2015) and the diffusion properties of the ice particles, the snowfall rate can be computed. Constrained by the satellite orbit, this measurement can be performed up to 82∘ S. Many sources of error are related to this measurement: the various assumptions as well as the low frequency of passage of the satellite over the Antarctic induce uncertainties. The study of Lemonnier et al. (2019a) allowed improved confidence in the CPR snowfall retrieval over peripheral areas by a comparison with in situ measurements (within maximum 25 % error). In this work, we use data from the 2007–2010 three-dimensional Antarctic climatology (Lemonnier et al., 2020) yielding the vertical distribution of the snowfall rate with a resolution of 1∘ latitude and 2∘ longitude – optimizing the agreement with in situ observations (Souverijns et al., 2018; Palerme et al., 2014). Recently the need to take into consideration the effect of soil echoes has been highlighted (Palerme et al., 2019), because it affects the measurement of CPR in particular in the areas of complex topography, such as mountains and fjords. Some abnormal values are ignored in this dataset, but do not highly impact averages. Here we consider the radar information at the level of 1200 m above ground level to assess the surface snowfall rate.
2.1.2 CMIP5 and CMIP6 global climate models
The Coupled Model Intercomparison Project (CMIP; Taylor et al., 2012; Eyring et al., 2016) is coordinated by the World Climate Research Programme (WCRP). Its main objective is to improve modeling and future predictions, combining the natural variability of the climate system and its response to modification of the radiative forcing in coordinated experiments (see https://es-doc.org/cmip6-experiments/, last access: 9 December 2019). The available model outputs taken into account in this study are listed in Table A1 of Appendix A. CMIP, which started in 1995, is currently in its sixth phase.
Here we evaluate CMIP5 and CMIP6 model output from the “amip” and “historical” experiments. In the amip configuration, an atmospheric circulation model uses observed sea surface temperatures (SSTs) and sea ice (from 1979 to 2014) as prescribed boundary conditions. The so-called historical simulations are coupled ocean–atmosphere experiments. In both setups, observed time-varying atmospheric composition (anthropogenic, natural, and volcanic influences), solar forcing, land use, etc. based on observations are prescribed. In addition, highresSST-present, defined in the framework of HighResMIP (Haarsma et al., 2016), is a configuration available in the CMIP6 archive similar to amip with forced SST, but with a higher horizontal resolution. The experiment is designed to allow evaluation of the sensitivity of climate model output to spatial resolution and to help understand the origins of model biases. The historical CMIP6 model outputs, driven by observed boundary conditions, end in 2014, while the observational period ended in 2005 in the earlier CMIP5 exercise. We therefore preferentially restrain the CMIP5 output to before 2005, complementing them by output from the RCP8.5 scenario run until 2014 where appropriate (see Fig. C1), because the realized CO2 emissions between 2006 and 2014 closely follow those of that high-emission scenario (Hayhoe et al., 2017). The start of our analysis period is 1979, corresponding to the beginning of the satellite period. We use all available CMIP5 and CMIP6 models, although it is well known (e.g., Masson and Knutti, 2011) that models managed by the same group or sharing a common development history yield very similar output, potentially biassing multi-model means. We preferentially use median model output, which is less sensitive to such effects, and quantify inter-model dispersion by the 25th and 75th percentiles, which are insensitive to outliers. Furthermore, although the highresSST-present multi-model ensemble of opportunity contains several versions of most models at low and high resolution, we do not restrain our choice to the high-resolution model versions; nevertheless, on average, the highresSST-present ensemble of opportunity used here has, on average, a substantially higher resolution than the amip and historical CMIP6 ensembles.
2.1.3 ERA5 reanalyses
ERA5 (Copernicus Climate Change Service (C3S), 2017) is the latest global reanalysis of the atmosphere made by the European Centre for Medium-Range Weather Forecasts (ECMWF) based on historical observation data since 1979 with the Integrated Forecasting System (IFS) model and its data assimilation system. Outputs from these reanalyses have high horizontal and vertical spatial resolutions (30 km, 137 vertical levels). In this work, the monthly averages of the ERA5 reanalyses are used for the 40 years from 1979 to 2018.
2.2 Methods
For precipitation, we consider the entire Antarctic ice sheet, including ice shelves, where CloudSat satellite observations are available (i.e., north of 82∘ S). In order to evaluate the performances of the models in reproducing the various precipitation regimes of Antarctica, we examine both regional and seasonal averages. We consider the four standard meteorological seasons that are December–January–February (DJF), March–April–May (MAM), June–July–August (JJA), and September–October–November (SON). These are studied separately on the plateau (all areas above 2250 m) and several peripheral and intermediate regions (defined by latitude and longitude, and an altitude below 2250 m), as there are some seasonal signature differences mostly due to the sea ice and the circumpolar current variations during the year with significant impact on precipitation patterns on the ice sheet margin (Palerme et al., 2017). Six regions have been selected based on latitude, longitude, and altitude to distinguish the main geographical patterns: Plateau, East Antarctic Coast, the Peninsula, the Filchner–Ronne and Ross ice shelves, and the remaining part of the West Antarctic Ice Sheet. These are shown in Fig. 1 and described in Appendix B.
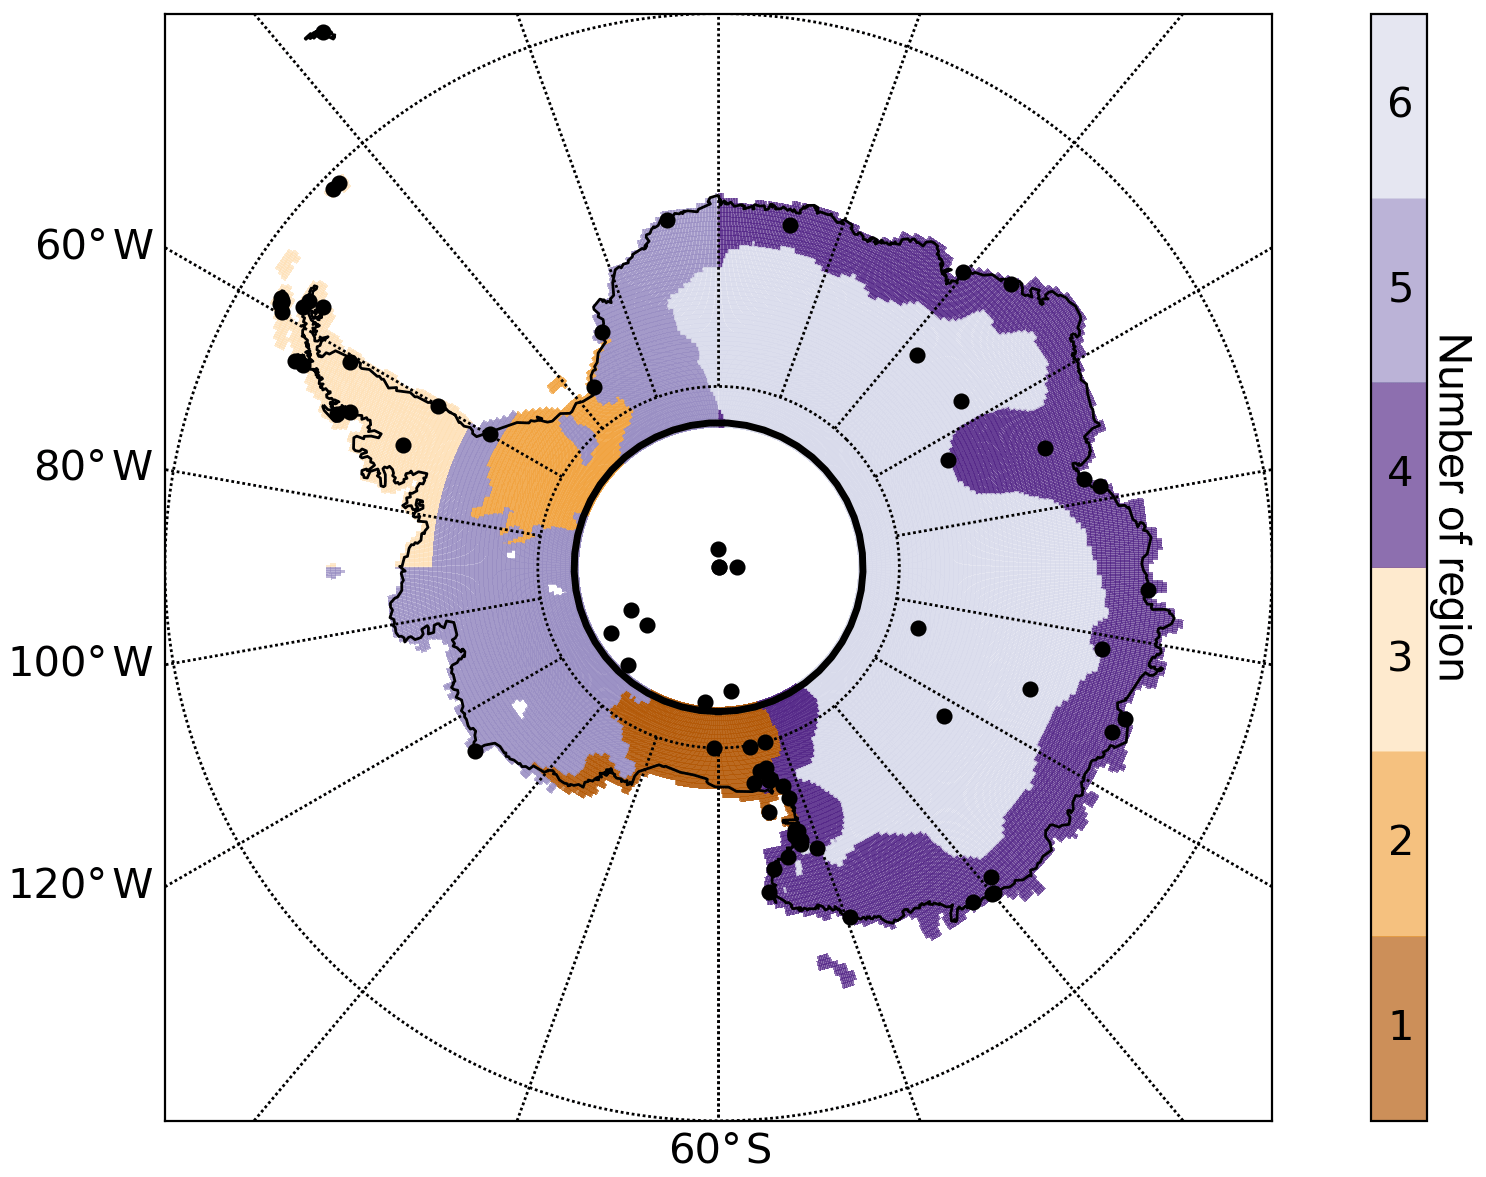
Figure 1Map of the studied regions on the ERA5 grid. Numbers refer to the regions defined in Table B1. Black dots indicate SCAR READER temperature measurement stations (AWS and manned stations). The black line indicates the 82∘ S latitude circle.
To test the sensitivity of our conclusions concerning ERA and the CMIP outputs to the relatively short 4-year CloudSat period, we compare the CloudSat 4-year time series with multiple time periods of the same length extracted from the 40-year climatology of ERA5 and with the average of the 2007–2010 CloudSat period. We made 20 draws of 4 random years to process the samples for the evaluation against the 2007–2010 CloudSat period. This number of 20 samples has been chosen because there is no significant difference in the results with more samples. As we will show below (see Sect. 2.3.1), our conclusions are not very sensitive to these choices.
Furthermore, as historical CMIP5 outputs are only available for years up to 2005, a direct comparison from 2007 to 2010 is not possible between CMIP5 and CloudSat. Annual mean snowfall (averaged over the whole Antarctic continent north of 82∘ S) starting in 1979 is available until 2005 for CMIP5, until 2014 for CMIP6, and until 2018 for ERA5. Over this period, there is a slight positive mean precipitation trend in the CMIP ensembles (strongest, about 2 % per decade, in the CMIP5 and CMIP6 historical simulations), but the variations induced by this trend over the model periods are substantially weaker than the absolute differences between the model means and the CloudSat observational average. Therefore, and because our results are not particularly sensitive to the choice of model years, CMIP output is averaged over the entire respective simulation period for comparison with CloudSat.
A more detailed statistical analysis using the Welch t test, presented in Appendix D, demonstrates that the greatest confidence is attached to the ice shelves, the peninsula, and the east coast (Ross, Filchner, Peninsula, and LowEast regions) when comparing the snowfall means from CloudSat to ERA5 and the CMIP (both 5 and 6) datasets. However, some uncertainties remain in areas of complex topography, due to sublimation of snow below the first level of CloudSat, which is likely to influence the total snowfall amount taken into account here. In the interior of the Antarctic continent, the comparison has to be treated with caution as the snowfall means from CloudSat, ERA5, and the CMIP datasets are significantly different. This may be mainly due to the CPR of CloudSat that underestimates snowfall means, as a major part of it comes from microphysical processes occurring below the first CloudSat level in this region. Therefore, the comparison is focused on the differences between CMIP5 and CMIP6, while the CloudSat results are kept for information purposes only as the single source of observation over these areas. In addition, the test points out that there is no major reduction of the reliability of the comparison between CloudSat and the CMIP experiments when the whole temporal coverage is considered (instead of a 4-year time series). Conversely, there is a more significant influence of the selected years of the ERA5 dataset, which is more sensitive to the interannual variability.
2.3 Results
2.3.1 Continent-wide climatological snowfall rates
Figure 2 displays the annual precipitation for the entire continent (“All”) and the defined regions for CloudSat, ERA5 (both the 2007–2010 period and the average of 20 draws of 4 random years with associated standard deviation), and the various CMIP5 and CMIP6 ensembles. For all CMIP experiments, the ensemble median of the continental mean precipitation is above the 2007–2010 CloudSat average of 186 mm w.e. yr−1. Following Palerme et al. (2017) who compared CMIP5 models to CloudSat snowfall measurements, we have identified CMIP5 and CMIP6 models that have continent-wide mean snowfall rates within 20 % of the CloudSat average value of 186 mm w.e. yr−1, that is, between 150 and 223 mm yr−1. Not a single CMIP5 and CMIP6 model falls below this lower bound. Conversely, a substantial fraction of CMIP models, in both CMIP5 and CMIP6, exceed the upper bound of 223 mm yr−1. As a result, only 58 % of the CMIP6 amip models fall within the ±20 % range around the CloudSat value, and this number decreases to 38 % for CMIP6 highresSST-present, the other ensembles lying between these extreme values. The atmosphere-only amip runs less frequently exceed the ±20 % bound (56 % and 58 % within the 20 % range for CMIP5 and CMIP6, respectively) than the coupled historical runs (43 % and 48 % within the 20 % range for CMIP5 and CMIP6, respectively). We must note that the median model precipitation rate shows no improvement from CMIP5 to CMIP6; if anything, compared to CMIP5, there is even a degradation in the CMIP6 median historical simulation with respect to CloudSat.
There is therefore a systematic high bias, exacerbated higher spatial resolution, and no substantial improvement obvious on the continental scale from CMIP5 to CMIP6; prescribed observed oceanic boundary conditions (SST and sea ice) in the amip runs lead, unsurprisingly, to more realistic simulated precipitation rates than in the corresponding coupled runs.

Figure 2Average snowfall rate per region and for the entire continent north of 82∘ S for CloudSat (black, 2007–2010), ERA5 (computed on 20 draws of 4 random years between 1979 and 2018, with standard deviation, and the 2007–2010 average), and the various CMIP ensembles. For CMIP, the ensemble medians and the 25th and 75th percentiles are indicated.
From CMIP5 to CMIP6, one can note, on the positive side, that the number of models with extreme positive precipitation biases is reduced. In the CMIP5 historical ensemble, for example, four models exceed (in one case very substantially) the maximum of the CMIP6 ensemble at 353 mm, which is almost twice the observed 2007–2010 rate.
Interestingly, ERA5 similarly exhibits a positive mean precipitation bias of about 30 mm yr−1 and is therefore not better, at least compared to the CloudSat climatology, than the CMIP5 and CMIP6 median models.
2.3.2 Regional averages
Figure 2 shows that ERA5 and the CMIP6-highresSST models, which have higher horizontal resolutions that should enable a better spatial representation of the small-scale processes, particularly those induced by topography, do not exhibit reduced errors in the Peninsula region and in West Antarctica (regions named LowWest, Filchner, and Ross). Relative errors with respect to the CloudSat measurement can exceed 50 % in these regions, compared to the lower regions of East Antarctica (LowEast) where it is as low as a few percent.
All CMIP ensembles and ERA5 exhibit positive biases with respect to CloudSat in all regions. The strongest relative biases are located in the Plateau region, that is, above 2250 m, where the CloudSat mean is about 29 mm w.e. yr−1, while the ERA mean for the same period is 65 mm yr−1, and the CMIP ensembles have even stronger biases. In most regions, the amip simulations exhibit lower biases than the coupled historical simulations in the CMIP5 and CMIP6 ensembles, as already seen for the continental mean values.
There is no clear overall improvement in the performance of the CMIP6 ensemble over the CMIP5 ensemble. There is degradation in some regions (for example the Peninsula) and improvement in others, such as the Plateau region, where the improvement in the amip configuration is modest (see also Fig. 3) but important because of the large spatial extent of the East Antarctic Plateau, and on the Ross Ice Shelf. In these plateau and ice shelf areas, the highresSST-present runs consistently perform better than the other CMIP6 runs. This is contrary to expectations that higher spatial resolution, by leading to a better representation of topographical effects, would in principle allow better representation of precipitation rates in regions with steep topography, that is, mostly coastal areas.
2.3.3 Seasonal averages
Figure 3 displays the observed and simulated seasonal variations in precipitation separately for the high (>2250 m) and low (<2250 m) regions of the continent. The CMIP ensembles capture the weak annual cycle in the plateau regions, characterized by a maximum in DJF and a minimum in SON, but, as reported above, they overestimate the average precipitation rate substantially. ERA5 does not capture this seasonality and simulated maximum precipitation rates in MAM and JJA. In the lower reaches of the continent, the CMIP ensembles and ERA5 do capture the observed seasonality, with maximum precipitation rates typically in MAM. This is very probably linked to the availability of oceanic moisture, driven by sea ice around the continent and the delayed annual temperature cycle in the Southern Ocean, and to the seasonality of meridional atmospheric circulation (Genthon and Krinner, 1998).
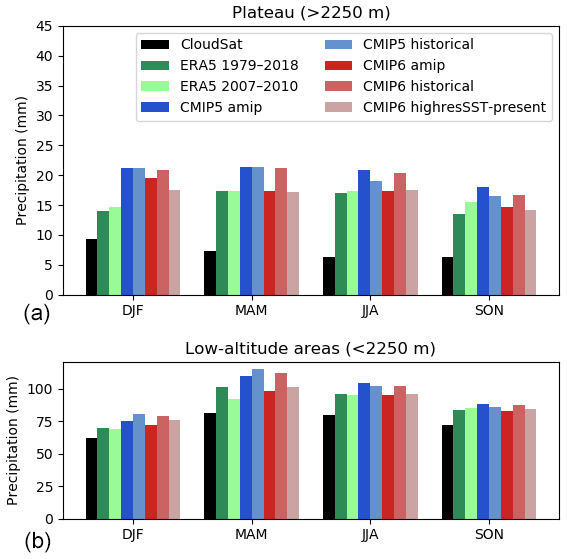
Figure 3Seasonal averages of the observed mean 2007–2010 CloudSat, mean ERA5 (random and 2007–2010 averages), and ensemble median long-term average CMIP5 and CMIP6 snowfall rates per season for the plateau areas (a) and the low-lying reaches of the continent (b).
The CloudSat precipitation climatology provides the possibility to evaluate climate models and reanalyses against model-independent satellite-derived data. By comparing ERA5 reanalysis output from multiple random 4-year periods against output for the 4-year observational period (2007–2010) and the satellite-derived data, we have shown that on regional scales, a 4-year period is long enough to draw robust conclusions about misfits between the models and the satellite dataset.
The main results of this short study are as follows.
-
All CMIP model ensemble medians and ERA5 overestimate the continental mean precipitation rates.
-
The positive biases are particularly strong in the plateau regions.
-
There is no measurable improvement, in terms of continental and regional mean precipitation rates and their seasonality, from CMIP5 to CMIP6.
-
The seasonal cycle of precipitation, both on the plateau and in lower (coastal) regions, is reasonably well captured by the median CMIP models.
-
Median precipitation rates tend to be better reproduced in the atmosphere-only amip configurations than in the coupled historical setups.
-
Positive precipitation biases in particular in the Peninsula region are exacerbated at higher resolution in the highresSST-present ensemble.
-
The CMIP6 ensemble suffers less than CMIP5 from outliers with very strong positive precipitation biases.
We note that although there is no progress in the representation of large-scale mean precipitation and of its seasonality from CMIP5 to CMIP6, there is a concomitant slight progress in the representation of surface air temperature. Regional-scale multi-model median root-mean-square errors are reduced by typically 5 % to 10 % between these successive CMIP generations (see Fig. E1 in the Appendix). This indicates that in spite of a clear physical link between temperature and precipitation changes on long timescales (e.g., Frieler et al., 2015), precipitation errors in current-generation atmospheric general circulation models (AGCMs) are not dominated by the first-order physical link between temperature and water vapor saturation pressure but by errors in the representation of other processes such as atmospheric circulation and cloud microphysics.
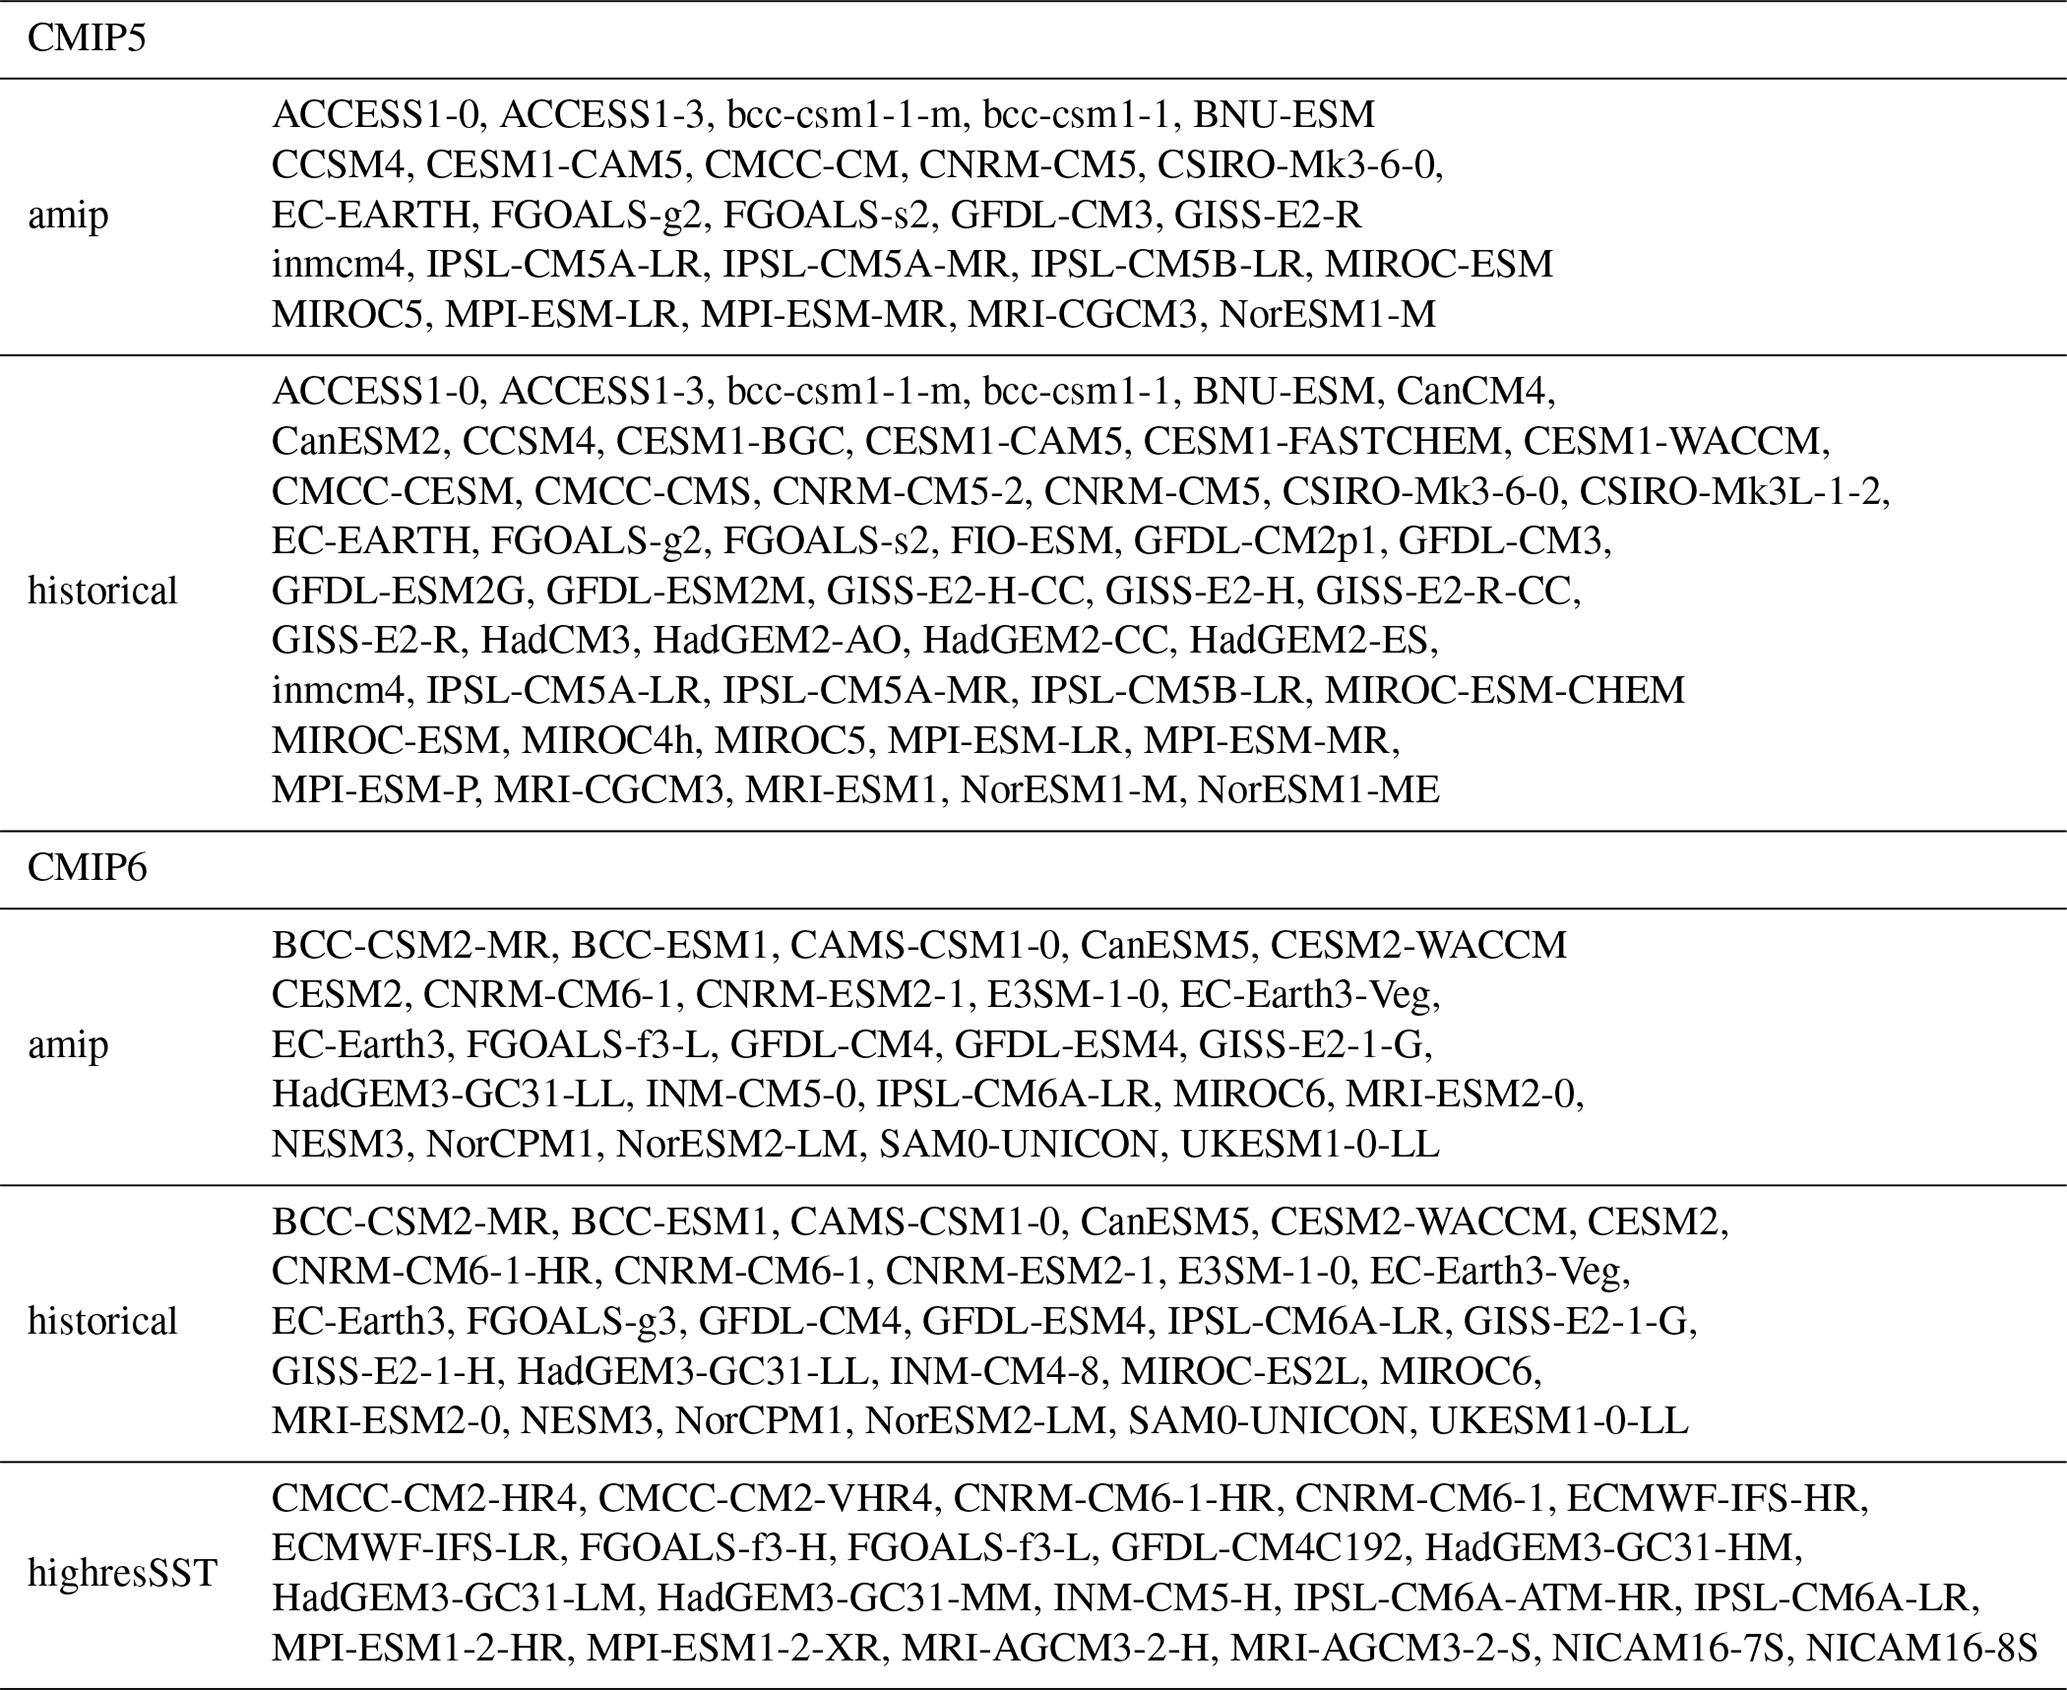
Table B1Selection criteria applied to define the studied regions.
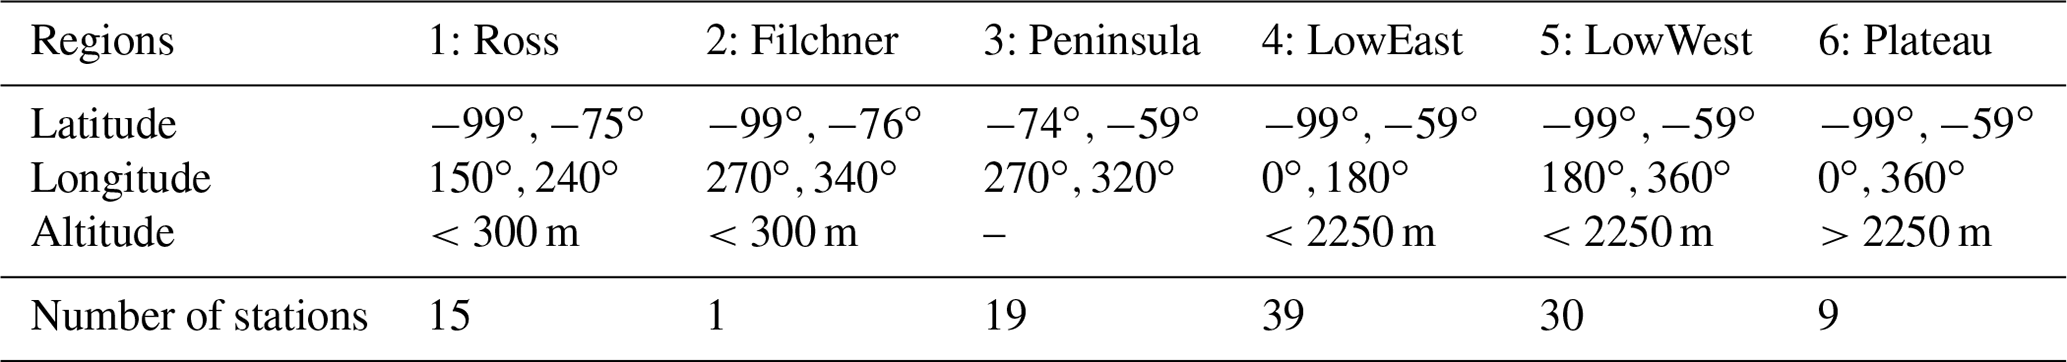

Figure C1The 1979 to 2018 time series of mean annual snowfall rate over the entire Antarctic continent. The median values for all the models of each CMIP (5 and 6) and the mean values for CloudSat and ERA5 are plotted.
Snowfall means of the CloudSat dataset have been compared to ERA5 ones and to the median of each of the CMIP (5 and 6) experiments with Welch's t test. This statistical tool is used to assess the difference between the mean of two independent groups that have normal distributions with unequal variances. Those assumptions have been verified by all the datasets at the continent scale and for the whole year. The hypothesis tested (null hypothesis) is that the means of the two groups are equal. We performed the two-tailed test and analyzed the p value (rounded down to one hundredth) – in comparison with the 0.05 threshold – for each region (defined in the Table B1) and each season. Three methods have been carried out to choose the time series of the datasets used in this test, illustrated by Fig. D1:
-
whole temporal coverage – the entire time series available (1979–2018 for ERA5, 1979–2005 for CMIP5, and 1979–2015 for CMIP6),
-
correct years – the exact years of the CloudSat climatology (only for ERA5 and the three CMIP6 experiments),
-
random years – draws of 4 non-consecutive years (tested from 1 to 10 000 draws and limited to 20 draws in the main work).

Figure D1The p values of the Welch t test comparing the snowfall means from CloudSat to ERA5 and each of the CMIP (5 and 6) experiments for various seasons and the whole year in each of the regions considered. The black dashed line shows the 0.05 threshold to decide whether the hypothesis is rejected or not. “x” crosses indicate results considering the whole temporal coverage, “+” crosses the random 4 years, and stars the correct 4 years of the CloudSat climatology.
The p values are generally higher for the first four regions (Ross, Filchner, Peninsula, and LowEast) for any season and for both ERA5 and CMIP (5 and 6). The choice of the time series has no major impact on the result of the test for each of the CMIP experiments. On the contrary, ERA5 and CloudSat are in a much better agreement when considering a 4-year time series. Figure D2 presents the detailed results considering the whole time coverage for each of the CMIP experiments and for the three time series considered for ERA5. The red color indicates when the null hypothesis has to be rejected and the blue color when it can not be rejected. One can note that the snowfall mean is significantly different at the continent scale for any season, as well as on the plateau and the west coast. Higher p values are mainly on ice shelves, the peninsula, and the east coast.

Figure D2The p values of the Welch t test comparing the snowfall means from CloudSat to ERA5 and each of the CMIP (5 and 6) experiments for various seasons and the whole year in each of the regions considered, considering the whole temporal coverage. Blue color indicates that the p value is greater then the 0.05 threshold (null hypothesis can not be rejected); red color indicates that the p value is lower than the threshold (null hypothesis rejected).
Changes in the quality of the representation of observed precipitation rates are briefly assessed in light of temperature biases with respect to SCAR READER (REference Antarctic Dataset for Environmental Research) AWS (automatic weather station) and manned station data (Turner et al., 2004). For each station and model, we identified the nearest grid point and used a spatial regression (based on the neighboring grid points) of surface temperature against surface altitude in order to correct for altitude differences between the model and the observations. SCAR READER data were used only when at least 10 years of observations were available, and the model output was averaged over the number of years of available observations, centered around the mean year of these observations between 1979 and 2005 (in order to evaluate progress from CMIP5 to CMIP6).
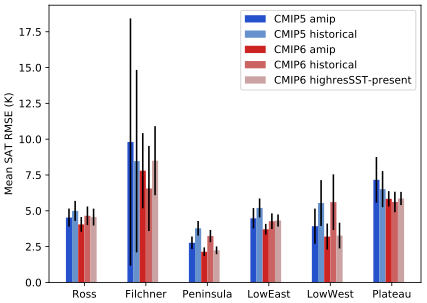
Figure E1Multi-model mean of the multi-station mean root-mean-square error (RMSE, in kelvin) of simulated monthly surface air temperatures against SCAR READER stations (AWS and manned), for the different regions. The regional mean inter-model standard deviation is shown as black error bars, indicating, for some regions, reduced inter-model spread in CMIP6 compared to CMIP5 and modest overall improvement.
All datasets are open access and have been extracted from official public repositories. Data processed from the CloudSat radar (Lemonnier et al., 2020) that have been involved in this research are available at https://doi.org/10.1594/PANGAEA.909434 (Lemonnier et al., 2019b). The ERA5 dataset used in this work have been generated using Copernicus Climate Change Service Information (Copernicus Climate Change Service (C3S), 2017). The CMIP5 datasets have been also generated using C3S. The CMIP6 have been obtained on the Earth System Grid Federation (ESGF) portal (https://esgfnode.llnl.gov/, last access: 9 December 2019, Cinquini et al., 2014). Only basic processing has been carried out (temporal and spatial averages).
This research was designed by all authors. MLR and GK carried out the data analysis. MLR wrote the initial draft and all coauthors contributed to the writing.
The authors declare that they have no conflict of interest.
This paper is a contribution to the CALVA project supported by the French Polar Institute IPEV. This research was carried out in the framework and with support of the French space agency CNES/CNRS GDR EECLAT. We acknowledge the World Climate Research Programme, which, through its Working Group on Coupled Modelling, coordinated and promoted CMIP5 and CMIP6. We thank the climate modeling groups for producing and making available their model output, the Earth System Grid Federation (ESGF) for archiving the data and providing access, and the multiple funding agencies who support CMIP6 and ESGF.
This research was carried out in the framework and with support of the French space agency CNES/CNRS GDR EECLAT.
This paper was edited by Alexander Robinson and reviewed by John King and one anonymous referee.
Boening, C., Lebsock, M., Landerer, F., and Stephens, G.: Snowfall-driven mass change on the East Antarctic ice sheet, Geophys. Res. Lett., 39, L21501, https://doi.org/10.1029/2012GL053316, 2012. a
Cinquini, L., Crichton, D., Mattmann, C., Harney, J., Shipman, G., Wang, F., Ananthakrishnan, R., Miller, N., Denvil, S., Morgan, M., Pobre, Z., Bell, G. M., Doutriaux, C., Drach, R., Williams, D., Kershaw, P., Pascoe, S., Gonzalez, E., Fiore, S., and Schweitzer, R.: The Earth System Grid Federation: An open infrastructure for access to distributed geospatial data, Future Generation Computer Systems, 36, 400–417, doi10.1016/j.future.2013.07.002, 2014. a
Copernicus Climate Change Service (C3S): ERA5: Fifth generation of ECMWF atmospheric reanalyses of the global climate, dataset available at https://cds.climate.copernicus.eu/cdsapp (9 December 2019), 2017. a, b
Di Luca, A., de Elía, R., and Laprise, R.: Potential for added value in precipitation simulated by high-resolution nested regional climate models and observations, Clim. Dynam., 38, 1229–1247, 2012. a
Eyring, V., Bony, S., Meehl, G. A., Senior, C. A., Stevens, B., Stouffer, R. J., and Taylor, K. E.: Overview of the Coupled Model Intercomparison Project Phase 6 (CMIP6) experimental design and organization, Geosci. Model Dev., 9, 1937–1958, https://doi.org/10.5194/gmd-9-1937-2016, 2016. a, b
Favier, V., Krinner, G., Amory, C., Gallée, H., Beaumet, J., and Agosta, C.: Antarctica-regional climate and surface mass budget, Current Climate Change Reports, 3, 303–315, 2017. a
Frieler, K., Clark, P. U., He, F., Buizert, C., Reese, R., Ligtenberg, S. R., Van Den Broeke, M. R., Winkelmann, R., and Levermann, A.: Consistent evidence of increasing Antarctic accumulation with warming, Nat. Clim. Change, 5, 348–352, https://doi.org/10.1038/nclimate2574, 2015. a, b
Genthon, C. and Krinner, G.: Convergence and Disposal of Energy and Moisture on the Antarctic Polar Cap from ECMWF Reanalyses and Forecasts, J. Climate, 11, 1703–1716, https://doi.org/10.1175/1520-0442(1998)011<1703:CADOEA>2.0.CO;2, 1998. a
Haarsma, R. J., Roberts, M. J., Vidale, P. L., Senior, C. A., Bellucci, A., Bao, Q., Chang, P., Corti, S., Fučkar, N. S., Guemas, V., von Hardenberg, J., Hazeleger, W., Kodama, C., Koenigk, T., Leung, L. R., Lu, J., Luo, J.-J., Mao, J., Mizielinski, M. S., Mizuta, R., Nobre, P., Satoh, M., Scoccimarro, E., Semmler, T., Small, J., and von Storch, J.-S.: High Resolution Model Intercomparison Project (HighResMIP v1.0) for CMIP6, Geosci. Model Dev., 9, 4185–4208, https://doi.org/10.5194/gmd-9-4185-2016, 2016. a
Hayhoe, K., Edmonds, J., Kopp, R., LeGrande, A., Sanderson, B., Wehner, M., and Wuebbles, D.: Climate models, scenarios, and projections, in: ClimateScience Special Report: A Sustained Assessment Activity of the U.S. Global Change Research Program, edited by: Wuebbles, D., Fahey, D., Hibbard, K., Dokken, D. J., Stewart, B., and Maycock, T., U.S. Global Change Research Program, Washington, DC, USA, 589, 186–227, available at: https://digitalcommons.unl.edu/usdeptcommercepub/589 (last access: 9 December 2019), 2017. a
Lemonnier, F., Madeleine, J.-B., Claud, C., Genthon, C., Durán-Alarcón, C., Palerme, C., Berne, A., Souverijns, N., van Lipzig, N., Gorodetskaya, I. V., L'Ecuyer, T., and Wood, N.: Evaluation of CloudSat snowfall rate profiles by a comparison with in situ micro-rain radar observations in East Antarctica, The Cryosphere, 13, 943–954, https://doi.org/10.5194/tc-13-943-2019, 2019a. a
Lemonnier, F., Madeleine, J.-B., Claud, C., Palerme, C., Genthon, C., L'Ecuyer, T., and Wood, N. B.: CloudSat-inferred vertical structure of precipitation over the Antarctic continent, PANGAEA, https://doi.org/10.1594/PANGAEA.909434, 2019b. a
Lemonnier, F., Madeleine, J.-B., Claud, C., Palerme, C., Genthon, C., L'Ecuyer, T., and Wood, N. B.: CloudSat-inferred vertical structure of precipitation over the Antarctic continent, J. Geophys. Res.-Atmos., 125, e2019JD031399, https://doi.org/10.1029/2019JD031399, 2020. a, b, c
Masson, D. and Knutti, R.: Climate model genealogy, Geophys. Res. Lett., 38, L08703, https://doi.org/10.1029/2011GL046864, 2011. a
Morlighem, M., Rignot, E., Binder, T., Blankenship, D., Drews, R., Eagles, G., Eisen, O., Ferraccioli, F., Forsberg, R., Fretwell, P., Goel, Vikram, Greenbaum, J. S., Gudmundsson, H., Guo, J., Helm, V., Hofstede, C., Howat, I., Humbert, A., Jokat, W., Karlsson, N. B., Lee, W. S., Matsuoka, K., Millan, R., Mouginot, J., Paden, J., Pattyn, F., Roberts, J., Rosier, S., Ruppel, A., Seroussi, H., Smith, E. C., Steinhage, D., Sun, B., Van Den Broeke, M. R., Van Ommen, T. D., Van Wessem, M., and Young, D. A.: Deep glacial troughs and stabilizing ridges unveiled beneath the margins of the Antarctic ice sheet, Nat. Geosci., 13, 132–137, https://doi.org/10.1038/s41561-019-0510-8, 2019. a
Palerme, C., Kay, J. E., Genthon, C., L'Ecuyer, T., Wood, N. B., and Claud, C.: How much snow falls on the Antarctic ice sheet?, The Cryosphere, 8, 1577–1587, https://doi.org/10.5194/tc-8-1577-2014, 2014. a, b
Palerme, C., Genthon, C., Claud, C., Kay, J. E., Wood, N. B., and L'Ecuyer, T.: Evaluation of current and projected Antarctic precipitation in CMIP5 models, Clim. Dynam., 48, 225–239, 2017. Cryosphere, 12, 3775–3789, https://doi.org/10.5194/tc-12-3775-2018, 2018. a, b, c
Palerme, C., Claud, C., Wood, N. B., L'Ecuyer, T., and Genthon, C.: How does ground clutter affect CloudSat snowfall retrievals over ice sheets?, IEEE Geosci. Remote S., 16, 342–346, 2019. a
Souverijns, N., Gossart, A., Lhermitte, S., Gorodetskaya, I. V., Grazioli, J., Berne, A., Duran-Alarcon, C., Boudevillain, B., Genthon, C., Scarchilli, C., and van Lipzig, N. P. M.: Evaluation of the CloudSat surface snowfall product over Antarctica using ground-based precipitation radars, The a
Taylor, K. E., Stouffer, R. J., and Meehl, G. A.: An overview of CMIP5 and the experiment design, B. Am. Meteorol. Soc., 93, 485–498, 2012. a, b
Turner, J., Colwell, S. R., Marshall, G. J., Lachlan-Cope, T. A., Carleton, A. M., Jones, P. D., Lagun, V., Reid, P. A., and Iagovkina, S.: The SCAR READER project: toward a high-quality database of mean Antarctic meteorological observations, J. Climate, 17, 2890–2898, 2004. a
Wood, N. B., L’Ecuyer, T. S., Heymsfield, A. J., and Stephens, G. L.: Microphysical Constraints on Millimeter-Wavelength Scattering Properties of Snow Particles, J. Appl. Meteorol. Clim., 54, 909–931, https://doi.org/10.1175/JAMC-D-14-0137.1, 2015. a
- Abstract
- Introduction
- Data and methods
- Discussion and conclusion
- Appendix A: CMIP5 and CMIP6 version models
- Appendix B: Geographical delimitations for the regional analysis
- Appendix C: CMIP5, CMIP6, ERA5, and CloudSat time series of mean annual surface precipitation rates
- Appendix D: Statistical significance of the 4-year CloudSat snowfall climatology
- Appendix E: CMIP5 and CMIP6 surface air temperature comparison to SCAR READER stations
- Data availability
- Author contributions
- Competing interests
- Acknowledgements
- Financial support
- Review statement
- References