the Creative Commons Attribution 4.0 License.
the Creative Commons Attribution 4.0 License.
 | 27 Jul 2020
Using a composite flow law to model deformation in the NEEM deep ice core, Greenland – Part 2: The role of grain size and premelting on ice deformation at high homologous temperature
Ernst-Jan N. Kuiper
Johannes H. P. de Bresser
Jan Eichler
Gill M. Pennock
The ice microstructure in the lower part of the North Greenland Eemian Ice Drilling (NEEM) ice core consists of relatively fine-grained ice with a single maximum crystallographic preferred orientation (CPO) alternated by much coarser-grained ice with a partial (great circle) girdle or multi-maxima CPO. In this study, the grain-size-sensitive (GSS) composite flow law of Goldsby and Kohlstedt (2001) was used to study the effects of grain size and premelting (liquid-like layer along the grain boundaries) on strain rate in the lower part of the NEEM ice core. The results show that the strain rates predicted in the fine-grained layers are about an order of magnitude higher than in the much coarser-grained layers. The dominant deformation mechanisms, based on the flow relation of Goldsby and Kohlstedt (2001), between the layers is also different, with basal slip rate limited by grain boundary sliding (GBS-limited creep) being the dominant deformation mechanism in the finer-grained layers, while GBS-limited creep and dislocation creep (basal slip rate limited by non-basal slip) contribute both roughly equally to bulk strain in the coarse-grained layers. Due to the large difference in microstructure between finer-grained ice and the coarse-grained ice at premelting temperatures (T>262 K), it is expected that the fine-grained layers deform at high strain rates, while the coarse-grained layers are relatively stagnant. The difference in microstructure, and consequently in viscosity, between impurity-rich and low-impurity ice can have important consequences for ice dynamics close to the bedrock.
- Article
(2585 KB) - Full-text XML
- Companion paper
- BibTeX
- EndNote


As a consequence of anthropogenic global warming, it is expected that global mean sea level (GMSL) rise will accelerate in the next few decades and centuries (e.g., IPCC, 2014; Kopp et al., 2017). To improve predictions of GMSL rise, the flow of ice in polar ice sheet models should be accurately described, since it is expected that the melting of the polar ice sheets will contribute significantly to future GMSL rise (IPCC, 2014). Therefore, a full understanding and description of ice deformation mechanisms in polar ice sheets is required. Ice in the lower part of polar ice sheets is of particular interest. Generally, this ice is expected to deform much faster than the ice closer to the surface, due to the relatively high temperatures and shear stress increase towards the bedrock. However, stress and strain rates near the bedrock can vary considerably due to the influence of variations in bedrock topography, slippery patches or subglacial lakes (e.g., Budd and Rowden-rich, 1985; Gudlaugsson et al., 2016; Wolovick and Creyts, 2016). The high variation in deformation rates in the ice near the bedrock are often shown by borehole surveys (e.g., Gow and Williamson, 1976; Paterson, 1983; Morgan et al., 1998; Thorsteinsson et al., 1999; Weikusat et al., 2017). The main source of heat of the ice near the bedrock is geothermal heat, which typically has a strength of 50–100 mW m−2 (Rogozhina et al., 2016). Locally, other sources of heat can be important, like strain heating (e.g., Krabbendam, 2016) or latent heat released by refreezing of meltwater (e.g., Zwally et al., 2002; Van de Wal et al., 2008; Catania and Neumann, 2010).
Ice deformation experiments have shown that the effect of temperature on the strain rate of ice can be described via a calibrated Arrhenius-type flow law relating equivalent strain rate to equivalent stress and temperature (e.g., Glen, 1955; Homer and Glen, 1978). However, at temperatures close to the melting point, the strain rate increase has been found to be higher than predicted by the extrapolation of lower-temperature results using the Arrhenius relation (e.g., Budd and Jacka, 1989), inferred to be due to the initiation of a new high-temperature deformation mechanism or due to the enhancement of the original one. To account for the latter, a higher activation energy is often used above a certain temperature threshold (e.g., Mellor and Testa, 1969; Barnes et al., 1971; Morgan, 1991; Paterson, 1994; Goldsby and Kohlstedt, 2001). This higher activation energy, which is the result of a simple best-fit approach of temperature and strain rate using a Arrhenius-type relation, lacks a good link with the controlling deformation mechanism, assumed to be intracrystalline dislocation motion. Therefore, its application is well established but is not well founded for two reasons. First, the enhancement in strain rate in the high-temperature regime is not described well by a constant activation energy (Mellor and Testa, 1969; Morgan, 1991; Budd and Jacka, 1989; Treverrow et al., 2012). In fact the apparent activation energy for secondary (or minimum) creep rate changes from 77 to 500 kJ mol−1 in the temperature range from −10 to −0.05 ∘C (Budd and Jacka, 1989), so the assumption of a constant value is a gross simplification. Second, there is no particular microphysical basis for an increased activation energy for creep in the high-temperature regime. The enhanced creep rate may be caused by an effect of brine content on creep rate, with brine content increasing with temperature. In experiments on ice single crystals and bi-crystals close to the melting point (Homer and Glen, 1978; Jones and Brunet, 1978), a strong strain rate increase has not been observed. This strongly suggests that the strain rate enhancement in natural ice close to the melting point is related to the occurrence of grain boundaries.
Premelting along grain boundaries has often been stated as being responsible for the high strain rates during ice deformation tests at high temperatures (e.g., Mellor and Testa, 1969; Dash et al., 1995, 2006; Wilson et al., 1996; Wilson and Zhang, 1996). Premelting is expected to initiate at surfaces or interfaces such as grain boundaries where the crystallographic structure is disrupted and molecules can adopt liquid-like qualities at temperatures below the melting point (e.g., Orem and Adamson, 1969; Barnes et al., 1971; Dash et al., 1995, 2006; Döppenschmidt et al., 1998). A vast amount of theory and indirect measurements indicate that quasi-liquid, disordered layers are present along ice surfaces and grain boundaries at 10 to 20 ∘C below the bulk melting temperature (Dash et al., 2006; Vaughan et al., 2016; Thomson et al., 2013). At temperatures above −15 to −10 ∘C, grain boundary mobility in ice increases by 2 to 4 orders of magnitude (Duval and Castelnau, 1995; Schulson and Duval, 2009), and premelting may be responsible for this increase in grain boundary mobility (De La Chapelle et al. 1998). In this paper we accept the hypothesis that the enhanced creep rate and grain boundary mobility in ice at temperatures above about −10 ∘C are related to premelting along grain boundaries. Although, as noted by Dash et al. (2006), “it has yet to be conclusively demonstrated whether or not grain boundary melting contributes to the explanation for these phenomena”.
The different activation energy reflecting the onset of premelting is used widely at a temperature threshold of −10 ∘C (263 K), when applying Glen's flow law in ice sheet models (e.g., Paterson, 1994), but a higher-temperature threshold of −8 ∘C (285 K) (Barnes et al., 1971) or lower-temperature thresholds of −15 ∘C (258 K) to −18 ∘C (255 K) (Goldsby and Kohlstedt, 2001) should be considered. As noted above, the assumption of a constant activation energy above the temperature threshold, is a gross simplification; however, as this approach is widely used in ice sheet models and the only available grain-size-sensitive flow laws (Goldsby and Kohlstedt, 2001) use a constant activation energy in the high-temperature regime, we will follow this approach. As temperature generally increases with depth in polar ice sheets, the temperature where premelting starts to affect ice rheology is important. A low premelting temperature would mean that a considerably larger portion of the ice is affected by premelting and hence will show strain rate enhancement over a larger range compared to a higher-temperature threshold.
At temperatures close to the melting point in the lower part of polar ice cores, a particular type of microstructure with very coarse grains and interlocking grain boundaries is often found (e.g., Gow and Williams, 1976; Gow and Engelhardt, 2000; NEEM community members, 2013; Weikusat et al., 2017). In the lower part of the North Greenland Eemian Ice Drilling (NEEM) ice core (NEEM community members, 2013) such regions of coarse, interlocking grains are alternated by regions of finer grains. In the case of the NEEM ice core, the alternated layers of fine- and coarse-grained ice are the result of stratigraphic disruptions and overturned folds, which consist of low-impurity Eemian interglacial ice and impurity-rich ice from the late Eemian and the Penultimate Glacial period (Fig. 1) (NEEM community members, 2013).
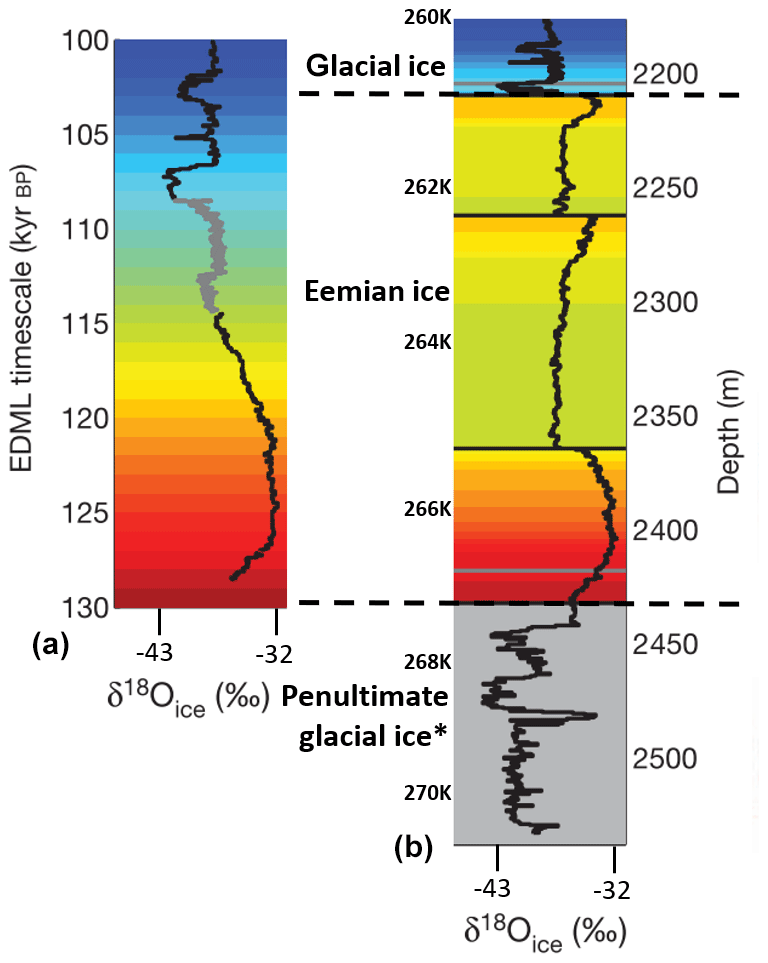
Figure 1(a) The reconstructed water stable isotope (δ18Oice) record from NEEM on the EDML1 timescale. The grey curve between 114 and 108 kyr BP is NGRIP data. The background has been color-coded based on age. (b) The NEEM stable isotope (δ18Oice) record on the original depth scale. No dating was attempted below 2432.2 m depth. The two dotted lines separate the Glacial, Eemian and what is likely the Penultimate Glacial ice (indicated by *). The in situ temperature at several depths in the NEEM ice core is indicated. This figure is based on data from NEEM community members (2013).
These coarse-grained layers at the bottom of some polar ice cores typically possess crystallographic preferred orientations (CPOs) that could be described as multi-maxima, although the exact type of CPO is often unclear due to the low number of grains measured in individual thin sections. The coarse grains and multi-maxima CPO are thought to be the result of rapid strain-induced boundary migration (SIBM) in combination with the nucleation of new grains (SIBM-N) (e.g., Alley, 1992; Duval and Castelnau, 1995; Durand et al., 2009; Faria et al., 2014a), where, based on the coarse grain size, SIBM is likely more important than nucleation of new grains. SIBM is the migration of grain boundaries driven by the difference in stored strain energy between neighboring grains that result from lattice distortions such as dislocations (Humphreys and Hatherly, 2004). SIBM starts in firn (Kipfstuhl et al., 2006, 2009) and is assumed to increase grain size (e.g., Duval and Castelnau, 1995), although under certain conditions SIBM can also be a grain-size-reducing mechanism by grain dissection (Steinbach et al., 2017). The layers of alternating grain size in deeper NEEM samples allow for the study of the effect of grain size on strain rate and CPO development in the high-temperature regime where enhanced creep and recrystallization can be explained by the occurrence of premelting along grain boundaries.
In this study, the composite flow law of Goldsby and Kohlstedt (2001) was used to explore the effect of grain size on strain rate in the lower part of the NEEM ice core. The composite flow law describes the deformation of polycrystalline ice as a combination of grain-size-sensitive (GSS) and grain-size-insensitive (GSI) deformation mechanisms, where the dominant deformation mechanism depends on the temperature, stress and grain size. Compared to our companion paper (Kuiper et al., 2020), which describes ice deformation at relatively low temperatures in the upper 2207 m of the NEEM ice core, the emphasis in this paper is on possible differences in the controlling deformation mechanism close to the melting point, that is, in the premelting regime below 2207 m depth. The results from flow law calculations were combined with CPO data to study deformation mechanisms in the lower part of the NEEM ice core. The NEEM ice core was chosen because of the high density of reflective light microscopy (LM) images (Kipfstuhl, 2010; Binder et al., 2013) and the alternation of fine- and coarse-grained layers in the lower part of the ice core. These reflective LM images were used to determine the change in grain size with depth (Binder, 2014). Furthermore, the CPO data of the NEEM ice core (Eichler et al., 2013a) were available. A critical assessment of the temperature threshold for the onset of enhanced recrystallization and creep caused by premelting in polar ice sheets led to a modification of the composite flow law of Goldsby and Kohlstedt (2001). The NEEM ice core data were used to calculate the strain rate predicted by Glen's flow law (Glen, 1952, 1955; Paterson, 1994) and by the modified composite flow law of Goldsby and Kohlstedt (2001) in the lower part of the NEEM ice core. Comparing the results from the modified composite flow law with the results obtained using Glen's flow law is an interesting “control” since Glen's flow law is the most often used flow law in polar ice sheet models. Possible deformation mechanisms are discussed.
2.1 The NEEM ice core and ice microstructure data
The NEEM ice core, located in northwestern Greenland (77.45∘ N, 51.06∘ W), was drilled during the field seasons of 2008–2012 (NEEM community members, 2013; Rasmussen et al., 2013). The NEEM ice core is 2540 m long, with ice deposited during the Holocene (Holocene ice) extending to a depth of 1419 m (Montagnat et al., 2014). Ice deposited during the last glacial period (glacial ice) lies below, reaching a depth of 2207 m. The layering in the underlaying Eemian ice is strongly disturbed, and four stratigraphic disruptions were identified at 2209.6, 2262.2, 2364.5 and 2432.2 m depth by discontinuities in oxygen stable isotope values (δ18Oice) of H2O and methane (CH4) concentrations (NEEM community members, 2013). These repeated and overturned parts are mainly from the late Eemian, which causes the coarse-grained Eemian ice to be alternated with the finer-grained late Eemian ice. Below 2432.2 m depth, in the lowest 330 m of the NEEM ice core, there is undated finer-grained, impurity-rich ice that is thought to be from the Penultimate Glacial period. In the remainder of this study, the ice from 2207 m depth to the ice–bedrock interface at 2540 m depth will be referred to as the “Eemian-glacial facies”. The lower part of the glacial ice of the NEEM ice core, from 2000 to 2207 m depth was included in this study to show the contrast in grain size, CPO and calculated strain rate between the glacial ice and the deeper Eemian-glacial facies. Therefore, the available LM images, orientation images and CPO data below 2000 m depth were included in this study. Calculations using the GSS composite flow law of Goldsby and Kohlstedt require grain size as an input variable. The grain size data in the lowest 540 m of the NEEM ice core were obtained using 224 large area scanning macroscope (LASM) images (Kipfstuhl, 2010) taken using reflective light macroscopy (Krischke et al., 2015). This method uses thermal etching by sublimation to reveal subgrain boundaries as grooves on the surface of the ice core sample (e.g., Saylor and Rohrer, 1999) and has a resolution of 5 µm per pixel edge. Each LASM image is about 90 mm long by about 55 mm wide (Kipfstuhl et al., 2006) and was digitally analyzed using the Ice-image software (http://www.ice-image.org/, last access: 1 April 2020) (Binder et al., 2013; Binder, 2014). The software automatically detects the grain area of each grain by counting the pixels enclosed by grain boundaries. The total area classified as “grain” by the Ice-image software was divided by the number of grains to give a mean area. The equivalent grain diameter was calculated from the mean area; this is always larger than the mean diameter calculated from the population of diameter measurements. Deriving a full grain size distribution, as was done in the companion paper (Part 1), was not possible in the Eemian-glacial facies because the number of grains in the LASM images (90×55 mm) of the coarse-grained layers was too low. Grains with a diameter <0.3 mm were excluded from the data set, as these grains are often artifacts caused by relaxation (Binder, 2014). In some parts of the Eemian-glacial facies, the grains are up to several centimeters and the grain boundaries are irregular with many grain boundary bulges. It is not possible to determine a mean grain size for these ice core sections by the Ice-image software as these grains often cross the edge of the LM images and are therefore not included in the grain size data (Binder, 2014). After visual inspection of the LASM images to check the grain size, the ice core sections containing very large grains were assigned a mean grain diameter of 30 mm, which was the estimated grain diameter based on the LASM images.
An automatic fabric analyzer (FA) was used to create high-resolution maps of the c-axes orientations. The method is based on the double-refracting properties of the hexagonal ice crystal. It offers a fast alternative for the measurement of crystal orientations, which are, however, limited only to the c axes. The grains in each orientation image were plotted in a pole figure. For each orientation image, the Woodcock parameter, k, was calculated according to Woodcock (1977):
where λ1, λ2 and λ3 are the normalized eigenvalues of the second-order orientation tensor with . The Woodcock parameter is often used in order to distinguish between cluster and girdle type of CPOs. A distribution with a Woodcock parameter >1 indicates a cluster, while a Woodcock parameter <1 indicates a girdle. Further computer-based analysis (Eichler et al., 2013a) of the FA-CPO-maps enables the derivation of a variety of microstructural parameters, such as mean grain shape or size. These can be used as complementary values to the LASM analysis data. However, these microstructural parameters can differ significantly from the microstructural parameters obtained by the Ice-image software (http://www.ice-image.org/, last access: 13 July 2020) (Binder et al., 2013; Binder, 2014). For instance, the effective diameter derived from the orientation images in this study is systematically shifted towards lower values, which is mainly caused by the exclusion of grains with a grain diameter <0.3 mm in the LASM method, as was described above. In the remainder of this paper, the grain size (effective diameter) determined using the Ice-image software (Binder et al., 2013; Binder, 2014) will be used unless stated otherwise.
2.2 Flow laws and flow law parameters
One of the two flow laws that was used during this study is the composite flow law of Goldsby and Kohlstedt (2001). The composite flow law was derived during uniaxial deformation tests in secondary creep with very fine-grained ice (Goldsby and Kohlstedt, 1997, 2001). The composite flow law combines different deformation mechanisms of ice explicitly, instead of presenting a series of individual flow laws. During their uniaxial deformation experiments on artificial fine-grained ice in secondary creep, Goldsby and Kohlstedt (1997, 2001) defined a composite flow law with rate contributions from four mechanisms:
where is the strain rate. refers to dislocation creep where basal slip is the main strain-producing mechanism that is rate-limited by non-basal slip and refers to diffusion creep. Basal slip and grain boundary sliding are sequential processes acting together, where the slower mechanism determines the overall strain rate by rate-limiting the faster mechanism (Durham and Stern, 2001). In the part in parentheses in Eq. (2), refers to basal slip, while refers to grain boundary sliding (GBS). Under stress, grain size and temperature conditions appropriate for terrestrial ice, diffusion creep and grain boundary sliding rate limited by basal slip are not relevant for ice deformation (Goldsby and Kohlstedt, 2001; Goldsby, 2006). Therefore, the composite flow law simplifies to
The strain rate produced by creep can be described by the following general flow law:
where is the strain rate (s−1), A is a material parameter, σ is the stress (MPa), n is the stress exponent (dimensionless), d is the grain size (m), p is the grain size exponent (dimensionless), Q is the activation energy (kJ mol−1), R the gas constant (J K−1 mol−1) and T the absolute temperature (K) corrected for the change in pressure-melting point due to the cryostatic pressure. The value for p determines whether the creep is grain size insensitive (p=0) or grain size sensitive (p≠0). The mean grain diameter, as determined from LASM images with the Ice-image software, was used for the calculation of the strain rate produced by GBS-limited creep.
If the temperature is expressed in terms of the difference with the pressure-melting point, ice can, as a first-order approximation, be considered incompressible (Rigsby, 1958; Doake and Wolff, 1985, Greve et al., 2014). The pressure-melting temperature was calculated according to
where Tm is the pressure-melting temperature (∘C), C is the pressure-melting constant for glacier ice ( ∘C Pa−1; Lliboutry, 1976) and ΔP is the overburden pressure (Pa) which was calculated according to
where ρice is the density of ice (910 kg m−3), hice is the ice thickness (m) and g is the gravitational constant (9.81 m s−2). The in situ temperature (T) profile of the NEEM ice core was taken from Sheldon et al. (2014). In the remainder of this paper, T∗ is used for the difference in temperature of the ice at a certain depth with respect to the pressure-melting point at that depth, which can be calculated according to
T∗ was used in Eq. (4) to calculate the strain rates in the lower part of the NEEM ice core according to Glen's flow law and the composite flow law. At the base of the 2540 m long NEEM ice core, the pressure-melting point is calculated to be −2.2 ∘C (271 K). For example, the in situ temperature at the ice–bedrock interface at NEEM is −3.4 ∘C, which would give a T∗ of −1.2 ∘C (Eq. 7).
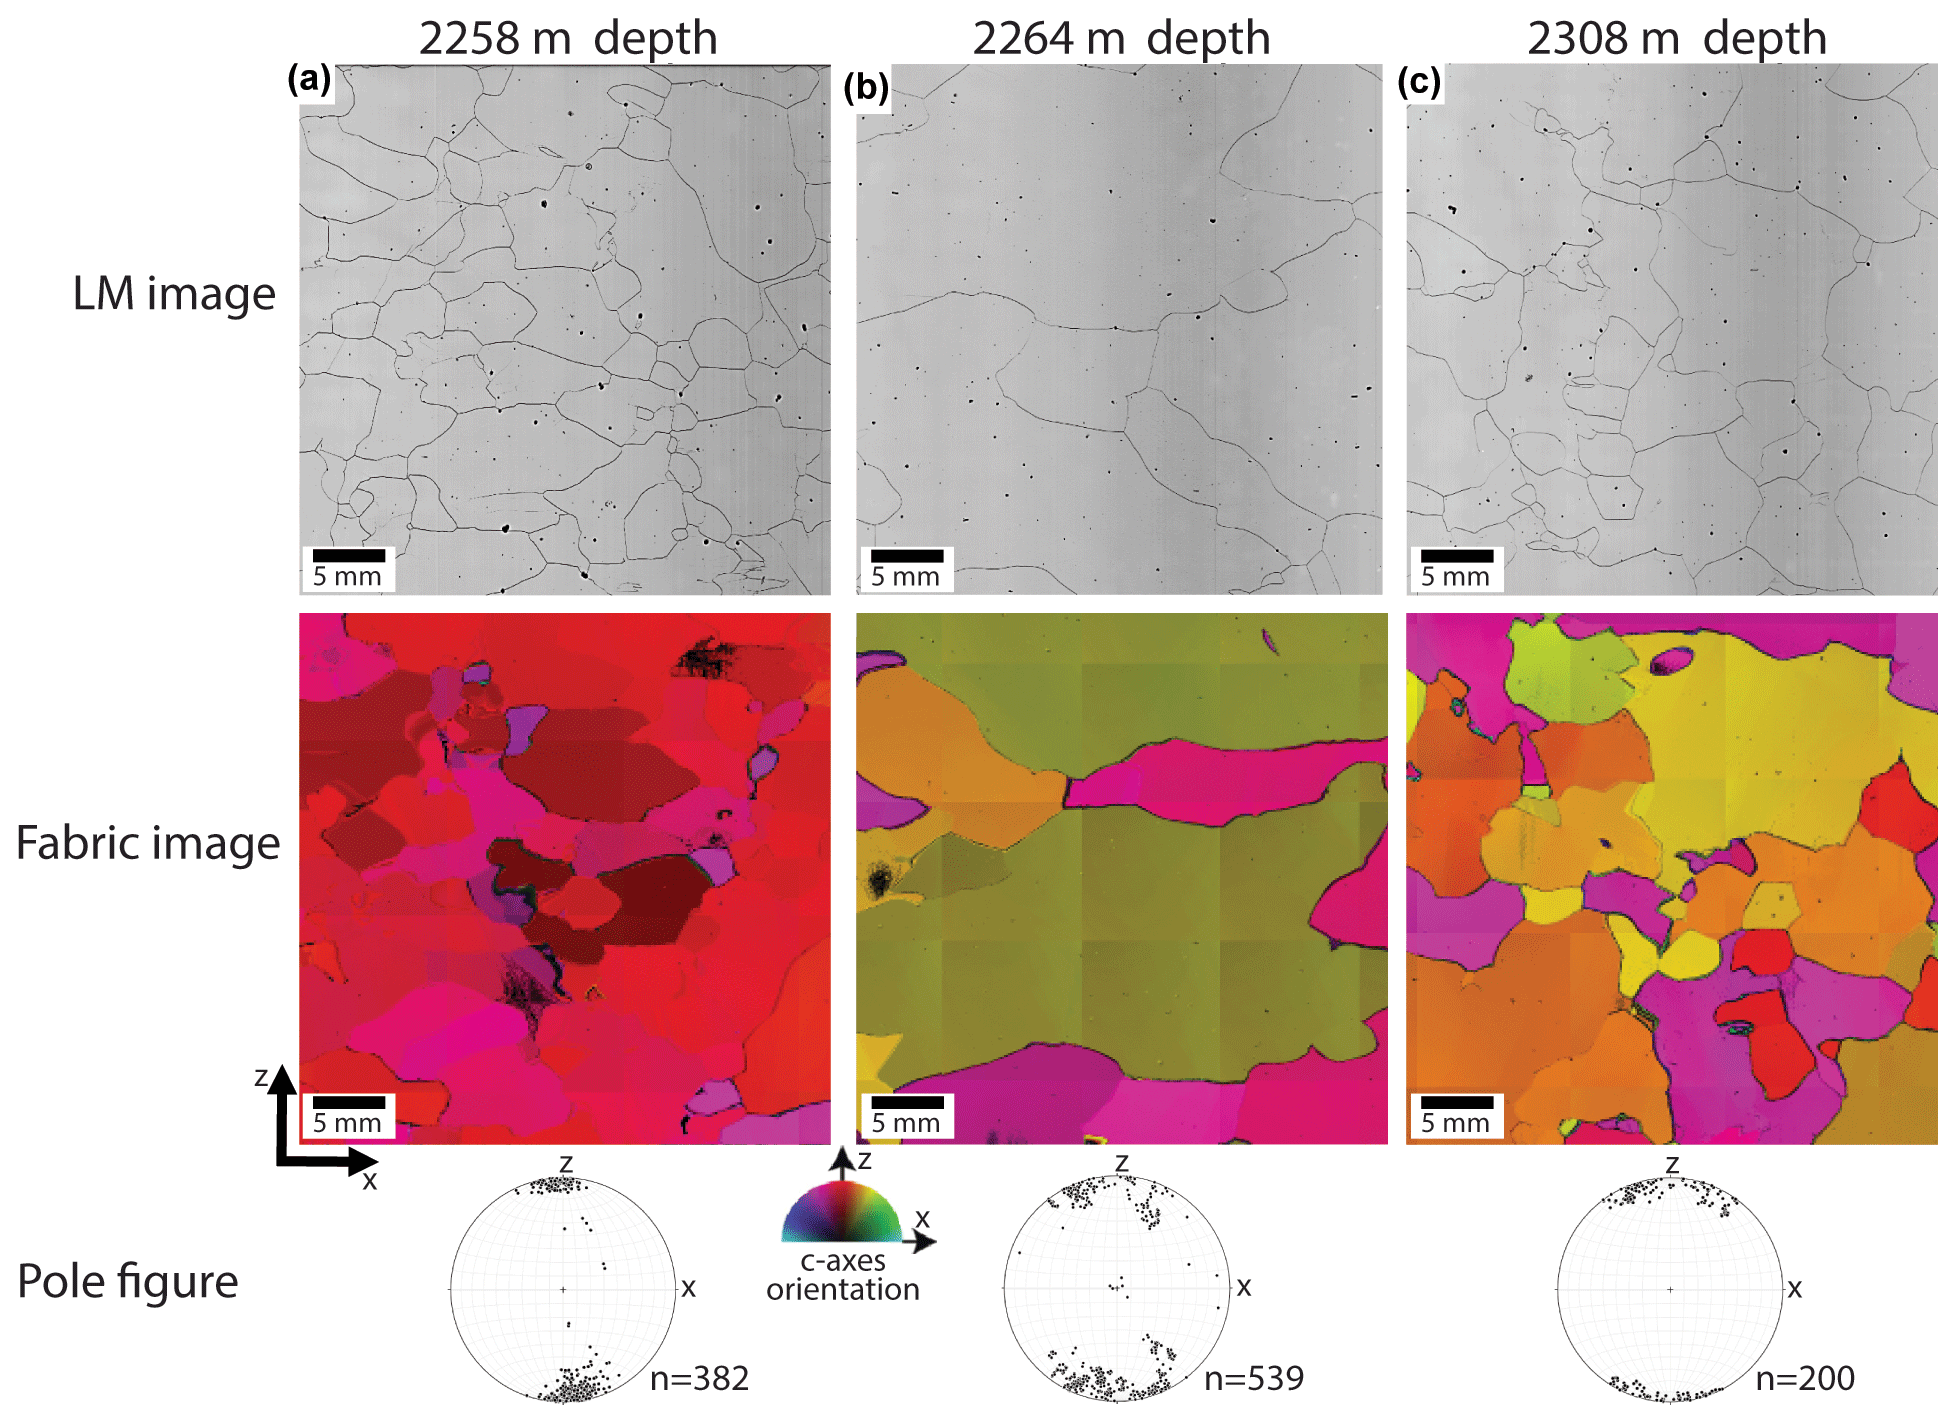
Figure 2The LASM, FA images and pole figures from three different ice core sections in the Eemian-glacial facies. The ice core sections in (a) and (b) are just above (2258 m depth) and below (2264 m depth) the stratigraphic disruption at 2262.2 m depth, while (c) is from the middle of one of the overturned layers (2308 m depth). The z axis is parallel to the (vertical) ice core axis. The number of grains n included in the whole (90×55 mm) orientation (fabric) image and pole figure is provided next to the pole figure (equal area, vertical plane, one point per grain). The pole figure in (b) contains the c-axes data from six consecutive ice core sections to increase the number of grains in the pole figure. LM images are taken from Kipfstuhl (2010) (https://doi.pangaea.de/10.1594/PANGAEA.743296). Fabric images and pole figures are taken from Weikusat and Kipfstuhl (2010) (https://doi.pangaea.de/10.1594/PANGAEA.744004).
The other flow law that was used in the this study is “Glen's flow law” (Glen, 1952, 1955; Paterson, 1994), which is a group of flow laws that are commonly used in ice sheet modeling. Glen's flow law is based on the results of uniaxial compression experiments on artificial, (initially) isotropic polycrystalline ice. Glen's flow law has the same form as Eq. (4) but is independent of grain size (i.e., p=0) and the form of Glen's flow law that is most often used has a stress exponent of n=3 (Paterson, 1994). However, at the low stress conditions with strong CPO development, a higher value of n of 3.5–4 might be a better approximation of ice dynamics in polar ice sheets, as shown by Treverrow et al. (2012), Bons et al. (2018) and others.
Following the analysis presented in our companion paper (Part 1), a constant equivalent stress of 0.07 MPa was taken as input for Glen's flow law and the composite flow law. This assumption is a useful first approximation for the NEEM ice core, where the equivalent stress, related to the shear stress in the lower part of the ice core, is by coincidence similar to the magnitude of equivalent stress related to the vertical stress in the upper part of the ice core. We explore the effect of grain size on the dominant deformation mechanism and the total strain rate, it is beyond the scope of this study to derive a stress-depth model for NEEM because this requires knowledge of the rheology, which is the property that is investigated here. When calculating strain rates, no distinction is made between simple shear and pure shear deformation.
3.1 Ice microstructure in the Eemian-glacial facies
Figure 2 shows reflective LM images and orientation images with pole figures of three ice core sections at 2258, 2264, 2308 m depth in the Eemian-glacial facies. Only a part of the 90×55 mm ice core sections is shown in the LM and fabric images, while the pole figure shows the c axes of all the grains in the 90×55 mm ice core section. The ice core section at 2258 m depth in Fig. 2a is from just above the stratigraphic disruption at 2262.2 m depth, while the ice core section at 2264 m depth in Fig. 2b is from just below this stratigraphic disruption. The ice core section in Fig. 2c is from 2308 m depth in the middle of one of the overturned layers (NEEM community members, 2013). The ice core section in Fig. 2a is one of the finer-grained ice core sections in the Eemian-glacial facies, with a mean grain size of about 5 mm, and originates from the late Eemian (NEEM community members, 2013). The orientation image and pole figure of Fig. 2a show that, similar to the glacial ice (1419–2207 m depth; Montagnat et al., 2014), almost all c axes are strongly aligned parallel to the vertical ice core axis. However, compared to the glacial ice, the grain size of the ice core section in Fig. 2a is slightly larger and the grain shape is more irregular. The ice core section in Fig. 2b is one of the ice core sections that was given a mean grain size of 30 mm, typical of the Eemian ice with high δ18Oice and low-impurity content deposited under warm interglacial conditions (NEEM community members, 2013). The grains have an irregular shape with many millimeter-sized bulges along the grain boundaries. The orientation image and pole figure show that the c axes are distributed in a partial (great circle) girdle spanning about 40∘ from the vertical axis. However, in some cases the c-axes distribution can also be classified as a multi-maxima CPO. The ice core section in Fig. 2c has a mean grain size of about 7 mm and originates from the end of the Eemian period (NEEM community members, 2013). The grain boundaries are bulging and have an irregular shape. The orientation image and pole figure show that the c axes are distributed in a partial (great circle) girdle spanning about 30 to 40∘ from the vertical axis.
3.2 Correlation mean grain diameter with type and strength of CPO
The correlation between the mean grain diameter and the type and strength of CPO in the lowest 540 m of the NEEM ice core is shown in Fig. 3a and b. This figure shows the first c-axes eigenvalue, λ3 in Eq. (1) (Eichler et al., 2013a), and the Woodcock parameter (Woodcock, 1977) versus the mean grain diameter for each orientation image in the lower part of the glacial ice (2000–2207 m depth) and the ice in the Eemian-glacial facies (2207–2540 m depth). The ice from the lower part of the glacial period (2000–2207 m depth), which has a finer mean grain diameter (about 2 mm) than the ice in the Eemian-glacial facies, has a c-axes eigenvalue of λ3>0.9 and the Woodcock parameter typically varies from 4 to 10. Some of the finest-grained regions in the Eemian-glacial facies have a slightly larger mean grain diameter (3–5 mm) with a similar c-axes eigenvalue of λ3>0.9 and a rather similar Woodcock parameter of about 2–10. For ice core sections with a mean grain diameter larger than about 5 mm, the eigenvalue is λ3<0.9, with a Woodcock parameter varying from 0.3 to 10. However, the number of grains per orientation image decreases with increasing grain size, and therefore the statistical significance of the first eigenvalue and Woodcock parameter decreases with increasing mean grain diameter. Based on Fig. 3, two classes of microstructure can be distinguished based on mean grain diameter and type and strength of CPO. The first class has a relatively fine mean grain diameter of <5 mm that is comparable in eigenvalue and Woodcock parameter to the glacial ice (green rectangle). The other class has a mean grain diameter of >5 mm with a relatively low first eigenvalue and Woodcock parameter (yellow rectangle). The mean grain diameter in Fig. 3 was derived from orientation images, which gives a slightly lower mean grain diameter than the mean grain diameter derived using the Ice-image software, as in Fig. 2.

Figure 3(a) The first c axis eigenvalue (dots) and (b) the Woodcock parameter (open squares) per FA image versus the mean grain diameter of the ice core sections in the lower part of the glacial ice (2000–2207 m depth) in blue and the Eemian-glacial facies (2207–2540 m depth) in red. Two classes of grains can be distinguished based on mean grain diameter, eigenvalue and Woodcock parameter. One class (green rectangle) has a fine mean grain size <5 mm and a first eigenvalue and Woodcock parameter that are comparable to the Glacial ice and the other class (yellow rectangle) with a larger mean grain diameter (>5 mm) that has a lower eigenvalue and predominantly lower Woodcock parameter.
3.3 Transition temperature: NEEM results compared to other polar ice cores
Table 1 shows data from eight polar ice cores drilled at the Greenland and Antarctic ice sheets that contain a sudden increase in grain size and change in CPO in the lower part of the ice core. The in situ temperature at the bottom of the boreholes varies significantly between the ice cores. The ice near the bedrock at GISP2 and GRIP was frozen to the bed, while for Byrd, EDC, EDML, NEEM and Siple Dome the ice was at, or very close to, pressure-melting point. In all eight ice cores, the CPO and grain size start to change at an in situ temperature of about −13 ∘C (260 K). For the NEEM ice core, this transition coincides with the climatic transition of the end of the Eemian period, also known as marine isotope stage (MIS) 5e, to the beginning of last glacial period (MIS 5d). The transitions to coarse grains with a multi-maxima CPO in the EDML, GISP2 and GRIP ice core also coincides with a climatic transition. For the other four ice cores, the transition to a different microstructure does not coincide with a major climatic transition. The pressure-corrected temperature threshold (T∗, Eqs. 5–7) at which this transition occurs in these polar ice cores is remarkably constant at T∗ of −11 ∘C (262 K). The depth in the ice cores at which the microstructure changes to large grains and a multi-maxima CPO is different for each ice core, which leads to a slightly different T∗ when correcting for the change in pressure-melting point with depth (Eqs. 5–7). However, when taking into account the uncertainty in determining the in situ temperature at a certain depth and the possible influence of the different impurity contents between the ice cores and individual layers in the same ice core that affect the pressure-melting point, the effect of correcting the temperature at which the microstructure changes due to changes in overburden pressure is small. A different cause for the sudden change in ice microstructure is stress relaxation due to the disruption of simple shear flow by the bedrock topography. This leads to more stagnant ice which, at the elevated temperatures close to the bedrock, can start to recover and recrystallize. However, the alternation of different microstructures with finer and coarser grain, as found at NEEM, cannot be explained in this way.
Table 1Polar ice cores drilled at the Greenland and Antarctic ice sheets that show a sudden increase in grain size and change in CPO in the lower part of the ice core. The depth where these changes occur is given, together with ice core length, bottom borehole temperature, in situ temperature and the pressure-corrected temperature (T∗) at the sudden grain size increase and change in CPO, and the age of the ice at the transition to a sudden grain size increase and change in CPO. The age of the ice is given in marine isotope stages (MIS) and approximate ka value (Lisiecki and Raymo, 2005).
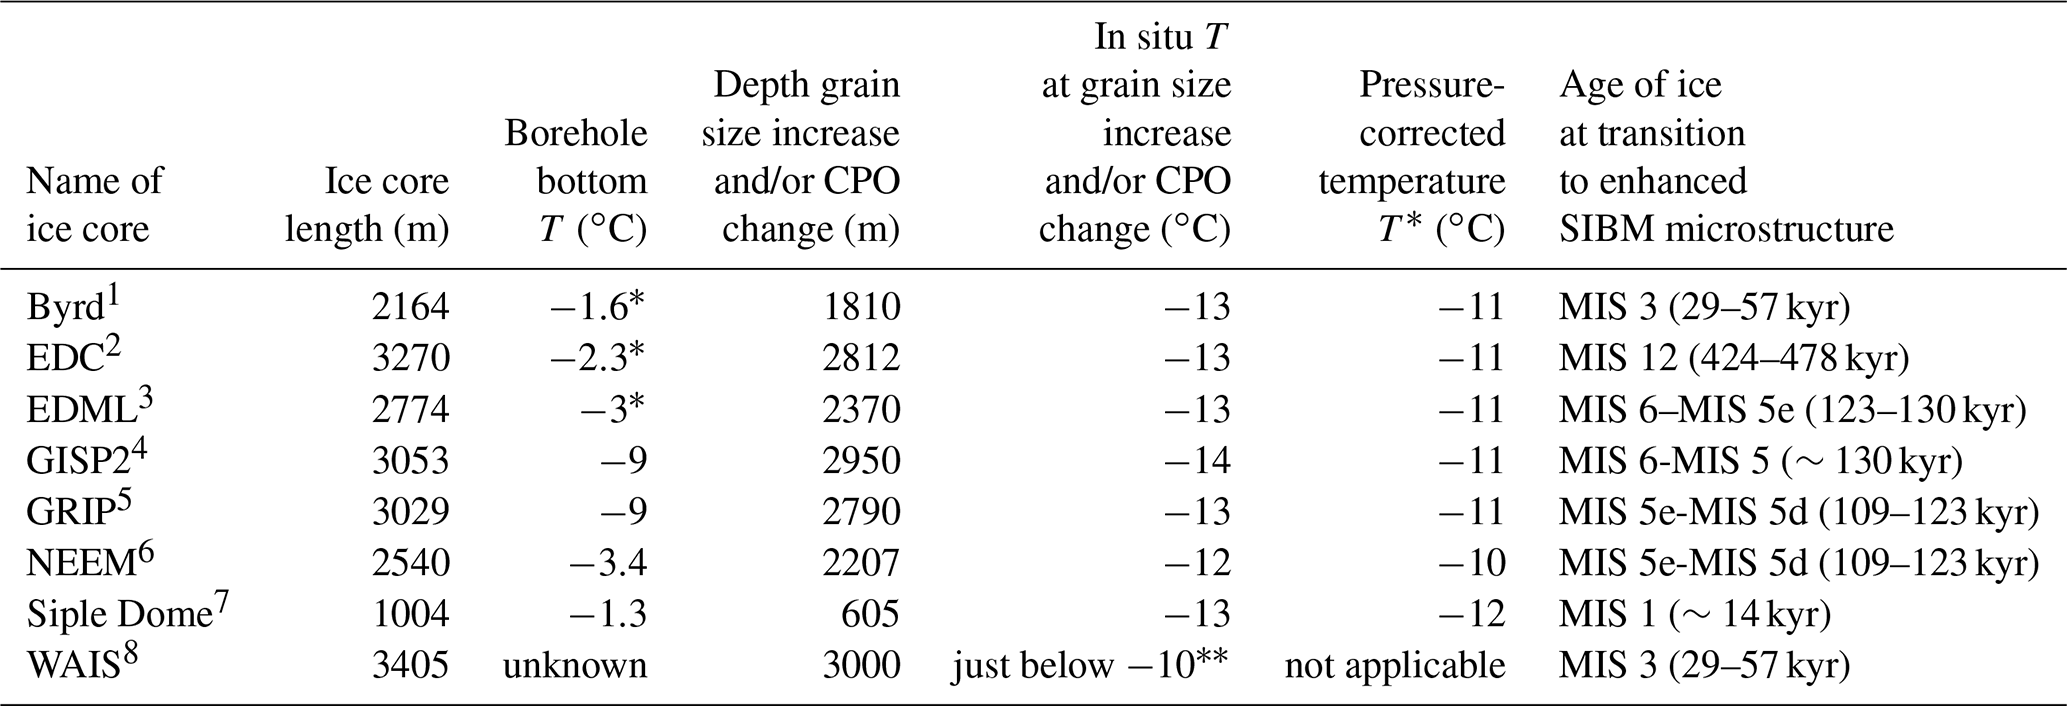
∗ Subglacial water encountered during drilling close to the bedrock. A specific temperature was not given, only that the grain size increase started just below −10 ∘C. 1 Gow and Williamson (1976), Hammer et al. (1994), Gow and Engelhardt (2000), Epstein et al. (2011). 2 EPICA community members (2004), Augustin et al. (2007), Durand et al. (2009). 3 Ruth et al. (2007), Weikusat et al. (2017). 4 Gow et al. (1997), Suwa et al. (2006). 5 Johnsen et al. (1995), Thorsteinsson et al. (1997), Suwa et al. (2006). 6 NEEM community members (2013), Sheldon et al. (2014). 7 Nereson et al. (1996), Gow and Engelhardt (2000). 8 Fitzpatrick et al. (2014), Buizert et al. (2015).
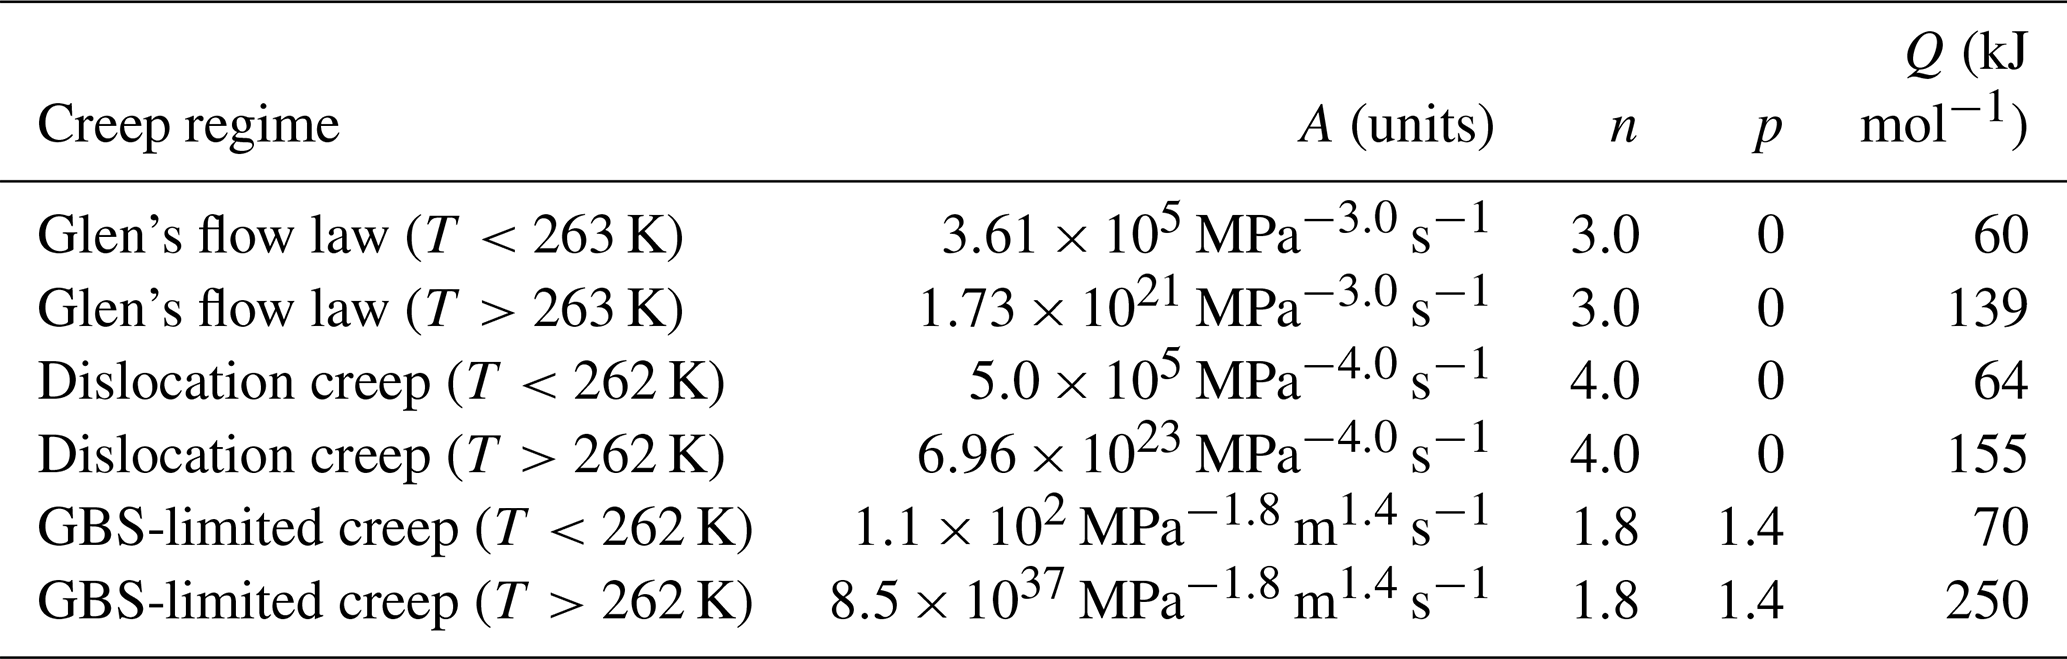
The flow law parameters of the original composite flow law (Goldsby and Kohlstedt, 2001) shown in Table 2 were modified to fit the temperature (T∗) threshold of −11 ∘C (262 K) for premelting, as derived from Table 1 and the experimental data points from Goldsby and Kohlstedt (2001). Another reason for modifying the dislocation creep parameters is improve the fit of the dislocation creep flow law and the experimental data of Goldsby and Kohlstedt (2001), as explained in the companion paper (Part 1). Both the flow law parameters for dislocation creep and GBS-limited creep were modified and are given in Table 3. Since the flow law parameters for GBS-limited creep were adjusted to be consistent with a temperature (T∗) threshold of 262 K, they are different from the flow law parameters used in our companion paper.
Figure 4 shows the temperature versus the calculated strain rate using the original flow law parameters of Glen's flow law (Paterson, 1994) and the members of the modified flow law parameters of the composite flow law (Table 3). The calculated strain rates for Glen's flow law, dislocation creep and GBS-limited creep increase with increasing temperature and show a kink at the temperature threshold of 263 K (Glen's flow law) or 262 K (modified composite flow law). The strain rate increase with temperature of the GBS-limited creep mechanism above the temperature threshold of 262 K is considerably higher than that for the dislocation creep mechanism or Glen's flow law, although this difference is largely related to our choice of Paterson's (1994) version of Glen's flow law. Using the Budd and Jacka (1989) description for the temperature sensitivity of Glen's law would produce different results.
3.4 Calculated strain rates and deformation mechanisms
Figure 5 shows the calculated strain rates, along with the relevant microstructural data (Binder et al., 2013; Eichler et al., 2013a; NEEM community members, 2013; Binder, 2014). The modified composite flow law shows that the calculated strain rate in the lower part of the glacial ice, which reaches to a depth of 2207 m (NEEM community members, 2013), is about s−1 and that the CPO has a strong single maximum. The dominant deformation mechanism of the modified composite flow law in the lower part of the glacial ice is GBS-limited creep, with only a very small contribution of dislocation creep to bulk strain rate. Glen's flow law predicts a higher strain rate (about 10−10 s−1) than the modified composite flow law in the lower part of the glacial ice. At the interface between the glacial ice and Eemian-glacial facies, the calculated strain rate for the composite flow law drops by about an order of magnitude. The relative contribution of the two members of the composite flow law changes as well with GBS-limited creep and dislocation creep contributing roughly equally to bulk strain rate. At the same depth, the CPO changes from a strong single maximum in the glacial ice to a partial girdle in the upper part of the Eemian-glacial facies. The calculated strain rate of the modified composite flow law varies by about an order of magnitude between the finer- and coarser-grained regions close to the stratigraphic disruptions. This variation in calculated strain rate close to the stratigraphic disruptions is produced by GBS-limited creep, which is affected by the change in grain size. The strain rate produced by dislocation creep, which is not affected by the variation in grain size, steadily increases with depth throughout the Eemian-glacial facies. Glen's flow law, which is not affected by grain size variation either, predicts an increasing strain rate with depth and a higher strain rate than the modified composite flow law in the entire Eemian-glacial facies. The increase in strain rate coincides with the increase in temperature along the NEEM ice core (Fig. 1 in Kuiper et al., 2020).
The relative contribution of GBS-limited creep and dislocation creep to the bulk strain rate of the modified composite flow law is roughly equal for the ice core sections that were assigned a mean grain diameter of 30 mm just below the stratigraphic disruptions at 2209.6 and 2262.2 m depth. At deeper levels, the contribution of GBS-limited creep to bulk strain rate for these coarse-grained ice core sections increases. The increase in relative contribution of GBS-limited creep to bulk strain rate, at the assigned constant grain size of 30 mm, results from the lower activation energy at T>262 K for dislocation creep compared to GBS-limited creep (Table 3, Fig. 4). The difference in activation energy for Glen's flow law and the dislocation creep mechanism above their temperature thresholds is rather small (Table 3), which results in an almost similar order of magnitude strain rate increase with depth. The relative changes in strain rate between the different flow laws are very sensitive to activation energies used (Table 3). In the case of Glen's law and possibly for the dislocation creep mechanism, a higher activation energy could apply close to the melting temperature (e.g., Budd and Jacka, 1989).
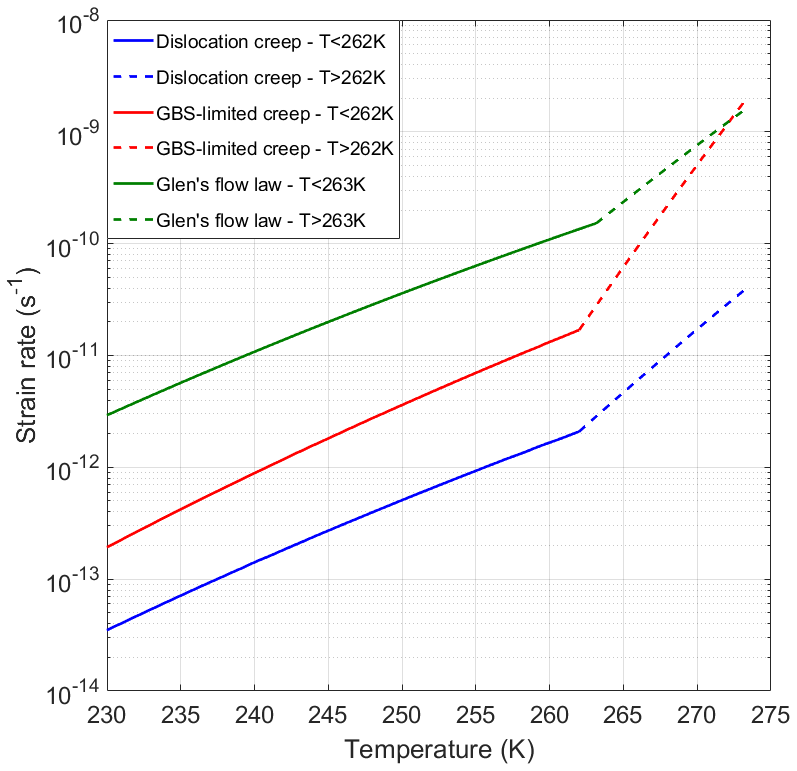
Figure 4Log strain rate versus temperature for Glen's flow law and the two mechanisms (dislocation creep and GBS-limited creep) that form the members of the modified composite flow law, using the flow law parameters from Table 3. A stress of 0.07 MPa and a mean grain diameter of 5 mm were used to calculate the strain rate.
Table 2The flow law parameters of Glen's flow law (Paterson, 1994) and the end-members of the original composite flow law for dislocation creep and GBS-limited creep. The corrected flow law parameters used in the companion paper are also shown below the dotted line. The flow law parameters used in this paper are shown in Table 3.
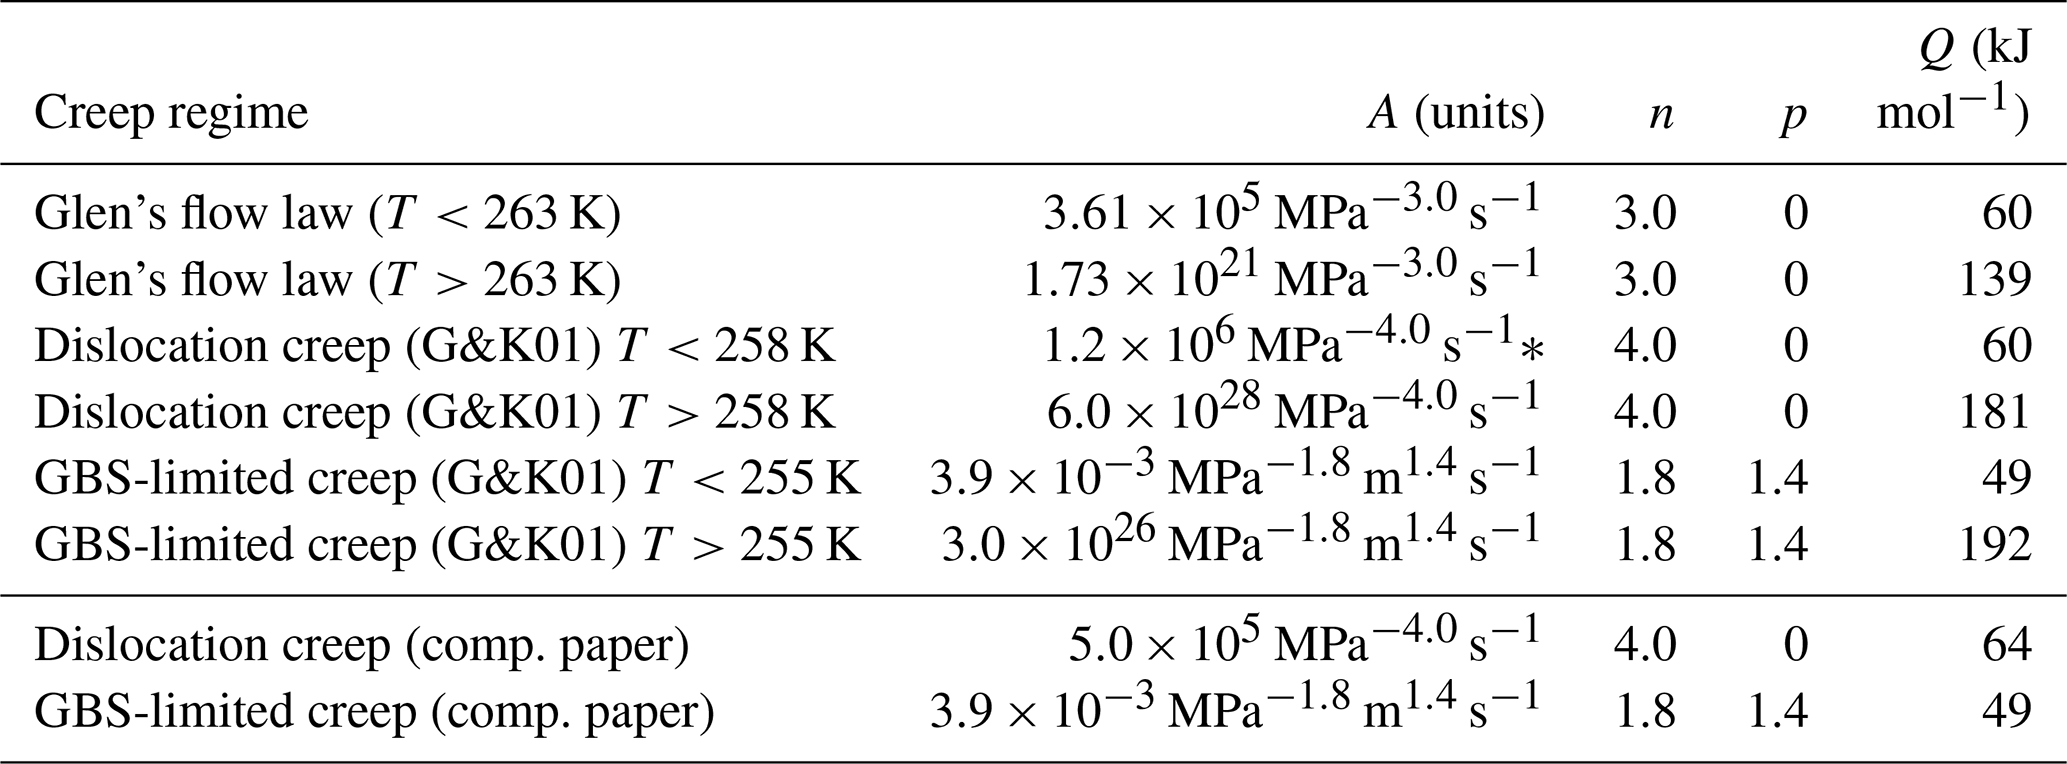
∗ This value of A was updated from the original value (Goldsby, 2006).
The results show that the Eemian-glacial facies consists of layers with relatively fine grains that are alternated by layers of very coarse grains. The coarse-grained layers have a strongly interlocking grain boundary structure with a partial girdle or multi-maxima type of CPO, while the fine-grained layers have a more regular grain shape and have a single maximum type of CPO (Figs. 2 and 3). A comparison with other polar ice cores showed that layers with very coarse and interlocking grains with a multi-maxima or partial girdle type of CPO start to appear at a T∗ value of about 262 K (Table 1). The modified composite flow law of Goldsby and Kohlstedt (2001) predicts that the strain rate in the fine-grained layers, which is almost entirely produced by GBS-limited creep, is about an order of magnitude higher than the strain rate in the coarse-grained layers, where GBS-limited creep and dislocation creep contribute roughly equally to bulk strain rate (Fig. 5).
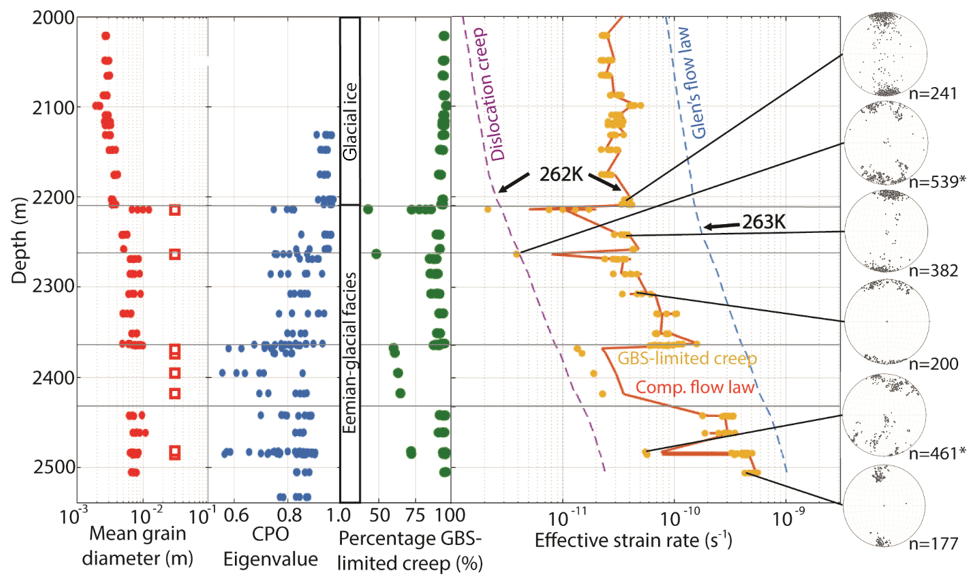
Figure 5Graphic display of results as a function of depth for the lowest 540 m of the NEEM ice core showing (from left to right) the mean grain diameter (red dots), the first CPO eigenvalues (blue dots), the Glacial and Eemian-Glacial facies, the percentage contribution of GBS-limited creep to bulk strain rate (green dots), the calculated strain rates (Table 3) using Glen's flow law (dotted blue line), the modified composite flow law (orange line), and the two deformation mechanisms of the Goldsby and Kohlstedt flow law, one showing dislocation creep (dotted purple line) and the other showing GBS-limited creep (yellow dots). Note that the orange line shows the total strain rates made up of the dislocation creep strain rate (shown by the purple line) and the GBS-limited strain rate (shown by the yellow dots). An open red square instead of a red dot was used when the grain size was too large to determine a mean grain diameter using the Ice-image software and a mean grain diameter of 30 mm was used. The four horizontal grey lines represent the stratigraphic disruptions that were found in the NEEM deep ice core (NEEM community members, 2013). The Glacial ice extends to a depth of 2207 m, with the Eemian-glacial facies continuing down to the ice–bedrock interface at 2540 m depth. The depth of the temperature threshold for the modified composite flow law (262 K) and Glen's flow law (263 K) are indicated. On the far-right six pole figures are shown (equal area, vertical plane, one point per grain) with the number of grains (n, next to the pole figure). At two depths, indicated by an asterisk (*), the CPO data from six consecutive ice core sections were combined to increase the number of grains in the pole figure. Pole figures were taken from Weikusat and Kipfstuhl (2010) (https://doi.pangaea.de/10.1594/PANGAEA.744004).
Table 3The flow law parameters of Glen's flow law (Paterson, 1994) and the members of the modified composite flow law for dislocation creep and GBS-limited creep, of which some parameters remained the same as reported in Goldsby and Kohlstedt (1997, 2001). For this paper, the flow law parameters were constrained with the temperature threshold of 262 K, which results in a change in activation energy and the pre-exponential factor for dislocation creep compared to the flow law used in our companion paper.
4.1 The role of impurities in premelted ice
It is well known that changes in impurity content correlate well with changes in mean grain size in polar ice cores (e.g., Fisher and Koerner, 1986; Paterson, 1991; Thorsteinsson et al., 1995; Cuffey et al., 2000); finer grains occur in ice with a higher impurity content. It is often assumed that impurities control grain size by pinning of grain boundaries (e.g., Fisher and Koerner, 1986; Gow et al., 1997; Durand et al., 2006), although the exact mechanism by which impurities control the mean grain size is still not understood in detail (Eichler et al., 2017). Similar to the Eemian-glacial facies in the NEEM ice core, the lower part of the GRIP ice core (Thorsteinsson et al., 1995) is likely affected by premelting (Table 1). In both the GRIP and NEEM ice core, the effect of impurities on grain size and shape is very large in the premelting regime (Thorsteinsson et al., 1995; NEEM community members, 2013). Due to the high impurity content in the glacial ice and late Eemian ice of the Eemian-glacial facies, the mean grain size in these layers remains relatively small. On the other hand, the low-impurity Eemian ice has much larger grains. The second effect of the high impurity content in the finer-grained layers in the Eemian-glacial facies is the melt content along grain boundaries and triple junctions is probably enhanced due to the lowering of the pressure-melting point by salts and/or impurities (e.g., Duval, 1977; Wettlaufer, 1999a, b; Döppenschmidt and Budd, 2000).
Impurities also provide additional interfaces, in addition to grain boundaries, where premelting can take place. These premelting films could act as dislocation sinks that may enhance dislocation motion in ice, preventing hardening by dislocation entanglement and thus enhance the strain rate. The type of impurity can change the effectivity of premelting, but as only a few studies on particle species in solid polar ice are available so far (Ohno et al., 2005, 2006; Sakurai et al., 2009, 2011; Oyabu et al., 2015), this argument can only be made via the total surface of impurities per volume of ice.
4.2 The effect of premelting on ice microstructure
Premelting is expected to initiate at grain boundaries at temperatures below (but close to) the melting point (e.g., Orem and Adamson, 1969; Döppenschmidt et al., 1998). Since premelting itself, as well as the collection of water in veins (Nye and Mae, 1972), takes place at grain boundaries and triple junctions, grain boundaries are the major “suspect” that enables weakening in polycrystalline ice. As temperature increases, a liquid-like amorphous layer gathers in layers along grain boundaries and veins along triple junctions, the presence of a liquid-like amorphous layer correlates with strain rates that are faster than predicted by extrapolation of low-temperature results using the Arrhenius relation with a fixed activation energy (e.g., Mellor and Testa, 1969; Nye and Mae, 1972; Duval, 1977; Dash et al., 1995; De La Chapelle et al., 1999). Therefore, a flow law that is calibrated at lower temperature cannot simply be applied under premelting conditions, since the mechanical properties of the material at premelting temperature are apparently different. Due to the higher grain boundary surface area per unit of volume in a fine-grained sample, the influence of premelting on a fine-grained sample is expected to be stronger than for a coarser-grained sample.
A small liquid-like amorphous layer at the grain boundaries may account for the increase in grain boundary mobility by about 2 to 4 orders of magnitude (De La Chapelle et al., 1998). Since grain boundary velocity is a function of grain boundary mobility and the driving force for grain boundary migration (e.g., Higgins, 1974; Alley et al., 1986), it is expected that a strong increase in grain boundary mobility leads to an increase in grain boundary velocity, provided that the stored strain energy for SIBM in the ice polycrystal is high enough. Ice deformation tests have indeed shown that grain boundary migration rates are high close to the melting point (e.g., Wilson and Zhang, 1996; Breton et al., 2016). Microstructural changes occurring in ice close to the melting point, which create very coarse and interlocking grains, and a change in deformation behavior, could both be explained well by the presence of a liquid-like amorphous layer that increases grain boundary mobility and consequently enhances SIBM. This enhanced SIBM would result in very coarse grains with an interlocking grain boundary structure (e.g., Duval and Castelnau, 1995; Schulson and Duval, 2009; Breton et al., 2016), as observed in the layers with low-impurity content of the Eemian-glacial facies (Fig. 2b).
In addition to the effect of high temperature on grain boundary mobility, the cryostatic pressure in the lower part of polar ice cores (20–23 MPa for NEEM, Eq. 6) will further enhance grain boundary mobility (Breton et al., 2016). Directed growth of migrating grain boundaries along subgrain boundaries in specimens deformed at a cryostatic pressure of 20 MPa can lead to a smaller median grain size and a more interlocking microstructure. The smaller grain size of samples deformed at a high cryostatic pressure of 20 MPa compared to samples deformed at atmospheric pressure could be caused by grain dissection (Breton et al., 2016; Steinbach et al., 2017), since this process also depends on SIBM.
The similarity between microstructures with coarse interlocking grains in the lower part of polar ice cores (Table 1, Fig. 2b) and the ice microstructure developing during deformation tests close to the melting point suggests that these microstructures are governed by the same processes. We therefore proposed that the sudden appearance of the coarse grains with an interlocking grain boundary structure in the lower part of polar ice cores is the result of premelting along the grain boundaries, which increases grain boundary mobility and consequently enhances SIBM.
4.3 Setting the temperature threshold for premelting
The in situ temperature at which coarse and interlocking grains start to appear in polar ice sheets (T∗ about 262 K) (Table 1) falls within the temperature range (258 to 263 K) of the transition to a more temperature-sensitive deformation mechanism during deformation tests (Mellor and Testa, 1969; Barnes et al., 1971; Weertman, 1983; Budd and Jacka, 1989; Paterson, 1994; Goldsby and Kohlstedt, 2001). The premelting temperature threshold for Glen's flow law (263 K; Paterson, 1994) is 5 and 8 K higher than the temperature thresholds for the dislocation creep (258 K) mechanism and the GBS-limited creep mechanism (255 K) applied by Goldsby and Kohlstedt (2001), respectively. Since the strain rate increase close to the melting point for dislocation creep and GBS-limited creep has been related to premelting along the grain boundaries (Goldsby and Kohlstedt, 2001), a similar temperature threshold can be expected for both deformation mechanisms.
The temperature threshold of 258 K proposed by Goldsby and Kohlstedt (2001) for dislocation creep was taken from Kirby et al. (1987), who conducted ice deformation tests at a high confining pressure of 50 MPa. A confining pressure of 50 MPa lowers the pressure-melting point by 3.7 K, using the pressure-melting constant for clean ice of K Pa−1 (Hobbs, 1974; Weertman, 1983; Eq. 5). This change in pressure-melting point due to the high confining pressure seems to not be considered by Kirby et al. (1987) and Goldsby and Kohlstedt (2001). Therefore, it is argued that the corresponding temperature threshold should have been 261.7 K instead of 258 K, when a confining pressure of 50 MPa is also assumed. This temperature threshold is much closer to 263 K used in Glen's flow law (Paterson, 1994) and practically equal to 262 K that was found by analyzing ice microstructures of polar ice cores (Table 1). 261.7 K is also closer to the temperature threshold proposed by Barnes et al. (1971), who found that the activation energy of ice is much higher between 271 and 265 K (120 kJ mol−1) than between 265 and 259 K (78.1 kJ mol−1). Similarly, 261.7 K is also closer to Mellor and Testa (1969) and Budd and Jacka (1989), who found that above 263 K the strain rate becomes progressively more temperature dependent when approaching the melting point.
4.4 Recrystallization and deformation mechanisms in the Eemian-glacial facies
The strain rate calculations using the composite flow law (Fig. 5) show that the fine-grained layers in the Eemian-glacial facies deform predominantly by GBS-limited creep. It is known that the basal slip system is not significantly affected by the cryostatic pressures that are reached in polar ice sheets (e.g., Rigsby, 1958; Cole, 1996). Therefore, basal slip is an important strain-producing mechanism in both the coarse and the fine-grained layers, but the way basal slip is rate-limited is different. Since basal slip provides only two of five independent slip systems required for homogeneous deformation, at least one additional slip system or some other mechanism is required (e.g., Von Mises, 1928; Hutchinson, 1977). Grain boundary sliding is favored as the rate-limiting mechanism for basal slip in the Eemian-glacial facies, since the grain boundary area in the impurity-rich and fine-grained layers is relatively high and a higher grain boundary area enhances the effect of premelting on deformation behavior (Barnes et al., 1971). However, compared to the glacial ice between 1419 to 2207 m depth (Fig. 2b), the grain boundary network in the fine-grained layers in the Eemian-glacial facies is relatively irregular with many bulges (Fig. 2a). The irregular grain boundary structure is likely a result of enhanced SIBM caused by premelting (Sect. 4.2). The occurrence of SIBM implies there are differences in internal strain energy between grains that are related to the basal slip component of deformation, which is still significant even when GBS is the rate controlling process. Still, the effect of impurities in these impurity-rich layers is strong enough to prevent the grains from growing up to tens of millimeters, like the example of the coarse-grained ice core section in Fig. 2b, thus grain boundary sliding remains an important rate-limiting mechanism. Due to the lower ratio of SIBM that is expected in these impurity-rich layers, the grains are longer-lived and can rotate towards a single maximum CPO (e.g., Van der Veen and Whillans, 1994). For these layers, the CPO is a reflection of cumulative strain, just like the CPO in the shallower parts of the ice sheet (e.g., Azuma and Higashi, 1985; Alley, 1988; Budd and Jacka, 1989; Llorens et al., 2016a, b, 2017).
For the coarse-grained layers in the Eemian-glacial facies, the calculations using the chosen creep laws predict that the deformation is not dominated by dislocation creep alone but that it also has a substantial GBS-limited creep component, i.e., up to 75 % at 2485 m depth (Fig. 5). This would suggest that even in these coarse-grained layers the creep behavior is strongly grain size dependent. The question is whether this grain size dependence is in agreement with the interlocking grain boundary structure observed in the material (Fig. 2b), since such a structure seems inconsistent with assumed sliding along grain boundaries. However, SIBM is highly active in these coarse-grained layers and SIBM has been suggested as being a possible accommodation mechanism for basal slip (Pimienta and Duval, 1987; De La Chapelle et al., 1999; Duval et al., 2000; Montagnat and Duval, 2000). If so, the flow law for GBS-limited creep is not applicable to these coarse-grained materials. Alternatively, the original microstructure might have been obliterated by SIBM in situ. In that case, GBS might have locally rate limited basal slip (Raj and Ashby, 1971), hence basal slip might be rate limited by SIBM coupled with GBS (Drury et al., 1989), and the grain-size-dependent flow law ( might still be of relevance.
The grain size and grain shape in these low-impurity interglacial layers (Fig. 2b) suggests that the grain boundaries are free to migrate at high SIBM rates (Duval and Castelnau, 1995; Schulson and Duval, 2009), which may be related to premelting (De La Chapelle et al., 1998) and are not or hardly influenced by impurities. The partial great circle to multi-maxima CPO of these coarse-grained ice core sections can be explained by the formation of new strain-free grains with soft orientations (relatively high Schmid factor), which grow at the expense of grains oriented in a hard orientation (Alley, 1988; Durand et al., 2009; Montagnat et al., 2015; Qi et al., 2017). This recrystallization mechanism can be described as discontinuous migration recrystallization (Wenk et al., 1989; Schulson and Duval, 2009) or SIBM-N (Faria et al., 2014a). The dominant deformation mode deep in the ice sheet is expected to be simple shear, yet the CPO maxima in the coarse-grained ice suggests that deformation in these layers may involve dominant coaxial strain rather than simple shear.
4.5 Strain localization in the Eemian-glacial facies
The ice in the Eemian-glacial facies alternates between fine-grained ice with a single maximum CPO and coarse-grained ice with a partial girdle CPO (Fig. 5). The differences in grain size, grain shape and CPO in the Eemian-glacial facies imply that there are large differences in viscosity between the different layers. This is also suggested by the results using the modified composite flow law (Fig. 5), which predict that the fine-grained ice is much softer than the coarse-grained ice when applying the modified composite flow law. Consequently, strain localization and strain partitioning into “hard” and “soft” layers can be expected. Strain localization has been shown on many different scales in ice (e.g., Paterson, 1991; Wilson and Zhang, 1996; Grennerat et al., 2012; Jansen et al., 2016; Steinbach et al., 2016). The predicted strain rates in Fig. 5 are based on flow laws for secondary creep at relatively low strain on samples with near random CPO. In addition to a variation in grain size, the CPO has, depending on its orientation, a weakening effect on ice (e.g., Budd and Jacka, 1989; Faria et al., 2014b; Hudleston, 2015), so differences in CPO are likely to change the relative strain rates between the different ice layers shown in Fig. 5. Deformation experiments with ice from other polar ice cores with a certain type of CPO, such as a single maximum or a multi-maxima CPO, have different strain rates when the ice is deformed under different deformation modes. For example, simple shear deformation experiments on basal ice with a multi-maxima CPO from Law Dome showed that the strain rates were comparable with those of isotropic ice (Russell-Head and Budd, 1979). The same study showed that samples from Law Dome with a single maximum CPO deformed much more readily than isotropic ice in simple shear (sheared in the direction of the measured surface velocity). The study of Lile (1978) with samples from Law Dome Summit and Cape Folger showed a similar result using samples containing a single maximum CPO that were deformed in simple shear (single maximum normal to the shear plane) showing much higher strain rates compared to laboratory-prepared isotropic ice with a similar grain size. For the case of dominant simple shear, which is expected to be the deformation mode in this part of the NEEM ice core (Dansgaard and Johnsen, 1969; Montagnat et al., 2014), different CPOs in the fine and coarse layers could lead to even higher strain rate differences than predicted in Fig. 5 from the Goldsby and Kohlstedt (2001) flow laws. The composite flow law that is used in this study does not explicitly include the effect of CPO on strain rate, while it is well known that the CPO has a weakening effect on ice depending on its orientation in certain different deformation modes (e.g., Budd and Jacka, 1989; Faria et al., 2014b; Hudleston, 2015).
The difference in microstructure between the impurity-rich ice and the low-impurity ice poses an interesting hypothesis for the effect of premelting on ice dynamics close to the bedrock. The deeper ice where premelt may occur and consisting entirely of interglacial ice (with a low-impurity content), is expected to be relatively viscous and hardly contributes to horizontal velocity, which will probably be localized above the premelting regime. In the case where glacial ice (with a high impurity content) is present in the premelting zone or the premelting zone consists entirely of glacial ice, a significant portion of the horizontal velocity will be accomplished in the premelting zone. The difference in microstructure of impurity-rich glacial and low-impurity interglacial ice in the premelting zone can have important consequences for ice dynamics close to the bedrock. Since the impurity content in the Greenland ice sheet is approximately 10 times higher than the impurity content in the Antarctic ice sheet (e.g., Legrand and Mayewski, 1997), this effect of strain partitioning in the premelting zone is likely to be stronger in the Greenland ice sheet than in the Antarctic ice sheet.
The hypothesis of the different effects of impurity-rich and low-impurity ice on ice dynamics in the premelting zone close to the bedrock is supported by borehole logging data from several ice cores. Data from Byrd station showed that the tilting rate (horizontal component of deformation rate) in the premelting zone (1810 m down to the bedrock at 2164 m depth), where grains are coarse with a multi-maxima CPO (Gow and Williamson, 1976), deformed much less than the remainder of the ice (Paterson, 1983). A similar observation for the EDML ice core was reported by Jansen et al. (2017). Morgan et al. (1997, 1998) also reported that the tilting rate at Law Dome decreased with depth as grain size increased and CPO deviated from a single maximum CPO. In this case the decreasing strain rate has been explained by a decrease in stress caused by bed rock topography (Budd and Jacka, 1989). The highest simple shear strain rates over the entire depth profile in the Law Dome (Dome Summit South) ice core, derived from the tilting, occur in a zone where the shear strain rates are otherwise decreasing. This layer is from the Last Glacial Maximum and has a fine grain size and strong single maximum CPO. The zone of high shear strain rate cannot be explained by variations in temperature or stress, but it can be explained by the combined influence of CPO and grain size.
We speculate that strain partitioning between glacial and interglacial layers in the premelting zone could lead to a different rate of layer thinning, which could have important consequences for interpreting paleoclimatic records from polar ice cores. In the deepest part of the ice core the dating is based on ice flow modeling describing a homogeneous transition from coaxial deformation to simple shear. It has often been shown that paleoclimatic records in the lower part of polar ice cores are disturbed (e.g., Alley et al., 1997; Gow et al., 1997; Suwa et al., 2006; Ruth et al., 2007; NEEM community members, 2013), which could be caused by heterogeneous deformation and strain partitioning between glacial and interglacial layers as described above.
In many polar ice cores the grain size, grain shape and CPO change significantly in the ice close to the bedrock, which can have a large impact on the dominant deformation mechanism and the strain rate. Temperatures close to the bed rock are near the melting temperature, and under these conditions enhanced creep and recrystallization can be explained by the occurrence of premelting along grain boundaries. In this study, actual temperature and grain size data of the NEEM ice core were used to apply the composite flow law of Goldsby and Kohlstedt (2001) and the Paterson (1994) version of Glen's flow law to the lower part of the NEEM ice core, with the aim of studying the effect of changes in grain size on the dominant deformation mechanism and the strain rate. Several stratigraphic disruptions are present in this part of the NEEM ice core, which causes layers of fine-grained ice to be alternated by layers of coarse-grained ice. After a microstructural evaluation of eight different polar ice cores from the Greenland and Antarctic ice sheets, it was found that microstructures that indicate premelting start at a temperature (T∗) of about 262 K, which is within the temperature range at which a more temperature-sensitive deformation mechanism starts to dominate the ice rheology in deformation tests. The composite flow law of Goldsby and Kohlstedt (2001) was modified to include this premelting temperature (T∗) threshold of 262 K.
The modified composite flow law predicts that, as a result of the grain size variation in the Eemian-glacial facies, the strain rate varies strongly with the fine-grained layers, deforming about an order of magnitude faster than the coarse-grained layers. In the fine-grained glacial ice, the dominant deformation mechanism is predicted to be GBS-limited creep. In the coarse-grained interglacial ice, dislocation creep and GBS-limited creep contribute roughly equally to the bulk strain rate, with the contribution of GBS-limited creep to bulk strain rate increasing with depth. Glen's flow law, which is grain size insensitive, does not predict any variations in strain rate in the Eemian-glacial facies apart from a steadily increasing strain rate with depth caused by an increase in temperature with depth. Glen's flow law predicts a higher strain rate than the modified composite flow law along the entire lowest 540 m depth of the NEEM ice core. The magnitude of the strain rate increase would be stronger if a more realistic temperature dependence (e.g., Budd and Jacka, 1989) for Glen's flow law is used.
Changes in grain size in the Eemian-glacial facies correlate strongly with changes in type and strength of CPO. The fine-grained (<5 mm) impurity-rich glacial layers have a strong single maximum CPO, which is compatible with predominant simple shear deformation in this part of the NEEM ice core. The relatively fine grain size argues for GBS-limited creep being the dominant deformation mechanism in these layers. The coarse-grained (>5 mm) low-impurity layers have a partial great-circle girdle to multi-maxima CPO, which is more compatible with coaxial deformation than with simple shear deformation. Due to the coarse grains and the interlocking grain boundary structure, these layers are likely deforming by basal slip rate limited by recovery via SIBM, which removes dislocations and stress concentrations in grains and allows further deformation to occur, or by coupled SIBM and grain boundary sliding. Therefore, strain partitioning is expected in the Eemian-glacial facies, with the fine-grained layers with a single maximum CPO deforming at high strain rates, while the coarse-grained interglacial layers with a partial girdle type of CPO deform at much lower strain rates. The difference in microstructure, and consequent difference in viscosity, of impurity-rich and low-impurity ice in the premelting zone can have important consequences for ice dynamics close to the bedrock.
For the model described in this paper we used Excel, with the NEEM grain size and temperature data from the PANGAEA Data Publisher for Earth & Environmental Science (https://doi.org/10.1594/PANGAEA.838063, Eichler et al., 2013b; https://doi.pangaea.de/10.1594/PANGAEA.743296, Kipfstuhl, 2010; https://doi.pangaea.de/10.1594/PANGAEA.744004, Weikusat and Kipfstuhl 2010; https://doi.org/10.1594/PANGAEA.920005, Weikusat et al., 2020a; https://doi.org/10.1594/PANGAEA.919775, Weikusat et al., 2020b) and the flow law parameters given in Table 3.
EJNK prepared the code, the data, and the setup of simulations and conducted model runs. JHPdB developed the algorithm for the code and provided the initial idea. MRD and GMP supervised and initiated the simulation setup and interpretation. JE and IW provided ice core samples and data, glaciological background, and data preparation. All authors jointly interpreted results and wrote the manuscript.
The authors declare that they have no conflict of interest.
This work has been carried out as part of the Helmholtz Junior Research group “The effect of deformation mechanisms for ice sheet dynamics” (VH-NG-802). The NEEM light microscope data used in this study have been made available by https://www.pangaea.de/ (last access: 13 July 2020). The authors would like to thank Sepp Kipfstuhl and Tobias Binder for providing data and encouraging discussions. David Prior and Adam Treverrow are thanked for their elaborate and very helpful comments on the first versions of the manuscript. The authors would like to thank all the NEEM community members that were involved in the preparation of the physical properties samples in the field. This work is a contribution to the NEEM ice core project, which is directed and organized by the Center of Ice and Climate at the Niels Bohr Institute and US NSF, Office of Polar Programs. It is supported by funding agencies and institutions in Belgium (FNRS-CFB and FWO), Canada (NRCan/GSC), China (CAS), Denmark (FIST), France (IPEV, CNRS/INSU, CEA and ANR), Germany (AWI), Iceland (RannIs), Japan (NIPR), South Korea (KOPRI), the Netherlands (NWO/ALW), Sweden (VR), Switzerland (SNF), the United Kingdom (NERC) and the USA (US NSF, Office of Polar Programs).
This research has been supported by the Alfred Wegener Institute Helmholtz Centre for Polar and Marine Research (grant no. VH-NG-802).
This paper was edited by Carlos Martin and reviewed by Adam Treverrow and David Prior.
Alley, R. B.: Fabrics in Polar Ice Sheets: Development and Predictions, Science, 240, 493–495, https://doi.org/10.1126/science.240.4851.493, 1988.
Alley, R. B.: Flow-law hypothesis for ice sheet modeling, J. Glaciol., 38, 245–256, https://doi.org/10.1017/S0022143000003658, 1992.
Alley, R. B., Perepezko, J. H., and Bentley, C. R.: Grain growth in polar ice: I. Theory, J. Glaciol., 32, 415–424, 1986.
Alley, R. B., Gow, A. J., Meese, D. A., Fitzpatrick, J. J., Waddington, E. D., and Bolzan, J. F.: Grain-scale processes, folding, and stratigraphic disturbance in the GISP2 ice core, J. Geophys. Res., 102, 26819–26830, https://doi.org/10.1029/96JC03836, 1997.
Augustin, L., Panichi, S., and Frascati, F.: EPICA Dome C 2 drilling operations: performances, difficulties, results, Ann. Glaciol., 47, 68–72, https://doi.org/10.3189/172756407786857767, 2007.
Azuma, N. and Higashi, A.: Formation processes of ice fabric pattern in ice sheets, Ann. Glaciol., 6, 130–134, 1985.
Barnes, P., Tabor, D., and Walker, J. C. F.: The friction and creep of polycrystalline ice, P. Roy. Soc. Lond. A., 324, 127–155, 1971.
Binder, T.: Measurements of grain boundary networks in deep polar ice cores – A digital image processing approach, PhD thesis, University of Heidelberg, Germany, 2014.
Binder, T., Weikusat, I., Freitag, J., Garbe, C. S., Wagenbach, D., and Kipfstuhl, S.: Microstructure through an ice sheet, Mat. Sci. Forum, 753, 481–484, https://doi.org/10.4028/www.scientific.net/MSF.753.481, 2013.
Bons, P. D., Kleiner, T., Llorens, M.-G., Prior, D. J., Sachau, T., Weikusat, I., and Jansen, D.: Greenland Ice Sheet: Higher Nonlinearity of ice Flow Significantly Reduces Estimated Basal Motion, Geophys. Res. Lett., 45, 1–7, https://doi.org/10.1029/2018GL078356, 2018.
Breton, D. J., Baker, I., and Cole, D. M.: Microstructural evolution of polycrystalline ice during confined creep testing, Cold Reg. Sci. Technol., 127, 25–36, https://doi.org/10.1016/j.coldregions.2016.03.009, 2016.
Budd, W. F. and Jacka, T. H.: A review of ice rheology for ice sheet modelling, Cold Reg. Sci. Technol., 16, 107–144, https://doi.org/10.1016/0165-232X(89)90014-1, 1989.
Budd, W. F. and Rowden-Rich, R. J. M.: Finite element analysis of two-dimensional longitudinal section flow on Law Dome, Aust. Glaciol. Res., 1982–1983, ANARE Res. Notes, 28, 153–161, 1985.
Buizert, C., Cuffey, K. M., Severinghaus, J. P., Baggenstos, D., Fudge, T. J., Steig, E. J., Markle, B. R., Winstrup, M., Rhodes, R. H., Brook, E. J., Sowers, T. A., Clow, G. D., Cheng, H., Edwards, R. L., Sigl, M., McConnell, J. R., and Taylor, K. C.: The WAIS Divide deep ice core WD2014 chronology – Part 1: Methane synchronization (68–31 ka BP) and the gas age–ice age difference, Clim. Past, 11, 153–173, https://doi.org/10.5194/cp-11-153-2015, 2015.
Catania, G. A. and Neumann, T. A.: Persistent englacial drainage features in the Greenland Ice Sheet, Geophys. Res. Lett., 37, 1–5, https://doi.org/10.1029/2009GL041108, 2010.
Cole, D. M.: Observations of pressure effects on the creep of ice single crystals, J. Glaciol., 42, 169–175, https://doi.org/10.1017/S0022143000030628, 1996.
Cuffey, K. M., Thorsteinsson, T., and Waddington, E. D.: A renewed argument for crystal size control of ice sheet strain rates, J. Geophys. Res., 105, 27889–27894, https://doi.org/10.1029/2000JB900270, 2000.
Dansgaard, W. and Johnsen, S. J.: A flow model and a time scale for the ice core from camp century, Greenland, J. Glaciol., 8, 215–223, https://doi.org/10.3189/S0022143000031208, 1969.
Dash, J. G., Fu, H., and Wettlaufer, J. S.: The premelting of ice and its environmental consequences, Rep. Progr. Phys., 58, 115–167, https://doi.org/10.1088/0034-4885/58/1/003, 1995.
Dash, J. G., Rempel, A. W., and Wettlaufer, J. S.: The physics of premelted ice and its geophysical consequences, Rev. Modern Phys., 78, 695–741, https://doi.org/10.1103/RevModPhys.78.695, 2006.
De La Chapelle, S., Castelnau, O., Lipenkov, V., and Duval, P.: Dynamic recrystallization and texture development ice as revealed by the study of deep ice cores Antarctica and Greenland, J. Geophys. Res., 103, 5091–5105, https://doi.org/10.1029/97JB02621, 1998.
De La Chapelle, S., Milsch, H., Castelnau, O., and Duval, P.: Compressive creep of ice containing a liquid intergranular phase: rate-controlling processes in the dislocation creep regime, Geophys. Res. Lett., 26, 251–254, https://doi.org/10.1029/1998GL900289, 1999.
Doake, C. S. M. and Wolff, E. W.: Flow law for ice in polar ice sheets, Nature, 314, 255–257, https://doi.org/10.1038/314255a0, 1985.
Döppenschmidt, A. and Butt, H.-J.: Measuring the Thickness of the Liquid-like Layer on Ice Surfaces with Atomic Force Microscopy, Langmuir, 16, 6709–6714, https://doi.org/10.1021/la990799w, 2000.
Döppenschmidt, A., Kappl, M., and Butt, H. J.: Surface Properties of Ice Studied by Atomic Force Microscopy, J. Phys. Chem., 102, 7813–8919, https://doi.org/10.1021/jp981396s, 1998.
Drury, M. R., Humphreys, F. J., and White, S. H.: Effect of dynamic recrystallization on the importance of grain-boundary sliding during creep, J. Mater. Sci., 24, 154–162, https://doi.org/10.1007/BF00660947, 1989.
Durand, G., Weiss, J., Lipenkov, V., Barnola, J. M., Krinner, G., Parrenin, F., Delmonte, B., Ritz, C., Duval, P., Röthlisberger, R., and Bigler, M.: Effect of impurities on grain growth in cold ice sheets, J. Geophys. Res., 111, 1–18, https://doi.org/10.1029/2005JF000320, 2006.
Durand, G., Svensson, A., Persson, A., Gagliardini, O., Gillet-Chaulet, F., Sjolte, J., Montagnat, M., and Dahl-Jensen, D.: Evolution of the texture along the EPICA Dome C ice core. Low Temperature, Science, 68, 91–105, 2009.
Durham, W. B. and Stern, L. A.: Rheological Properties of Water Ice – Applications to satellites of the Outer Planets, Annu. Rev. Earth Planet. Sci., 29, 295–330, 2001.
Duval, P.: The role of the water content on the creep rate of polycrystalline ice, Int. Assoc. Hydrol. Sci., 118, 29–33, 1977.
Duval, P. and Castelnau, O.: Dynamic Recrystallization of Ice in Polar Ice Sheets, J. Phys. III, 05, 197–205, https://doi.org/10.1051/jp4:1995317, 1995.
Duval, P., Arnaud, L., Brissaud, O., Montagnat, M., and De La Chapelle, S.: Deformation and recrystallization processes of ice from polar ice sheets, Ann. Glaciol., 30, 83–87, https://doi.org/10.3189/172756400781820688, 2000.
Eichler, J., Weikusat, I., and Kipfstuhl, S.: Orientation-tensor eigenvalues along the NEEM ice core, PANGAEA, https://doi.org/10.1594/Pangaea.838059, 2013a.
Eichler, J., Weikusat, I., and Kipfstuhl, S.: C-axis fabric analysis of ice samples collected from the NEEM ice core, PANGAEA, https://doi.org/10.1594/PANGAEA.838063, 2013b.
Eichler, J., Kleitz, I., Bayer-Giraldi, M., Jansen, D., Kipfstuhl, S., Shigeyama, W., Weikusat, C., and Weikusat, I.: Location and distribution of micro-inclusions in the EDML and NEEM ice cores using optical microscopy and in situ Raman spectroscopy, The Cryosphere, 11, 1075–1090, https://doi.org/10.5194/tc-11-1075-2017, 2017.
EPICA community members: Eight glacial cycles from an Antarctic ice core, Nature, 429, 623–628, https://doi.org/10.1038/nature02599, 2004.
Epstein, S., Sharp, R. P., and Gow, A. J.: Antarctic Ice Sheet: Stable Isotope Analysis of Byrd Station Cores and Interhemispheric Climate Implications, Science, 168, 1570–1572, https://doi.org/10.1126/science.168.3939.1570, 2011.
Faria, S. H., Weikusat, I., and Azuma, N.: The microstructure of polar ice. Part I: Highlights from ice core research, J. Struct. Geol., 61, 2–20, https://doi.org/10.1016/j.jsg.2013.09.010, 2014a.
Faria, S. H., Weikusat, I., and Azuma, N.: The microstructure of polar ice: Part II: State of the art, J. Struct. Geol., 61, 21–49, https://doi.org/10.1016/j.jsg.2013.11.003, 2014b.
Fisher, D. A. and Koerner, R. M.: On the special rheological properties of ancient microparticle-laden northern hemisphere ice as derived from bore-hole and core measurements, J. Glaciol., 32, 501–510, 1986.
Fitzpatrick, J. J., Voigt, D. E., Fegyveresi, J. M., Stevens, N. T., Spencer, M. K., Cole-Dai, J., Alley, R. B., Jardine, G. E., Cravens, E. D., Wilen, L. A., Fudge, T. J., and McConnell, J. R.: Physical properties of the WAIS Divide ice core, J. Glaciol., 69, 1181–1198, https://doi.org/10.3189/2014JoG14J100, 2014.
Glen, J. W.: Experiments on the deformation of ice, J. Glaciology, 2, 111–114, 1952.
Glen, J. W.: The creep of polycrystalline ice, Proc. Roy. Soc. Lond. A, 228, 519–538, https://doi.org/10.1098/rspa.1955.0066, 1955.
Goldsby, D. L.: Glacier Science and environmental change, edited by: Knight, P. G., 308–314, Blackwell, Oxford, 2006.
Goldsby, D. L. and Kohlstedt, D. L.: Grain boundary sliding in fine grained ice I, Scripta Mater., 37, 1399–1406, 1997.
Goldsby, D. L. and Kohlstedt, D. L.: Superplastic deformation of ice: Experimental observations, J. Geophys. Res., 106, 11017–11030, https://doi.org/10.1029/2000JB900336, 2001.
Gow, A. J. and Engelhardt, H.: Preliminary analysis of ice cores from Siple Dome, West Antarctica, in: Physics of ice core records, edited by: Hondoh, T., Sapporo, Hokkaido University Press, 63–82, 2000.
Gow, A. J. and Williamson, T.: Rheological implications of the internal structure and crystal fabrics of the West Antarctic ice sheet as revealed by deep core drilling at Byrd Station, B. Geol. Soc. Am., 87, 1665–1677, 1976.
Gow, A. J., Meese, D. A., Alley, R. B., Fitzpatrick, J. J., Anandakrishnan, S., Woods, G. A., and Elder, B. C.: Physical and structural properties of the Greenland Ice Sheet Project 2 ice core: A review, J. Geophys. Res., 102, 26559–26575, https://doi.org/10.1029/97JC00165, 1997.
Grennerat, F., Montagnat, M., Castelnau, O., Vacher, P., Moulinec, H., Suquet, P., and Duval, P.: Experimental characterization of the intragranular strain field in columnar ice during transient creep, Acta Mater., 60, 3655–3666, https://doi.org/10.1016/j.actamat.2012.03.025, 2012.
Greve, R., Zwinger, T., and Ging, Y.: On the pressure dependence of the rate factor in Glen's flow law, J. Glaciol., 60, 397–398, 2014.
Gudlaugsson, E., Humbert, A., Kleiner, T., Kohler, J., and Andreassen, K.: The influence of a model subglacial lake on ice dynamics and internal layering, The Cryosphere, 10, 751–760, https://doi.org/10.5194/tc-10-751-2016, 2016.
Hammer, C. U., Clausen, H. B., and Langway, C. C.: Electrical conductivity method (ECM) stratigraphic dating of the Byrd Station ice core, Antarctica, Ann. Glaciol., 20, 155–120, https://doi.org/10.3189/172756494794587555, 1994.
Higgins, G. T.: Grain-boundary migration and grain growth, Metal Sci., 8, 143–150, https://doi.org/10.1179/msc.1974.8.1.143, 1974.
Hobbs, P. V.: Ice Physics, Clarendon Press, Oxford, 1974.
Homer, D. R. and Glen, J. W.: The creep activation energies of ice, J. Glaciol., 21, 429–444, https://doi.org/10.3189/S0022143000033591, 1978.
Hudleston, P. J.: Structures and fabrics in glacial ice: A review, J. Glaciol., 81, 1–27, https://doi.org/10.1016/j.jsg.2015.09.003, 2015.
Humphreys, F. J. and Hatherly, M.: Recrystallization and Related Annealing Phenomena, Oxford, Elsevier, 2004.
Hutchinson, J. W.: Creep and Plasticity of Hexagonal Polycrystals as Related to Single Crystal Slip, Metall. Trans. A, 8, 1465–1469, https://doi.org/10.1007/BF02642860, 1977.
IPCC: Climate change 2014: Synthesis report. contribution of working groups i, ii, iii to the fifth assessment report of the intergovernmental panel on climate change, IPCC, Geneva, Switzerland, 151, 2014.
Jansen, D., Llorens, M.-G., Westhoff, J., Steinbach, F., Kipfstuhl, S., Bons, P. D., Griera, A., and Weikusat, I.: Small-scale disturbances in the stratigraphy of the NEEM ice core: observations and numerical model simulations, The Cryosphere, 10, 359–370, https://doi.org/10.5194/tc-10-359-2016, 2016.
Jansen, D., Weikusat, I., Kleiner, T., Wilhelms, F., Dahl-Jensen, D., Frenzel, A., Stoll, N., Binder, T., Eichler, J., Faria, S. H., Sheldon, S., Panton, C., Kipfstuhl, S., and Miller, H.: In situ-measurement of ice deformation from repeated borehole logging of the EPICA Dronning Maud Land (EDML) ice core, East Antarctica, Poster presentation, EGU, Vienna (Austria), available at: https://meetingorganizer.copernicus.org/EGU2017/EGU2017-16368.pdf (last access: 13 July 2020), 2017
Johnsen, S. J., Dahl-Jensen, D., Dansgaard, W., and Gundestrup, N.: Greenland paleotemperatures derived from GRIP bore hole temperature and ice core isotope profiles, Tellus B, 47, 624–629, https://doi.org/10.1034/j.1600-0889.47.issue5.9.x, 1995.
Jones, J. and Brunet, J. G.: Deformation of ice single crystals close to the melting point, J. Glaciol., 21, 445–455, 1978.
Kipfstuhl, S.: Large area scan macroscope images from the NEEM ice core. Alfred Wegener Institute, Helmholtz Center for Polar and Marine Research, Bremerhaven, Pangaea, https://doi.pangaea.de/10.1594/PANGAEA.744004, (unpublished dataset), 2010.
Kipfstuhl, S., Hamann, I., Lambrecht, A., Freitag, J., Faria, S. H., Grigoriev, D., and Azuma, N.: Microstructure mapping: a new method for imaging deformation induced microstructural features of ice on the grain scale, J. Glaciol., 52, 398–406, https://doi.org/10.3189/172756506781828647, 2006.
Kipfstuhl, S., Faria, S. H., Azuma, N., Freitag, J., Hamann, I., Kaufmann, P., Miller, H., Weiler, K., and Wilhelms, F.: Evidence of dynamic recrystallization in polar firn, J. Geophys. Res.-Solid Earth, 114, 1–10, https://doi.org/10.1029/2008JB005583, 2009.
Kirby, S., Durham, W., Beeman, M., Heard, H., and Daley, M.: Inelastic properties of ice Ih at low temperatures and high pressures, J. Phys. Coll., 48, 227–232, https://doi.org/10.1051/jphyscol:1987131, 1987.
Kopp, R. E., DeConto, R. M., Bader, D. A., Hay, C. C., Horton, R. M., Kulp, S., Oppenheimer, M., Pollard, D., and Strauss, B. H.: Evolving understanding of Antarctic ice-sheet physics and ambiguity in probabilistic sea-level projections, Earth's Fut., 5, 1–17, https://doi.org/10.1002/2017EF000663, 2017.
Krabbendam, M.: Sliding of temperate basal ice on a rough, hard bed: creep mechanisms, pressure melting, and implications for ice streaming, The Cryosphere, 10, 1915–1932, https://doi.org/10.5194/tc-10-1915-2016, 2016.
Krischke, A., Oechsner, U., and Kipfstuhl, S.: Rapid Microstructure Analysis of Polar Ice Cores, Optik & Photonik, WILEY-VCH Verlag, Weinheim, 10, 32–35, 2015.
Kuiper, E.-J. N., Weikusat, I., de Bresser, J. H. P., Jansen, D., Pennock, G. M., and Drury, M. R.: Using a composite flow law to model deformation in the NEEM deep ice core, Greenland – Part 1: The role of grain size and grain size distribution on deformation of the upper 2207 m, The Cryosphere, 14, 2429–2448, https://doi.org/10.5194/tc-14-2429-2020, 2020.
Legrand, M. and Mayewski, P.: Glaciochemistry of polar ice cores: A review, Rev. Geophys., 35, 219–243, https://doi.org/10.1029/96RG03527, 1997.
Lile, R. C.: The effect of anisotropy on the creep of polycrystalline ice, J. Glaciol., 21, 475–483, 1978.
Lisiecki, L. E. and Raymo, M. E.: A Pliocene-Pleistocene stack of 57 globally distributed benthic δ18O records, Paleoceanography, 20, 1–17, https://doi.org/10.1029/2004PA001071, 2005.
Lliboutry, L.: Physical processes in temperate glaciers, J. Glaciol., 16, 151–158, https://doi.org/10.3189/S002214300003149X, 1976.
Llorens, M.-G., Griera, A., Bons, P. D., Roessiger, J., Lebensohn, R., Evans, L., and Weikusat, I.: Dynamic recrystallisation of ice aggregates during co-axial viscoplastic deformation: a numerical approach, J. Glaciol., 62, 359–377, https://doi.org/10.1017/jog.2016.28, 2016a.
Llorens, M.-G., Griera, A., Bons, P., Lebensohn, R. A., Evans, L. A., Jansen, D., and Weikusat, I.: Full-field predictions of ice dynamic recrystallization under simple shear conditions, Earth Planet. Sci. Lett., 450, 233–242, https://doi.org/10.1016/j.epsl.2016.06.045, 2016b.
Llorens, M.-G., Griera, A., Steinbach, F., Bons, P. D., Gomez-Rivas, E., Jansen, D., Roessiger, J., Lebensohn, R. A., and Weikusat, I.: Dynamic recrystallization during deformation of polycrystalline ice: insights from numerical simulations, Philos. Trans. A, A375, 2015.0346, https://doi.org/10.1098/rsta.2015.0346, 2017.
Mellor, M. and Testa, R.: Effect of temperature on the creep of ice, J. Glaciol., 8, 131–145, 1969.
Montagnat, M. and Duval, P.: Rate controlling processes in the creep of polar ice, influence of grain boundary migration associated with recrystallization, Earth Planet. Sci. Lett., 183, 179–186, https://doi.org/10.1016/S0012-821X(00)00262-4, 2000.
Montagnat, M., Azuma, N., Dahl-Jensen, D., Eichler, J., Fujita, S., Gillet-Chaulet, F., Kipfstuhl, S., Samyn, D., Svensson, A., and Weikusat, I.: Fabric along the NEEM ice core, Greenland, and its comparison with GRIP and NGRIP ice cores, The Cryosphere, 8, 1129–1138, https://doi.org/10.5194/tc-8-1129-2014, 2014.
Montagnat, M., Chauve, T., Barou, F., Tommasi, A., Beausir, B., and Fressengaes, C.: Analysis of Dynamic Recrystallization of Ice from EBSD Orientation Mapping, Front. Earth Sci., 3, 1–13, https://doi.org/10.3389/feart.2015.00081, 2015.
Morgan, V. I.: High-temperature ice creep tests, Cold Reg. Sci. Technol., 19, 295–300, https://doi.org/10.1016/0165-232X(91)90044-H, 1991.
Morgan, V. I., Wookey, C. W., Li, J., van Ommen, T. D., Skinner, W., and Fitzpatrick, M. F.: Site information and initial results from deep ice drilling on Law Dome, Antarctica, Ann. Glaciol., 27, 135–139, 1997.
Morgan, V., van Ommen, T. D., Elcheikh, A., and Li, J.: Variations in shear deformation rate with depth at Dome Summit South, Law Dome, East Antarctica, Ann. Glaciol., 27, 135–139, https://doi.org/10.3189/1998AoG27-1-135-139, 1998.
NEEM community members: Eemian interglacial reconstructed from a Greenland folded ice core, Nature, 493, 489–493, https://doi.org/10.1038/nature11789, 2013.
Nereson, N. A., Waddington, E. D., Raymond, C. F., and Jacobson, H. P.: Predicted age-depth scales for Siple Dome and inland WAIS ice cores in West Antarctica, Geophys. Res. Lett., 23, 3163–3166, https://doi.org/10.1029/96GL03101, 1996.
Nye, J. F. and Mae, S.: The effect of non-hydrostatic stress on intergranular water veins and lenses in ice, J. Glaciol., 11, 81–101, https://doi.org/10.3189/S0022143000022528, 1972.
Ohno, H., Igarashi, M., and Hondoh, T.: Salt inclusions in polar ice core: Location and chemical form of water-soluble impurities. Earth Planet. Lett., 232, 171–178, https://doi.org/10.1016/j.epsl.2005.01.001, 2005.
Ohno, H., Igarashi, M., and Hondoh, T.: Characteristics of salt inclusions in polar ice from Dome Fuji, East Antarctica, Geophys. Res. Lett., 33, 1–5, https://doi.org/10.1029/2006Gl025774, 2006.
Orem, M. W. and Adamson, A. W.: Physical adsorption of Vapor on ice, J. Coll. Interf. Sci., 31, 278–286, https://doi.org/10.1016/0021-9797(69)90337-3, 1969.
Oyabu, I., Lizuka, Y., Fisher, H., Schüpbach, S., Gfeller, G., Svensson, A., Fukui, M., Steffensen, J. P., and Hansson, M.: Chemical composition of particles present in the Greenland NEEM ice core over the last 110,000 years, J. Geophys. Res.-Atmos., 120, 9789–9813, https://doi.org/10.1002/2015JD023290, 2015.
Paterson, W. S. B.: Deformation within polar ice sheets: an analysis of the Byrd station and Camp Century borehole-tilting measurements, Cold Reg. Sci. Technol., 8, 165–179, 1983.
Paterson, W. S. B.: Why ice-age ice is sometimes “soft”, Cold Reg. Sci. Technol., 20, 75–98, https://doi.org/10.1016/0165-232X(91)90058-O, 1991.
Paterson, W. S. B.: The physics of glaciers, Third edition, Oxford, Elsevier, 1994.
Pimienta, P. and Duval, P.: Rate controlling processes in the creep of polar glacier ice, J. Phys. Coll., 48, 243–248, https://doi.org/10.1051/jphyscol:1987134, 1987.
Qi, C., Goldsby, D. L., and Prior, D. J.: The down-stress transition from cluster to cone fabrics in experimentally deformed ice, Earth Planet. Sci. Lett., 471, 136–147, https://doi.org/10.1016/j.epsl.2017.05.008, 2017.
Raj, R. and Ashby, M. F.: On grain boundary sliding and diffusional creep, Metall. Trans., 2, 1113–1127, https://doi.org/10.1007/BF02664244, 1971.
Rasmussen, S. O., Abbott, P. M., Blunier, T., Bourne, A. J., Brook, E., Buchardt, S. L., Buizert, C., Chappellaz, J., Clausen, H. B., Cook, E., Dahl-Jensen, D., Davies, S. M., Guillevic, M., Kipfstuhl, S., Laepple, T., Seierstad, I. K., Severinghaus, J. P., Steffensen, J. P., Stowasser, C., Svensson, A., Vallelonga, P., Vinther, B. M., Wilhelms, F., and Winstrup, M.: A first chronology for the North Greenland Eemian Ice Drilling (NEEM) ice core, Clim. Past, 9, 2713–2730, https://doi.org/10.5194/cp-9-2713-2013, 2013
Rigsby, G. P.: Effect of hydrostatic pressure on velocity of shear deformation of single ice crystals, J. Glaciol., 3, 273–278, https://doi.org/10.3189/S0022143000023911, 1958.
Rogozhina, I., Petrunin, A. G., Vaughan, A. P. M., Steinberger, B., Johnson, J., Kaban, M. K., Calov, R., Rickers, F., Thomas, M., and Koulakov, I.: Melting at the base of the Greenland ice sheet explained by Iceland hotspot history, Nat. Geosci., 9, 366–369, https://doi.org/10.1038/NGEO2689, 2016.
Russell-Head, D. S. and Budd, W. F.: Ice-sheet flow properties derived from bore-hole shear measurements combined with ice-core studies, J. Glaciol., 24, 117–130, https://doi.org/10.3189/S0022143000014684, 1979.
Ruth, U., Barnola, J.-M., Beer, J., Bigler, M., Blunier, T., Castellano, E., Fischer, H., Fundel, F., Huybrechts, P., Kaufmann, P., Kipfstuhl, S., Lambrecht, A., Morganti, A., Oerter, H., Parrenin, F., Rybak, O., Severi, M., Udisti, R., Wilhelms, F., and Wolff, E.: ”EDML1”: a chronology for the EPICA deep ice core from Dronning Maud Land, Antarctica, over the last 150 000 years, Clim. Past, 3, 475–484, https://doi.org/10.5194/cp-3-475-2007, 2007.
Sakurai, T., Iizuka, Y., Horlkawa, S., Johnsen, S., Dahl-Jensen, D., Steffensen, J. P., and Hondoh, T.: Direct observations of salts as micro-inclusions in the Greenland GRIP ice core, J. Glaciol., 55, 777–783, https://doi.org/10.3189/002214309790152483, 2009.
Sakurai, T., Ohno, H., Horikawa, S., Iizuka, Y., Uchida, T., Hirakawa, K., and Hondoh, T.: The chemical forms of water-soluble microparticles preserved in the Antarctic ice sheet during Termination I, J. Glaciol., 57, 1027–1032, https://doi.org/10.3189/002214311798843403, 2011.
Saylor, M. S. and Rohrer, G. S.: Measuring the Influence of Grain-Boundary Misorientation on Thermal Groove Geometry in Ceramic Polycrystals, J. Am. Soc., 82, 1529–1536, https://doi.org/10.1111/j.1151-2916.1999.tb01951.x, 1999.
Schulson, E. M. and Duval, P.: Creep and Fracture of Ice, Cambridge University Press, Cambridge, 2009.
Sheldon, S. G., Steffensen, J. P., Hansen, S. B., Popp, T. J., and Johnsen, S. J.: The investigation and experience of using ESTISOL ™ 240 and COASOL ™ for ice-core drilling, Ann. Glaciol., 55, 219–232, https://doi.org/10.3189/2014AoG68A036, 2014.
Steinbach, F., Bons, P. D., Griera, A., Jansen, D., Llorens, M.-G., Roessiger, J., and Weikusat, I.: Strain localization and dynamic recrystallization in the ice–air aggregate: a numerical study, The Cryosphere, 10, 3071–3089, https://doi.org/10.5194/tc-10-3071-2016, 2016.
Steinbach, F., Kuiper, E. N., Eichler, J., Bons, P. D., Drury, M. R., Griera, A., Pennock, G., and Weikusat, I.: The Relevance of Grain Dissection for Grain Size Reduction in Polar Ice: Insights from Numerical Models and Ice Core Microstructure Analysis, Front. Earth Sci., 5, 1–19, https://doi.org/10.3389/feart.2017.00066, 2017.
Suwa, M., von Fischer, J. C., Bender, M. L., Landais, A., and Brook, E. J.: Chronology reconstruction for the disturbed bottom section of the GISP2 and the GRIP ice cores: Implications for Termination II in Greenland, J. Geophys. Res., 111, D02101, https://doi.org/10.1029/2005JD006032, 2006.
Thorsteinsson, T., Kipfstuhl, J., Eicken, H., Johnsen, S. J., and Fuhrer, K.: Crystal size variations in Eemian-age ice from the GRIP ice core, Central Greenland, Earth Planet. Sci. Lett., 131, 381–394, https://doi.org/10.1016/0012-821X(95)00031-7, 1995.
Thorsteinsson, T., Kipfstuhl, J., and Miller, H.: Textures and fabrics in the GRIP ice core, J. Geophys. Res., 102, 26583–26599, https://doi.org/10.1029/97JC00161, 1997.
Thorsteinsson, T., Waddington, E. D., Taylor, K. C., Alley, R. B., and Blankenship, D. D.: Strain-rate enhancement at Dye 3, Greenland, J. Glaciol., 45, 338–345, https://doi.org/10.3189/002214399793377185, 1999.
Thomson, E. S., Hendrik Hansen-Goos, Wettlaufer, J. S., and Wilen, L. A.: Grain boundary melting in ice, The J. Chem. Phys., 138, 1–5, https://doi.org/10.1063/1.4797468, 2013.
Treverrow, A., Budd, W. F., Jacka, T. H., and Warner, R. C.: The tertiary creep of polycrystalline ice: experimental evidence for stress-dependent levels of strain enhancement, J. Glaciol., 58, 301–314, 2012.
Van de Wal, R. S. W., Boot, W., Van den Broeke, M. R., Smeets, C. J. P. P., Reijmer, C. H., Donker, J. J. A., and Oerlemans, J.: Large and Rapid Melt-Induced Velocity Changes in the Ablation Zone of the Greenland Ice Sheet, Science, 321, 111–113, https://doi.org/10.1126/science.1158540, 2008.
Van der Veen, C. J. and Whillans, I. M.: Development of fabrics in ice, Cold Reg. Sci. Technol., 22, 171–195, https://doi.org/10.1016/0165-232X(94)90027-2, 1994.
Vaughan, M. J., van Wijk, K., Prior, D. J., and Bowman, M. H.: Monitoring the temperature-dependent elastic and anelastic properties in isotropic polycrystalline ice using resonant ultrasound spectroscopy, The Cryosphere, 10, 2821–2829, https://doi.org/10.5194/tc-10-2821-2016, 2016.
Von Mises, R.: Mechanik der Plastischen Formänderung von Kristallen, Zamm-Z. Angew. Math. Me., 8, 161–185, 1928.
Weertman, J.: Creep deformation of ice, Ann. Rev. Earth Planet. Sci., 11, 215–240, 1983.
Weikusat, I. and Kipfstuhl, S.: Crystal c-axes (fabric) of ice core samples collected from the NEEM ice core, PANGAEA, https://doi.pangaea.de/10.1594/PANGAEA.744004, 2010.
Weikusat, I., Jansen, D., Binder, T., Eichler, J., Faria, S. H., Wilhelms, F., Kipfstuhl, S., Sheldon, S., Miller, H., Dahl-Jensen, D., and Kleiner, T.: Physical analysis of an Antarctic ice core (EDML) – towards an integration of micro- and macrodynamics of polar ice, Philos. Trans. A, 375, 2015.0347, https://doi.org/10.1098/rsta.2015.0347, 2017.
Weikusat, I., Binder, T., and Kipfstuhl, S.: Structural grain parameters from image analysis of large area scan macroscope images from the NEEM ice core, PANGAEA, https://doi.org/10.1594/PANGAEA.919775, 2020a.
Weikusat, I., Kuiper, E.-J. N., de Bresser, J. H. P., Jansen, D., Pennock, G. M., and Drury, M. R.: A composite flow law to model deformation in the NEEM deep ice core, Greenland – The role of grain size, grain size distribution and premelting on ice deformation, PANGAEA, https://doi.org/10.1594/PANGAEA.920005, 2020b.
Wenk, H.-R., Canova, A., Molinari, A., and Kocks, U. F.: Viscoplastic modelling of texture development in quartzite, J. Geophys. Res., 94, 17895–17906, https://doi.org/10.1029/JB094iB12p17895, 1989.
Wettlaufer, J. S.: Ice Surfaces : Macroscopic Effects of Microscopic Structure, Philos. Trans. Mathe. Phys. Eng. Sci., 357, 3403–3425, 1999a.
Wettlaufer, J. S.: Impurity effects in the Premelting of Ice, Phys. Rev. Lett., 82, 2516–2519, https://doi.org/10.1103/PhysRevLett.82.2516, 1999b.
Wilson, C. J. L. and Zhang, Y.: Development of microstructure in the high-temperature deformation of ice, Ann. Glaciol., 23, 293–302, https://doi.org/10.3189/S0260305500013562, 1996.
Wilson, C. J. L., Zhang, Y., and Stüwe, K.: The effects of localized deformation on melting processes in ice, Cold Reg. Sci. Technol., 24, 177–189, 1996.
Wolovick, M. J. and Creyts, T. T.: Overturned folds in ice sheets: Insights from a kinematic model of traveling sticky patches and comparisons with observations, J. Geophys. Res.-Earth Surf., 121, 1065–1083, https://doi.org/10.1002/2015JF003698, 2016.
Woodcock, N. H.: Specification of fabric shapes using an eigenvalue method, J. Struct. Geol., 88, 1231–1236, https://doi.org/10.1130/0016-7606(1977)88<1231:SOFSUA>2.0.CO;2, 1977.
Zwally, H. J., Abdalati, W., Herring, T., Larson, K., Saba, J., and Steffen, K.: Surface Melt-Induced Acceleration of Greenland Ice-Sheet Flow, Science, 297, 218–223, https://doi.org/110.1126/science.1072708, 2002.