the Creative Commons Attribution 4.0 License.
the Creative Commons Attribution 4.0 License.
 | 04 Jun 2020
New observations of the distribution, morphology and dissolution dynamics of cryogenic gypsum in the Arctic Ocean
Jutta E. Wollenburg
Morten Iversen
Christian Katlein
Thomas Krumpen
Marcel Nicolaus
Giulia Castellani
Ilka Peeken
Hauke Flores
To date, observations on a single location indicate that cryogenic gypsum (Ca[SO4]•2H2O) may constitute an efficient but hitherto overlooked ballasting mineral enhancing the efficiency of the biological carbon pump in the Arctic Ocean. In June–July 2017 we sampled cryogenic gypsum under pack ice in the Nansen Basin north of Svalbard using a plankton net mounted on a remotely operated vehicle (ROVnet). Cryogenic gypsum crystals were present at all sampled stations, which suggested a persisting cryogenic gypsum release from melting sea ice throughout the investigated area. This was supported by a sea ice backtracking model, indicating that gypsum release was not related to a specific region of sea ice formation. The observed cryogenic gypsum crystals exhibited a large variability in morphology and size, with the largest crystals exceeding a length of 1 cm. Preservation, temperature and pressure laboratory studies revealed that gypsum dissolution rates accelerated with increasing temperature and pressure, ranging from 6 % d−1 by mass in polar surface water (−0.5 ∘C) to 81 % d−1 by mass in Atlantic Water (2.5 ∘C at 65 bar). When testing the preservation of gypsum in formaldehyde-fixed samples, we observed immediate dissolution. Dissolution at warmer temperatures and through inappropriate preservation media may thus explain why cryogenic gypsum was not observed in scientific samples previously. Direct measurements of gypsum crystal sinking velocities ranged between 200 and 7000 m d−1, suggesting that gypsum-loaded marine aggregates could rapidly sink from the surface to abyssal depths, supporting the hypothesized potential of gypsum as a ballasting mineral in the Arctic Ocean.
- Article
(3090 KB) - Full-text XML
-
Supplement
(1707 KB) - BibTeX
- EndNote


Climate change in the Arctic Ocean has led to a drastic reduction in the extent of summer sea ice as well as to a significant thinning of the sea ice (Kwok, 2018; Kwok and Rothrock, 2009). Sea ice strength has reduced, and increased deformation and fractionation result in a progressively increasing sea ice drift speed (Docquier et al., 2017) and sea ice export. Over the past decades, the ice export via the Fram Strait alone has increased by 11 % per decade during the productive spring and summer periods (Smedsrud et al., 2017). An increasing amount of sea ice produced in the East Siberian and Laptev seas melts over the adjacent continental slopes or in the central Arctic Ocean (Krumpen et al., 2019). Overall, the Arctic Ocean sea ice cover has shifted to a predominantly seasonal ice cover. However, although the majority of sea ice diminishes during late summer, the amount of sea ice produced in autumn and winter progressively increases (Kwok, 2018).
Large-scale transformations in the seasonal sea ice cover impact the physical, chemical and biological dynamics of the sea ice–ocean system. However, especially the interactions of physical–chemical processes within the sea ice and pelagic to benthic biological processes have only received a little attention. Of particular importance are poorly soluble minerals precipitated within the brine channels of sea ice, which, once released, may ballast organic material sinking to the seafloor. The changing Arctic sea ice becomes progressively thinner, develops more leads, allows increasing light penetration into the under-ice surface water (Katlein et al., 2015; Nicolaus et al., 2013, 2012) and supports fast-growing and often massive under-ice phytoplankton blooms (Arrigo et al., 2012, 2014; Assmy et al., 2017). A recent study reported on the sudden export event of an under-ice bloom of the “unsinkable alga” Phaeocystis, caused by the ballasting effect of cryogenic gypsum released from melting sea ice (Wollenburg et al., 2018a). This single event was the first and only report of cryogenic gypsum release in the Arctic Ocean. Moreover, this sea ice precipitation of cryogenic gypsum has never been recorded in Arctic sediments, sediment traps or other field studies.
When sea ice forms, the concentrations of dissolved ions in brine increase, and, depending on the temperature of sea ice, a series of minerals (ikaite, mirabilite, hydrohalite, gypsum, hydrohalite, sylvite, MgCl2, Antarcticite) precipitates (Butler, 2016; Butler and Kennedy, 2015; Geilfus et al., 2013; Golden et al., 1998; Wollenburg et al., 2018a). Once released into the ocean, gypsum is considered to be the most stable of the cryogenic precipitates (Butler et al., 2017; Strunz and Nickel, 2001). Sea-ice-derived cryogenic gypsum was first described by Geilfus et al. (2013) in a comprehensive work on the chemical, physical and mineralogical aspects of its precipitation in experimental and natural sea ice off Greenland. According to FREZCHEM, a chemical–thermodynamic model that was developed to quantify aqueous electrolyte properties at sub-zero temperatures, cryogenic gypsum can precipitate at temperatures below −18 ∘C and within a small temperature window between −6.5 and −8.5 ∘C (Geilfus et al., 2013; Marion et al., 2010; Wollenburg et al., 2018a). However, measurements on the stoichiometric solubility products showed that gypsum dynamics in ice–brine equilibrium systems strongly depend on the solubility and precipitation of hydrohalite and mirabilite (Butler, 2016; Butler et al., 2017). So far gypsum precipitation in experimental setups was only observed at temperatures between −7.1 and −8.2 ∘C, and not in the lower temperature range (Butler, 2016; Butler et al., 2017). Moreover, as Arctic sea ice rarely reaches temperatures lower than −18 ∘C, cryogenic gypsum is more likely precipitated within the higher temperature window in the Arctic Ocean (Wollenburg et al., 2018a).
A model applied to understand the gypsum release event of 2015 showed that the ice floe was too warm when it started to form and identified December to February as the most likely time span for gypsum precipitation (Wollenburg et al., 2018a). Due to the absence of a downward brine flux in this advanced phase of sea ice formation, gypsum crystals likely remain trapped in the ice until spring. In the absence of sufficient field observations, gypsum release from sea ice is expected to peak at the beginning of the melting season, when sea ice warms to temperatures above −5 ∘C. This temperature marks the transition in the fluid transport capacities of sea ice, allowing brine water and included crystals to be released into the water column (Golden et al., 1998). However, due to a lack of any extensive, year-round field studies, our knowledge depends on models, kinetics and two single field observations (Geilfus et al., 2013; Wollenburg et al., 2018a). There are no studies on sea-ice-derived cryogenic gypsum crystal morphologies and its stability in seawater. It is unclear whether gypsum just precipitates during the assumed peak from December to February or whether it continues to grow in remaining brine during sea ice drift.
In this study, we systematically investigated the occurrence of cryogenic gypsum release from sea ice in spring 2017 with special emphasis on the morphological properties of the crystals. Varieties of cryogenic gypsum crystal morphologies are described and illustrated. The sampled gypsum crystals were further subjected to various laboratory experiments. Hereby, we investigated the dissolution behaviour over typical depth and temperature ranges of the Arctic water column and in formaldehyde solution typically used for biological sampling preservation. We also made direct measurements of the size-specific sinking velocities of individual gypsum crystals. These experiments were conducted to answer the following question: why has cryogenic gypsum not previously been observed in field studies and does it qualify as a ballast mineral?
2.1 Gypsum sampling with the ROVnet and on-board treatment
RV Polarstern expedition PS 106 (June–July 2017) in the early melting season gave the opportunity to systematically study the occurrence of cryogenic gypsum release and the morphological properties of gypsum crystals in the area north of Svalbard and on the Barents Sea shelf (Fig. 1a; Table 1).
Table 1Properties of sea ice stations and characteristics of ROVnet profiles (NA: not available).
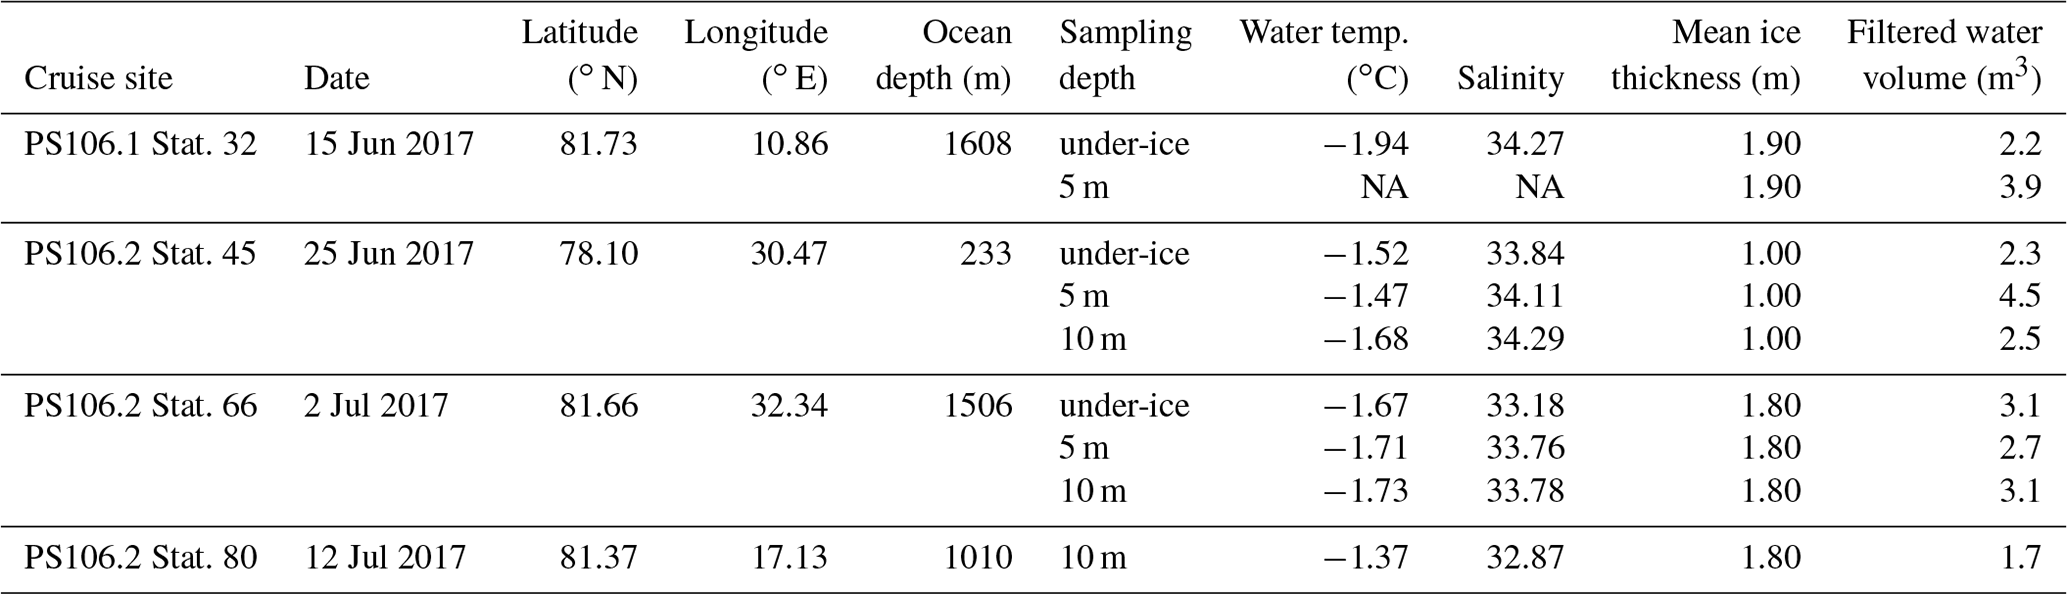

Figure 1Study area with sample locations. (a) Sea ice coverage at the station and time of sampling in %. (b) Trajectories of the sea ice from which the cryogenic gypsum was released. Each trajectory starts where sea ice formed (black circles) and shows its drift until the time and place of sampling (white circles). The colour scale of the drift trajectories indicates the month in which the backtracked sea ice was at any given position.
Cryogenic gypsum was sampled from the upper 10 m of the under-ice water at four stations distributed throughout the expedition area (Fig. 1a; Table 1). The first part of the expedition (PS106/1) consisted of a drift study north of Svalbard, during which the vessel was anchored to an ice floe (station 32). This ice floe was revisited 6 weeks later at the end of the expedition (PS106/2) (station 80). During the second part of the expedition (PS106/2), cryogenic gypsum was collected over the western Barents Sea (station 45) and in the Nansen Basin to the north-east of Svalbard (station 66).
Gypsum crystals were sampled with a plankton net mounted on a remotely operated vehicle (ROVnet, Fig. S1). The ROVnet consists of a polycarbonate frame with an opening of 40 cm by 60 cm, to which a zooplankton net with a mesh size of 500 µm was attached (Flores et al., 2018). For gypsum sampling, a handmade nylon net with an opening of 10 cm by 15 cm and a mesh size of 30 µm was mounted in the zooplankton net opening. The concentrated particulate material of the small nylon net was collected in a 2 L polyethylene bottle attached to the cod end of the net. A gauze-covered window in the cod-end bottle allowed seawater to drain out. Both nets were mounted on the aft end of a M500 (Ocean Modules, Sweden) observation class ROV carrying an extensive sensor suite described in Katlein et al. (2017). After each ROVnet deployment, the nets were rinsed with ambient seawater to concentrate the sample in the cod end of the net. The ROVnet sampled horizontal profiles in the water directly below the sea ice. Standard ROVnet profiles were conducted at the ice–water interface at 5 m and 10 m depths. The distance covered by each profile ranged between 300 and 600 m. At station 32, the 10 m profile was aborted due to technical failure. At station 80 no 5 m profile was sampled due to time constraints, and the sub-surface sample was discarded due to handling failure (Table 1).
The concentrated particulate material collected in the cod-end bottle of the gypsum sampling net was mixed with a sample-equivalent volume of 98 % ethanol and stored at 4 ∘C until further analyses (Wollenburg et al., 2018a).
At ROVnet sampling stations, ice thickness was estimated through thickness drill holes with a tape measure. To characterize the properties of the ice floes sampled on the floe-wide scale, ice thickness surveys were conducted at each sampling station with a GEM-2 (Geophex) electromagnetic induction ice-thickness sensor (Katlein et al., 2018).
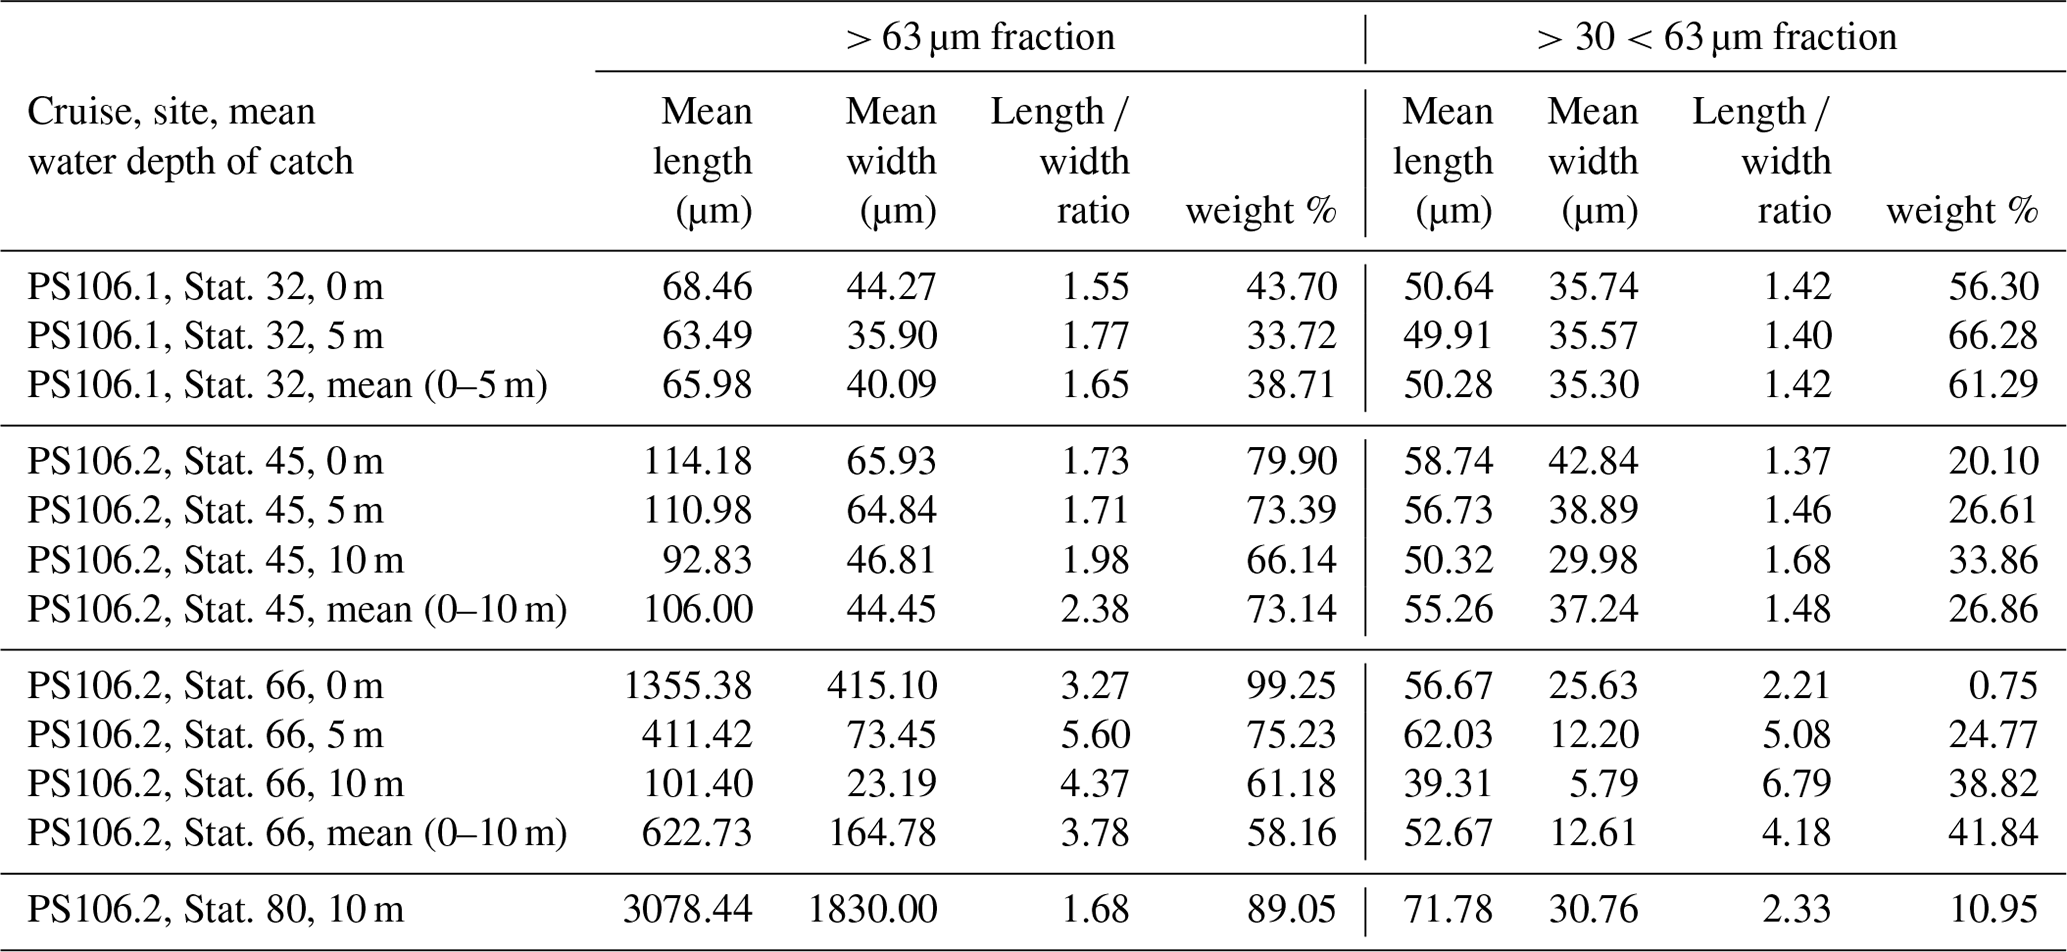
Table 2Size measurements and percentage of mass contribution of gypsum crystals from the > 63 µm size fraction and the µm size fraction.
2.2 Initial analyses of ROVnet samples
In the home laboratory the samples were rinsed onto a 32 µm mesh using fresh water. The samples were then oven-dried at 50 ∘C for 20 h. The remaining crystals were transferred into pre-weighed micropalaeontological slides, and their weight was determined with a high-precision Sartorius SE2 ultra-microbalance. Under a Zeiss Axio Zoom V16 microscope, pictures were taken with an Axiocam 506 colour camera. We made both overview images of the whole sample and detailed images of individual crystals. From all samples and crystal morphologies, individual crystals were analysed using Raman microscopy, which confirmed that the crystals were gypsum (Wollenburg et al., 2018a). As in some samples both very large and very small crystals (Figs. S3–S4) were observed; the > 32 µm samples were dry-sieved over a 63 µm analysis sieve. The length and width of the cryogenic gypsum crystals in the size fractions and > 63 µm were determined with the software application ImageJ for 50 crystals in each sample and size fraction (Schneider et al., 2012) (Table 2).
2.3 Initial analyses of ice cores
At all ice stations, sea ice cores for archive purposes and for further measurement of bottom communities were drilled with a 9 cm diameter ice corer (Kovacs Enterprise) and stored at −20 ∘C (Peeken et al., 2018b). One ice core from station 80 and four bottom slices (10 cm) of ice cores from station 45 were studied to investigate the gypsum crystal morphologies within sea ice. Each section was transferred into a measuring jug with lukewarm tap water for approximately 2 s, and then the jug was emptied over a 32 µm analysis sieve and repeatedly refilled. This process was continued until all ice was melted. With the aid of a hand shower and a wash bottle the residue on the sieve was rinsed and transferred into a 30 µm mesh-covered funnel, dried and transferred into a micropalaeontological picking tray for inspection and documentation. For storage, the residue was transferred onto pre-weighed, labelled micropalaeontological slides.
2.4 Dissolution experiments
The aim of our dissolution experiments was to investigate the persistence of gypsum crystals against dissolution in the Arctic water column (water mass trials) and under common biological sample treatment (formaldehyde trial).
Dissolution experiments were carried out on individual gypsum crystals collected from ROVnet samples. Hereby, five cryogenic gypsum crystals with different crystal morphologies and from both size fractions were used in each reaction chamber. Before the start and after the termination of each experiment, pictures of the cryogenic gypsum crystals used were taken with an Axiocam 506 colour camera under a Zeiss Axio Zoom V16 microscope. The weight of the crystals before and after each treatment was determined with a high-precision Sartorius SE2 ultra-microbalance after they had been transferred into a pre-weighed silver boat. The experimental running time of each experiment was 24 h.
2.4.1 Water mass trials
The experiments to simulate dissolution within the different water masses and hydrostatic pressure regimes of the Arctic Ocean were carried out with high-pressure chambers installed in a cooling table (Wollenburg et al., 2018b). With a high-pressure pump (ProStar218 Agilent Technologies), peak tubing and multiple titanium valves, a continuous isobaric and isocratic one-way seawater flow of 0.3 mL min−1 was directed through a set of four serially arranged high-pressure chambers each with an internal volume of 0.258 mL (Wollenburg et al., 2018b). This setup allowed for dissolution experiments at defined pressures and temperatures (Wollenburg et al., 2018b). For the experiments, we used sterile-filtered (0.2 µm mesh) North Sea water that was adjusted to a salinity of 34.98 by the addition of 1 g Instant Ocean® sea salt per litre and psu offset. The natural pH of 8.1 after equilibration to the refrigerator's atmosphere (at 2.5 ∘C and at atmospheric pressure) lowers to pH 8.05 at 2.5 ∘C at 150 bar (Culberson and Pytkowicx, 1968). Five experiments with four high-pressure chambers were carried out. The polar surface water (PSW) experimental trial was running at −0.5 ∘C and 3 bar, the experimental Atlantic Water (AW) trial was running at +2.5 ∘C and 65 bar, and three experimental deep water trials were conducted at −1 ∘C and 100, 120 and 150 bar.
2.4.2 Formaldehyde trial
To study the effect of formaldehyde treatment on cryogenic gypsum, the crystals were subjected to a formaldehyde solution of 4 % in seawater, which is commonly used to preserve biological samples. The stock solution consisted of 500 mL formaldehyde at a concentration of 40 %, 500 mL aqua deionized water and 100 g hexamethylenetetramine, adjusted to a pH of 7.3–7.9. Aliquots of the 20 % stock solution were added to the 4-fold volume of artificial Arctic Ocean seawater to obtain a final concentration of 4 %.
The gypsum crystals were transferred into Falcon tubes, and the 4 % formaldehyde solution was added. The Falcon tubes were then either stored at 3 ∘C or at room temperature. After the experiments, the gypsum crystal–formaldehyde suspension was washed with deionized water over a 10 µm mesh using a wash bottle and dried on gauze. As in all formaldehyde trials all gypsum dissolved, and no post-experimental weight was determined.
2.5 Size-specific settling velocities of gypsum
The size-specific sinking velocity of cryogenic gypsum was measured in a settling cylinder (Ploug et al., 2008). The cylinder (30 cm high and 5 cm in diameter) was filled with filtered seawater (salinity 32) and surrounded by a water jacket for thermal stabilization at 2 ∘C. The settling cylinder was closed at both ends, only allowing the insertion of a wide-bore pipette at the top. Immediately before measurement, the gypsum was submerged into seawater with a salinity of 32 and a temperature of 2 ∘C, and then transferred to the settling cylinder with a wide-bore pipette. The gypsum crystals were allowed to sink out of the wide-bore pipette, which was centred in the cylinder. The descent of the crystals was recorded by a Basler 4 MP Ethernet camera equipped with a 25 mm fixed focal lens (Edmund Optics). The settling column was illuminated from the sides by a custom-made LED light source. The camera recorded seven images per second as the gypsum crystals sank through the settling column. The measurements were only done with one camera, so a two-dimensional view. We measured over a distance of ∼ 5 cm after the crystals had reached terminal settling velocity and at stable and constant temperature and salinity. The technical uncertainties of the setup were smaller than the uncertainties between two similar-sized gypsum crystals, which had up to 1000 m d−1 uncertainties (see Fig. 6, with equivalent spherical diameters of ∼ 1 mm). The setup was calibrated by recording a length scale before sinking velocity measurements. The size and settling of the individual gypsum crystals was determined with the image analysis software ImageJ. This was done by using the projected area of the crystals to calculate the equivalent spherical diameter and the distance travelled between the subsequent images to determine the sinking velocity of the individual crystals (Iversen et al., 2010)
2.6 Backtracking the sampled ice floes under which cryogenic gypsum was sampled
To determine sea ice drift trajectories of sampled sea ice, we used a Lagrangian approach (ICETrack) that traces sea ice backward or forward in time using a combination of satellite-derived, low-resolution drift products. So far, ICETrack has been used in a number of publications to examine sea ice sources, pathways, thickness changes and atmospheric processes acting on the ice cover (Damm et al., 2018; Krumpen et al., 2016; Peeken et al., 2018a). A detailed description is provided in Krumpen et al. (2019).
Sea ice motion information was provided by different institutions and obtained from different sensors and for different time intervals. In this study we applied a combination of three different products: (i) motion estimates based on a combination of scatterometer and radiometer data provided by the Center for Satellite Exploitation and Research (CERSAT; Girard-Ardhuin and Ezraty, 2012); (ii) the OSI-405-c motion product from the Ocean and Sea Ice Satellite Application Facility (OSI SAF; Lavergne, 2016); and (iii) polar pathfinder daily motion vectors from the National Snow and Ice Data Center (NSIDC; Tschudi et al., 2016).
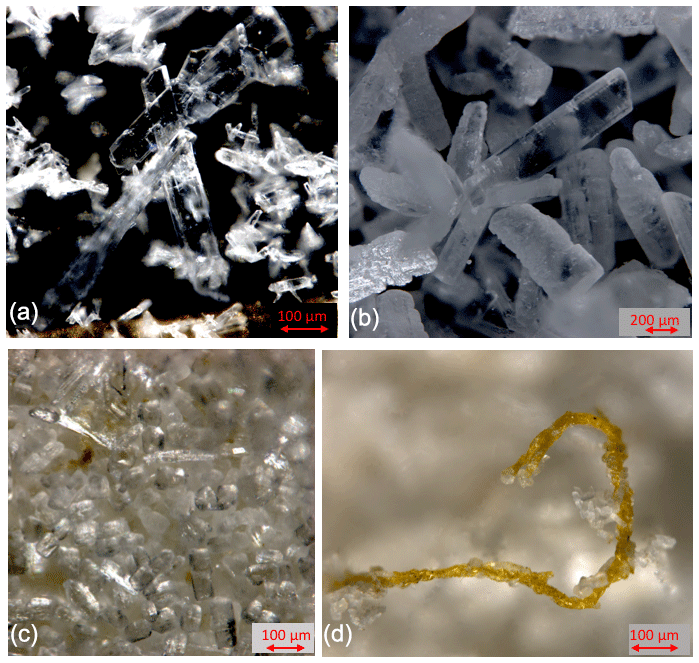
Figure 2Cryogenic gypsum crystals collected during Polarstern expedition PS106/1 from the upper water column. (a) Crystals collected from station 66 at 5 m water depth. (b) Crystals collected from station 66 at 0 m water depth. (c) Crystals collected from station 45 at 10 m water depth. (d) Crystals collected from station 45 at 10 m water depth entangled in an algae filament.

Figure 3Proportional mass (%) of cryogenic gypsum for the size fractions and >63 µm for all ROV samples.
The tracking approach works as follows: an ice parcel is traced backward or forward in time on a daily basis. Tracking is stopped if (a) ice hits the coastline or fast ice edge or (b) ice concentration at a specific location drops below 50 %, at which point we assume the ice to be formed or melted. The applied sea ice concentration product was provided by CERSAT and was based on 85 GHz SSM/I brightness temperatures, using the ARTIST Sea Ice (ASI) algorithm.
3.1 Presence and distribution of cryogenic gypsum under the investigated ice floes
Based on backtracking (Krumpen, 2018) and sea ice observations, the sampled ice floes had an age of 1 to 3 years (Fig. 1b), were originating in the Siberian Sea (station 32/80) and the Laptev Sea (station 45), and were more locally grown in the Nansen Basin (station 66). Whereas the mean sea ice thickness at the ROV survey stations ranged between 94 and 156 cm, the mean sea ice thickness of the investigated ice floes, estimated by ice-thickness sensor surveys (Katlein et al., 2018), was 1.90 m for station 32, 1.00 m for station 45 and 1.80 m for stations 66 and 80 (Fig. 1a, Table 1). Despite the different origins and thicknesses of sea ice, cryogenic gypsum crystals were found at all stations and at all depth layers sampled with the ROVnet (Fig. 1a, b, Table 1). At all stations and sampling depths, the samples were dominated by cryogenic gypsum with a proportional dry weight of > 96.5 % in the 5 m sample at station 32 and of > 99 % in all other samples (Figs. 2, S2–S5). Other lithogenic particles, as are often found in sea ice (Nürnberg et al., 1994), were essentially absent.
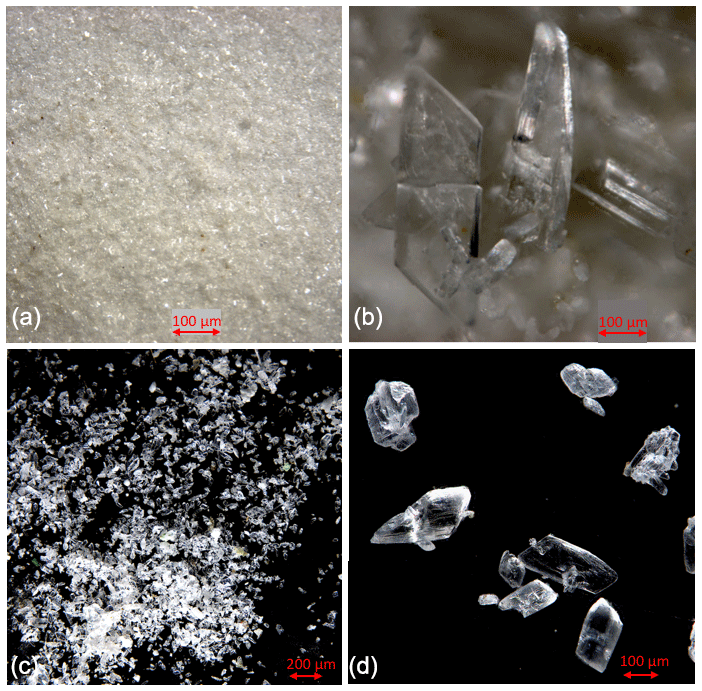
Figure 4Comparison of cryogenic gypsum crystals collected from the water column at station PS45 (10 m water depth) (a, b) with crystals retrieved from an ice core collected above the ROVnet sampling area (c, d).
3.2 The morphology of cryogenic gypsum
The samples collected at station 32 were dominated by solid, rounded, matt cryogenic gypsum crystals with a mean length–width ratio of 1.40–1.76 (Tables 2, S2). The proportional mass contribution of the smaller-sized crystals of the µm size fraction increased with depth and outweighed the contribution of the > 63 µm size fraction with 56.30 % and 66.28 % for the 0 and 5 m water depth samples, respectively (Fig. 3). At 0 m, the mean length of the crystals was 68.46 µm in the > 63 µm size fraction and 50.64 µm in the µm fraction. At 5 m depth, crystal dimensions were similar with mean crystal lengths ranging from 63.28 µm in the >63 µm fraction to 49.91 µm in the µm size fraction.
At station 45, the crystals were mostly solid and for the most part hyaline rather than matt crystals as at station 32 (Figs. 2c, d, 6, S3). With decreasing weight proportion, the > 63 µm size clearly dominated the 0, 5 and 10 m samples with 79.90 %, 73.39 % and 66.14 %, respectively. In the 0 m layer samples, mean crystal lengths were 114.18 µm in the > 63 µm size fraction and 58.74 µm in the µm size fraction (Table 2). At 5 m depth, we observed mean crystal lengths of 111 µm in the > 63 µm size fraction and 56.73 µm in the µm fraction. The mean crystal lengths in the 10 m samples were 92.83 and 50.32 µm for the > 63 and µm size fractions, respectively. At station 45 the crystal length–width ratio varied between 1.37 and 1.98, measured in the µm size fraction of the surface sample and in the > 63 µm size fraction of the 10 m sample. The cryogenic gypsum crystals retrieved from the melted ice core drilled at this station were solid and hyaline. In size and shape they resembled the crystals of the 10 m layer at this station with a mean crystal length of 114.2 µm, mean width of 57.2 µm and a length–width ratio of 2 (Fig. 4).
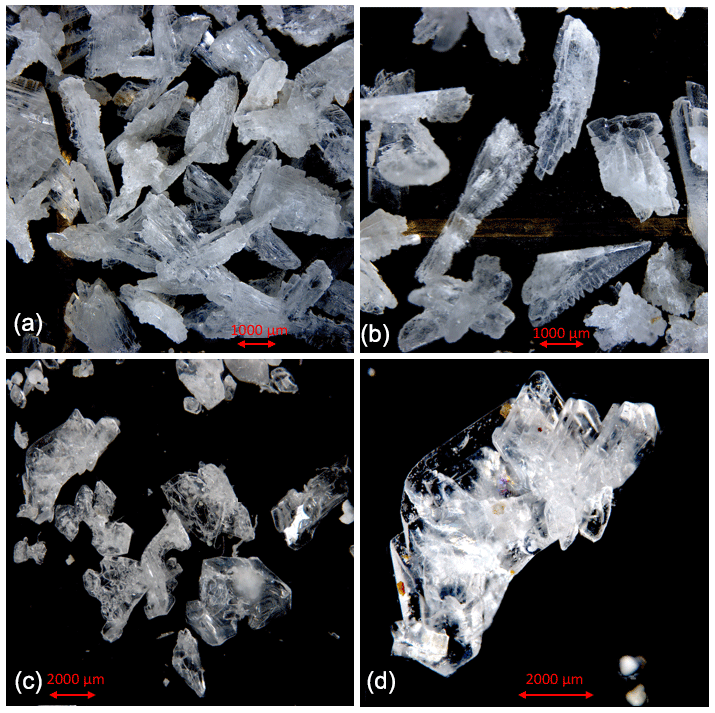
Figure 5Comparison of cryogenic gypsum crystals collected from the water column at station PS80-2 (10 m water depth) (a, b) with crystals retrieved from an ice core collected above the ROVnet sampling area (c, d).
At station 66, the crystals from 0 m water depth were dominated by large, solid, pencil-like, hyaline crystals with a mean crystal length of 1355 µm and mean width of 415 µm in the dominating > 63 µm fraction (99.25 % mass) (Figs. 2b, S4, Table 2). These crystals with an average length–width ratio of 3.27 were found as isolated crystals but very often also as intergrown crystal rosettes with 2 to more than 10 individual crystals involved (Fig. S4, Table 2). The µm size fraction (0.75 % mass) was dominated by rounded, whitish, matt gypsum particles and tiny gypsum needles with a mean crystal length of 56.67 µm (Fig. S4, Table 2). As at the other stations, the weight proportion of the > 63 µm size fraction significantly decreased from 99.25 in the 0 m, to 75.23 at 5 m and to 61.18 % in the 10 m sample (Fig. 2). The size of cryogenic gypsum crystals collected from the 5 and 10 m layers was significantly smaller and predominantly composed of isolated small hyaline and euhedral gypsum needles. The length–width ratio ranged between 5.60 (5 m) and 4.37 (10 m) (Figs. 2a, S4, Table 2). In the 5 m layer sample, the mean crystal length was 411.42 µm in the > 63 µm size fraction and 62.03 µm in the µm size fraction. The 10 m samples showed a mean crystal length of 101.40 µm in the > 63 and 30.71 µm in the µm size fraction (Table 2).
In the 10 m layer sample of station 80, large tabular gypsum crystals measuring up to 1 cm in length (mean length: 3078 µm, mean width: 1830 µm) dominated the > 63 µm size fraction. Their average length–width ratio was 1.7. This size fraction contributed 89.1 % of the gypsum mass (Figs. 5, S5, Table 2). The µm size fraction was composed of fragments of these large crystals and a few small gypsum needles. These often intergrown columnar crystals looked bladed and for the most part also dented and with numerous cracks. Their mean length was 71.8 µm. The ice core retrieved from this station was very porous and broke into pieces of 9 to 11 cm. Cryogenic gypsum was retrieved from all these ice core sections and revealed a dominance of extraordinary large crystals (Figs. 5, S5), which resembled the ROVnet samples from this station. The largest cryogenic gypsum crystals > 6000 µm (mean crystal length: 2821 µm, mean width: 1689 µm) were retrieved from the topmost 8 cm of the ice core section, whereas the maximum crystal size gradually decreased downcore (Fig. S5). The crystals themselves lacked sharp corners, and the large crystals had cavities inside, indicating an advanced stage of dissolution (Figs. 5c, d, S5).
3.3 Dissolution experiments
3.3.1 Experiments to simulate cryogenic gypsum dissolution within the Arctic water column
Our study area was characterized by the presence of three main water masses (Nikolopoulos et al., 2018; Rudels, 2015): (1) the polar surface water (PSW), including the halocline, with a variable mean salinity of 32 and a temperature range of −1.8 to 0.0 ∘C, extending from the surface to maximum 100 m water depth (Nikolopoulos et al., 2018); (2) the Atlantic Water (AW) with a mean salinity of 34.4 to 34.7 and variable temperature of 0.0 to 4.7 ∘C in the study area, extending from below the PSW to 600–800 m water depth (Nikolopoulos et al., 2018); and (3) the Eurasian Arctic deep water (EADW), which fills the deep Eurasian Basin below the AW with a temperature range of < 0 to −0.94 ∘C and a salinity of about 34.9 (Nikolopoulos et al., 2018).
Table 3Dissolution experiments on cryogenic gypsum crystals. “Water mass” simulating experiments with 34.9 ‰ sterile filtered seawater. Each experiment was conducted in parallel in 3–4 separate pressure chambers.
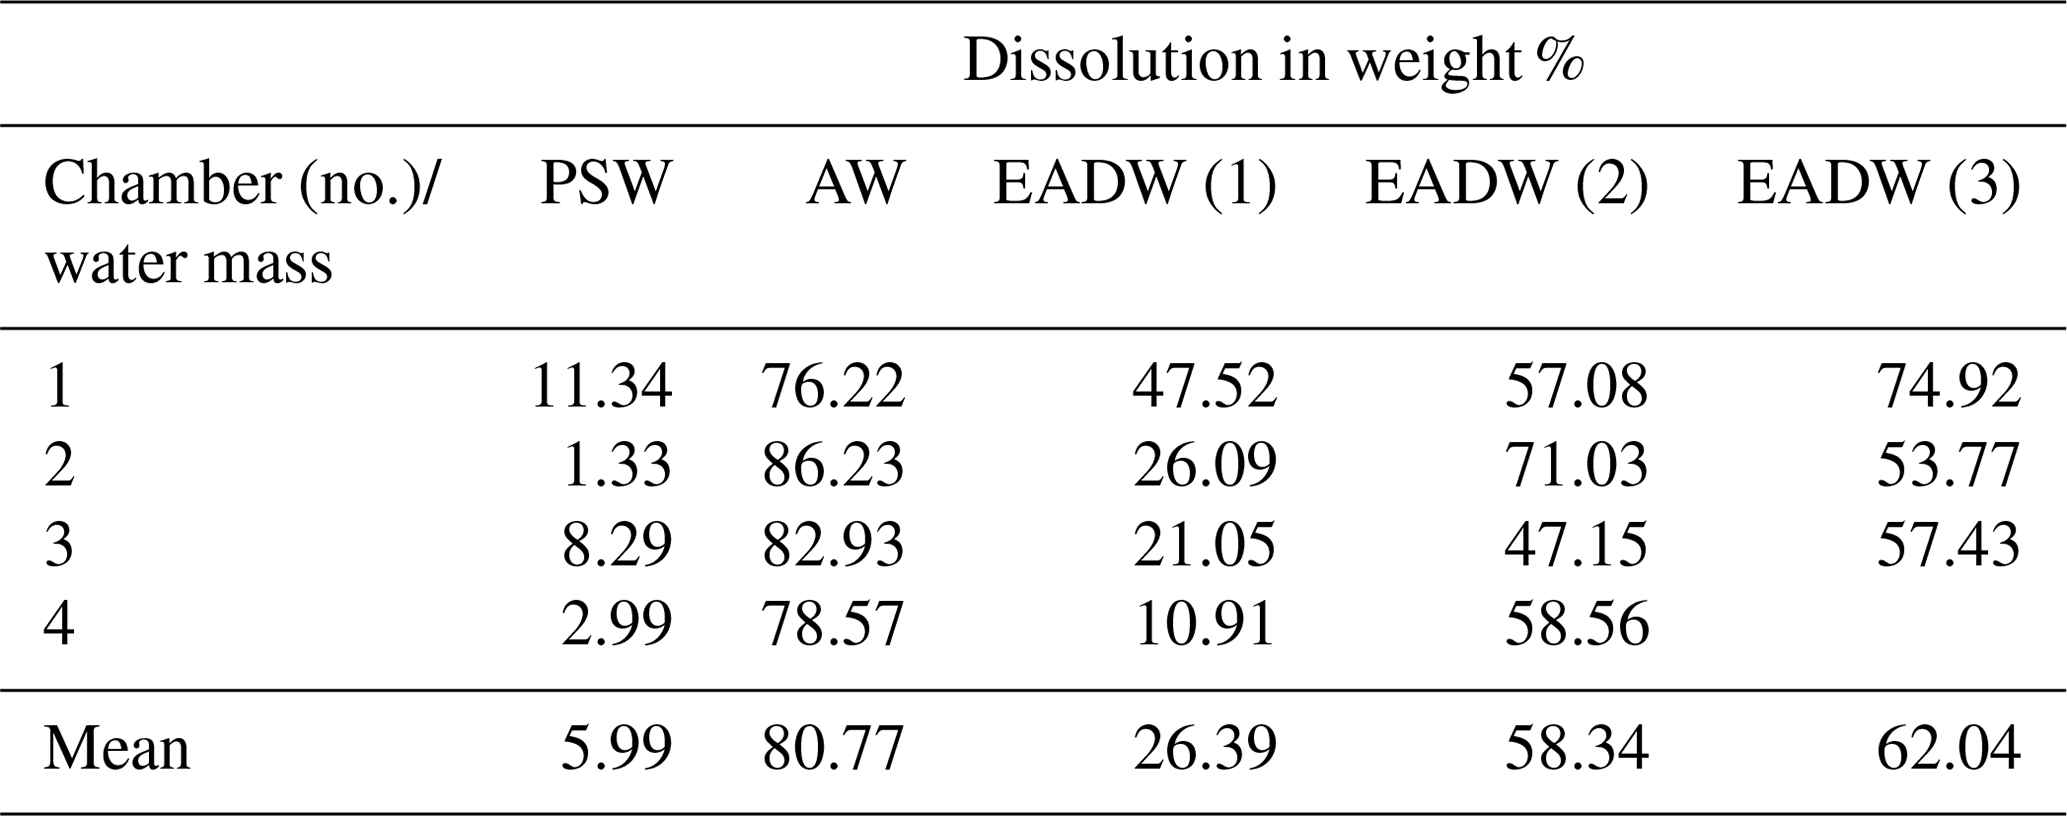
The dissolution experiments carried out to simulate dissolution in the PSW were set to 3 bar and −0.5 ∘C. Over the 24 h PSW-simulating dissolution experiment, about 6 % of the gypsum dissolved (Figs. 6, S6a, Table 3). In the AW experiment, the combination of positive temperatures (2.5 ∘C) and a pressure of 65 bar impacted the dissolution of the cryogenic gypsum crystals more than in any other seawater trial. More than 80 % of the cryogenic gypsum crystals dissolved during the 24 h experiment (Figs. 6, S6b, Table 3). The EADW-simulating dissolution experiments, set to a temperature of −0.5 ∘C, showed a progressive cryogenic gypsum dissolution of 26 %, 58 % and 62 % with increasing pressure for the 100, 120 and 150 bar experiments, respectively (Figs. 6, S7, Table 3). Moreover, as dissolution mainly affects the crystal's surface, smaller gypsum crystals and those with increased surface roughness (Fig. S8c, d) were preferentially impacted by dissolution, whereas larger and solid crystals with smooth surfaces showed the lowest dissolution (Fig. S8a, b).
3.3.2 Experiments to simulate cryogenic gypsum dissolution within formaldehyde-treated biological samples
In the formaldehyde experiments we exposed our set of cryogenic gypsum crystals to a formaldehyde solution of 4 %, which is commonly used to store pelagic samples from the polar oceans (Edler, 1979). Irrespective of the temperature at which the sample was stored, all gypsum dissolved within 24 h.
3.4 Sinking velocities of gypsum crystals
The sinking velocity (SV) of the gypsum crystals increased with crystal size (Fig. 7). Small crystals with an equivalent spherical diameter (ESD) of 200 µm sank with 300 m d−1 velocities, while large gypsum crystals with ESDs of 2000 to 2500 µm sank with velocities of 5000 to 7000 m d−1. The size to settling relationship was best described by a power function (SV = 4239.9 ESD0.839, R2=0.84).
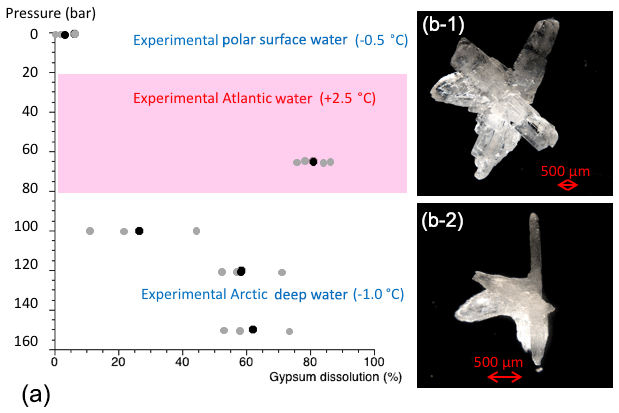
Figure 6Results from cryogenic gypsum dissolution experiments. (a) Graph showing the position of the simulated Arctic water masses in respect to pressure and temperature and how much gypsum (%) was dissolved on average over a 24 h exposure to such pressure and temperature conditions. Grey dots indicate the values from each aquarium and black dots the mean per experiment. (b-1) Cryogenic gypsum crystal of the 120 bar experiment before exposure. (b-2) The same cryogenic gypsum crystal of the 120 bar experiment after 24 h.
4.1 Distribution and morphology of cryogenic gypsum crystals
This study shows for the first time the widespread presence of cryogenic gypsum under melting Arctic sea ice of different origins. At all stations, cryogenic gypsum dominated the sample fraction of particles > 30 µm in Eurasian Basin surface waters, indicating a continuous cryogenic gypsum flux from melting sea ice over a period of 6 weeks.
When designing the ROVnet for cryogenic gypsum sampling, we opted for the coarser > 30 µm mesh to prohibit an overflow of the sampling container when running into a phytoplankton bloom. However, as Geilfus et al. (2013) have observed gypsum crystals as small as 10 µm, we probably lost an unknown proportion of smaller gypsum crystals by the chosen sampling strategy. The gypsum crystals described from sea ice so far retrieved from only 3-day-old experimental and 30 cm thick natural sea ice off Greenland were small (crystal length max. 100 µm). They are planar idiomorphic gypsum crystals often intergrown at large angles or occurring as rosettes (Geilfus et al., 2013). Similar but larger (crystal length up to 1 mm) gypsum crystals were observed within Phaeocystis aggregates collected in the region of the present study (Wollenburg et al., 2018a). However, here we show that gypsum crystals exhibit a strong variability in size and morphology. Particularly large crystals were characterized by more complex shapes (Figs. 2, 5, S3–4) and increased surface roughness (Fig. S8c, d), compared to the small planar euhedral (Fig. 2a) and more spherical crystals (Fig. S8a, b). Euhedral crystal needles larger but otherwise similar to those described by Geilfus et al. (2013) and Wollenburg et al. (2018a) dominated the > 63 µm fraction collected at 5 and 10 m depths at station 66, and smaller crystals contributed especially to the µm size fraction of the station's sub-surface samples.
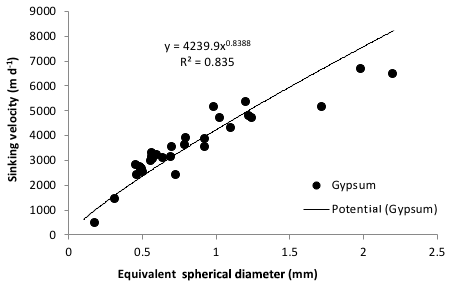
Figure 7Sinking velocity of cryogenic gypsum crystals plotted against equivalent spherical diameter (ESD).
As cryogenic gypsum forms in sea ice brine pockets or channels, the size and morphology especially of large crystals is likely determined by sea ice texture and porosity during gypsum precipitation. Pursuing this hypothesis, the large and intergrown crystals collected from the 0 m layer at station 66 and the 10 m layer and ice core at station 80 formed in highly branched granular sea ice (Lieb-Lappen et al., 2017; Weissenberger et al., 1992). In contrast, the small cryogenic gypsum needles reported by Geilfus et al. (2013) and Wollenburg et al. (2018a) may have preferentially formed in columnar sea ice. Even sampling the same ice floe (station 32 and 80), the appearance of the crystals changed. Possibly, a widening of the brine channels during the elapsed time (6 weeks) allowed a release of larger crystals at station 80 when compared to station 32. However, crystal growth during this elapsed period or lateral advection of large crystals cannot be excluded. Thus, detailed texture analyses of sea ice cores prior to sampling are needed to validate or reject hypotheses on a link between sea ice porosity and cryogenic gypsum crystal size and morphology, which should be considered in future studies.
The sea ice microstructure dictating the formation of gypsum crystals in the brine matrix likely varied among ice floes due to different ages, origins and drift trajectories (Fig. 1b). For example, station 66 was the only station where the sea ice likely formed over the central Nansen Basin only months before our study (Fig. 1b). The surface sample of station 66 had large star-shaped intergrown hyaline gypsum crystals that were observed at no other station. They also showed a considerably higher length–width ratio than crystals from second-year ice of stations 32/80 and 45 (Figs. 1b and 2). Accordingly, a close relationship between local sea ice properties and gypsum crystal morphology in the underlying water was evident from the comparison of gypsum crystals collected with the ROVnet with those retrieved from ice cores collected at two stations. The ice core samples revealed cryogenic gypsum crystals that basically resembled the crystal morphologies collected from the water column at the same stations, indicating that the gypsum morphologies observed in the water column likely reflect the gypsum precipitation conditions and brine-channel structure of local ice floes. The current understanding of mineral precipitation in supersaturated brine relies on ice core analyses, sea ice brine, experimental studies and the mathematical modelling of the temperature window in which each mineral is likely to form (Butler et al., 2017; Marion et al., 2010). There are still many uncertainties regarding the precipitation and dissolution of gypsum within natural sea ice and during ice core storage. Although the FREZCHEM model and Gitterman pathway predict gypsum precipitation under defined conditions, only Geilfus et al. (2013) and Butler et al. (2017) succeeded in retrieving gypsum under such conditions, whereas others failed (Butler and Kennedy, 2015). According to the FREZCHEM model, cryogenic gypsum precipitates at temperatures of −6.2 to −8.5 ∘C and at temperatures ∘C (Geilfus et al., 2013; Wollenburg et al., 2018a). Accordingly, a storage temperature of −20 ∘C would allow the post-coring precipitation of gypsum from contained brine. However, in field and experimental studies, cryogenic gypsum was so far only observed to precipitate in the −6.2 to −8.5 ∘C temperature window, even when treatments were conducted below −20 ∘C (Butler et al., 2017; Geilfus et al., 2013). Furthermore, the observed signs of dissolution on the large cryogenic gypsum crystals from the ice core when compared to the sharp-edged crystals retrieved from the water column at station 80 indicate that significant new precipitation of gypsum during storage did not occur but rather the opposite.
Apart from the growing conditions of gypsum crystals within sea ice, the size spectrum of crystals retrieved from different depths in the water column was likely essentially altered by the size-dependent sinking velocity of the crystals. Because the sinking velocity of large cryogenic gypsum crystals is high, the chance to catch large crystals with horizontal transects directly under the ice should be lower compared to small crystals (Fig. 7a). Accordingly, significant amounts of large cryogenic gypsum crystals were mainly sampled from the 0 m layer where they could be scraped off the underside of the ice (see station 66, Table 2). In contrast, smaller cryogenic gypsum crystals sink at lower velocities (Fig. 7a). Hence, the large quantity of small-sized crystals retrieved in the deeper layers of station 66 and all layers of station 32 and 45 were likely influenced by the accumulated gypsum release in this size fraction, whereas the rarer large crystals indicated the momentary release at these stations. The extremely large crystals sampled at station 80 at 10 m depth probably indicated an ongoing flux event during rapid melting. According to our dissolution experiments, gypsum dissolution within Arctic surface waters should only have a minor impact on the size distribution of cryogenic gypsum crystals within the surface water. Besides vertical flux, the advection of gypsum crystals with surface currents may also have influenced the size distribution of gypsum crystals sampled in the water column.
4.2 Reasons why cryogenic gypsum was rarely observed in past studies
The small temperature range of the −6.2 to −8.5 ∘C window, which is also the only gypsum precipitation temperature spectrum applicable in the Arctic Ocean, has been considered one reason why gypsum was not detected in other studies (Butler and Kennedy, 2015; Wollenburg et al., 2018a). Furthermore, the kinetics of gypsum precipitation was considered too slow for detection during experimental studies, and the amount of gypsum was considered hard to verify versus other sea ice precipitates that are quantitatively much more abundant, leading the focus towards other sea ice precipitates (Butler and Kennedy, 2015; Geilfus et al., 2013). Although cryogenic mirabilite and hydrohalite are 3 and 22 times more abundant than gypsum, respectively (Butler and Kennedy, 2015), gypsum is the only sea ice precipitate that survives for one to several days within the Arctic water column. Cryogenic gypsum dissolution increases with increasing hydrostatic pressure and increasing temperatures (Fig. 6). However, well-preserved cryogenic gypsum crystals were retrieved from algae aggregates collected from 2146 m water depth, suggesting that either the transport from the surface to this depth was very rapid or that dissolution was decreased and/or prevented once gypsum crystals were included within the matrix of organosulfur compound-rich aggregates (Wollenburg et al., 2018a). Yet, as seawater is usually undersaturated with respect to gypsum (Briskin and Schreiber, 1978) and as shown by our dissolution experiments, the disaggregation of organic aggregates would expose the gypsum to the seawater and dissolve any crystals, suggesting that the gypsum crystals sank rapidly to the seafloor within the organic aggregates. The same dissolution would occur within the sampling cups of sediment traps, explaining why gypsum has not been observed in those types of samples.
Our dissolution experiments showed that cryogenic gypsum can persist long enough in the cold polar surface water to be collected in measurable concentrations. The missing evidence of gypsum from past studies was likely due to the quick dissolution of gypsum crystals at higher temperatures and the pressure dependence of dissolution kinetics, impeding the discovery of gypsum in sediment trap samples and on the seafloor. In addition, formaldehyde preservation leads to the immediate dissolution of gypsum, destroying any evidence of cryogenic gypsum in all biological samples that are fixed with formaldehyde, including water column and net samples.
Based on our experience with the PS106 expedition samples and the experiments presented here, we propose a standardized procedure for gypsum sampling in the field. This procedure is part of the standard operating protocol for gypsum sampling on the MOSAiC expedition (Fig. S9).
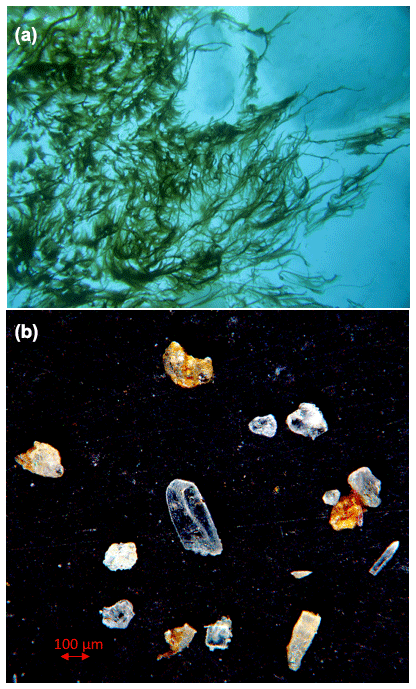
Figure 8(a) Living Melosira arctica curtains hanging from ice floes during the PS106 expedition (photo taken by Marcel Nicolaus and Christian Katlein). (b) Cryogenic gypsum isolated from Melosira arctica (PS106/1, station 21; Peeken at al., 2018b).
4.3 Potential of cryogenic gypsum as a ballast of algae blooms
We found less than 6 % dissolution of individual crystals in polar surface water per day. Thus, at depths immediately below the fluorescence maximum where a significant part of organic aggregates are formed (Iversen et al., 2010), the gypsum scavenging and ballasting of aggregates (Turner, 2015) is little affected by gypsum dissolution (Olli et al., 2007) (Fig. 6, Table 3). The incorporation of dense minerals into settling organic aggregates will increase their density and, therefore, the size-specific sinking velocities of the aggregates (Iversen and Ploug, 2010; Iversen and Robert, 2015; van der Jagt et al., 2018). The high sinking velocity of large gypsum crystals > 1 mm (5000–7000 m d−1; Fig. 7a) could create strong hydrodynamic shear that might cause disaggregation of fragile algae aggregates (Olli et al., 2007). However, smaller gypsum crystals have been observed inside Phaeocystis aggregates collected at depths below 2000 m (Wollenburg et al., 2018a). This shows that cryogenic gypsum is incorporated into organic aggregates and supports the hypothesis that gypsum can be an important ballast mineral of organic aggregates.
As chlorophyll concentrations in the surface water were mostly low (< 1 mg m−3; Hauke Flores, unpublished data), a massive gypsum-mediated export of phytoplankton was unlikely during expedition PS106. However, especially at the ice floe of station 32/80, we observed a high coverage of the ice underside by the filamentous algae Melosira arctica, and gypsum crystals were found in M. arctica filaments collected nearby (Fig. 8), as well as at station 45 (Fig. 2d). This indicates a potential for rapid M. arctica sedimentation mediated by cryogenic gypsum, as soon as the algal filaments were released from the melting sea ice. Hence, ballasting by cryogenic gypsum may also have contributed to the mass export of Melosira arctica aggregates observed in 2012 (Boetius et al., 2013).
This study shows for the first time that gypsum released into the water at the onset of melt season in the Arctic Ocean causes a constant flux of gypsum over widespread areas and over a long period of time (> 6 weeks). The morphological diversity of gypsum crystals retrieved from Arctic surface waters and ice cores indicated a complex variety of precipitation and release processes, as well as modifications during sea ice formation, the melt phase and in the water column. In the fresh and cold polar surface water, gypsum crystals persist long enough to act as an effective ballast on organic matter, such as phytoplankton filaments and marine snow.
Cryogenic gypsum collected during PS106 is available at https://doi.org/10.1594/PANGAEA.916035 (Wollenburg and Iversen, 2020).
The supplement related to this article is available online at: https://doi.org/10.5194/tc-14-1795-2020-supplement.
JW, HF and MI designed this study. JW led the writing of this paper and performed gypsum sample preparation and analysis. HF, IP, CK, GC and MN acquired ROVnet and ice samples in the field. MI measured crystal settling velocities. TK performed the backtracking analysis. All authors contributed to the writing and editing of the paper.
The authors declare that they have no conflict of interest.
We thank Gernot Nehrke for performing Raman spectroscopy on crystals from all catches. Christoph Vogt and Dieter Wolf-Gladrow made valuable comments on the paper. We thank the captain and crew of RV Polarstern expedition PS106 for their support at sea. This study was funded by the PACES (Polar Regions and Coasts in a Changing Earth System) programme of the Helmholtz Association and the Helmholtz infrastructure fund “Frontiers in Arctic Marine Monitoring (FRAM)”. This study used samples and data provided by the Alfred-Wegener-Institut Helmholtz-Zentrum für Polar- und Meeresforschung in Bremerhaven from Polarstern expedition PS106 (grant no. AWI-PS106_00).
The article processing charges for this
open-access publication were covered by a Research
Centre of the Helmholtz Association.
This paper was edited by Florent Dominé and reviewed by Griet Neukermans and one anonymous referee.
Arrigo, K. R., Perovich, D. K., Pickart, R. S., Brown, Z. W., van Dijken, G. L., Lowry, K. E., Mills, M. M., Palmer, M. A., Balch, W. M., Bahr, F., Bates, N. R., Benitez-Nelson, C., Bowler, B., Brownlee, E., Ehn, J. K., Frey, K. E., Garley, R., Laney, S. R., Lubelczyk, L., Mathis, J., Matsuoka, A., Mitchell, B. G., Moore, G. W. K., Ortega-Retuerta, E., Pal, S., Polashenski, C. M., Reynolds, R. A., Schieber, B., Sosik, H. M., Stephens, M., and Swift, J. H.: Massive Phytoplankton Blooms Under Arctic Sea Ice, Science, 336, 1408, https://doi.org/10.1126/science.1215065, 2012.
Arrigo, K. R., Perovich, D. K., Pickart, R. S., Brown, Z. W., van Dijken, G. L., Lowry, K. E., Mills, M. M., Palmer, M. A., Balch, W. M., Bates, N. R., Benitez-Nelson, C. R., Brownlee, E., Frey, K. E., Laney, S. R., Mathis, J., Matsuoka, A., Greg Mitchell, B., Moore, G. W. K., Reynolds, R. A., Sosik, H. M., and Swift, J. H.: Phytoplankton blooms beneath the sea ice in the Chukchi sea, Deep-Sea Res. Pt. II, 105, 1–16, 2014.
Assmy, P., Fernández-Méndez, M., Duarte, P., Meyer, A., Randelhoff, A., Mundy, C. J., Olsen, L. M., Kauko, H. M., Bailey, A., Chierici, M., Cohen, L., Doulgeris, A. P., Ehn, J. K., Fransson, A., Gerland, S., Hop, H., Hudson, S. R., Hughes, N., Itkin, P., Johnsen, G., King, J. A., Koch, B. P., Koenig, Z., Kwasniewski, S., Laney, S. R., Nicolaus, M., Pavlov, A. K., Polashenski, C. M., Provost, C., Rösel, A., Sandbu, M., Spreen, G., Smedsrud, L. H., Sundfjord, A., Taskjelle, T., Tatarek, A., Wiktor, J., Wagner, P. M., Wold, A., Steen, H., and Granskog, M. A.: Leads in Arctic pack ice enable early phytoplankton blooms below snow-covered sea ice, Sci. Rep., 7, 40850, https://doi.org/10.1038/srep40850, 2017.
Boetius, A., Albrecht, S., Bakker, K., Bienhold, C., Felden, J., Fernandez-Mendez, M., Hendricks, S., Katlein, C., Lalande, C., Krumpen, T., Nicolaus, M., Peeken, I., Rabe, B., Rogacheva, A., Rybakova, E., Somavilla, R., Wenzhöfer, F., and R. V. Polarstern ARK27-3-Shipboard Science Crew: Export of Algal Biomass from the Melting Arctic Sea Ice, Science, 339, 1430–1432, 2013.
Briskin, M. and Schreiber, B. C.: Authigenic gypsum in marine sediments, Mar. Geol., 28, 37–49, 1978.
Butler, B.: Mineral dynamics in sea ice brines, PhD, Bangor, 184 pp., 2016.
Butler, B. M. and Kennedy, H.: An investigation of mineral dynamics in frozen seawater brines by direct measurement with synchrotron X-ray powder diffraction, J. Geophys. Res.-Oceans, 120, 5686–5697, 2015.
Butler, B. M., Papadimitriou, S., Day, S. J., and Kennedy, H.: Gypsum and hydrohalite dynamics in sea ice brines, Geochim. Cosmochim. Ac., 213, 17–34, 2017.
Culberson, C. and Pytkowicx, R. M.: Effect of pressure on carbonic acid, boric acid, and the pH in seawater, Limnol. Oceanogr., 13, 403–417, 1968.
Damm, E., Bauch, D., Krumpen, T., Rabe, B., Korhonen, M., Vinogradova, E., and Uhlig, C.: The Transpolar Drift conveys methane from the Siberian Shelf to the central Arctic Ocean, Sci. Rep., 8, 4515, https://doi.org/10.1038/s41598-018-22801-z, 2018.
Docquier, D., Massonnet, F., Barthélemy, A., Tandon, N. F., Lecomte, O., and Fichefet, T.: Relationships between Arctic sea ice drift and strength modelled by NEMO-LIM3.6, The Cryosphere, 11, 2829–2846, https://doi.org/10.5194/tc-11-2829-2017, 2017.
Edler, L.: Recommendations on Methods for Marine Biological Studies in the Baltic Sea: Phytoplankton and chlorophyll, Department of Marine Botany, University of Lund, 1979.
Flores, H., Ehrlich, J., Lange, B. A., Kohlbach, D., Graeve, M., Orlov, A., Sulanke, E., Niehoff, B., Hildebrandt, N., Doble, M., Schaafsma, F. L., Meijboom, A., Fey, B., Kuehn, S., Bravo Rebolledo, Elisa, van Dorssen, M., van Franeker, J. A., Burggraaf, D., Couperus, A. S., Gradinger, R., Bluhm, B., Hassett, B., and Kunisch, E.: Under-ice fauna, zooplankton and endotherms, in: The Expeditions PS106/1 and 2 of the Research Vessel Polarstern to the Arctic Ocean in 2017, edited by: Knust, R., Macke, A., and Flores, H., Reports on polar and marine research, 34–37, 2018.
Geilfus, N. X., Galley, R. J., Cooper, M., Halden, N., Hare, A., Wang, F., Søgaard, D. H., and Rysgaard, S.: Gypsum crystals observed in experimental and natural sea ice, Geophys. Res. Lett., 40, 6362–6367, 2013.
Girard-Ardhuin, F. and Ezraty, R.: Enhanced Arctic Sea Ice Drift Estimation Merging Radiometer and Scatterometer Data, IEEE T. Geosci. Remote, 50, 2639–2648, 2012.
Golden, K. M., Ackley, S. F., and Lytle, V. I.: The Percolation Phase Transition in Sea Ice, Science, 282, 2238–2241, 1998.
Iversen, M., Nowald, N., Ploug, H., A. Jackson, G., and Fischer, G.: High resolution profiles of vertical particulate organic matter export off Cape Blanc, Mauritania: Degradation processes and ballasting effects, Deep-Sea Res. Pt. I, 57, 771–784, 2010.
Iversen, M. H. and Ploug, H.: Ballast minerals and the sinking carbon flux in the ocean: carbon-specific respiration rates and sinking velocity of marine snow aggregates, Biogeosciences, 7, 2613–2624, https://doi.org/10.5194/bg-7-2613-2010, 2010.
Iversen, M. H. and Robert, M. L.: Ballasting effects of smectite on aggregate formation and export from a natural plankton community, Mar. Chem., 175, 18–27, 2015.
Katlein, C., Arndt, S., Nicolaus, M., Perovich, D. K., Jakuba, M. V., Suman, S., Elliott, S., Whitcomb, L. L., McFarland, C. J., Gerdes, R., Boetius, A., and German, C. R.: Influence of ice thickness and surface properties on light transmission through Arctic sea ice, J. Geophys. Res.-Oceans, 120, 5932–5944, 2015.
Katlein, C., Schiller, M., Belter, H. J., Coppolaro, V., Wenslandt, D., and Nicolaus, M.: A New Remotely Operated Sensor Platform for Interdisciplinary Observations under Sea Ice, Front. Mar. Sci., 4, 281, https://doi.org/10.3389/fmars.2017.00281, 2017.
Katlein, C., Nicolaus, M., Sommerfeld, A., Copalorado, V., Tiemann, L., Zanatta, M., Schulz, H., and Lange, B.: Sea Ice Physics, in: The Expeditions PS106/1 and 2 of the research vessel Polarstern in the Arctic Ocean in 2017, edited by: Macke, A. and Flores, H., Berichte zur Polarforschung Bremerhaven, 2018.
Krumpen, T.: AWI ICETrack – Antarctic and Arctic Sea Ice Monitoring and Tracking Tool Alfred-Wegener-Institut Hemholtz-Zentrum für Polar- und Meeresforschung, Bremerhaven, Germany, 2018.
Krumpen, T., Gerdes, R., Haas, C., Hendricks, S., Herber, A., Selyuzhenok, V., Smedsrud, L., and Spreen, G.: Recent summer sea ice thickness surveys in Fram Strait and associated ice volume fluxes, The Cryosphere, 10, 523–534, https://doi.org/10.5194/tc-10-523-2016, 2016.
Krumpen, T., Belter, H. J., Boetius, A., Damm, E., Haas, C., Hendricks, S., Nicolaus, M., Nöthig, E.-M., Paul, S., Peeken, I., Ricker, R., and Stein, R.: Arctic warming interrupts the Transpolar Drift and affects long-range transport of sea ice and ice-rafted matter, Sci. Rep., 9, 5459, https://doi.org/10.1038/s41598-019-41456-y, 2019.
Kwok, R.: Arctic sea ice thickness, volume, and multiyear ice coverage: losses and coupled variability (1958–2018), Environ. Res. Lett., 13, 105005, https://doi.org/10.1088/1748-9326/aae3ec, 2018.
Kwok, R. and Rothrock, D. A.: Decline in Arctic sea ice thickness from submarine and ICESat records: 1958–2008, Geophys. Res. Lett., 36, L15501, https://doi.org/10.1029/2009GL039035, 2009.
Lavergne, T.: Validation and Monitoring of the OSI SAF Low Resolution Sea Ice Drift Product (v5), Ocean & Sea Ice SAF, 2016.
Lieb-Lappen, R. M., Golden, E. J., and Obbard, R. W.: Metrics for interpreting the microstructure of sea ice using X-ray micro-computed tomography, Cold Reg. Sci. Technol., 138, 24–35, 2017.
Marion, G. M., Mironenko, M. V., and Roberts, M. W.: FREZCHEM: A geochemical model for cold aqueous solutions, Comput. Geosci., 36, 10–15, 2010.
Nicolaus, M., Katlein, C., Maslanik, J., and Hendricks, S.: Changes in Arctic sea ice result in increasing light transmittance and absorption, Geophys. Res. Lett., 39, L24501, https://doi.org/10.1029/2012GL053738, 2012.
Nicolaus, M., Arndt, S., Katlein, C., Maslanik, J., and Hendricks, S.: Correction to “Changes in Arctic sea ice result in increasing light transmittance and absorption”, Geophys. Res. Lett., 40, 2699–2700, 2013.
Nikolopoulos, A., Heuzé, C., Linders, T., Andrée, E., and Sahlin, S.: Physical Oceanography, in: The Expeditions PS106/1 and 2 of the Research Vessel POLARSTERN to the Arctic Ocean in 2017, edited by: Macke, A. and Flores, H., Reports on Polar and Marine Research, Alfred-Wegener Institute Helmholtz Centre for Polar and marine research, Bremerhaven, 2018.
Nürnberg, D., Wollenburg, I., Dethleff, D., Eicken, H., Kassens, H., Letzig, T., Reimnitz, E., and Thiede, J.: Sediments in Arctic sea ice: Implications for entrainment, transport and release, Mar. Geol., 119, 185–214, 1994.
Olli, K., Wassmann, P., Reigstad, M., Ratkova, T. N., Arashkevich, E., Pasternak, A., Matrai, P. A., Knulst, J., Tranvik, L., Klais, R., and Jacobsen, A.: The fate of production in the central Arctic Ocean – top-down regulation by zooplankton expatriates?, Prog. Oceanogr., 72, 84–113, 2007.
Peeken, I., Primpke, S., Beyer, B., Gütermann, J., Katlein, C., Krumpen, T., Bergmann, M., Hehemann, L., and Gerdts, G.: Arctic sea ice is an important temporal sink and means of transport for microplastic, Nat. Commun., 9, 1505, https://doi.org/10.1038/s41467-018-03825-5, 2018a.
Peeken, I., Castellani, G., Flores, H., Ehrlich, J., Lange, B., Schaafsma, F. L., Gradinger, R., Hassett, B., Kunisch, E., Damm, E., Verdugo, J., Kohlbach, D., Graeve, M., and Blum, B.: Sea ice biology and biogeochemistry, in: The Expeditions PS106/1 and 2 of the Research Vessel Polarstern to the Arctic Ocean in 2017, edited by: Macke, A. and Flores, H., vol. 719, Reports of polar and marine research, 2018b.
Ploug, H., Iversen, M. H., Koski, M., and Buitenhuis, E. T.: Production, oxygen respiration rates, and sinking velocity of copepod fecal pellets: Direct measurements of ballasting by opal and calcite, Limnol. Oceanogr., 53, 469–476, 2008.
Rudels, B.: Arctic Ocean circulation, processes and water masses: A description of observations and ideas with focus on the period prior to the International Polar Year 2007–2009, Prog. Oceanogr., 132, 22–67, 2015.
Schneider, C. A., Rasband, W. S., and Eliceiri, K. W.: NIH Image to ImageJ: 25 years of image analysis, Nat. Meth., 9, 671–675, 2012.
Smedsrud, L. H., Halvorsen, M. H., Stroeve, J. C., Zhang, R., and Kloster, K.: Fram Strait sea ice export variability and September Arctic sea ice extent over the last 80 years, The Cryosphere, 11, 65–79, https://doi.org/10.5194/tc-11-65-2017, 2017.
Strunz, H. and Nickel, E. H.: Strunz Mineralogical Tables. Chemical-structural Mineral Classification System, Schweizerbart'sche Verlagsbuchhandlung, Nägele u. Obermiller, Stuttgart, 2001.
Tschudi, S., Fowler, C., Maslanik, J., Stewart, J., and Stewart, W.: Polar Pathfinder Daily 25 km EASE-Grid Sea Ice Motion Vectors, Technical report, NASA National Snow and Ice Data Center Distributed Active Archive Center, Boulder, CO, USA, 2016.
Turner, J. T.: Zooplankton fecal pellets, marine snow, phytodetritus and the ocean's biological pump, Prog. Oceanogr., 130, 205–248, 2015.
van der Jagt, H., Friese, C., Stuut, J.-B. W., Fischer, G., and Iversen, M. H.: The ballasting effect of Saharan dust deposition on aggregate dynamics and carbon export: Aggregation, settling, and scavenging potential of marine snow, Limnol. Oceanogr., 63, 1386–1394, 2018.
Weissenberger, J., Dieckmann, G., Gradinger, R., and Spindler, M.: Sea ice: A cast technique to examine and analyze brine pockets and channel structure, Limnol. Oceanogr., 37, 179–183, 1992.
Wollenburg, J. E. and Iversen, M. H.: Cryogenic gypsum collected during PS106-1/2 in 2017, PANGAEA, https://doi.org/10.1594/PANGAEA.916035, 2020.
Wollenburg, J. E., Katlein, C., Nehrke, G., Nöthig, E. M., Matthiessen, J., Wolf-Gladrow, D. A., Nikolopoulos, A., Gázquez-Sanchez, F., Rossmann, L., Assmy, P., Babin, M., Bruyant, F., Beaulieu, M., Dybwad, C., and Peeken, I.: Ballasting by cryogenic gypsum enhances carbon export in a Phaeocystis under-ice bloom, Sci. Rep., 8, 7703, https://doi.org/10.1038/s41598-018-26016-0, 2018a.
Wollenburg, J. E., Zittier, Z. M. C., and Bijma, J.: Insight into deep-sea life – Cibicidoides pachyderma substrate and pH-dependent behaviour following disturbance, Deep-Sea Res. Pt. I, 138, 34–45, 2018b.