the Creative Commons Attribution 4.0 License.
the Creative Commons Attribution 4.0 License.
 | 27 May 2020
Synoptic conditions and atmospheric moisture pathways associated with virga and precipitation over coastal Adélie Land in Antarctica
Nicolas Jullien
Étienne Vignon
Michael Sprenger
Franziska Aemisegger
Precipitation falling over the coastal regions of Antarctica often experiences low-level sublimation within the dry katabatic layer. The amount of water that reaches the ground surface is thereby considerably reduced. This paper investigates the synoptic conditions and the atmospheric transport pathways of moisture that lead to either virga – when precipitation is completely sublimated – or actual surface precipitation events over coastal Adélie Land, East Antarctica. For this purpose, the study combines ground-based lidar and radar measurements at Dumont d'Urville station (DDU), Lagrangian back trajectories, Eulerian diagnostics of extratropical cyclones and fronts, and moisture source estimations. It is found that precipitating systems at DDU are associated with warm fronts of cyclones that are located to the west of Adélie Land. Virga – corresponding to 36 % of the hours with precipitation above DDU – and surface precipitation cases are associated with the same precipitating system but they correspond to different phases of the event. Virga cases more often precede surface precipitation. They sometimes follow surface precipitation in the warm sector of the cyclone's frontal system, when the associated cyclone has moved to the east of Adélie Land and the precipitation intensity has weakened. On their way to DDU, the air parcels that ultimately precipitate above the station experience a large-scale lifting across the warm front. The lifting generally occurs earlier in time and farther from the station for virga than for precipitation. It is further shown that the water contained in the snow falling above DDU during pre-precipitation virga has an oceanic origin farther away (about 30∘ more to the west) from Adélie Land than the one contained in the snow that precipitates down to the ground surface.
- Article
(8072 KB) - Full-text XML
- BibTeX
- EndNote


Precipitation is the main water input to the mass balance of the Antarctic ice sheet (e.g., King and Turner, 1997). The atmospheric synoptic circulation over the Austral Ocean drives the advection of moisture from the midlatitudes towards Antarctica (Bromwich et al., 1995; Grieger et al., 2018), thereby controlling the amount and location of precipitation falling above the continent (Souverijns et al., 2018). Extratropical cyclones are responsible for a very important part of this moisture transport (Simmonds and Keay, 2000; Simmonds et al., 2003; Uotila et al., 2013). In cyclones, the poleward transport of moisture and the precipitation production mostly occurs in the warm and moist air stream that rises along the cold front within the cyclone's warm sector (the so-called “warm conveyor belt”; Eckhardt et al., 2004; Madonna et al., 2014). Sinclair and Dacre (2019) underline that the quantity of water extratropical cyclones bring to Antarctica mostly depends on the latitude of cyclogenesis and on the poleward propagation speed: the closer to the Equator cyclones form and the faster they transit to Antarctica, the more they carry water onto the ice sheet. During atmospheric blocking conditions (Naithani et al., 2002; Schlosser et al., 2010; Hirasawa et al., 2013), the advection of moisture along the eastern flank of cyclones can be particularly long and intense and can sometimes be associated with so-called “atmospheric rivers” (Gorodetskaya et al., 2014; Wille et al., 2019). Gorodetskaya et al. (2014) show that atmospheric rivers are responsible for anomalously high-snow-accumulation events over Dronning Maud Land, East Antarctica, substantially impacting the surface mass balance in this region. More generally, Turner et al. (2019) reveal that a large proportion of the total precipitation amount over the Antarctic ice sheet is brought by extreme precipitation events.
While the synoptic dynamics governs the advection of moisture over the ice sheet, the mesoscale dynamics exerts a significant control on the spatial distribution of precipitation as well as on the amount of precipitation that reaches the ground surface. In particular, Grazioli et al. (2017b) show that the relatively dry low-level katabatic winds blowing from the high plateau towards the ice sheet edges (Parish and Bromwich, 2007) sublimate a substantial part of the precipitation falling from overlying clouds. Such results were confirmed and further investigated in Vignon et al. (2019b) by inspecting the vertical profiles of relative humidity from radiosoundings over the coastal margins of East Antarctica. Atmospheric reanalysis and regional models suggest that about 17 % of precipitation sublimates at the continental scale (Grazioli et al., 2017b; Agosta et al., 2019), this percentage reaches about 35 % over the coastal regions.
Adélie Land, East Antarctica, experiences both fierce katabatic winds (Wendler et al., 1997) and strong precipitation sublimation (Vignon et al., 2019a, b). Inspecting vertical profiles of reflectivity from a precipitation radar, Durán-Alarcón et al. (2019) further reveal that 36 % of the time precipitation is detected in the column above Dumont d'Urville (DDU) station actually corresponds to virga cases, i.e., cases during which no precipitation reaches the ground surface. Such a percentage is comparable to the one estimated for precipitation falling over deserts in arid tropical regions (Wang et al., 2018).
Overall, understanding when, where and how precipitation is sublimated over Antarctica is crucial to decipher, simulate and predict the surface mass balance of the ice sheet (Agosta et al., 2019). Moreover as the sublimation process significantly affects the isotopic composition of snowfall, this phenomenon should potentially be taken into account and quantified when analyzing the isotopic composition of the near-surface water vapor or ice cores, especially in katabatic sectors of Antarctica (Bréant et al., 2019; Goursaud et al., 2019).
The present paper aims to study the synoptic conditions and the atmospheric moisture pathways that are associated with either surface precipitation or virga over DDU station in coastal Adélie Land. More precisely, the paper tackles the following questions:
-
Which synoptic circulation features drive the advection of moisture and the precipitation over DDU and what are the differences, if any, between surface precipitation and virga cases?
-
What are the atmospheric transport pathways of moisture that precipitates above DDU during either virga or surface precipitation cases?
-
What is the origin of the moisture contained in snowfall that precipitates or sublimates over DDU?
To answer these questions, we use a combination of ground-based profiling radar and lidar measurements at DDU, Eulerian diagnostics of extratropical cyclones and fronts, Lagrangian back trajectories from atmospheric reanalysis, and a trajectory-based moisture source diagnostic scheme. The paper is organized as follows: Sect. 2 describes the datasets and the methods. Section 3 depicts the analysis of one particular precipitation case at DDU to illustrate the methodology and the typical structure of precipitation events. Section 4 presents the results of the statistical analysis of surface precipitation and virga events at DDU. Section 5 closes the article with a conclusion and a summarizing conceptual model paving the way for future analyses.
2.1 Dumont d'Urville station
DDU station is located on Petrels Island, 5 km off the coast of Adélie Land, Antarctica (66.66∘ S, 140.00∘ E). This place is known to experience very frequent and fierce katabatic winds (König-Langlo et al., 1998; Vignon et al., 2020) inducing a strong low-level sublimation of snowfall (Grazioli et al., 2017b; Vignon et al., 2019b). The annual mean wind speed is approximately 20 m s−1 (Parish and Walker, 2012), and typical katabatic winds flow from 120 to 140∘ (Pettré and Périard, 1996). Standard measurements of meteorological variables (among which are 10 m wind speed and direction) are collected all year round by the French meteorological service at a 1 min temporal resolution.
2.2 APRES3 campaign data
During the Antarctic Precipitation, Remote Sensing from Surface and Space (APRES3) campaign from November 2015 to February 2016, a set of instruments dedicated to the characterization of precipitation was deployed at DDU, among them being a K-band micro-rain radar (MRR). Since November 2015, the radar has been continuously measuring and it is still operational today. More details about the campaign can be found in Grazioli et al. (2017a) and Genthon et al. (2018).
In addition to the MRR, a 532 nm elastic lidar with a polarization-sensitive system was deployed at DDU, giving reliable data from February to September 2017. After integration to reduce the noise level, the temporal (vertical) resolution of lidar backscattering coefficient and depolarization ratio estimates was 10 min (23 m).
The MRR reflectivity at the lowest reliable radar gate (300 m a.g.l.) has been converted into precipitation rate following Grazioli et al. (2017a) and Durán-Alarcón et al. (2019). Precipitation and virga events have been differentiated as in Durán-Alarcón et al. (2019). In summary, radar measurements have been hourly averaged, and, if there is significant reflectivity (higher than 0 mm6 m−3) in the column above DDU but no signal at the lowest reliable radar gate, the hourly reflectivity profile is classified as “virga”. If significant reflectivity is detected at the lowest radar gate, the profile is classified as “surface precipitation”. It is worth noting that the MRR does not measure above 3000 m a.g.l. Subsequently, the instrument does not see potential sublimation occurring above this altitude, suggesting that the number of virga hours is probably underestimated. In the present study, we consider the 23 November 2015–22 November 2017 2-year period, characterized by 1934 virga hours and 3397 surface precipitation hours.
Instead of distinguishing virga and surface precipitation cases, one could separate the reflectivity profiles between those with strong sublimation – with a strongly negative vertical gradient of reflectivity in the lowest layers – and profiles with weak sublimation. In this paper, we keep the virga–surface precipitation distinction for two main reasons. First, we thereby stay in line with the study of Durán-Alarcón et al. (2019), who perform a thorough statistical analysis of the vertical profiles of radar reflectivity above DDU during virga and precipitation cases. We can therefore parallel and put in our work perspective with theirs. Second, classifying the radar profiles depending on different sublimation intensities would imply setting up arbitrary thresholds on arbitrary parameters (i.e., the mean vertical gradient of reflectivity over a given altitude range), making our results less objective and our methodology less replicable for other contexts.
One may also question the added value of using MRR ground-based measurements to quantify precipitation intensity and to identify surface precipitation and virga cases instead of using outputs from a state-of-the-art reanalysis product, especially ERA5 that exhibits the best Antarctic accumulation fields according to Gossart et al. (2019). A comparison between MRR data and ERA5 is presented in Appendix A. It in particular reveals a large overestimation of the number of hours with light precipitation in ERA5 compared to radar measurements, precluding a reliable identification of precipitation occurrences from reanalyses.
2.3 Cyclone detection algorithm
To characterize the extratropical cyclones transiting over the Austral Ocean, we applied the algorithm of Wernli and Schwierz (2006) and verified by Sprenger et al. (2017) to the ERA5 (https://www.ecmwf.int/en/forecasts/datasets/reanalysis-datasets/era5, last access: 14 May 2020) reanalysis data. The algorithm identifies each cyclone as a local minimum in the sea level pressure field. It then finds the outermost closed sea level pressure contour for each cyclone to estimate its area. More details about the methodology can be found in Wernli and Schwierz (2006) and Sprenger et al. (2017).
2.3.1 Front detection algorithm
To locate and characterize synoptic atmospheric fronts, a slightly modified version of the front detection algorithm developed by Jenkner et al. (2010) was applied to ERA5 reanalysis data as in Sprenger et al. (2017). In summary, the front detection algorithm evaluates the frontal lines in a smoothed 700 hPa equivalent potential temperature (θe) field. θe is conserved during moist adiabatic motions and thus reflects both the temperature and humidity of an air mass. It is thus a powerful variable for identifying air masses of different origin and with contrasting thermodynamic characteristics (e.g., for separating cold and dry polar air masses from subtropical warm and moist ones). The masking condition used to detect the fronts reads
∇ is the gradient operator applied over a 100 km distance, and κ is the frontal strength minimum threshold set at 4 K 100 km−1. The frontal motion and type are then estimated. More details about the methodology can be found in Sprenger et al. (2017) and Jenkner et al. (2010). Over the Antarctic continent, the frontal structures are chaotic and unreliable because of strong topography-induced quasi-stationary temperature gradients (Schemm et al., 2015). The fronts located in regions where the corresponding topography exceeds 100 m a.s.l. have thus been removed.
2.4 Back trajectories of precipitating air parcels
Air parcel Lagrangian back trajectories were estimated using LAGRANTO (Wernli and Davies, 1997; Sprenger and Wernli, 2015) applied to the ERA5 reanalysis with a horizontal grid of and a hourly temporal resolution. The 5 d back trajectories were calculated for every hour with virga or surface precipitation. Trajectories start (backward in time) at DDU, in a column from the surface level (1000 hPa) to the 300 hPa level, with a 50 hPa vertical step. Temperature, specific humidity, condensed water species (snow, rain, cloud ice, cloud liquid water) and the pressure at the boundary layer top are saved along the trajectories every 2 h. As we want to focus on the atmospheric pathway of the water contained in snowfall above DDU, we need to restrict the set of trajectories to those corresponding to the air parcels from which water condenses and precipitates above the station. As a first-order approximation, we assume that the so-called “precipitating air parcels” in the ERA5 dataset are those for which the snow water content (SWC) vertical gradient in the column above DDU is significantly negative: , where SWCT has been set to kg kg−1 m−1 after inspection of the distribution of dSWC∕dz above DDU (not shown). The underlying reason is that if we neglect the advection – which is a reasonable hypothesis for the stratiform precipitation over the Antarctic coast and given the ≈30 km horizontal resolution of ERA5 – a negative vertical gradient of SWC typically corresponds to a situation with auto-conversion of ice to snow or snowflake growth through vapor deposition, aggregation or riming (see Vignon et al., 2019a, for examples above DDU). Examination of individual vertical profiles of SWC reveals that positive vertical gradients are almost always located in the katabatic layer, where sublimation occurs. Note that this method is based on the assumption that all vertical SWC profiles have the same shape as the one shown in Fig. 1. A visual inspection of SWC profiles revealed that roughly 10 % of these show different shapes, with a few cases having two maxima in the profile. Figure 1 illustrates significant precipitation generation highlighted in light red (between 800 and 600 hPa) and low-level sublimation highlighted in light blue (between 950 and 850 hPa).
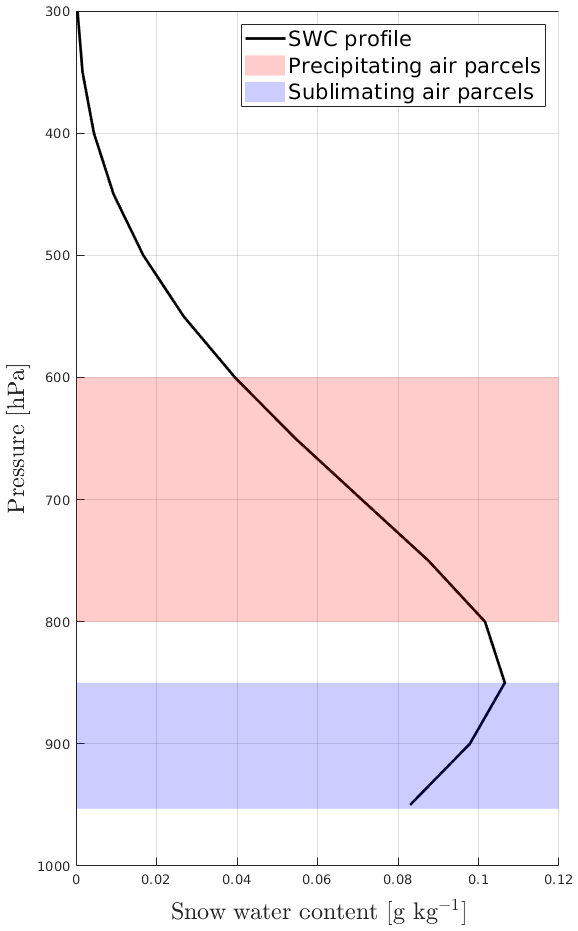
Figure 1Illustration of the precipitating and sublimating layers in a typical hourly SWC vertical profile.
2.5 Lagrangian moisture source diagnostics
The geographical locations of moisture uptakes along the precipitating air parcels' back trajectories were then diagnosed using the methodology presented in Aemisegger et al. (2014) and adapted from Sodemann et al. (2008). Along each back trajectory, the locations of a positive change in the specific humidity with time are identified. Each uptake is then characterized by a weight that corresponds to the respective contribution (percentage) to the specific humidity value at the arrival point of the trajectory. Note that if the air parcel precipitates along its path, the corresponding quantity in specific humidity is discounted. It is worth mentioning that for some situations, moisture uptakes might be missed due to not long enough back trajectories (limited to 5 d here). Several precipitating air parcels may contribute to the total moisture precipitating above DDU at each hourly time step. Every hour, a weighting is thus applied to determine the contribution of each precipitating air parcel to the total integrated water vapor of the precipitating column above DDU. Composite maps of moisture uptakes over several time steps can then be produced using the total integrated water vapor of the precipitating column as a weighting factor. Note that the algorithm differentiates uptakes occurring within and above the boundary layer. Here, only the moisture uptakes located within the boundary layer, scaled with a factor of 1.5 to account for the uncertainty in the diagnosed boundary layer top from ERA5 (as in Sodemann et al., 2008), were considered.
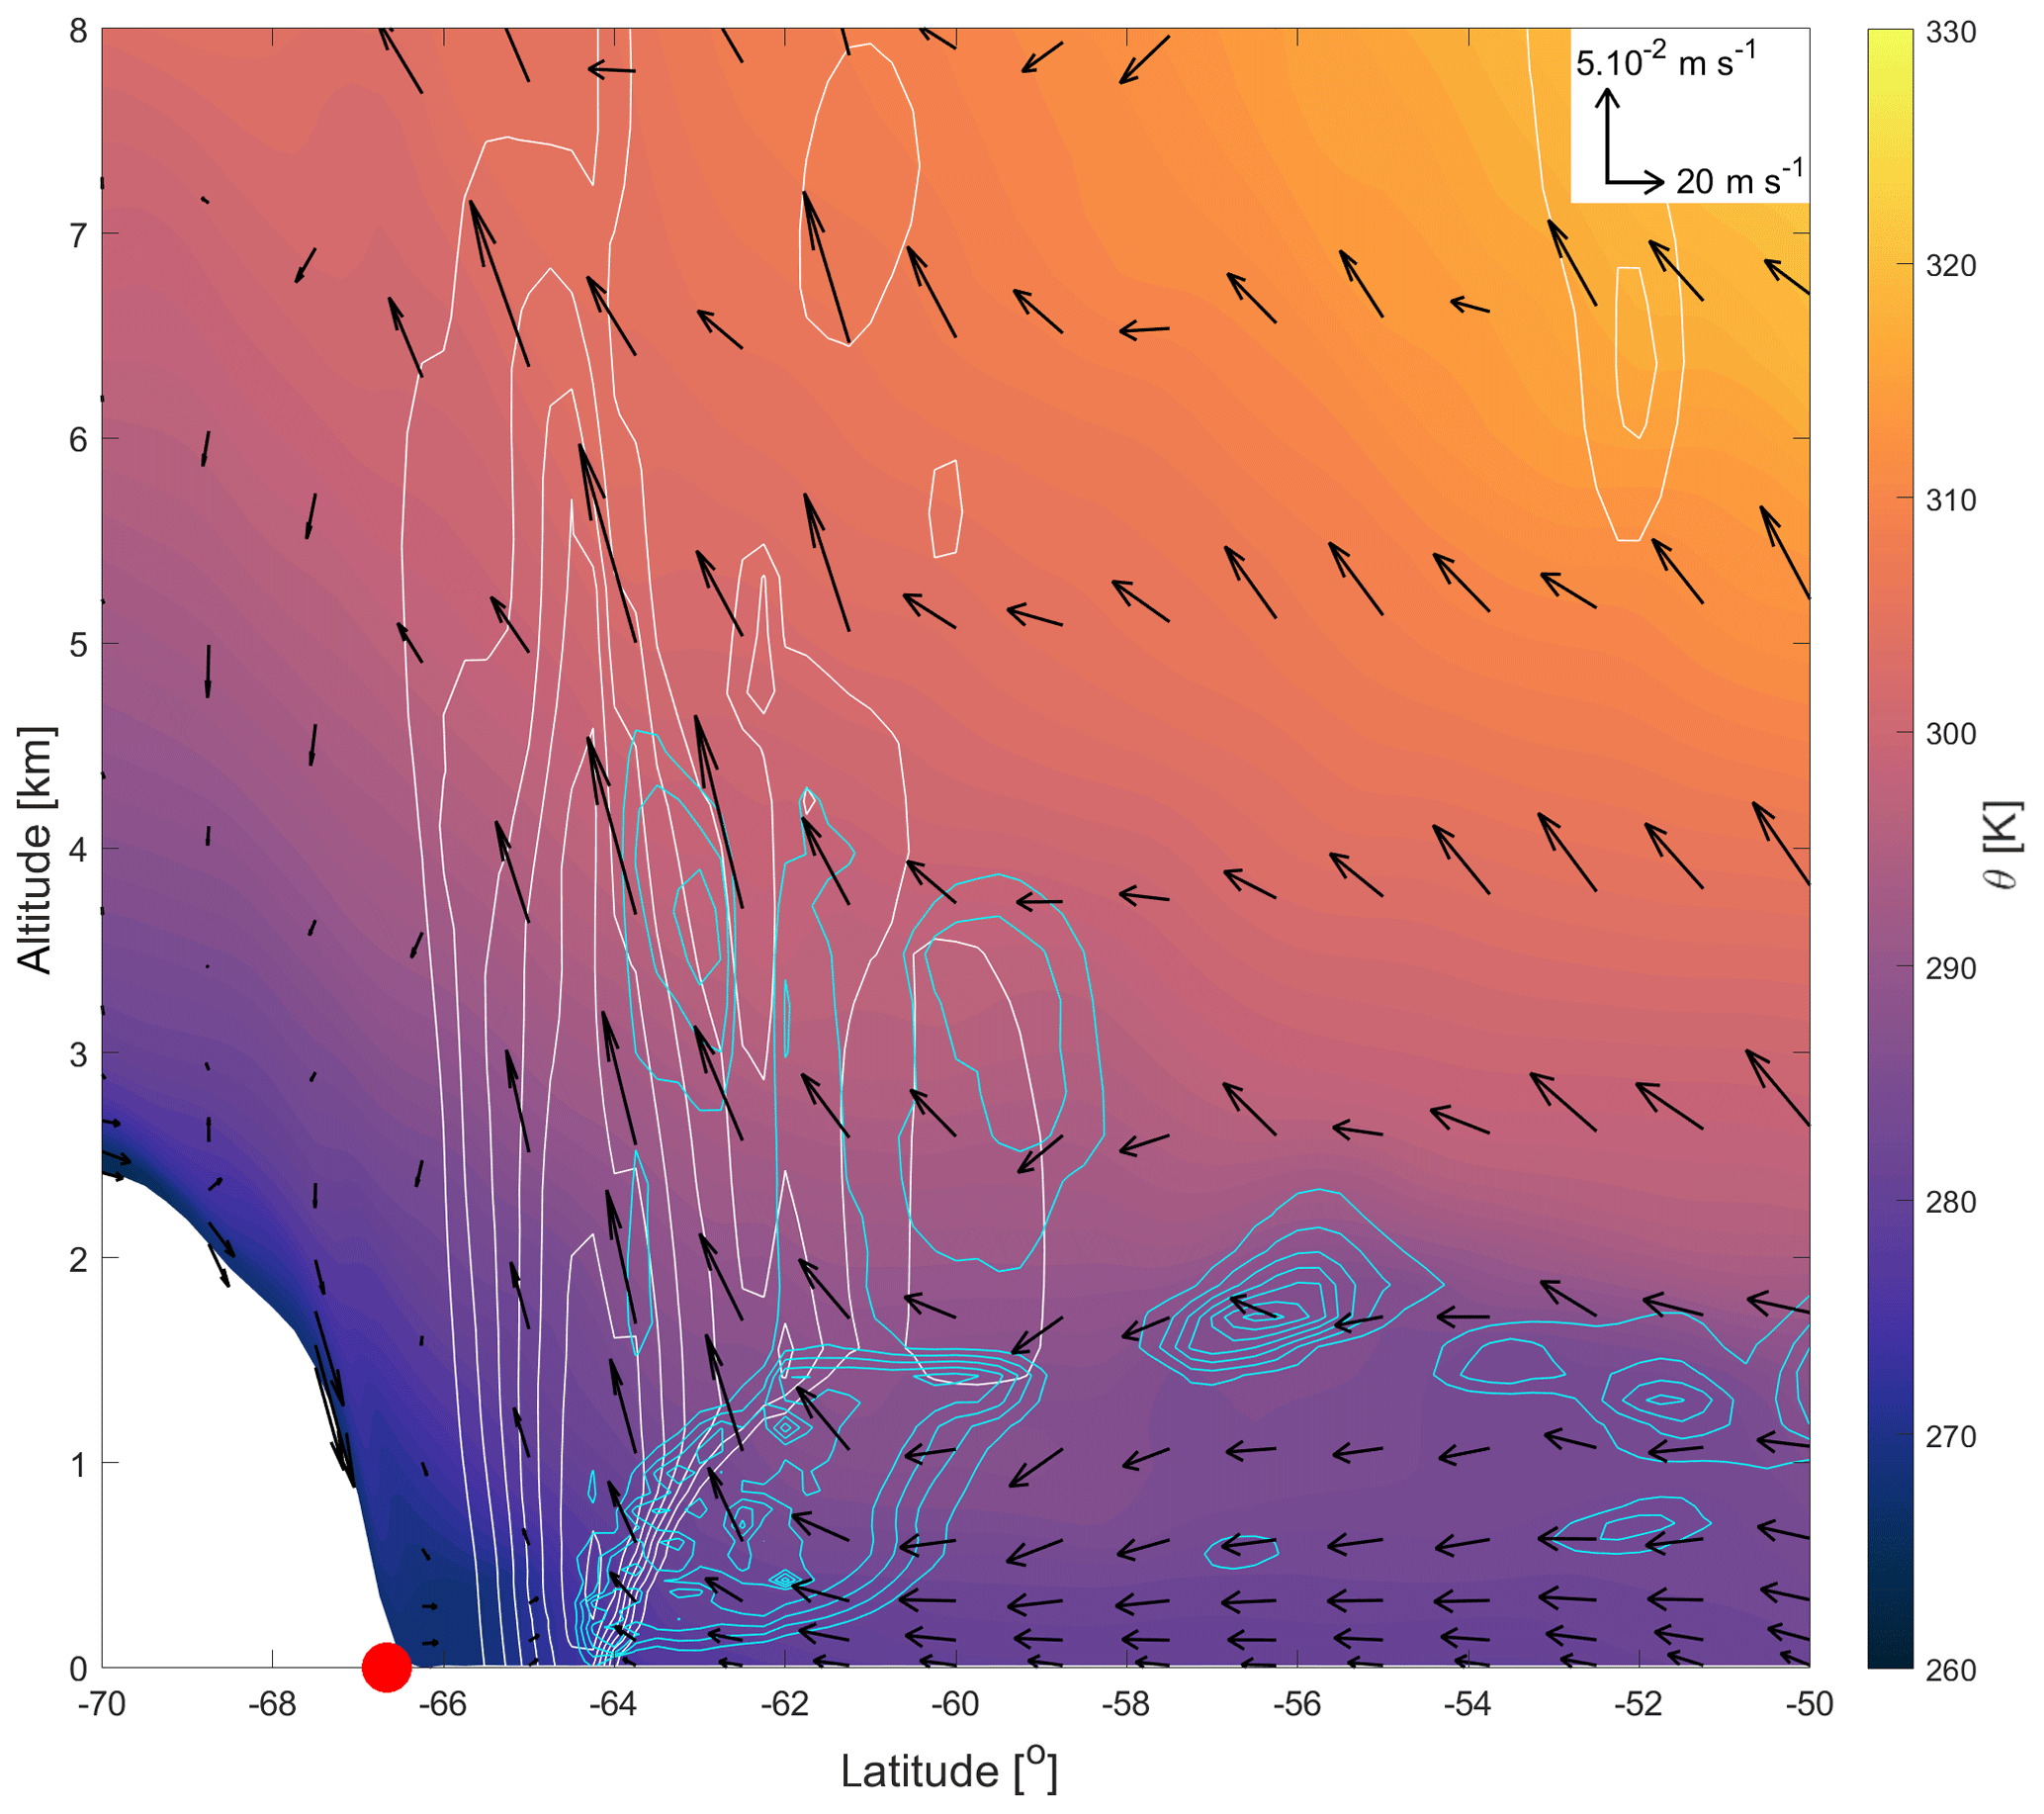
Figure 2The 140.00∘ E meridional cross section of the potential temperature (shading), meridional and vertical wind (black arrows), snow + ice water contents (white contours), and cloud liquid water content (cyan contours) from ERA5 data on 8 February 2017, 00:00:00 UTC. Contour interval is kg kg−1. Wind vectors are scaled according to the spatial extent of the figure. DDU location is indicated by the red circle (66.66∘ S, 140.00∘ E). Color maps are from Thyng et al. (2016).
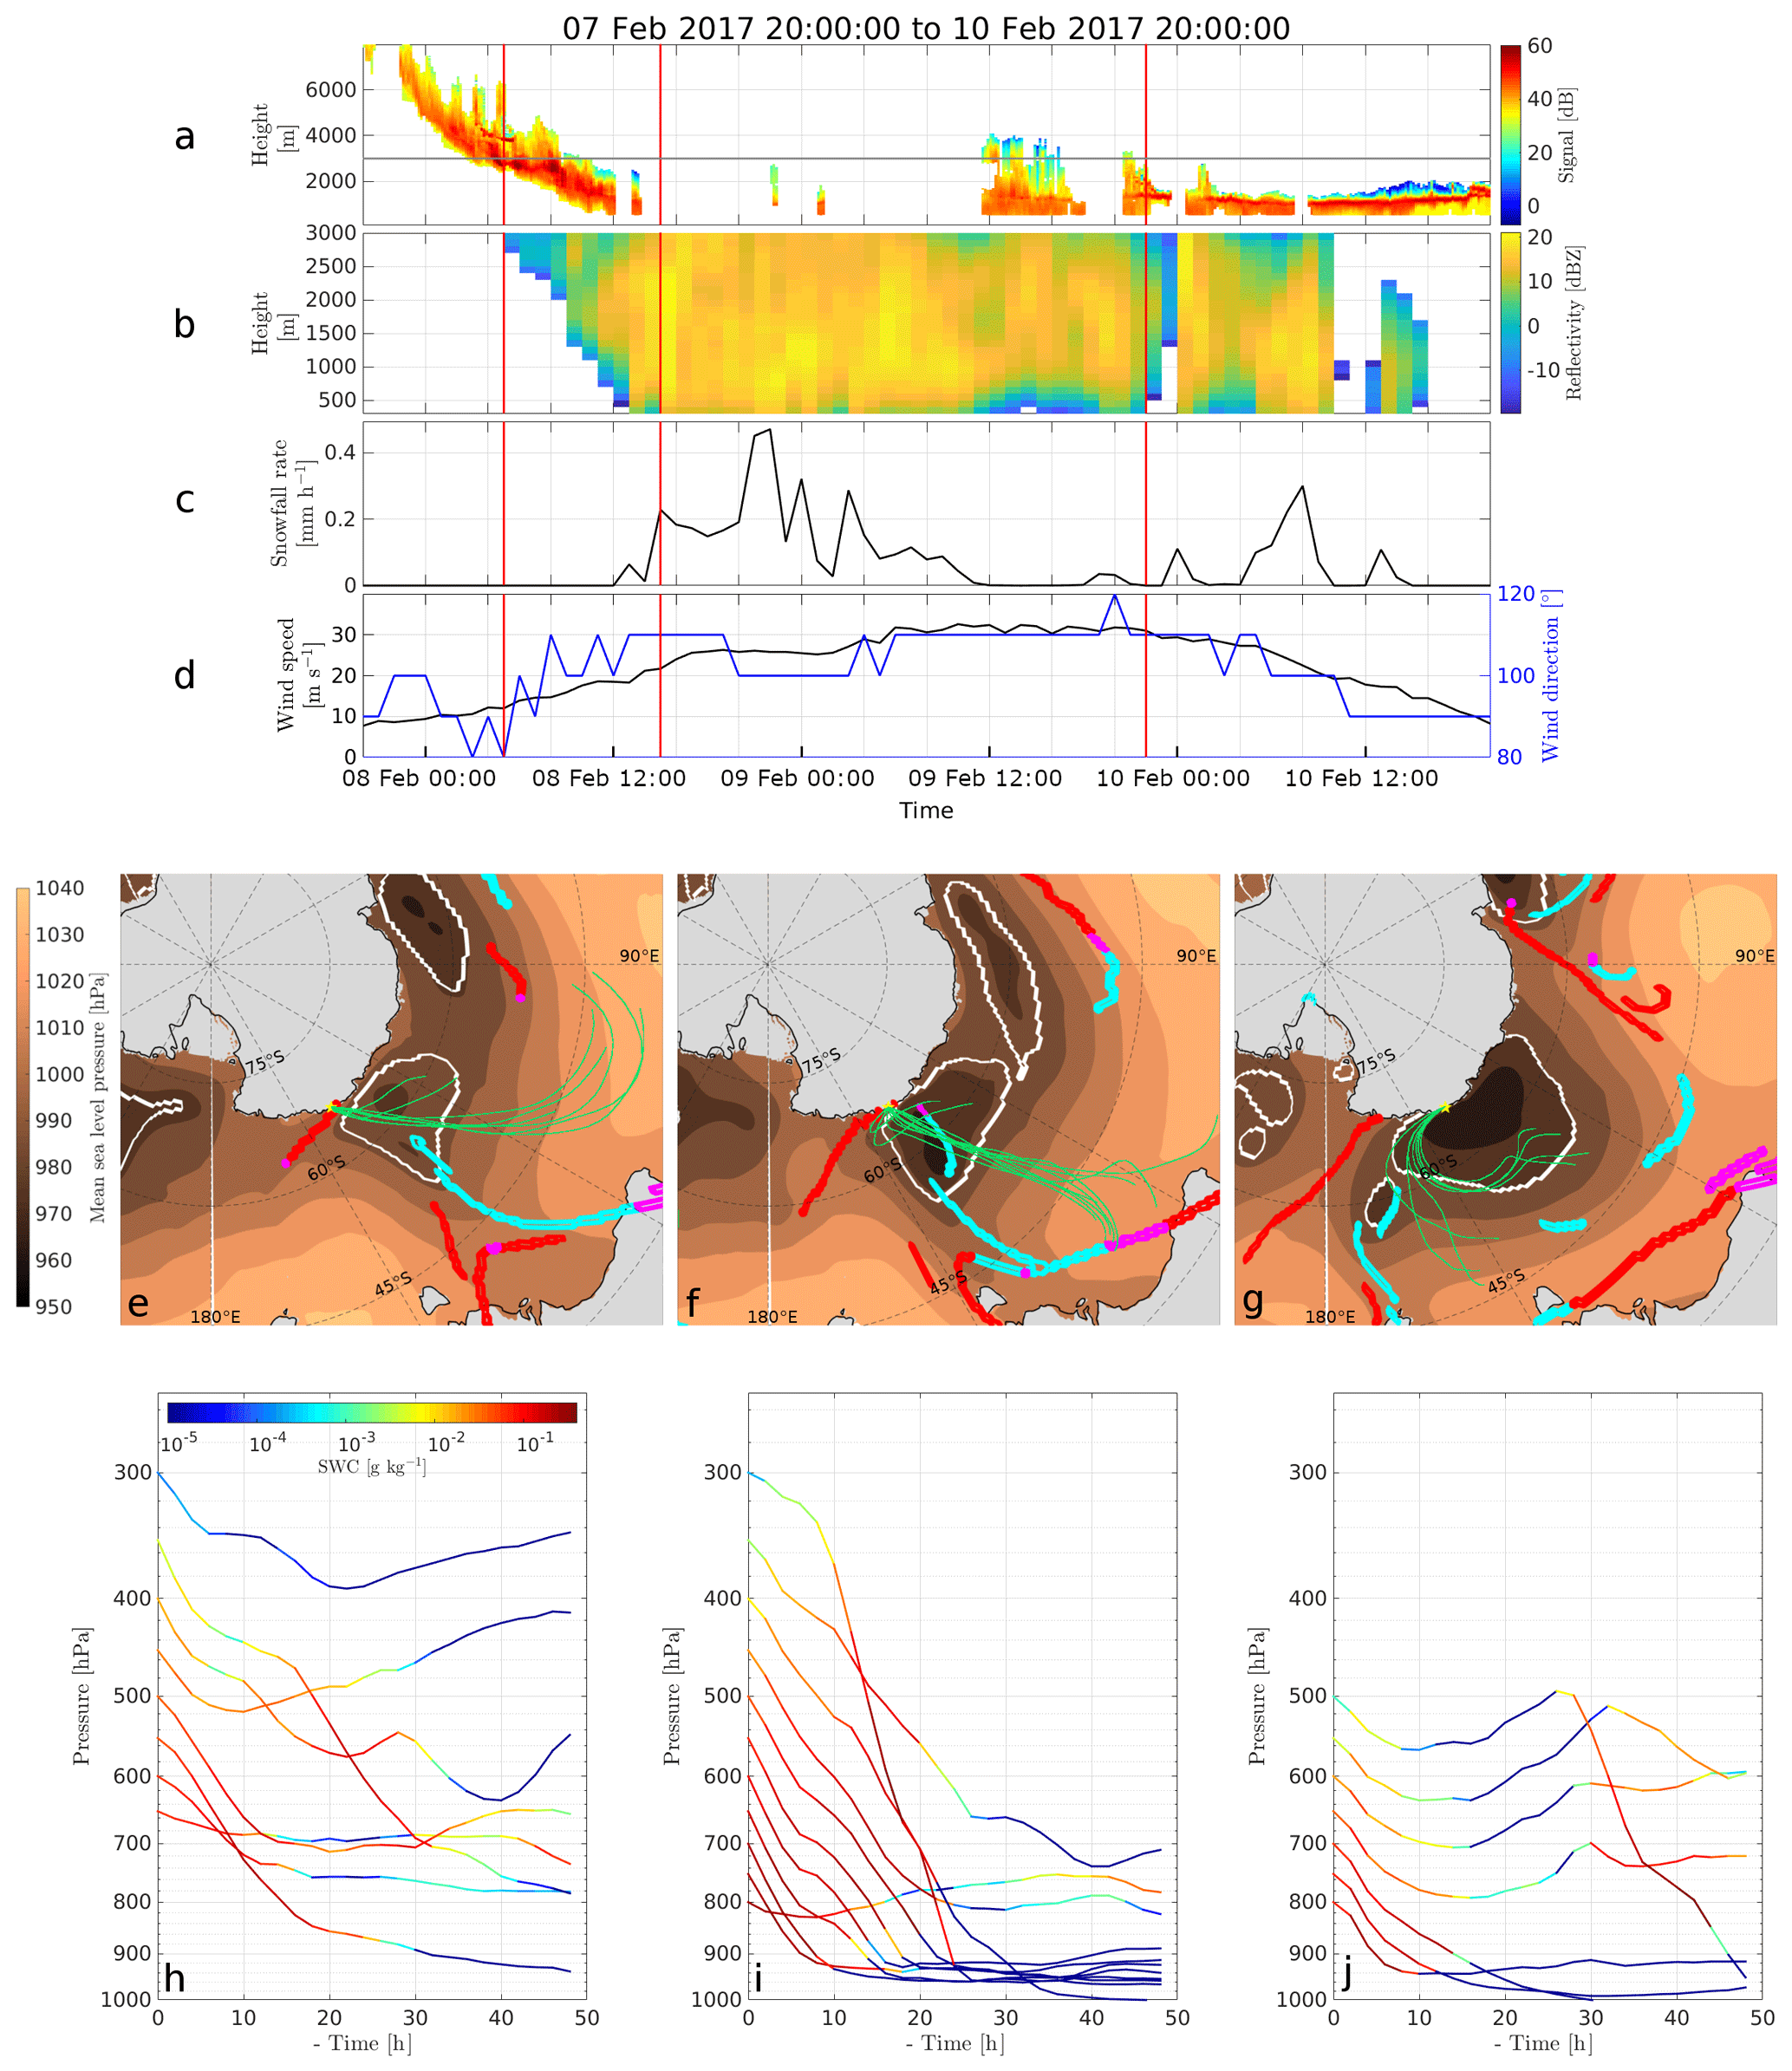
Figure 3Case study of a precipitation event at DDU. Panel (a) shows a time–height plot of the lidar signal. The 3000 m MRR maximum height is highlighted with a grey line. Mind the lidar signal attenuation during precipitation periods. Panel (b) is a time–height plot of the MRR reflectivity. Panel (c) is the time series of the snowfall rate derived from MRR measurements. Panel (d) shows the time series of the 10 m wind speed and direction. Panels (e)–(g) show, for three different times indicated with red vertical lines in panels (a)–(d), the sea level pressure (shading), the cyclone mask (white contours), the front lines (red for warm front, cyan for cold front, magenta for indefinite) and the 2 d back trajectories of the precipitating air parcels (in green). The yellow star shows the location of DDU. Panels (h)–(j) show the corresponding time evolution of the pressure along the back trajectories. Colors indicate the SWC.
This section presents a case study of a precipitation event at DDU. This particular event was chosen to illustrate our methodology. It has the advantage of presenting a fully continuous time series of lidar data. The analysis of the event starts on 20:00 UTC, 7 February 2017 and ends on 20:00 UTC, 10 February 2017. Figure 2 shows a meridional cross section of potential temperature, wind and cloud condensates at the DDU longitude and at the beginning of the event (00:00 UTC, 8 February 2017). The potential temperature field exhibits a typical warm-front structure with the arrival of warm air from the north towards the Antarctic coast associated with a clear ascending stream around 64∘ S of latitude. The system brings iced clouds and snow (white contours) and supercooled liquid water (cyan contours) while the katabatic flow blows cold air from the Antarctic Plateau towards the station, inducing low-level sublimation.
Three 1 h specific times were selected: one during a virga period that precedes precipitation (so-called “pre-precipitation virga”) at the beginning of the event (05:00 UTC, 8 February 2017), one during a surface precipitation period (15:00 UTC, 8 February 2017) and one during a virga period that follows precipitation (so-called “post-precipitation virga”) at the end of the event (22:00 UTC, 9 February 2017). Panels (a–d) of Fig. 3 show how the system evolves above the DDU station. The synoptic conditions for the three specific times (identified with vertical red lines) and the precipitating air parcel back trajectories are plotted in panels (e–g). Panels (h–j) show the time evolution of the pressure and SWC (colors) of the precipitating air parcels.
From 20:00 UTC, 7 February to 12:00 UTC, 8 February, the 10 m wind speed at DDU gradually increases (Fig. 3d) in relation to the increase in the ocean–continent pressure gradient owing to the arrival of the extratropical cyclone to the west of DDU. The lidar signal shows the gradual decrease in the cloud height base (Fig. 3a), associated with the warm front arrival (Fig. 3e). At 05:00 UTC, 8 February, the MRR starts detecting significant reflectivity but the corresponding snowfall does not reach the surface, indicating a pre-frontal virga: such features are also observed in midlatitude systems (e.g., Clough and Franks, 1991). Precipitating air parcels originate from the northwest, and they are advected along the eastern flank of the cyclone (Fig. 3e). In agreement with MRR measurements, all the precipitating air parcels have an arrival pressure lower than 700 hPa, thus higher than about 2500 m a.s.l. (Fig. 3h). At 15:00 UTC, 8 February, there is surface precipitation at DDU (significant MRR signal recorded at 300 m a.g.l.). The synoptic cyclone has moved to the east (Fig. 3f). The warm front has reached DDU, but the cold front remains away from it. The corresponding precipitating air parcel back trajectories are aligned along a well-defined meridional corridor arriving along the eastern flank of the cyclone. Figure 3i shows that most of the precipitating air parcels experience a clear lifting above the ocean associated with a loading in SWC in the last hours before reaching DDU: 30 h before reaching the station, 8 out of 11 air parcels originate from a height below the 900 hPa level (see Fig. 3i). The higher the parcels arrive above DDU, the earlier they ascend. The lifting occurs perpendicularly to the warm front and just upstream of it. This strongly suggests that the lifting occurs within – and is due to – the warm conveyor belt of the system. Note that the parcel that arrives above DDU at 300 hPa has been lifted by more than 600 hPa in less than 48 h, fulfilling the criterion of trajectories belonging to a warm conveyor belt by Madonna et al. (2014).
During 9 and 10 February, the cyclone continues its slow eastward transit. One can notice the decrease in wind speed acceleration (Fig. 3d), as the core of the cyclone passes off the coast of DDU, and then the decrease in the wind speed owing to the progressive building up of the pressure at the station (Naithani et al., 2003). The warm front passes the station, and DDU is in the warm sector where one sees the alternation of hours with relatively weak precipitation affected by sublimation (decrease in reflectivity with decreasing height) and hours with virga. One can notice in Fig. 3b a period with near-surface sublimation – corresponding to a near-surface decrease in reflectivity with decreasing height – from 11:00 to 18:00 UTC, 9 February, in between a precipitation period. In a vertical cross section meridionally crossing the coast at 12:00 and 18:00 UTC (not shown), a reinforcement of the katabatic flow at DDU is observed. The precipitating air parcels that arrive at DDU at 22:00 UTC, 9 February, have been trapped by the clockwise cyclonic circulation, and they reach the station from the east (Fig. 3g). They arrive closer to the surface and experience a much less pronounced lifting (Fig. 3j) while the near-surface wind speed at DDU remains strong (Fig. 3d). On 11 February, the extratropical cyclone moves to the east of the station and its intensity dramatically decreases.
In the following section, we carry out a statistical analysis over a 2-year period and show that this case study is reasonably well representative of the precipitation events that affect coastal Adélie Land.
4.1 Occurrence and timing of virga and surface precipitation at DDU
Over the considered 2 years of MRR measurements, virga events represented at least 36 % of the hourly vertical profiles with significant reflectivity whereas surface precipitation accounts for 64 % (see Appendix A). As the MRR does not measure above 3000 m a.g.l., the actual proportion of virga is most likely even higher. Note that although virga are frequent, the total amount of sublimated snow is higher in cases during which precipitation, albeit affected by sublimation, reaches the ground surface than during virga cases (see Appendix B).
In the previous case study, surface precipitation periods are preceded and followed by virga. One may thus ask the question whether virga and precipitation cases are always associated with the same synoptic event or not. Figure 4a and b show the distribution of the time elapsed between 1 h with virga (precipitation) and the closest hour with surface precipitation (virga). The minimum and maximum time delays for the closest virga for precipitation (closest precipitation for virga) are −3.04 and +2.08 d (−9.25 and 12.62 d). A large majority of the virga events occurs close to precipitation periods. Only a few of them can be deemed isolated event (time difference exceeding ≈ 2 d). Given that almost all time difference values presented in Fig. 4a and b fall within the [−2, +2] d interval, with a major part between −1 and +1 d, we can reasonably conclude that precipitation and virga hours correspond to different phases of the same synoptic event.
A positive time shift in the closest virga for a considered precipitation event (panel a in Fig. 4) means that the virga occurs before the considered precipitation event. Virga precedes and follows precipitation, with more occurrences for pre-precipitation virga, as the distribution in Fig. 4a is slightly positively skewed. A total of 60 % of virga hours can be classified as “pre-precipitation” and 40 % as “post-precipitation”.
From the case study of Sect. 3, one can expect that pre-precipitation virga roughly corresponds to the early phase of precipitation events while post-precipitation virga would be associated with the weakening phase of the events. Hereafter, we will investigate the synoptic conditions and the atmospheric moisture transport pathways considering three composites: pre-precipitation virga, surface precipitation and post-precipitation virga.
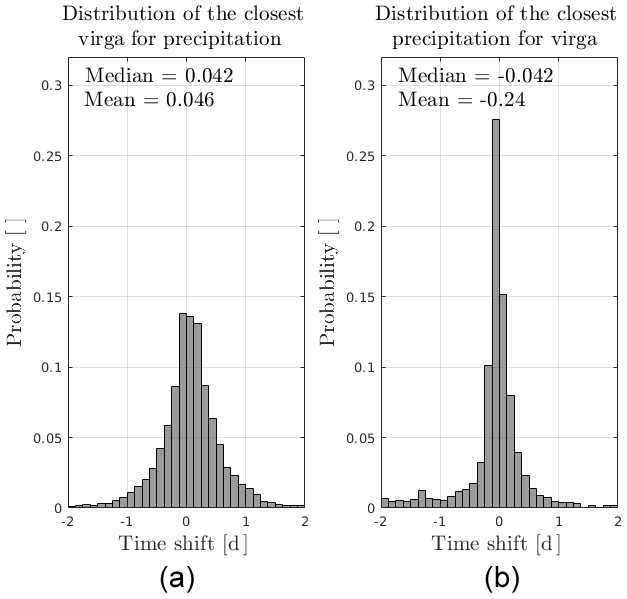
Figure 4Panel (a) (panel b): 2-year distribution of the elapsed time between the closest virga hour (precipitation hour) for each hour with surface precipitation (virga) detected by the MRR. The bin resolution is 3 h. For the sake of readability, the axes are truncated to ±2 d, excluding 0.3 % and 13.6 % of the data in panels (a) and (b), respectively. In panel (a) (panel b), a positive time shift means that the virga (surface precipitation) occurred before the closest precipitation period (virga period).
4.2 Synoptic circulation and weather system features
4.2.1 Extratropical cyclone position and effects on katabatic winds at DDU
Precipitation events at DDU are expected to be frequently associated with cyclones, in particular the events with high intensities (Pfahl and Wernli, 2012; Papritz et al., 2014). Figure 5 shows the statistics of the location of the extratropical cyclones for the three composites.
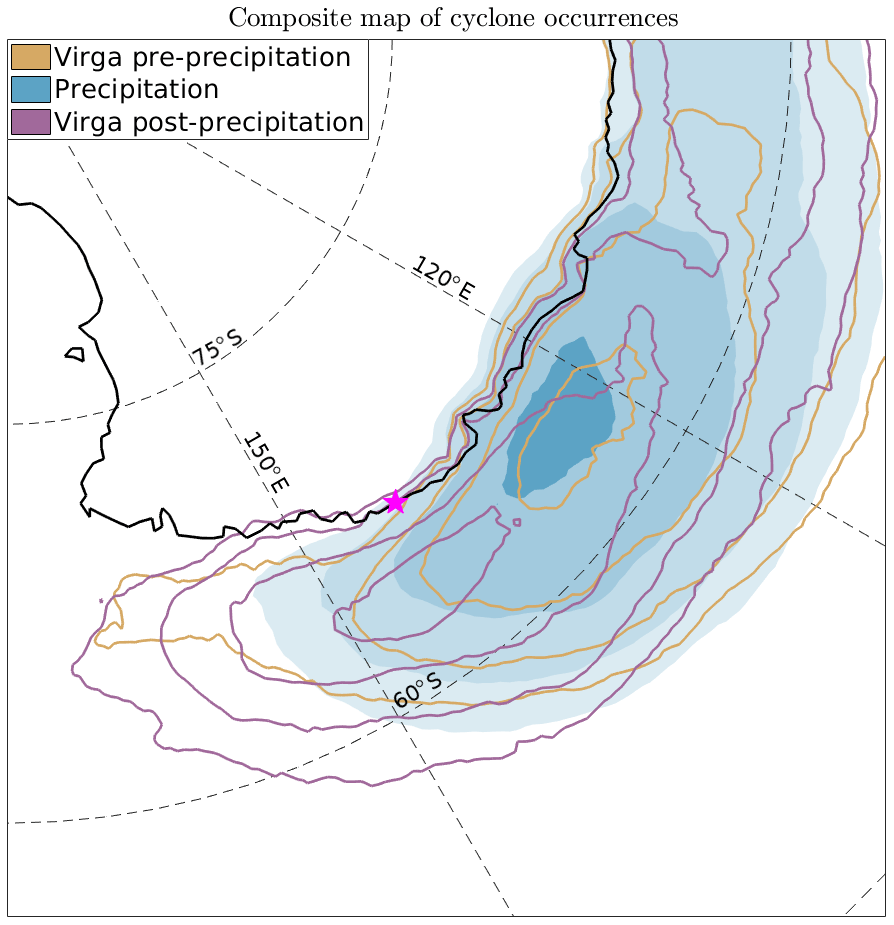
Figure 5Map of the normalized cyclone occurrence from ERA5 data for each of the three composites. An ERA5 grid point is considered to belong to a cyclone if it is included within the cyclone mask identified by the algorithm presented in Sect. 2.3. For the sake of readability, only the contours corresponding to the 0.9, 0.95, 0.99 and 0.999 quantiles are shown. DDU station is indicated with the purple star.
During precipitation events, an extratropical cyclone is located to the west of DDU (median of the 99.9th percentile: 124.5∘ W). The geostrophic flow shows a strong northerly component and the moisture is advected towards Adélie Land along the eastern flank of the cyclone. The position of cyclones for the pre-precipitation virga and surface precipitation composites is reasonably similar (note however a slightly more southerly positioning of the latter). During post-precipitation virga cases, the cyclone has transited towards the east and the geostrophic flow over the station thus becomes easterly. According to Bromwich et al. (2011), such cyclones can be either en route to lysis or they can be reinforced through secondary-development processes.
The cyclone transit not only affects the synoptic atmospheric circulation above Adélie Land but also strengthens katabatic winds by increasing the ocean-to-continent pressure gradient. The 10 m wind measurements at DDU reveal that the wind speed is slightly lower during pre-precipitation virga cases (mean: 9.8 m s−1) than during surface precipitation (mean: 13.6 m s−1) and post-precipitation virga (mean: 15.2 m s−1) cases, i.e., when the low-pressure system is closer to the station. This finding is in agreement with other studies on the link between extratropical cyclones and the formation of cold air outbreaks from katabatic outflows from Antarctica (see e.g., Parish and Bromwich, 1998; Papritz et al., 2015). However, the regional low-level flow at DDU remains of continental origin (easterly or southeasterly direction) during both virga and surface precipitation cases. In addition, radiosoundings have further revealed that the lower troposphere remains undersaturated even during surface precipitation cases (see Fig. 4 of Vignon et al., 2019b). Therefore, the low-level sublimation is effective over the whole duration of a precipitation event.
4.2.2 Front analysis
In the context of an extratropical cyclone, the associated frontal systems are responsible for a large share of precipitation (Papritz et al., 2014). Large-scale convergence and uplift due to the density difference of the air masses separated by the front induce condensation in the lifted warmer air masses. Panels (a) and (b) of Fig. 6 show the maps of occurrence frequencies of warm (panel a) and cold (panel b) fronts identified by the front algorithm on ERA5 data during all precipitation and virga cases at DDU. Panel (b) in Fig. 6 shows that the cold fronts almost never reach the station during precipitating events. On the other hand, panel (a) clearly shows that during precipitation and virga at DDU, a warm front is passing over the station. Hence, precipitation and virga at DDU are typically associated with the warm front of a synoptic weather system that is located to the west of the station.
Panels (c), (d) and (e) of Fig. 6 separate the warm front occurrences, allowing us to analyze the evolution of the warm front position during the three phases. The warm front at 700 hPa is generally off the coast of DDU during the pre-precipitation virga phase, passes over the station during surface precipitation cases and has penetrated onto the ice sheet and has moved eastward during post-precipitation virga cases (the latter situation is not clearly visible in the figure since the front detection is not reliable above the ice sheet). The above results rely on the ability of the front detection algorithm to properly detect and classify atmospheric fronts. To ensure the robustness of our conclusions, in Fig. 7 we present composite maps of θe at 700 hPa during precipitation and virga periods. Warm air associated with the approaching warm front is located off DDU, while the cold sector of the extratropical cyclones is located to the west of Adélie Land during virga pre-precipitation periods (panel a). During surface precipitation periods (Fig. 7b), the cold sector moves northward while the warm sector travels eastward and southward over the station, consistent with the expected rotation of the cyclone. This motion is visible in the difference of equivalent potential temperature between the two composites in Fig. 7d, where the negative blue spot to the northwestern side of DDU indicates warmer air in this region due to the warm sector progress in pre-precipitation virga periods compared to surface precipitation periods. During post-precipitation virga (Fig. 7c), the warm sector has penetrated into the plateau, while relatively cold air is now present to the north and east of DDU, suggesting a further rotation of the cold sector of the cyclone (Fig. 7e). Such a picture overall concurs with our inferences from Fig. 6.
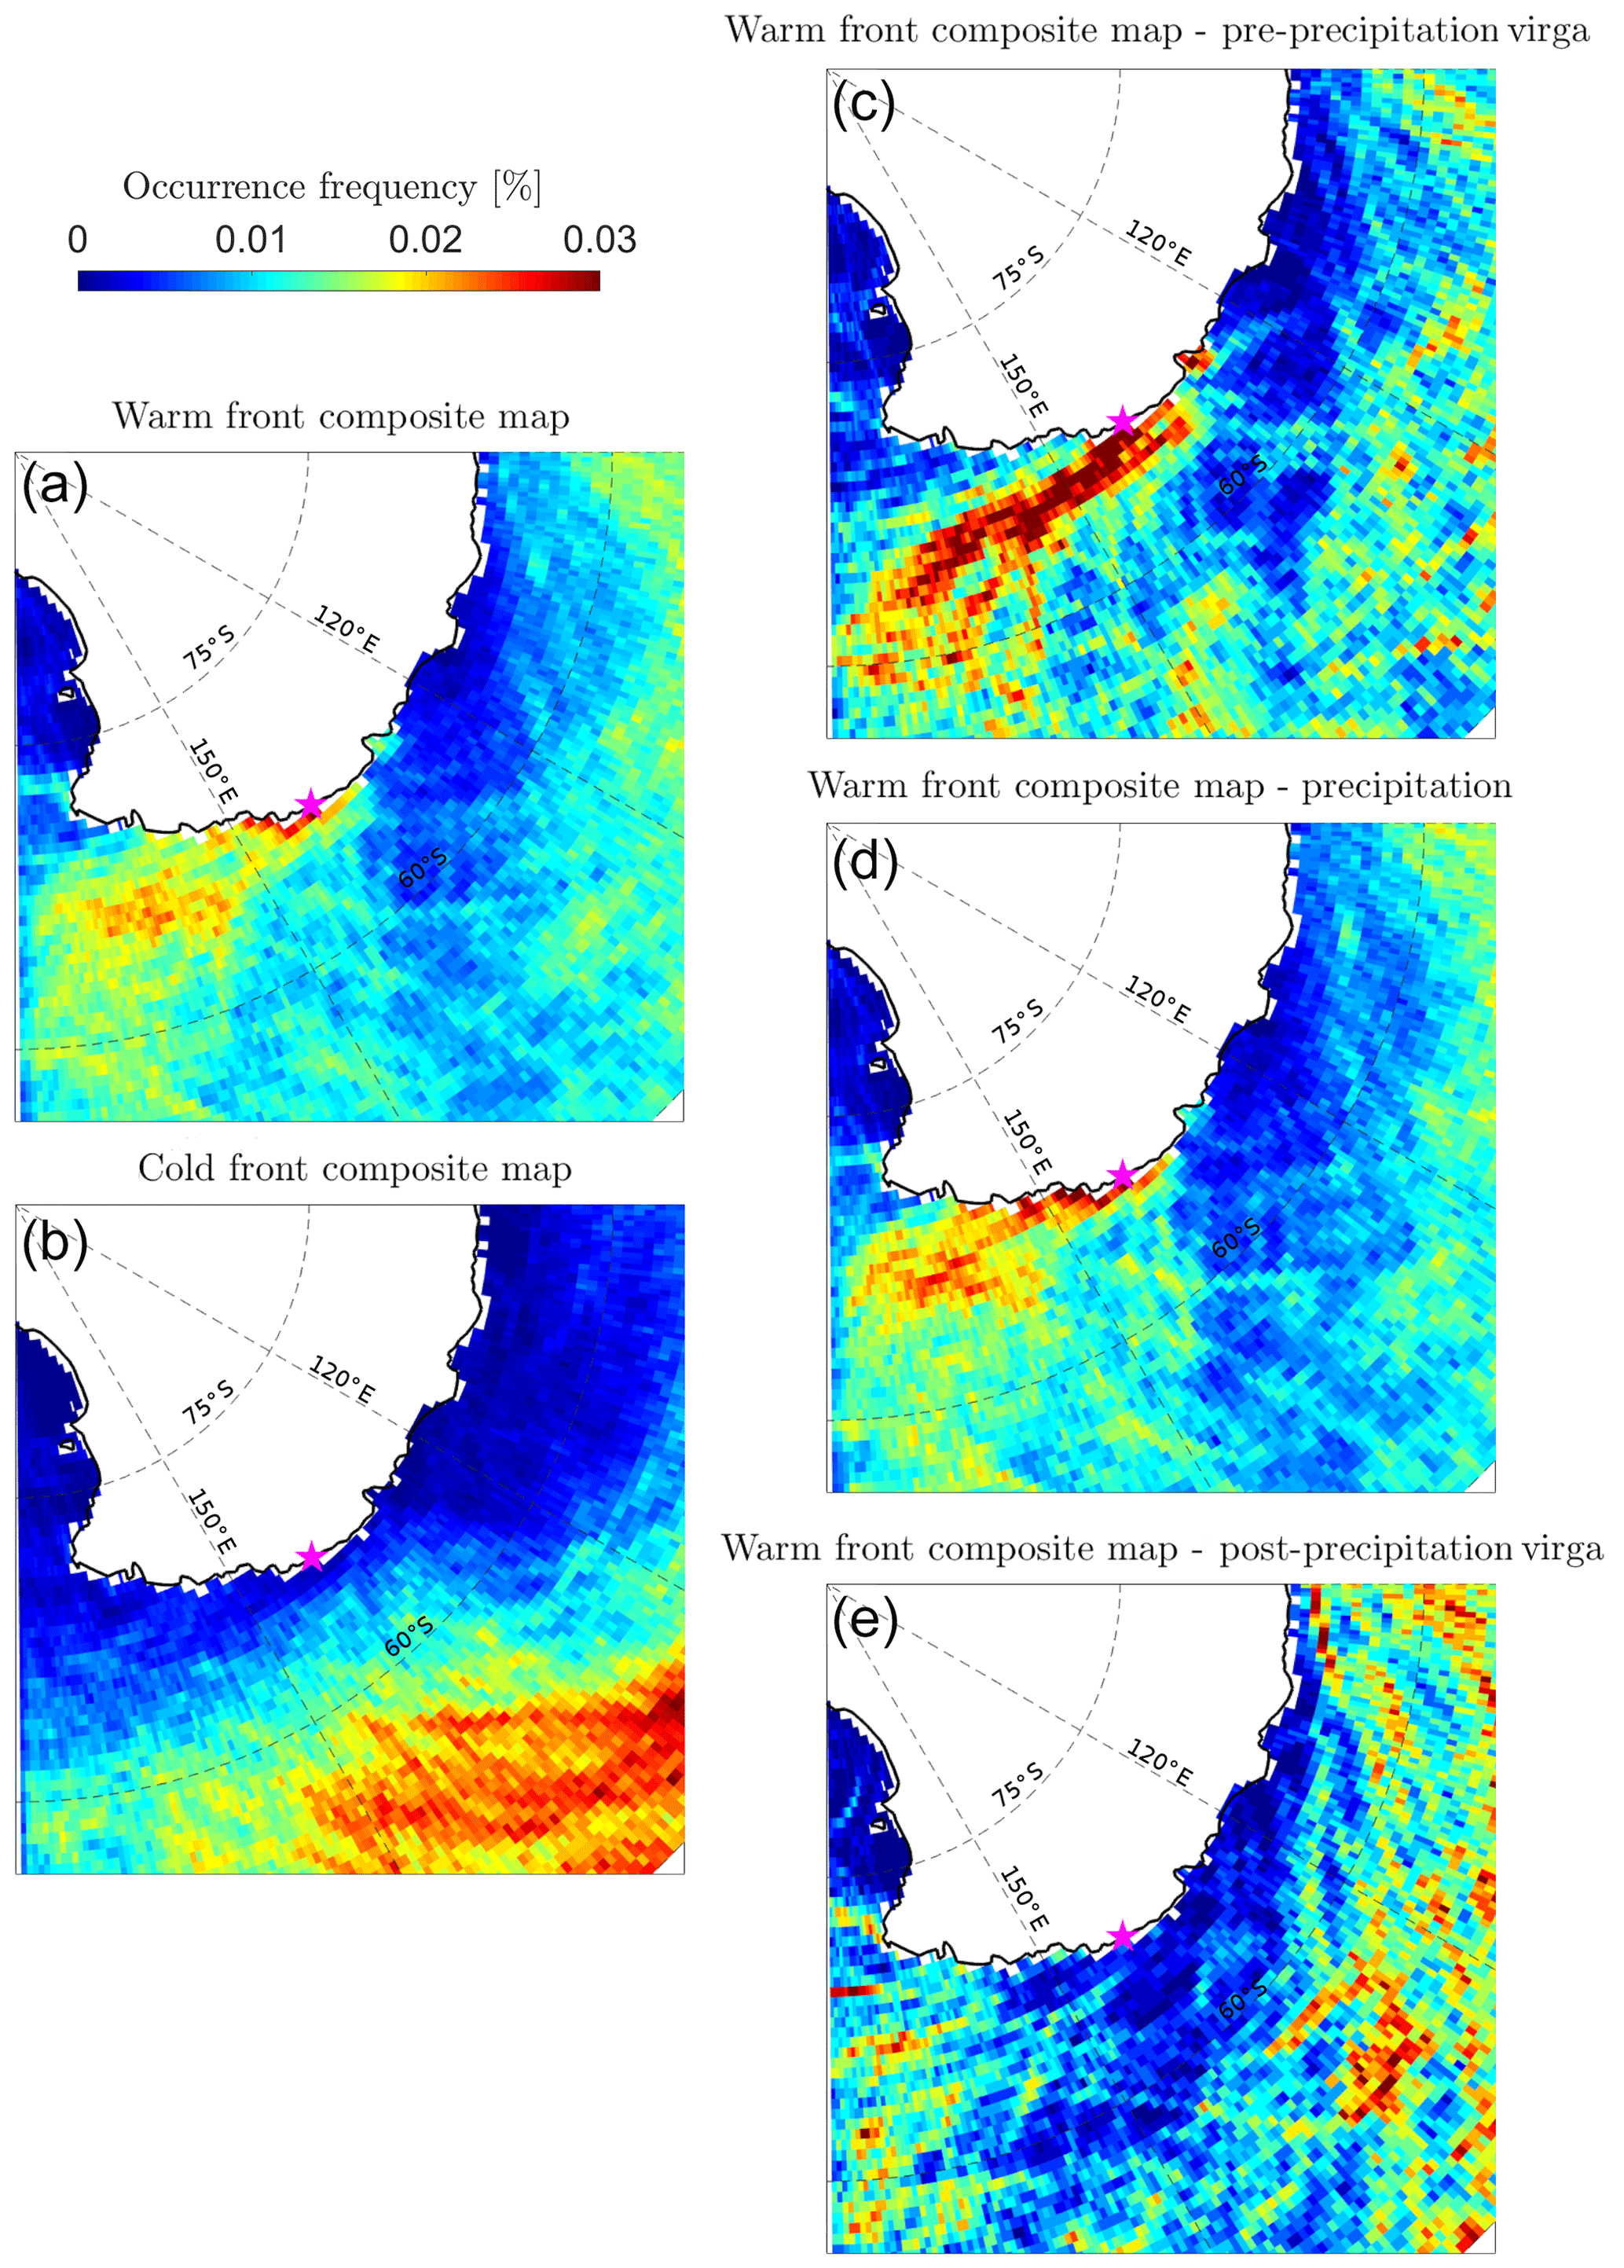
Figure 6Statistical maps of front occurrences. Panels (a) and (b) show the frequency of hourly occurrences of warm fronts (a) and cold fronts (b) during precipitation and virga cases at DDU. Panels (c)–(e) show the frequency of hourly occurrences of warm fronts for the pre-precipitation virga composite, surface precipitation composite and post-precipitation virga composite, respectively. The magenta star shows the location of DDU. Note that fronts located above the Antarctic ice sheet have been removed.

Figure 7Composite maps of equivalent potential temperature at 700 hPa for the pre-precipitation virga composite (a), surface precipitation composite (b) and post-precipitation virga composite (c). Panel (d) shows the difference between panels (b) and (a), and panel (e) shows the difference between (c) and (b). Regions with a topography higher than 2500 m a.s.l. (≈ altitude of the 700 hPa level) have been shaded. Color maps in (a)–(c) are from Thyng et al. (2016). Color maps in (e)–(d) are from Auton (2020).
4.3 Back trajectories and lifting of precipitating air parcels
When a synoptic weather system approaches Adélie Land, the occurrence of pre-precipitation virga, surface precipitation or post-precipitation virga above the coast depends on the location of the extratropical cyclone and in particular its warm front. We now investigate in more detail the atmospheric pathway of the moisture that ultimately precipitates above DDU, with precipitation reaching the ground (precipitation event) or being totally sublimated (virga event).
Maps of 2 d back-trajectory occurrences of precipitating air parcels (see Fig. 1 for their selection) for the three composites are plotted in Fig. 8. It is worth emphasizing that trajectories of non-precipitating air parcels – among which are those arriving in the low-level dry katabatic layer – are not included in the statistics. During pre-precipitation virga, air parcels follow a clear southeastward route towards the station while during surface precipitation cases, the general pathway is more meridional. During post-precipitation virga, precipitating air parcels generally reach the station from the northeast. The position of the cyclone in Fig. 5 and the back trajectories plotted in the case study precipitation in Fig. 3g suggest that air parcels can spin around the cyclone center before being advected over DDU.
The time evolution of the pressure of precipitating air parcels during their transit towards DDU is depicted in Fig. 9. There is no significant difference in the pressure level of the three composites between 48 and 36 h before reaching DDU (and before). From −36 h, precipitating air parcels experience a pronounced lifting. Air parcels are generally lifted up earlier in time for pre-precipitation and post-precipitation virga compared to surface precipitation cases. Pre-precipitation virga arrive significantly higher above DDU compared to surface precipitation and post-precipitation virga. The distributions of pressure at the arrival above DDU indeed show lower median values (higher altitude) for pre-precipitation virga than for the precipitation and post-precipitation virga composites.
A closer look at the distribution of the change in air parcels' pressure level between different time intervals (not shown) reveals more occurrences of large negative changes (indicating a lifting) in the last 6 h before reaching DDU for surface precipitation cases than for pre-precipitation virga and post-precipitation virga cases. The pressure distribution of virga cases is dominated by large negative changes between −6 and −24 h. The pressure distributions of the three ensembles are very similar between 24 and 48 h and almost identical between 48 and 72 h.
A further analysis of the location of the maximum ascending rate along the back trajectories (not shown) also reveals closer-to-DDU lifting for the precipitation phase than for virga cases. For the latter, the lifting generally occurs over a broader area and farther away from the station, to the north as well as to the west and east.
These results of the back-trajectory analysis are consistent with the general picture of precipitation induced by air parcel lifting within a warm conveyor belt that crosses a surface warm front moving towards DDU. Precipitating air parcels from pre-precipitation virga events, which generally precede the front, fall from high air parcels that have been lifted relatively far away from the station when the front was over the Austral Ocean. During surface precipitation cases, the warm front reaches the coast and the snowfall originates from air parcels that were lifted later in time and closer to the continent. Finally, air parcels corresponding to post-precipitation virga generally experience a longer travel time before reaching DDU, explaining their relatively early lifting compared to the surface precipitation composite.
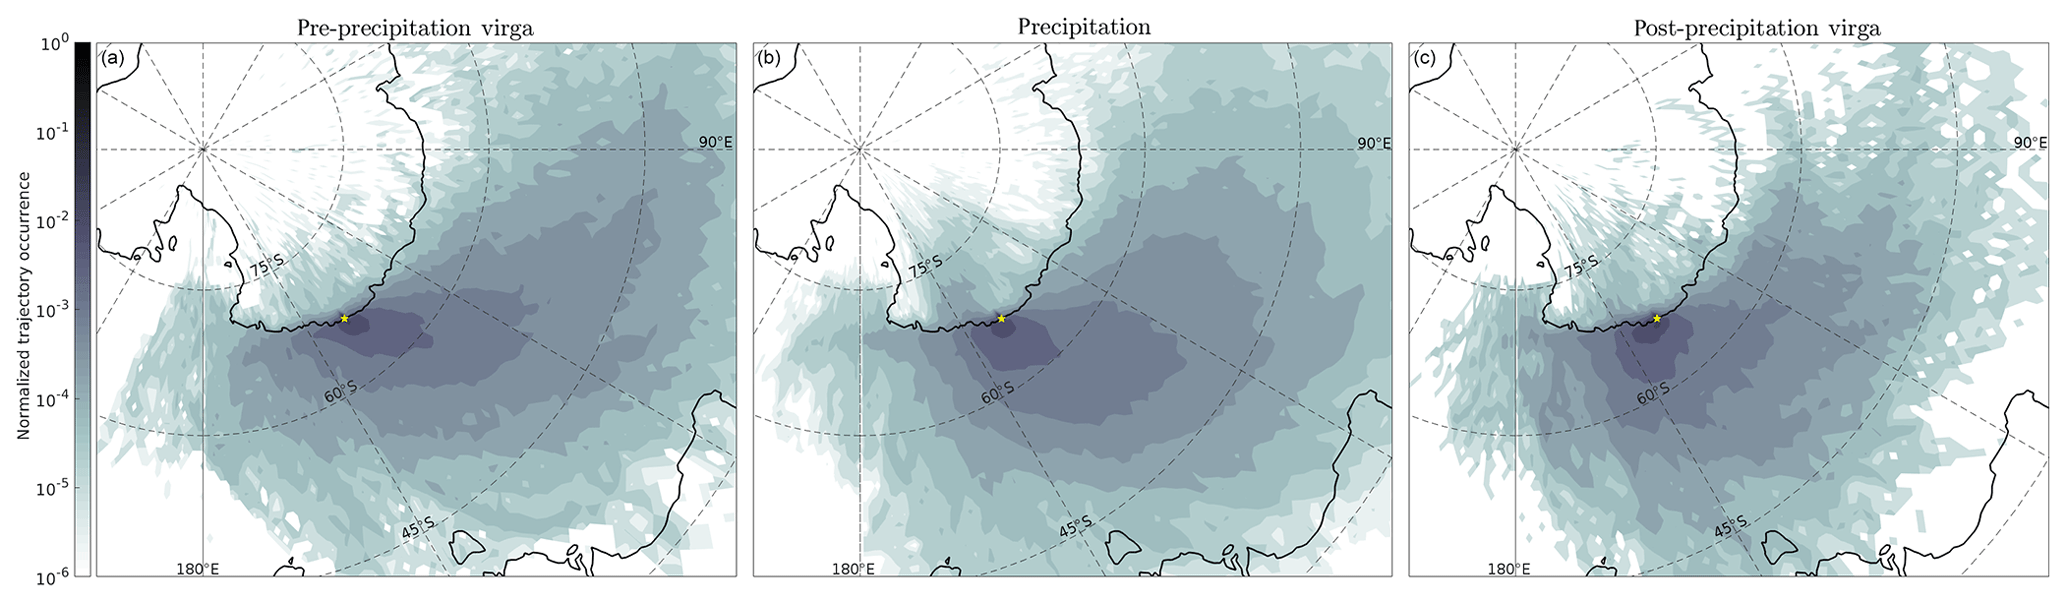
Figure 8Spatial density of the occurrence of 2 d back trajectories of precipitating air parcels over DDU. Panels (a), (b) and (c) show the pre-precipitation virga, surface precipitation and post-precipitation virga composites, respectively. Note the logarithmic color scale.

Figure 9Box plot of the three composites of precipitating air parcel pressure for different times along their trajectory towards DDU. In each box, the central mark indicates the median, and the bottom and top edges of the box indicate the 25th and 75th percentiles, respectively.
4.4 Moisture origin
Different phases of precipitating events over Adélie Land follow significantly different atmospheric pathways during virga and surface precipitation cases. One may also question possible differences in the origin of moisture leading to snowfall, with potential implications for ice core interpretation (Sodemann and Stohl, 2009; Bailey et al., 2019). Composite maps of moisture uptakes along the precipitating air parcels' back trajectories are presented in Fig. 10. Air parcels corresponding to pre-precipitation virga periods pick up moisture far away from DDU (major uptakes along the 45∘ S parallel) and to the northwest of the station (close to and to the east of the 120∘ E meridian, further south) in the Austral Ocean. These remote moisture sources for pre-precipitation virga cases are collocated with regions known for frequent occurrence of strong large-scale ocean evaporation events (Aemisegger and Papritz, 2018). On the other hand, air parcels corresponding to actual surface precipitation periods generally pick up moisture closer to DDU at a longitude close to that of the station. This difference in moisture origin is consistent with the fact that precipitating air parcels for pre-precipitation virga cases are lifted up earlier in time and farther from the station compared to surface precipitation cases (Fig. 9). The large fraction of moisture originating from a region off the coast of DDU during precipitation events points towards a potentially important contribution of rain evaporation and snow sublimation during precipitation in the warm sector of the cyclone already prior to the air parcel's arrival at DDU. The distinction between surface evaporative sources and recycled moisture by precipitation evaporation in the moisture source diagnostics will be the object of future studies.
For post-precipitation virga back trajectories, the map of moisture uptakes shows a similar pattern to the surface precipitation composite. However, there are no very clear confined regions off DDU that dominate the signal. This might be partly explained by the smaller size of the post-precipitation virga composite and to its higher sensitivity to particular events compared to the other two.
It is worth noting that the moisture origin of Antarctic precipitation shows a strong seasonality (Sodemann and Stohl, 2009), particularly owing to the presence or absence of sea ice. This effect is illustrated for DDU with maps of seasonal moisture uptakes and sea ice extent in Appendix C.
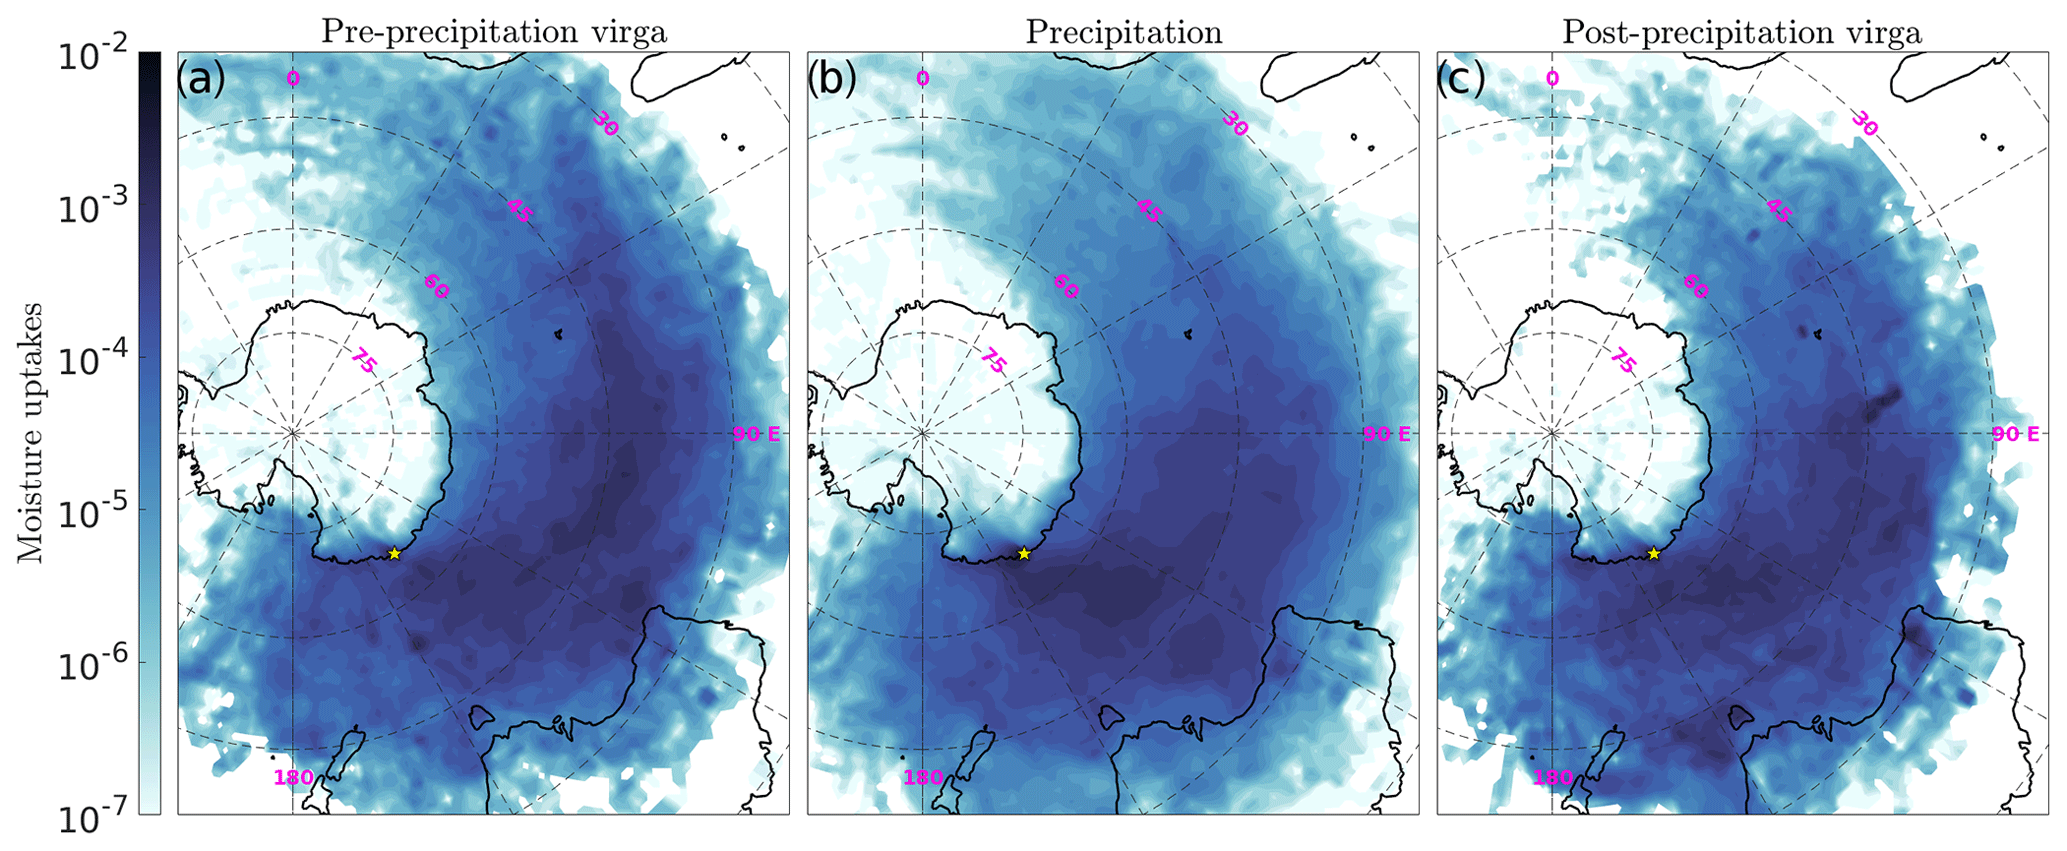
Figure 10Composite maps of moisture uptakes for precipitating air parcels over DDU. The quantity (fractional uptakes per square kilometer) shown in the maps is the sum of the contributions to the specific humidity at the arrival of the air parcel over DDU, weighted by the total amount of water vapor contained in precipitating air parcels above the station. Pre-precipitation virga, surface precipitation and post-precipitation cases are shown in panels (a)–(c), respectively. Note the logarithmic color scale. Color maps are from Thyng et al. (2016).
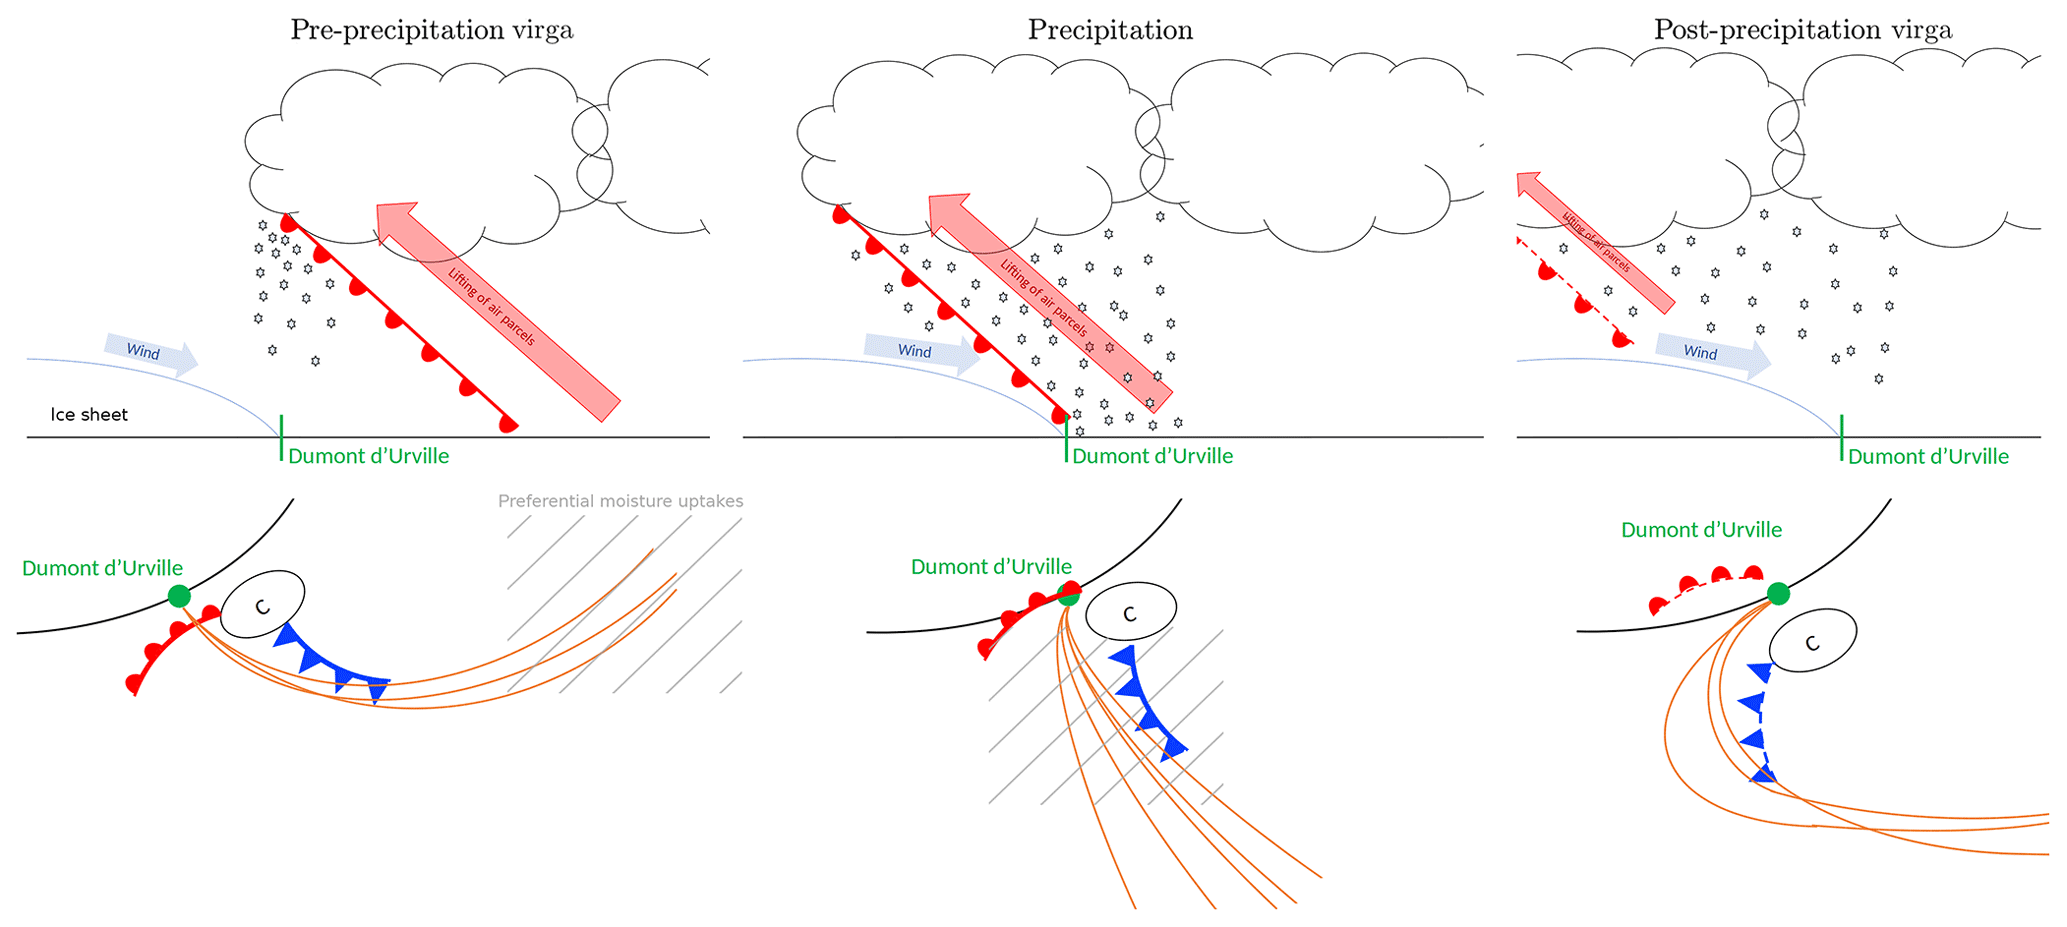
Figure 11Conceptual scheme summarizing the sequence of the different phases of a typical warm front event and associated precipitation over DDU station. The trajectories in orange arrive in the layer where precipitation forms. In the bottom subplots, the south pole is towards the top left corner direction.
This study employs ground-based remotely sensed measurements, atmospheric back trajectories, diagnostics of extratropical cyclones, fronts and moisture sources to characterize the synoptic conditions and the atmospheric moisture transport pathways associated with precipitation and virga cases at DDU, coastal Antarctica. The inspection of vertical profiles of radar reflectivity made it possible to distinguish hours with actual surface precipitation from hours with virga over a 2-year period. It was further shown that surface precipitation and virga actually correspond to different phases of the same synoptic system.
A composite analysis of the pre-precipitation virga, surface precipitation and post-precipitation virga cases leads us to the following conclusions which are pictured in a conceptual model in Fig. 11.
-
Precipitation and virga at DDU are typically associated with the warm front of an extratropical cyclone that is located to the west of the station. When the warm front approaches DDU, precipitation falling from high frontal clouds is fully sublimated in the lowest levels of the troposphere due to the remnant low-level katabatic wind. Precipitating air parcels arrive from the southwest, and they experience a sharp lifting probably within the warm conveyor belt 24 to 6 h before reaching the coast. They pick up their moisture over the Austral Ocean in a remote sector to the west of Adélie Land.
-
During the surface precipitation phase, the warm front has reached the continent. Precipitation is observed at the surface, as snowfall is intense enough to not completely sublimate even though dry continental winds are still blowing at low levels above the coast. Back trajectories of precipitating air parcels are more meridional, and their lifting occurs later in time and closer to the station compared to pre-precipitation virga. They also pick up moisture from the ocean more to the east and closer to the station.
-
Post-precipitation virga cases are less frequent than pre-precipitation ones and they often correspond to the weakening phase of snowfall in the warm sector, sometimes in alternation with surface precipitation periods. They occur when the warm front has penetrated into the plateau, as the cyclone has moved to the east, off the coast of DDU. Precipitating air parcels arrive above DDU from the northeast, skirting the eastern flank of the cyclone and experiencing a long travel time before reaching the station.
An aspect that was not investigated in this study is the potential seasonality of the precipitation event structure. Over the same analysis period, Durán-Alarcón et al. (2019) reveal a slightly higher virga-to-precipitation ratio in summer compared to the other seasons, probably owing to the warmer temperature and higher saturation vapor pressure, implying a higher moisture holding capacity of the air for a given relative humidity. In our study, further seasonal analyses have not revealed major differences in terms of cyclone positions during virga and precipitation cases, although one might expect a signature of the semiannual oscillation with larger and near-coast weather systems in winter than in summer (Uotila et al., 2011). The only clear seasonality signal is the one in the moisture origin (Appendix C) that is directly affected by the sea ice extent. However, a 2-year analysis period is not sufficient to draw robust conclusions about a potential seasonality of the structure of precipitation and virga events, and this aspect deserves further work on longer MRR time series in the future.
Furthermore, Turner et al. (2019) underline the role of extreme precipitation events in the total surface snow accumulation and snowfall variability in Antarctica, concurring with atmospheric rivers over Dronning Maud Land (Gorodetskaya et al., 2014). At DDU, MRR measurements show that 54 % of the accumulated precipitation is explained by the 10 % of hours with the highest precipitation rate (higher than the 0.9 quantile). A first analysis showed that 72 % of the precipitation events identified as atmospheric rivers (according to an updated version of the detection algorithm from Wille et al., 2019) belong to the 10 % (0.9 quantile) most intense hourly radar reflectivity (thus precipitation). In terms of hours, it represents only 27 % of the number of hours belonging to this 0.9 quantile, implying that a few hours of precipitation bring a large quantity of water for the accumulation over the Antarctic ice sheet. However our analysis period is, at the moment, too short to draw robust conclusions about intense precipitation events at DDU.
Last but not least, this paper has focused on one particular location of coastal Antarctica. Grazioli et al. (2017b) and Vignon et al. (2019b) showed that low-level sublimation occurs over many sectors along the coast of Antarctica. Moreover, Adélie Land corresponds to a specific location of the Southern Hemisphere storm track, with a major cyclone genesis (lysis) region at the east (west) of DDU (Hoskins and Hodges, 2005). It would be interesting to carry out a similar study for other sectors in Antarctica to assess how representative our conclusions are at the Antarctic scale.
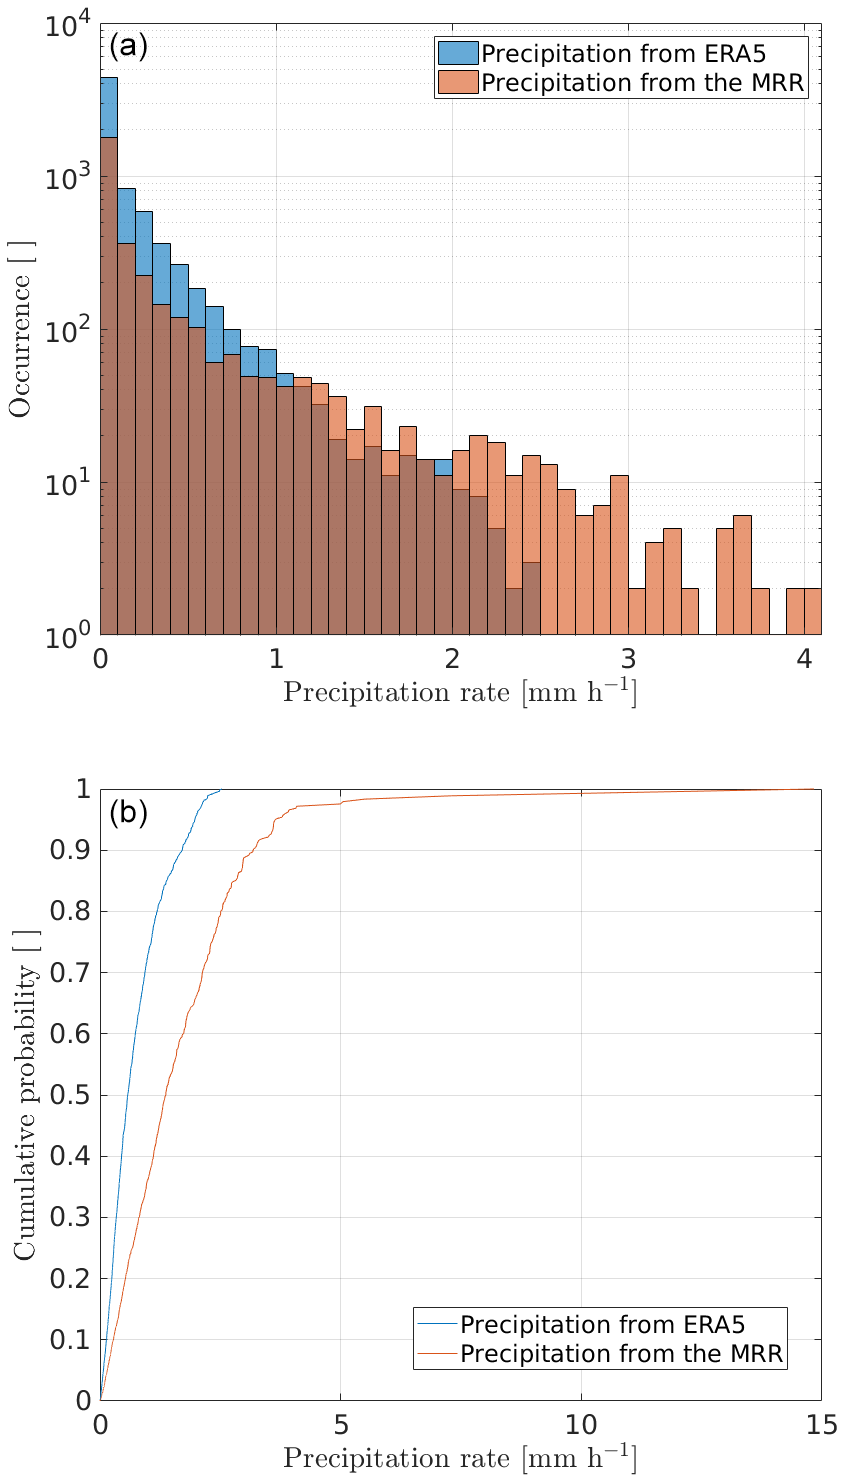
Figure A1Comparison of surface precipitation between MRR and ERA5 over the period 23 November 2015–22 November 2017. Panel (a) shows the distribution of hourly precipitation rates (note the logarithmic scale on y axis) and panel (b) the cumulative probability of increasing snowfall rates compared to the total accumulated precipitation.
In this part, we briefly compare the surface precipitation in the ERA5 reanalysis at the DDU grid point to the MRR measurements. Note that hourly precipitation rates in ERA5 are always above the lowest hourly precipitation rate measured by the MRR at the first reliable radar gate ( mm h−1). Over the 2-year period, the accumulated precipitation in ERA5 is 1383.44 mm, which is close to the accumulated precipitation measured by the MRR: 1335.12 mm. However, Fig. A1a shows that ERA5 underestimates the relative number of high-precipitation intensities. On the other hand, the reanalysis overestimates (note the logarithmic y axis) the number of low-precipitation cases. Moreover ERA5 does not represent hourly precipitation rates exceeding 2.5 mm h−1 while the MRR show values up to 4 mm h−1.
Figure A1b further shows that the accumulated surface precipitation is explained by more frequent low-precipitation hours in ERA5 compared to MRR measurements. This result is consistent with the findings of Grazioli et al. (2017a). In addition, 50 % of the total surface precipitation measured by the MRR corresponds to the 294 h (28 d) with the highest precipitation rates, and in ERA5 it corresponds to 680 h (45 d).
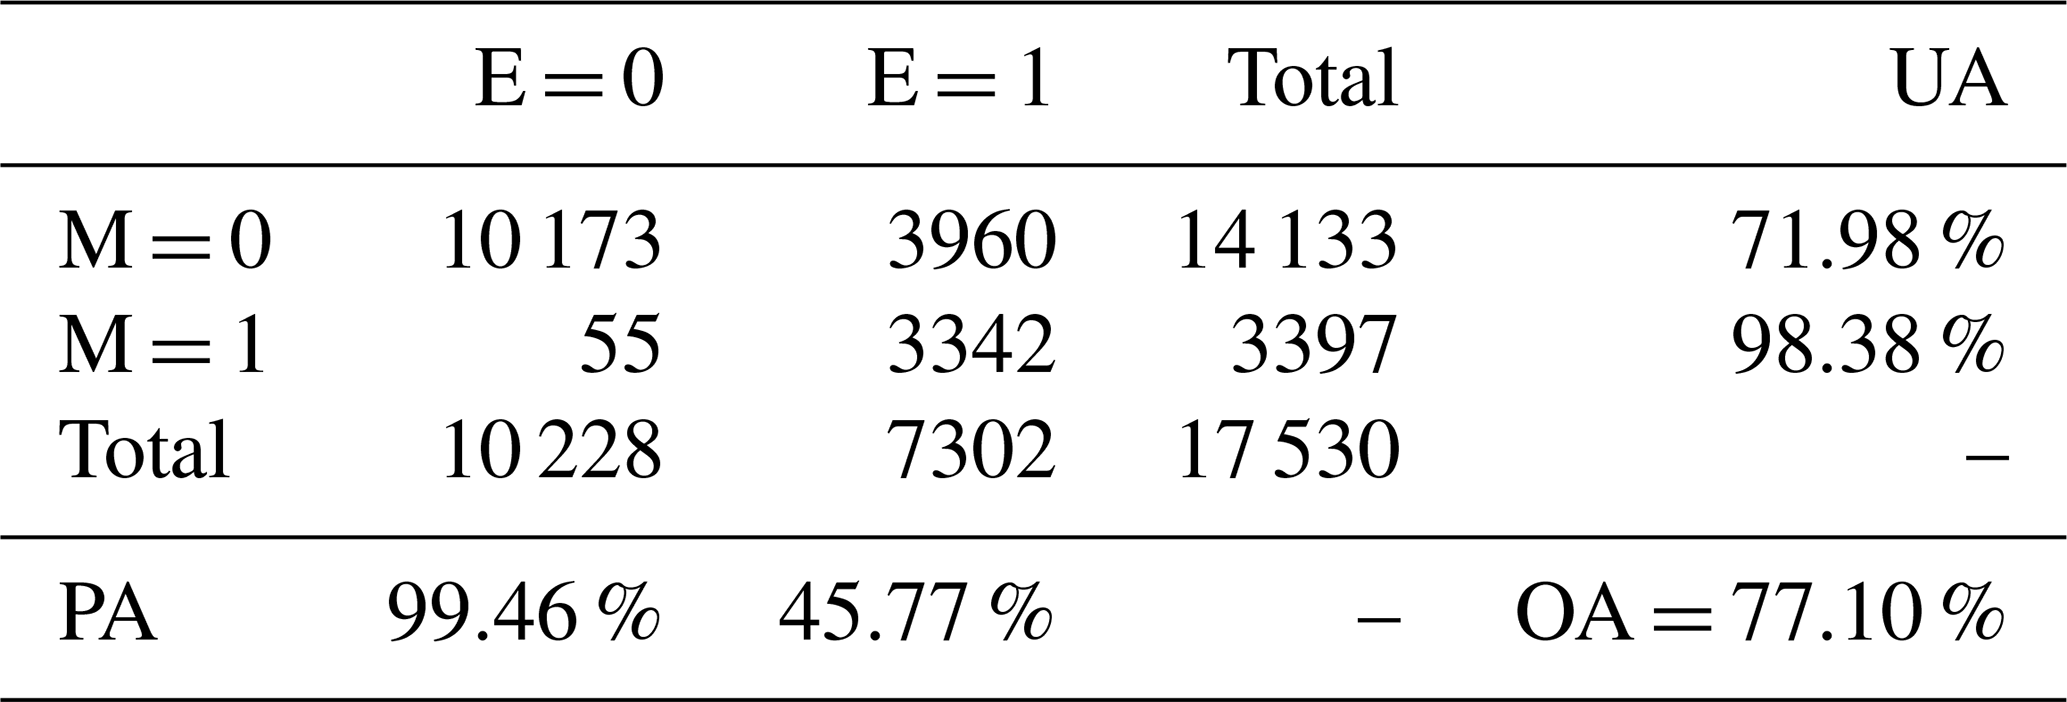
The contingency table (Table A1) compares the precipitation occurrences between the MRR and ERA5. More than 98 % of the hourly precipitation events measured by the MRR are also present in the ERA5 reanalysis, regardless of the precipitation intensity. On the other hand, only 46 % of precipitation hours in ERA5 correspond to actual MRR measurements.
Over the 2-year period, there are 10 173 h when both ERA5 and MRR did not detect any precipitation. The overall accuracy is 77.1 % between ERA5 and the MRR. This percentage should however be interpreted with caution as it is influenced by the non-precipitation days, which are counted as matching in the overall accuracy calculation.
Table A1Contingency table comparing hours with precipitation from MRR measurements (M in the table) and from ERA5 (E in the table). Hours with no precipitation are included in the statistics. A value of 1 (0) means with a (no) precipitation event. “UA” refers to user's accuracy, “PA” to producer's accuracy and “OA” to overall accuracy.
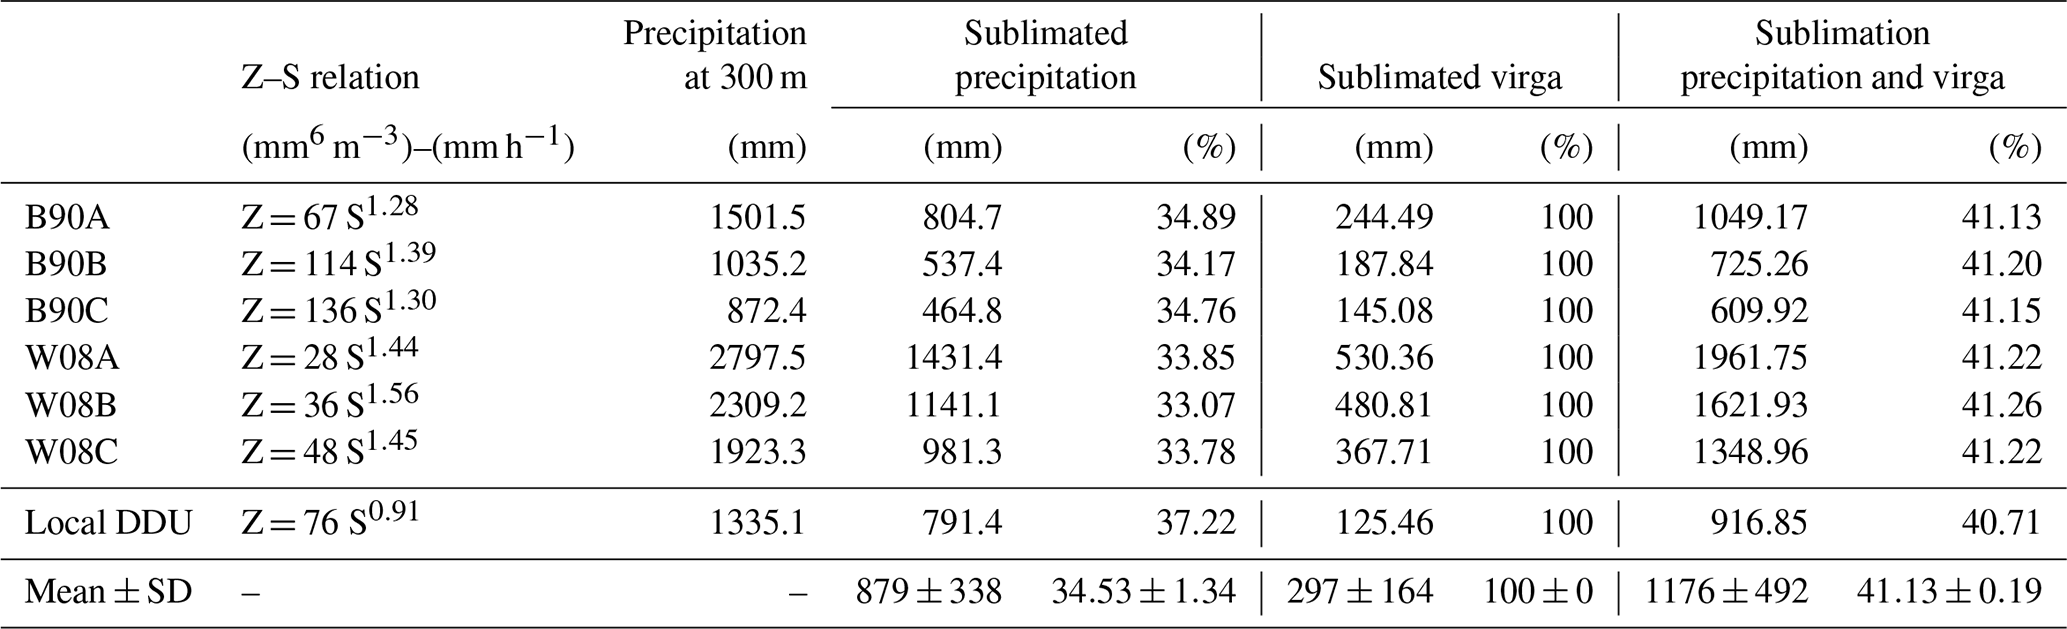
Here we provide a first-order quantification of the amount of sublimated snow using MRR reflectivity data. The sublimated precipitation is calculated by subtracting the maximum snowfall rate in the column with the quantity of precipitation measured at 300 m a.g.l. using the local reflectivity–snowfall rate (Z–S) relationship derived at DDU in Grazioli et al. (2017a). The results are presented in the seventh row of Table B1.
The amount of precipitation that sublimates during surface precipitation cases (virga cases) is 791 mm (125 mm), corresponding to 37 % (100 %) of the maximum falling precipitation in the column. Summing surface precipitation and virga periods, 917 mm of precipitation is sublimated, corresponding to 41 % of the maximum falling precipitation in the column. This can be compared to the amount of accumulated precipitation at the surface (first reliable radar gate): 1335 mm.
However, such results should be interpreted with care since the Z–S relationship derived for near-surface conditions is used at an altitude up to 3000 m a.g.l. It may not be valid in the top layers, especially above the aggregation layer, because of different snowflake concentrations and particle types. Yet, the distribution of the maximum reflectivity in the column for each event (not shown) reveals that 50 % (95 %) of the profiles show values of maximum reflectivity at an altitude below or equal to 1000 (1800) m a.g.l. Even though we cannot provide an uncertainty associated with the vertical extrapolation of the Z–S relationship, we can test different Z–S relations from the literature (Grazioli et al., 2017a). The results are presented in the top six rows of Table B1, and the mean and standard deviations of the sublimated snow estimations with the different relationships are shown in the bottom row of Table B1. Although the magnitude of the amount of total precipitation and sublimated precipitation varies a lot between different Z–S relationships, the relative amounts of sublimated precipitation are very consistent.
Table B1Amount of precipitation and sublimated precipitation using the different Z–S relationships considered in Grazioli et al. (2017a). Percentages correspond to the quantity of precipitation at the 300 m level with respect to the maximum precipitation in the column. The acronym for each Z–S law reference can be found in Grazioli et al. (2017a).
Maps of summer (DJF) and winter (JJA) moisture uptakes for surface precipitation cases are plotted in Fig. C1. During summer, when sea ice concentration is minimum, moisture uptakes generally occur in the northern and northwestern sectors off DDU. In winter, when sea ice extends further north, air parcels generally pick up moisture further north in the Austral Ocean, but also more to the west of DDU compared to summer. One can notice the sharp gradient of moisture uptakes at the sea ice margin, suggesting the limiting effect of sea ice on evaporation.
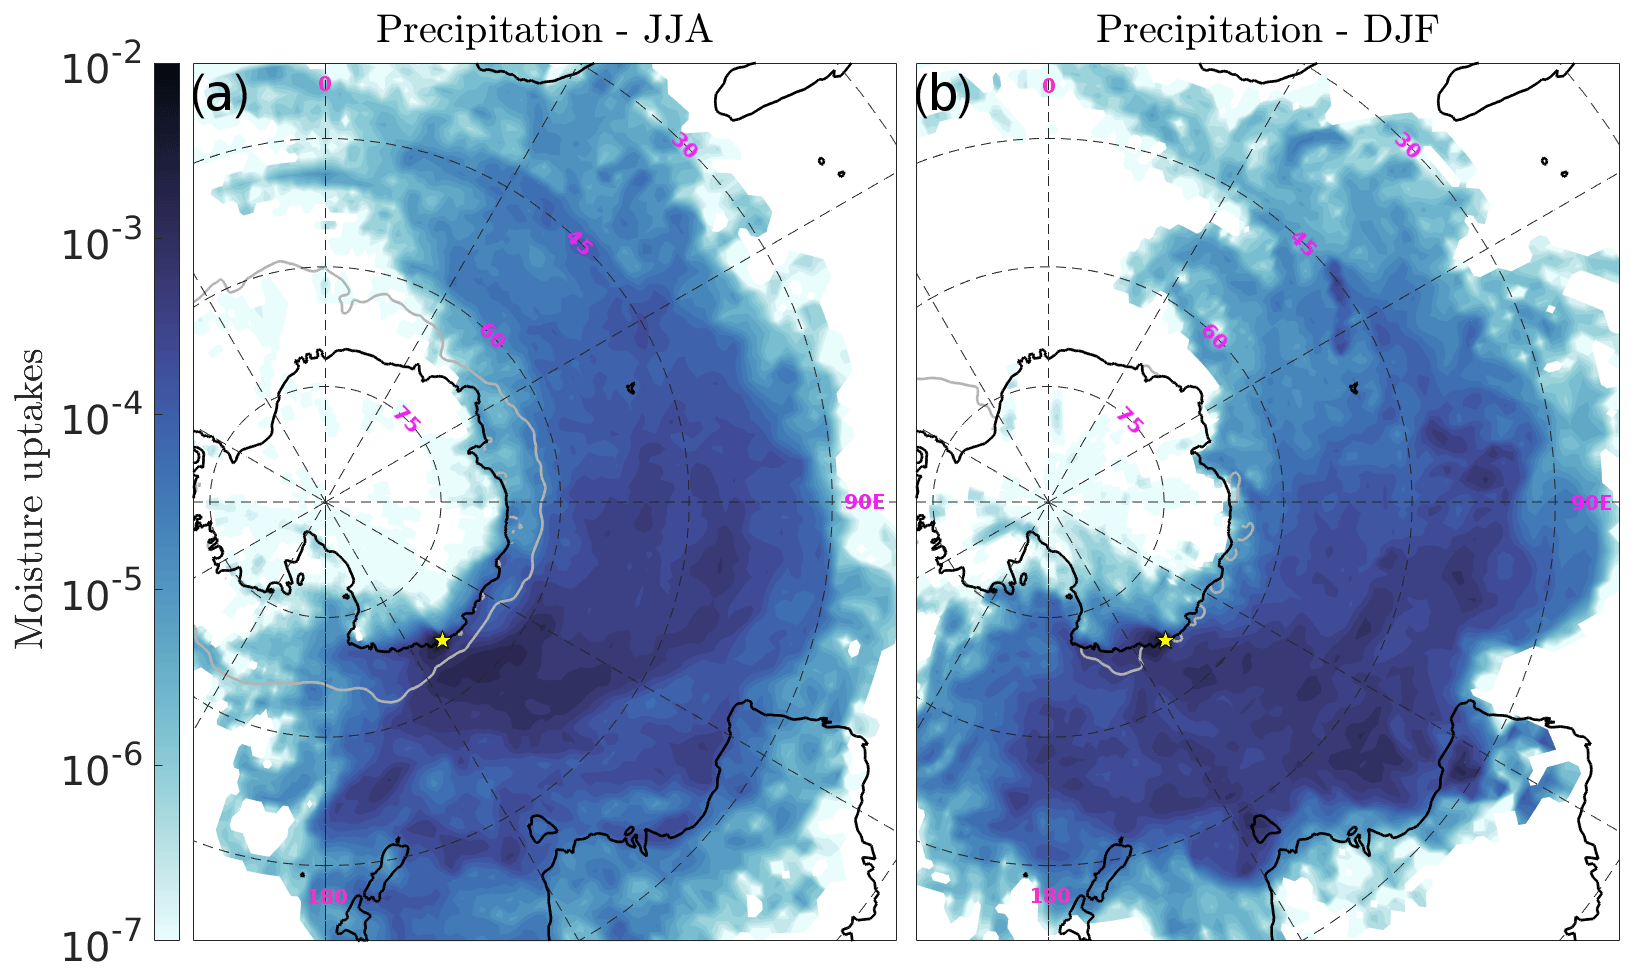
Figure C1Same as Fig. 10b but conditioned to the winter (JJA, a) and summer (DJF, b) seasons. The grey line shows the 0.7 contour of the seasonal sea ice fraction in ERA5.
The APRES3 campaign data are freely distributed in the PANGAEA data repository (https://doi.org/10.1594/PANGAEA.883562, Berne et al., 2017; Genthon et al., 2018).
NJ, EV and AB designed and conducted the study. MS ran the LAGRANTO algorithm and provided the back trajectories as well as the cyclones and front diagnostics. FA calculated the moisture sources. NJ carried out the major part of the analysis. NJ prepared the manuscript with contributions from all the authors.
The authors declare that they have no conflict of interest.
All the figures showing the Antarctic continent in this paper were plotted using the MATLAB Antarctic Mapping Tools toolbox (Greene et al., 2017). Color maps used in Figs. 2, 7a–c, 10a–c and C1a, b are from Thyng et al. (2016). The color maps used in Fig. 7d, e are from Auton (2020). Nicolas Jullien acknowledges support by the European Research Council (ERC) under the European Union's Horizon 2020 Research and Innovation Programme (grant agreement no. 818994). We are grateful to Irina Gorodetskaya for her comments on a preliminary version of this paper as well as Iris Thurnherr, Josué Gehring and Alfonso Ferrone for fruitful discussions and support. Météo France is acknowledged for providing the near-surface measurements at DDU station. The authors acknowledge the support of the French National Research Agency (ANR) and of the French Polar Institute (IPEV) for the APRES3 project. Claudio Durán-Alarcón is thanked for pre-processing the radar data. Jonathan Wille and Vincent Favier are gratefully acknowledged for discussions and complementary analyses on atmospheric rivers. We also thank Sergi Gonzalez and the anonymous reviewer for their careful evaluation of the paper and thoughtful comments.
This work has been funded by the EPFL LOSUMEA project.
This paper was edited by Tobias Sauter and reviewed by Sergi Gonzalez and one anonymous referee.
Aemisegger, F. and Papritz, L.: A Climatology of Strong Large-Scale Ocean Evaporation Events. Part I: Identification, Global Distribution, and Associated Climate Conditions, J. Climate, 31, 7287–7312, https://doi.org/10.1175/JCLI-D-17-0591.1, 2018. a
Aemisegger, F., Pfahl, S., Sodemann, H., Lehner, I., Seneviratne, S. I., and Wernli, H.: Deuterium excess as a proxy for continental moisture recycling and plant transpiration, Atmos. Chem. Phys., 14, 4029–4054, https://doi.org/10.5194/acp-14-4029-2014, 2014. a
Agosta, C., Amory, C., Kittel, C., Orsi, A., Favier, V., Gallée, H., van den Broeke, M. R., Lenaerts, J. T. M., van Wessem, J. M., van de Berg, W. J., and Fettweis, X.: Estimation of the Antarctic surface mass balance using the regional climate model MAR (1979–2015) and identification of dominant processes, The Cryosphere, 13, 281–296, https://doi.org/10.5194/tc-13-281-2019, 2019. a, b
Auton, A.: Red Blue Colormap, MATLAB Central File Exchange, available at: https://www.mathworks.com/matlabcentral/fileexchange/25536-red-blue-colormap, last access: 1 April 2020. a, b
Bailey, A., Singh, H. K. A., and Nusbaumer, J.: Evaluating a Moist Isentropic Framework for Poleward Moisture Transport: Implications for Water Isotopes Over Antarctica, Geophys. Res. Lett., 46, 7819–7827, https://doi.org/10.1029/2019GL082965, 2019. a
Berne, A., Grazioli, J., and Genthon, C.: Precipitation observations at the Dumont d'Urville station, Adelie Land, East Antarctica, PANGAEA, https://doi.org/10.1594/PANGAEA.883562, 2017. a
Bréant, C., Santos, C. L. D., Agosta, C., Casado, M., Fourré, E., Goursaud, S., Masson-Delmotte, V., Favier, V., Cattani, O., Prié, F., Golly, B., Orsi, A., Martinerie, P., and Landais, A.: Coastal water vapor isotopic composition driven by katabatic wind variability in summer at Dumont d'Urville, coastal East Antarctica, Earth Planet. Sc. Lett., 514, 37–47, https://doi.org/10.1016/j.epsl.2019.03.004, 2019. a
Bromwich, D. H., Robasky, F. M., Cullather, R. I., and Van Woert, M. L.: The atmospheric hydrologic cycle over the Southern Ocean and Antarctica from operational numerical analyses, Mon. Weather Rev., 123, 3518–3538, 1995. a
Bromwich, D. H., Steinhoff, D. F., Simmonds, I., Keay, K., and Fogt, R. L.: Climatological aspects of cyclogenesis near Adélie Land Antarctica, Tellus A, 63, 921–938, https://doi.org/10.1111/j.1600-0870.2011.00537.x, 2011. a
Clough, S. A. and Franks, R. A. A.: The evaporation of frontal and other stratiform precipitation, Q. J. Roy. Meteor. Soc, 117, 1054–1080, 1991. a
Durán-Alarcón, C., Boudevillain, B., Genthon, C., Grazioli, J., Souverijns, N., van Lipzig, N. P. M., Gorodetskaya, I. V., and Berne, A.: The vertical structure of precipitation at two stations in East Antarctica derived from micro rain radars, The Cryosphere, 13, 247–264, https://doi.org/10.5194/tc-13-247-2019, 2019. a, b, c, d, e
Eckhardt, S., Stohl, A., Wernli, H., James, P., Forster, C., and Spichtinger, N.: A 15-Year Climatology of Warm Conveyor Belts, J. Climate, 17, 218–237, https://doi.org/10.1175/1520-0442(2004)017<0218:AYCOWC>2.0.CO;2, 2004. a
Genthon, C., Berne, A., Grazioli, J., Durán Alarcón, C., Praz, C., and Boudevillain, B.: Precipitation at Dumont d'Urville, Adélie Land, East Antarctica: the APRES3 field campaigns dataset, Earth Syst. Sci. Data, 10, 1605–1612, https://doi.org/10.5194/essd-10-1605-2018, 2018. a, b
Gorodetskaya, I. V., Tsukernik, M., Claes, K., Ralph, M. F., Neff, W. D., and Van Lipzig, N. P. M.: The role of atmospheric rivers in anomalous snow accumulation in East Antarctica, Geophys. Res. Lett., 41, 6199–6206, https://doi.org/10.1002/2014GL060881, 2014. a, b, c
Gossart, A., Helsen, S., Lenaerts, J. T. M., Broucke, S. V., van Lipzig, N. P. M., and Souverijns, N.: An Evaluation of Surface Climatology in State-of-the-Art Reanalyses over the Antarctic Ice Sheet, J. Climate, 32, 6899–6915, https://doi.org/10.1175/JCLI-D-19-0030.1, 2019. a
Goursaud, S., Masson-Delmotte, V., Favier, V., Preunkert, S., Legrand, M., Minster, B., and Werner, M.: Challenges associated with the climatic interpretation of water stable isotope records from a highly resolved firn core from Adélie Land, coastal Antarctica, The Cryosphere, 13, 1297–1324, https://doi.org/10.5194/tc-13-1297-2019, 2019. a
Grazioli, J., Genthon, C., Boudevillain, B., Duran-Alarcon, C., Del Guasta, M., Madeleine, J.-B., and Berne, A.: Measurements of precipitation in Dumont d'Urville, Adélie Land, East Antarctica, The Cryosphere, 11, 1797–1811, https://doi.org/10.5194/tc-11-1797-2017, 2017a. a, b, c, d, e, f, g
Grazioli, J., Madeleine, J.-B., Gallée, H., Forbes, R. M., Genthon, C., Krinner, G., and Berne, A.: Katabatic winds diminish precipitation contribution to the Antarctic ice mass balance, P. Natl. Acad. Sci. USA, 114, 10858–10863, https://doi.org/10.1073/pnas.1707633114, 2017b. a, b, c, d
Greene, C. A., Gwyther, D. E., and Blankenship, D. D.: Antarctic Mapping Tools for Matlab, Comput. Geosci., 104, 151–157, https://doi.org/10.1016/j.cageo.2016.08.003, 2017. a
Grieger, J., Leckebusch, G. C., Raible, C. C., Rudeva, I., and Simmonds, I.: Subantarctic cyclones identified by 14 tracking methods, and their role for moisture transports into the continent, Tellus A, 70, 1–18, 2018. a
Hirasawa, N., Nakamura, H., Motoyama, H., Hayashi, M., and Yamanouchi, T.: The role of synoptic-scale features and advection in prolonged warming and generation of different forms of precipitation at Dome Fuji station, Antarctica, following a prominent blocking event, J. Geophys. Res.-Atmos., 118, 6916–6928, https://doi.org/10.1002/jgrd.50532, 2013. a
Hoskins, B. J. and Hodges, K. I.: A New Perspective on Southern Hemisphere Storm Tracks, J. Climate, 18, 4108–4129, https://doi.org/10.1175/JCLI3570.1, 2005. a
Jenkner, J., Sprenger, M., Schwenk, I., Schwierz, C., Dierer, S., and Leuenberger, D.: Detection and climatology of fronts in a high-resolution model reanalysis over the Alps, Meteorol. Appl., 17, 1–18, https://doi.org/10.1002/met.142, 2010. a, b
King, J. C. and Turner, J.: Antarctic Meteorology and Climatology, Cambridge Atmospheric and Space Science Series, Cambridge University Press, 1997. a
König-Langlo, G., King, J. C., and Pettré, P.: Climatology of the three coastal Antarctic stations Dumont d'Urville, Neumayer, and Halley, J. Geophys. Res.-Atmos., 103, 10935–10946, https://doi.org/10.1029/97JD00527, 1998. a
Madonna, E., Wernli, H., Joos, H., and Martius, O.: Warm Conveyor Belts in the ERA-Interim Dataset (1979–2010). Part I: Climatology and Potential Vorticity Evolution, J. Climate, 27, 3–26, https://doi.org/10.1175/JCLI-D-12-00720.1, 2014. a, b
Naithani, J., Gallée, H., and Schayes, G.: Marine air intrusion into the Adelie Land sector of East Antarctica: A study using the regional climate model (MAR), J. Geophys. Res.-Atmos., 107, ACL 6-1–ACL 6-16, https://doi.org/10.1029/2000JD000274, 2002. a
Naithani, J., Argentini, S., Schayes, G., and Mastrantonio, G.: Analysis of strong wind events around Adelie Land, East Antarctica, Ann. Geophys., 46, 385–399, 2003. a
Papritz, L., Pfahl, S., Rudeva, I., Simmonds, I., Sodemann, H., and Wernli, H.: The Role of Extratropical Cyclones and Fronts for Southern Ocean Freshwater Fluxes, J. Climate, 27, 6205–6224, https://doi.org/10.1175/JCLI-D-13-00409.1, 2014. a, b
Papritz, L., Pfahl, S., Sodemann, H., and Wernli, H.: A Climatology of Cold Air Outbreaks and Their Impact on Air–Sea Heat Fluxes in the High-Latitude South Pacific, J. Climate, 28, 342–364, https://doi.org/10.1175/JCLI-D-14-00482.1, 2015. a
Parish, T. and Walker, R.: A re-examination of the winds of Adélie Land, Antarctica, Aust. Meteorol. Mag., 55, 105–117, 2012. a
Parish, T. R. and Bromwich, D. H.: A Case Study of Antarctic Katabatic Wind Interaction with Large-Scale Forcing, Mon. Weather Rev., 126, 199–209, https://doi.org/10.1175/1520-0493(1998)126<0199:ACSOAK>2.0.CO;2, 1998. a
Parish, T. R. and Bromwich, D. H.: Reexamination of the Near-Surface Airflow over the Antarctic Continent and Implications of Atmospheric Circulations at High Southern Latitudes, Mon. Weather Rev., 135, 1961–1973, https://doi.org/10.1175/MWR3374.1, 2007. a
Pettré, P. and Périard, C.: Aspects du climat de Dumont-D'Urville et de l'Antarctique, La Météorologie, 13, 55–62, https://doi.org/10.4267/2042/51175, 1996. a
Pfahl, S. and Wernli, H.: Quantifying the Relevance of Cyclones for Precipitation Extremes, J. Climate, 25, 6770–6780, https://doi.org/10.1175/JCLI-D-11-00705.1, 2012. a
Schemm, S., Rudeva, I., and Simmonds, I.: Extratropical fronts in the lower troposphere-global perspectives obtained from two automated methods, Q. J. Roy. Meteor. Soc., 141, 1686–1698, https://doi.org/10.1002/qj.2471, 2015. a
Schlosser, E., Manning, K. W., Powers, J. G., Duda, M. G., Birnbaum, G., and Fujita, K.: Characteristics of high-precipitation events in Dronning Maud Land, Antarctica, J. Geophys. Res.-Atmos., 115, D14107, https://doi.org/10.1029/2009JD013410, 2010. a
Simmonds, I. and Keay, K.: Mean Southern Hemisphere extratropical cyclone behavior in the 40-year NCEP–NCAR reanalysis, J. Climate, 13, 873–885, 2000. a
Simmonds, I., Keay, K., and Lim, E.-P.: Synoptic Activity in the Seas around Antarctica, Mon. Weather Rev., 131, 272–288, https://doi.org/10.1175/1520-0493(2003)131<0272:SAITSA>2.0.CO;2, 2003. a
Sinclair, V. A. and Dacre, H. F.: Which Extratropical Cyclones Contribute Most to the Transport of Moisture in the Southern Hemisphere?, J. Geophys. Res.-Atmos., 124, 2525–2545, https://doi.org/10.1029/2018JD028766, 2019. a
Sodemann, H. and Stohl, A.: Asymmetries in the moisture origin of Antarctic precipitation, Geophys. Res. Lett., 36, L22803, https://doi.org/10.1029/2009GL040242, 2009. a, b
Sodemann, H., Schwierz, C., and Wernli, H.: Interannual variability of Greenland winter precipitation sources: Lagrangian moisture diagnostic and North Atlantic Oscillation influence, J. Geophys. Res.-Atmos., 113, D03107, https://doi.org/10.1029/2007JD008503, 2008. a, b
Souverijns, N., Gossart, A., Gorodetskaya, I. V., Lhermitte, S., Mangold, A., Laffineur, Q., Delcloo, A., and van Lipzig, N. P. M.: How does the ice sheet surface mass balance relate to snowfall? Insights from a ground-based precipitation radar in East Antarctica, The Cryosphere, 12, 1987–2003, https://doi.org/10.5194/tc-12-1987-2018, 2018. a
Sprenger, M. and Wernli, H.: The LAGRANTO Lagrangian analysis tool – version 2.0, Geosci. Model Dev., 8, 2569–2586, https://doi.org/10.5194/gmd-8-2569-2015, 2015. a
Sprenger, M., Fragkoulidis, G., Binder, H., Croci-Maspoli, M., Graf, P., Grams, C. M., Knippertz, P., Madonna, E., Schemm, S., Škerlak, B., and Wernli, H.: Global Climatologies of Eulerian and Lagrangian Flow Features based on ERA-Interim, B. Am. Meteorol. Soc., 98, 1739–1748, https://doi.org/10.1175/BAMS-D-15-00299.1, 2017. a, b, c, d
Thyng, K., Greene, C., Hetland, R., Zimmerle, H., and DiMarco, S.: True Colors of Oceanography: Guidelines for Effective and Accurate Colormap Selection, Oceanography, 29, 9–13, https://doi.org/10.5670/oceanog.2016.66, 2016. a, b, c, d
Turner, J., Phillips, T., Thamban, M., Rahaman, W., Marshall, G. J., Wille, J. D., Favier, V., Winton, V. H. L., Thomas, E., Wang, Z., van den Broeke, M., Hosking, J. S., and Lachlan-Cope, T.: The Dominant Role of Extreme Precipitation Events in Antarctic Snowfall Variability, Geophys. Res. Lett., 46, 3502–3511, https://doi.org/10.1029/2018GL081517, 2019. a, b
Uotila, P., Vihma, T., Pezza, A., Simmonds, I., Keay, K., and Lynch, A.: Relationships between Antarctic cyclones and surface conditions as derived from high-resolution numerical weather prediction data, J. Geophys. Res.-Atmos., 116, D07109, https://doi.org/10.1029/2010JD015358, 2011. a
Uotila, P., Vihma, T., and Tsukernik, M.: Close interactions between the Antarctic cyclone budget and large-scale atmospheric circulation, Geophys. Res. Lett., 40, 3237–3241, https://doi.org/10.1002/grl.50560, 2013. a
Vignon, E., Besic, N., Jullien, N., Gehring, J., and Berne, A.: Microphysics of Snowfall Over Coastal East Antarctica Simulated by Polar WRF and Observed by Radar, J. Geophys. Res.-Atmos., 124, 11452–11476, https://doi.org/10.1029/2019JD031028, 2019a. a, b
Vignon, É., Traullé, O., and Berne, A.: On the fine vertical structure of the low troposphere over the coastal margins of East Antarctica, Atmos. Chem. Phys., 19, 4659–4683, https://doi.org/10.5194/acp-19-4659-2019, 2019b. a, b, c, d, e
Vignon, E., Picard, G., Durán-Alarcón, C., Alexander, S. P., Gallée, H., and Berne, A.: Gravity Wave Excitation during the Coastal Transition of an Extreme Katabatic Flow in Antarctica, J. Atmos. Sci., 77, 1295–1312, https://doi.org/10.1175/JAS-D-19-0264.1, 2020. a
Wang, Y., You, Y., and Kulie, M.: Global Virga Precipitation Distribution Derived From Three Spaceborne Radars and Its Contribution to the False Radiometer Precipitation Detection, Geophys. Res. Lett., 45, 4446–4455, https://doi.org/10.1029/2018GL077891, 2018. a
Wendler, G., Stearns, C., Weidner, G., Dargaud, G., and Parish, T.: On the extraordinary katabatic winds of Adélie Land, J. Geophys. Res.-Atmos., 102, 4463–4474, https://doi.org/10.1029/96JD03438, 1997. a
Wernli, B. H. and Davies, H. C.: A lagrangian-based analysis of extratropical cyclones. I: The method and some applications, Q. J. Roy. Meteor. Soc., 123, 467–489, https://doi.org/10.1002/qj.49712353811, 1997. a
Wernli, H. and Schwierz, C.: Surface Cyclones in the ERA-40 Dataset (1958–2001). Part I: Novel Identification Method and Global Climatology, J. Atmos. Sci., 63, 2486–2507, https://doi.org/10.1175/JAS3766.1, 2006. a, b
Wille, J. D., Favier, V., Dufour, A., Gorodetskaya, I. V., Turner, J., Agosta, C., and Codron, F.: West Antarctic surface melt triggered by atmospheric rivers, Nat. Geosci., 12, 911–916, https://doi.org/10.1038/s41561-019-0460-1, 2019. a, b
- Abstract
- Introduction
- Data and methods
- Example of a precipitation event at DDU
- Statistical analysis
- Discussion and conclusions
- Appendix A: Comparison between the MRR and ERA5 reanalysis
- Appendix B: Amount of sublimated snow
- Appendix C: Seasonal moisture source analysis
- Data availability
- Author contributions
- Competing interests
- Acknowledgements
- Financial support
- Review statement
- References