the Creative Commons Attribution 4.0 License.
the Creative Commons Attribution 4.0 License.
 | 17 Jan 2020
Modeling snow slab avalanches caused by weak-layer failure – Part 1: Slabs on compliant and collapsible weak layers
Philipp L. Rosendahl
Dry-snow slab avalanche release is preceded by a fracture process within the snowpack. Recognizing weak-layer collapse as an integral part of the fracture process is crucial and explains phenomena such as whumpf sounds and remote triggering of avalanches from low-angle terrain. In this two-part work we propose a novel closed-form analytical model for a snowpack under skier loading and a mixed-mode failure criterion for the nucleation of weak-layer failure.
In the first part of this two-part series we introduce a closed-form analytical model of a snowpack accounting for the deformable layer. Despite the importance of persistent weak layers for slab avalanche release, no simple analytical model considering weak-layer deformations is available. The proposed model provides deformations of the snow slab, weak-layer stresses and energy release rates of cracks within the weak layer. It generally applies to skier-loaded slopes as well as stability tests such as the propagation saw test. A validation with a numerical reference model shows very good agreement of the stress and energy release rate results in several parametric studies including analyses of the bridging effect and slope angle dependence. The proposed model is used to analyze 93 propagation saw tests. Computed weak-layer fracture toughness values are physically meaningful and in excellent agreement with finite element analyses.
In the second part of the series (Rosendahl and Weißgraeber, 2020) we make use of the present mechanical model to establish a novel failure criterion crack nucleation in weak layers. The code used for the analyses in both parts is publicly available under https://github.com/2phi/weac (last access: 6 January 2020) (2phi, 2020).
- Article
(10991 KB) - Full-text XML
- Companion paper
- BibTeX
- EndNote


Dry-snow slab avalanches can release when a persistent weak layer of, for example, surface hoar or depth hoar breaks (see the well-known image of a partially collapsed weak layer by Jamieson and Schweizer, 2000, shown in Fig. 1). Weak-layer failure can be triggered by additional loads like a skier. If the conditions allow for crack propagation, i.e., if the energy release rate of a growing crack suffices, a triggered initial defect may extend across slopes and eventually cause the slab to fail and slide.
The earliest approaches to snowpack stability were so-called stability indices. They consider snowpack loading owing to the weight of the snow slab and owing to additional loading by a skier (Perla, 1977; Föhn, 1987). To account for snow stratification improved stability index models were proposed by Habermann et al. (2008) and Monti et al. (2015). However, these local models are insufficient to describe the stability of snowpacks across slopes (Bellaire and Schweizer, 2011). Many researchers suggested that stability indices are incomplete as they do not account for the propagation of the failure within the snowpack (van Herwijnen and Jamieson, 2007).
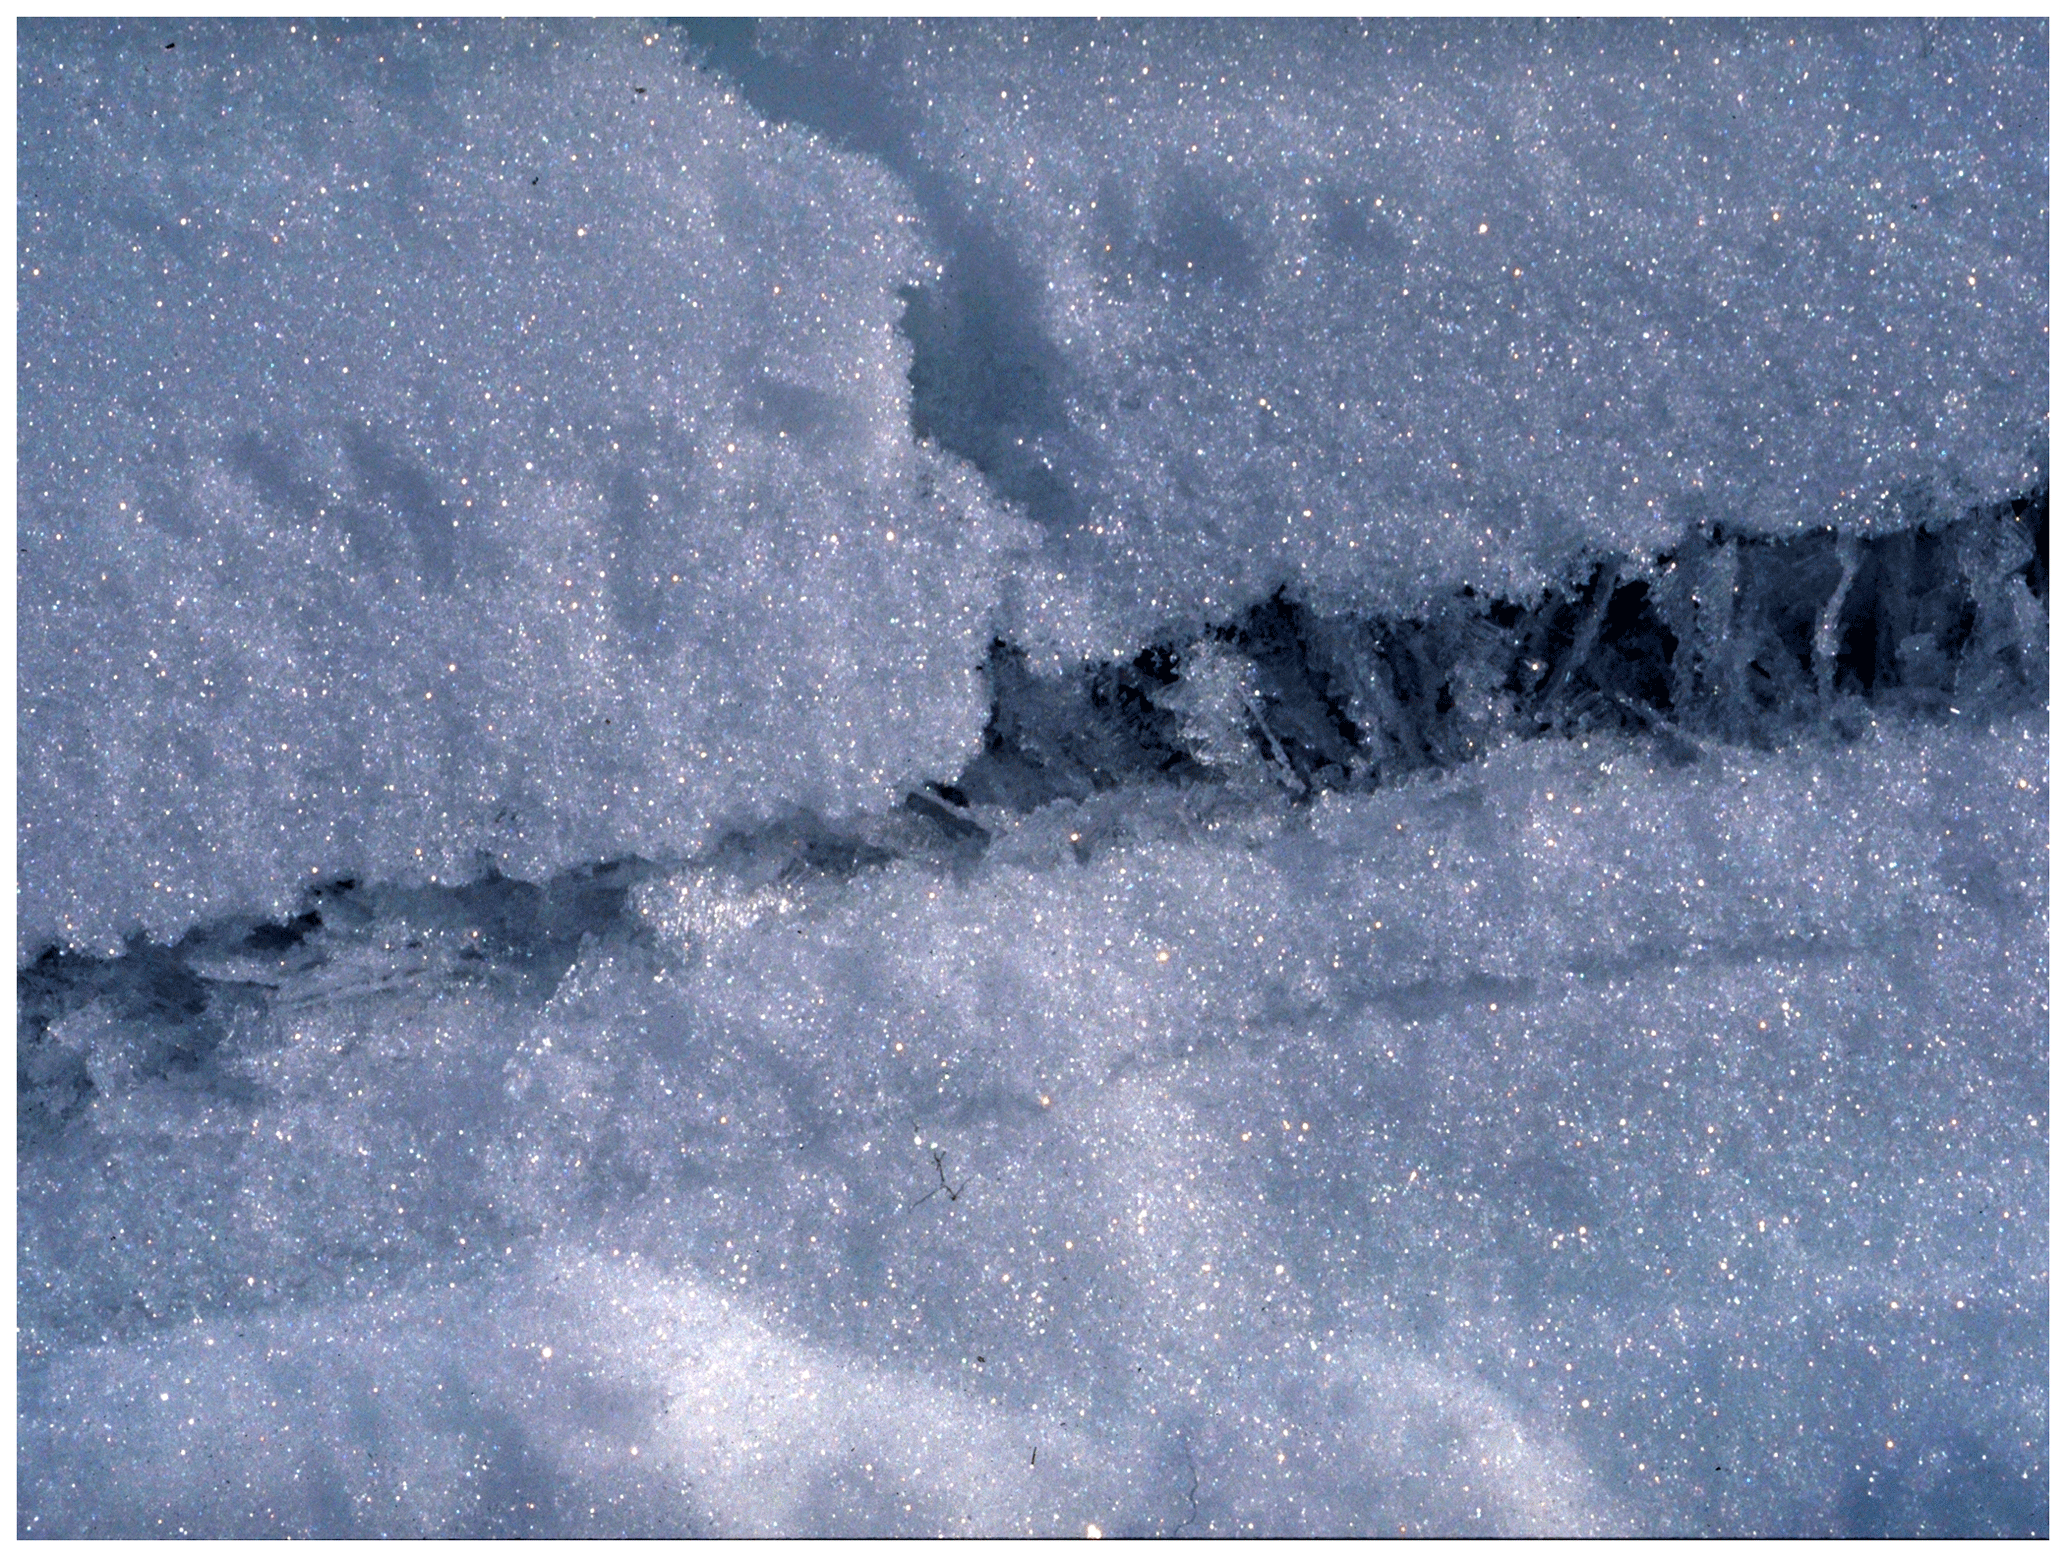
Figure 1Weak layer of buried surface hoar. Left of the vertical slab fracture the weak layer has collapsed, whereas on the right-hand side the porous weak layer is still intact. Reprinted from the Journal of Glaciology (Jamieson and Schweizer, 2000) with permission of the International Glaciological Society.
To evaluate stability indices or fracture mechanics criteria, a model of the stress distribution within the snowpack and especially the weak layer is needed. Using the exact solution for a concentrated load on a homogeneous semi-infinite plate, Föhn (1987) proposed a model for the stress distribution below a skier. A first interface model with shear for snowpacks with weak layers was proposed by McClung (1979). Linear elastic finite element analyses have shown that the effect of layering can play an important role (Schweizer, 1993; Habermann et al., 2008). This was accounted for in the model of Monti et al. (2015) by using an equivalent homogenized snow layer with an effective uniform Young modulus and a modified total slab thickness. Shear-lag models consider only the extensional stiffness of the slab above the weak layer. Considering the complex microstructure of snow, micromechanical models derive the macroscopic constitutive behavior from representative volume elements (Nicot, 2004a, b). Similarly, discrete element models assemble the continuum from individual particles to model the effective structural response (Gaume et al., 2015, 2017). To account for bending deformation, beam models using Euler–Bernoulli beam kinematics (Heierli and Zaiser, 2006) and Timoshenko beam kinematics (Heierli and Zaiser, 2008; Heierli et al., 2008) were proposed. The latter accounts for shear deformation of the slab and thus for the low shear stiffness of cohesive snow. In such models, the slab bending stiffness controls the load distribution. It increases in a cubic relation with slab thickness, whereas the extensional stiffness considered in shear-lag models only changes proportionally with slab thickness. Hence, beam models cover bridging effects (Schweizer and Camponovo, 2001; Schweizer and Jamieson, 2003; Thumlert and Jamieson, 2014). Bridging effects show that stiff and thick layers above a weak layer can distribute loads more evenly, leading to smaller stresses in the weak layer. However, the effect of weak-layer compliance in the normal direction is unaccounted for in the aforementioned beam models (Heierli and Zaiser, 2008). The snowpack is assumed to rest on a rigid weak layer, and only slab deformation in the region of the collapsed weak layer is modeled. Yet, it is known that the deformation of the weak layer is crucial for deformations and the local load transfer in the snowpack (Reiweger and Schweizer, 2010). Chiaia et al. (2008) and Gaume et al. (2013) consider weak-layer deformability only in shear.
In the first part of this two-part contribution, a novel modeling approach for the description of weak-layer failure is given. It aims at providing a model that fully accounts for the weak layer's effect on deformations and load transfer and solutions to the mixed-mode energy release rates of cracks within the weak layer. The model is validated using finite element analyses and field experiments. In the second part we propose a new failure criterion that physically links stability indices and fracture mechanics models. Here, the necessary distinction of the strength of materials and fracture mechanics approaches is highlighted and discussed.
Deformation, stresses and consequently the energy release rate of cracks within the weak layer are controlled by loading and the complete stratigraphy of the snowpack. Deformations of the slab and in particular of the weak layer must be described in a sufficiently accurate manner. The slab is loaded in local bending and stretching, which we account for using beam and rod kinematics. As in the analysis by Heierli et al. (2008) we model the slab as an elastic beam with bending and shear deformation. In order to account for weak-layer deformations, the present model rests the beam on an elastic foundation of an infinite set of springs with compressive and shear stiffness commonly referred to as the Winkler foundation. Base layers are assumed rigid. The model provides slab deformations, weak-layer normal and shear stresses, and the energy release rate of cracks. Skier penetration is not considered. Like other models given in the literature and discussed above we employ linear elasticity and neglect, e.g., viscous or plastic deformations. Consequential limitations are discussed in Sect. 4.
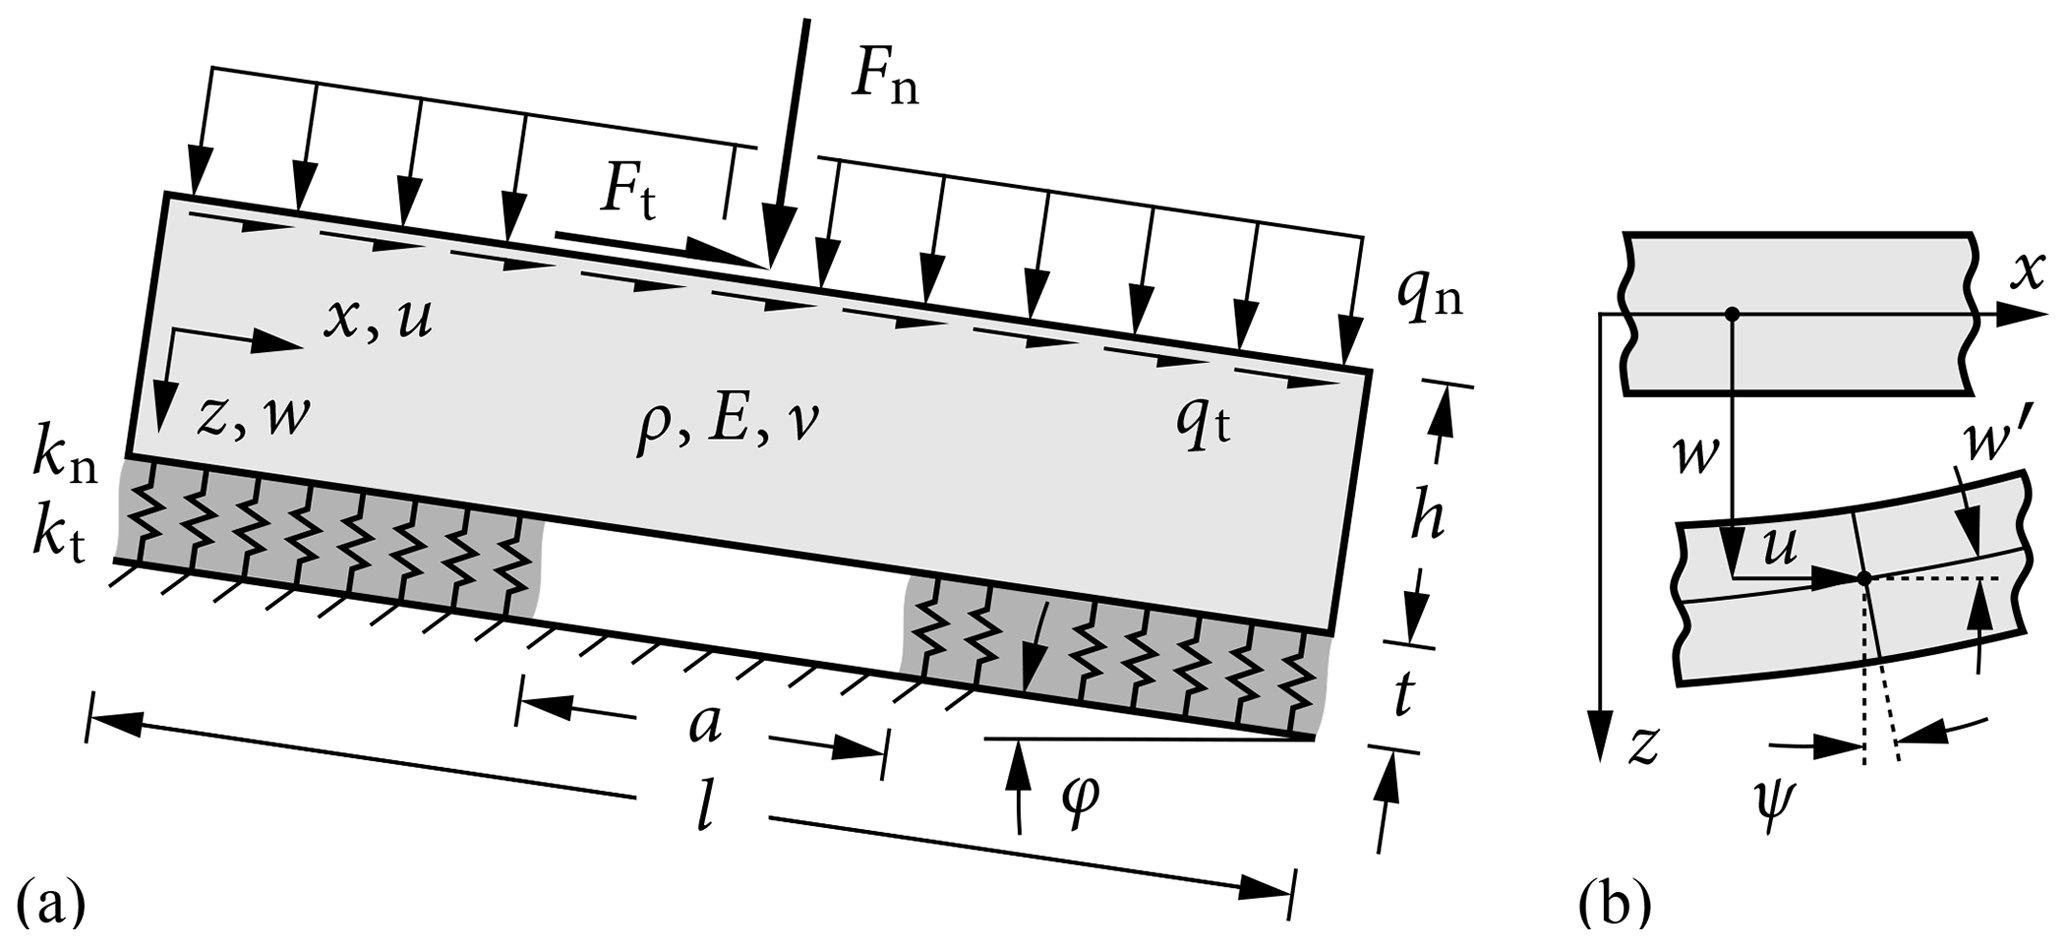
Figure 2Snowpack modeled (a) as a beam on an elastic foundation of an infinite set of shear and compressive springs (b) using Timoshenko beam kinematics.
2.1 Governing equations
Consider the snowpack model on an inclined slope of angle φ depicted in Fig. 2a. The plane strain beam representing the snow slab has an out-of-plane thickness b, height h and length l. The weak-layer thickness is denoted by t. The slab is assumed to be homogeneous with Young's modulus E, Poisson's ratio ν and density ρ. The snow slab is loaded by its own weight prescribed as distributed loads qt=ρghb sin (φ) in the tangential x direction and qn=ρghb cos (φ) in the normal z direction, where g is the acceleration of gravity. Additional loading (e.g., by the weight force of the mass m of a skier, snowmobile or others) is represented by a concentrated force , where lo is the effective out-of-plane length of the object such as the length of skis. F is split into normal and tangential concentrated forces Fn=Fcos (φ) and Ft=Fsin (φ), respectively. The weak layer of thickness t consists of an infinite set of springs with compressive stiffness and shear stiffness with the shear modulus . Cracks within the weak layer are modeled by removing the support of the beam on the crack length a.
Timoshenko kinematics for the beam allow for shear deformation. Initially plane beam cross sections may rotate by an angle ψ (see Fig. 2b) yet remain plane during deformation, which yields the general deformation kinematics of the beam:
where u is the horizontal displacement and w the vertical deflection of the beam middle plane, respectively. The index z is introduced to distinguish between midplane deformations u(x) and w(x) and the actual displacement fields uz(x,z) and wz(x,z).
Enforcing equilibrium of forces and moments and using the laws of elasticity allows for deriving a set of ordinary differential equations (ODEs) with constant coefficients that describe the deformation of the snow slab (see Appendix A). The horizontal displacement u is obtained from
where A=hb is the snow slab cross section. The vertical beam deflection w and the rotation of the beam cross section ψ are described by
where is the shear correction factor for rectangular cross sections and is the moment of inertia with respect to the y axis.
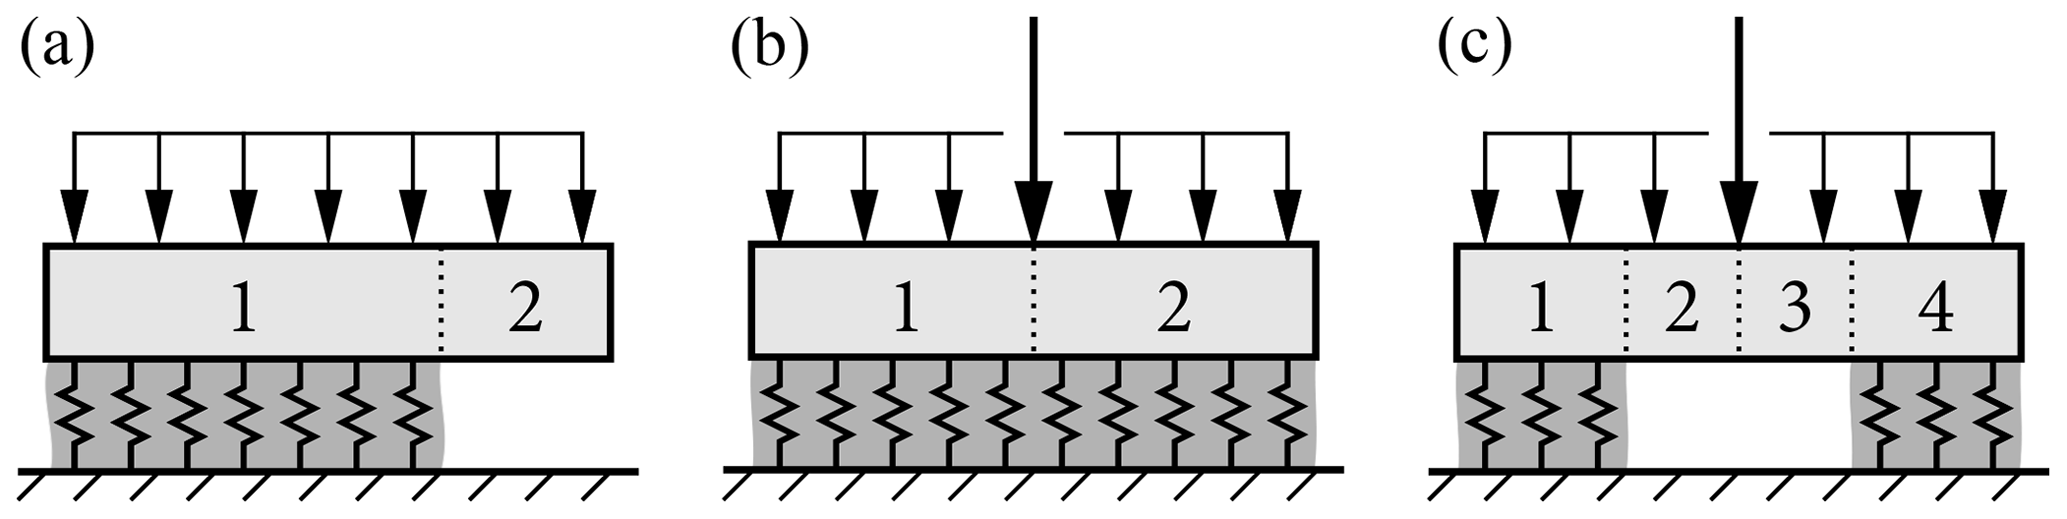
Figure 3Snowpack configurations assembled from beam segments with boundary and transmission conditions: (a) PST, (b) skier load on the intact weak layer, (c) skier load on the weak layer with a crack. Weak-layer cracks are modeled by removing the support of the beam. For the sake of clarity only vertical loads are shown.
The general solution of ODE (2) for the horizontal displacement is given by
with the eigenvalue
The free constants c1 and c2 must be determined from boundary conditions. The solution of the coupled ODEs (Eqs. 3 and 4) is of an exponential type as well. Depending on the material parameters, the eigenvalues of this solution may become real or complex. When knEI≥(4(κGA)2), the eigenvalues are real numbers,
and the general solution is given by
If knEI<(4(κGA)2), the eigenvalues are complex and read
In this case the general solution of the normal deflection is given by
Again, the constants c3 to c6 must be determined from boundary conditions.
For regions without the elastic foundation, e.g., above a crack or when modeling propagation saw tests (PSTs), we obtain , and the differential equations simplify to
The corresponding solutions are given by
As before, the free constants must be determined from boundary conditions which are defined by the final assembly of the solution.
2.2 Assembling the solution
The present model readily applies to an inclined skier-loaded snowpack with or without a crack in the weak layer as well as to propagation saw tests. For this purpose, considered snowpack configurations must be assembled from general solutions of beam segments with or without the elastic foundation given above. The free constants are determined from boundary and transmission conditions.
To model a propagation saw test two beam segments are required as shown in Fig. 3a. The left part of the snow slab rests on an elastic foundation representing the intact weak layer. The right part is a cantilever beam where cutting has removed the weak-layer support. The slab is loaded by its own weight qn and qt. Free left and right ends require vanishing section forces and moments. Using the expressions
for the bending moment M, the lateral shear force Q and the normal force N yields
at free ends. At the transition between the unsupported and supported segments of displacements, cross-section rotation, section forces and moments must be C0-continuous. This yields
where the indices l and r denote quantities left and right of the discontinuity, respectively.
In skier-loaded snowpacks (Fig. 3b and c) the skier point load adds discontinuities of normal and transverse shear forces, and the solution is assembled from two or four regions. Skier-loaded slopes extend far beyond the influence zone of local skier loading. Hence, we have chosen a length of 25 times the thickness of the slab (l=25h) to avoid any edge effects. Of course, shorter slabs can also be modeled to account for the resulting edge effects on the mechanical response if necessary. Again, at either end of the assembly, boundary conditions of vanishing section forces hold. At crack tips the continuity conditions Eq. (18) hold. At the concentrated skier load the transmission conditions must be modified according to
The boundary and transmission conditions for the respective load case provide a linear system of equations with up to 24 unknown constants. The system can be solved easily using any mathematical toolbox. Closed-form solutions for u, w and ψ can then be given in piecewise form.
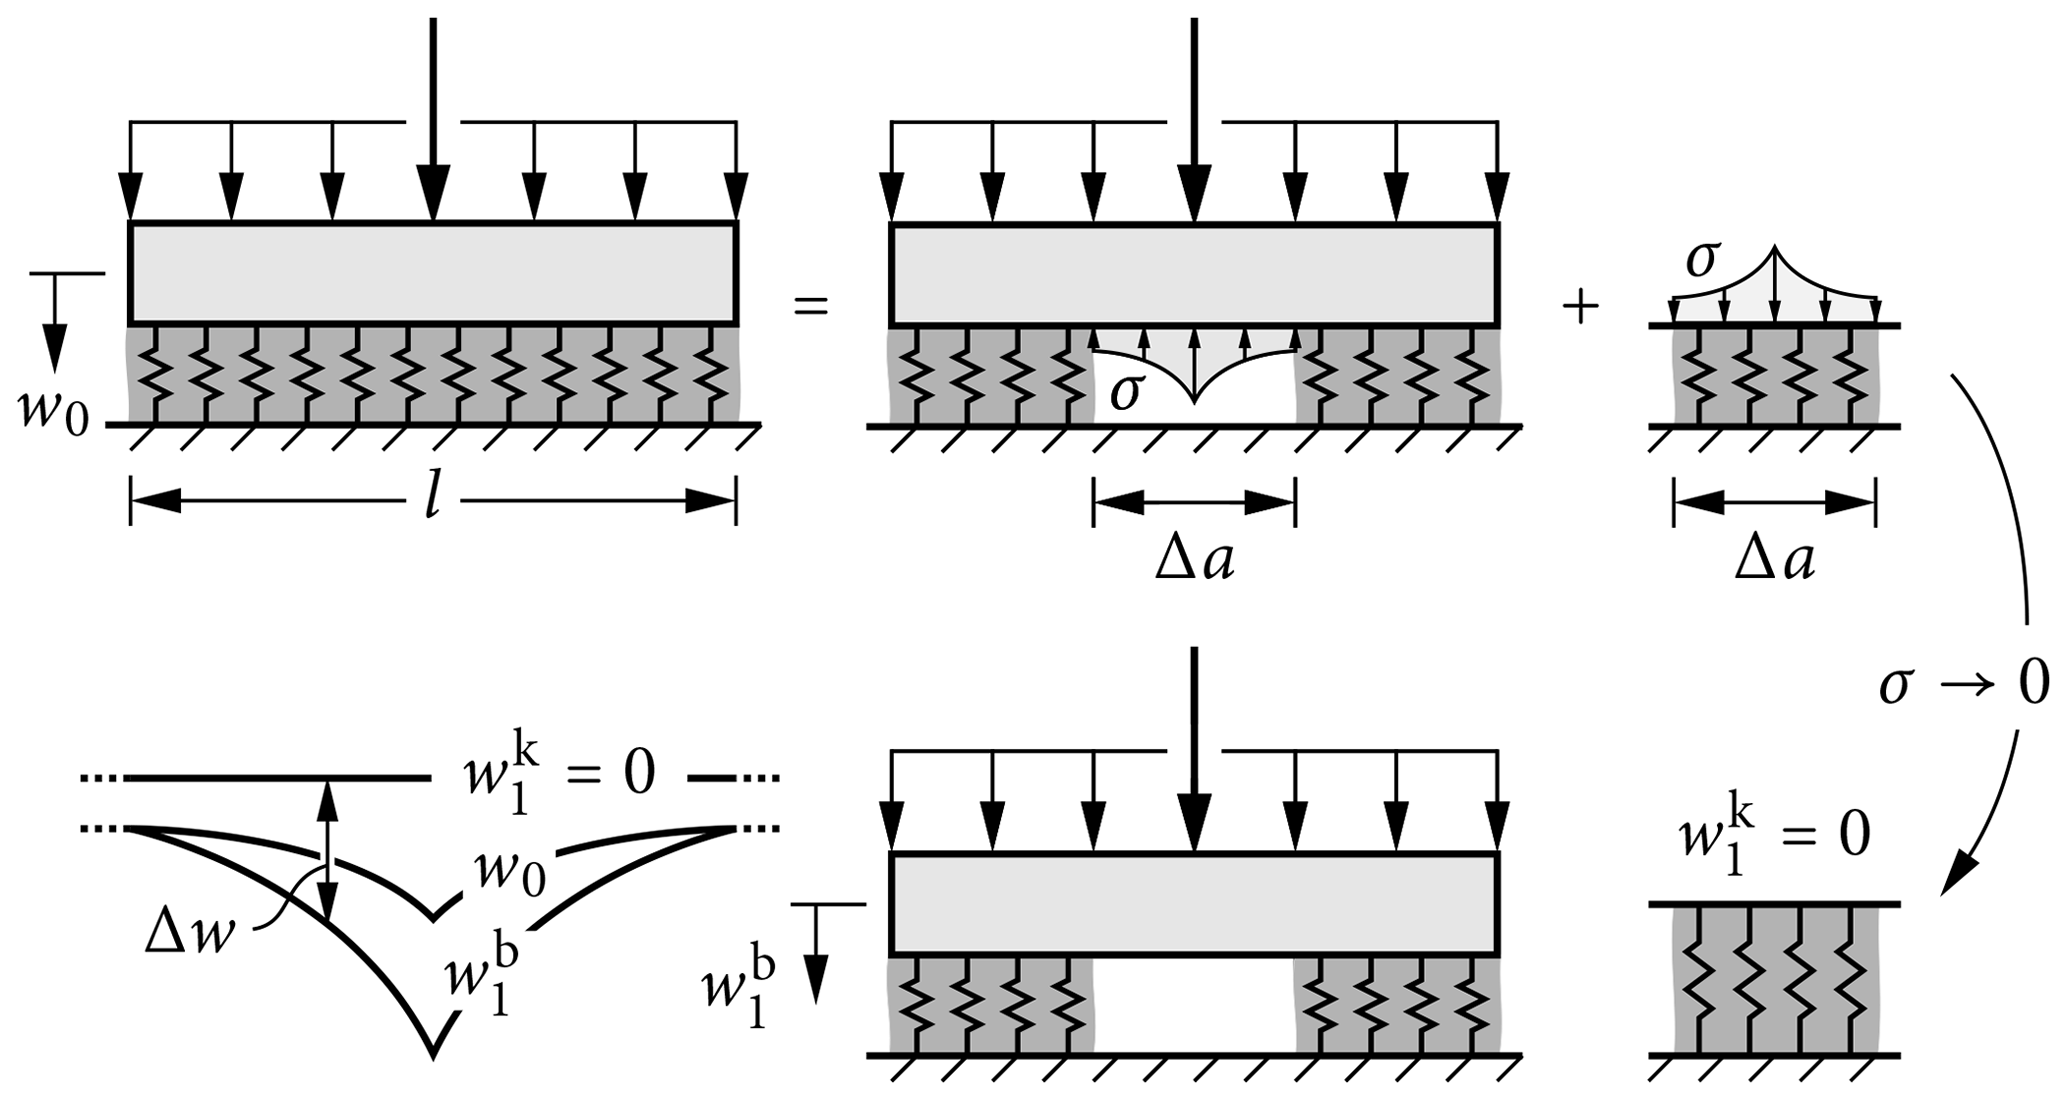
Figure 4Graphical representation of the mode I crack opening integral. An uncracked snowpack can be represented by removing a part of the weak layer and applying virtual stresses to both the slab and the removed weak-layer segment such that they are deformed as in the original configuration (w0). Reducing the virtual stresses to zero quasi-statically increases the beam deformation (), relaxes the weak layer () and finally yields the cracked configuration. The work done by the virtual stresses (integral of σΔw on Δa) corresponds to the total potential energy difference between uncracked and cracked configurations.
2.3 Weak-layer stresses
Since the weak layer is represented as an elastic Winkler foundation, also known as the weak interface model (Lenci, 2001), it is not modeled as a complete continuum. Instead, it only transfers compressive and lateral shear loads. In this simplified continuum, the stress interaction is simplified and compressive and shear stresses are uncoupled. Using calculated slab displacements w in the normal and u in the tangential direction, stresses are obtained from
Weak interface approaches are well established in structural analysis (Krenk, 1992; Selvadurai, 1979), in particular when strong elastic contrasts are present. Stress solutions are generally of good quality. However, highly localized effects such as stress singularities cannot be captured. The effect of this limitation is discussed in Part 2 of this work.
2.4 Fracture mechanical quantities
Fracture mechanics (Broberg, 1999; Anderson, 2017) is concerned with the behavior of cracks in continua. Propagation of existing cracks can be described in terms of energy considerations which allow for an assessment of the stability of cracks. If the change in total potential energy dΠ with an infinitesimal crack advance da (denoted as the differential energy release rate) equals the fracture toughness
the crack will grow. This fundamental condition is called the Griffith criterion. The fracture toughness describes the energy required for formation of a new crack surface of unit area. It comprises surface energy as well as dissipative energy terms. The latter render fracture processes irreversible. The fracture toughness is defined within the continuum framework. That is, it efficiently covers all local failure mechanisms on the microscale – even for complex and heterogeneous materials.1
Within the framework of weak interface models the energy release rate corresponding to infinitesimal crack growth can be obtained from the local strain energy (see Krenk, 1992). For mode I and mode II, contributions to the energy release rate
hold. Here, w(a) and u(a) correspond to displacements at the crack tip. Again, this simplified framework typically provides good results, but it does not capture certain effects such as the energy release rate of vanishing crack lengths (see discussion in Fig. 4).
We distinguish different crack opening modes. Mode I loading is a crack opening mode normal to the crack faces. Strictly speaking this comprises only symmetric deformations, which typically does not hold for cracks along material discontinuities with different stiffnesses. Mode II and III are shear crack modes with tangential displacements of the two crack faces. In this work only modes I and II are considered. Following the concept of anticracks (Heierli and Zaiser, 2008) we extend the mode I definition to general deformation normal to the crack faces. Normal deformations include tearing deformations of the crack faces away from each. Additionally, they comprise collapse deformations where crack faces move towards each other. Since the microstructural failure mechanisms are of course very different for tearing and collapse, the magnitude of the associated fracture toughnesses will also be different. Hence, we must distinguish between mode I fracture toughness for tearing and mode I fracture toughness for collapse .
Loading which causes any combination of the three crack opening modes is called mixed-mode loading. Then mixed-mode failure criteria must be used to account for the different contributions to the total energy release and the required energy to extend a crack under mixed-mode conditions. This will be a subject in Part 2 of this work.
In order to extend the scope of fracture mechanics, which is only applicable to infinitesimal crack growth da, Hashin (1996) considers finite differences in crack length Δa. Then the so-called incremental energy release rate describes the difference in total potential energy ΔΠ for a finite crack increment Δa. The incremental energy release rate can also be obtained by integrating the differential energy release rate over the finite crack advance Δa:
The total differential energy release rate is the sum of contributions from different crack opening modes:
Equivalently, the total incremental energy release rate can be split into contributions from crack opening (mode I) and crack sliding (mode II):
The total potential energy difference between a cracked and an uncracked configuration can be calculated efficiently using the crack opening integral. The change in potential energy corresponds to the work done by stresses on crack flanks when reduced quasi-statically to zero as detailed in Fig. 4. The mode I and II contributions amount to
Using the stress-to-displacement relation (20) obtained from the snowpack model and Eq. 23 yields
where the indices 0 and 1 refer to uncracked and cracked configurations, respectively. Computing the incremental energy release rate for a crack of length Δa requires knowledge of the deformations of the uncracked and corresponding cracked configurations. These expressions of the incremental energy release rate can be evaluated readily using the displacement solutions of the model presented above.
The present model provides slab displacements, weak-layer stresses and energy release rates for cracks within the weak layer as closed-form analytical expressions. In order to validate the model, stresses and energy release rates are compared against detailed finite element analyses (FEAs) and existing models. Results of several parametric studies are shown in detail. Further, we compute the fracture toughness corresponding to critical cut lengths in propagation saw tests for a comprehensive set of 93 field experiments provided by Gaume et al. (2017) to investigate the capabilities of the present model.
Table 1Material properties used throughout the present work.
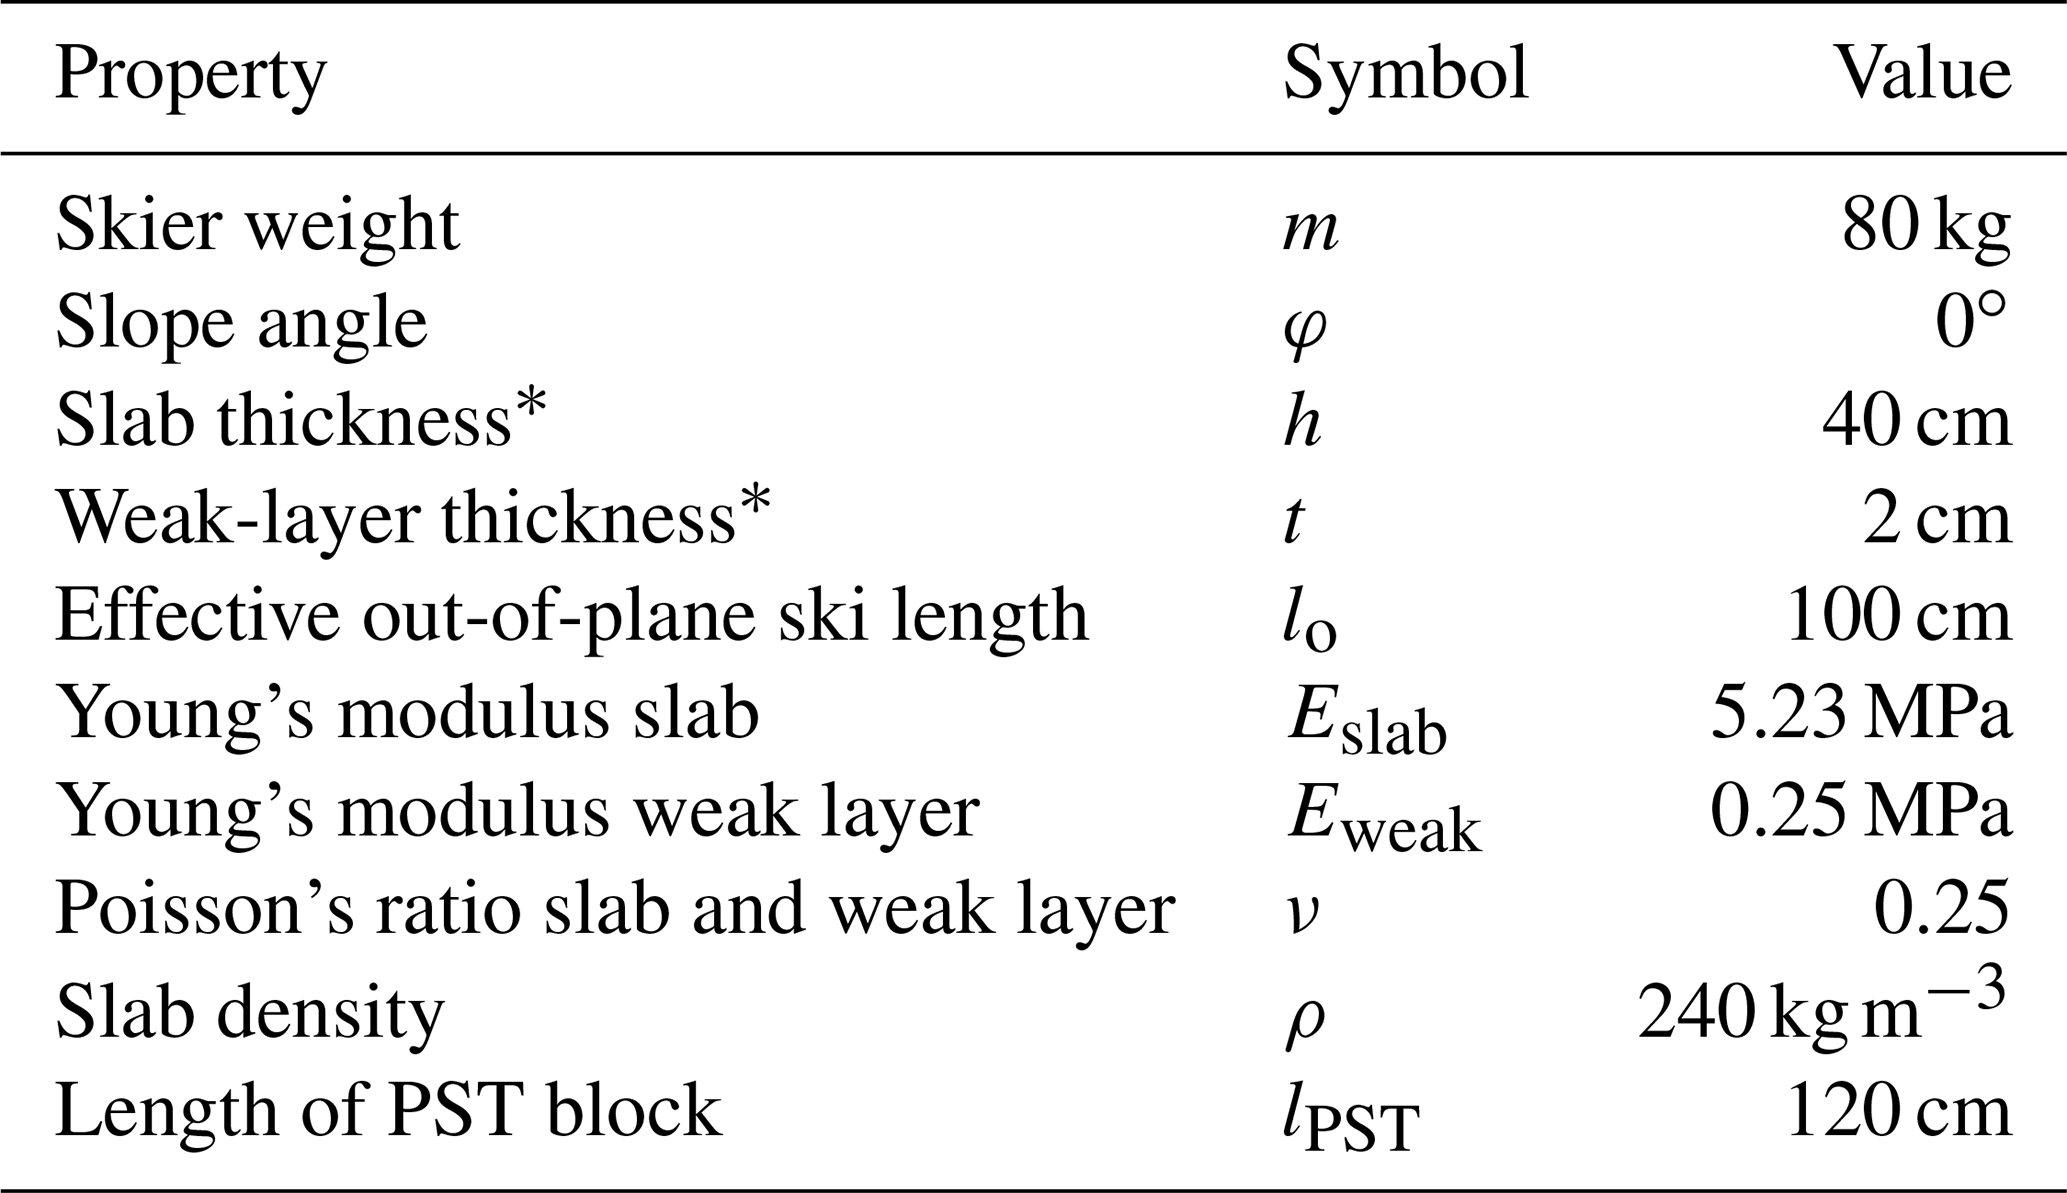
* Thicknesses are slope normal.
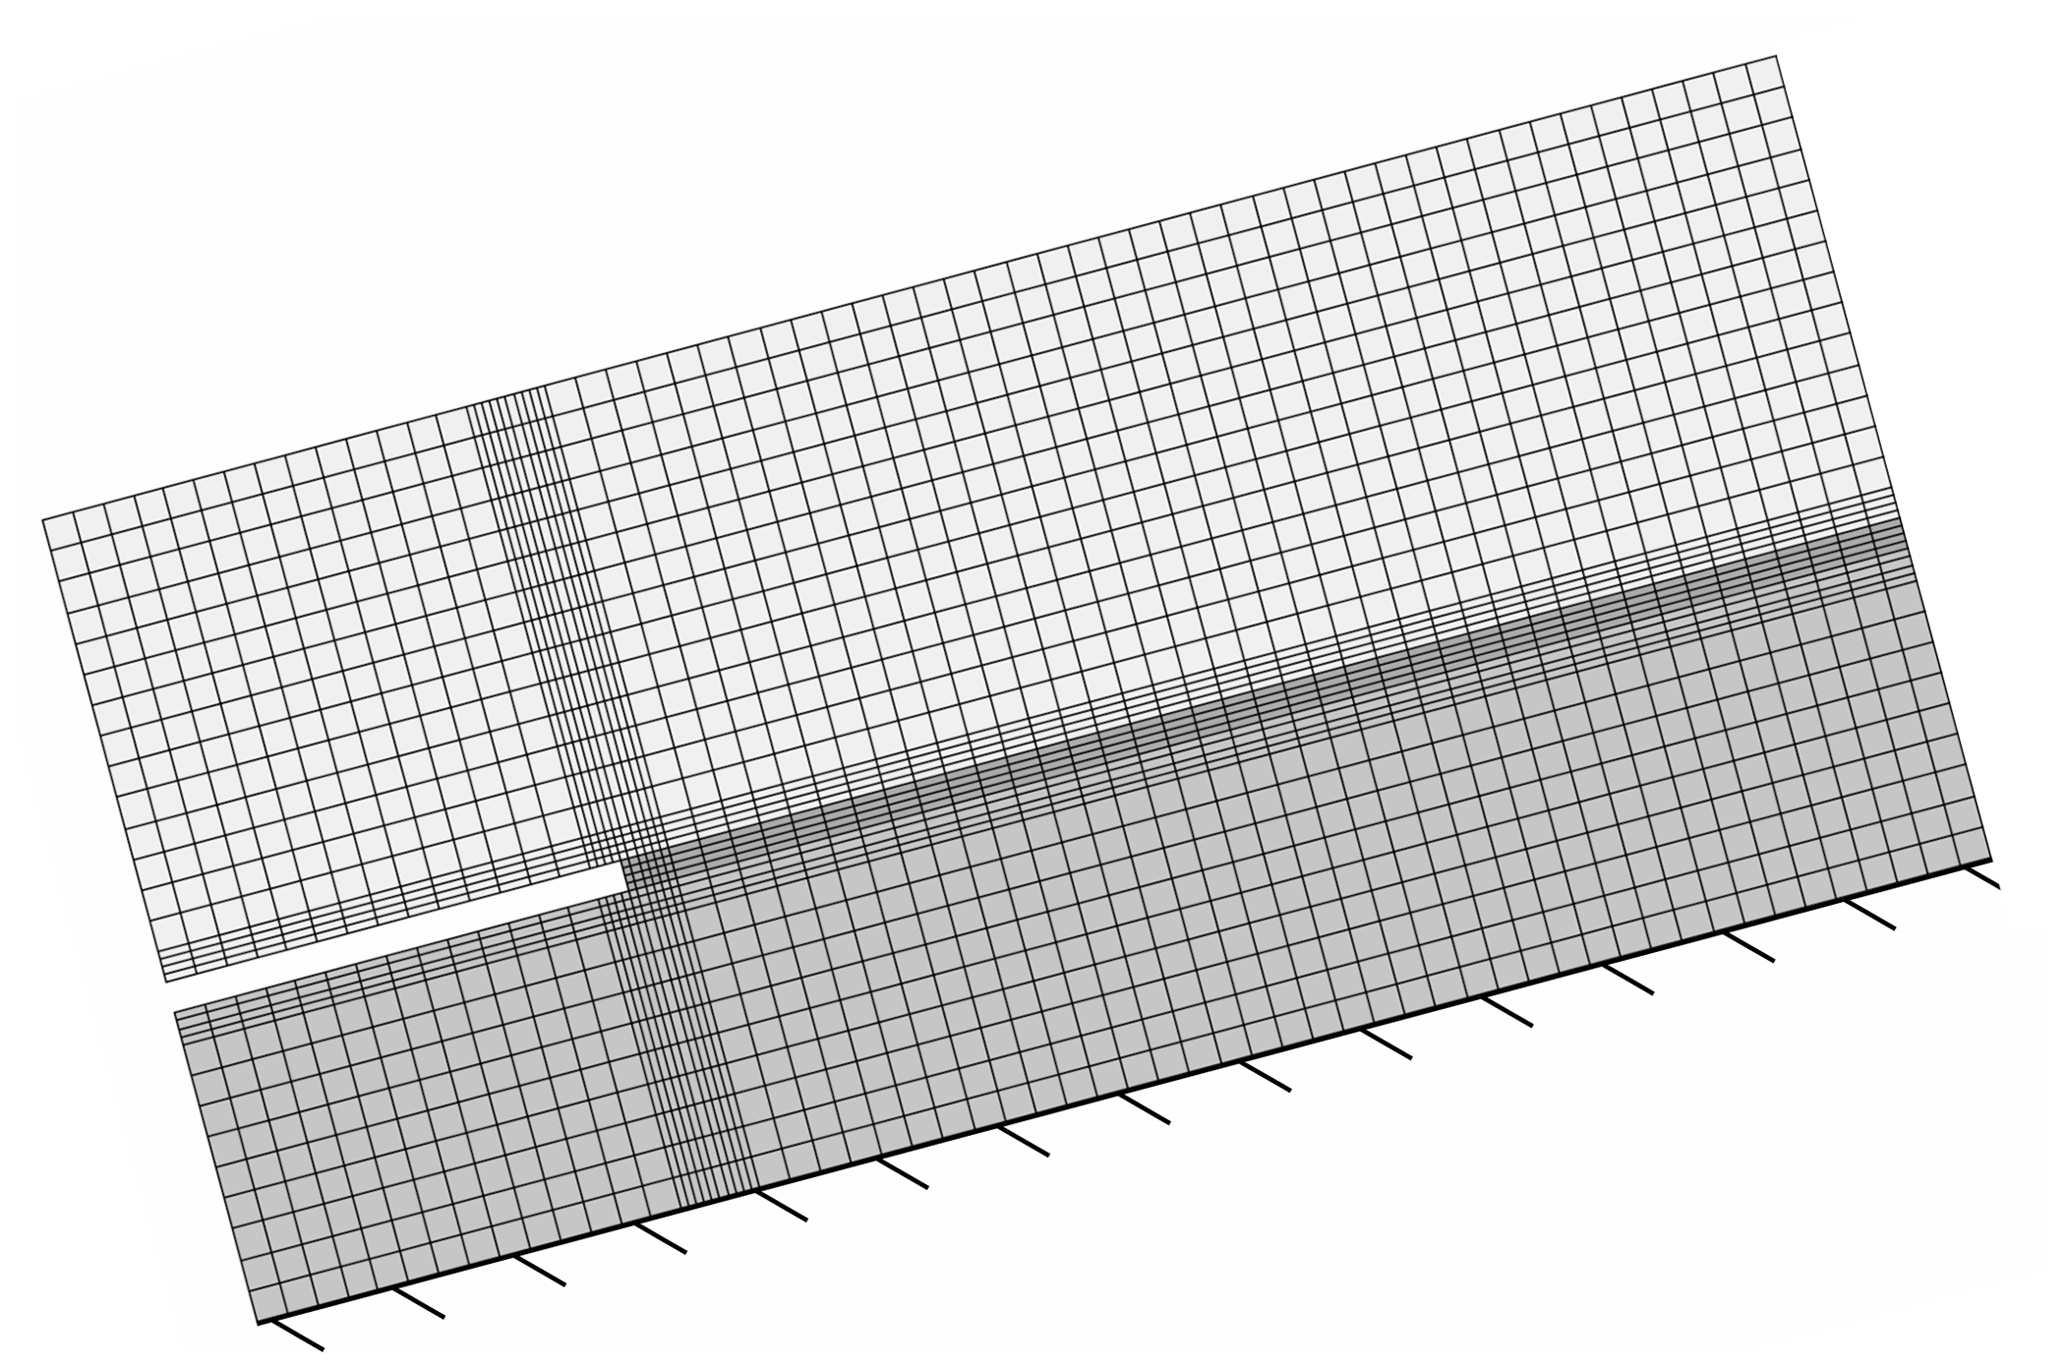
Figure 5Finite element model used for validation. Discretization of a snowpack with slab and weak layer. Cracks are introduced by removing all weak-layer elements. Skier loads are applied as vertical concentrated forces. Here, the case of a propagation saw test is shown as an example. The rigid base below the weak layer has a Young modulus of Ebase=1012 MPa.
3.1 Reference solution
Reference stress solutions and energy release rates are computed using the plane strain FEA model shown in Fig. 5. Like the reference models used by Sigrist and Schweizer (2007) and Habermann et al. (2008) it considers an inclined snowpack consisting of a homogeneous slab and a weak layer. The slab is loaded with a vertical volume gravity load. The weak layer is clamped at its bottom side. Cracks are introduced by removing all weak-layer elements on the crack length a. The mesh of biquadratic eight-node elements with reduced integration is refined towards stress concentrations. Mesh convergence of the FEA solutions has been controlled. The FEA total energy release rate of a crack of length Δa is computed according to
where the incremental energy release rate is determined using Eq. (23). In order to calculate the derivative of , the incremental energy release rate is evaluated for four different crack lengths closely around Δa. The derivative is then obtained by differentiating the interpolating cubic spline of the four values at Δa.
For the following considerations, the Young modulus is calculated from density ρ using an empirical power law fit to the data of Scapozza (2004) in plane strain conditions
with the density of ice ρ0=917 kg m−3. Note that Gerling et al. (2017) provide a different equation that is cross-validated using two different experimental methods and, therefore, likely more reliable. However, we chose Eq. (29) for comparability with previously published models.
A weak-layer Young modulus of Eweak=0.25 MPa is chosen based on the findings of Köchle and Schneebeli (2014), who report an average ratio of the weak-layer to slab Young modulus . Assuming Eq. (29) to be applicable to weak layers as well, Eweak=0.25 MPa corresponds to a weak-layer density of ρweak≈135 kg m−3. This agrees with density measurements of surface hoar layers by Föhn (2001), who reports densities (i) between 44 and 215 kg m−3 with a mean of 102.5 kg m−3 and (ii) between 75 and 252 kg m−3 with a mean of 132.4 kg m−3 using two different measurement techniques.
With reference to Jamieson and Schweizer (2000), who report weak-layer thicknesses between 0.2 and 3 cm, we chose t=2 cm. Further parameter choices are summarized in Fig. 1.
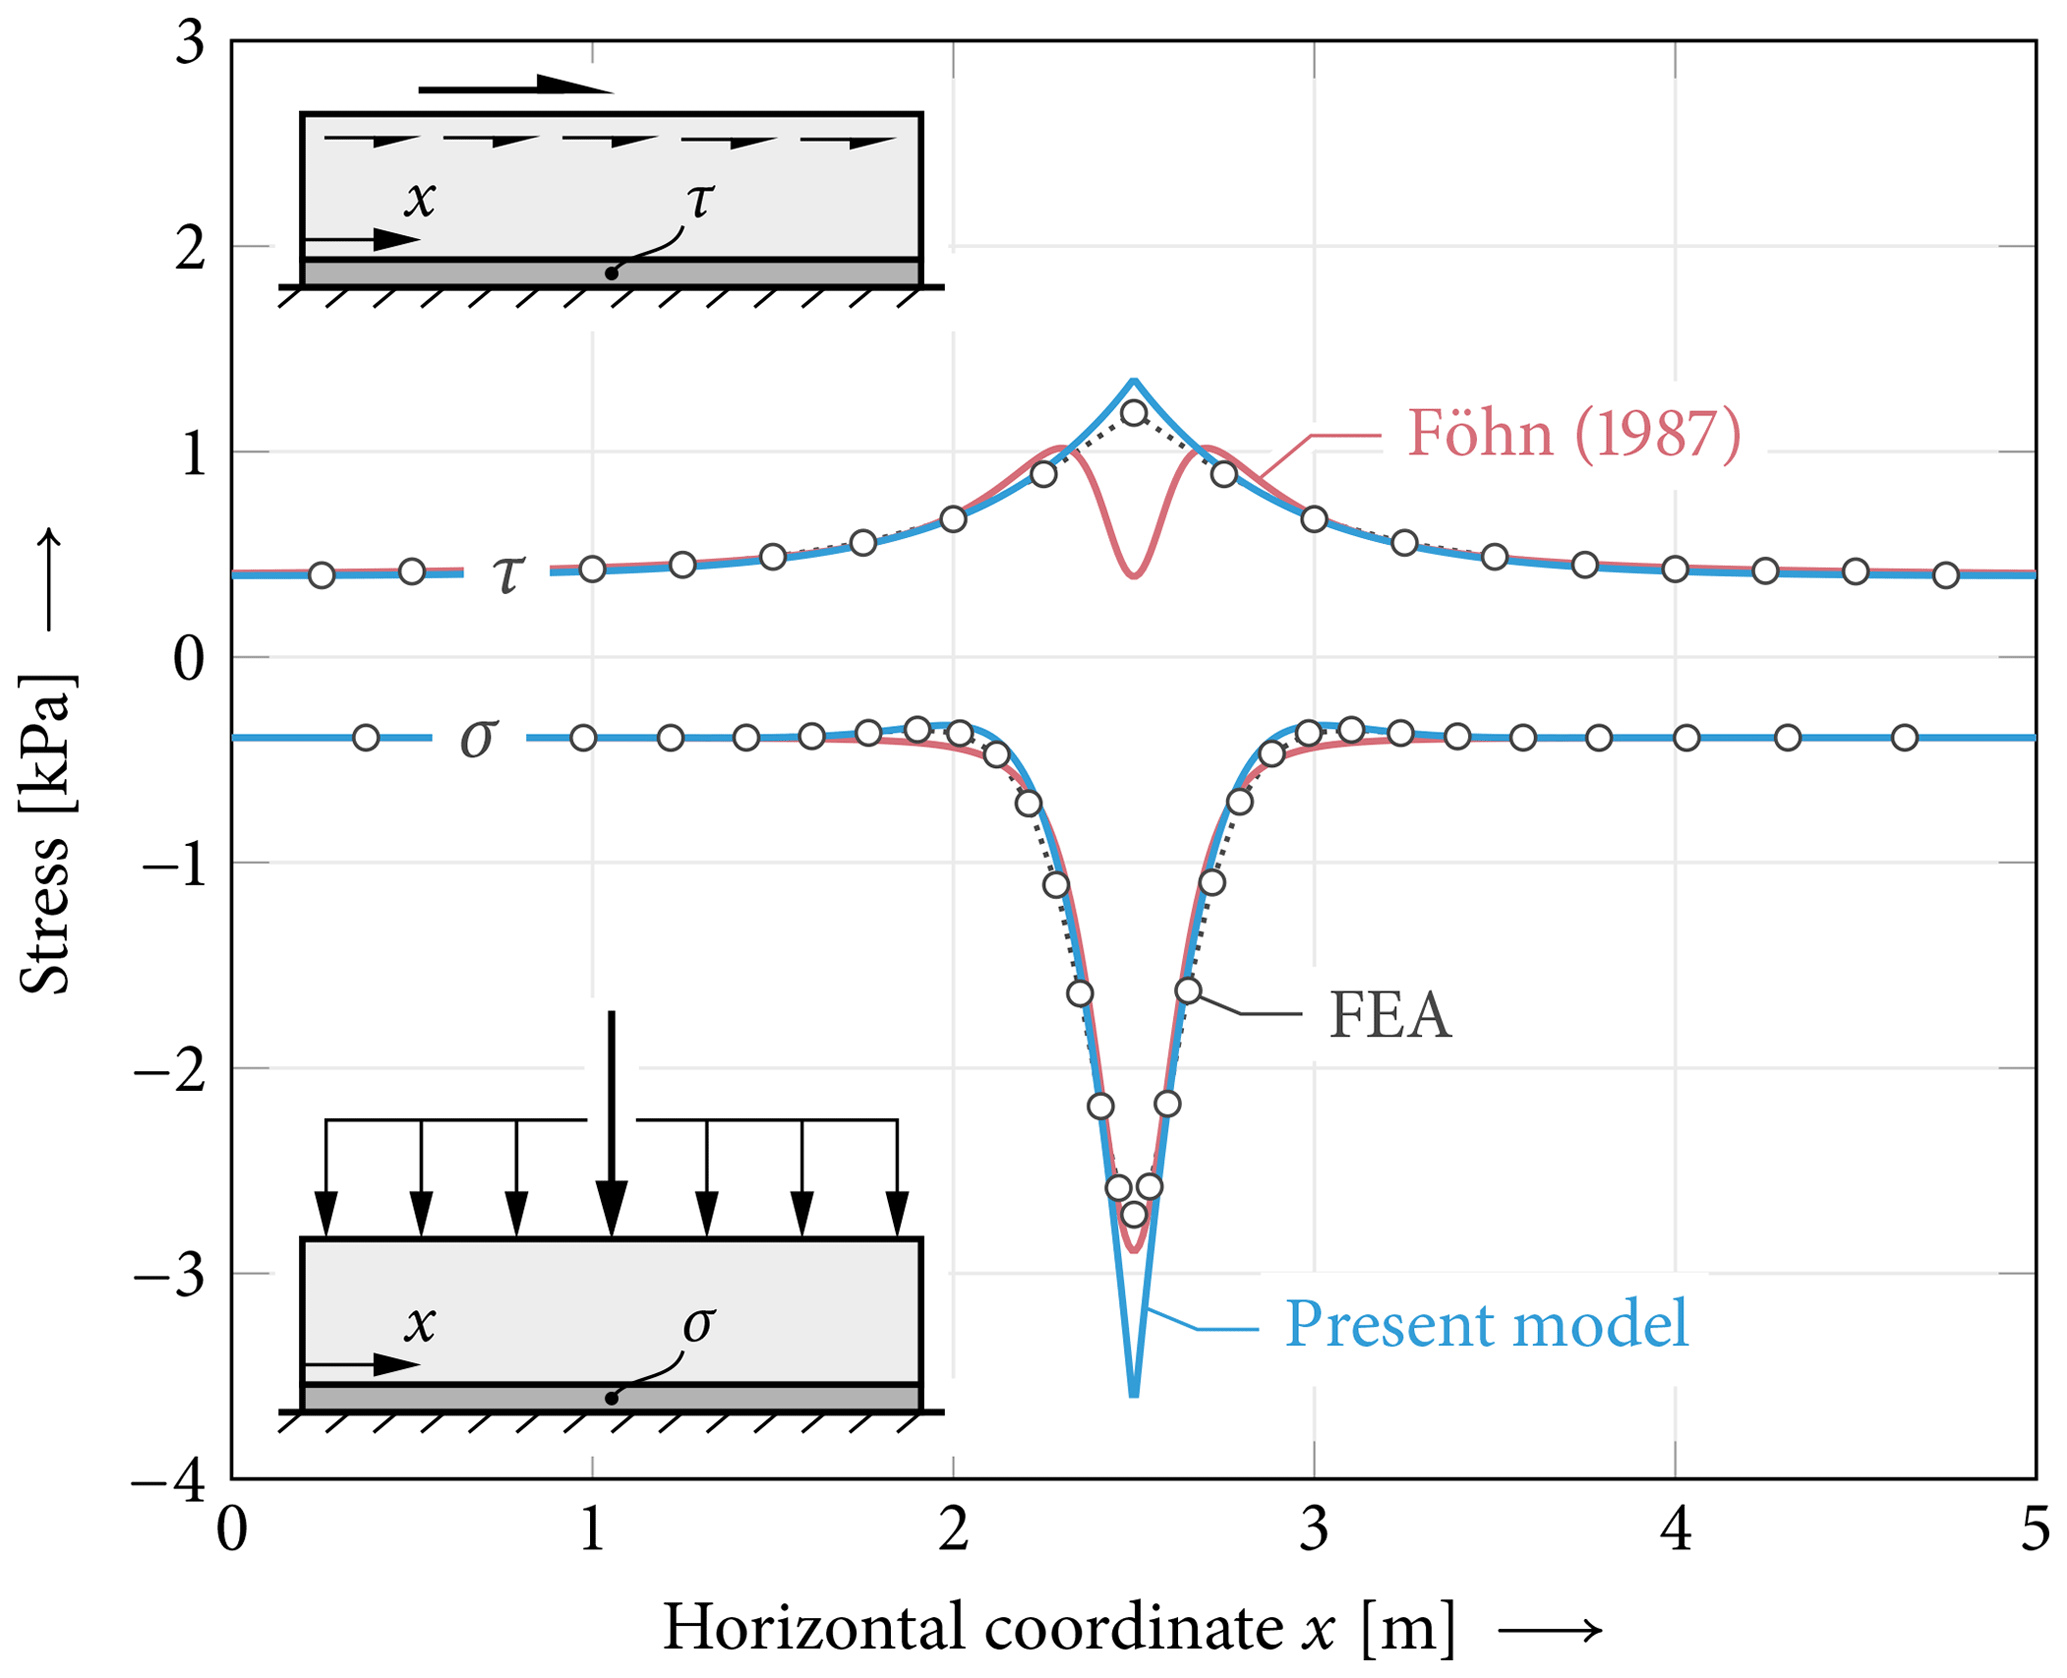
Figure 6Normal and shear stresses owing to pure vertical and pure horizontal combined skier and slab weight loading, respectively. Comparison of the present model (blue) and the Föhn (1987) model (red) to FEA results (circles). Model parameters other than h=20 cm, t=1 cm, Eslab=5 MPa, Eweak=0.15 MPa and ρ=200 kg m−3 are chosen as given in Fig. 1.
3.2 Results
Figure 6 shows weak-layer compressive and shear stresses owing to pure vertical and pure horizontal combined skier and slab weight loading, respectively. Stresses calculated using FEA, the solution by Föhn (1987) and the present model are shown. Föhn's solution for a force acting on an elastic half plane agrees particularly well with the shown FEA results in terms of normal stress. The present model agrees almost equally well and deviates only in a small region around the load point. Considering shear stress, Föhn provides an exact solution for transverse shear stresses in a homogeneous body. These stresses are zero directly below the concentrated force and peak to the left and right of it as seen in Fig. 6. Additional shear stresses arise from a horizontal displacement of the beam, which also strains the weak layer. Lateral shear stresses originating from this effect peak below the load point. Superimposing both components yields the total weak-layer shear stress obtained in FEAs. Note that lateral shear stresses owing to slope-parallel concentrated force components do not change their sign left and right of the load point as shown in Fig. 6. This is in contrast to transverse shear stresses owing to normal concentrated forces, which do change their sign. However, as discussed in Fig. 4, transverse weak-layer shear stresses are not accounted for in the present model. It considers only lateral shear where its agreement with FEA results is better than Föhn's transverse shear solution.
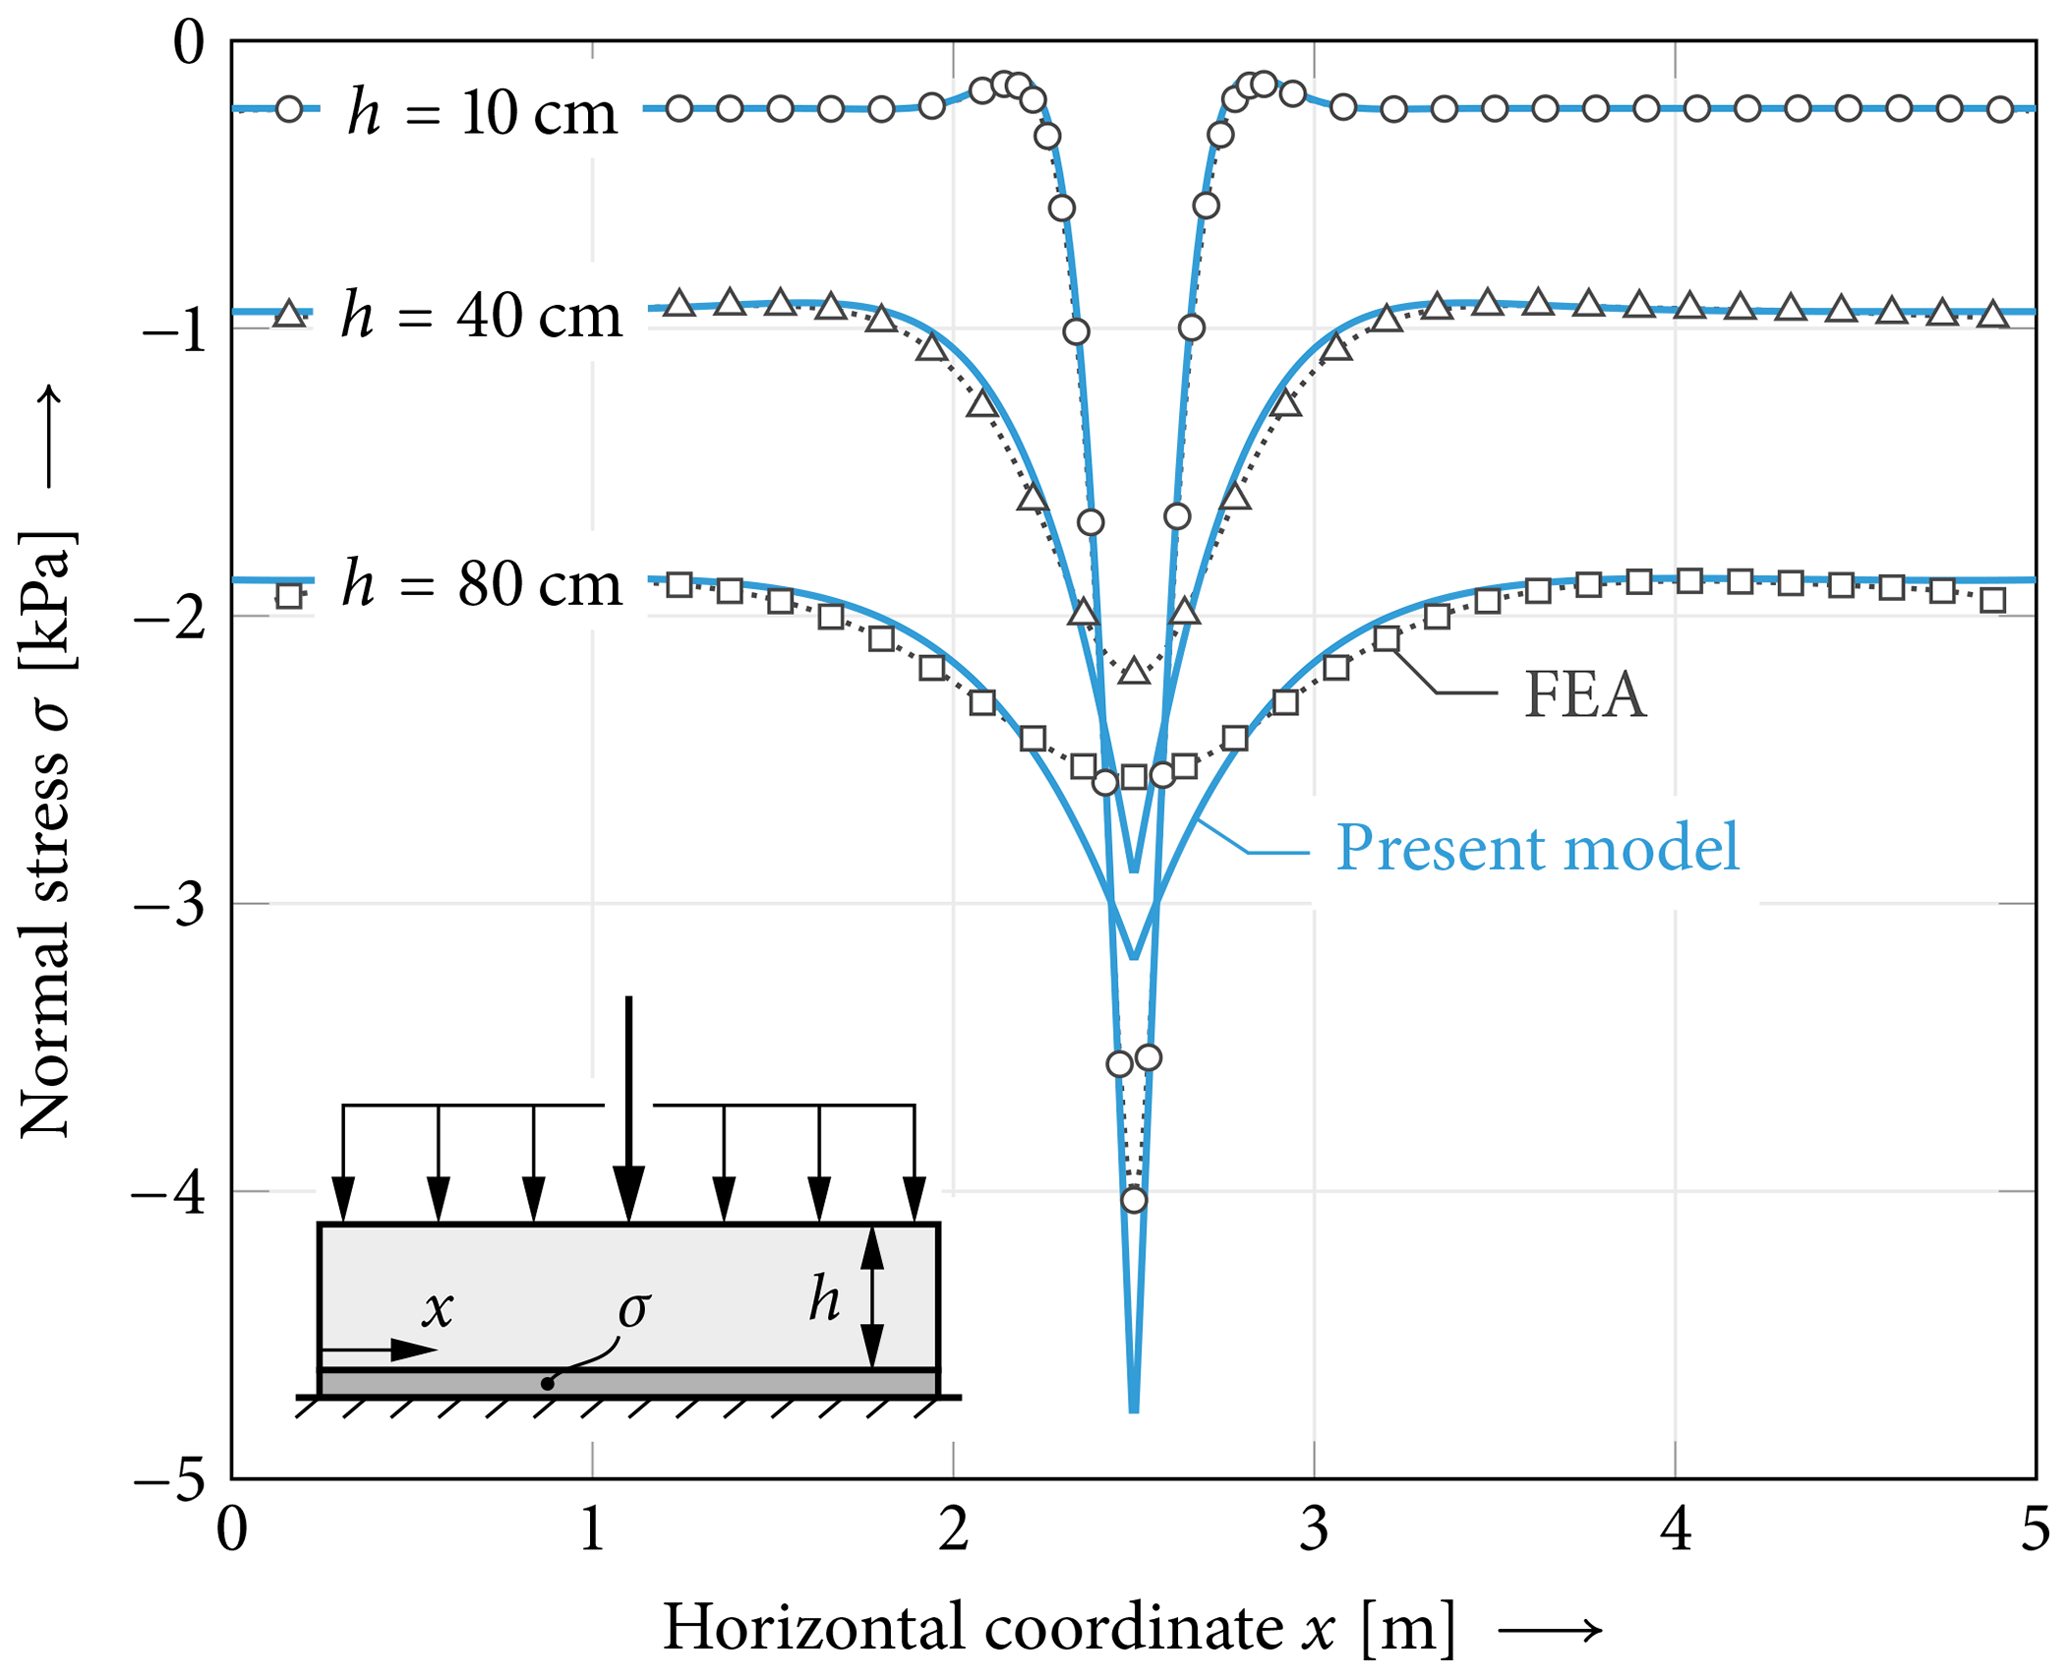
Figure 7Bridging effect evident in weak-layer normal stresses depending on the slab thickness. Peak stresses and the width of the skier-loaded snowpack changes with different slab thicknesses. Model results (solid lines) are compared against the reference solution (markers ◦, Δ, □). Model parameters are chosen as given in Fig. 1.
The bridging effect of stiff slabs is studied in Fig. 7. The results show that with thicker slabs the local loading of a skier is transferred on a wider area of the weak layer. This dependence on the slab thickness is very pronounced as the bending stiffness of the slab increases in cubic dependence with the slab thickness2. Because the weight of the slab is proportional to the slab thickness, the stress level distant from the skier increases.

Figure 8Effect of the weak-layer thickness on local weak-layer normal stresses. The weak-layer thickness changes the size of the skier-load-affected part of the weak layer and also the peak value of the stress. Thicker, more compliant weak layers distribute the load on a larger area and lead to lower peak stresses. Model results (solid lines) are compared against the reference solution (markers ◦, □). Model parameters are chosen as given in Fig. 1.
Figure 8 shows the effect of the weak-layer thickness on normal stresses in the weak layer. Two different weak-layer thicknesses are compared. For the thin weak layer we observe strong localization and high peak values, while the thick weak layer allows for point load distribution over a larger area. In comparison to FEA data, a very good agreement of the present model is evident for either thickness. Very local deviations just below the point load are observed. The Föhn (1987) model is shown for comparison. As it does not account for layering, its normal stress distribution is independent of the weak-layer thickness.
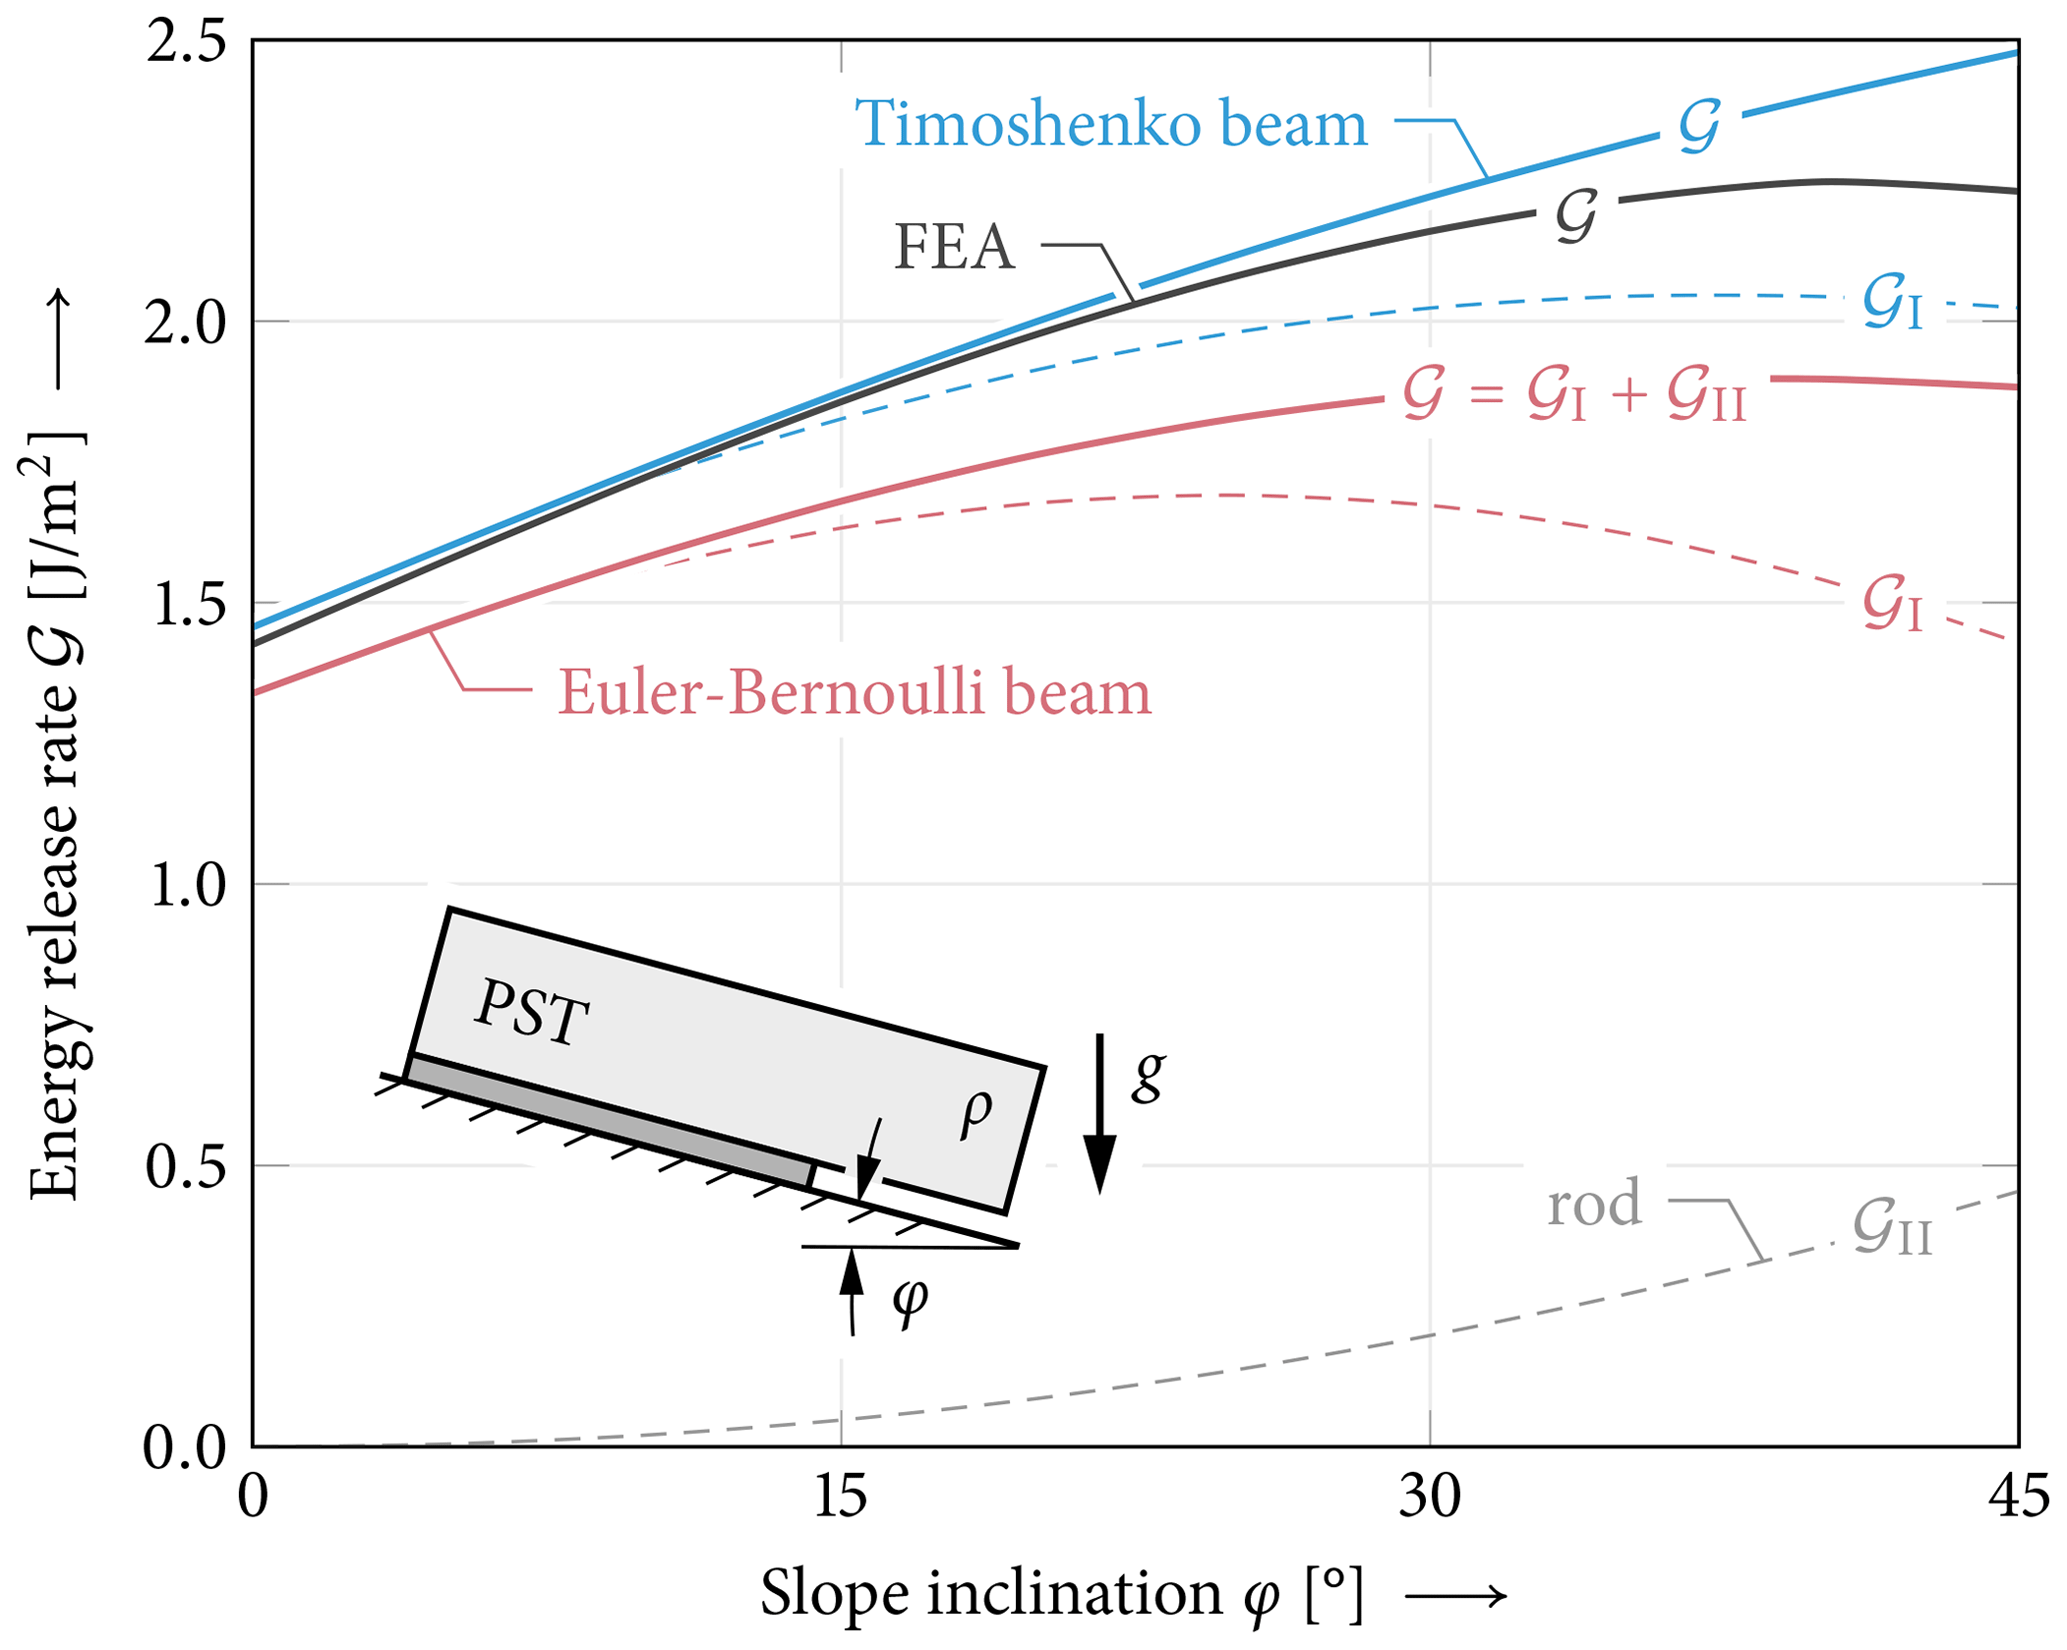
Figure 9Total, mode I and mode II energy release rates in propagation saw tests of different slope angles φ with crack length a=30 cm. Comparison of the present model using Timoshenko beam kinematics accounting for shear deformation of the slab and the classical Euler–Bernoulli beam model. The latter is recovered in the limit case of infinite shear stiffness of the beam (κGA→∞). Model parameters other than Eweak=0.15 MPa and t=5 cm are chosen as given in Fig. 1.
Let us consider the energy release rate solution. Figure 9 shows the differential mode I and II energy release rates as a function of slope angle. Besides the implemented Timoshenko kinematics, the limit case of Euler–Bernoulli beam theory is shown. In the numerical reference model only the total incremental energy release rate is evaluated. The comparison shows that for moderate slope angles the present model provides an excellent prediction of the energy release rate. While the mode I contribution of the energy release rate decreases for higher slope angles, the mode II contribution increases monotonously. Using Euler–Bernoulli beam theory underestimates the mode I contribution and hence the total energy release rate. The mode II energy release rate is a result of tangential displacements and thus unaffected by the choice of beam kinematics.
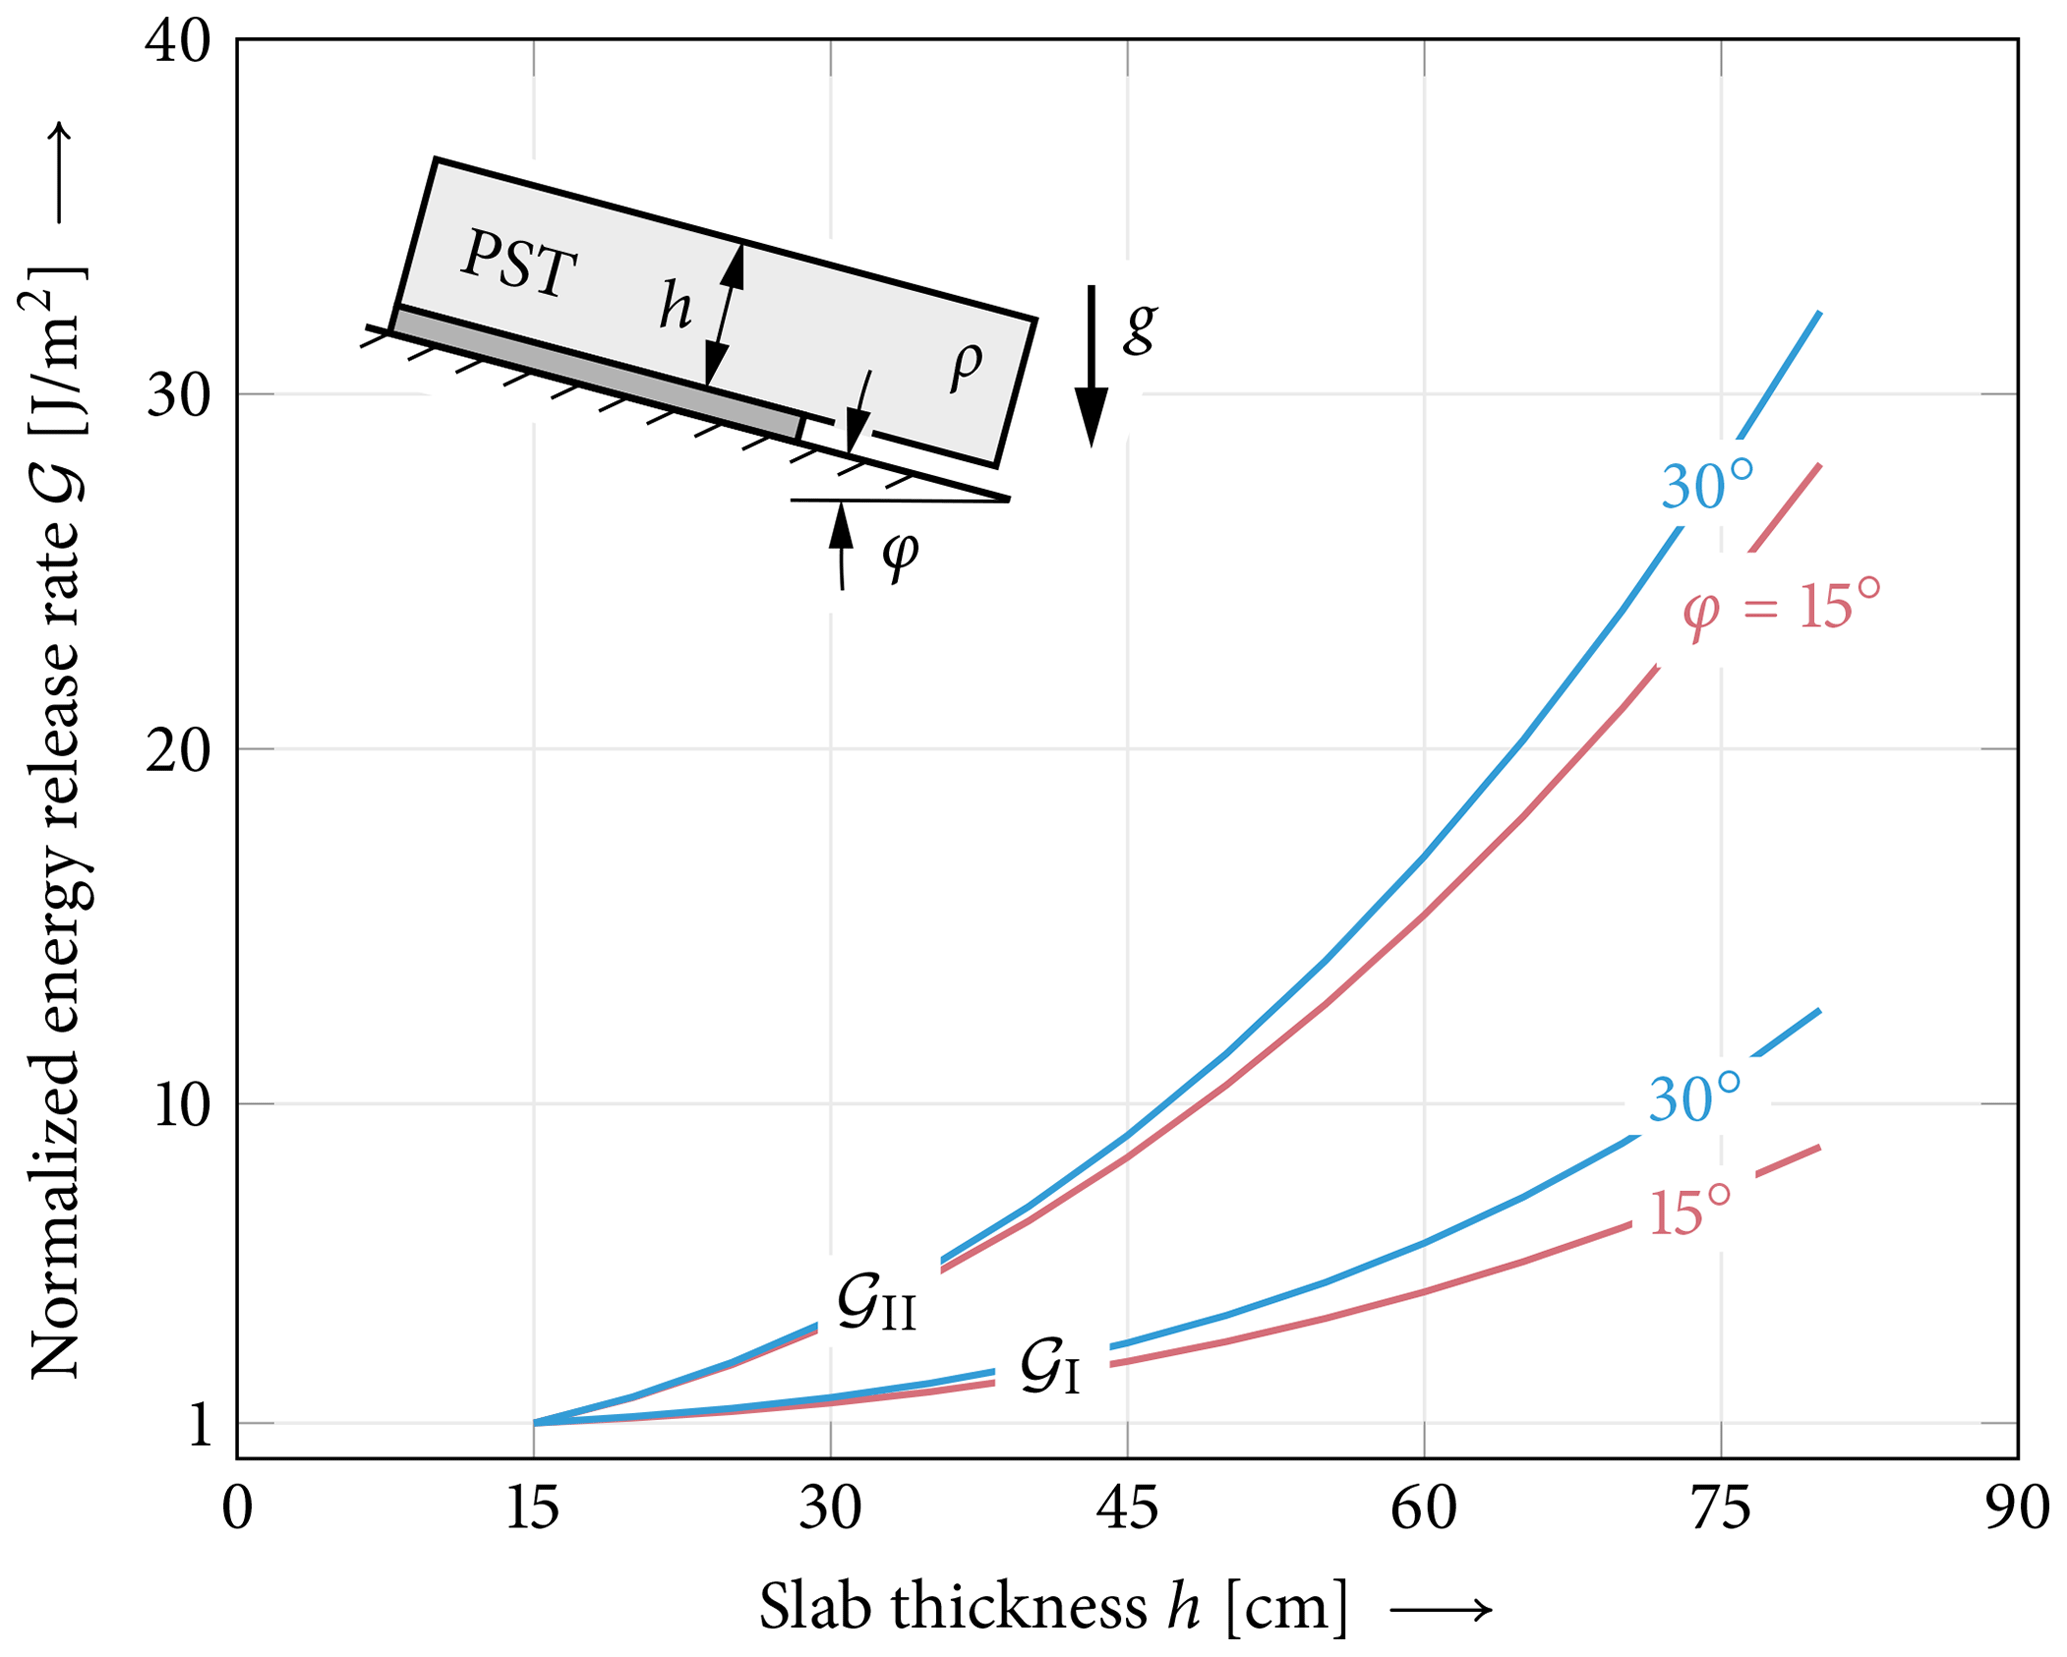
Figure 10Mixed-mode energy release rates of propagation saw test (PST) configurations. The mode I (collapse) and mode II (shear) contributions of the energy release rates of a cut length a=30 cm are shown as a function of the slab thickness. Energy release rates are normalized with the respective initial value at h=15 cm: , , and . Model parameters other than Eweak=0.15 MPa and t=5 cm are chosen as given in Fig. 1.
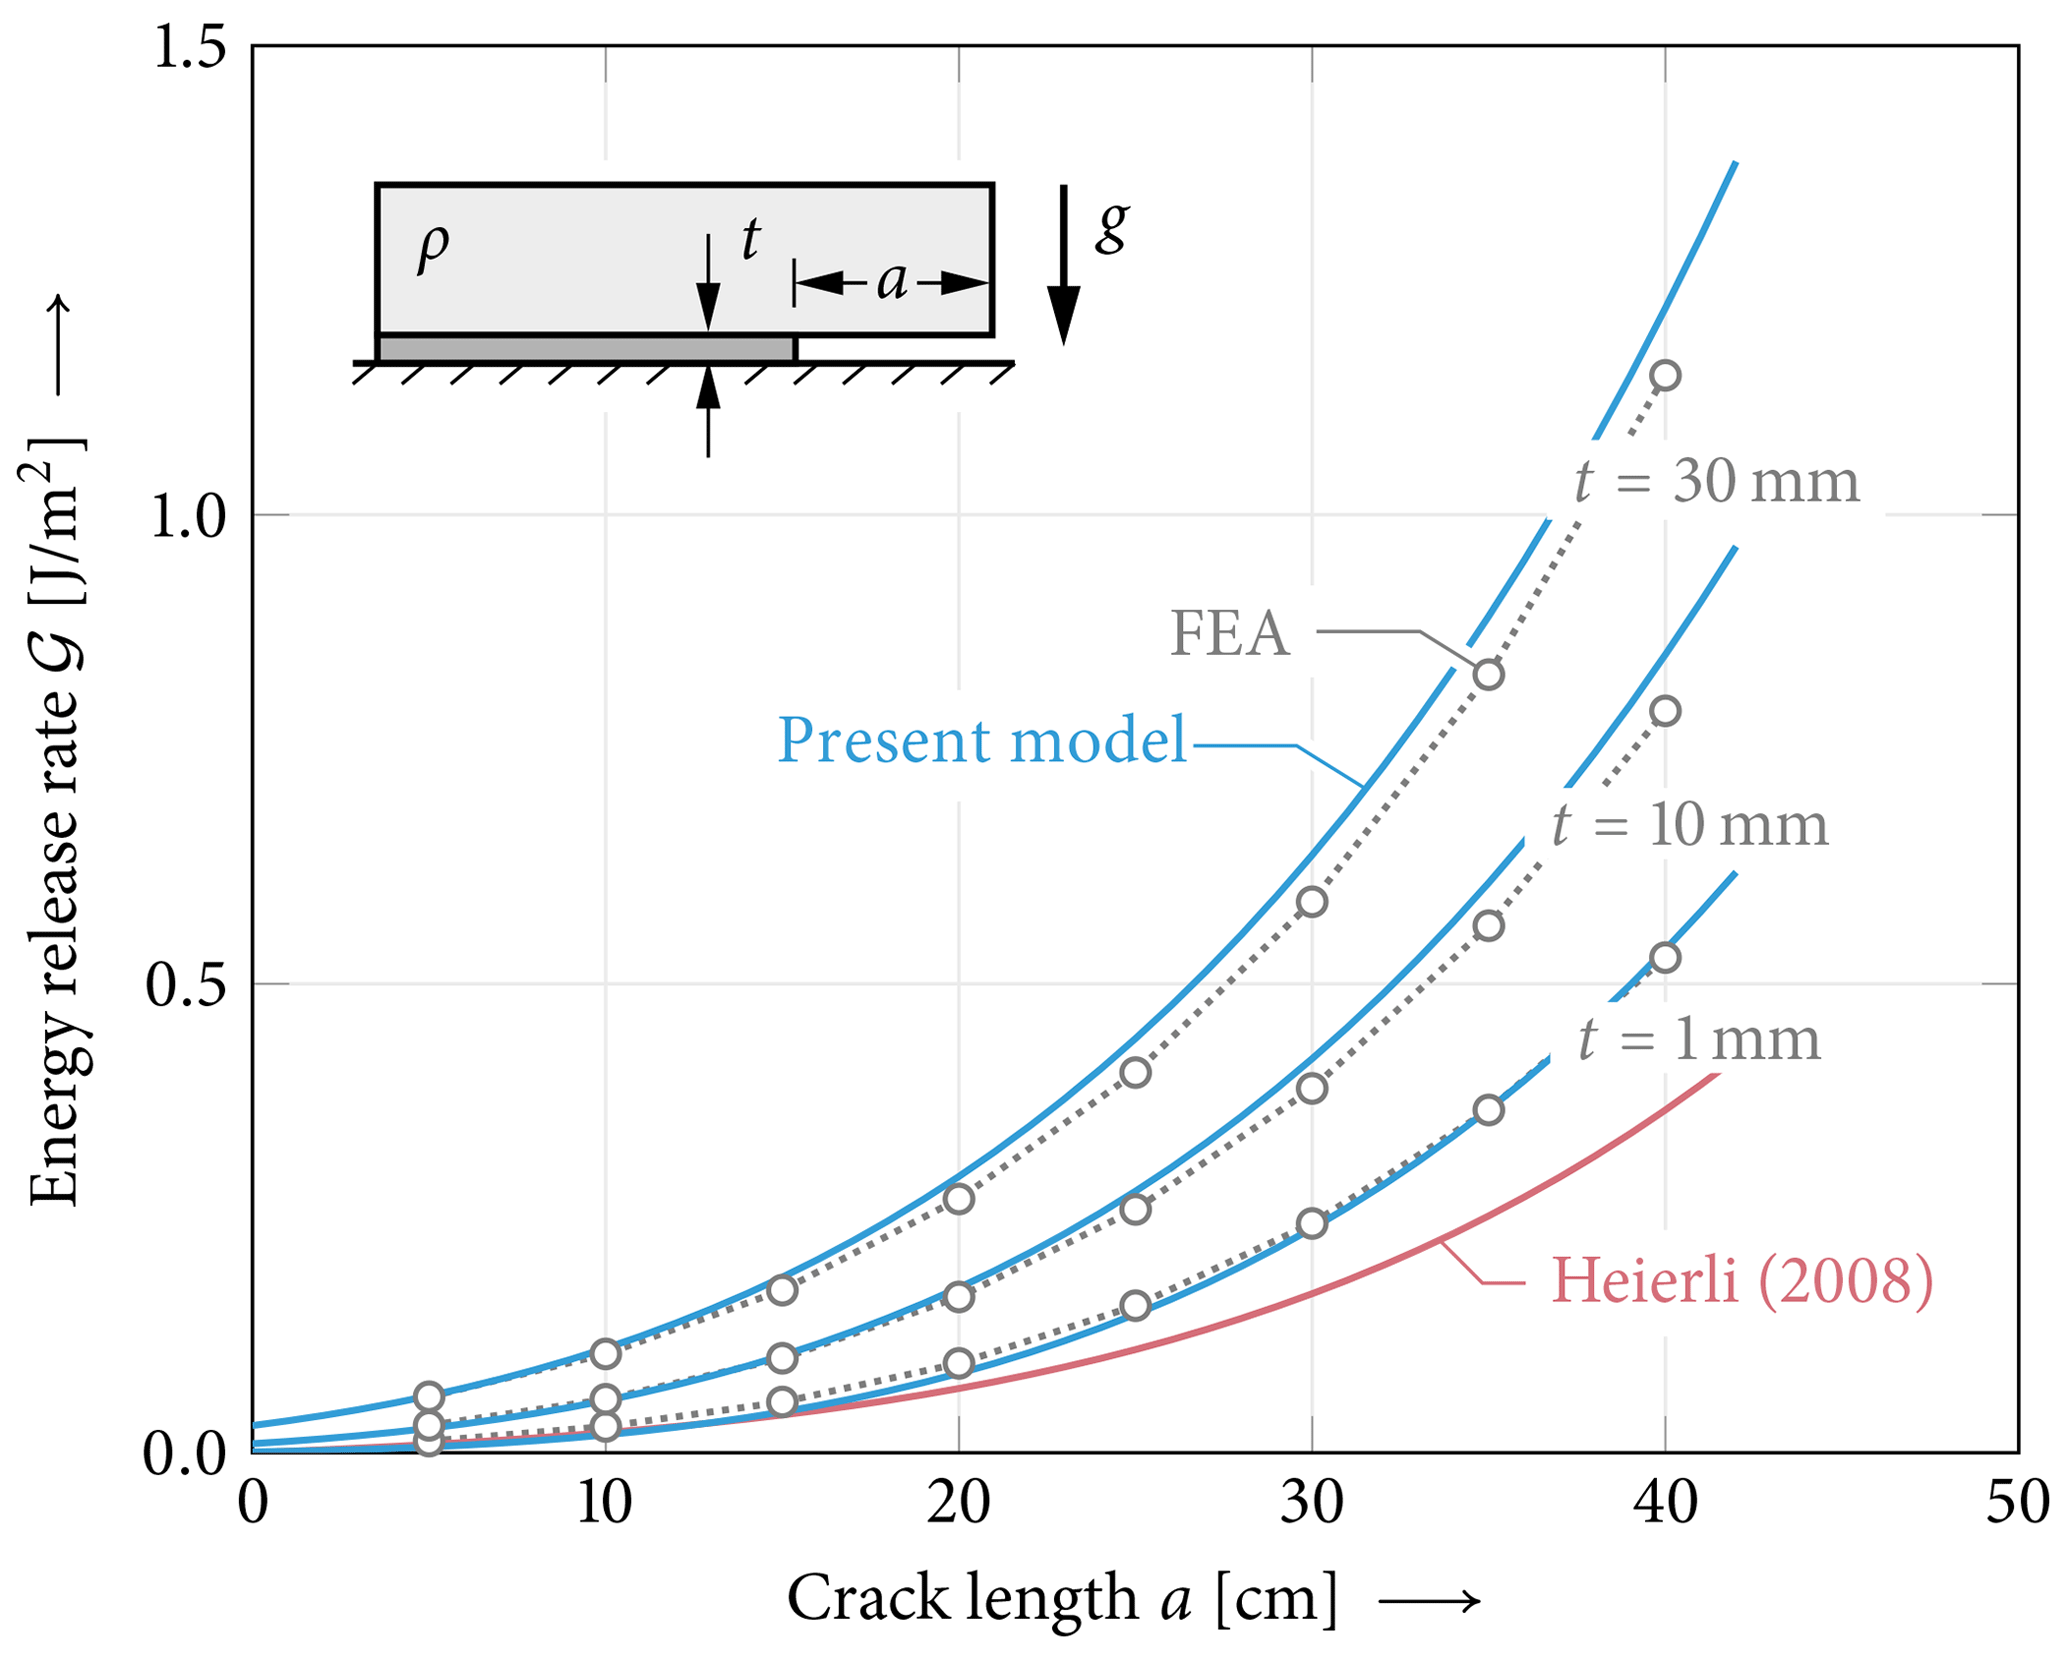
Figure 11Energy release rate 𝒢 in propagation saw tests (PSTs) in flat terrain. Comparison of the present model (blue lines), Heierli (2008) model (red line) and FEA results (gray circles). Both models agree well with FEA data for short crack lengths and stiff (i.e., thin) weak layers. The model by Heierli (2008) cannot reproduce varying weak-layer properties and provides a lower bound of the energy release rate corresponding to vanishing weak-layer thickness. Except for h=30 cm, model parameters are chosen as given in Fig. 1.
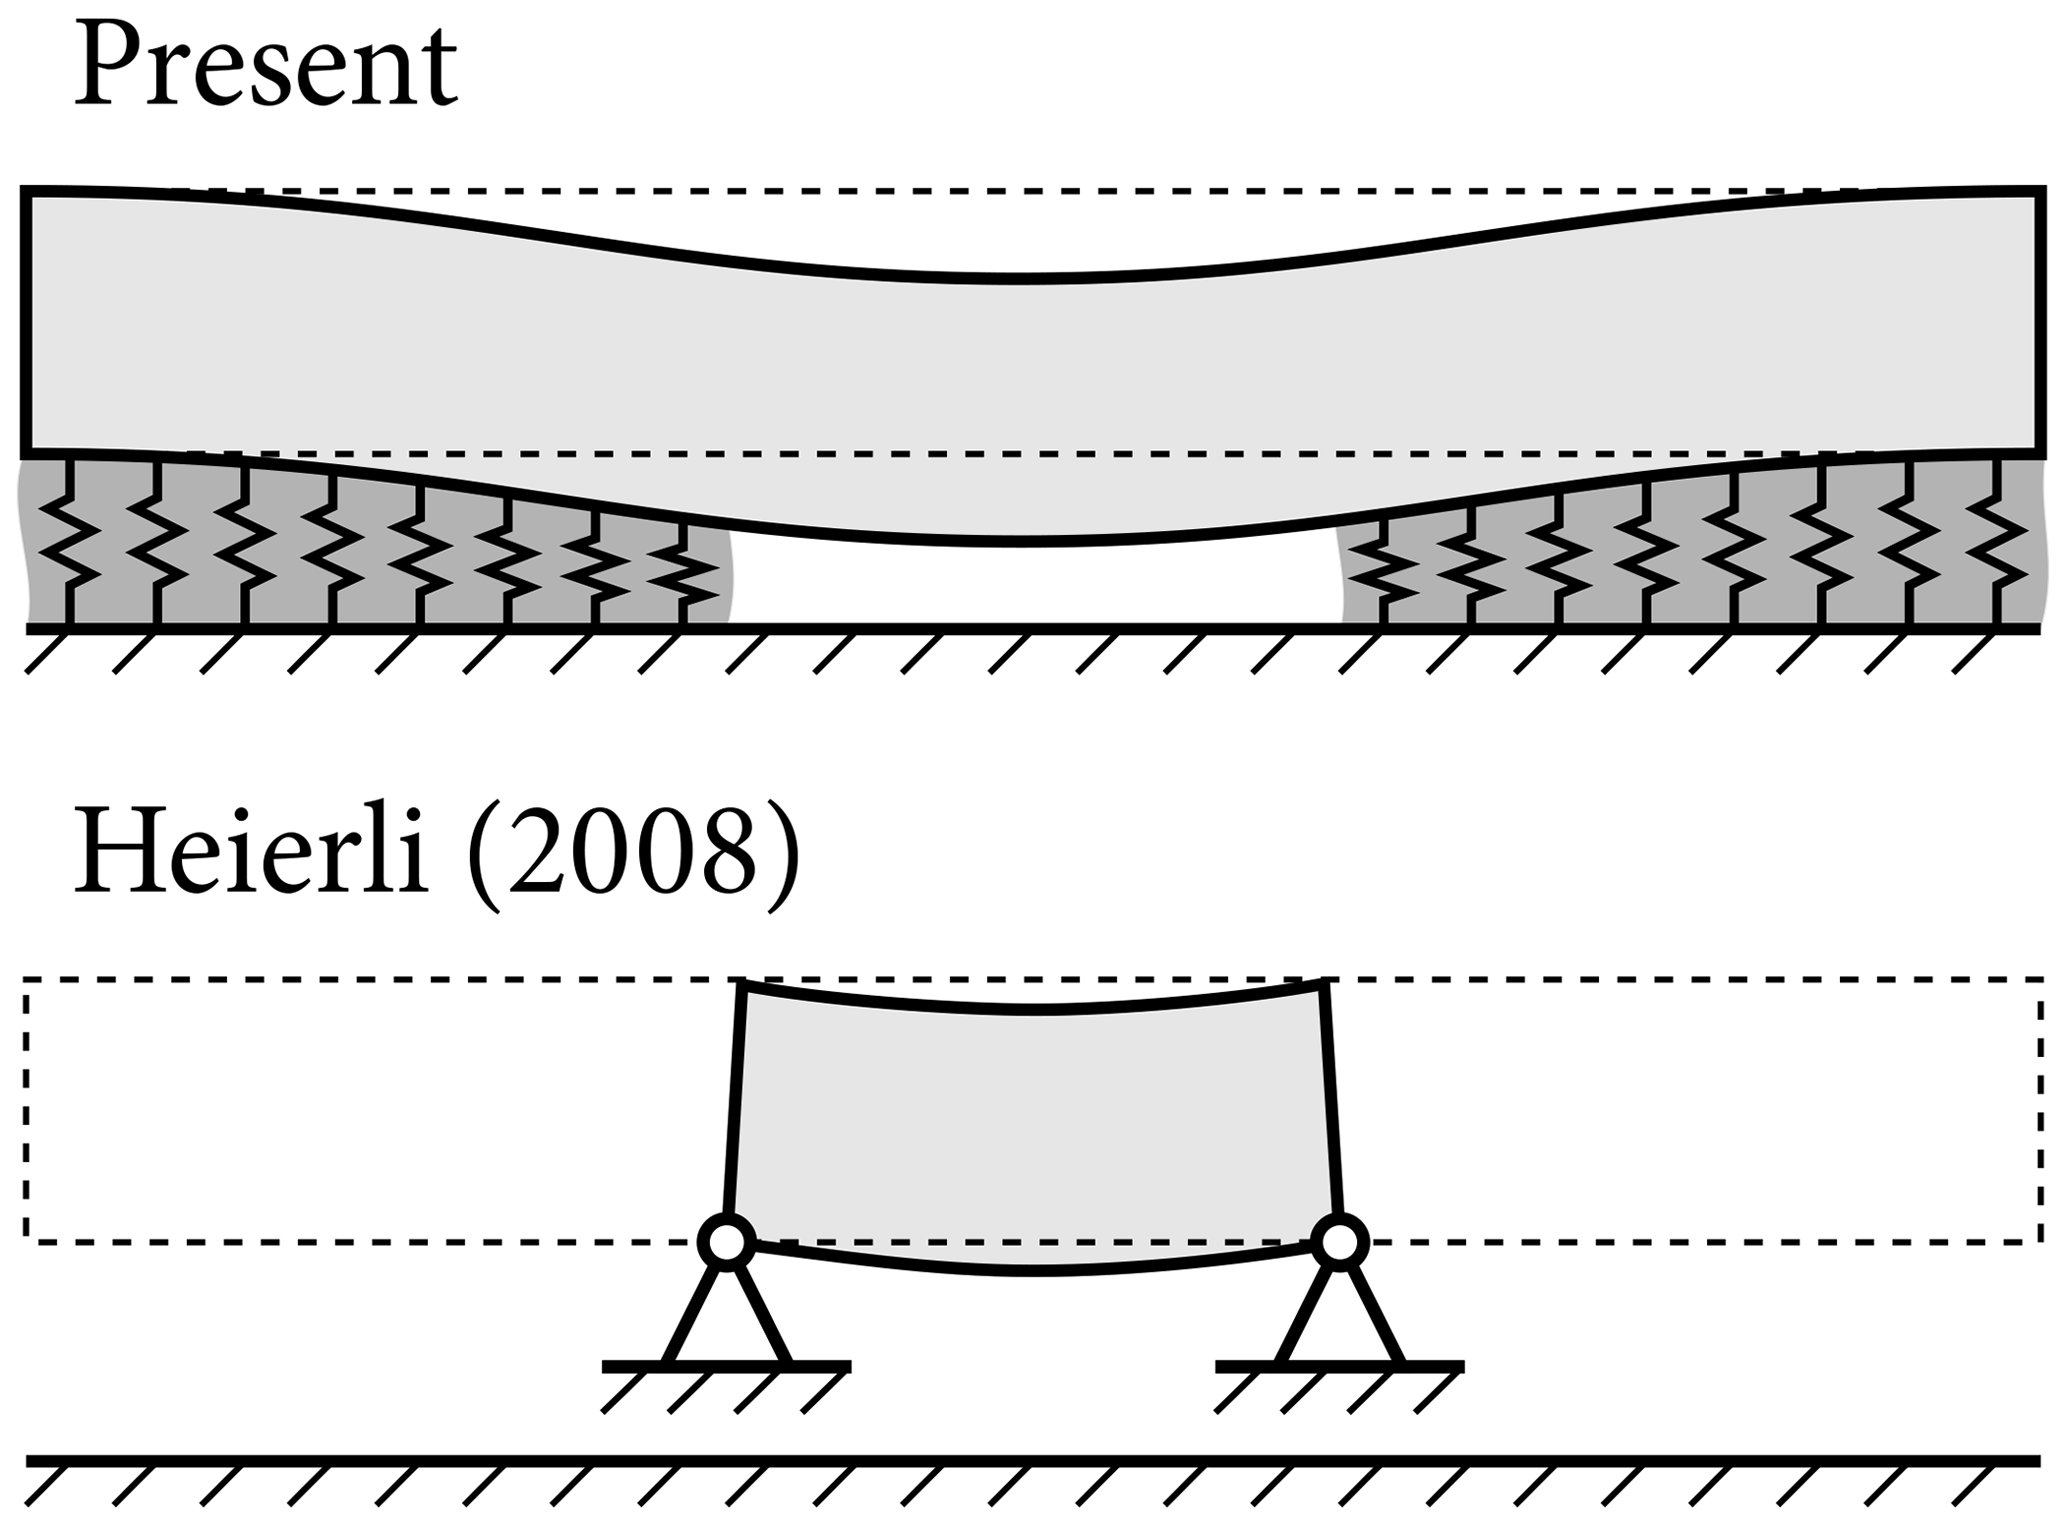
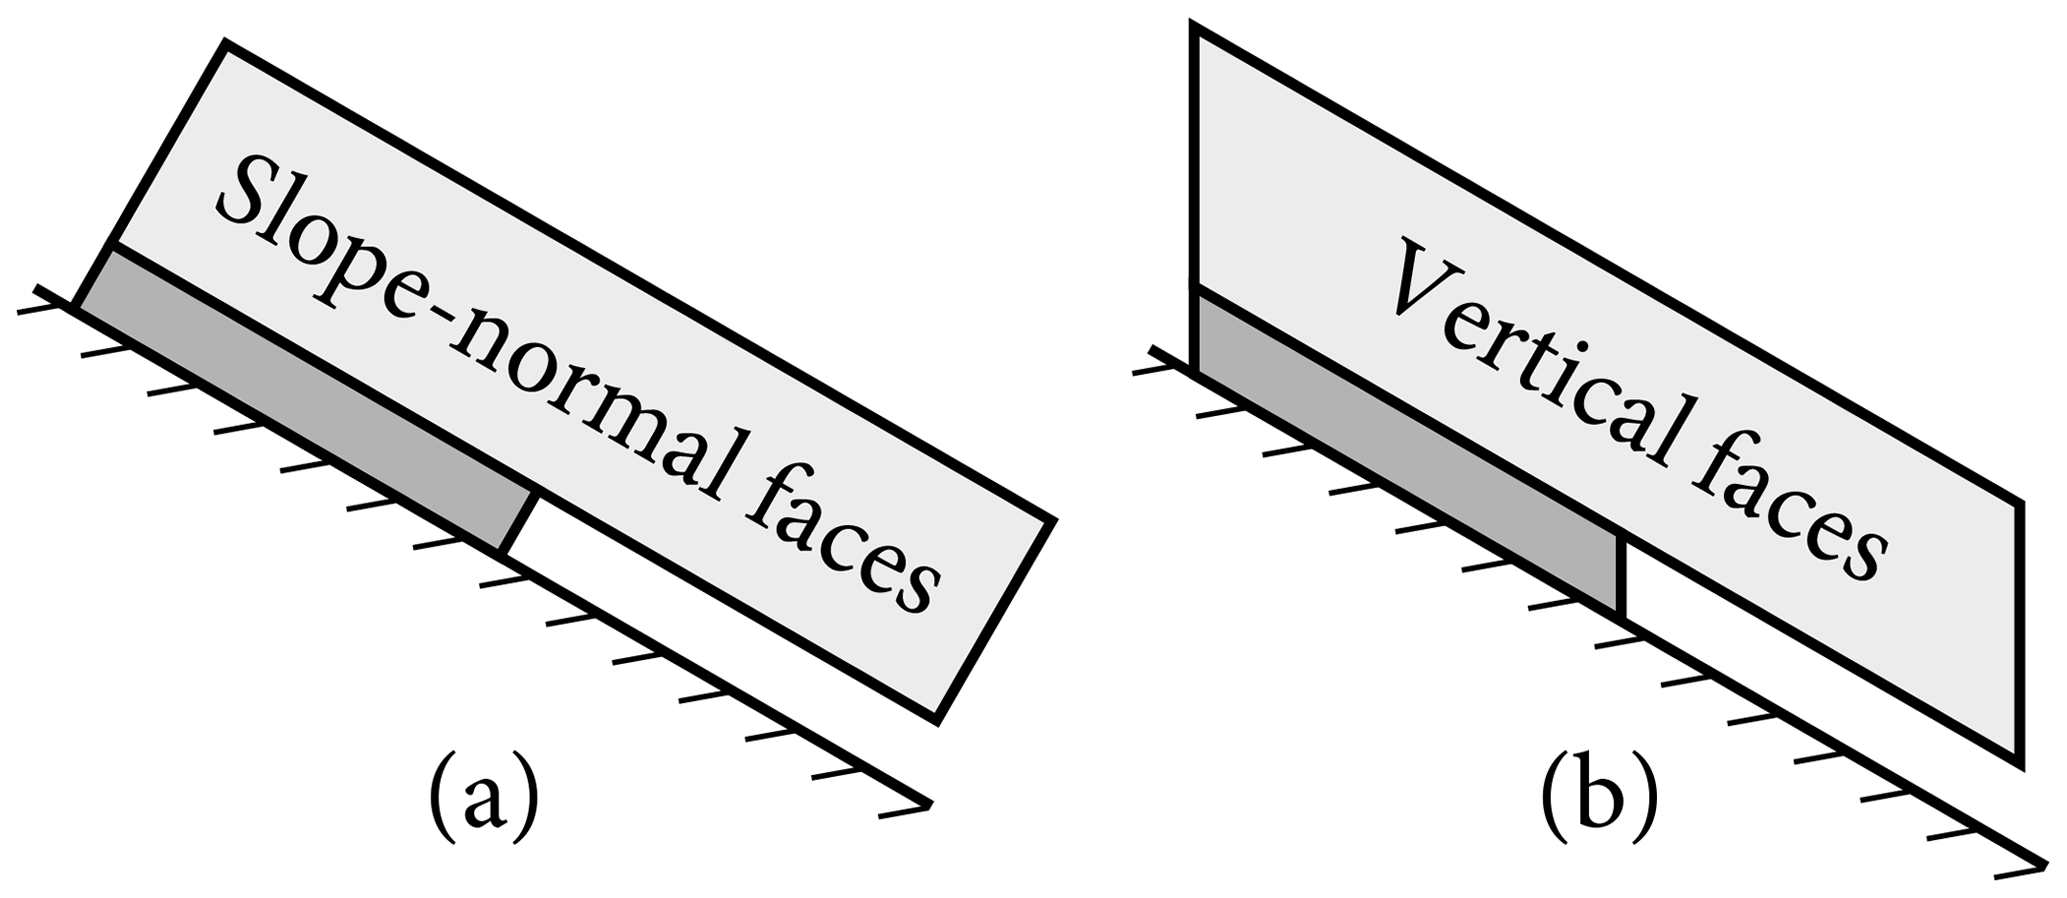
Figure 13Boundary conditions in PST experiments: (a) slope-normal and (b) vertical upslope and downslope faces.
In Fig. 10 a PST experiment is studied. The mode I and mode II energy release rates are shown depending on the thickness of the slab above the weak layer. Two different slope inclinations are considered. Energy release rate results are normalized to account for the different orders of magnitude of both crack opening modes. For both angles the mode II contribution has a stronger dependence on the slab thickness than the mode I contribution as they are governed by different deformation mechanisms. Hence, the mode mixity changes towards a mode-II-dominated loading of the PST. No mode III contribution exists when PSTs are cut downsloping and no lateral loading occurs.
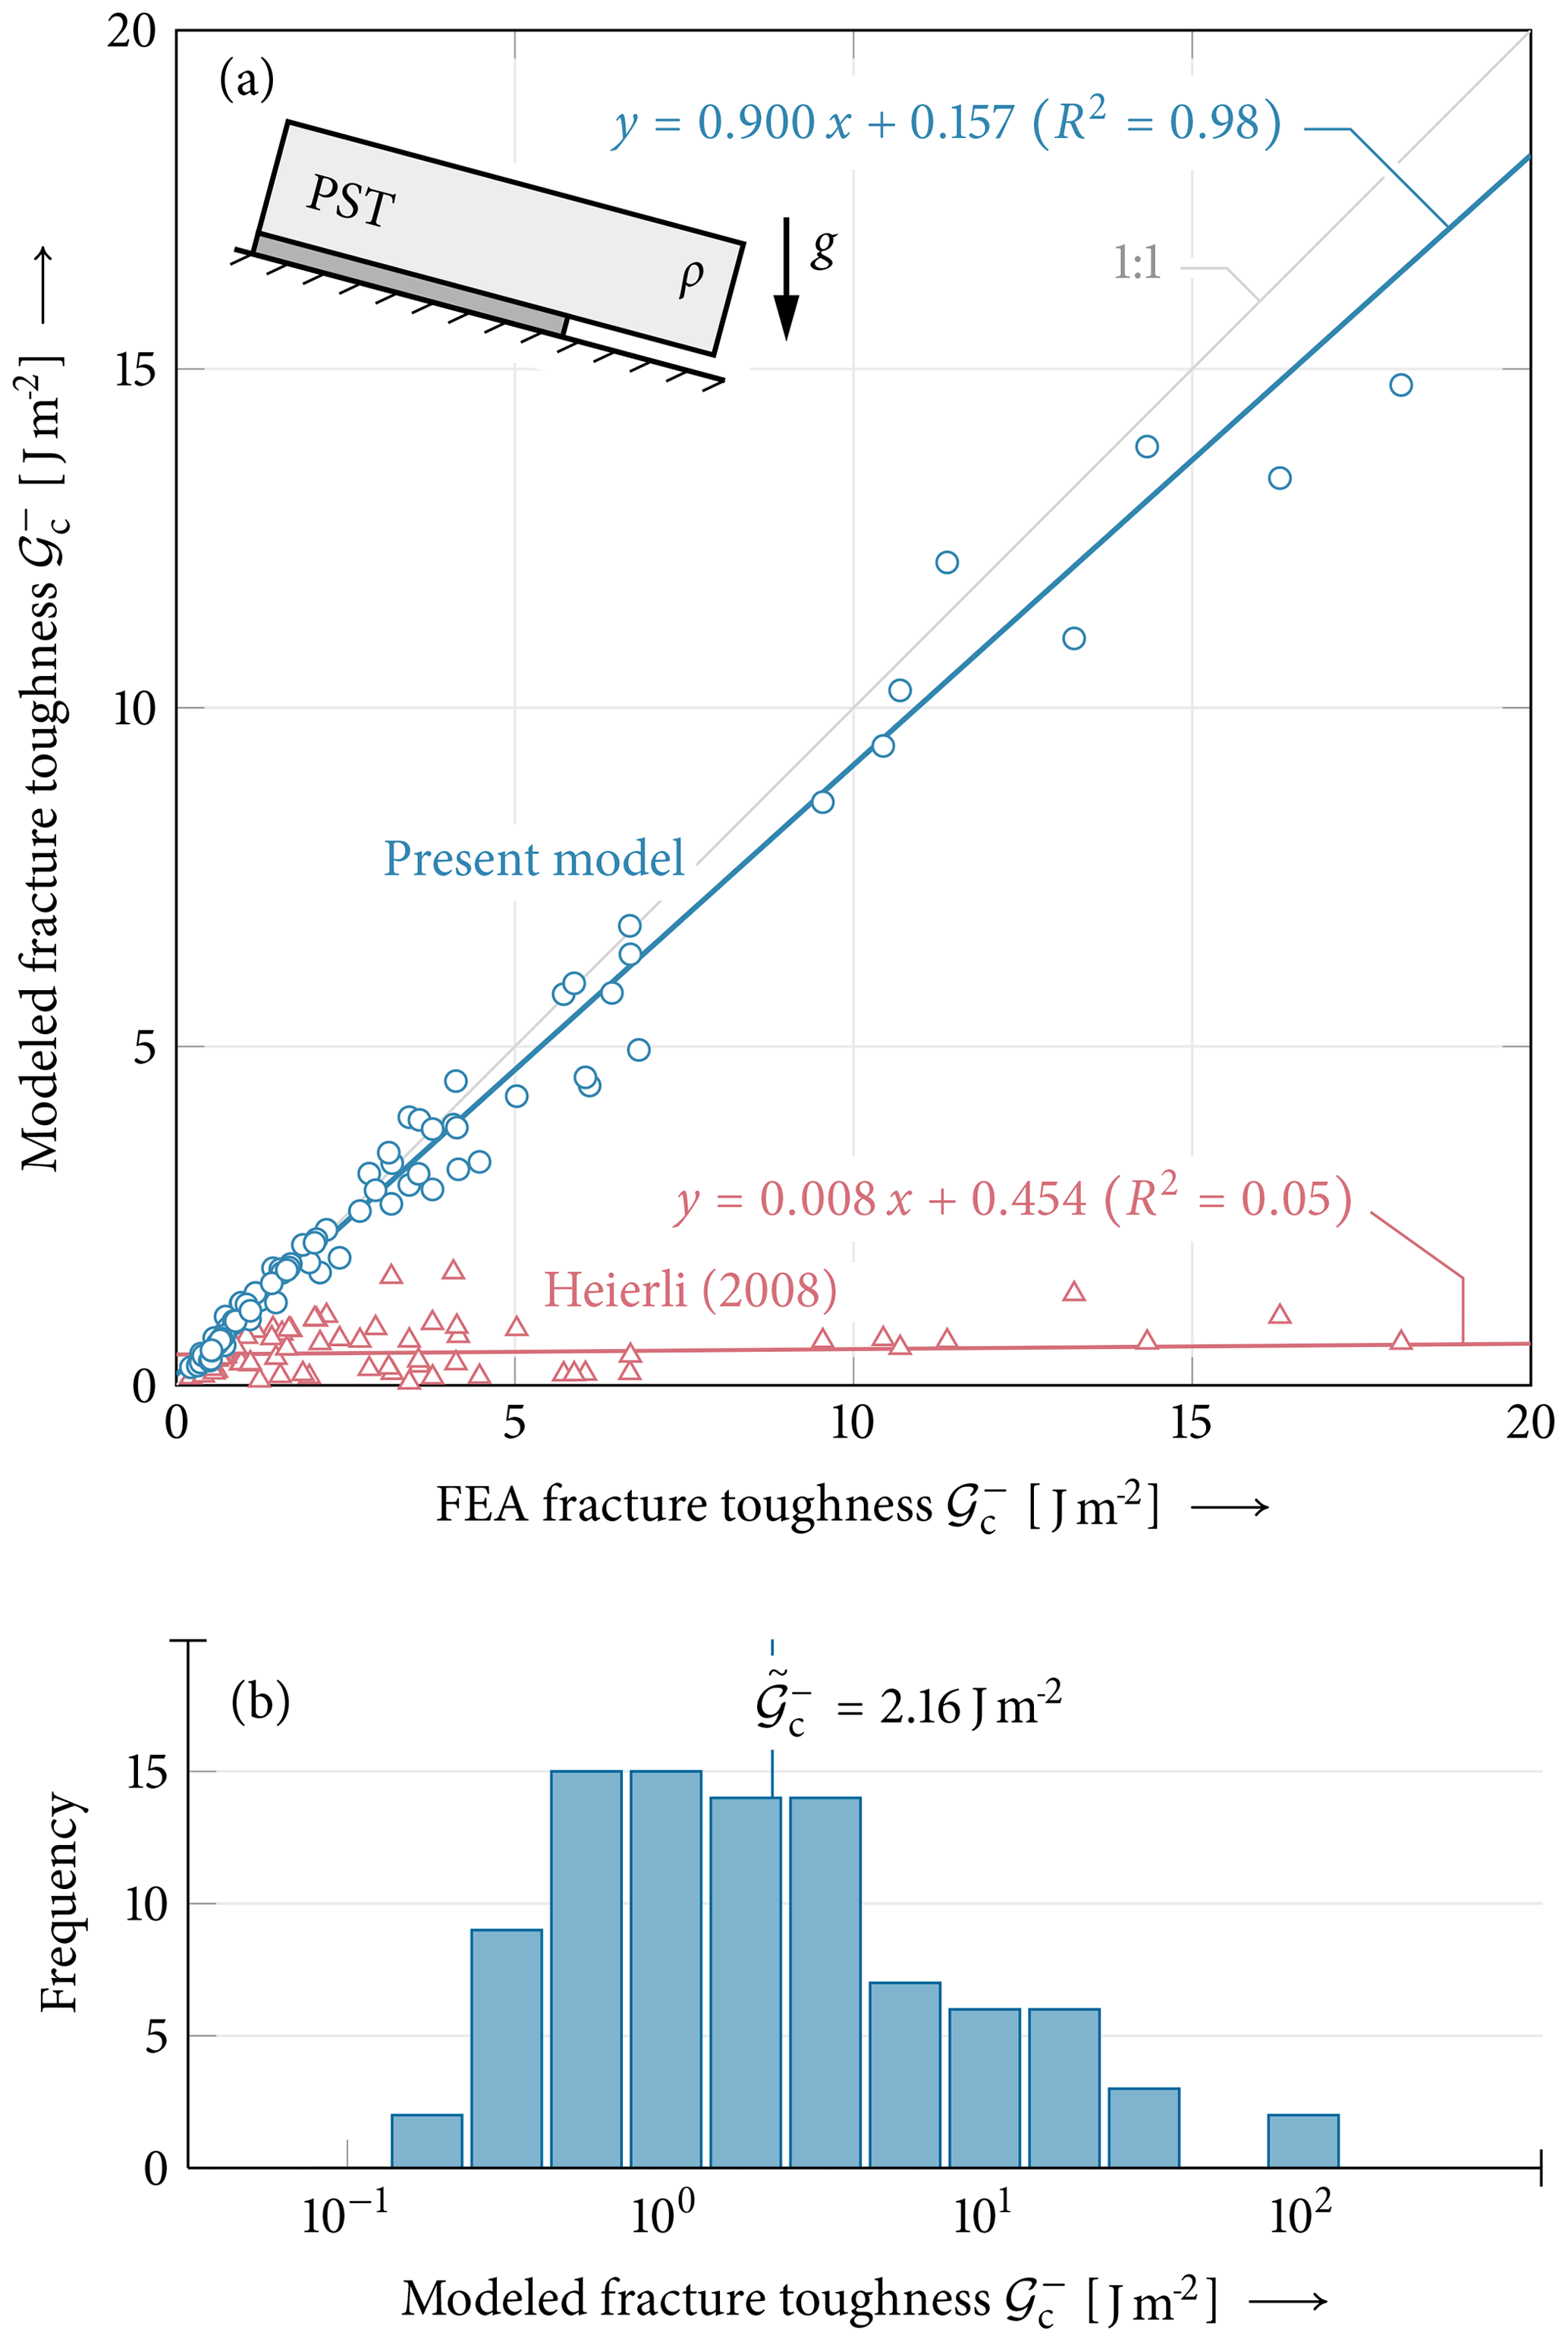
Figure 14Fracture toughness determined from 93 field PST experiments reported by Gaume et al. (2017). (a) Comparison of model and FEA results with corresponding linear regressions and coefficients of determination R2 for the present model (blue) and the model by Heierli (2008) (red). (b) Histogram with logarithmic bin size 100.25 and median of the 93 fracture toughnesses calculated using the present model. Data not given in Gaume et al. (2017) are assumed as given in Table 1.
Figure 11 compares energy release rates for PSTs in flat terrain computed using FEAs, the anticrack model by Heierli (2008) and the present model. Different weak-layer thicknesses are shown. FEA energy release rates are computed using Eq. (28). Heierli (2008) models only the unsupported segment of the slab above a failed weak layer (Fig. 12). Deformations of the intact weak layer and the beam segment resting on the intact weak layer are not accounted for. That is, the intact weak layer in Heierli's model can be envisaged as rigid, i.e., indefinitely thin. For short cracks and thin weak layers Heierli's model agrees well with FEA results.
PST experiments can be conducted in one of two ways as depicted in Fig. 13. The upslope and downslope faces may be cut slope-normally (Fig. 13a) or vertically (Fig. 13b), which has to be accounted for when using beam models. A beam model collapses the slab onto its lower edge resting on smeared springs. Considering vertically cut PSTs, the vertical gravity load of the slab acts entirely on the beam and is transferred into the weak layer. In the case of slope-normal faces, the right end of the gravity-loaded slab extends past the right end of its lower edge, i.e., the beam. Hence, the beam is loaded not only by a distributed load representing gravity loading but also force boundary conditions representing the section forces and moments resulting from the overhanging mass. The resulting weight force of the overhanging part of the slab amounts to . The corresponding section forces applied at the PST beam model boundary are , and . Please note that this is PST-specific. Considering inclined skier-loaded snowpacks with center cracks does not require such boundary conditions because no interaction between boundary effects and skier loading is present.
Figure 14 correlates model predictions for the weak-layer fracture toughness to data obtained using detailed FEAs and Eq. (28). The FE model features slope-normal faces such that the corresponding section force boundary conditions discussed above are applied to the beam model. Fracture toughnesses are determined from critical cut lengths ac measured in 93 PST field experiments (Gaume et al., 2017). Measured cut lengths correspond to critical lengths required for crack propagation. No case in the data set showed maximum deflections exceeding the weak-layer thickness which would indicate a base-touching slab. According to the fundamental Griffith criterion of fracture mechanics, Eq. (21), the energy release rate corresponding to the critical cut length is the fracture toughness of the weak layer. We will denote it as to emphasize the difference between the fracture toughness of a collapsing weak layer and a tearing fracture toughness . The difference between the two will be discussed in Fig. 4. Please note that here only the total energy release rate is considered and no mode-mixity dependence is assumed. The 93 PST measurements allow for a model validation against the reference solution, and we can obtain actual weak-layer fracture toughnesses. For comparison, the closed-form analytical expression for the energy release rate derived by Schweizer et al. (2011) from the model of Heierli (2008) is shown. In the notation of the present work the expression reads
with w0 to w4 given in Appendix B. Schweizer et al. (2011) obtain this expression by differentiating the total strain energy of the anticrack model of Heierli (2008) with respect to the crack length.
Predictions of the present model are found within a narrow range around the one-to-one line, indicating excellent agreement (R2=0.99) with FEAs for this comprehensive set of real-world parameters. The Heierli solution significantly underestimates the energy release rates as already seen in previous analyses of the influence of the weak-layer thickness. The comparison to the FEA reference solution shows poor correlation (R2=0.04).
The values of the obtained fracture toughness are within 3 orders of magnitude. A total of 61 % of the values are within 1 order of magnitude around the median value of Jm−2. To individually show most of the data points, Fig. 14a only shows a region with values below 20 J m−2. As shown in Fig. 14b, 11 data points are above this value. The mean relative error for all 93 data points is 13.0 %. Values with J m−2 outside the domain shown in Fig. 14a exhibit an increased mean relative error amounting to 19.3 %. The relative error of the predicted fracture toughness and the numerical reference model is between −28.3 % and +68.3 %. A total of 50 % of the values have an error of less than 9.0 %. The maximum value of the fracture toughness3 calculated is 124.0 J m−2, with a relative error of 2.48 % in the comparison to the reference model.

Figure 15Incremental energy release rate of cracks below a skier for three different slab thicknesses. The slab is locally loaded by a skier and by the weight load of the slab. The slab is modeled to have a length of 25 times the slab thickness, guaranteeing vanishing boundary effects. Model parameters other than Eweak=0.15 MPa and t=5 cm are chosen as given in Fig. 1.
The previously given results of the energy release rate as given by the model show differential energy release rates 𝒢 describing the growth of initial cracks introduced by the saw. In order to study crack initiation, it is important to consider the incremental energy release rate of cracks of finite size; see Eq. (23). In Fig. 15 the incremental energy release rate of finite cracks in the weak layer of a skier-loaded snowpack is shown. Besides the local load the weight load of the slab is also considered. As an example the effects of slab and weak-layer thicknesses are studied. The incremental energy release rate is given as a function of the size of the finite cracks. Of course, the incremental energy release rate increases with crack length. It also increases with slab thickness and with increasing weak-layer thickness.
The presented closed-form analytical model of the snowpack contains two different levels of abstraction. The first level is the treatment of the snowpack as a linear elastic continuum. This is common for models of skier-triggered avalanches (Schweizer and Camponovo, 2001; Schweizer et al., 2003) and agrees with the fact that the brittle failure process of dry-snow slab avalanches occurs within very short timescales (Narita, 1980). Further, van Herwijnen et al. (2016) have shown a good agreement of displacements measured using particle tracking in field measurements with linear elastic models. Such models are insufficient to study long-term effects within a snowpack, such as temporal compaction or sintering/metamorphic processes (Capelli et al., 2018; Mulak and Gaume, 2019). At first glance, the propagation saw test seems governed by the rather slow saw movement. However, the fracture process itself is associated with high strain rates (Reiweger and Schweizer, 2010).
The second layer of abstraction is the simplification of heterogeneous media to continua and engineering structures like elastic foundations or deformable rods and beams. If chosen correctly, accurate representations of the deformation and stress fields within the continua can be recovered with such elements of structural analysis, which are well established in civil and mechanical engineering (Gross et al., 2014). Using appropriate simplifications, numerical models can be avoided and closed-form analytical solutions are obtained. Comparisons to finite element analyses (FEAs) (see Fig. 9) with continuum elements show that the first-order shear deformation theory is needed to account for the low shear stiffness of the slab. The Euler–Bernoulli beam theory does not suffice and the present work uses the Timoshenko beam theory.
The studies shown in Figs. 6 and 8 assess the quality of the stress solution. The present model shows very good agreement with FEA reference solutions, with relative errors below 2 %–5 % outside the stress localization domain just below the point load. We exclude this domain from our discussion because considering a localized distributed load instead would resolve this typical problem of concentrated loads and weak interface models. Moreover, the effect of the point load limitation on the results of failure models is discussed in detail in Part 2. Stiffer weak layers yield smaller errors. For thicker weak layers, stress concentrations below a skier load are less pronounced with larger areas of load transfer (see Fig. 8). Hence, the peak stresses in the weak layer are reduced with increasing thickness of that layer. This result of the stress solution is in line with the FEA reference solution but cannot be captured by the Föhn (1987) solution, which makes use of the elastic half-space solution. This model deficiency is discussed in detail by Gaume et al. (2017). However, the effect of reduced local load contradicts observations that thicker weak layers are more likely to fracture and that avalanches are easier to trigger when the weak layer under the slab is thicker (Gaume et al., 2013). The failure analysis presented in Part 2 of this work is able to correctly recover this effect by additionally considering the energy release rate as a requirement for failure. Figure 7 investigates the bridging effect. This effect describes the ability to distribute external loads on the slab on a wider area of the weak layer (Thumlert and Jamieson, 2014) as the slab thickness increases. The present model is able to capture the overall stress level due to the increased slab weight as well as the load distribution on a wider area in very good agreement with the numerical reference solution. The load transfer area increases by a factor of approximately 5 for a change in slab thickness from h=10 to h=80 cm. Although not shown, the classical solution by Föhn (1987) is capable of rendering this bridging effect correctly. Schweizer and Jamieson (2003) have introduced a bridging index as the product of slab hardness and thickness. The results of the present analysis show that this is a good estimate, but the local stresses decrease overproportionally with the slab thickness. This is due to the bending deformation which is controlled by the bending stiffness of the slab, which in turn is proportional to h3. The effect of the elastic contrast of the stiffnesses of the weak layer and slab on this bridging behavior has been addressed by Monti et al. (2015). They proposed to scale the effective slab thickness with the cubic root of the elastic contrast of the slab and weak layer. The bridging effect is very important and explains why thicker slabs can sustain higher loads before weak-layer failure occurs (Schweizer and Camponovo, 2001). However, propagation of cracks is more likely below thicker slabs (van Herwijnen and Jamieson, 2007). This change in parameter effect is addressed in the failure model presented in the second part of this work.
The energy release rate of cracks within the weak layer is studied in detail in the validation studies shown in Figs. 9–14. The effect of slope angle (Fig. 9) on the energy release rates shows that both mode I and mode II contributions strongly depend on the slope angle. While the angle dependence of the stress solution mainly stems from the split in normal and tangential force contributions, the angle dependence of the energy release rate also depends on the deformations of the slab above the cracked weak layer (see Fig. 4). Therefore, the angle dependence of simplified models like McClung (1981) or Heierli et al. (2011) is insufficient. The present model is in very good agreement with the numerical reference solution, which is carefully set up to identify these important fracture mechanical quantities.
The effect of the slab thickness on the energy release rate obtained for PST experiments is shown in Fig. 10. As mode I and mode II are associated with very different failure modes of collapse and shear failure of the weak layer, the corresponding energy release rates can be of different magnitudes and at the same time both be relevant for the mixed-mode failure. This has been studied in the comprehensive experimental work of Birkeland et al. (2019). They performed PST experiments in which the slab thickness was changed in order to assess the change in failure behavior at hand of the measured critical cut lengths. The results of the present model show different ratios of mode I and II contributions when the slab thickness changes. This may allow for identifying a comprehensive mixed-mode fracture envelope using these extended PST experiments. The present model could also help to identify relevant geometric parameter ranges to be studied within experimental campaigns.
As pointed out by Reiweger and Schweizer (2010) up to 90 % of the total deformation of snowpacks is concentrated in the weak layer because of its considerably low stiffness. It is evident that, in order to capture snowpack deformations adequately, a mechanical model must consider the weak layer.
Increasing the thickness of the weak layer while keeping all other geometry and material properties constant increases its compliance. That is, Heierli's assumption of rigidity leads to increasing discrepancies as the weak-layer thickness increases. This is reflected in Fig. 11. The importance of considering the compliance of the weak layer below the slab is also evident in Fig. 14. The thickness of the weak layer (which influences its compliance linearly) has a pronounced effect on the energy release rate obtained for these cases. The model by Heierli and Zaiser (2008), which neglects the compliance of the weak layer and renders it as rigid, is shown in comparison. It is a lower bound of the energy release rate for vanishing weak-layer thickness. Van Herwijnen et al. 2016 also showed the insufficient approximation for longer cracks and resorted to using a numerical correction factor obtained from finite element analyses (FEAs). The energy release rate predicted by the present model, which accounts for weak-layer deformation, is in good agreement with the numerical reference. Figure 9 indicates that with slope angles above 35∘ the agreement of the present solution and reference solution would decrease by a few percent. However, the overall effect of the weak-layer thickness (Fig. 11) remains the same.
The analysis of 93 PST data points (Fig. 14) provides insight into the analysis of the energy release rate. The 93 data points show a wide span of the input parameters slab density (factor 4.6), slab thickness (factor 3.9), weak-layer thickness (factor 44) and slope angle (from 0 to 44∘). They provide a realistic overview on possible configurations along with corresponding measurements of the critical cut length. Applying the model to these data points now not only provides a comprehensive overview on the model's capabilities by comparing it to the numerical reference model but also provides insight into the fracture toughness of a multitude of weak layers. The comparison to the numerical reference model shows that the present model provides a good prediction of the energy release rate for most of the configurations. Only 10 (10.75 %) data points deviate by more than 30 % from the numerical reference. Since the energy release rate has a quadratic dependence on (skier) loading, this constitutes an error in crack propagation analyses below 14 %. Because Heierli's model neglects weak-layer deformations, it underestimates the fracture toughness significantly (see Fig. 11). It neither shows a satisfactory slope of the linear regression nor a reasonable coefficient of determination R2. The fracture toughness values that are obtained in the analysis of these 93 data points spans several decades. However, 75 % of the values are between J m−2 and 6.0 J m−2 with a median of 2.16 J m−2. This range of values reflects the heterogeneity of weak-layer structures of persistent weak layers. Complex and divers microstructures are observed for weak layers of faceted crystals or buried surface hoar (Hagenmuller et al., 2014; Schweizer et al., 2003). Possible thickness dependence or layering effects are neither considered in the present nor in the numerical reference model. However, because of the quadratic load dependence of the energy release rate, the range of orders of magnitudes of the corresponding crack driving forces is halved when investigating crack initiation and crack propagation.
In the framework of continuum mechanics the PST must be considered a fracture mechanical experiment aimed at identifying the fracture toughness. The fracture toughness is the energy required to form a new surface on the idealized plane of fracture. This energy comprises the dissipative processes at the microscale. These processes are very different between crack growth under tension and under compression with a collapse of the weak layer. In the latter case local dissipative damage processes are much more pronounced, leading to a significantly higher value of the (effective) fracture toughness in compression than in tension . This has been in observed in lab experiments of cracks on glass foams leading to critical energy release rates 2 orders of magnitude higher in compression than in tension (Heierli et al., 2012)4. For such porous materials with a thin microstructure, local stability failure contributes significantly to the local damage process. Sigrist (2006) and McClung (2007) show that typical values of the fracture toughness in tension are between 10−1 and 100 J m−2, which provides the same relation of tensile and compression fracture toughness as in the experiments by Heierli et al. (2012). The tensile fracture toughness of ice () is on the order of 100 J m−2 (Dempsey, 1991). This is, of course, larger than the fracture toughness of snow in tension. However, the fracture toughness for the present case of mode I in compression may lie well above this value as the corresponding failure process of collapse dissipates significantly more energy than a simple tensile bond breaking. Compared to temperature- and time-driven transformation processes of snow, PSTs represent rather fast experiments with little or no impact of viscous effects. Hence, material properties determined from PSTs may be used for analyses of skier-triggered snowpack instability, which is associated with fast loading and high strain rates.
As pointed out by Gaume et al. (2017), fracture parameters obtained from experimental results are always linked to the failure mode that is considered in the model employed to evaluate the data. Hence, fracture energies obtained under the assumption of a rigid weak layer (Heierli et al., 2010) or in pure shear models (McClung, 1979) will always be different from models that take into account weak deformation and mixed-mode fracture. If the failure mode is modeled insufficiently, the obtained failure parameters are not true material parameters and hence not consistent.
Figure 15 shows the result of the incremental energy release rate of cracks of finite size (as opposed to infinitesimal crack growth). These effects are very similar to those of the previously discussed case of the differential energy release rate. When differential energy release rates can be calculated as a function of the crack length, incremental energy release rates can always be obtained from integration. The integration is highly efficient using closed-form analytical solutions and established (numerical) integration schemes. However, computational effort can be reduced even further by employing the crack opening integral. While integrating the differential energy release rate requires its evaluation for several crack lengths, the crack opening integral only needs data from the uncracked configuration and the configuration with the final crack length. It computes the difference in total potential energy between an uncracked state and a configuration with a finite crack from the work done by stresses as the crack opens. Similar to differential energy release rates, incremental energy release rates increase with increasing crack length (Fig. 15). More importantly, they also increase with both weak-layer thickness and slab thickness. Maximum deflections of the slabs considered in Fig. 15 are smaller than half the weak-layer thickness even for the longest cracks. At first glance, Figs. 7 and 15 demonstrate a contradiction: thicker slabs distribute loads more evenly over the weak layer, reduce local stress peaks and should be more difficult to trigger. However, they release more energy, favoring crack propagation. A failure criterion using both stress and incremental energy release rates to assess the nucleation of finite cracks within the weak layer resolving this contradiction will be introduced in Part 2 of this work.
The present model does not account for layering of the slab above the weak layer. It is well known that the layering can have a significant effect (e.g., Schweizer, 1993; van Herwijnen and Jamieson, 2007; Habermann et al., 2008; Reuter et al., 2015). It influences the load distribution, the fracture process of the weak layer and also the bridging effect. Monti et al. (2015) have proposed a stability index based on the Föhn solution that accounts for layering by using adapted values of the thickness and the stiffness of the slab. In the present work, rigid base layers are assumed. However, as shown by Jones et al. (2006) and Habermann et al. (2008), substratum elasticity is not negligible. The elastic foundation should not only account for weak-layer compliance but also for deformable base layers. Future research is required to make use of these considerations in a refined version of the present model to combine the capabilities.
Penetration depths leading to forces acting not on top of the slab but well within the slab are not considered at this point. To understand loading scenarios where the penetration depth is high, e.g., because of a soft top layer of snow or a highly localized load (recreationist by foot or a snowmobile), further modeling and experimental effort is needed.
In this work, interaction of shear and compression is limited. Slab extension causes only tangential and slab deflection causes only normal weak-layer deformations. This modeling strategy can be pictured as weak-layer springs attached to the midsurface of the beam. With this simplification the governing system of equations is uncoupled and can be solved independently for tangential and normal displacements, respectively. Of course, the weak layer does not interact with the midsurface of the slab but with its bottom side. Tangential displacements on the slab bottom side are caused by both slab extension and the rotation of beam cross sections, which in turn depends on the slab deflection. Hence, the rotation of beam cross sections couples tangential and normal displacements. This will increase the solution effort but simultaneously provide improved accuracy, in particular concerning weak-layer shear stresses and mode II energy release rates (see, e.g., Fig. 6).
By considering a deformable weak layer the present work provides a simple but comprehensive closed-form analytical model for snowpack deformations, weak-layer stresses and energy release rates of cracks within weak layers:
-
The model applies to skier-loaded slopes as well as PST experiments.
-
Providing closed-form solutions, the present analysis framework is highly efficient and evaluates in real time.
-
Comparisons with numerical reference solutions indicate good agreement of weak-layer stress and energy release rates.
-
The model renders physical effects such as the bridging effect of thick slabs, the influence of slope inclination and most importantly the impact of weak-layer compliance. Evaluating a comprehensive set of 93 PSTs, fracture toughnesses of a multitude of weak layers are analyzed and discussed.
-
Providing weak-layer stress and energy release rates of cracks within the weak layer, the present framework allows for evaluating comprehensive criteria for skier-triggered crack nucleation and crack propagation in the weak layer, which will be discussed in Part 2 of this two-part work.
The set of differential equations governing the present problem can be derived from the equilibrium of forces and moments of a beam element and elasticity laws for the bending moment M, the transverse shear force Q and the normal force N. The latter read (Timoshenko and Goodier, 1951)
where A=hb is the snow slab cross section, is the shear correction factor for rectangular cross sections and is the moment of inertia with respect to the y axis. In the limit κGA→∞ we obtain the classical Euler–Bernoulli beam theory. Equilibrium of forces and moments of a beam element yields
where ktu and knw are distributed reaction forces acting on the beam, which originate from the elastic foundation. Therefore, they depend on the normal and tangential displacements along the top of the weak layer and its normal and lateral shear stiffnesses kn and kt.
Preliminary studies showed that two-parameter foundation models like Pasternak or Vlazov foundations (Selvadurai, 1979), which consider additional stiffnesses such as a transverse foundation shear stiffness, do not have a significant effect on the outcome of the analysis.
The ODE governing horizontal displacements, i.e., the deformations of an elastically bedded rod, is obtained by inserting the derivative of Eq. (A1) into Eq. (A4). The following rearrangements are necessary to obtain differential equations of the deflection w and the curvature ψ of a Timoshenko beam on an elastic foundation: plugging the derivative of Eq. (A2) into Eq. (A5) yields
Adding to the balance of moments (Eq. A6), differentiating twice and plugging the result into the first derivative of Eq. (A6) yields
Now we use the third derivative of the elasticity law of shear deformations (Eq. A2) to substitute the first term of the right-hand side and obtain
Substituting Q′ using Eq. (A5) and Q′′′ using the second derivative of Eq. (A5) yields the ODE of the beam deflection:
In order to obtain the ODE of the rotation of normals to the beam midsurface, we insert Eq. (A2) and the derivative of Eq. (A3) into Eq. (A6), which yields
Plugging the derivative of Eq. (A7) into Eq. (A11) and rearranging for ψ yields
With normal and shear loading and , respectively, the constants w0 to w4 of Eq. (30) read
in the notation of the present work, where γ≈1 and are constants.
The analysis code of both the modeling framework in Part 1 and the mixed-mode failure criterion based on this framework is available under https://github.com/2phi/weac (last access: 6 January 2020) (2phi, 2020).
PLR and PW designed, conceived and developed the model. PW drafted the paper, and PLR carried out the numerical reference analysis. Both authors contributed equally to the presented model and the final version of the paper.
The authors declare that they have no conflict of interest.
We thank Johan Gaume and Alec van Herwijnen for sharing their PST data set and for valuable discussions on snow slab models and characterization tests. We want to thank Ned Bair, Karl Birkeland and Bastian Bergfeld for fruitful discussions on snow physics, model assumptions and snowpack stability experiments. We thank Wilfried Becker for his support and Vera Lübke for studying the feasibility of different modeling approaches. We are grateful for the contributions of Michael Zaiser, the anonymous referee and editor Guillaume Chambon, who carefully reviewed the paper.
This research has been supported by the German Research Foundation and the Open Access Publishing Fund of Technische Universität Darmstadt.
This paper was edited by Guillaume Chambon and reviewed by Michael Zaiser and one anonymous referee.
2phi: Weak layer anticrack nucleation model, available at: https://github.com/2phi/weac, last access: 6 January 2020. a, b
Anderson, T. L.: Fracture Mechanics, CRC Press, Boca Raton, 4th edn., https://doi.org/10.1201/9781315370293, 2017. a
Bellaire, S. and Schweizer, J.: Measuring spatial variations of weak layer and slab properties with regard to snow slope stability, Cold Reg. Sci. Technol., 65, 234–241, https://doi.org/10.1016/j.coldregions.2010.08.013, 2011. a
Birkeland, K. W., van Herwijnen, A., Reuter, B., and Bergfeld, B.: Temporal changes in the mechanical properties of snow related to crack propagation after loading, Cold Reg. Sci. Technol., 159, 142–152, https://doi.org/10.1016/j.coldregions.2018.11.007, 2019. a
Broberg, K. B.: Cracks and fracture, Elsevier, 1999. a
Capelli, A., Reiweger, I., and Schweizer, J.: Acoustic emission signatures prior to snow failure, J. Glaciol., 64, 543–554, https://doi.org/10.1017/jog.2018.43, 2018. a
Chiaia, B. M., Cornetti, P., and Frigo, B.: Triggering of dry snow slab avalanches: stress versus fracture mechanical approach, Cold Reg. Sci. Technol., 53, 170–178, https://doi.org/10.1016/j.coldregions.2007.08.003, 2008. a
Dempsey, J. P.: The fracture toughness of ice, in: Ice-structure interaction, Springer, 109–145, 1991. a
Föhn, P. M. B.: The stability index and various triggering mechanisms, in: Avalanche Formation, Movement and Effects, Proceedings of the Davos Symposium, Sept. 1986, IAHS Publ., 195–214, 1987. a, b, c, d, e, f, g
Föhn, P. M. B.: Simulation of surface-hoar layers for snow-cover models, Ann. Glaciol., 32, 19–26, https://doi.org/10.3189/172756401781819490, 2001. a
Gaume, J., Chambon, G., Eckert, N., and Naaim, M.: Influence of weak-layer heterogeneity on snow slab avalanche release: application to the evaluation of avalanche release depths, J. Glaciol., 59, 423–437, https://doi.org/10.3189/2013JoG12J161, 2013. a, b
Gaume, J., van Herwijnen, A., Chambon, G., Birkeland, K. W., and Schweizer, J.: Modeling of crack propagation in weak snowpack layers using the discrete element method, The Cryosphere, 9, 1915–1932, https://doi.org/10.5194/tc-9-1915-2015, 2015. a
Gaume, J., van Herwijnen, A., Chambon, G., Wever, N., and Schweizer, J.: Snow fracture in relation to slab avalanche release: critical state for the onset of crack propagation, The Cryosphere, 11, 217–228, https://doi.org/10.5194/tc-11-217-2017, 2017. a, b, c, d, e, f, g
Gerling, B., Löwe, H., and van Herwijnen, A.: Measuring the Elastic Modulus of Snow, Geophys. Res. Lett., 44, 11,088–11,096, https://doi.org/10.1002/2017GL075110, 2017. a
Gross, D., Hauger, W., and Wriggers, P.: Technische Mechanik 4, Springer, 9th edn., 2014. a
Habermann, M., Schweizer, J., and Jamieson, B.: Influence of snowpack layering on human-triggered snow slab avalanche release, Cold Reg. Sci. Technol., 54, 176–182, https://doi.org/10.1016/j.coldregions.2008.05.003, 2008. a, b, c, d, e
Hagenmuller, P., Theile, T. C., and Schneebeli, M.: Numerical simulation of microstructural damage and tensile strength of snow, Geophys. Res. Lett., 41, 86–89, https://doi.org/10.1002/2013GL058078, 2014. a
Hashin, Z.: Finite thermoelastic fracture criterion with application to laminate cracking analysis, J. Mech. Phys. Solids., 44, 1129–1145, https://doi.org/10.1016/0022-5096(95)00080-1, 1996. a
Heierli, J.: Anticrack model for slab avalanche release, PhD thesis, Universität Karlsruhe, 2008. a, b, c, d, e, f, g, h
Heierli, J. and Zaiser, M.: An analytical model for fracture nucleation in collapsible stratifications, Geophys. Res. Lett., 33, L06501, https://doi.org/10.1029/2005GL025311, 2006. a
Heierli, J. and Zaiser, M.: Failure initiation in snow stratifications containing weak layers: Nucleation of whumpfs and slab avalanches, Cold Reg. Sci. Technol., 52, 385–400, https://doi.org/10.1016/j.coldregions.2007.02.007, 2008. a, b, c, d
Heierli, J., Gumbsch, P., and Zaiser, M.: Anticrack nucleation as triggering mechanism for snow slab avalanches., Science, 321, 240–243, https://doi.org/10.1126/science.1153948, 2008. a, b
Heierli, J., Zaiser, M., and Gumbsch, P.: Der Knall im Lawinenhang. Die Ursache von Schneebrettlawinen, Physik in unserer Zeit, 41, 31–34, https://doi.org/10.1002/piuz.201001224, 2010. a
Heierli, J., Birkeland, K. W., Simenhois, R., and Gumbsch, P.: Anticrack model for skier triggering of slab avalanches, Cold Reg. Sci. Technol., 65, 372–381, https://doi.org/10.1016/j.coldregions.2010.10.008, 2011. a
Heierli, J., Gumbsch, P., and Sherman, D.: Anticrack-type fracture in brittle foam under compressive stress, Scripta Mater., 67, 96–99, https://doi.org/10.1016/j.scriptamat.2012.03.032, 2012. a, b, c
Jamieson, B. and Schweizer, J.: Texture and strength changes of buried surface-hoar layers with implications for dry snow-slab avalanche release, J. Glaciol., 46, 151–160, https://doi.org/10.3189/172756500781833278, 2000. a, b, c
Jones, A., Jamieson, J., and Schweizer, J.: The effect of slab and bed surface stiffness on the skier-induced shear stress in weak snowpack layers, in: Proceedings ISSW 2006, International Snow Science Workshop, Telluride, CO, edited by: Gleason, J. A., 157–164, 2006. a
Köchle, B. and Schneebeli, M.: Three-dimensional microstructure and numerical calculation of elastic properties of alpine snow with a focus on weak layers, J. Glaciol., 60, 705–713, https://doi.org/10.3189/2014JoG13J220, 2014. a
Krenk, S.: Energy release rate of symmetric adhesive joints, Eng. Fract. Mech., 43, 549–559, https://doi.org/10.1016/0013-7944(92)90198-N, 1992. a, b
Lenci, S.: Analysis of a crack at a weak interface, Int. J. Fracture, 108, 275–290, https://doi.org/10.1023/A:1011041409243, 2001. a
McClung, D. M.: Shear Fracture Precipated by Strain Softening as a Mechanism of Dry Slab Avalanche Release, J. Geophys. Res., 84, 3519–3526, 1979. a, b
McClung, D. M.: Fracture mechanical models of dry slab avalanche release, J. Geophys. Res.-Sol. Ea., 86, 10783–10790, https://doi.org/10.1029/JB086iB11p10783, 1981. a
McClung, D. M.: Fracture energy applicable to dry snow slab avalanche release, Geophys. Res. Lett., 34, L02503, https://doi.org/10.1029/2006GL028238, 2007. a
Monti, F., Gaume, J., van Herwijnen, A., and Schweizer, J.: Snow instability evaluation: calculating the skier-induced stress in a multi-layered snowpack, Nat. Hazards Earth Syst. Sci., 16, 775–788, https://doi.org/10.5194/nhess-16-775-2016, 2016. a, b, c, d
Mulak, D. and Gaume, J.: Numerical investigation of the mixed-mode failure of snow, Computational Particle Mechanics, 6, 25–28, https://doi.org/10.1007/s40571-019-00224-5, 2019. a
Narita, H.: Mechanical behaviour and structure of snow under uniaxial tensile stress, J. Glaciol., 26, 275–282, https://doi.org/10.1017/S0022143000010819, 1980. a
Nicot, F.: From constitutive modelling of a snow cover to the design of flexible protective structures Part I – Mechanical modelling, Int. J. Solids Stru., 41, 3317–3337, https://doi.org/10.1016/j.ijsolstr.2003.09.022, 2004a. a
Nicot, F.: From constitutive modelling of a snow cover to the design of flexible protective structures Part II – Some numerical aspects, Int. J. Solids Stru., 41, 3339–3352, https://doi.org/10.1016/j.ijsolstr.2003.09.021, 2004b. a
Perla, R.: Slab avalanche measurements, Can. Geotech. J., 14, 206–213, https://doi.org/10.1139/t77-021, 1977. a
Reiweger, I. and Schweizer, J.: Failure of a layer of buried surface hoar, Geophys. Res. Lett., 37, L24501, https://doi.org/10.1029/2010GL045433, 2010. a, b, c
Reuter, B., Schweizer, J., and van Herwijnen, A.: A process-based approach to estimate point snow instability, The Cryosphere, 9, 837–847, https://doi.org/10.5194/tc-9-837-2015, 2015. a
Rosendahl, P. L. and Weißgraeber, P.: Modeling snow slab avalanches caused by weak-layer failure – Part 2: Coupled mixed-mode criterion for skier-triggered anticracks, The Cryosphere, 14, 131–145, https://doi.org/10.5194/tc-14-131-2020, 2020. a
Scapozza, C.: Entwicklung eines dichte- und temperaturabhängigen Stoffgesetzes zur Beschreibung des visko-elastischen Verhaltens von Schnee, PhD thesis, ETH Zürich, https://doi.org/10.3929/ethz-a-004680249, 2004. a
Schweizer, J.: The influence of the layered character of snow cover on the triggering of slab avalanches, Ann. Glaciol., 18, 193–198, https://doi.org/10.3189/S0260305500011496, 1993. a, b
Schweizer, J. and Camponovo, C.: The skier's zone of influence in triggering slab avalanches, Ann. Glaciol., 32, 314–320, https://doi.org/10.3189/172756401781819300, 2001. a, b, c
Schweizer, J. and Jamieson, B.: Snowpack properties for snow profile analysis, Cold Reg. Sci. Technol., 37, 233–241, https://doi.org/10.1016/S0165-232X(03)00067-3, 2003. a, b
Schweizer, J., Jamieson, B., and Schneebeli, M.: Snow avalanche formation, Rev. Geophys., 41, 1016, https://doi.org/10.1029/2002RG000123, 2003. a, b
Schweizer, J., van Herwijnen, A., and Reuter, B.: Measurements of weak layer fracture energy, Cold Reg. Sci. Technol., 69, 139–144, https://doi.org/10.1016/j.coldregions.2011.06.004, 2011. a, b
Selvadurai, A.: Elastic Analysis of Soil-foundation Interaction, no. 17 in Developments in geotechnical engineering, Elsevier Scientific Publishing Company, 1979. a, b
Sigrist, C.: Measurement of fracture mechanical properties of snow and application to dry snow slab avalanche release, PhD thesis, ETH Zürich, 2006. a
Sigrist, C. and Schweizer, J.: Critical energy release rates of weak snowpack layers determined in field experiments, Geophys. Res. Lett., 34, L03502, https://doi.org/10.1029/2006GL028576, 2007. a
Thumlert, S. and Jamieson, B.: Stress measurements in the snow cover below localized dynamic loads, Cold Reg. Sci. Technol., 106–107, 28–35, https://doi.org/10.1016/j.coldregions.2014.06.002, 2014. a, b
Timoshenko, S. and Goodier, J. N.: Theory of Elasticity, McGraw-Hill, 2nd. edn., 1951. a
van Herwijnen, A. and Jamieson, B.: Snowpack properties associated with fracture initiation and propagation resulting in skier-triggered dry snow slab avalanches, Cold Reg. Sci. Technol., 50, 13–22, https://doi.org/10.1016/j.coldregions.2007.02.004, 2007. a, b, c
van Herwijnen, A., Gaume, J., Bair, E. H., Reuter, B., Birkeland, K. W., and Schweizer, J.: Estimating the effective elastic modulus and specific fracture energy of snowpack layers from field experiments, J. Glaciol., 62, 997–1007, https://doi.org/10.1017/jog.2016.90, 2016. a, b
In linear elastic materials the Griffith criterion may be reformulated using stress intensity factors K which describe the asymptotic crack tip stress field. Both the critical energy release rate 𝒢c and the critical stress intensity factor Kc are denoted as fracture toughness. The units of these two quantities are different but can be converted using the material's elastic modulus.
The effective rigidity of a Timoshenko beam against vertical deflections is composed of bending stiffness EI∝h3 and shear stiffness κGA∝h. Hence, its dependence on h is slightly smaller than cubic.
This maximum is obtained for the following configuration: h=81 cm, φ=20∘, ρ=269 kg m−3, t=2 cm and ac=67.1 cm.
In their study Heierli et al. (2012) use critical stress intensity factors, which relate to the critical energy release rate through , and report a 1 order of magnitude larger than .
- Abstract
- Introduction
- Modeling approach
- Validation of the mechanical model
- Discussion
- Conclusions
- Appendix A: Derivation of governing equations
- Appendix B: Constants of Heierli's solution
- Code availability
- Author contributions
- Competing interests
- Acknowledgements
- Financial support
- Review statement
- References