the Creative Commons Attribution 4.0 License.
the Creative Commons Attribution 4.0 License.
Evaluation of CloudSat snowfall rate profiles by a comparison with in situ micro-rain radar observations in East Antarctica
Florentin Lemonnier
Jean-Baptiste Madeleine
Chantal Claud
Christophe Genthon
Claudio Durán-Alarcón
Cyril Palerme
Alexis Berne
Niels Souverijns
Nicole van Lipzig
Irina V. Gorodetskaya
Tristan L'Ecuyer
Norman Wood
The Antarctic continent is a vast desert and is the coldest and the most unknown area on Earth. It contains the Antarctic ice sheet, the largest continental water reservoir on Earth that could be affected by the current global warming, leading to sea level rise. The only significant supply of ice is through precipitation, which can be observed from the surface and from space. Remote-sensing observations of the coastal regions and the inner continent using CloudSat radar give an estimated rate of snowfall but with uncertainties twice as large as each single measured value, whereas climate models give a range from half to twice the space–time-averaged observations. The aim of this study is the evaluation of the vertical precipitation rate profiles of CloudSat radar by comparison with two surface-based micro-rain radars (MRRs), located at the coastal French Dumont d'Urville station and at the Belgian Princess Elisabeth station located in the Dronning Maud Land escarpment zone. This in turn leads to a better understanding and reassessment of CloudSat uncertainties. We compared a total of four precipitation events, two per station, when CloudSat overpassed within 10 km of the station and we compared these two different datasets at each vertical level. The correlation between both datasets is near-perfect, even though climatic and geographic conditions are different for the two stations. Using different CloudSat and MRR vertical levels, we obtain 10 km space-scale and short-timescale (a few seconds) CloudSat uncertainties from −13 % up to +22 %. This confirms the robustness of the CloudSat retrievals of snowfall over Antarctica above the blind zone and justifies further analyses of this dataset.
- Article
(6952 KB) - Full-text XML
- BibTeX
- EndNote
In the context of global warming, predicting the evolution of the Antarctic ice sheet is a major challenge. Snowfall is the main input of the ice sheet mass balance, but it is difficult to estimate its amount. Indeed precipitation characteristics depend on the region of Antarctica. In coastal areas, precipitation is influenced by cyclones and fronts (Bromwich, 1988), and a few times a year these fronts intrude on the high continental plateau, likely bringing most of the snow accumulation (Genthon et al., 2016). The remaining annual precipitation rate is in the form of “diamond dust” (thin ice crystals) under clear-sky conditions (Bromwich, 1988; Fujita and Abe, 2006).
Some field campaigns with in situ observations were conducted to estimate local snow accumulations (Arthern et al., 2006; Eisen et al., 2008), but ground-based measurements are difficult in Antarctica, and the size of this continent (twice the size of Australia) does not permit one to cover and study the whole occurrence, rate and distribution of precipitation. Moreover, accumulation observed from stake measurements is a poor proxy for snowfall as it is strongly affected by local winds (Souverijns et al., 2018a).
CloudSat and its cloud-profiling radar (CPR) provide the first real opportunity to estimate the precipitation at a polar continental scale (Stephens and Ellis, 2008; Liu et al., 2008). Since August 2006, CloudSat has been observing solid precipitation through the atmosphere, which led to the first multi-year, model-independent climatology of Antarctic precipitation (Palerme et al., 2014). Using two CloudSat products to determine the frequency, the rate and the phase of precipitation, Palerme et al. (2014) established a mean snowfall rate from August 2006 to April 2011 of 171 mm w.e. year−1 over the Antarctic ice sheet, north of 82∘ S. Palerme et al. (2019) recently revisited the data and reduced this estimate to 160 mm w.e. year−1. It is worth noting that this rate is given at an altitude of about 1200 m above ground level (m a.g.l.) due to the reflectivity of snow interfering with radar waves near the surface (the so-called ground clutter; Kulie and Bennartz, 2009). It should be taken into account that close to the coastal areas and over the ocean, this vertical limit for observation can be lower. Boening et al. (2012) showed that there is a good agreement between CloudSat and ERA-Interim precipitation over Dronning Maud Land, responsible for the total ice sheet mass anomalies detected by the GRACE satelite, but currently the estimated uncertainties for the satellite snowfall rate range between 50 % and 175 % (Wood, 2011). Palerme et al. (2017) showed that ERA-Interim is also in good agreement with CloudSat at the continental scale.
In January 2010, a first micro-rain radar (MRR) used for precipitation studies was installed in Antarctica at the Belgian Princess Elisabeth station in the escarpment zone of Dronning Maud Land (PE station; 71∘57′ S, 23∘21′ E at 1392 m above ground level) in the context of the Belgian project HYDRANT (The Atmospheric branch of the HYDRological cycle in ANTarctica) (Gorodetskaya et al., 2015). The PE station is located in the escarpment zone of Dronning Maud Land with Sør Rondane mountains to the south of it (for a detailed description of the station's meteorological conditions, see Gorodetskaya et al., 2013, and Souverijns et al., 2018a). In November 2015, in the context of the French–Swiss APRES3 project (Antarctic Precipitation, Remote Sensing from Surface and Space), new instruments were deployed at the French station Dumont d'Urville on the coast of Adélie Land in East Antarctica (DDU station; 66∘40′ S, 140∘00′ E at 42 m a.g.l.) leading to unprecedented weather radar observations of precipitation by a scanning X-band polarimetric radar and a K-band vertically profiling micro-rain radar (Grazioli et al., 2017a). A comparison of MRR- and CloudSat-derived surface snowfall product showed that CloudSat is able to accurately represent the snowfall climatology with biases smaller than 15 %, outperforming ERA-Interim (Souverijns et al., 2018b). Moreover, CloudSat's blind zone (lowest measurement available at about 1200 m above the surface) leads to surface precipitation amounts being underestimated by about 10 % on average, although differences during specific events can be much larger (Maahn et al., 2014). This paper focuses on the vertical structure of precipitation.
With the aim of improving CloudSat radar uncertainty estimates using ground-based observations, CloudSat snowfall retrievals over Dumont d'Urville and Princess Elisabeth stations were compared with MRR data on a total of four concurrently recorded snowfall events. During the MRR observation periods, there were 14 overflights over the DDU station and 63 over the PE station. These overflights are short, typically a few seconds, explaining why we actually detected snow for only four of them. According to these events and using the deviation of CloudSat precipitation rates from MRR observations, the CloudSat snowfall uncertainties were reassessed. A systematic difference is found between CloudSat and the ground radars, by comparing their very low snowfall rates. This difference could be due to limitations in sensitivity or attenuation of the MRRs.
As a first step, we characterize the general weather conditions of the four cases (Sect. 3.1). Then, a comparison is done between CloudSat and the vertical MRRs' precipitation profiles (Sect. 4.1 and 4.2). From this comparison we highlight a systematic difference (Sect. 4.3); then from a statistical study described in Appendix A, a nearly perfect correlation between MRR and CloudSat datasets is derived (Sect. 4.4). To conclude, we assess a new range of CloudSat uncertainties at short timescale (a few seconds) and 10 km space scale (Sect. 4.4).
2.1 CloudSat cloud-profiling radar
The CloudSat cloud-profiling radar is a nadir-looking 94 GHz radar which measures the signal backscattered by hydrometeors. Radar reflectivity profiles are divided into 150 vertical bins with a resolution of 240 m, with a 1.7×1.3 km2 footprint and up to 82∘ of latitude. CloudSat has been operating fulltime since April 2006 but because of a dysfunctional onboard battery has been only able to provide daylight observations since April 2011. The satellite is characterized by a period of 16 days, so it exactly overpasses a location every 16 days. The DDU station is overpassed by a descending orbit, whereas the PE station is overpassed by ascending and descending orbits, which are less than 10 km away from each station. The CloudSat vertical bins are relative to the geoid, and depending on the altitude where the stations are located, the first exploitable bin (out of the ground clutter alteration altitude) varies significantly. Moreover, in locations where the ice does not interfere much with the radar signal (ocean and some coastal areas), the ground clutter layer is thinner and lower altitude bins can be used. We are using at the DDU station CloudSat profiles from the fourth bin, which is located at 961 m a.g.l. At the PE station the first exploitable bin is the fifth, which is located at 1043 m a.g.l. We use the 2C-SNOW-PROFILE product (Wood, 2011) which retrieves profiles of liquid-equivalent snowfall rates. The product is based on assumptions on snow particle size distribution, microphysical and scattering properties which induce many uncertainties in the calculation of the relationship between radar reflectivity and snowfall rate (see Sect. 2.2).
2.2 Micro-rain radars
The MRR is a vertically profiling Doppler radar operating at a frequency of 24.3 GHz (K band) with a beamwidth of 2∘ (around 50 m in diameter at a 3000 m altitude). At both stations, the resolution was set to 100 m per bin, ranging from 300 m – for the first valid available measurements – to 3000 m. However, we only consider the data up to 2500 m because of the change in the snow microphysical properties above this altitude (Grazioli et al., 2017a). The MRR's raw measurement – Doppler spectral densities – is available at a 10 s temporal resolution. The collected data were processed using the IMProTool developed by (Maahn and Kollias, 2012). At the DDU station, the radar reflectivity derived from MRR was calibrated by comparison with a colocated X-band polarimetric radar over the period from December 2015 to January 2016 (for more details, see Grazioli et al., 2017a). Through this calibration with the second radar, the reflectivity (at X band) is converted into snowfall rates using a Ze∕Sr relation (Grazioli et al., 2017a):
with Ze the radar reflectivity (in dBZ), and Sr the snowfall rate (in mm h−1). Grazioli et al. (2017a) proposed a range of values of 69–83 for the prefactor and 0.78–1.09 for the exponent corresponding to a confidence interval of 95 %.
For the instrument operating at the PE station, hereafter called MRR2, the average Ze∕Sr relation is given by Souverijns et al. (2017):
The range of prefactor, 11–43, and exponent, 0.97–1.17, for this equation spans a confidence interval of 40 % due to the summation of uncertainties in particle size, shape, measurement and conversion from reflectivity Ze to snowfall rate Sr. For this study, the MRR2 data used are processed with the Maahn and Kollias (2012) algorithm. Unlike Souverijns et al. (2017), we did not calibrate the ground radar dataset with CloudSat reflectivities (1) because we want an independent evaluation of the CloudSat CPR dataset and (2) because we do not consider surface precipitation rate comparisons. The mean precipitation profiles obtained over the MRR observation periods (2015–2016 for the DDU station and 2012 for the PE station) were also used to evaluate how typical the four precipitation events are (Durán-Alarcón et al., 2019). They are obtained using the same Ze∕Sr relationships as the ones introduced earlier (see Eqs. 1 and 2) and are separated into quantiles. According to Maahn and Kollias (2012), the minimum detection of both MRRs varies between −14 and −8 dBZ, corresponding to 0.00122–0.00546 mm h−1 at the DDU station and 0.00385–0.0135 mm h−1 at the PE station. However, these values correspond to theoretical cases of clear sky. Therefore we analyzed the density probability functions of the MRR1 (DDU station MRR) at three different levels to determine a minimum threshold of detectability of ground radars (Fig. A2 in Appendix). We used the lowest level out of the ground clutter layer (about 1200 m a.g.l.) and selected a threshold of 0.005 mm h−1 (see the vertical dashed line in Fig. A2 in Appendix).
2.3 Radiosondes
A radiosonde is a meteorological device containing a set of sensors to measure the characteristics of the atmosphere from ground level to an altitude ranging from 25 up to 30 km. Parameters measured are temperature, relative humidity, wind speed, wind direction and pressure.
At the DDU station, the radiosonde system used is a METEOMODEM M10. The relative humidity accuracy is 3 % and its temporal resolution is 2 s. The temperature measurement is realized every 1 s with an accuracy of 0.3 ∘C. At the PE station, the ground receiving systems used are GRAW-GS-E and GRAW radiosondes DFM-09-QRE. Relative humidity is measured with an accuracy of 3 % and a temporal resolution of 4 s. The accuracy and the temporal resolution of the temperature measurements are 0.2 ∘C and 3–4 s.
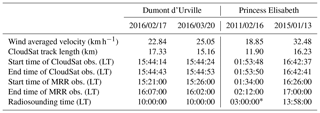
Table 1Weather conditions and instrumental characteristics for the DDU and the PE stations. Wind velocity is vertically averaged over the first 3 km of the atmosphere. Times are converted from UTC and displayed in local time (LT); the DDU station is UTC+10 and the PE station is UTC+03. The asterisk denotes that weather conditions were retrieved from ERA-Interim profiles instead of a radiosonde. The date format is yyyy/mm/dd.
3.1 Event characteristics
We summarize in Table 1 the characteristics of the four recorded precipitation cases when both CloudSat and ground-based MRRs simultaneously record a snowfall event and when the satellite is in the vicinity of the stations. Due to the CloudSat delay of revisit, satellite overflights near the DDU station are located either less than 10 km or more than 80 km away. CloudSat tracks passing through a radius of 10 km around each station (Fig. 1) were selected. Each CloudSat flyby over a station takes less than 10 s and covers a distance between 11.90 and 17.33 km. We consider that the four associated weather systems are static with regards to the CloudSat satellite overfly. However, MRRs are stationary and local precipitation patterns are typically associated with transient large-scale and mesoscale weather systems. We therefore analyzed the synoptic conditions by using radiosonde data and reanalysis (ERA-Interim) from the European Centre for Medium-Range Weather Forecasts (ECMWF) in order to determine the adequate MRR time series corresponding to CloudSat observations. We estimated a duration for which MRR observing conditions agree most with those of CloudSat using the following equation:
where Δtavg represents the temporal range of the MRR observations including the CloudSat overflight dates, Δxsat is the length of the track inside the 10 km radius area over stations and Vwind is the vertically averaged wind velocity. All characteristics are shown in Table 1.
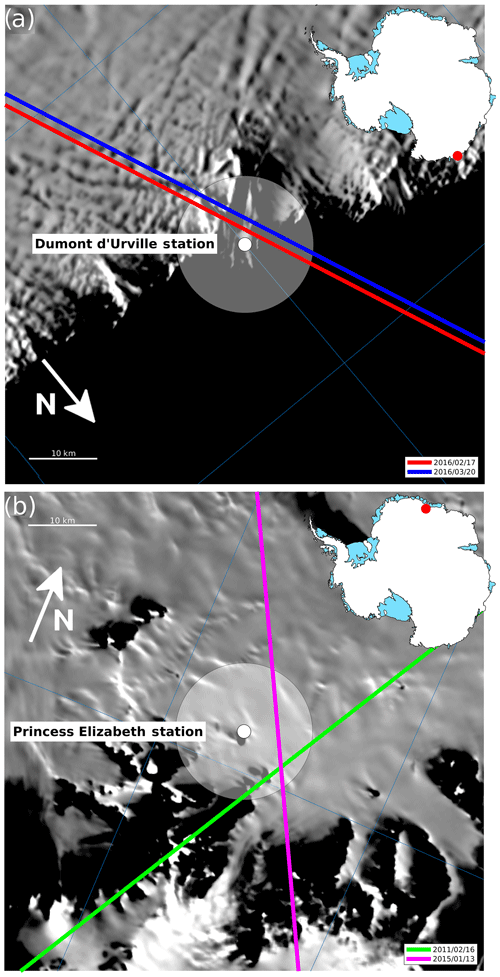
Figure 1(a) CloudSat radar tracks passing over the French Dumont d'Urville station (DDU) in red for the 17 February 2016 and in blue for the 20 March 2016. (b) CloudSat radar tracks passing over the Belgian Princess Elisabeth station (PE) in green for the 16 February 2011 and in magenta for the 13 January 2015. We only considered the measured profiles passing within a 10 km radius represented by a white disc around the stations. The background image is the hill-shaded topography obtained with MODIS MOA2004 (Haran et al., 2005).
3.1.1 Events at the DDU station
The 17 February 2016 precipitation event at the DDU station was overflown by CloudSat at local afternoon time. It occurred on the edge of a low-pressure system which was approaching the station, in agreement with the radiosounding launched in the morning at 09:00 LT. Indeed, as seen in Fig. 2b, c, above 1.5 km, a westerly wind brings moisture and a warmer air mass. The radiosounding also shows wind with a continental origin below 1 km which brings relatively dry air. The recorded precipitation profile (Fig. 3a) presents a low-level sublimation below 1 km and thus suggests that this layer might be dried by continental winds, according to wind direction, relative humidity and temperature profiles.
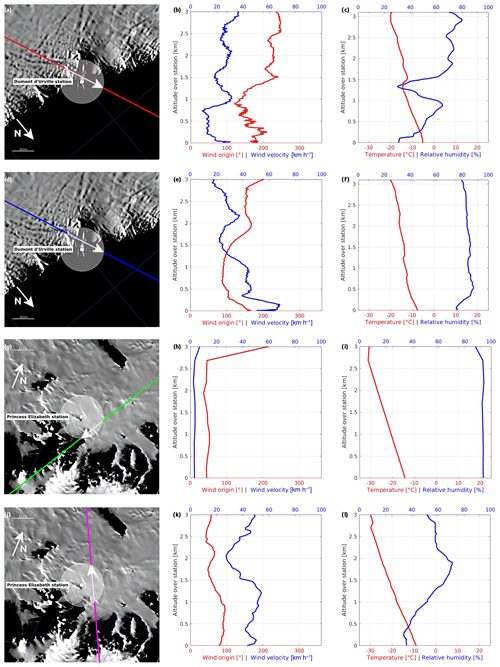
Figure 2Vertical profiles of the lower-tropospheric meteorological parameters over DDU and PE stations for the four precipitation events. The radiosonde launch times are summarized in Table 1. (a, d, g, j) The first column shows each station location, selected CloudSat tracks and their directions. The white disk represents a 10 km radius area around each station in which we consider the CloudSat measurements. (a–c) 17 February 2016; (d–f) 20 March 2016; (g–i) 15 February 2011; (j–l) 13 January 2015. The background image is the hill-shaded topography obtained with MODIS MOA2004 (Haran et al., 2005). (b, e, h, k) The second column shows wind velocities (blue solid line) and wind directions (0∘ indicating from the north) (red solid line) over the stations gathered with radiosoundings, except for panel (h), which is obtained with ERA-Interim. (c, f, i, l) The third column shows air temperatures (red solid line) and relative humidities with respect to ice (blue solid line) over the stations obtained with radiosoundings, except for panel (i), which is deduced from ERA-Interim.
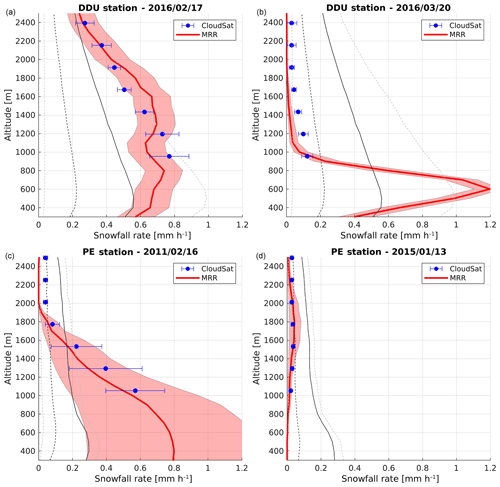
Figure 3(a) Comparison between CloudSat (blue dots with 2σ standard deviation bars) and MRR (red solid line with shaded area representing a 95 % confidence interval) for the 17 February 2016 precipitation event at the DDU station. (b) Same as panel (a) for the 20 March 2016 event at the DDU station. (c) Comparison between CloudSat (blue dots with 2σ standard deviation bars) and MRR (red solid line with shaded area representing a 40 % confidence interval) for the 15 February 2011 precipitation event at the PE station. (d) Same as panel (c) for the 13 January 2015 event at the PE station. The mean precipitation profile obtained over a long period of observation is also shown and separated into quantiles. The gray dashed lines represent the 20th and 80th quantiles, the dark dashed line represents the 50th quantile and the solid line represents the average of the vertical structure of precipitation (Durán-Alarcón et al., 2019).
Located between two low-pressure systems, the 20 March 2016 radiosounding is characterized by a shear between continental and oceanic winds below 500 m, marked by an inversion of relative humidity (Fig. 2e, f). Being at the rear margin of the first passing low-pressure system, it explains the easterly origin of the oceanic winds. It is followed by a strong event recorded in the afternoon by the radars, with katabatic winds blowing down the ice cap and sublimating precipitation at low altitude below 1000 m (Fig. 3b). This kind of dry air leading to significant low-level sublimation of snowfall is well documented by Grazioli et al. (2017b).
3.1.2 Events at the PE station
To analyze the vertical meteorological profiles at the Princess Elisabeth station we used ERA-Interim reanalysis, due to the absence of an air-sounding campaign during the third precipitation event period. The 15 February 2011 precipitation night event is characterized by a large low-pressure system northwest of the PE station blocked by a high-pressure ridge to the east directing a strong moisture flux defined as an atmospheric river directly to the PE station. It is a significant snowfall event that caused an anomalous increase in Dronning Maud Land's surface mass balance (Gorodetskaya et al., 2014). The westerly origin of the high-altitude wind observed in Fig. 2 is dominated by the circumpolar atmospheric circulation. At the resolution of the reanalysis (0.75∘ in longitude and latitude), it is difficult to observe any orographic impact on the weather around the Princess Elisabeth station.
The fourth observed radiosounding, released 3 h before the 13 January 2015 afternoon event, is explained by a low-pressure system located northwest of the PE station and a strong easterly wind which is constant in altitude (Fig. 2k). The temperature and relative humidity suggest cloudy weather with a dryer and hotter boundary layer (Fig. 2l). The observed precipitation profile suggests in-cloud snowfall and virga (Fig. 3d). This is confirmed with a backscatter profile measured by a ceilometer installed at the PE station (see Fig. A1 in Appendix) which observed a passing cloud over the station during the recording of the precipitation event by CloudSat and the MRR.
3.2 Estimation of the confidence intervals in CloudSat reports
All CloudSat measurements were selected within a 10 km radius from each station and averaged for each vertical bin. A variance in the CloudSat retrievals is computed for the duration of each overpass (see Fig. A3 in Appendix).
The MRR confidence intervals are calculated using the range of Ze∕Sr parameters given by Grazioli et al. (2017a) for the Dumont d'Urville station and Souverijns et al. (2017) for the Princess Elisabeth station. At the DDU station, according to Grazioli et al. (2017a), for an altitude higher than 2500 m where there is a crystal dominance for precipitation, the parameterizations used for Ze∕Sr conversion are not adapted anymore. That is why MRR measurements are considered and compared to equivalent CloudSat vertical bins only in the first 2500 m of the atmosphere. In contrast with the coastal areas, we would expect less riming at the PE station compared to the DDU station, while aggregates are expected to occur at the PE station given the measured large particle sizes (Souverijns et al., 2017). Also the low variability in the vertical profile of mean Doppler vertical velocity at the PE station suggests that aggregation and/or riming of particles is not frequent in this region and hydrometeor type is relatively constant in the vertical profile (Durán-Alarcón et al., 2019). Without this change in the proportion of the different hydrometeors, the ground-based Ze∕Sr relationships would be still valid higher up.
4.1 Precipitation profiles
Focusing on the Dumont d'Urville station, Fig. 3a shows a good agreement between CloudSat and the MRR's snowfall rates for each vertical level. Indeed, an averaged satellite precipitation rate at all levels is included within the 95 % MRR confidence interval. The MRR profile presents a maximum of the snowfall rate of 0.75 mm h−1 at 750 m and an inversion of the precipitation rate likely due to low-level sublimation processes, whereas the ground clutter prevents CloudSat from seeing the inversion. This precipitation event is likely generated by the passage of the second low-pressure system, as described previously using the corresponding radiosounding. According to Durán-Alarcón et al. (2019), this precipitation event is representative of the climatology of the DDU station as it lies between the 20th and 80th quantiles (indicated by grey dashed line) with a shape similar to the average climatology in solid black line.
According to Fig. 3b, there is a poor concordance between the two datasets for low snowfall rate values. The MRR recorded low-level strong values until a null signal of precipitation from 1000 m upward, where CloudSat still recorded small but significant rates. An inversion of the precipitation rate at low levels is also observed under the maximum precipitation rate of 1 mm h−1 at 600 m. The strong gradient of this inversion is likely due to katabatic wind effects, which can drastically dry out atmospheric layers when blowing down from the ice cap. This event shows that the use of CloudSat for surface precipitation determination may be problematic in certain conditions for a specific event. It is also important to note that this event is an anomalous climatological event at the DDU station, in comparison with the quantiles of the vertical structure of precipitation both in terms of snowfall rate and shape.
Figure 3c shows a good agreement between the four lowest values of CloudSat observations and the MRR profile. Indeed, every averaged satellite measurement is included in the 40 % confidence interval, but the standard deviations indicate a large dispersion. Above this altitude precipitation rate is small and the agreement is weaker. This is similar to what is observed in Fig. 3b. CloudSat observes again a small signal of precipitation where MRR recorded a null snowfall rate, suggesting some limitations in the sensitivity or attenuation of the MRRs but also a satellite sensitivity for low snowfall rates. This event is an important anomalous climatological event at the PE station because the observed snowfall rates are much higher than the snowfall rates of Durán-Alarcón et al. (2019) climatology. This is caused by the passage of an atmospheric river over the station.
Figure 3d snowfall rates observed by both CloudSat and MRRs are quite low compared to the three other cases but the agreement remains good for the five lower satellite levels. According to Durán-Alarcón et al. (2019), this precipitation event is representative of the climatology of the PE station with in particular the presence of virga with very low precipitation rates included between the high and low quantiles.
4.2 Agreement between CloudSat and MRR datasets
Figure 4 represents the correlation for (all data, all levels) CloudSat and MRR precipitation reports for the four events using the error bars shown in Fig. 3. Error bars for the MRRs are implemented by using the confidence intervals obtained with the Ze∕Sr relations. Large error bars correspond to the PE station's MRR and smaller ones represent the DDU stations's MRR confidence interval. CloudSat error bars represent the variance of measurements collected along the swath. A linear regression fit between CloudSat and MRRs is performed and shows a good correlation between both datasets.
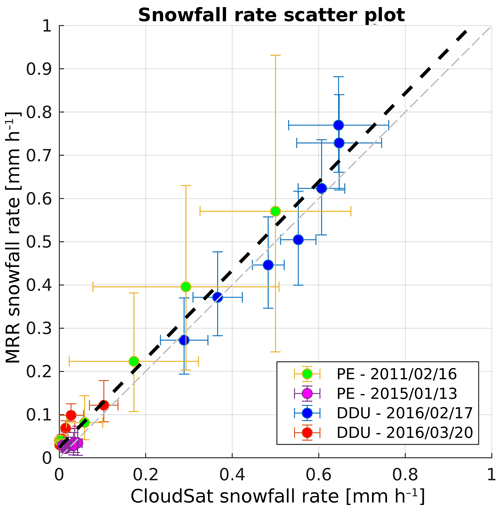
Figure 4Scatter plot of the MRR and CloudSat snowfall rates in mm h−1 with the linear regression (thick black dashed line). The error bars are computed using the Ze∕Sr relations (cf.Sect. 2.2.) for the MRR and standard deviations at each vertical bin for CloudSat. The grey dashed line represents the 1 : 1 line for a perfect correlation.
4.3 Evidence of a difference between both snowfall rate measurements
A previous study by Protat et al. (2009) showed that CloudSat-measured ice cloud reflectivity is 1 dB higher than an airborne cloud radar, and following a statistical evaluation with basic cloud properties and five ground-based sites a weighted-mean difference in Ze, which ranges from −0.4 dBZ to +0.3 dBZ, is observed when a period of ±1 h around the CloudSat overpass is considered. According to Chen et al. (2016), CloudSat tends to observe lighter snowfall events (smaller than 2 mm h−1) in comparison with the NOAA National Severe Storms Laboratory (NOAA/NSSL) multi-radar multi-sensor (MRMS/Q3).
Figure 3b shows that CloudSat can report small but significant snowfall when the MRR signal is virtually zero. The shift between the two instruments is estimated in this case at mm h−1. Looking at Fig. 3c for the three last CloudSat bins above 2 km height, an averaged snowfall rate of mm h−1 is observed when the MRR signal at the PE station is null. Concerning Fig. 3d, a similar value of mm h−1 is recorded by CloudSat, but this time MRR also records a similar signal of mm h−1. This difference in measured values suggests a difference in sensitivity of the two radars even if these measured rates are above the MRR detection limit of 0.005 mm h−1 (see Sect. 2.2). This shift in snowfall rates could either be due to a strong attenuation of the MRR backscattered signal with the altitude or due to the detection of cloud water by the CPR as it is more sensitive to small atmospheric particles and clouds.
4.4 Calculation of the CloudSat uncertainties
The CloudSat 2C-SNOW-PROFILE product already contains its own uncertainties estimates, calculated from hypothetical parameters such as the mass–diameter distribution of the hydrometeors, their microphysical and scattering properties. Our analysis suggests that under Antarctic (and probably polar) conditions, this uncertainty can be significantly reduced. By assuming that CloudSat and MRR snowfall rates datasets follow a normally distributed deviation from the mean, a correlation coefficient is calculated in order to establish the degree of similarity between both observations. By using the covariance of both data records, we found a correlation coefficient of 0.99, which confirms a very good agreement between both radar data (see Appendix).
For each CloudSat vertical bin, we calculated the distance of satellite measurement to the corresponding interpolated MRR observation. We averaged these values by weighting them with the MRR confidence intervals and we found a range of CloudSat uncertainties from −13 % up to +22 %.
CloudSat remote-sensing observations were compared with two in situ micro-rain radars at the coastal French Dumont d'Urville and mountainous Belgian Princess Elisabeth stations in East Antarctica. The comparison of four cases of precipitation that coincide with CloudSat observations shows a near-perfect correlation. This comparison also reveals a difference in the CloudSat dataset with respect to the MRR for very light precipitation. This might be precipitable cloud water recorded by CloudSat or an MRR limitation due to a strong attenuation of the signal through important precipitation. From our correlation and statistical studies based on the quantification of the CloudSat deviation to the MRR values, we assessed new CloudSat precipitation uncertainties ranging from −13 % to +22 % based on this short-time and small space-scale study. This new assessment of the CloudSat uncertainties, in spite of the limited number of events, provides confidence in the retrieval given the different climatic and geographical conditions of the two stations. It also justifies further analysis of this dataset in this region of the globe, where snowfall is critical and poorly known. Subsequent studies using weak precipitation rates profiles over other Antarctic regions, particularly in the interior of the continent, will strengthen the robustness of this new range of uncertainties and corroborate the difference recorded by both CPR and MRRs. Moreover, the Earth Cloud Aerosol and Radiation Explorer (EarthCare) spaceborne radar, with a much better vertical resolution, should be even more instructive and improve our understanding of clouds and snowfall in the polar regions, where field observations are so hard to perform.
Data from the micro-rain radar at Dumont d'Urville station were obtained with the logistical support of the French Polar institute (IPEV; program CALVA) and are available at https://doi.org/10.1594/PANGAEA.882565 (Berne et al., 2017). CloudSat data are freely available via the CloudSat Data Processing Center (http://www.cloudsat.cira.colostate.edu/, last access: 11 January 2018). Data from the micro-rain radar at the Princess Elisabeth station can be obtained at http://www.aerocloud.be (last access: 11 January 2018).
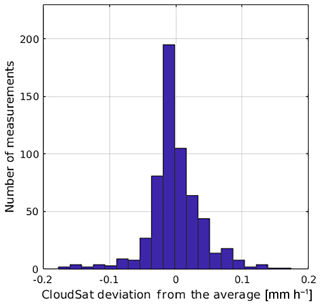
In order to compute the correlation between both datasets, we assume that both the MRR's and CloudSat's deviations from the average follow a Gaussian-shaped distribution. The MRR data have a Gaussian-shaped distribution, according to this confidence interval calculation. CloudSat deviation from the mean measurements also follows a Gaussian-shaped distribution, as shown in Fig. A3. Figure 4 shows an evident linear fit between both datasets.
Because of different vertical-bin altitudes, the MRR snowfall rates were linearly interpolated at the CloudSat data levels. Covariance of both data populations was calculated by the following equation:
where SCDSi and SMRRi are the snowfall rate values for CloudSat and MRR and and the averaged snowfall rates of both datasets. By calculating the standard deviations σ from the mean of each instrument, a covariance matrix was obtained and used to determine the correlation factor ρ between both datasets:
We applied this calculation with both MRR and CloudSat radar datasets and calculated a correlation coefficient of 0.99 as discussed in Sect. 4.2 and shown by a dashed line in Fig. 4.
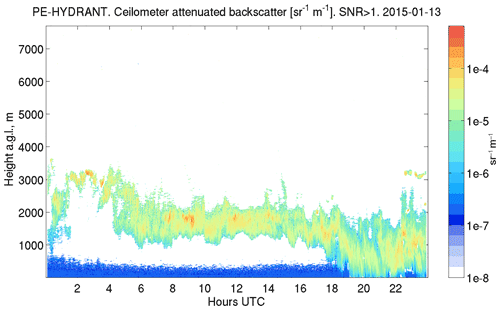
Figure A1Ceilometer backscatter profile at the PE station on 13 January 2015. The backscattered reflectivity suggests a passing cloud with in-cloud precipitation and virga.
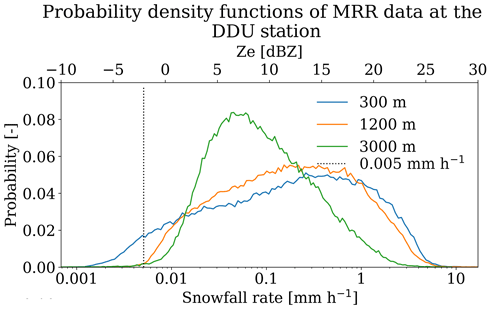
Figure A2Density functions of the corrected 1 min Ze values at three different heights (300 m; 1.2 km, lowest value of CloudSat; and 3 km) at the DDU station and the respective snowfall rates.
FL led the analysis and drafted the paper. JBM, CC and CG supervised the project. CDA and AB provided the MRR data for the Dumont d'Urville station. NS, NvL and IVG provided the MRR data for the Princess Elisabeth station. NW and TL provided the CloudSat data. All authors discussed the results and commented on the paper. IVG processed the Fig. A1 and CDA processed the Fig. A2 during the review process. CP contributed to the understanding and study of the CloudSat data.
The authors declare that they have no conflict of interest.
This work was supported by the French National Research Agency (grant number: ANR-15-CE01-0003). This work was supported by the Belgian Science
Policy Office (BELSPO; grant number BR/143/A2/AEROCLOUD) and the Research
Foundation Flanders (FWO; grant number G0C2215N). Irina V. Gorodetskaya thanks
the following for financial support: CESAM (UID/AMB/50017/2019), the FCT/MEC (through national
funds) and co-funding by FEDER (within the PT2020 Partnership
Agreement and Compete 2020). The authors thank Jacopo Grazioli for his help
and advice during the review period and Anna-Lea Albright as well as Max Popp
for their proofreading.
Edited by: Florent Dominé
Reviewed by: two anonymous referees
Arthern, R. J., Winebrenner, D. P., and Vaughan, D. G.: Antarctic snow accumulation mapped using polarization of 4.3-cm wavelength microwave emission, J. Geophys. Res.-Atmos., 111, D06107, https://doi.org/10.1029/2004JD005667, 2006. a
Berne, A., Grazioli, J., and Genthon, C.: Snowfall rate estimates derived from a micro rain radar (MRR) at the Dumont d'Urville station, Adelie Land, East Antarctica, link to netCDF file, PANGAEA, https://doi.org/10.1594/PANGAEA.882565, 2017. a
Boening, C., Lebsock, M., Landerer, F., and Stephens, G.: Snowfall-driven mass change on the East Antarctic Ice Sheet, Geophys. Res. Lett., 39, L21501, https://doi.org/10.1029/2012GL053316, 2012. a
Bromwich, D. H.: Snowfall in high southern latitudes, Rev. Geophys., 26, 149–168, 1988. a, b
Chen, S., Hong, Y., Kulie, M., Behrangi, A., Stepanian, P. M., Cao, Q., You, Y., Zhang, J., Hu, J., and Zhang, X.: Comparison of snowfall estimates from the NASA CloudSat cloud profiling radar and NOAA/NSSL multi-radar multi-sensor system, J. Hydrol., 541, 862–872, 2016. a
Durán-Alarcón, C., Boudevillain, B., Genthon, C., Grazioli, J., Souverijns, N., van Lipzig, N. P. M., Gorodetskaya, I. V., and Berne, A.: The vertical structure of precipitation at two stations in East Antarctica derived from micro rain radars, The Cryosphere, 13, 247–264, https://doi.org/10.5194/tc-13-247-2019, 2019. a, b, c, d, e, f
Eisen, O., Frezzotti, M., Genthon, C., Isaksson, E., Magand, O., van den Broeke, M. R., Dixon, D. A., Ekaykin, A., Holmlund, P., Kameda, T., Karlöf, L., Kaspari, S., Lipenkov, V. Y., Oerter, H., Takahashi, S., and Vaughan, D. G.: Ground-based measurements of spatial and temporal variability of snow accumulation in East Antarctica, Rev. Geophys., 46, RG2001, https://doi.org/10.1029/2006RG000218, 2008. a
Fujita, K. and Abe, O.: Stable isotopes in daily precipitation at Dome Fuji, East Antarctica, Geophys. Res. Lett., 33, L18503, https://doi.org/10.1029/2006GL026936, 2006. a
Genthon, C., Six, D., Scarchilli, C., Ciardini, V., and Frezzotti, M.: Meteorological and snow accumulation gradients across Dome C, East Antarctic plateau, Int. J. Climatol., 36, 455–466, 2016. a
Gorodetskaya, I. V., Van Lipzig, N., Van den Broeke, M., Mangold, A., Boot, W., and Reijmer, C.: Meteorological regimes and accumulation patterns at Utsteinen, Dronning Maud Land, East Antarctica: Analysis of two contrasting years, J. Geophys. Res.-Atmos., 118, 1700–1715, 2013. a
Gorodetskaya, I. V., Tsukernik, M., Claes, K., Ralph, M. F., Neff, W. D., and Van Lipzig, N. P.: The role of atmospheric rivers in anomalous snow accumulation in East Antarctica, Geophys. Res. Lett., 41, 6199–6206, 2014. a
Gorodetskaya, I. V., Kneifel, S., Maahn, M., Van Tricht, K., Thiery, W., Schween, J. H., Mangold, A., Crewell, S., and Van Lipzig, N. P. M.: Cloud and precipitation properties from ground-based remote-sensing instruments in East Antarctica, The Cryosphere, 9, 285–304, https://doi.org/10.5194/tc-9-285-2015, 2015. a
Grazioli, J., Genthon, C., Boudevillain, B., Duran-Alarcon, C., Del Guasta, M., Madeleine, J.-B., and Berne, A.: Measurements of precipitation in Dumont d'Urville, Adélie Land, East Antarctica, The Cryosphere, 11, 1797–1811, https://doi.org/10.5194/tc-11-1797-2017, 2017a. a, b, c, d, e, f, g
Grazioli, J., Madeleine, J.-B., Gallée, H., Forbes, R. M., Genthon, C., Krinner, G., and Berne, A.: Katabatic winds diminish precipitation contribution to the Antarctic ice mass balance, P. Natl. Acad. Sci. USA, 114, 10858–10863, 2017b. a
Haran, T., Bohlander, J., Scambos, T., Painter, T., and Fahnestock, M.: MODIS Mosaic of Antarctica 2003–2004 (MOA2004) Image Map, Digital media, National Snow and Ice Data Center, Boulder, CO, USA, https://doi.org/10.7265/N5ZK5DM5, 2005. a, b
Kulie, M. S. and Bennartz, R.: Utilizing spaceborne radars to retrieve dry snowfall, J. Appl. Meteorol. Clim., 48, 2564–2580, 2009. a
Liu, C., Zipser, E. J., Cecil, D. J., Nesbitt, S. W., and Sherwood, S.: A cloud and precipitation feature database from nine years of TRMM observations, J. Appl. Meteorol. Clim., 47, 2712–2728, 2008. a
Maahn, M. and Kollias, P.: Improved Micro Rain Radar snow measurements using Doppler spectra post-processing, Atmos. Meas. Tech., 5, 2661–2673, https://doi.org/10.5194/amt-5-2661-2012, 2012. a, b, c
Maahn, M., Burgard, C., Crewell, S., Gorodetskaya, I. V., Kneifel, S., Lhermitte, S., Van Tricht, K., and van Lipzig, N. P.: How does the spaceborne radar blind zone affect derived surface snowfall statistics in polar regions?, J. Geophys. Res.-Atmos., 119, 13–604, 2014. a
Palerme, C., Kay, J. E., Genthon, C., L'Ecuyer, T., Wood, N. B., and Claud, C.: How much snow falls on the Antarctic ice sheet?, The Cryosphere, 8, 1577–1587, https://doi.org/10.5194/tc-8-1577-2014, 2014. a, b
Palerme, C., Genthon, C., Claud, C., Kay, J. E., Wood, N. B., and L'Ecuyer, T.: Evaluation of current and projected Antarctic precipitation in CMIP5 models, Clim. Dynam., 48, 225–239, 2017. a
Palerme, C., Claud, C., Wood, N., L'Ecuyer, T., and Genthon, C.: How does ground clutter affect CloudSat snowfall retrievals over ice sheets?, IEEE Geosci. Remote, 16, 342–346, https://doi.org/10.1109/LGRS.2018.2875007, 2019. a
Protat, A., Bouniol, D., Delanoë, J., May, P. T., Plana-Fattori, A., Hasson, A., O'Connor, E., Görsdorf, U., and Heymsfield, A. J.: Assessment of cloudsat reflectivity measurements and ice cloud properties using ground-based and airborne cloud radar observations, Am. Meteorol. Soc., 26, 1717–1741, 2009. a
Souverijns, N., Gossart, A., Lhermitte, S., Gorodetskaya, I. V., Kneifel, S., Maahn, M., Bliven, F. L., and van Lipzig, N.: Estimating radar reflectivity-Snowfall rate relationships and their uncertainties over Antarctica by combining disdrometer and radar observations, Atmos. Res., 196, 211–223, 2017. a, b, c, d
Souverijns, N., Gossart, A., Gorodetskaya, I. V., Lhermitte, S., Mangold, A., Laffineur, Q., Delcloo, A., and van Lipzig, N. P. M.: How does the ice sheet surface mass balance relate to snowfall? Insights from a ground-based precipitation radar in East Antarctica, The Cryosphere, 12, 1987–2003, https://doi.org/10.5194/tc-12-1987-2018, 2018a. a, b
Souverijns, N., Gossart, A., Lhermitte, S., Gorodetskaya, I. V., Grazioli, J., Berne, A., Duran-Alarcon, C., Boudevillain, B., Genthon, C., Scarchilli, C., and van Lipzig, N. P. M.: Evaluation of the CloudSat surface snowfall product over Antarctica using ground-based precipitation radars, The Cryosphere, 12, 3775–3789, https://doi.org/10.5194/tc-12-3775-2018, 2018b. a
Stephens, G. L. and Ellis, T. D.: Controls of global-mean precipitation increases in global warming GCM experiments, J. Climate, 21, 6141–6155, 2008. a
Wood, N. B.: Estimation of snow microphysical properties with application to millimeter-wavelength radar retrievals for snowfall rate, PhD thesis, Colorado State University, Fort Collins, USA, 2011. a, b


